Article

Characterization of Light-To-Frequency Converter for Visible Light Communication Systems

by
Roger Alexander Martínez Ciro
1,*,
Francisco Eugenio López Giraldo
1,
Andrés Felipe Betancur Perez
2 and
Martín Luna Rivera
3
1
Facultad de Ingenierías, Instituto Tectonológico Metropolitano (ITM), Calle 54A No. 30-01, Barrio Boston, CP 050012 Medellín, Colombia
2
Departamento de Tecnología Electrónica, Universidad Carlos III de Madrid, Calle de Butarque 15, CP 28911 Leganés, Madrid, Spain
3
Facultad de Ciencias, Universidad Autónoma de San Luis Potosí (UASLP), Zona Universitaria, Av. Salvador Nava s/n, CP 78290 San Luis Potosí, Mexico
*
Author to whom correspondence should be addressed.
Electronics 2018, 7(9), 165; https://doi.org/10.3390/electronics7090165
Submission received: 17 July 2018 / Revised: 14 August 2018 / Accepted: 17 August 2018 / Published: 28 August 2018
(This article belongs to the Special Issue Visible Light Communication and Positioning)

Abstract

:
PIN (positive intrinsic negative) photodiodes and analog-to-digital converters (ADC) are commonly used on visible light communication (VLC) receivers in order to retrieve the data on detected signals. In this paper, a visible light communication receiver based on a light to frequency converter (LTF) is proposed. We characterized the LTF and derived an equation for signal-to-noise ratio (SNR) estimation in terms of its input optical power, and the frequency of the output periodic signal. The experiments show that the periodic signal of the LTF converter has a maximum output frequency of 600 kHz at a distance of 6.2 cm. In this setup, measured SNR reached 18.75 dB, while the lowest obtained SNR with 1.1 m length was roughly −35.1 dB. The results obtained suggest that a bit rate of 150 kbps can be achieved with an on-off keying (OOK) modulation format. We analyzed the results and discuss the advantages and limitations of the LTF converter for optical wireless communication purposes.

1. Introduction

In optical wireless communication (OWC), it is common to find optical receivers conformed by positive intrinsic negative (PIN) photodiodes or avalanche photodiode (APD) and analog-to-digital converters (ADC) [1,2,3,4,5,6], as proposed by the IEEE 802.15.7 standard [7] for visible light communication (VLC) systems. Among these, the PIN photodiodes (PD) are presented more often in VLC systems, because they have better immunity to noise and low parasitic capacitance, and can be used to speed up the transmission (ultrafast PIN-PD), which is a milestone in VLC works [2,6]. This is a result of the intrinsic material between the p–n junction, which leads to a reduction of the time constant, and thus better bandwidth [2,8]. In fact, the PIN-type photodiodes adapted to the red-green-blue (RGB) sensors have been studied for applications in VLC systems [9], the authors characterized these sensors and determined its frequency response. Furthermore, PIN photodiodes are being adapted to other systems, to perceive intensity levels of light and turn over periodic electrical signals with frequencies that correspond to the incident power in the photodetector [10]. These devices are known as light-to-frequency (LTF) converters, and are internally comprised of PIN-type photodiodes and a module that transforms the photocurrent to frequency. The mentioned module employs a voltage-controlled oscillator (VCO), which reduces and simplifies the conditioning circuit of the photodiode, allowing its adaptation with embedded low-cost systems that do not require ADC [10,11,12,13,14,15,16]. Therefore, the LTF converters are exposed as an attractive solution for the detection of communication signals in the visible range of the electromagnetic spectrum because of the reduction of the system complexity [10]. Recently, LTF converters have been investigated, for example, in optical communication systems for the design of portable transceivers [11] and in health applications to detect levels of oxygen in the blood [12], among others.
In this paper, we propose the use of a light-to-frequency converter as an alternative to design the receiver of a VLC system. In this scheme, the characterization and performance evaluation of LTF converter as a receiver in a VLC system, based on on-off keying (OOK) modulation, is presented. The main contribution of this article is summarized as follows: initially, the characterization of an LTF converter is presented, and an equation is derived based on both the incident optical power and the frequency generated in the LTF, in order to estimate the system’s SNR value. The second contribution is the evaluation of the LTF by using a periodic optical signal, which reveals the advantages and disadvantages regarding its use as a receiver in a VLC system.
The rest of the paper is organized as follows: Section 2 shows the model of the VLC system and the LTF converter. The characterization of the LTF converter for a VLC system is presented in Section 3. The results and discussions are presented in Section 4. Finally, we summarize the main conclusions.

2. VLC and LTF System Model

2.1. VLC System Model

VLC systems are based on intensity modulation and direct detection (IM/DD), which is the most used method to implement optical wireless communications [1,2,7]. A typical VLC system is depicted in Figure 1.
Once the photodiode (PD) detects an incident optical power or irradiance E ( λ ) on its photosensitive surface, it will generate a photocurrent i r ( t ) proportional to device responsivity R ( λ ) and E ( λ ) , which is corrupted by noise n ( t ) . Such relation is illustrated in Equation (1):
i r ( t ) = R ( λ ) E ( λ ) + n ( t )
If emitted optical signal degradation effects due to communication channel are considered, the model in the work of [1] can be described through the expressions in Equation (2):
i r ( t ) = R ( λ ) P t ( t ) h ( t ) + n ( t ) , P t ( t ) = i t ( t ) h e o ( t ) ,      
where i t ( t ) is the bias current of light-emitting-diode (LED); h e o ( t ) is the impulse response of LED; P t ( t ) is the emitted instantaneous optical power by the LED; h ( t ) represents the channel impulse response; i r ( t ) is the sensor generated photocurrent; R ( λ ) is the photodiode responsivity; denotes the convolution operator; and n ( t ) is the system noise, which is modeled as additive white gaussian noise (AWGN). The radiated optical power is always positive P t ( t ) 0 ; moreover, it is important take into account that the required illumination in a space in which people are dwelling needs to be below a certain limit of the average total emitted optical power, in order to mitigate the possible harmful effects on the eyes [2]. The average optical power of the source can be estimated with Equation (3):
P a v g = lim T 1 2 T T T P t ( t ) d t
VLC systems usually have two main threats: thermal noise and shot noise, both of which distort the signal of interest. The source of shot noise is the randomness in the photon absorption process and the electron-hole pair recombination within PD, whereas thermal noise depends on the environment temperature that perturbs enough the electrons in the receiver discrete devices [8]. The noise is a random process, thus it is characterized by a total variance. In the model described in the literature [8], the overall variance σ 2 is equal to the sum of the shot noise variance σ 2 s h o t and the thermal noise variance σ 2 t h e r m a l as shown in Equation (4):
σ 2 = σ 2 s h o t + σ 2 t h e r m a l , σ 2 = 2 q R ( λ ) ( P r + P n ) B w + i a m p 2 B a m p , B n = β B r ,
where:
  • q, is the electron charge ( 1602 × 10 19   coulomb ) ,
  • R ( λ ) , is the PD responsivity,
  • P r is the signal power received,
  • P n is the noise power generated by external light sources,
  • B w is the channel equivalent noise bandwidth,
  • i a m p is the parasitic current of the amplifier,
  • B a m p is the bandwidth of the amplifier,
  • β is the Bandwidth factor, and
  • B r is the signal bit rate.
A commonly used figure of merit in telecommunications is the SNR, which is a ratio between the signal power and the power contributed by the noise described by σ 2 [17,18,19,20,21,22,23]. In the case of a VLC system, the electrical SNR can be estimated with (5):
P i n ( t ) = E ( λ ) A r , S N R = ( R ( λ ) , P i n ( t ) ) 2 σ 2
where:
  • P i n ( t ) is the incident optical power,
  • E ( λ ) is the irradiance, and
  • A r , is the PD area.

2.2. Light-To-Frequency Model

An LTF reduces and simplifies the signal acquisition process coming from a light source because its output can be sent directly to be processed to a microcontroller for data processing [10]. As a result, traditional systems using ADCs can be seen as an additional option on the list. In some low-cost cases, complex ADCs are not a good choice as they can be oversized for low speed applications, and this is the result of all the related subsystems inside of an ADC-like antialiasing filter, sampler, quantization, and encoder. The LTF in data processing quantifies light intensity variations in terms of frequency, through a current-to-frequency (CTF) converter [11,15].
An LTF generates a train of pulses with a constant duty cycle (50%) and a frequency that is a function of the irradiance incident light signal:
f 0 = f D + ( R e ) ( E ( λ ) )
From Equation (6), it can be observed that the output frequency of the LTF f 0 is proportional to the irradiance of the perceived light E ( λ ) , and when no power is detected, the LTF has a constant frequency f D , which is called dark frequency. R e is the LTF responsivity in a certain wavelength λ and the associated units are Hz / ( μ W / cm 2 ) . The irradiance is related to the surface area A r of the LTF converter through the expression E ( λ ) = P i n A r measured in μ W / cm 2 [1,11].
The dark frequency value, f D , results from the leak current produced by the semiconductor material and is affected by the overall system temperature [13,14].
Given that LTF output corresponds with a pulse train with variable frequency, it is important to keep in mind the different available techniques to measure it; therefore, a selection criterion of the technique will depend on the resolution and speed of the electronic interface used [14]. Thus, if a high resolution embedded system is required and time response is not too demanding, frequency counting or an accumulation of pulses can be used; if frequency is high and a high speed electronic interface is needed for measurement, given the rapid change of the light intensity, the period measurement technique is the more suitable solution [14,15]. The period measurement demands a reference clock signal with a frequency greater than the signal of interest. In the case of the TCS3200 LTF sensor, the output signal possesses frequencies between 10 Hz and 780 kHz; hence, this guides the choice of a low-cost embedded system, because almost every single chip on the market has an equipped timer with a reference signal in the order of MHz [16]. As quoted, the period measurement technique for the scenario of optical wireless communications is properly considered, given that these systems call for online processing to decrease the overall link latency.

3. Characterization of the LTF for a VLC System

In this section, we present the characterization of the LTF converter and the analysis of the proposed VLC.
In particular, an EMC 3030 HV white light LED, Tektronix TDS 3034C oscilloscope, THORLABS PM100D instrument and an LTF TCS3200 were used for the experimental setup, as shown in Figure 2. In the TCS3200, the light-to-frequency converter reads an array of 8 × 8 photodiodes with 16 photodiodes with blue filters, 16 with red filters, 16 with green filters, and the remaining 16 photodiodes are clear with no filters. For this experimental setup, the TCS3200 device was configured for its maximum output frequency and only the blue channel was used for the VLC system as the blue component of a white LED lighting has the highest bandwidth [18,19,20]. Given the nature of the proposed experiment, it is necessary to bear in mind that the central wavelength of the blue filter in the LTF is λ c = 470 nm and the total area of the photodiodes is A r = 0.1936 cm2 [14].
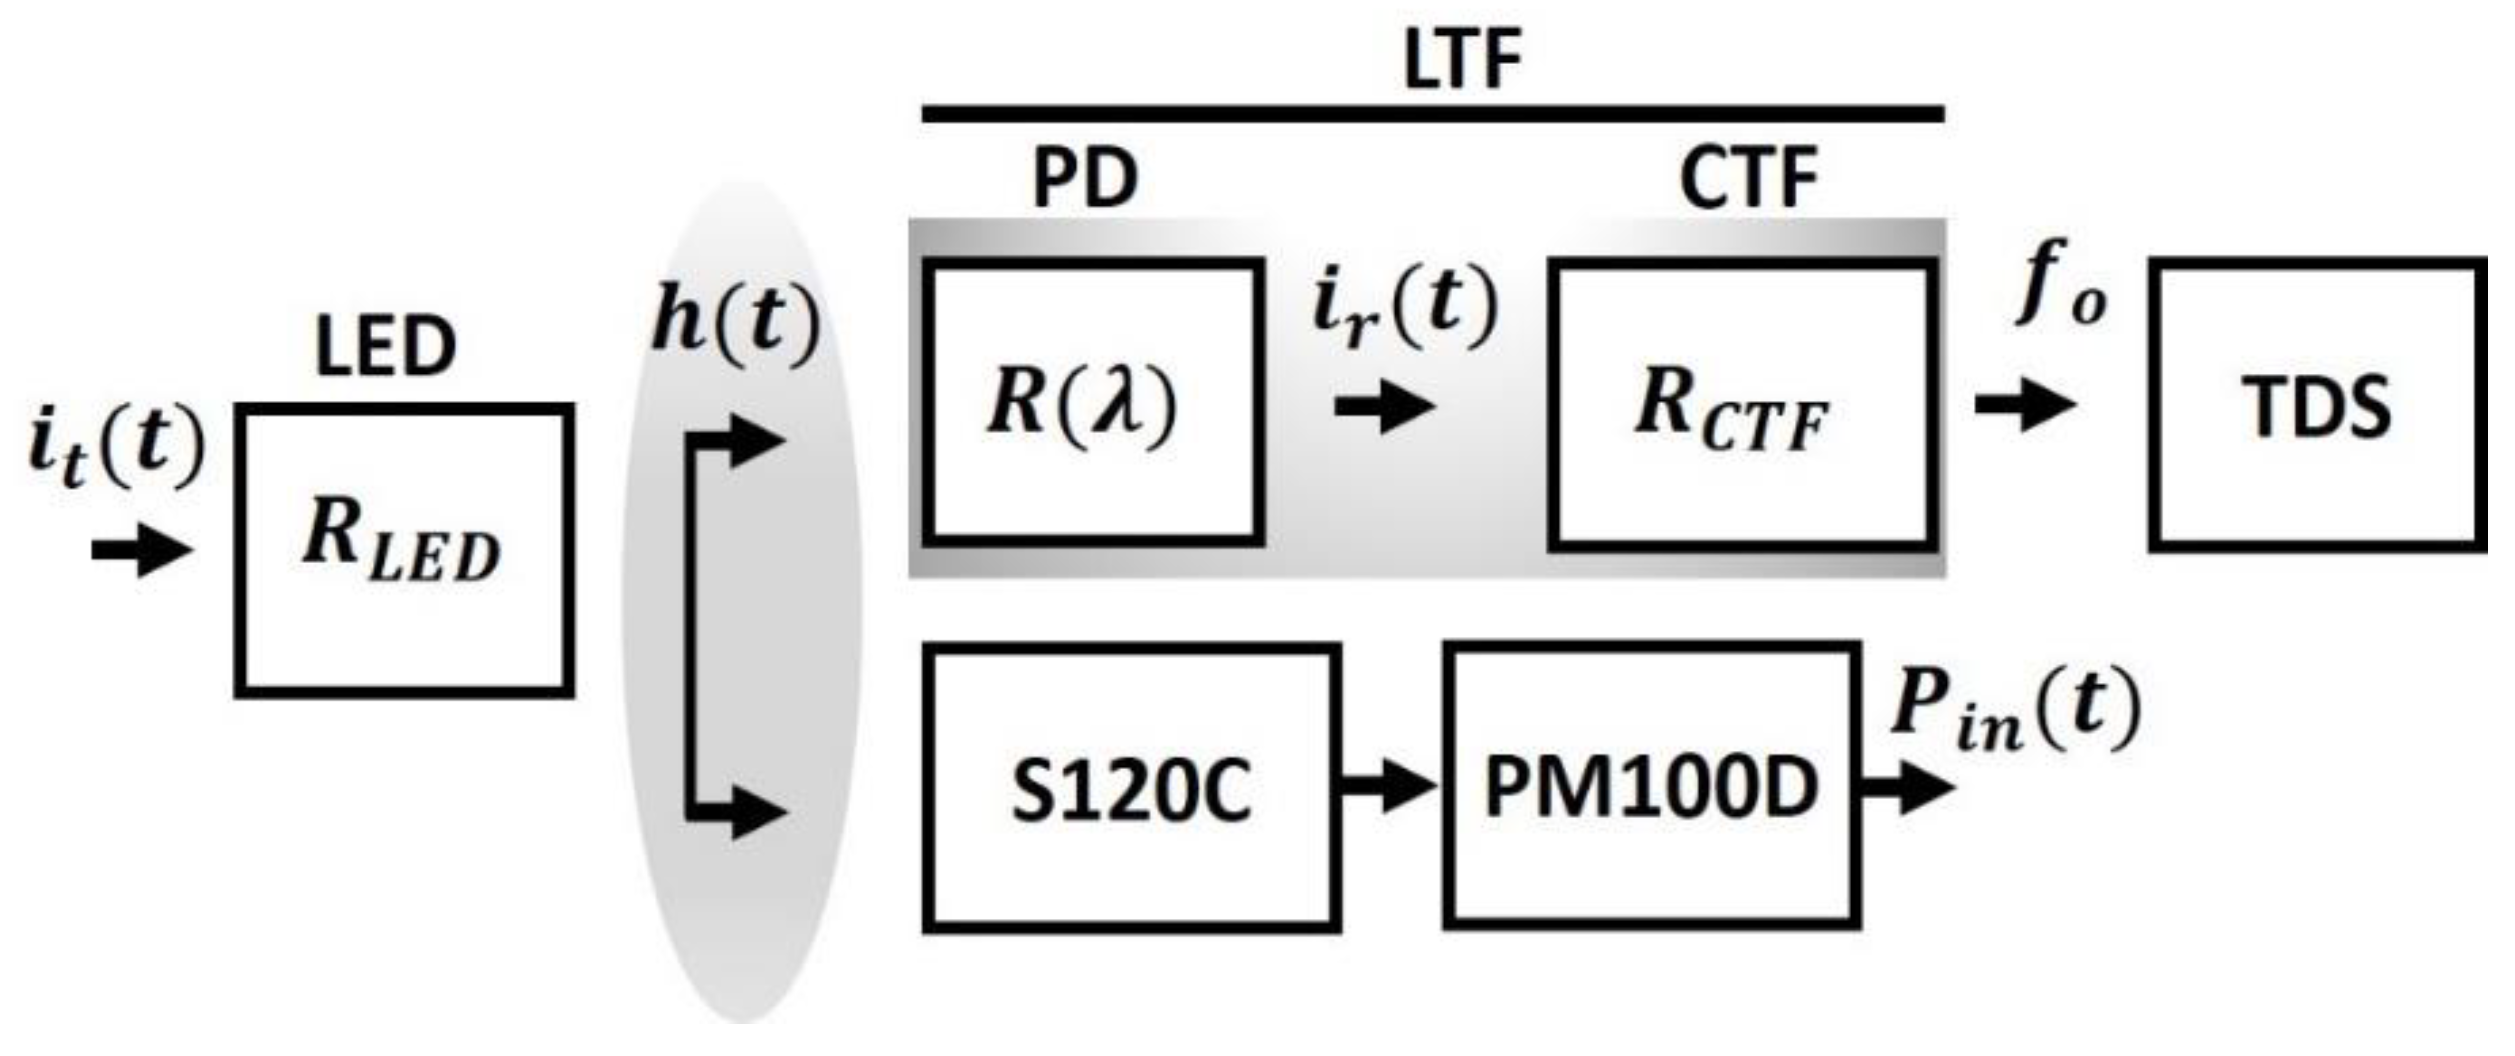
The schematic diagram of the experimental characterization for the LTF converter is shown in Figure 2. It consists of an optical transmitter based on a white light LED and a LTF converter acting as VLC receiver. For convenience, the LTF converter is represented as a two connected subsystems block: a photodiode and a CTF converter.
In order to analyze the performance of the LTF converter, it is necessary to derive a mathematical expression for the signal-to-noise ratio at the VLC receiver output. In this way, using Equation (1) to represent the output current of the photodiode i r ( t ) within the LTF block, the output signal of the CTF subsystem, f 0 , can be estimated using the following expression:
f 0 = R C T F R ( λ ) E ( λ ) + R C T F n ( t )
where R C T F is the CTF responsivity. Now, it is important to remark that the expression for f 0 , given by Equation (7), does not alter the LTF model as an analogy could be made between the terms of Equations (6) and (7), that is, R C T F R ( λ ) with R e ( λ ) and R C T F n ( t ) with f D . The aforementioned statement can be demonstrated by considering an analysis of the units for each variable. The term R C T F denotes a conversion factor between the input current in amperes (A) and output frequency in Hertz (Hz) of the CTF subsystem; therefore, the units of R C T F are Hz/A. Next, R ( λ ) is the conversion factor between the optical irradiance and the photocurrent output then its units are A μ W / cm 2 . Thus, the term R C T F R ( λ ) will be given in the units of Hz / ( μ W / cm 2 ) , which is equivalent to the units of R e ( λ ) in Equation (6). Conducting a similar analysis for the term R C T F n ( t ) , it can be shown that it has the same units as that of the dark frequency f D . It is also important to note that the noise variance is scaled by the factor R C T F , such that σ f 0 2 = R C T F 2 σ 2 , of the stochastic process R C T F n ( t ) = f D .
Once we have obtained an expression for the dark frequency f D , the SNR value in Equation (5) can be estimated as a function of the incident irradiance and the frequency of the LTF, that is,
S N R = ( R C T F R ( λ ) E ( λ ) ) 2 σ f 0 2 = ( f o f D ) 2 σ f 0 2
where
  E ( λ )   = A r P i n ( t )

3.1. Evaluation of the LTF Converter

The evaluation process for the LTF has been broken down into the following three steps:
  • constant current signal, i t ( t ) , is applied to the transmitter LED.
  • Using the Tektronix TDS 3034C oscilloscope, the output frequency f 0 and dark frequency f D are measured for different distance cases between the transmitter LED and the LTF.
  • Next, the incident optical power, P i n ( t ) , is recorded for each case using the optical sensor S120C with aperture diameter 9.5 mm, which is coupled with the THORLABS PM100D instrument. This meter console can deliver measurements of luminous flux and incident irradiance. It is not recommended to use the irradiance measurement as the PM100D instrument considers the area of the sensor S120C rather than the area of the photodiodes integrated into the LTF TCS3200 [21]. Therefore, the useful information of this experiment is the incident optical power flow P i n ( t ) , considering the Ar of the sensor S120C.

3.2. LTF Response to an Optical Periodic Signal

For this evaluation process, the objective is to observe the response of the LTF converter when it is excited by a periodic signal. Using this type of signal is helpful to observe the advantages and disadvantages of using the LTF as a receiver in a VLC system. For this case, the arbitrary waveform generator (AWG) RLGOL DG4162 was used to generate the modulated signal, applied to the base of the 2N3904 NPN transistor, configured in saturation mode, and acting as the driver of the LED. A frequency sweep is then carried out for the modulating signal f O O K from 1 kHz until reaching the saturation frequency of the LTF. For each frequency, the separation distance of the link between the transmitter LED and the LTF was changed, from 0 cm up to the distance where the LTF output frequency was greater than or equal to the frequency of the modulating signal, that is, f o f O O K . This limit makes sense from the viewpoint of the frequency generated by the LTF, that is, f o reaches its maximum value during the half-period in which the modulated signal is in a high state (presence of the optical signal).

4. Results and Discussion

In this section, LTF characterization and the proposed VLC system performance analysis are evaluated, considering the input optical signal P i n ( t ) , variation of the link distance, LTF output frequency f O , and SNR. We assume that the VLC channel is corrupted by AWGN. First, the LTF performance was evaluated in function of the input constant optical signal, and we proceeded with the distance variation between the transmitter LED and the LTF receiver. 
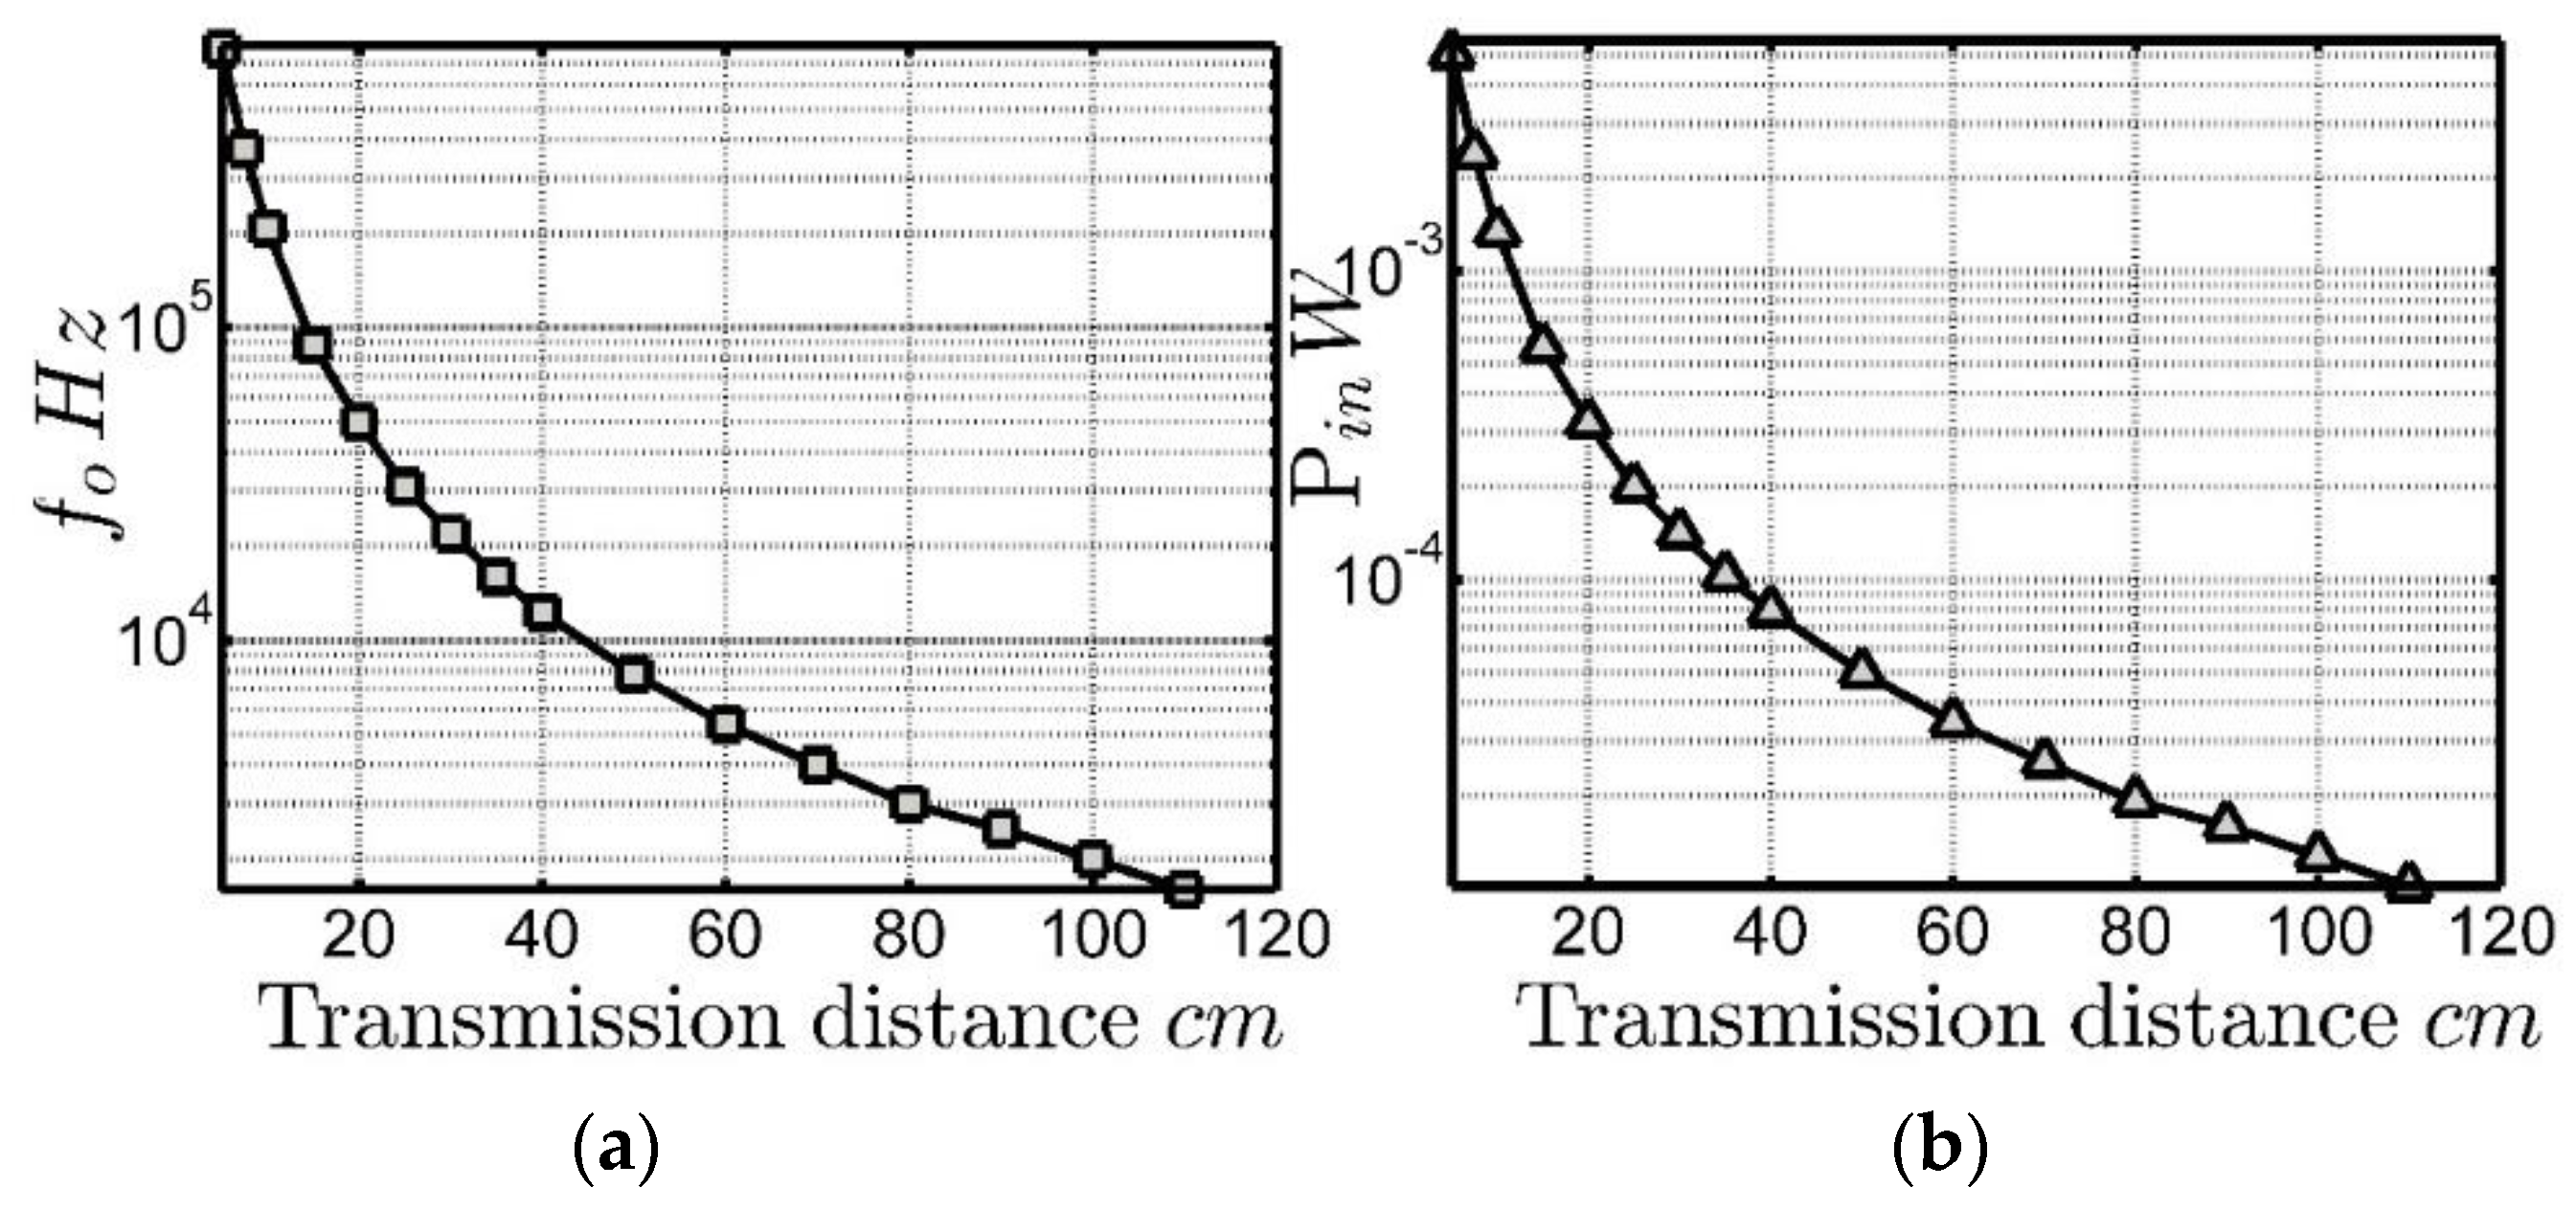
Figure 3 depicts LTF output frequency and optical input power versus link distance. It can be seen in Figure 3a that LTF output maximum frequency was 780 kHz (LTF saturation frequency) at the 5 mW optical input power, with 5 cm minimum link distance. On the other hand, we can see in Figure 3b that when the power input is 10   μ W , the link distance that achieves the minimum output LTF frequency 1.6 kHz is 110 cm. This result is consistent with the inverse-square law, as the LED is a Lambertian source [16].
The estimated LTF responsivity value during the experiment was R e = 30.34   MHz / ( μ W / cm 2 ) . This result enables the LTF to detect optical power levels of the order of nW . However, in this paper, the minimum optical power reference was limited to 10   μ W , which generates a respective frequency f o = 2   kHz . This configuration was important for us to experiment with a minimum frequency in the modulating signal OOK.
Additionally, based on the data presented in Figure 4, the LTF conversion factor R e will positively affect the SNR of the system. Therefore, to generate an LTF output frequency f o approximate to saturation, a measured SNR equal to 18.75 dB with link distance of 5 cm was found in the experiment, as illustrated in Figure 4a; for the case of less frequency f o = 1.6   kHz , the SNR was around −35.15 dB, with maximum link distance of 110 cm, as illustrated in Figure 4b. The parameters estimated for the LTF are significantly different from those of the data sheet [15], because the experiment was performed under specific physical conditions and a white light LED was used.
The relationship f o = f D is the dark condition (without optical power). Figure 5 summarizes the results for the dark frequency f D versus link distance. We can see that when link distance ranges from 20 cm to 40 cm, the condition f D < 35   Hz is reached, which indicates the presence of external optical sources, that is, oscilloscope, AWG, and power supplies. With this approach, it is important to mention that in the experimental setup, we do not consider focusing optical power on the LTF sensor.
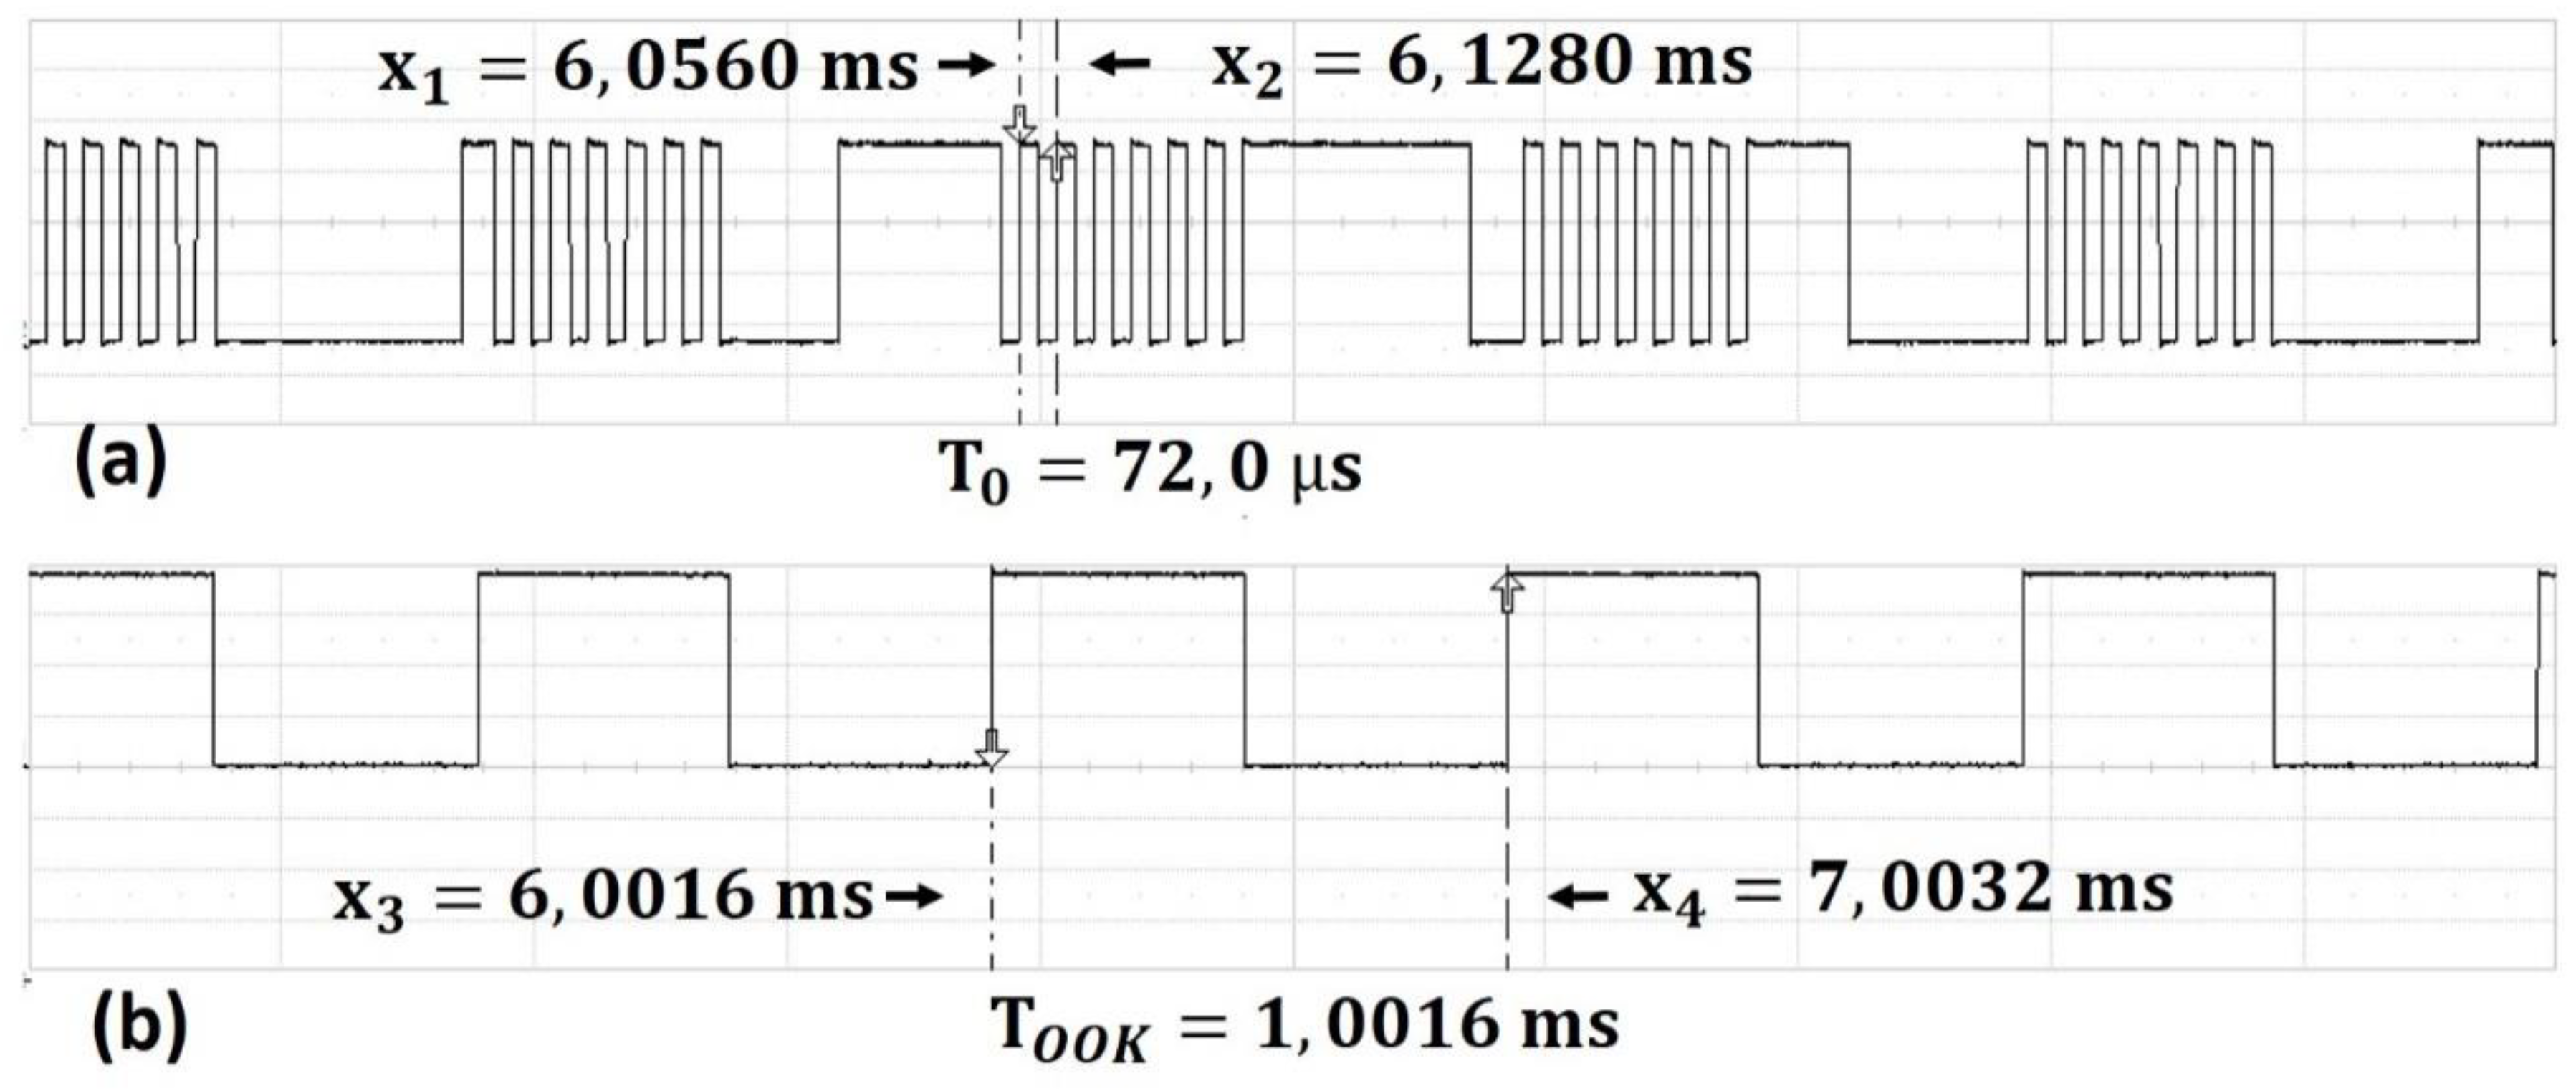
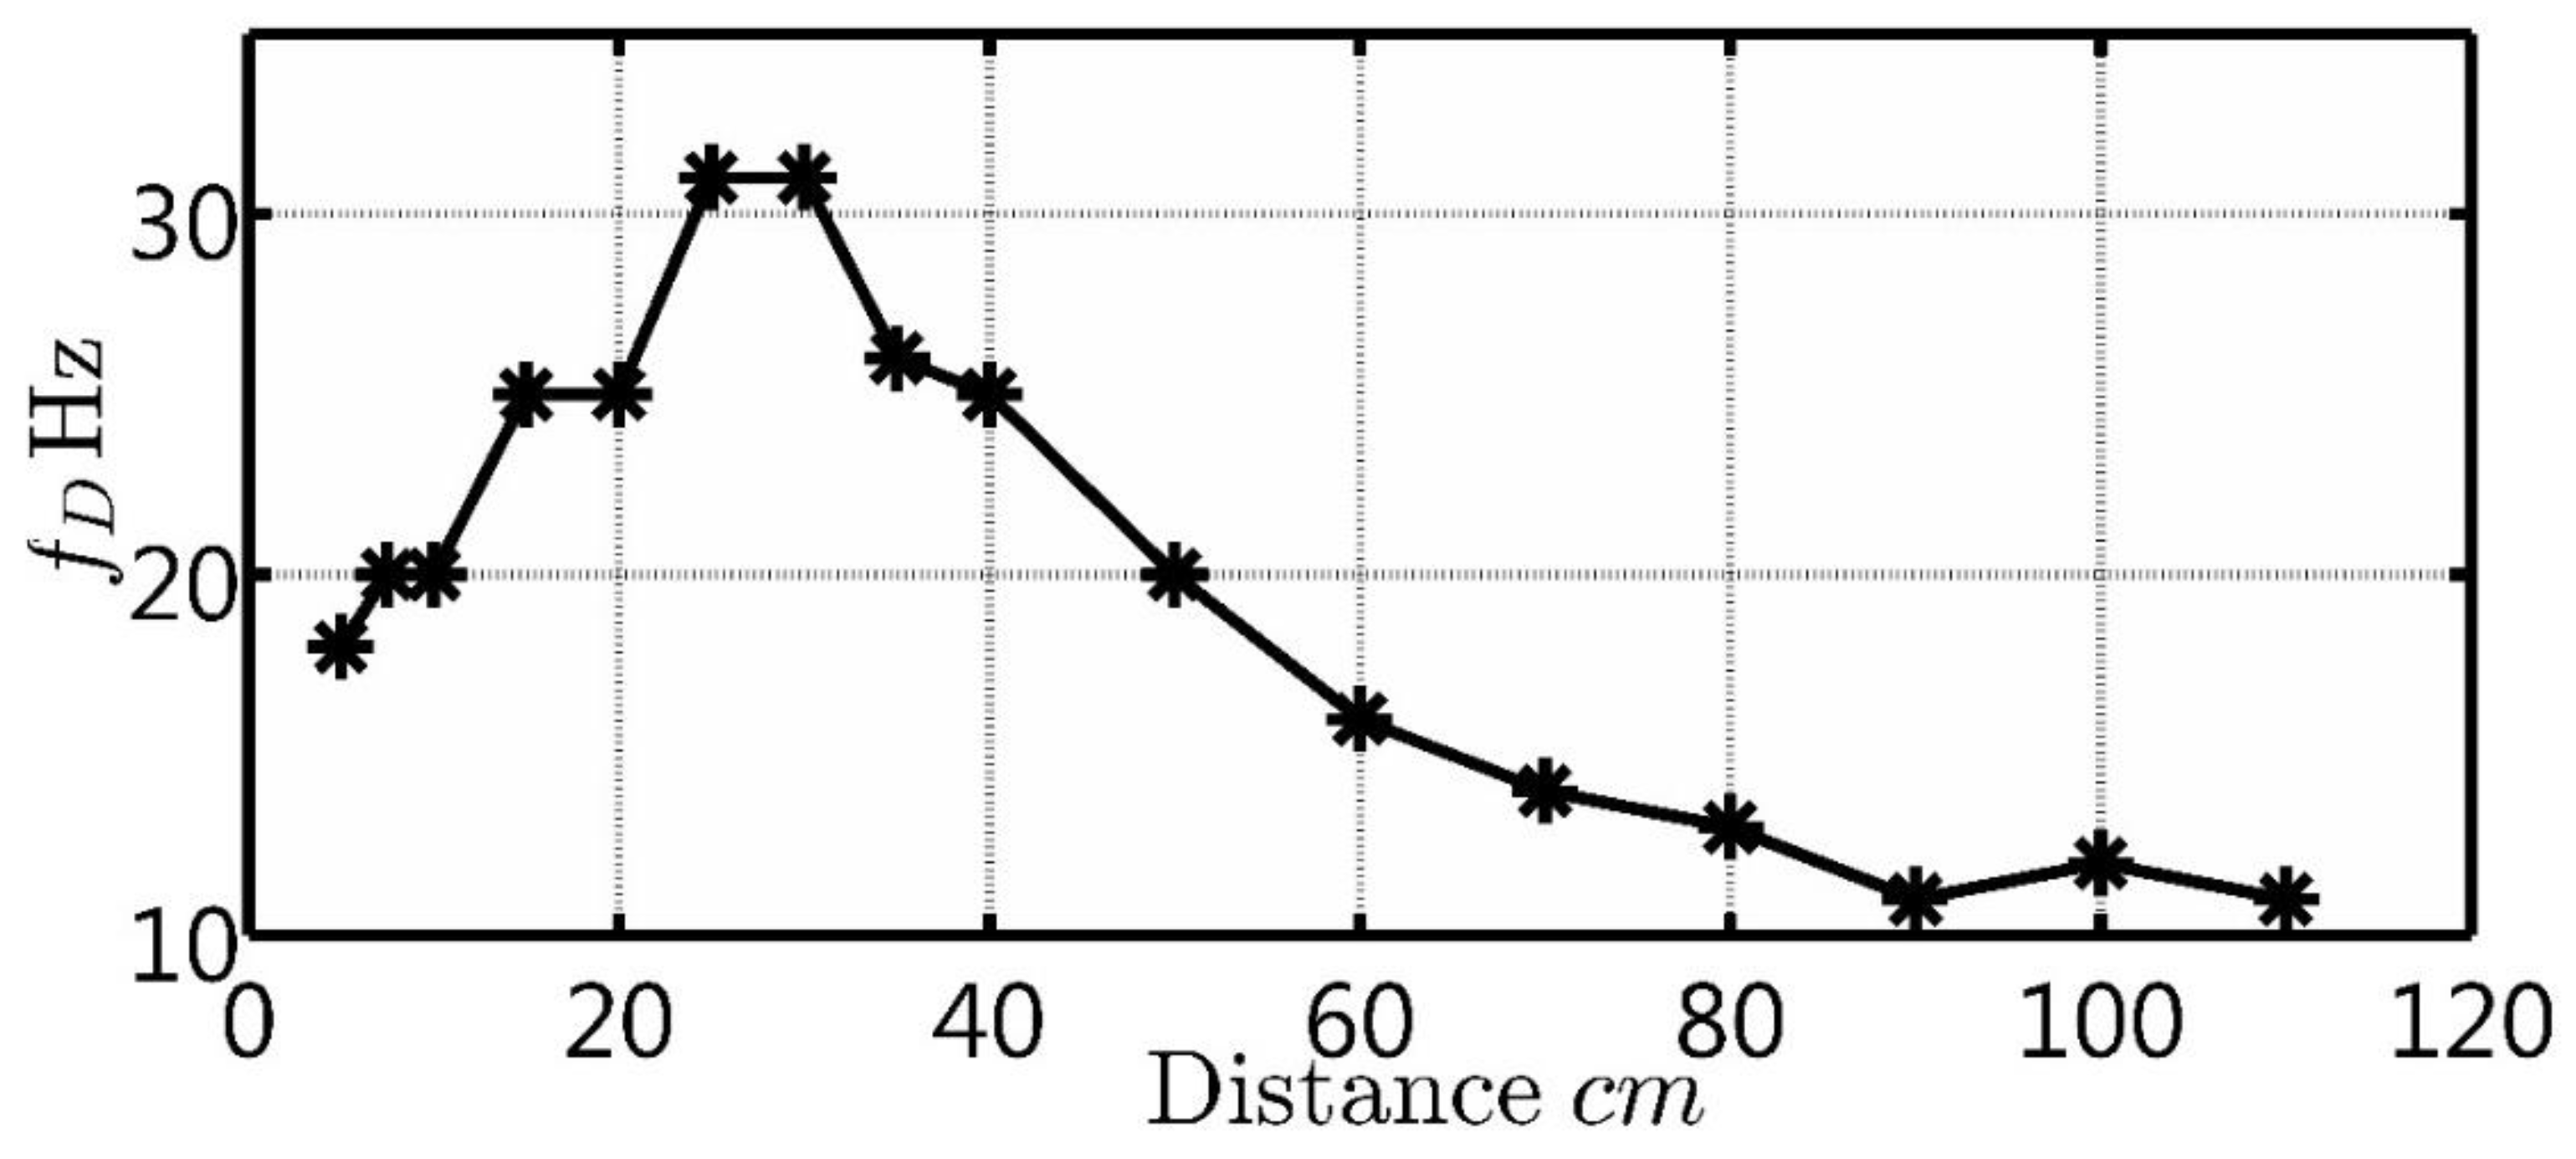
The result in Figure 6 clearly shows the LTF output frequency response to light intensity variations on photodiode. At the transmitter side, the electrical OOK signal is applied to modulate the white light LED with a modulating frequency f O O K = 1   kHz and 50% of duty cycle, as shown in Figure 6a. After free space optical transmission, the OOK signal is detected by an LTF receiver and generates an electrical signal. Then, the electrical OOK signal is converted to frequency by a current-to-frequency converter, as shown in Figure 6b.
LTF converter generates a frequency around the f o = 13.88   kHz when the LED transmit optical power when duty cycle is one, and, if duty cycle is zero, the LTF output frequency is f o = f D , with f D < 35 Hz. The f D   f O O K ; therefore, for LTF frequency estimation, it was necessary that we use the period measurement technique, for maximum data-acquisition rate (this data-acquisition rate depends on the resolution of the timer) [14,15]. However, for the VLC system, such high accuracy measurement is not necessary, because in these systems, time boundaries are wide enough to determine if a symbol is in the on-off state.
We experiment with different frequency values f O O K . One thing to note, however, is the LTF frequency estimation for symbol decoding. It is necessary that the condition f o f O O K should be fulfilled; thus, given the unknown oscillator state of the LTF, when intensity fluctuations occur, there exists a possibility that high state of the square output signal will not be completed. Therefore, we recommend that the LTF output frequency meet the following condition f o 4 f O O K , in order to mitigate the frequency estimation problem due to the deviations generated by the LTF output.
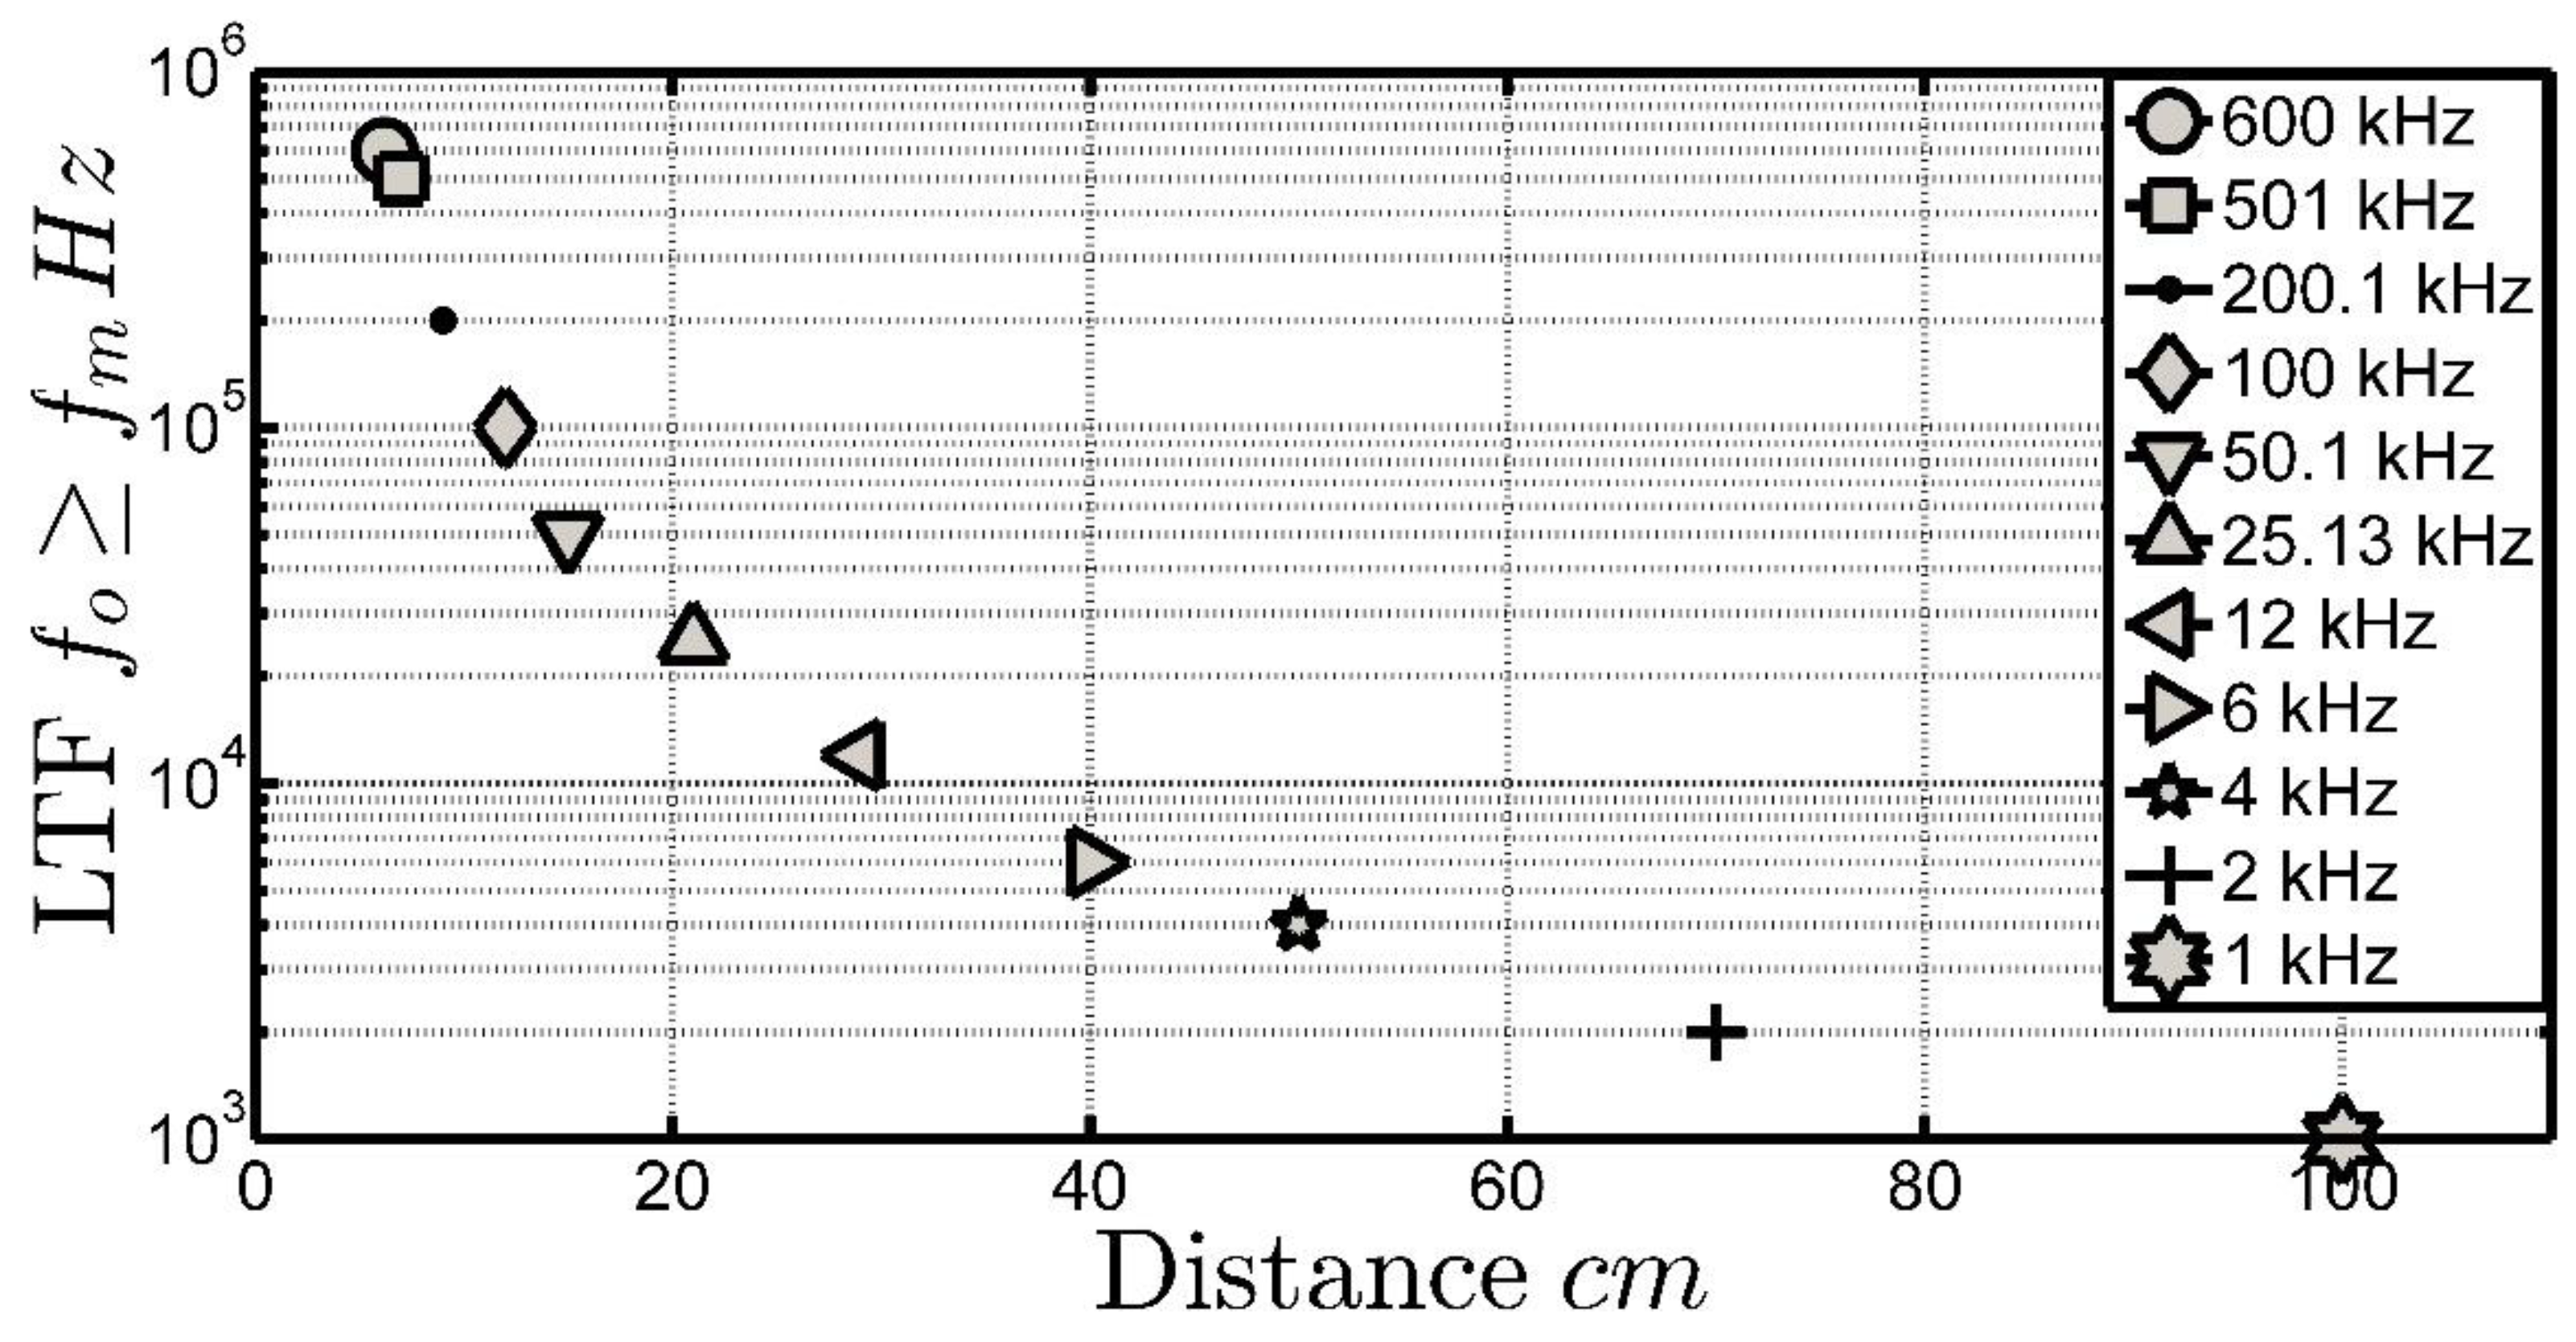
Regarding the experiment, for each frequency f O O K value, we can see the link distance between the LED and the LTF converter, which would allow finding an LTF output frequency f o 4 f O O K . Figure 7 depicts an experimental estimation of the LTF output frequency f o versus link distance, for the different values f O O K . We can see that the maximum frequency f O O K of modulating signal is limited by transmission length, because the light intensity on the LTF is also a function of distance. The minimal link distance was 6.2 cm for a maximum frequency f O O K = 600   kHz , without the LTF output frequency operates in saturation mode. Such maximum frequency could be achieved at a greater distance (>6.2 cm), if we consider an optical concentrator in the receiver. For the case of less frequency f O O K = 1   kHz , the maximum distance was the 100 cm.
In Figure 4, we can appreciate the sensibility of the LTF converter to incident light. For slight variations of transmission reach, a considerate change in output frequency is observed. Nevertheless, we consider that having a receiver with high responsivity could limit the visible light communication system, if the application scenarios have light sources different to LED transmitters. Such stimulations may cause a frequency deviation of that mapped in the color-shift keying (CSK) constellation space [23].

5. Conclusions

This paper proposed a novel receiver for visible light communication system using a LTF converter as the detector. The LTF can convert the modulated light into periodic square signal with a frequency proportional to light intensity. Under this scheme, the frequency estimation can be performed with the period measurement technique, without the need of ADC modules in the receiver side. In this system, the characterization of LTF converter was presented in terms of SNR, its input optical power, and the frequency of its output squares signal. The main objective of this characterization is to identify the parameters that determine the performance of the LTF converter as a receiver in a VLC system. Among the measured parameters of the LTF detector, responsivity R e was big enough to make the device too sensitive to light intensity variations. However, such a characteristic could affect the overall SNR of the communication, as the detector is also sensitive to power related to outside optical sources. Experimental results showed that the LTF output signal has a maximum output frequency of 600 kHz at a distance of 6.2 cm. In this setup, measured SNR reached 18.75 dB, while the lowest obtained SNR with 1.1 m length was roughly −35.1 dB. Therefore, we conclude that it is possible to use the LTF converter as a receiver in a VLC system, considering a minimum SNR value that guarantees the f o 4 f O O K inequality. Given the condition that f o 4 f O O K , a theoretical bit rate can be achieved and would be less than or equal to 150 kbps; however, we must be aware that no bit error rate measurement was made, because the electronic elements used are noisy and under the mentioned conditions, we obtained an SNR of 18.75 dB. This could have an impact on the speed of the system, but we consider that it could be a functional VLC system, because the main application is in low data rate sceneries, so the bit rate is not critical. The f o 4 f O O K is necessary for the identification of the LTF output frequency with the measurement system used in the receiver. Additionally, it must be ensured that the application scenario has a reduced number of non-transmitting lighting sources, in order to mitigate the negative effects of noise on the VLC receiver, and then the frequency shift in the LTF output.
The main advantage of using the LTF converter as a detector in a VLC system lies in the low complexity to convert light intensity to an electrical signal, which can be directly processed in a digital device such as a microcontroller, a field-programmer gate array (FPGA), or an embedded system equipped with a fast reference clock [14,15].
This way of detection is suggested for low data rate sceneries (indoor location, sensor networks, VLC-ID systems) because of limited bandwidth of the LTF, which is less than 800   kHz . Hence, higher data speed can be improved with an increased order of the CSK modulation format, at the cost of a penalty in transmission reach [23].
Future works include evaluation of multilevel modulation techniques like CSK [22,23] and pulse-width modulation (PWM) [24,25], which allows one to maximize the low bandwidth of the LTF converter.

Author Contributions

All authors contributed equally to writing the paper. R.A.M.C. and F.E.L.G. proposed the research project and designed the experiments; R.A.M.C. wrote the paper; A.F.B.P. contributed to the formal analysis; M.L.R. and A.F.B.P. derived the analytic model and revised the paper.

Funding

This research received no external funding.

Acknowledgments

This work was supported by the Instituto Tecnológico Metropolitano (ITM) of Colombia and Universidad Autónoma de San Luis Potosí (UASLP) of México.

Conflicts of Interest

The authors declare no conflict of interest.

References

  1. Ghassemlooy, Z.; Popoola, W.; Rajbhandari, S. Optical Wireless Communications System and Channel Modelling with MATLAB; CRC Press: Boca Raton, FL, USA, 2013. [Google Scholar]
  2. Cevik, T.; Yilmaz, S. An overview of visible light communication systems. Int. J. Comput. Netw. Commun. (IJCNC) 2015, 7, 139–150. [Google Scholar] [CrossRef]
  3. Komine, T.; Nakagawa, M. Fundamental analysis for visible light communication system using LED lights. IEEE Trans. Consum. Electron. 2004, 50, 100–107. [Google Scholar] [CrossRef]
  4. Grobe, L.; Paraskevopoulos, A.; Hilt, J.; Schulz, D.; Lassak, F.; Hartlieb, F.; Kottke, C.; Jungnickel, V.; Langer, K. High-speed visible light communication systems. IEEE Commun. Mag. 2013, 51, 60–66. [Google Scholar] [CrossRef]
  5. Pathak, P.H.; Feng, X.T.; Hu, P.F.; Mohapatra, P. Visible light communication, networking, and sensing: A survey, potential and challenges. IEEE Commun. Surv. Tutor. 2015, 17, 2047–2077. [Google Scholar] [CrossRef]
  6. Umbach, A.; Engel, T.; Bach, H.G.; van Waasen, S.; Droge, E.; Strittmatter, A.; Ebert, W.; Passenberg, W.; Steingruber, R.; Schlaak, W.; et al. Technology of InP-based 1.55-/spl mu/m ultrafast OEMMICs: 40-Gbit/s broad-band and 38/60-GHz narrow-band photoreceivers. IEEE J. Quantum Electron. 1999, 35, 1024–1031. [Google Scholar] [CrossRef]
  7. IEEE Standard for Local and Metropolitan Area Networks—Part 15.7: Short-Range Wireless Optical Communication Using Visible Light, 802.15.7-2011, 2011. Available online: https://standards.ieee.org/findstds/standard/802.15.7-2011.html (accessed on 27 August 2018). [CrossRef]
  8. Agrawal, G.P. Fiber-Optic Communications Systems; Wiley: New York, NY, USA, 2002. [Google Scholar]
  9. Martinez, R.; Lopez, F.; Betancur, A. RGB sensor frequency response for a visible light communication system. IEEE Latin Am. Trans. 2016, 14, 4688–4692. [Google Scholar] [CrossRef]
  10. Barrales, G.; Mocholí, S.; Vázquez, C.; Rodríguez, R.; Barrales, G. A technique for sdapting a Quasi-Digital photodetector to a frequency-to-digital converter. In Proceedings of the 2012 IEEE Ninth Electronics, Robotics and Automotive Mechanics Conference (CERMA 2012), Cuernavaca, Mexico, 19–23 November 2012; pp. 343–348. [Google Scholar]
  11. Ehsan, A.; Shaari, A.; Rahman, M.; Khan, K. Optical transceiver design for POF portable optical access-card system using light-to-frequency converter. In Proceedings of the 2008 IEEE International Conference on Semiconductor Electronics, Johor Bahru, Malaysia, 25–27 November 2008; pp. 345–349. [Google Scholar]
  12. Tang, F.; Shu, Z.; Ye, K.; Zhou, X.; Hu, S.; Lin, Z.; Bermak, A. A linear 126-dB dynamic range light-to-frequency converter with dark current suppression upto 125 °C for blood oxygen concentration detection. IEEE Trans. Electron Devices 2016, 63, 3983–3988. [Google Scholar] [CrossRef]
  13. AMS. Light-To-Frequency—Programmable Light-To-Frequency Converter—TSL230RD. AMS Datasheet v1-00. Retrieved 14 September 2016. Available online: https://www.mouser.com/ds/2/588/TSL230RDTSL230ARDTSL230BRD-P-519226.pdf (accessed on 14 September 2016).
  14. TSL230RD, TSL230ARD, TSL230BRS Programable Light-To-Frequency Converters. 2016. Available online: http://ams.com/eng/Products/Light-Sensors/Light-to-Frequency (accessed on 17 May 2016).
  15. TCS3200, TCS3210, Programmable Color Light-To-Frequency Converter. 2009. Available online: http://ams.com/eng/Products/Light-Sensors/Color-Sensors/TCS3200 (accessed on 10 July 2015).
  16. Yurish, S. Intelligent opto sensors’ interfacing based on universal. frequency-to-digital converter. Sens. Transducers Mag. 2005, 56, 326–334. [Google Scholar]
  17. Monteiro, E. Design and Implementation of Color-Shift Keying for Visible Light Communications. Master’s Thesis, McMaster University, Hamilton, ON, Canada, 2013. [Google Scholar]
  18. Bhalerao, M.; Sonavane, S.; Kumar, V. A survey of wireless communication using visible light. Int. J. Adv. Eng. Technol. 2013, 5, 188–197. [Google Scholar]
  19. Li, H.; Chen, X.; Huang, B.; Tang, D.; Chen, H. High bandwidth visible light communications based on a post-equalization circuit. IEEE Photonics Technol. Lett. 2014, 26, 119–122. [Google Scholar] [CrossRef]
  20. Zeng, L.; O’Brien, D.; Le-Minh, H.; Lee, K.; Jung, D.; Oh, Y. Improvement of date rate by using equalization in an indoor visible light communication system. In Proceedings of the 2008 4th IEEE International Conference on Circuits and Systems for Communications, Shanghai, China, 26–28 May 2008; pp. 678–682. [Google Scholar]
  21. THORLABS. PM100D Compact Power and Energy Meter Console. 2016. Available online: https://www.thorlabs.com/thorproduct.cfm?partnumber=PM100D (accessed on 28 September 2016).
  22. Murata, N.; Kozawa, Y.; Umeda, Y. Digital color shift keying with multicolor LED array. IEEE Photonics J. 2016, 8, 1–13. [Google Scholar] [CrossRef]
  23. Luna-Rivera, J.; Suarez-Rodriguez, C.; Guerra, V.; Perez-Jimenez, R.; Rabadan-Borges, J.; Rufo-Torres, J. Low-complexity colour-shift keying-based visible light communications system. IET Optoelectron. 2015, 9, 191–198. [Google Scholar] [CrossRef]
  24. Assabir, A.; Elmhamdi, J.; Hammouch, A.; Akherraz, A. Application of Li-Fi technology in the transmission of the sound at the base of the PWM. In Proceedings of the 2016 International Conference on Electrical and Information Technologies (ICEIT), Tangiers, Morocco, 4–7 May 2016; pp. 260–265. [Google Scholar]
  25. Pradana, A.; Ahmadi, N.; Adionos, T. Design and implementation of visible light communication system using pulse width modulation. In Proceedings of the 2015 International Conference on Electrical Engineering and Informatics (ICEEI), Denpasar, Indonesia, 10–11 August 2015; pp. 25–30. [Google Scholar]
Figure 1. Block diagram of a visible light communication (VLC) system. LED—light-emitting-diode; PD—photodiode.
Electronics 07 00165 g001
Figure 2. Experimental setup for the characterization of the LTF converter.
Electronics 07 00165 g002
Figure 3. Experimental setup. Estimated f O and optical power under various link distance: (a) LTF output frequency versus link distance; (b) optical input power versus link distance.
Electronics 07 00165 g003
Figure 4. Model description: (a) signal-to-noise ratio (SNR) versus LTF output frequency; (b) SNR versus link distance.
Electronics 07 00165 g004
Figure 5. Dark frequency versus link distance.
Electronics 07 00165 g005
Figure 6. Transmitter with on-off keying (OOK) modulator signal and LTF as receiver signal: (a) optical power transmission; (b) LTF output frequency.
Electronics 07 00165 g006
Figure 7. LTF frequency estimation for the different f O O K value and variation link distance.
Electronics 07 00165 g007

