Design of a Proportional Resonant Controller with Resonant Harmonic Compensator and Fault Ride Trough Strategies for a Grid-Connected Photovoltaic System


 , ,
, , 
 and
and 
Abstract
:1. Introduction
- Design and simulation analysis of the grid-connected PVS is carried out—i.e., the PV side, grid side parameters, and DC link voltage are optimized to the acceptable limits, not only at the PCC, but also at a 19 km distance from the PCC.
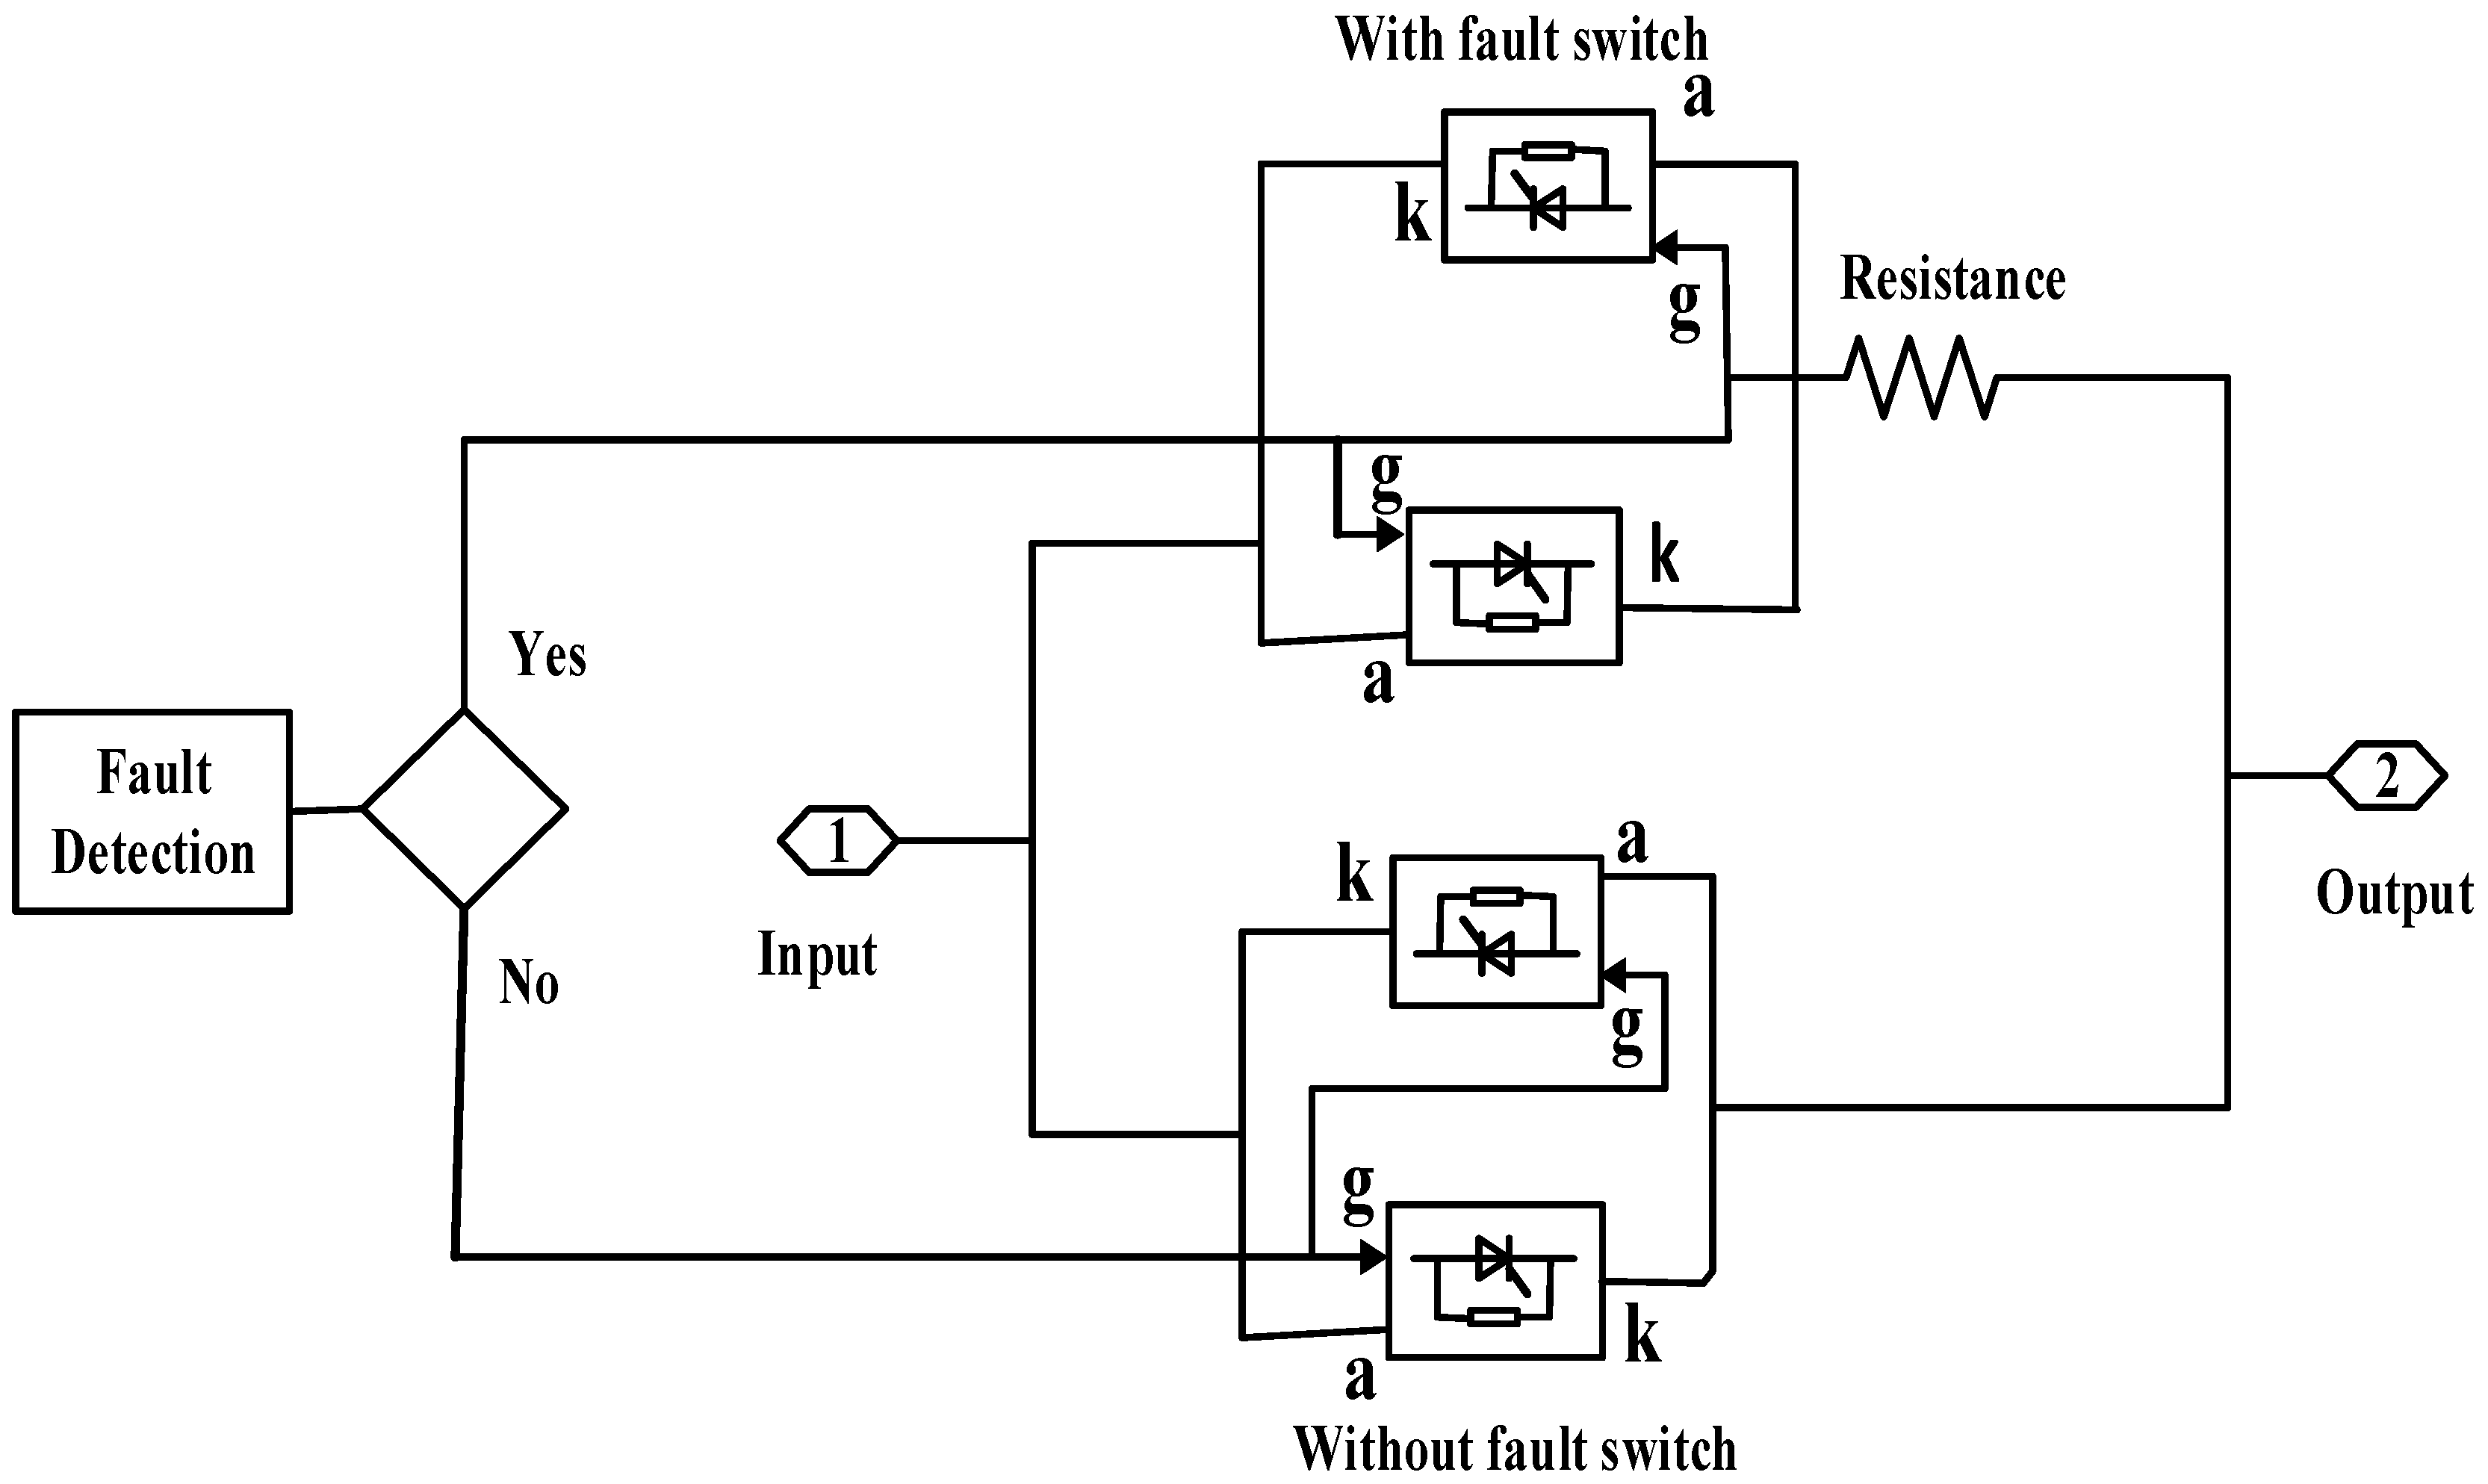
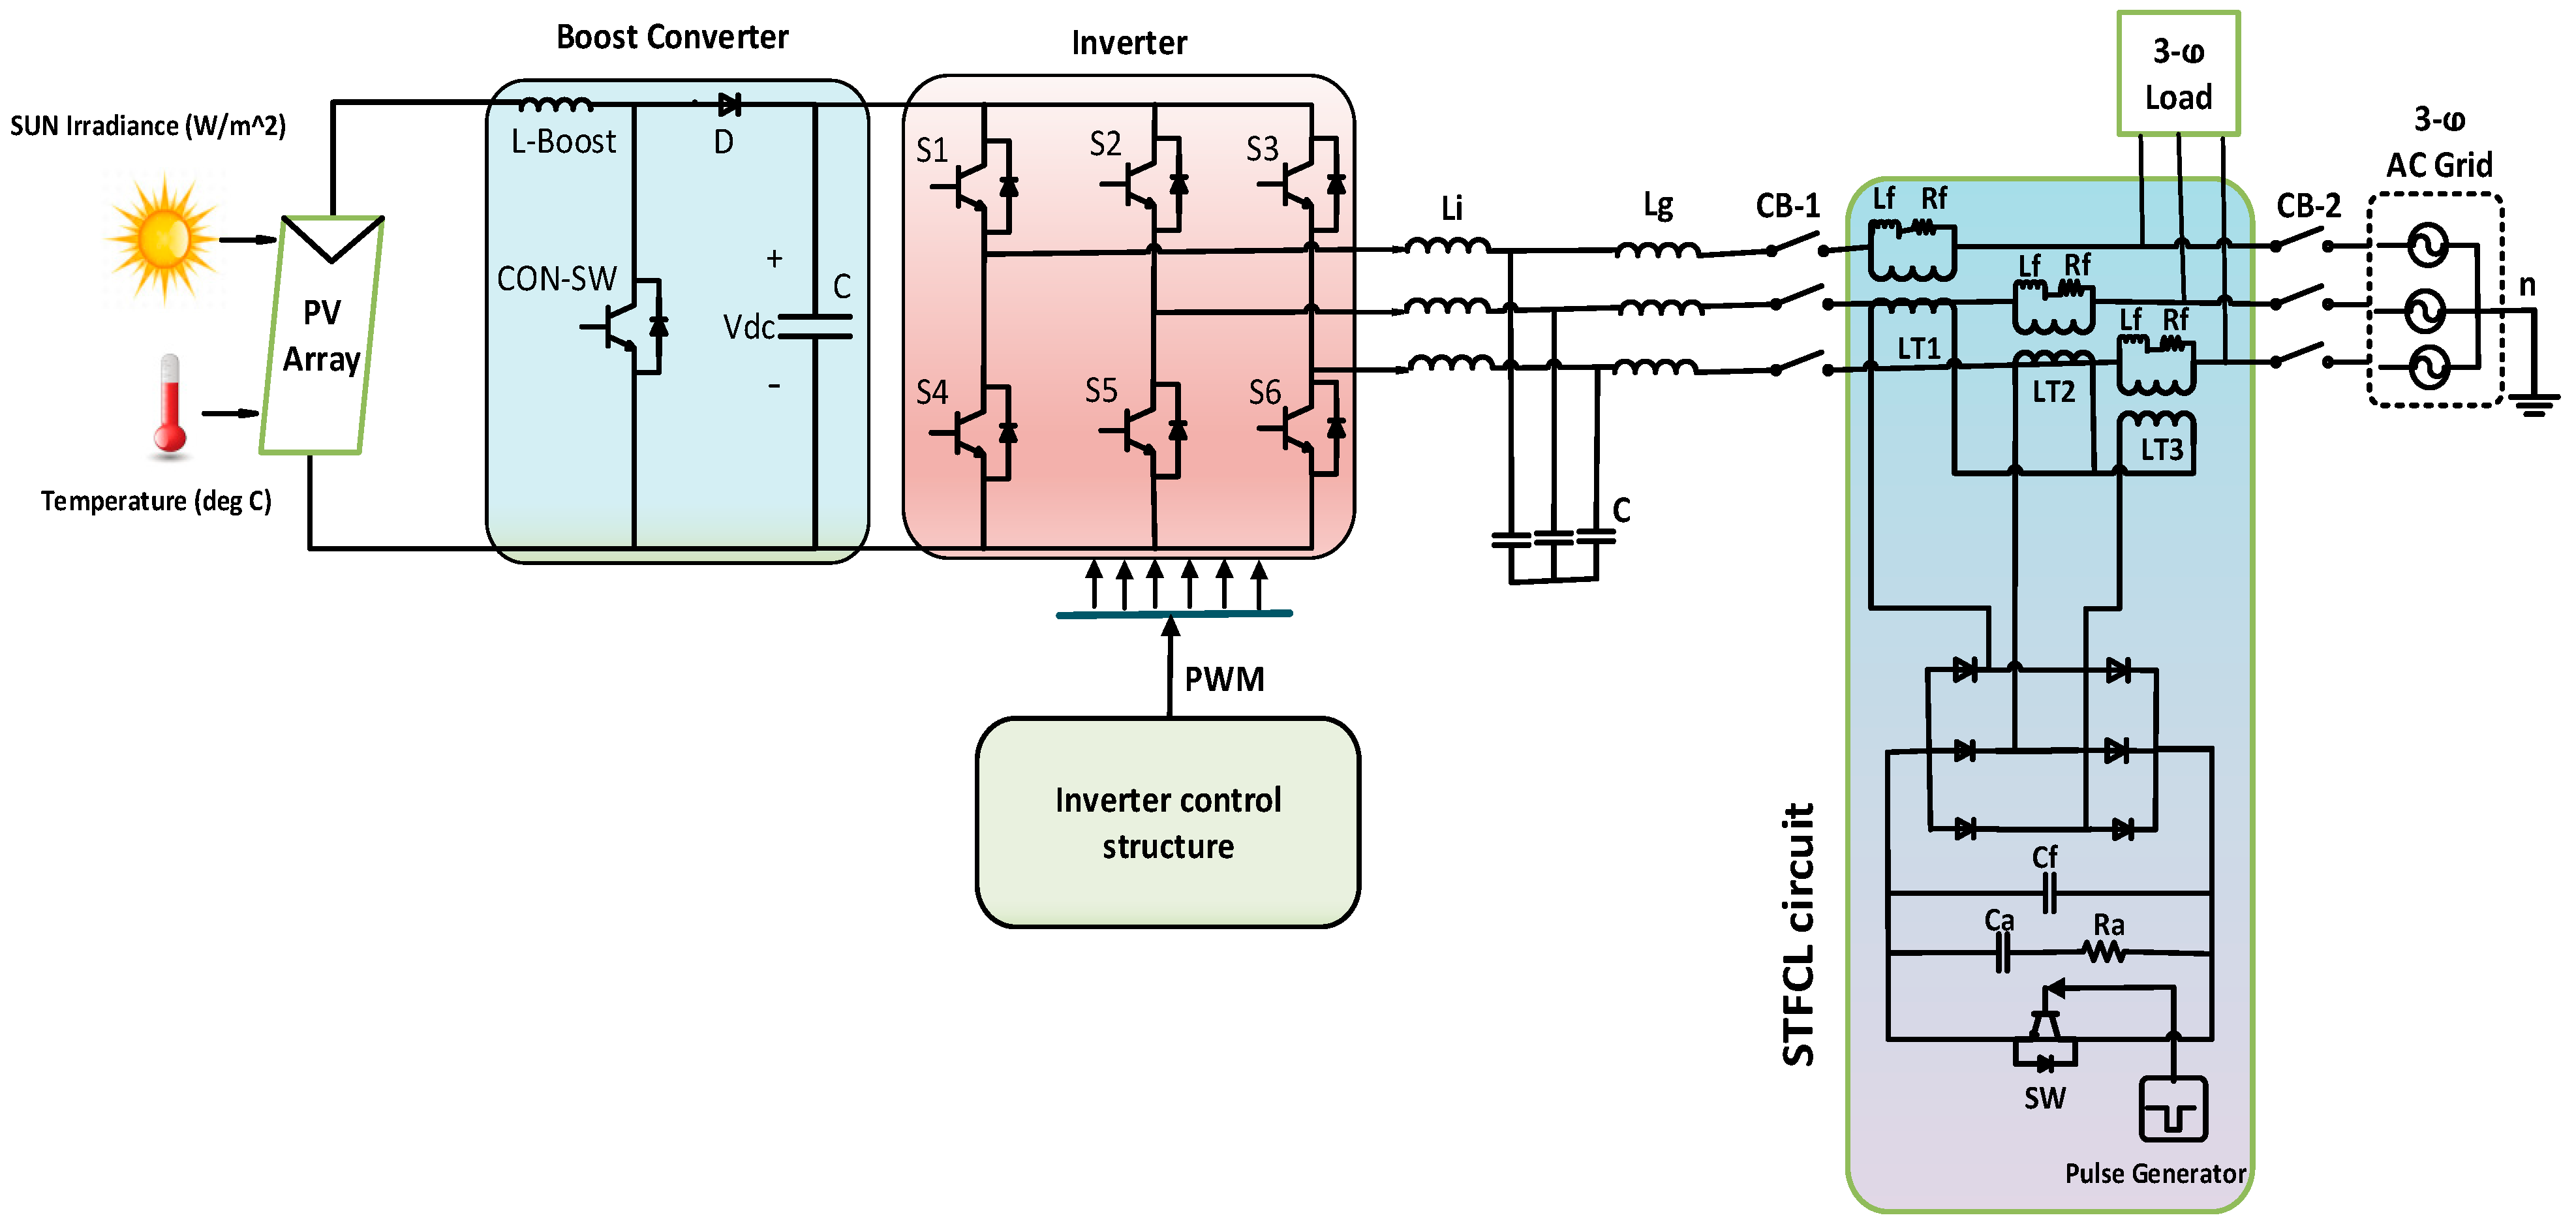
- A novel switch-type fault–current limiter (STFCL) topology is implemented to improve the LVRT capability of the PVS.
- A detailed and precise comparison of the conventional crowbar strategy with STFCL topology is performed.
- Proportional resonant (PR) with resonant harmonic compensator (RHC) is designed and compared with previously practiced PI controllers.
- Asymmetrical faults are applied for 150 ms to verify the fault-tolerant capability of the proposed PR with RHC along with the STFCL, in to compare to the conventional PI and crowbar strategy.
- Performance evaluation analysis is performed to verify the stability of the proposed controller and strategy i.e., integral absolute error (IAE), integral-square error (ISE), and integral of time-weighted absolute error (ITAE).
2. Mathematical Modeling
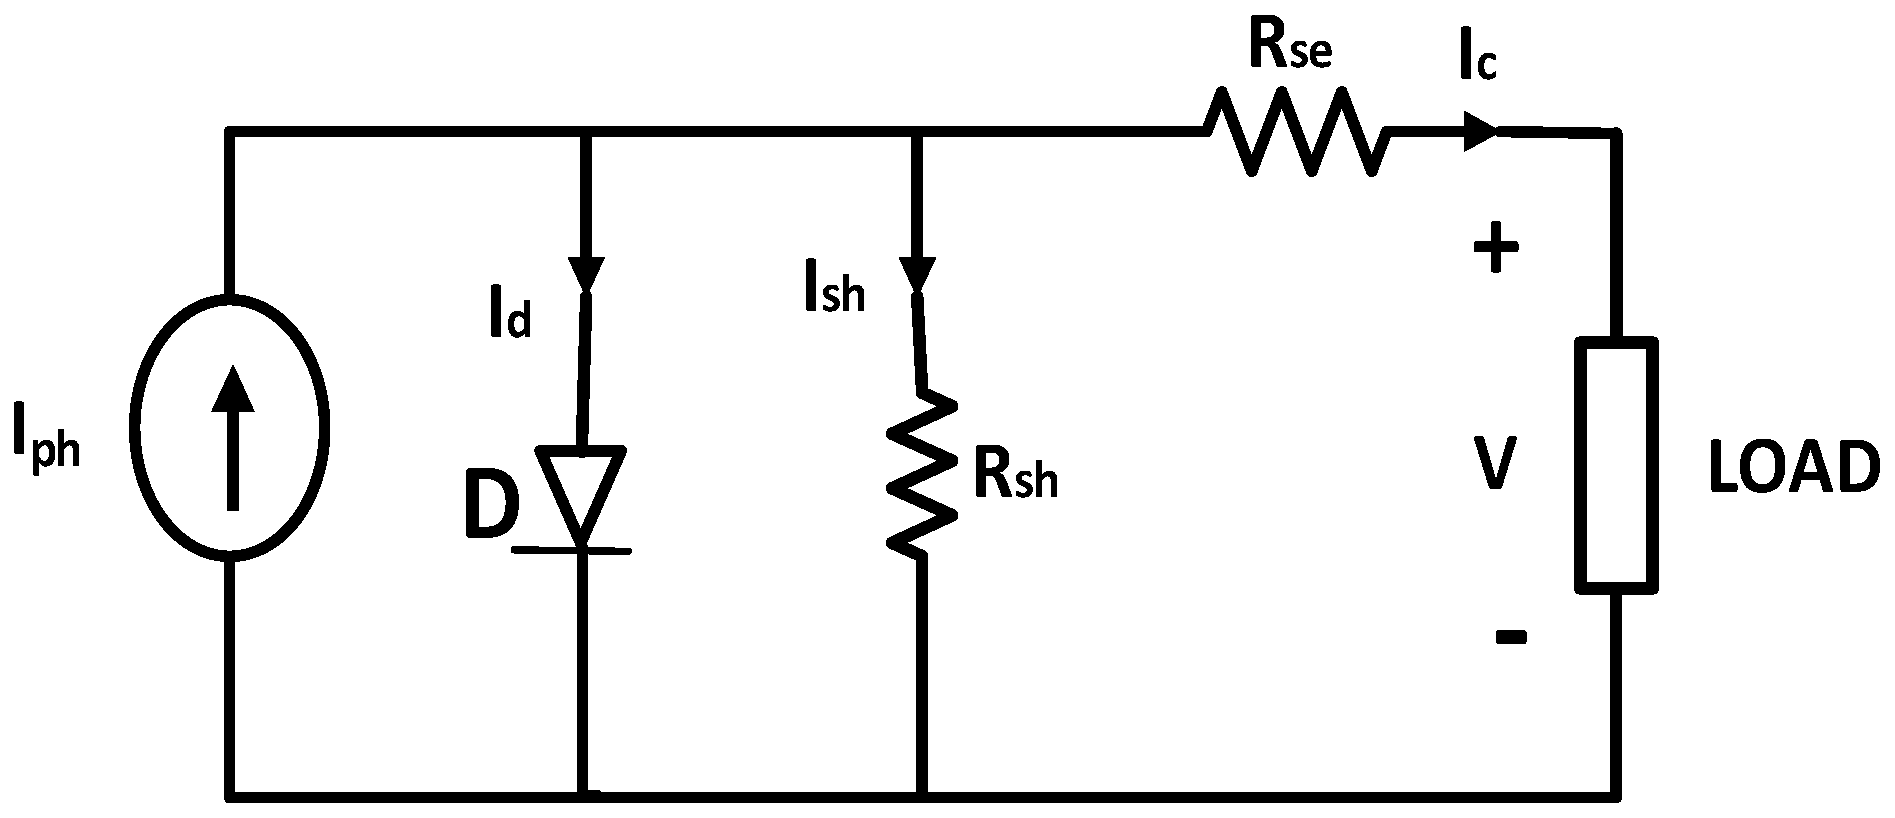
2.1. Mathematical Modeling of a Photovoltaic Cell
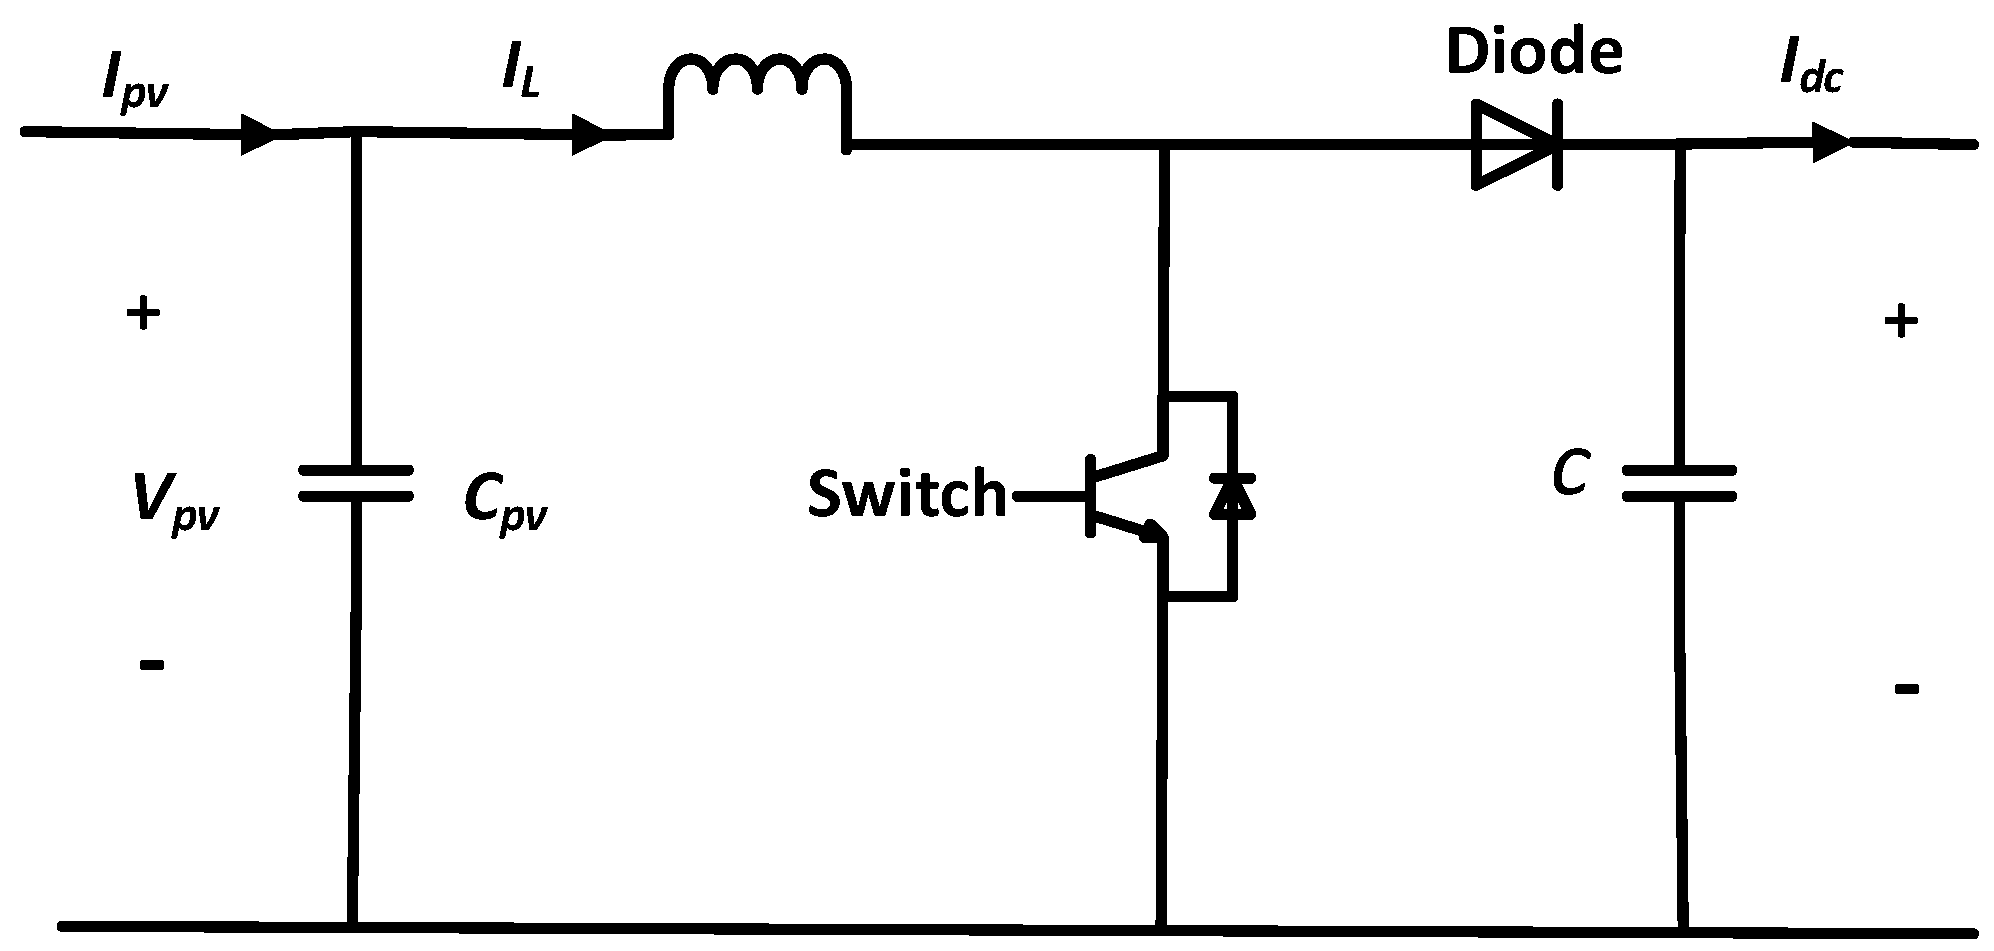
2.2. Mathematical Modeling of a DC-DC Boost Converter
2.3. Modeling of the Inverter
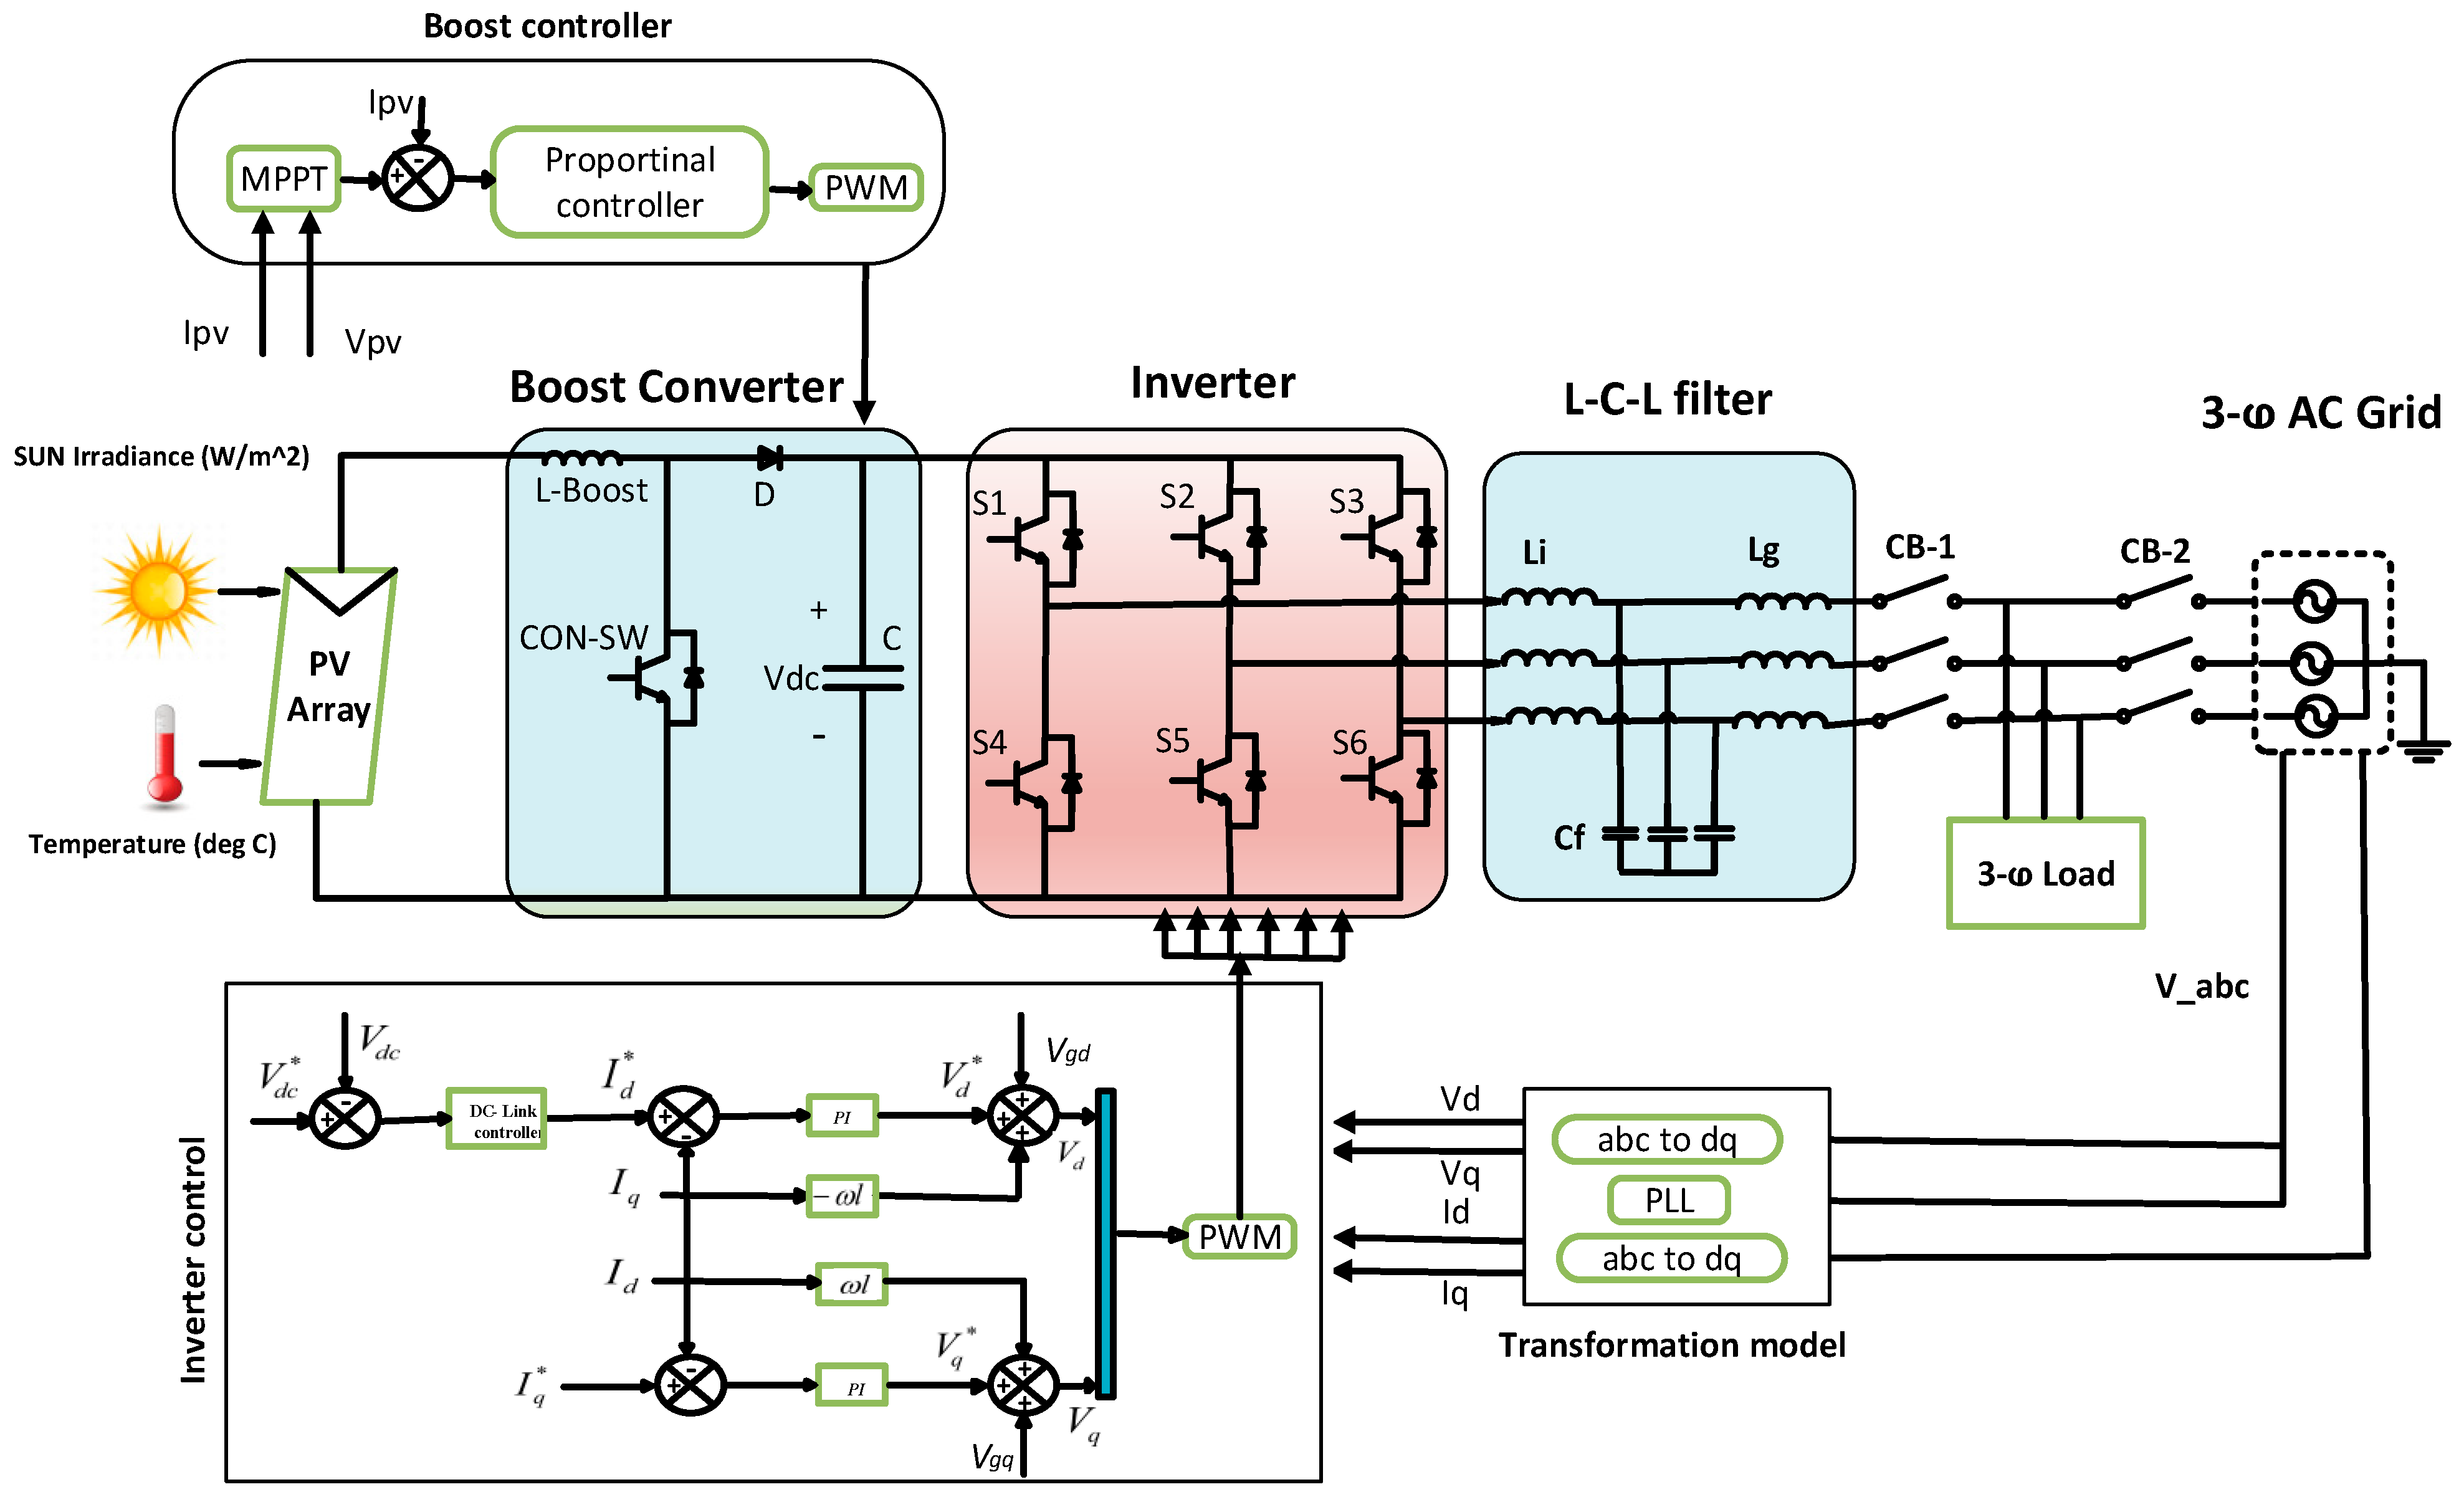
2.4. Proposed System
2.5. Design of Controller and Fault-Ride Through Strategy
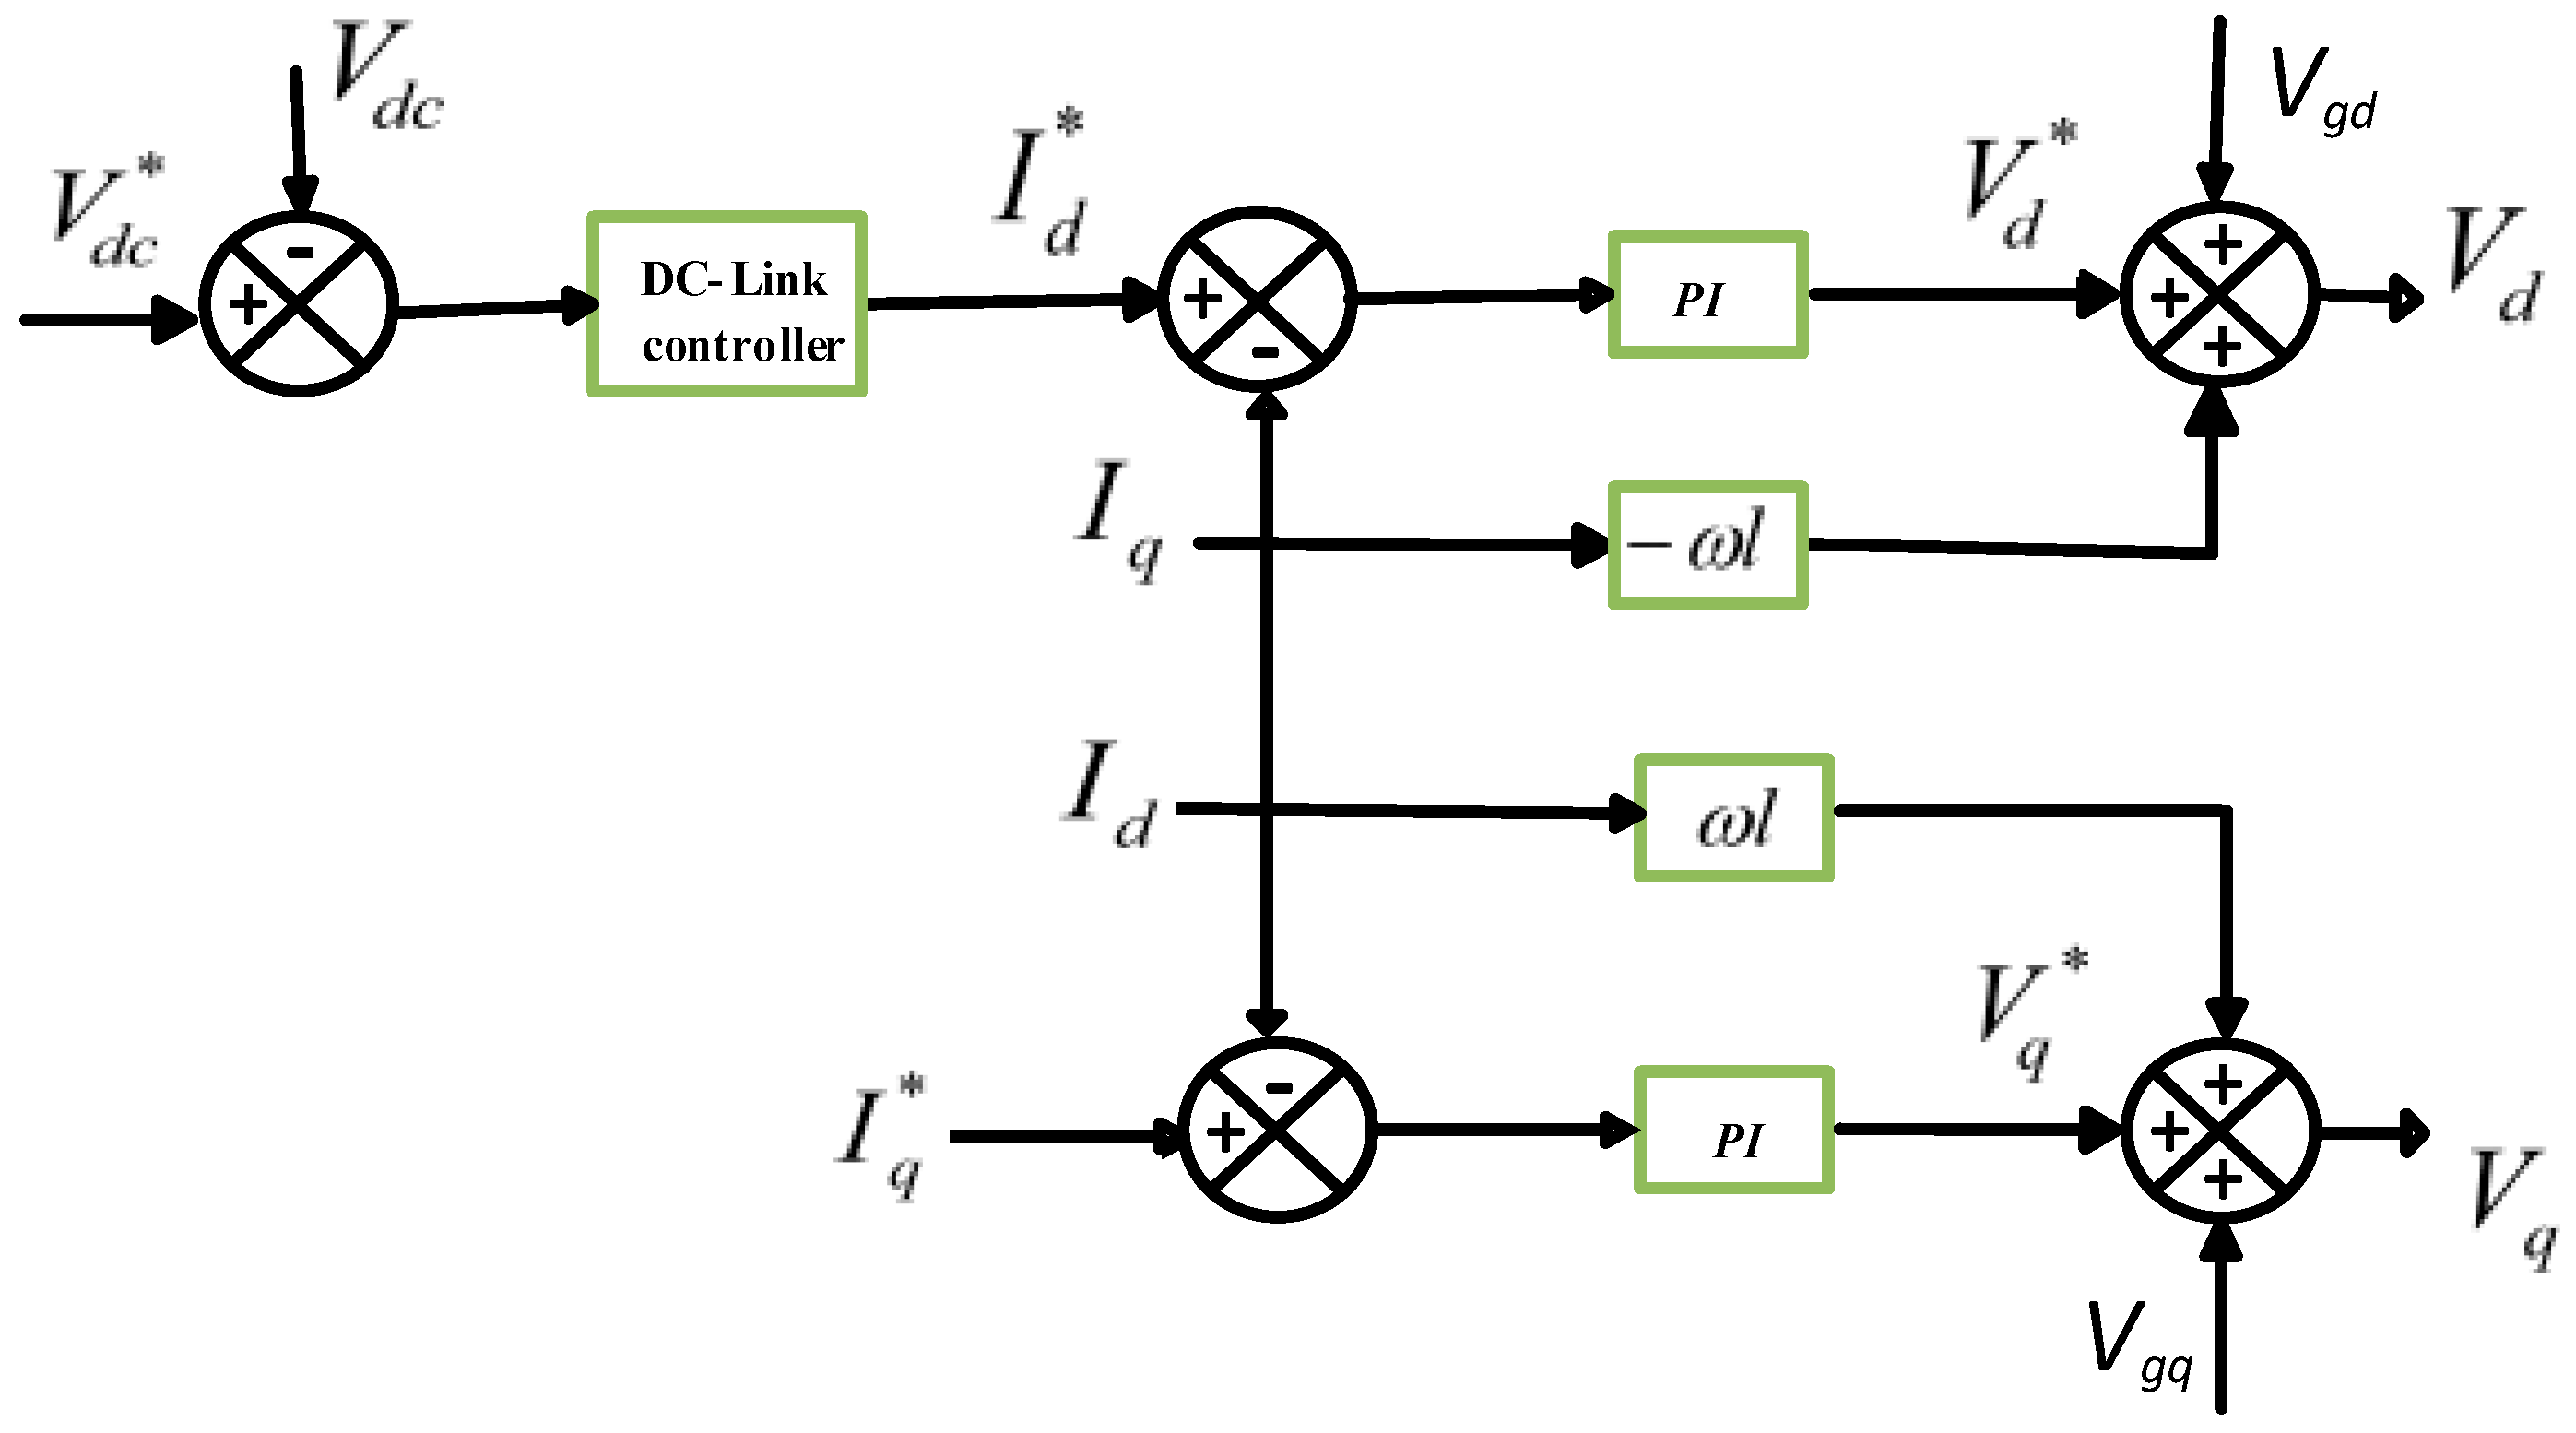
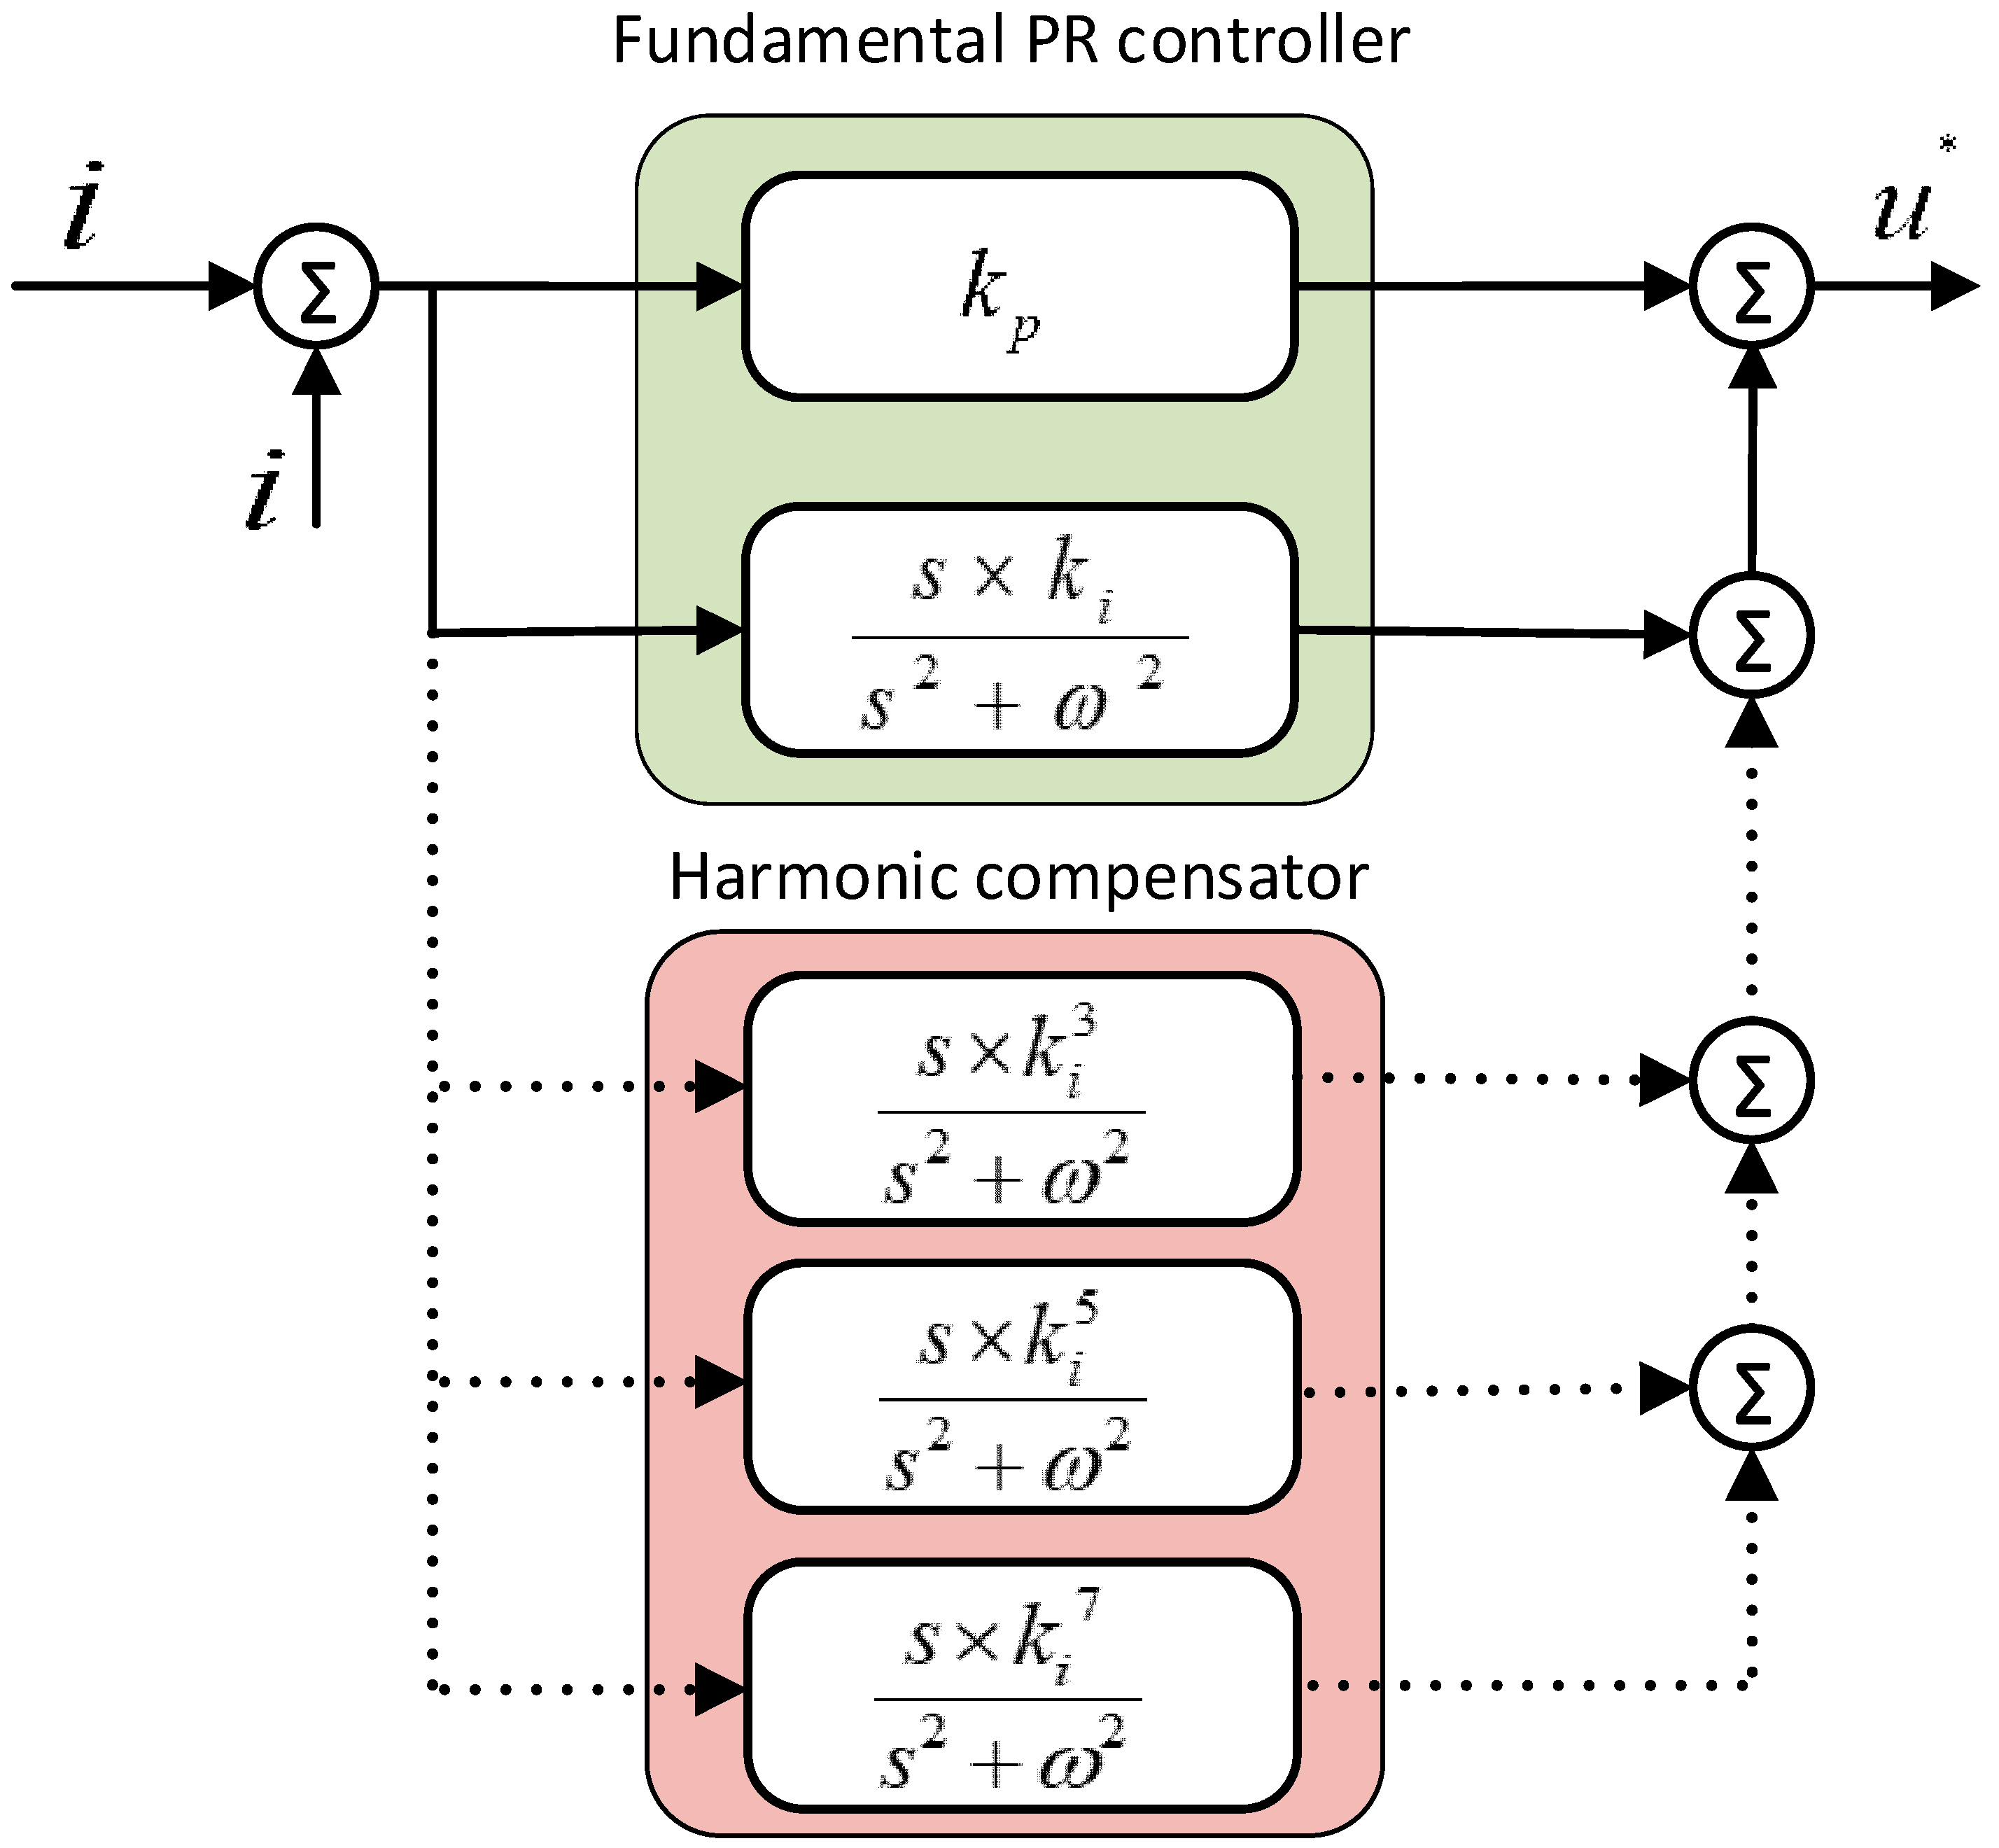
2.5.1. Controller Design
2.5.2. Fault-Ride Through (FRT) strategies
3. Results and Discussion
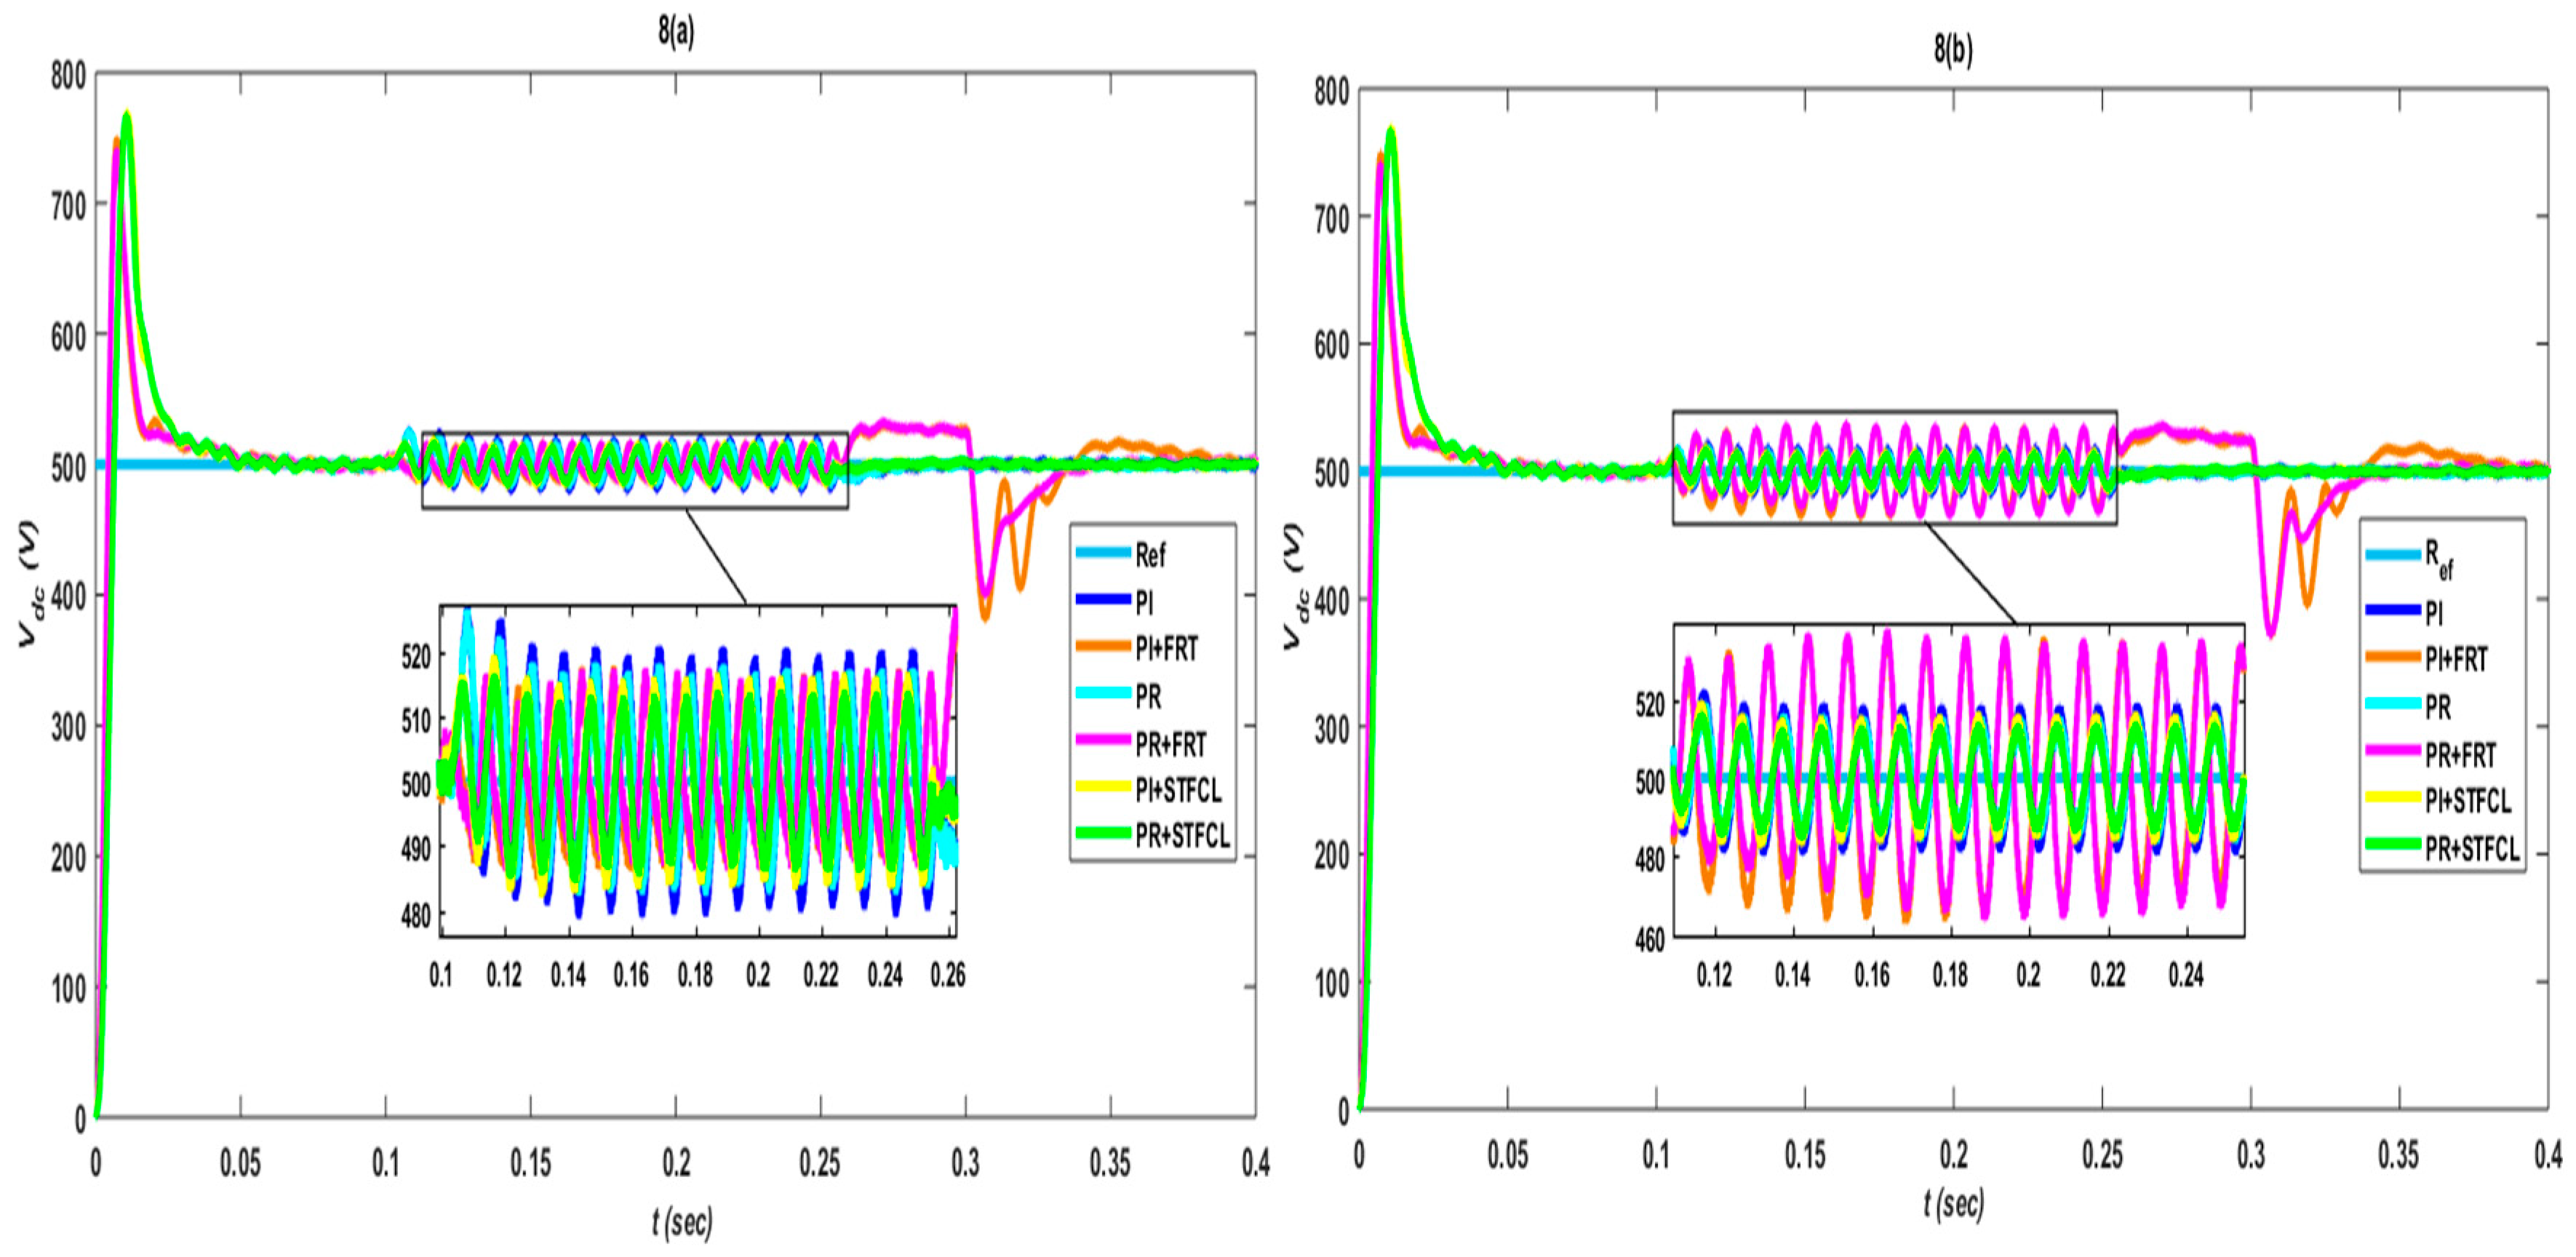
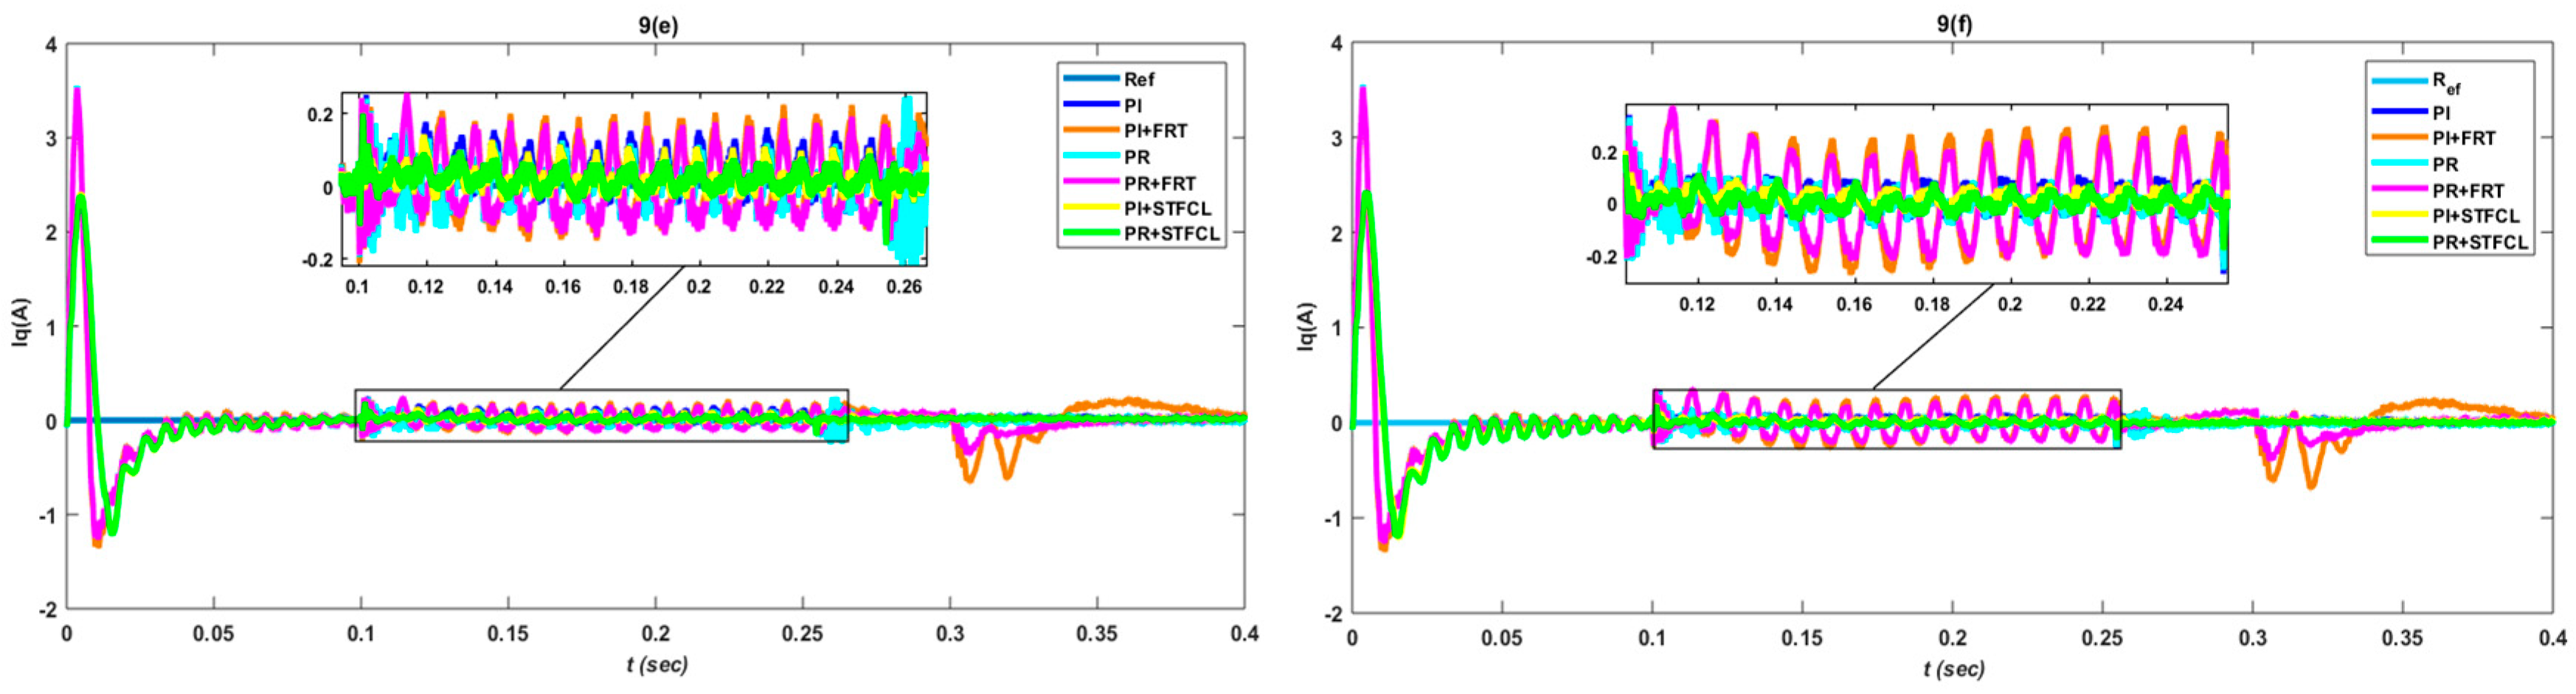
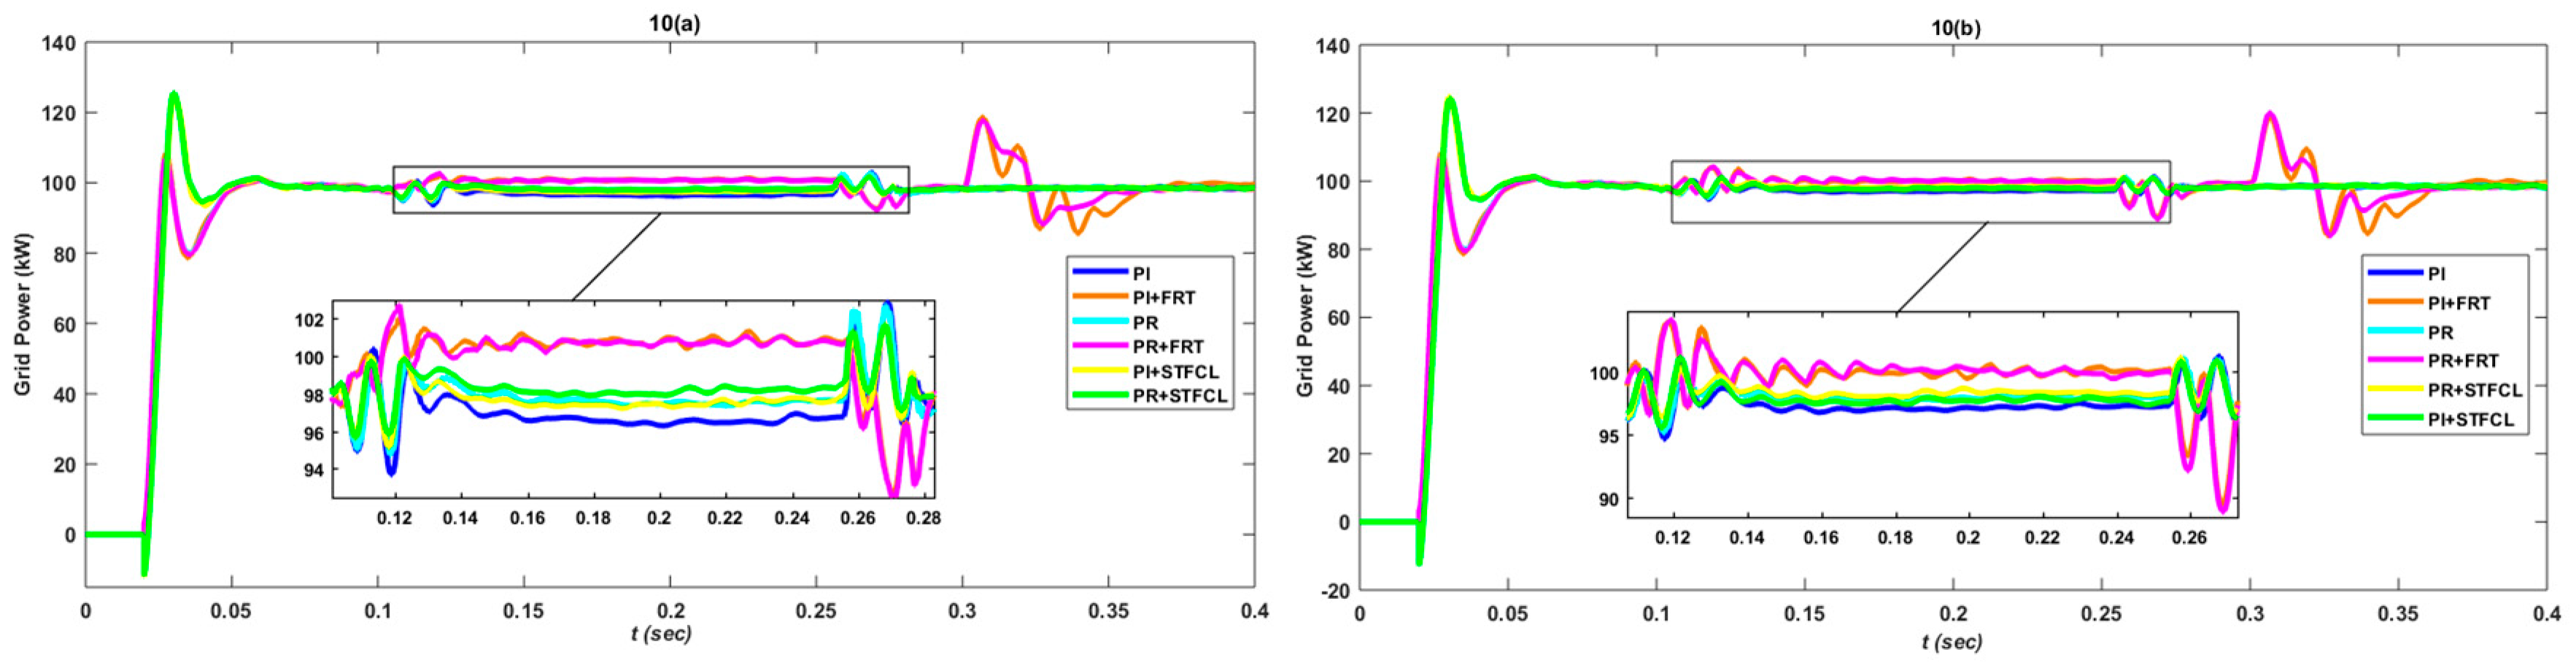
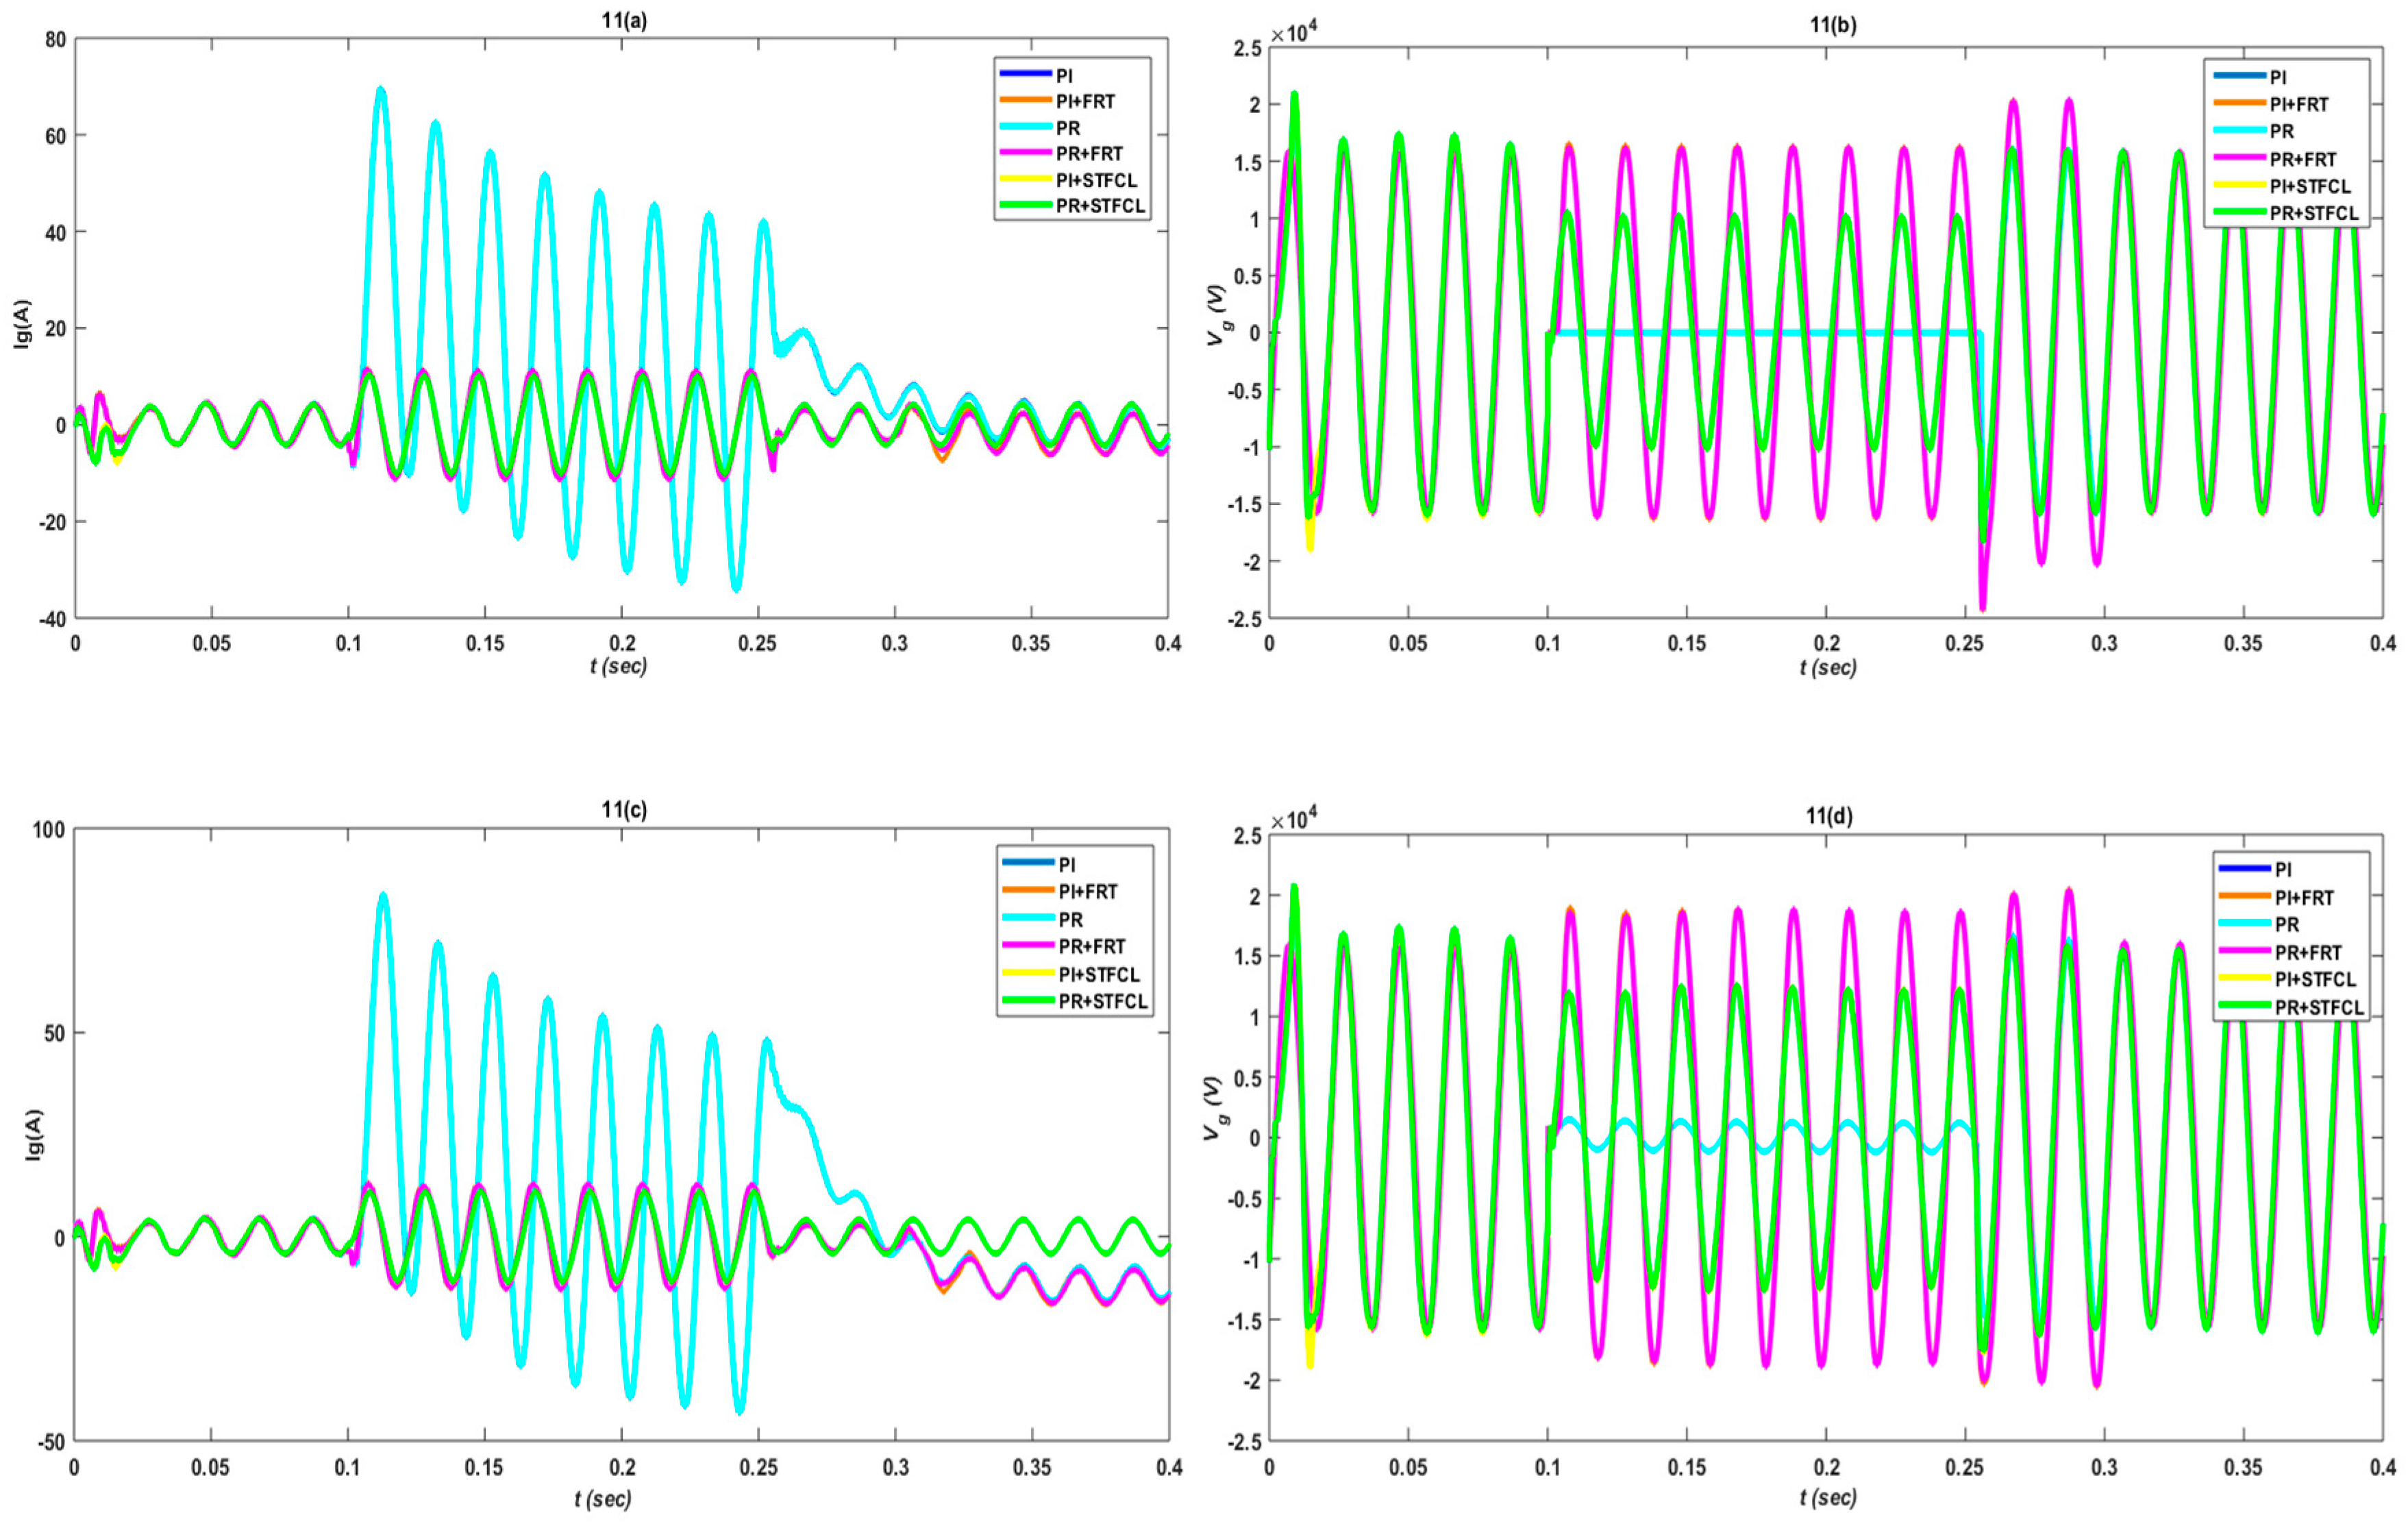
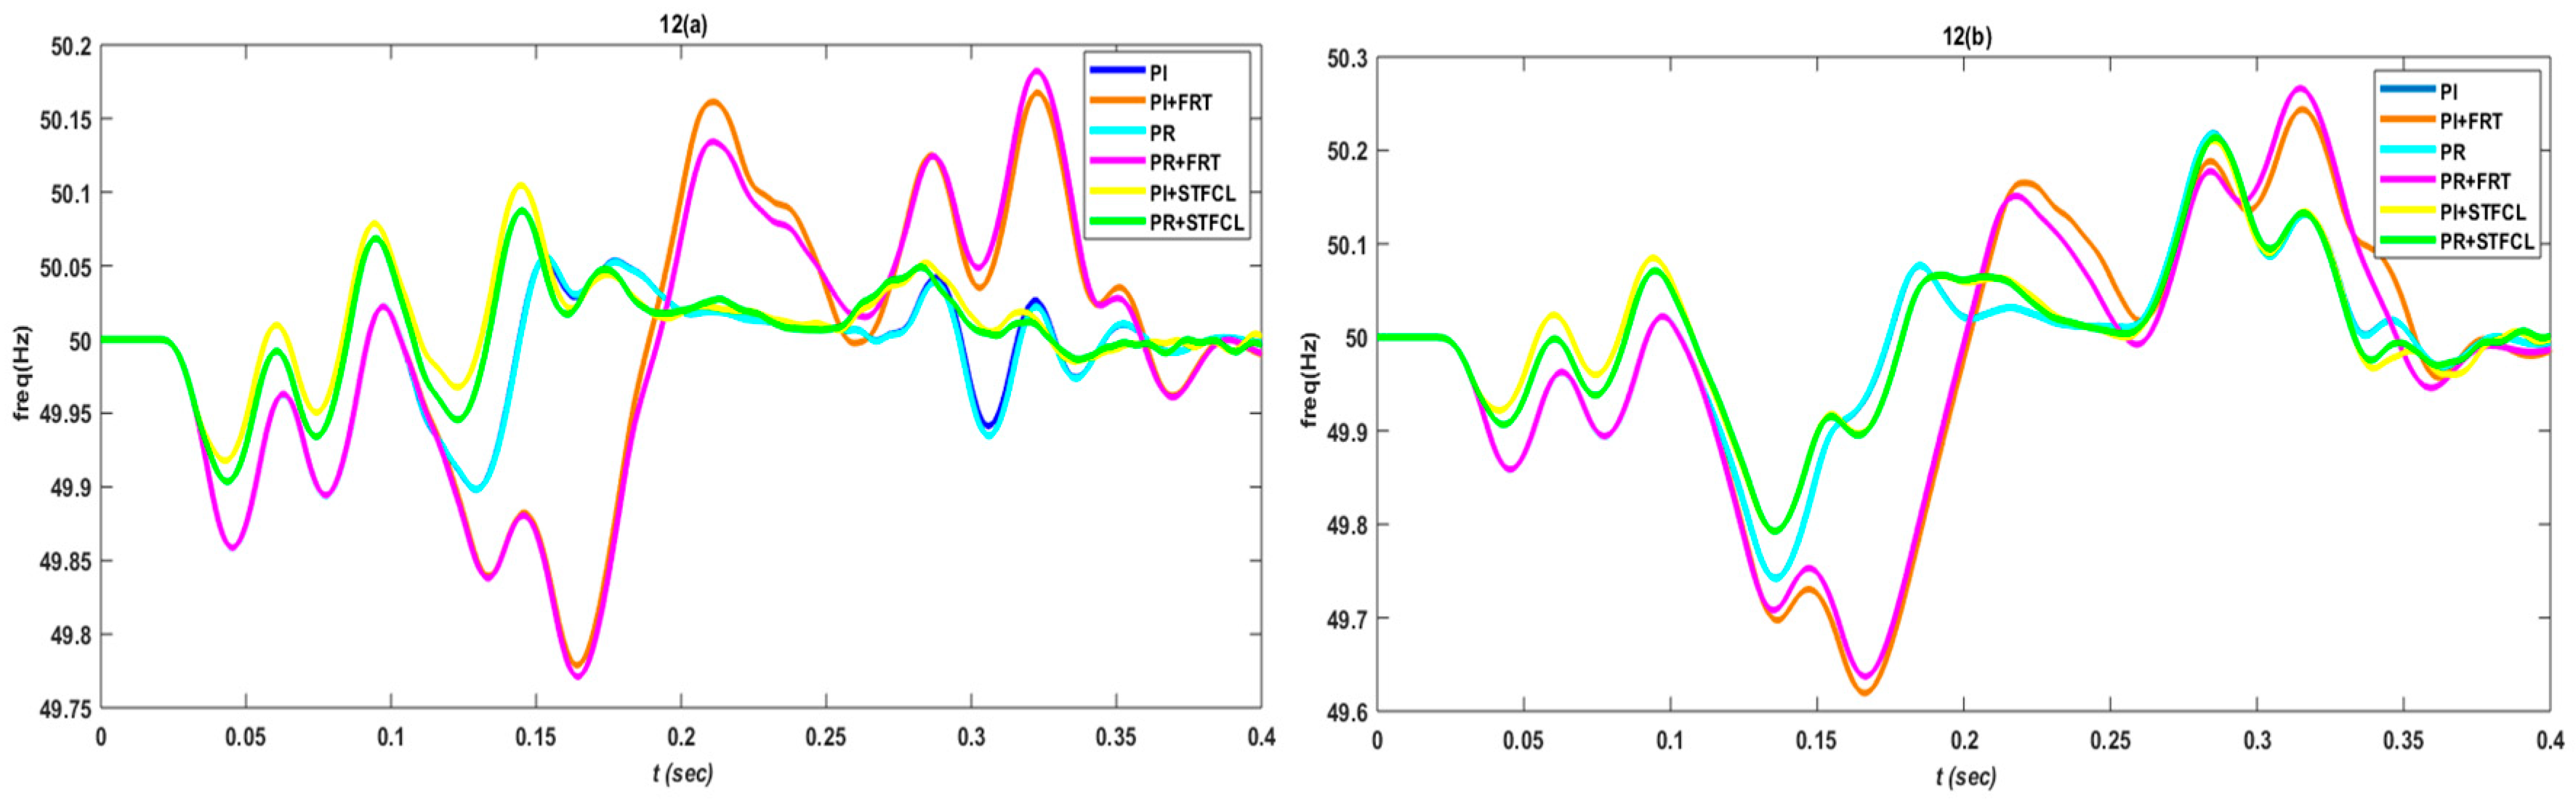
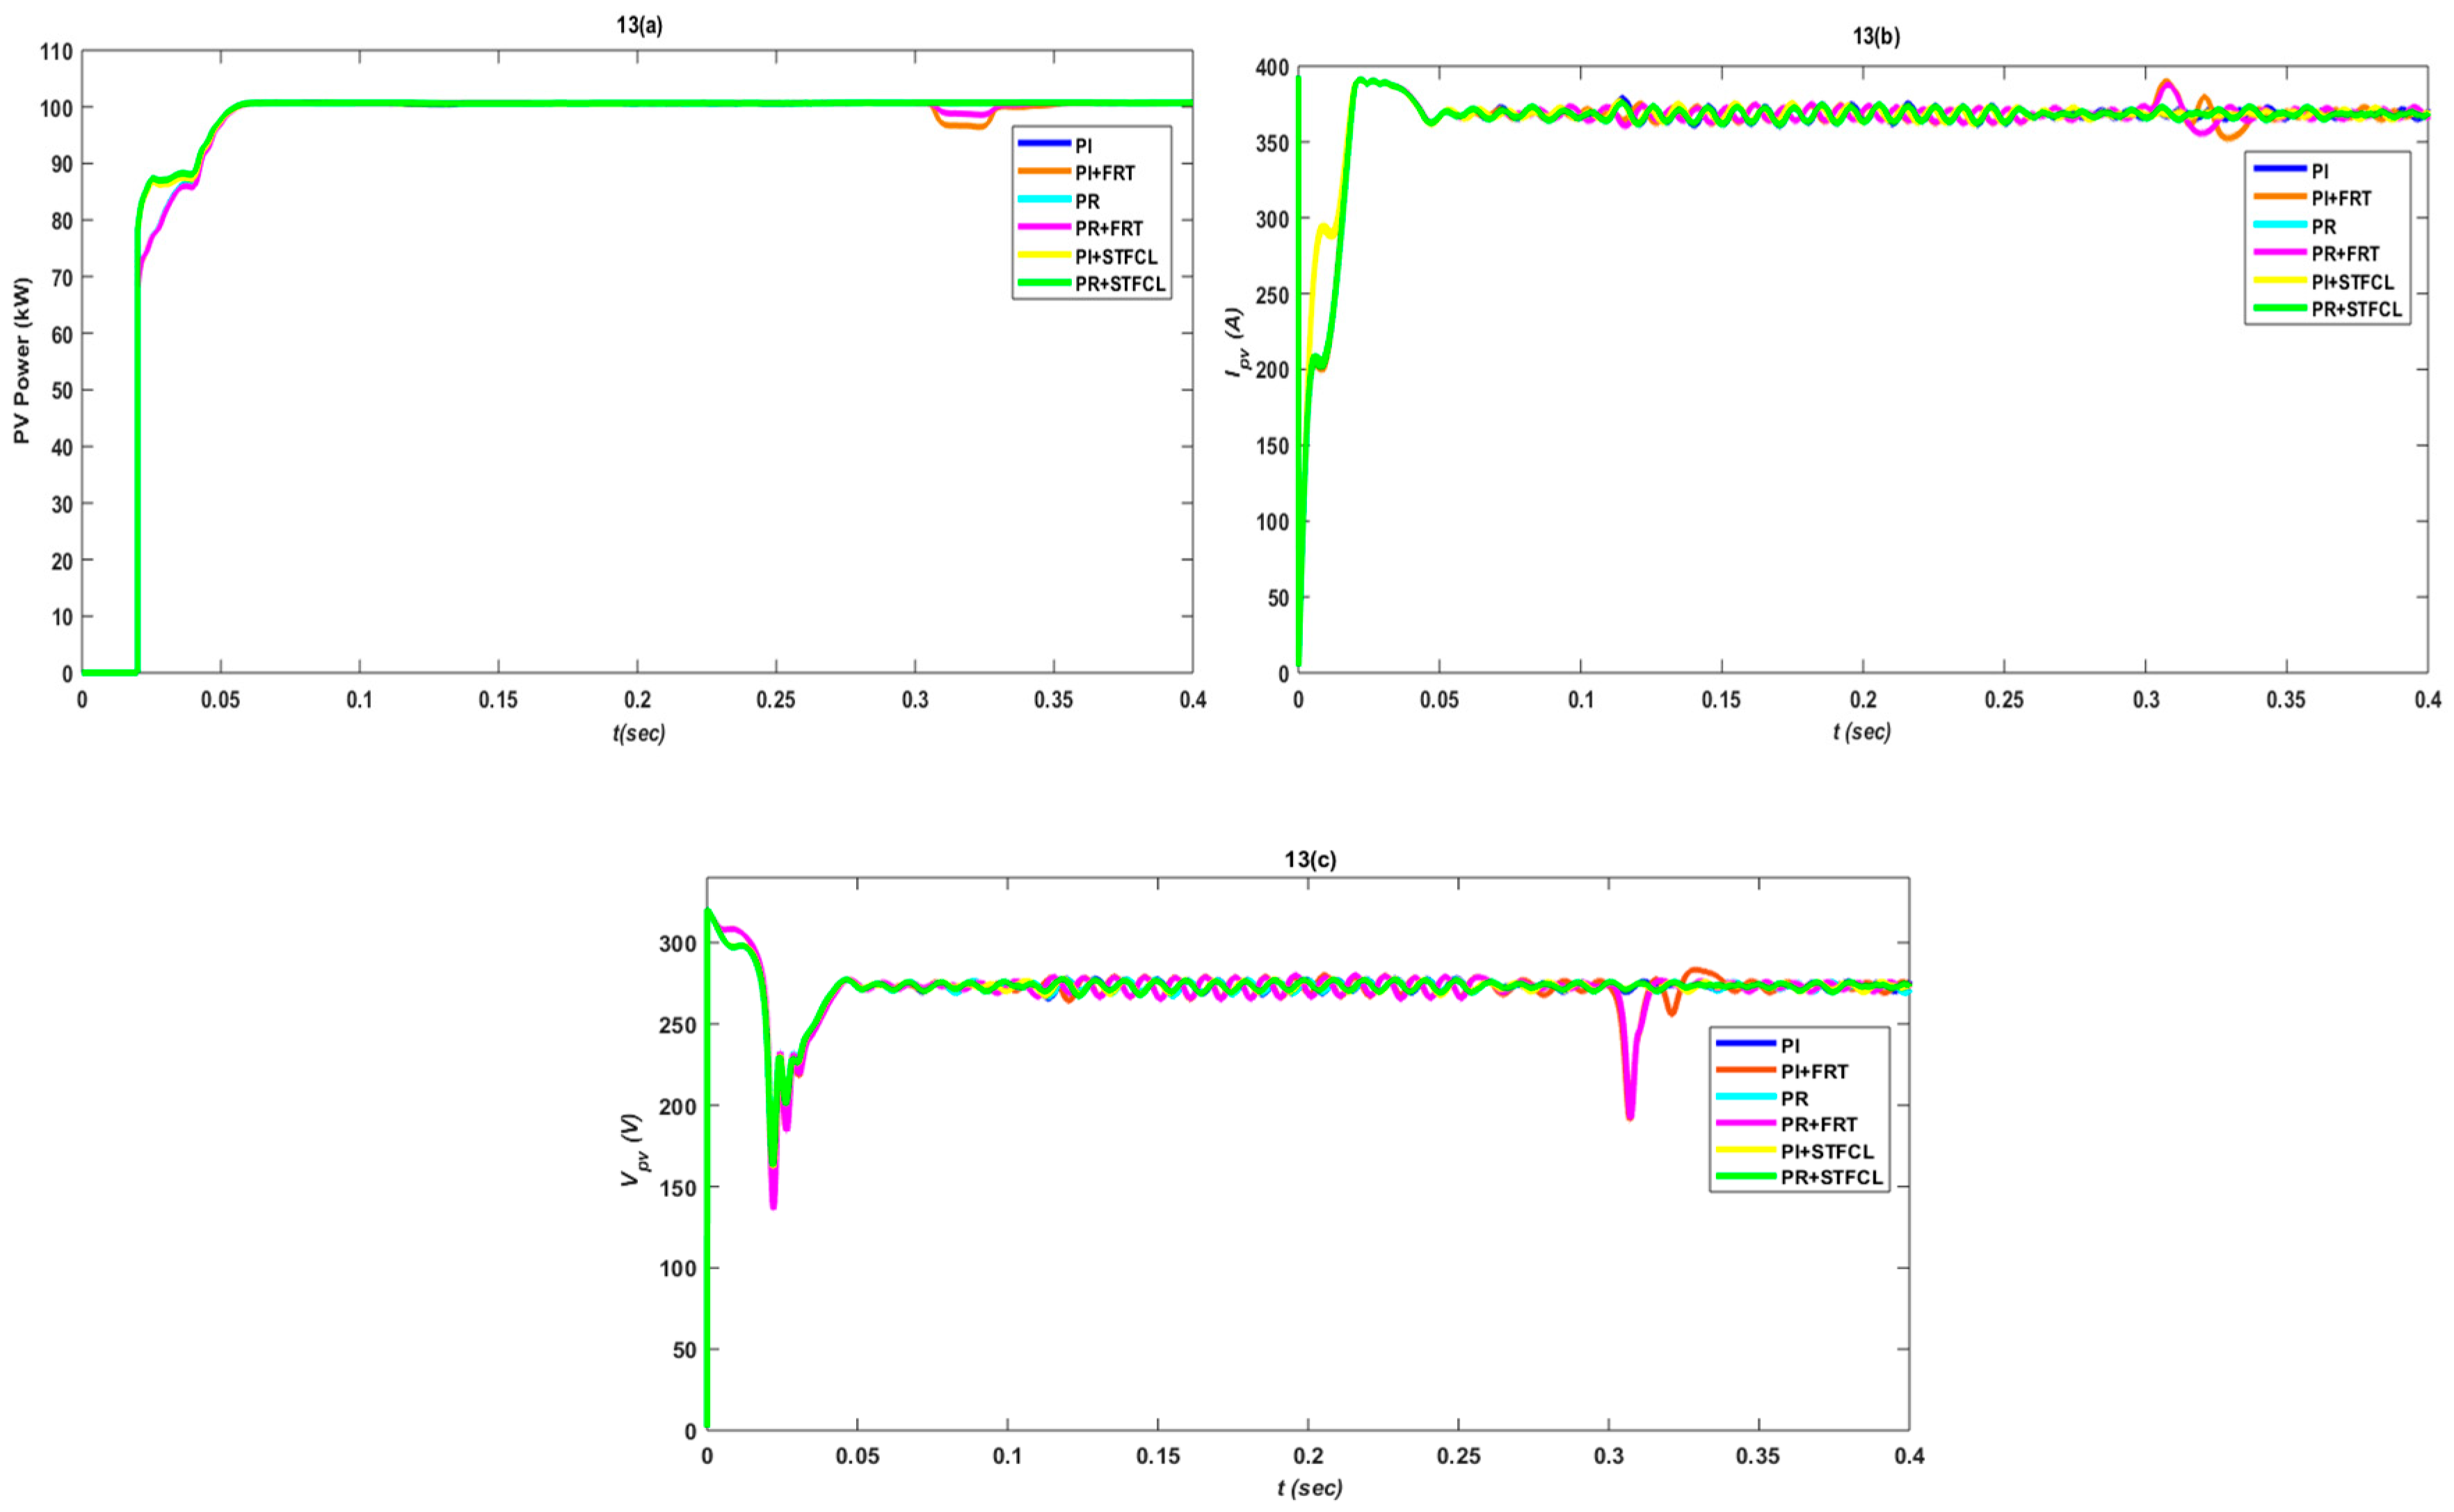
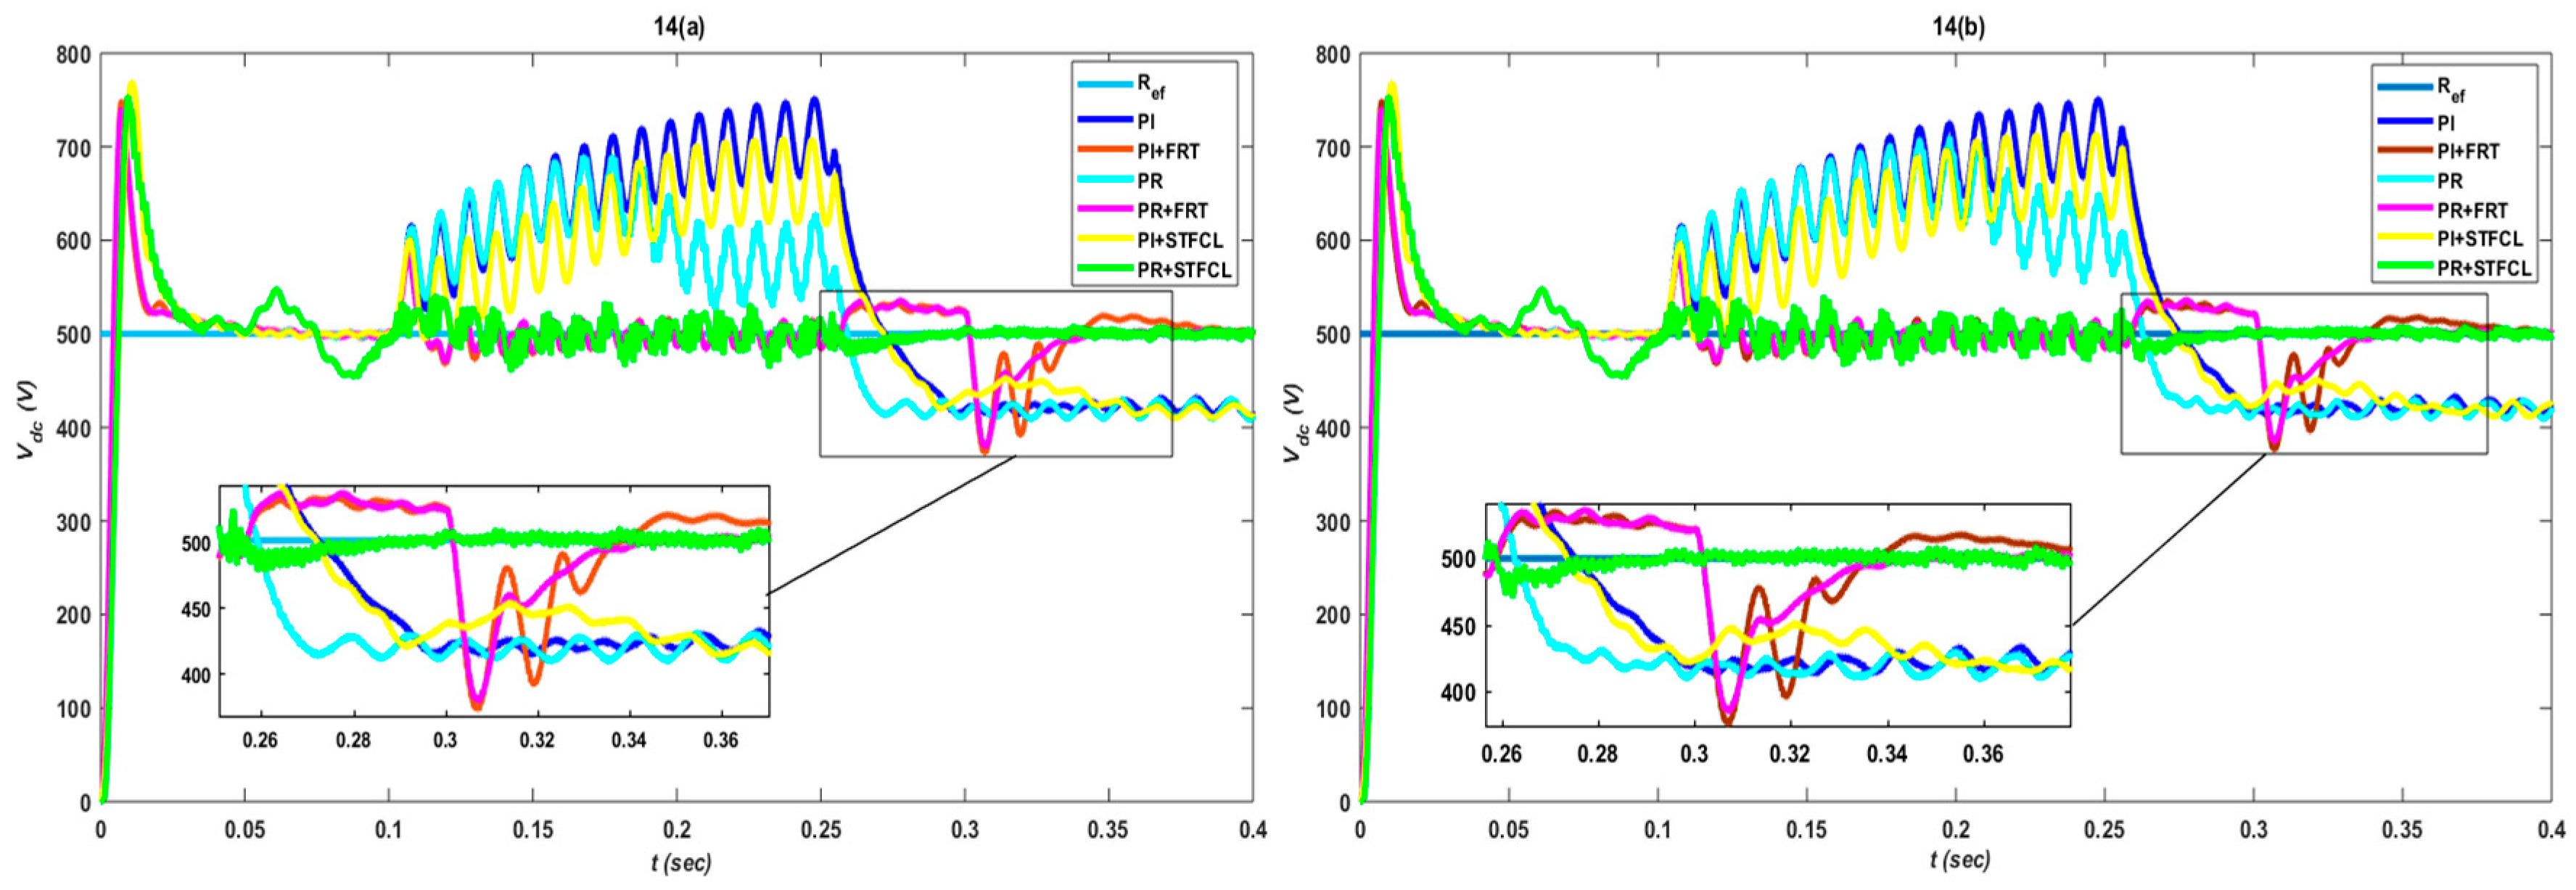
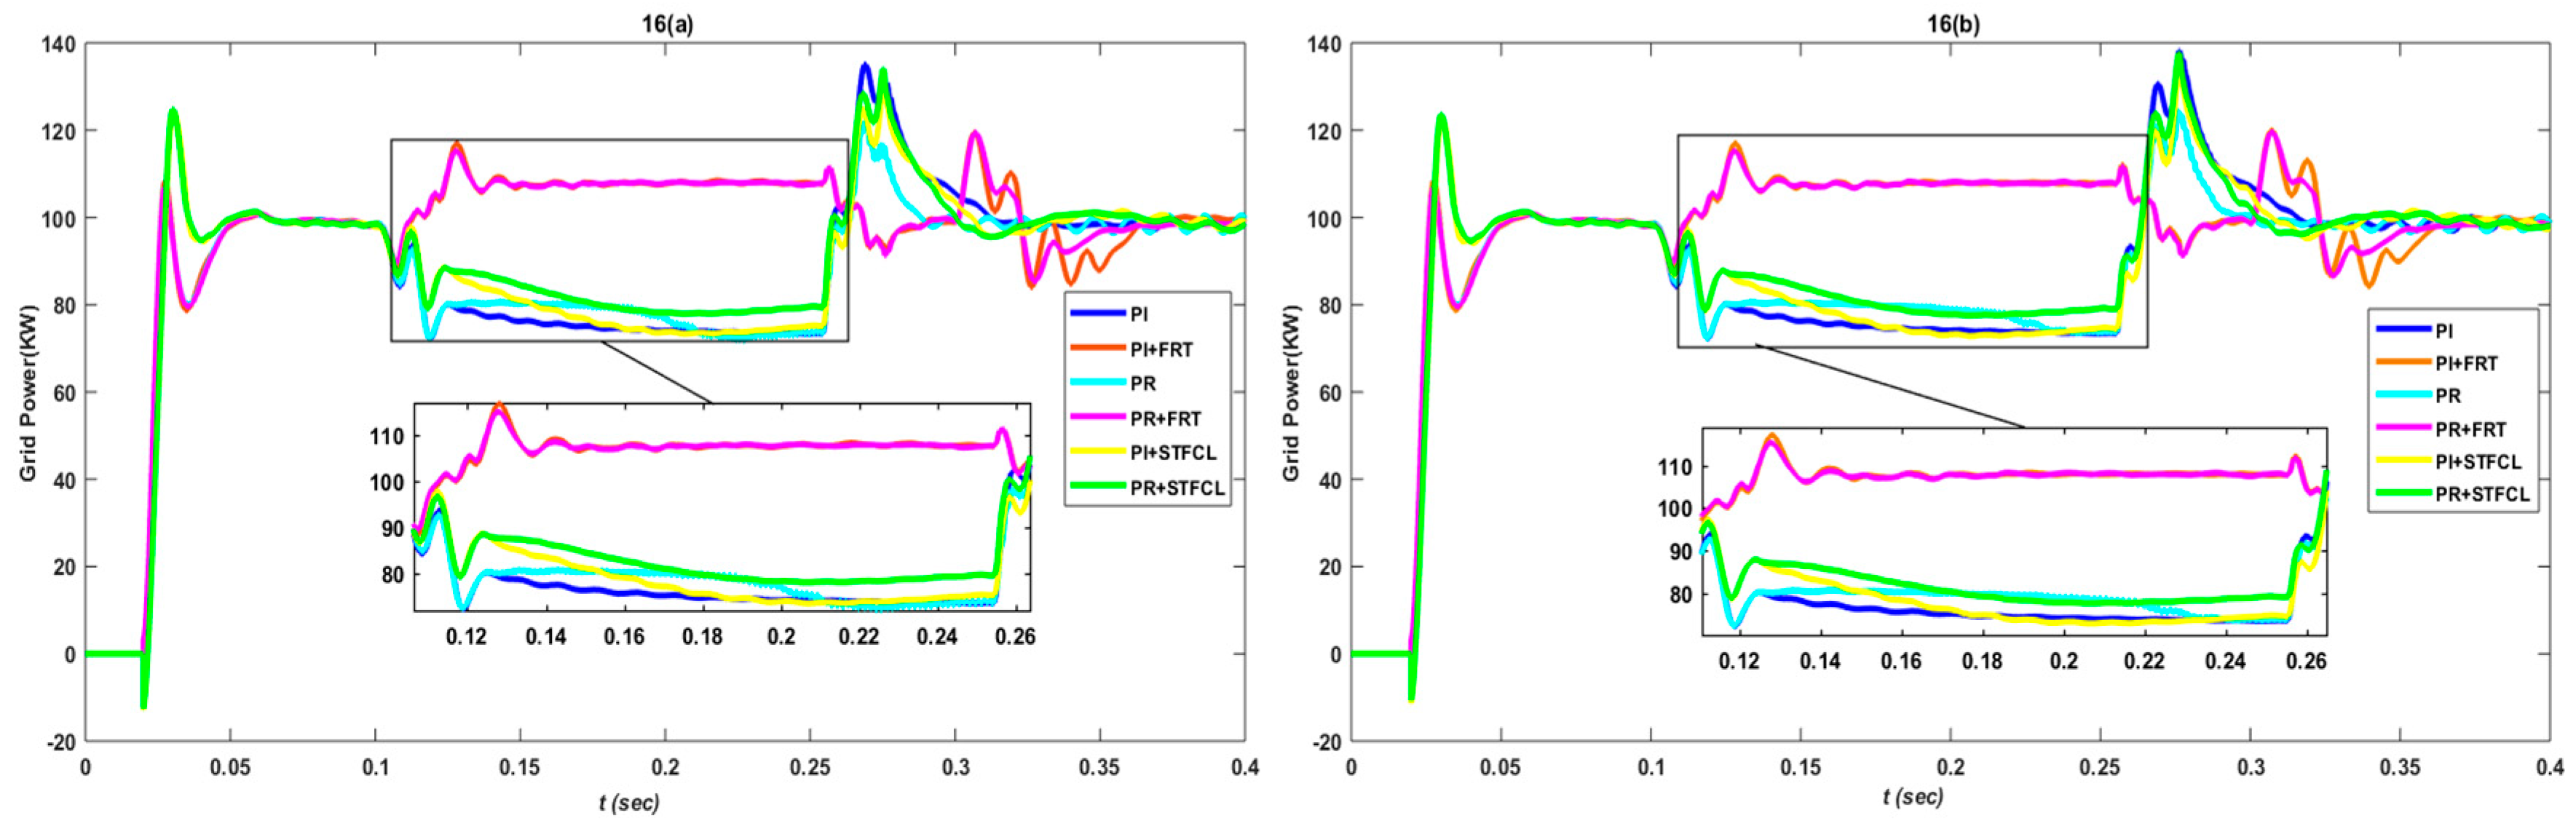
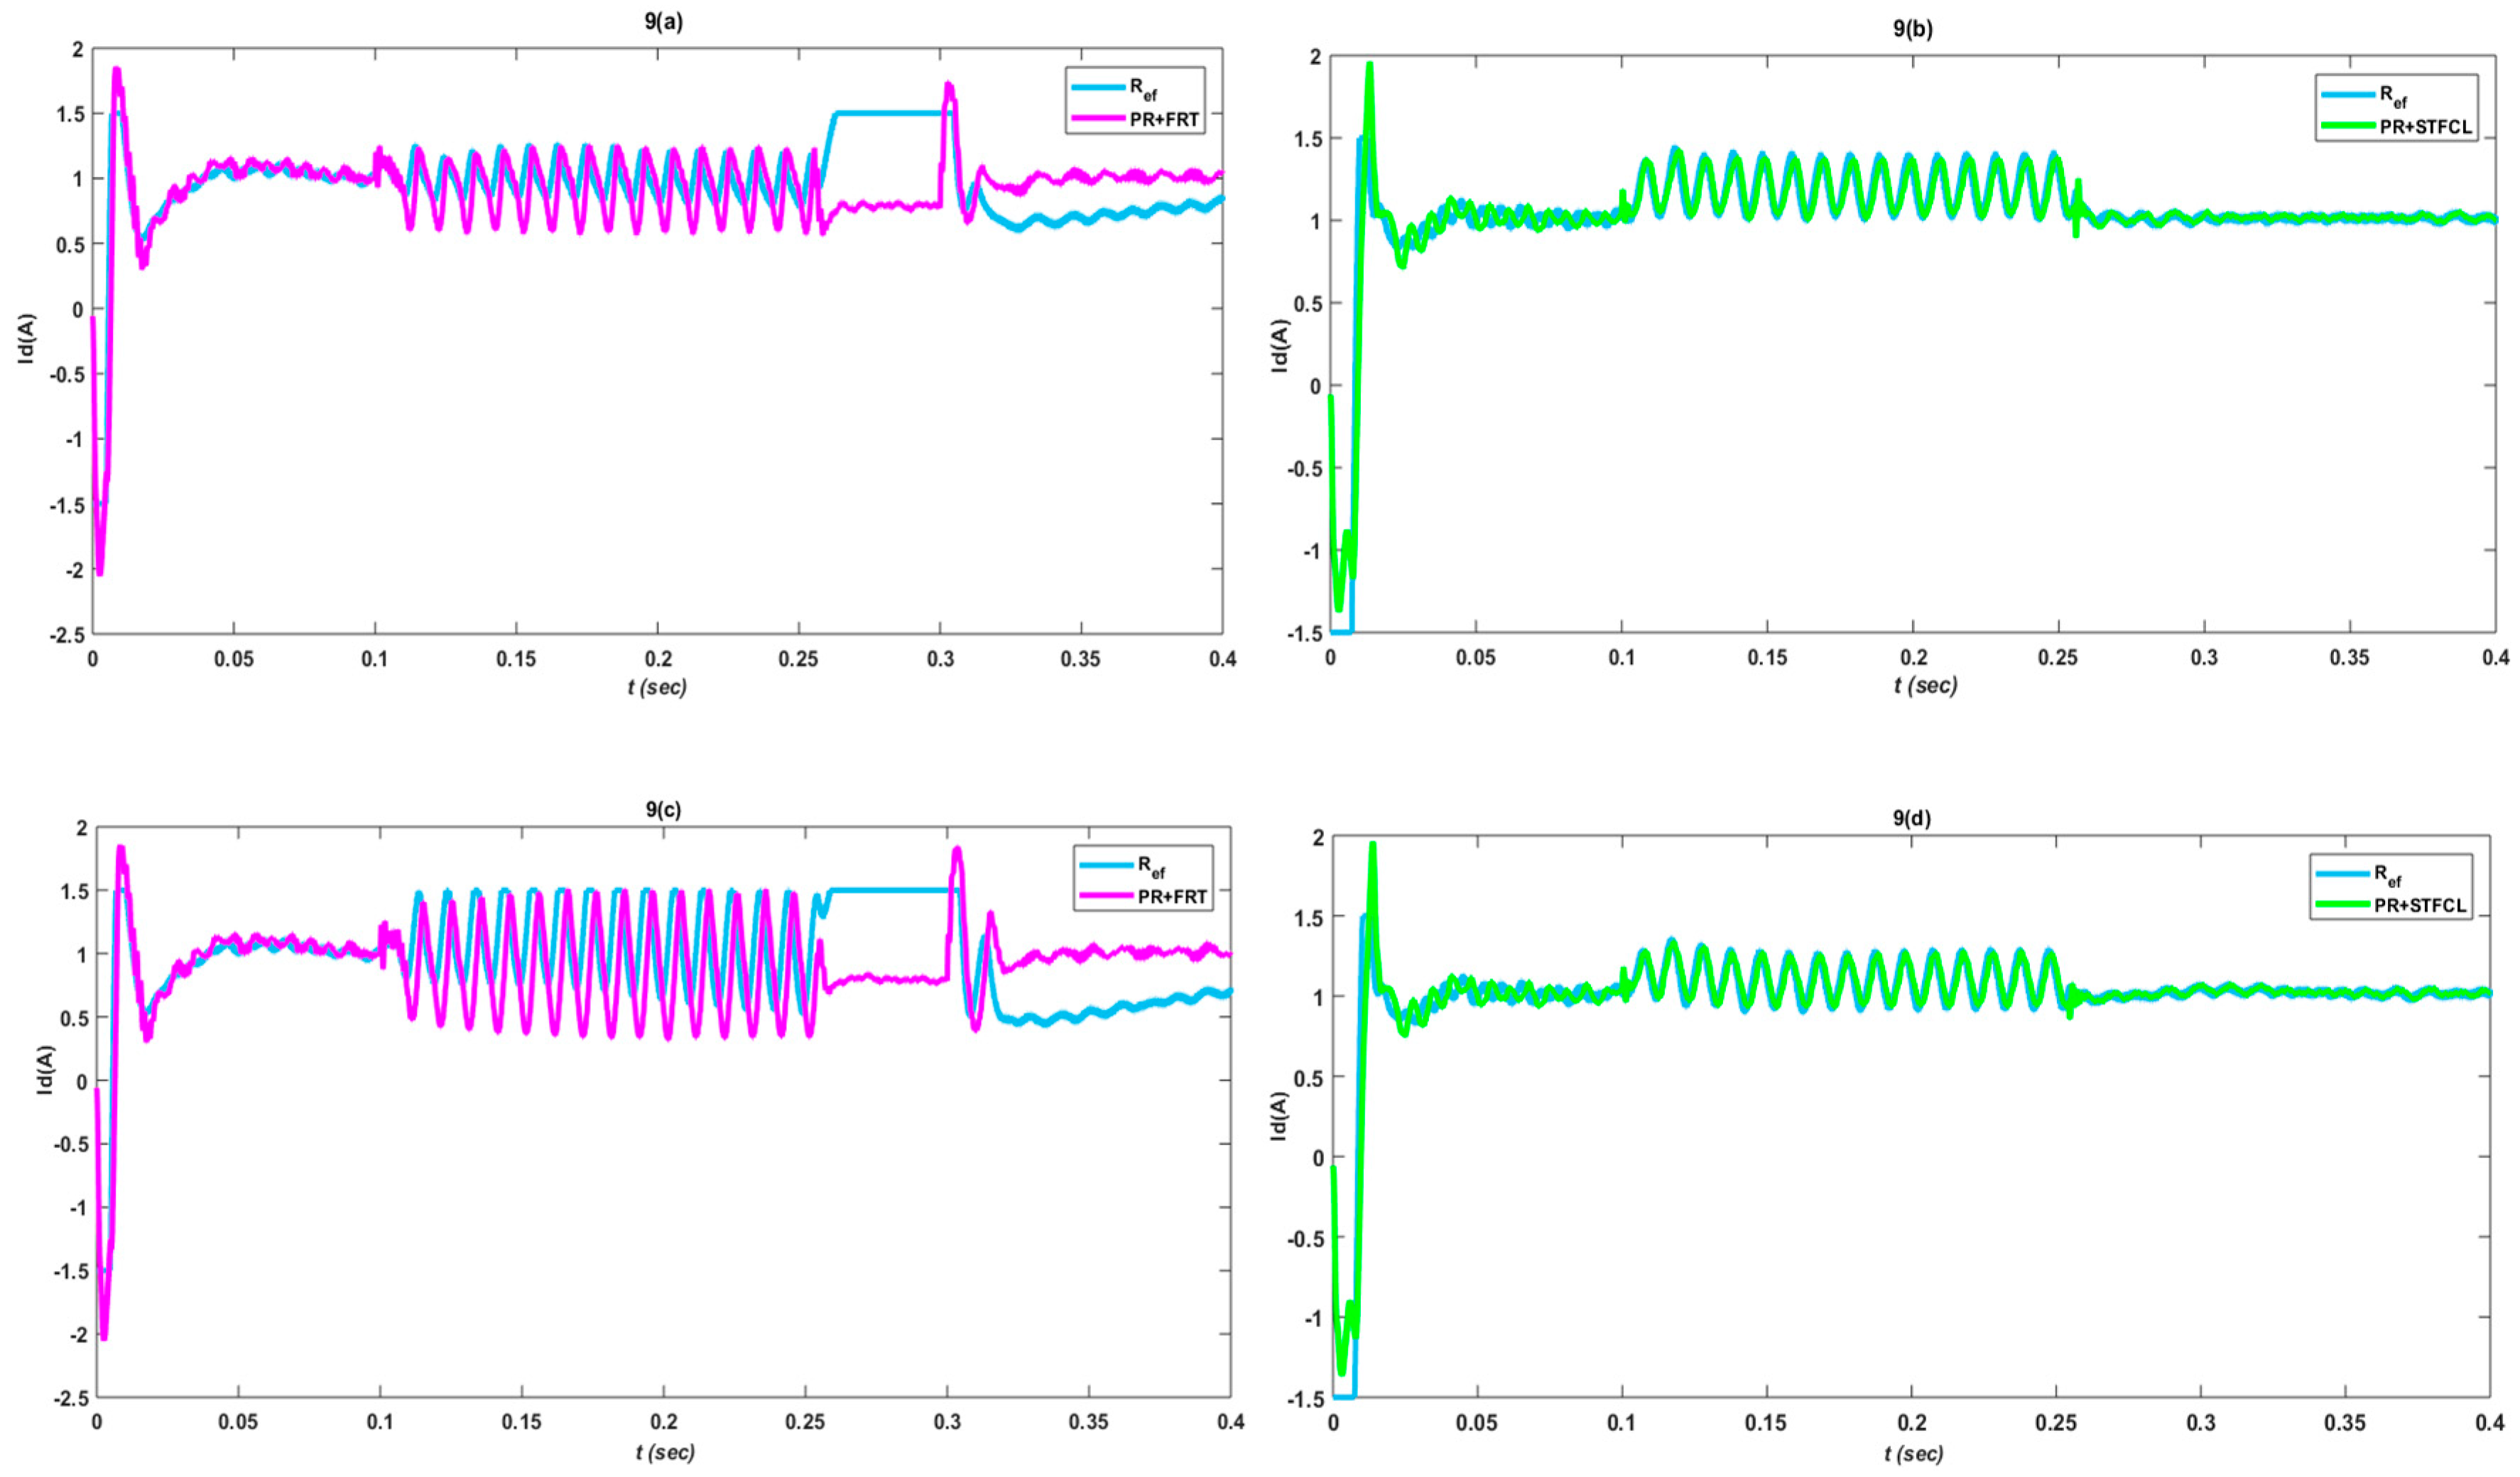
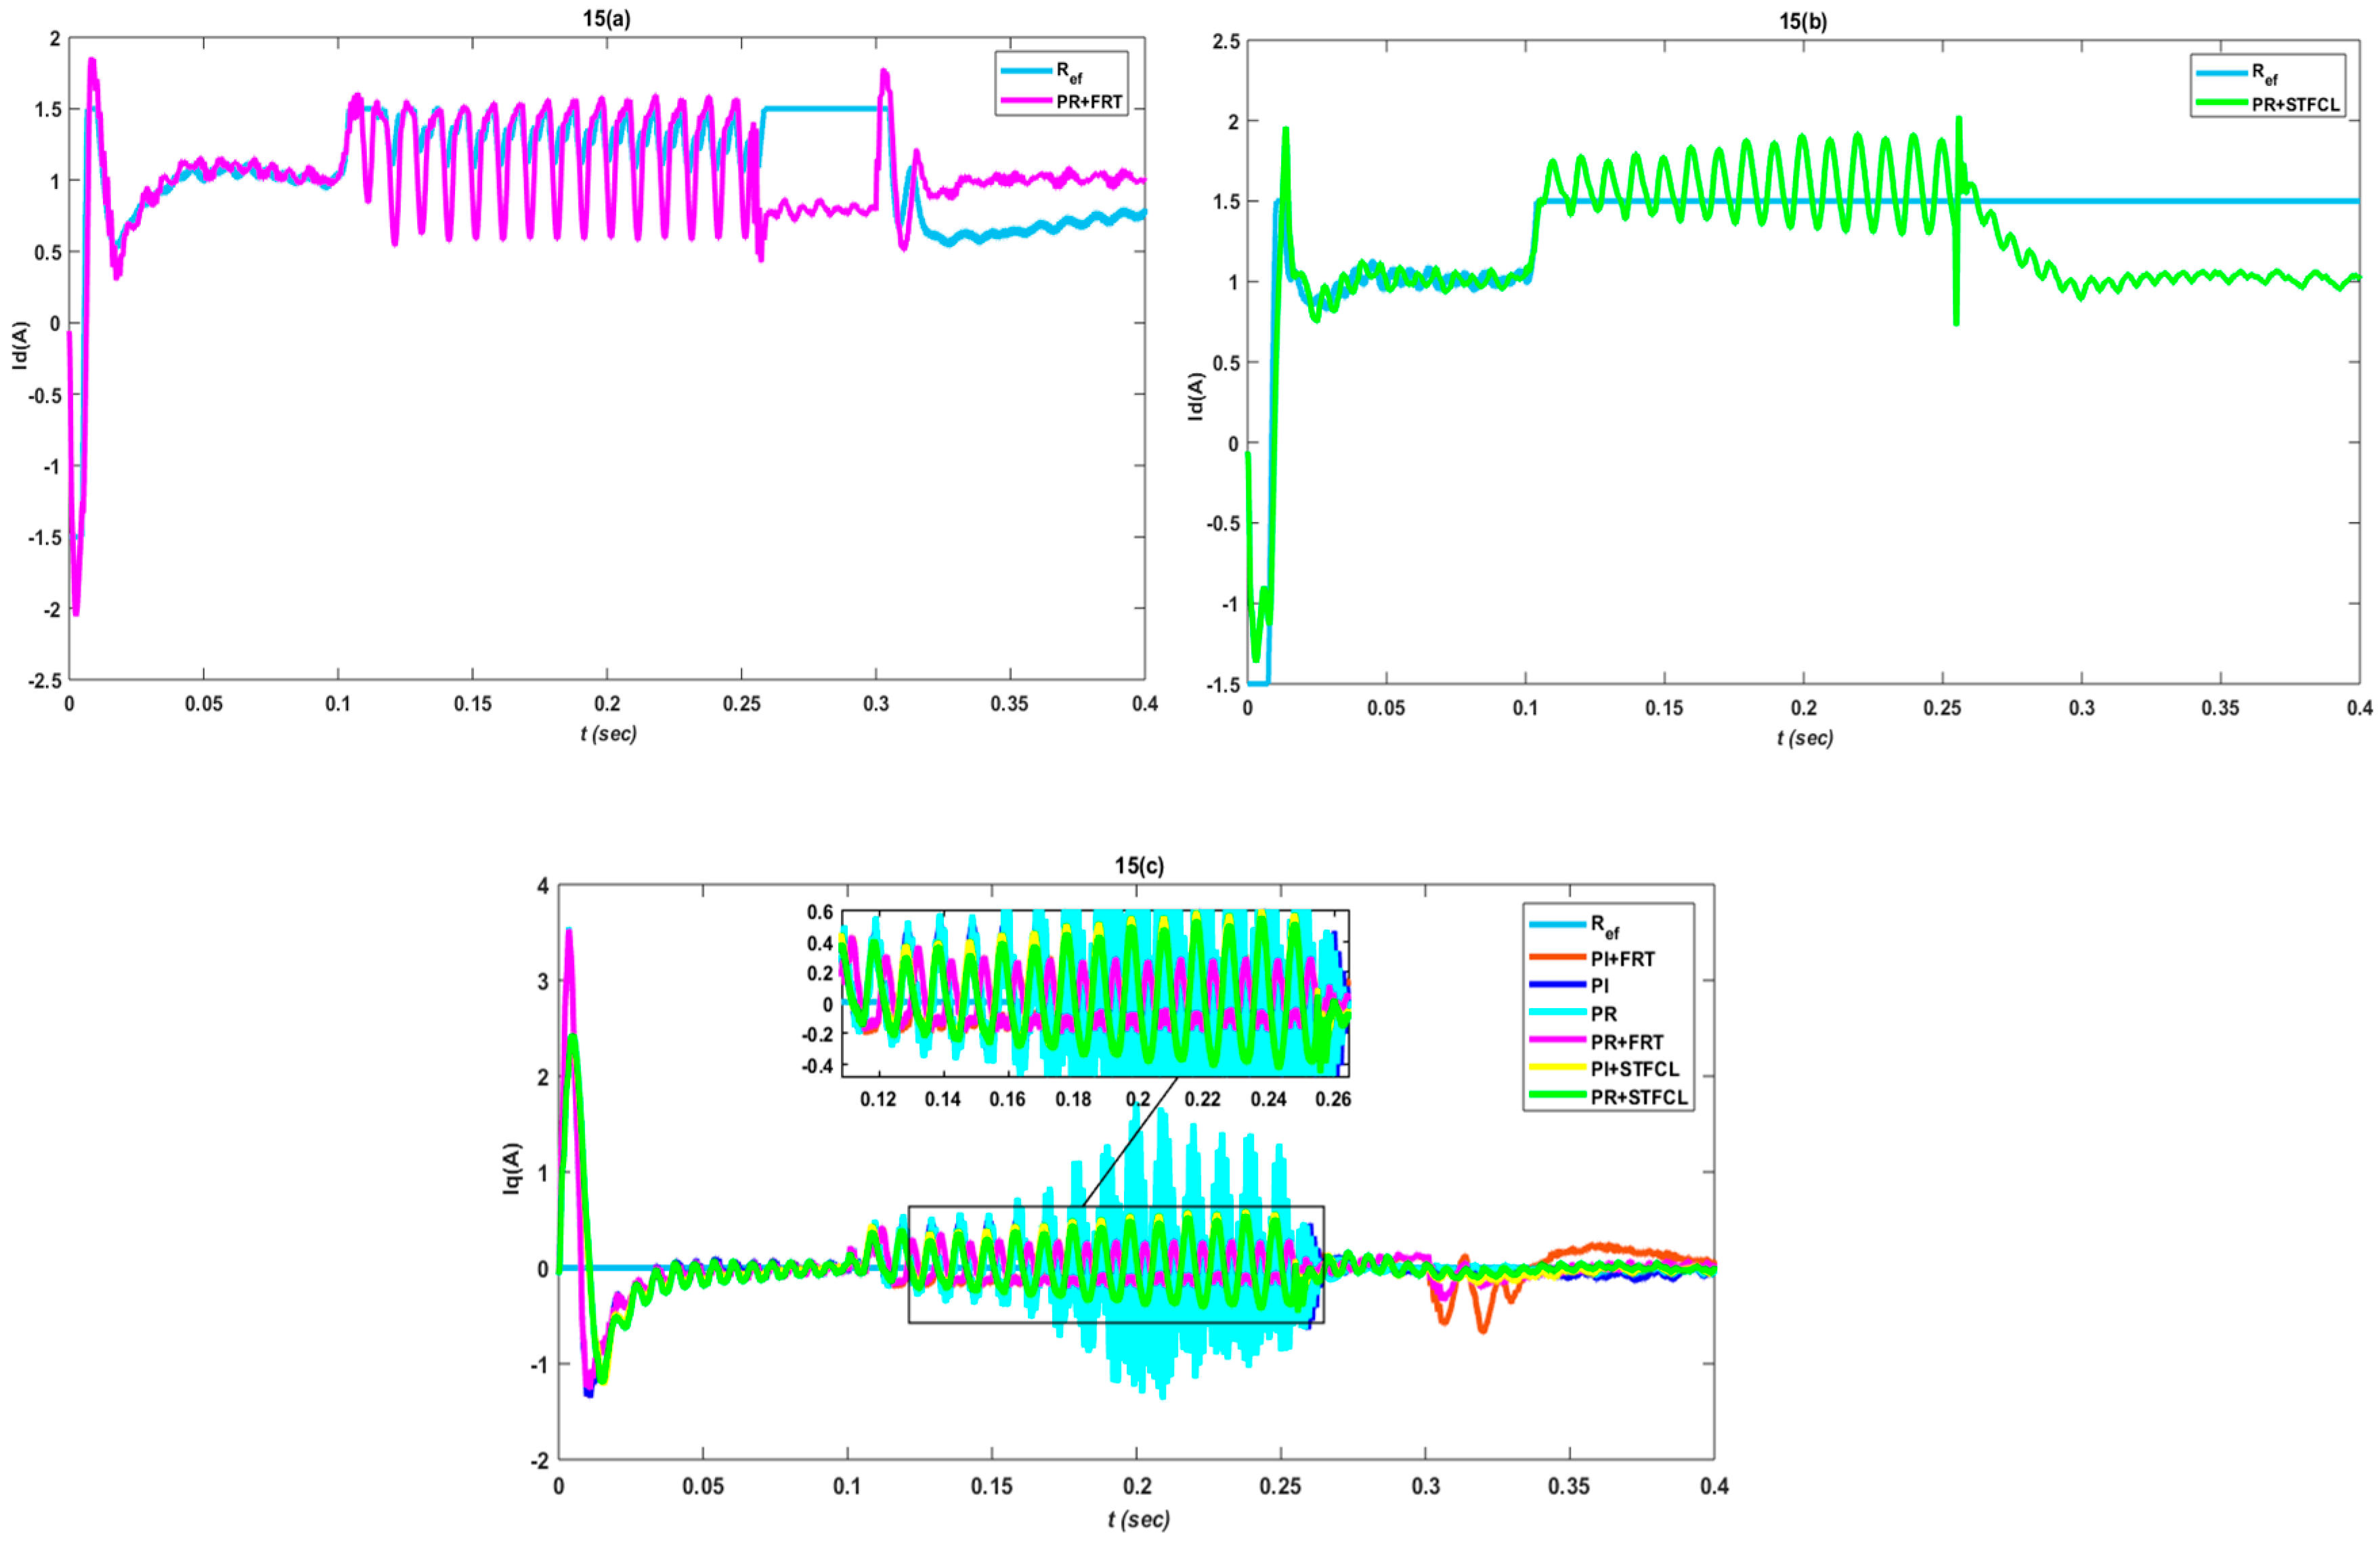
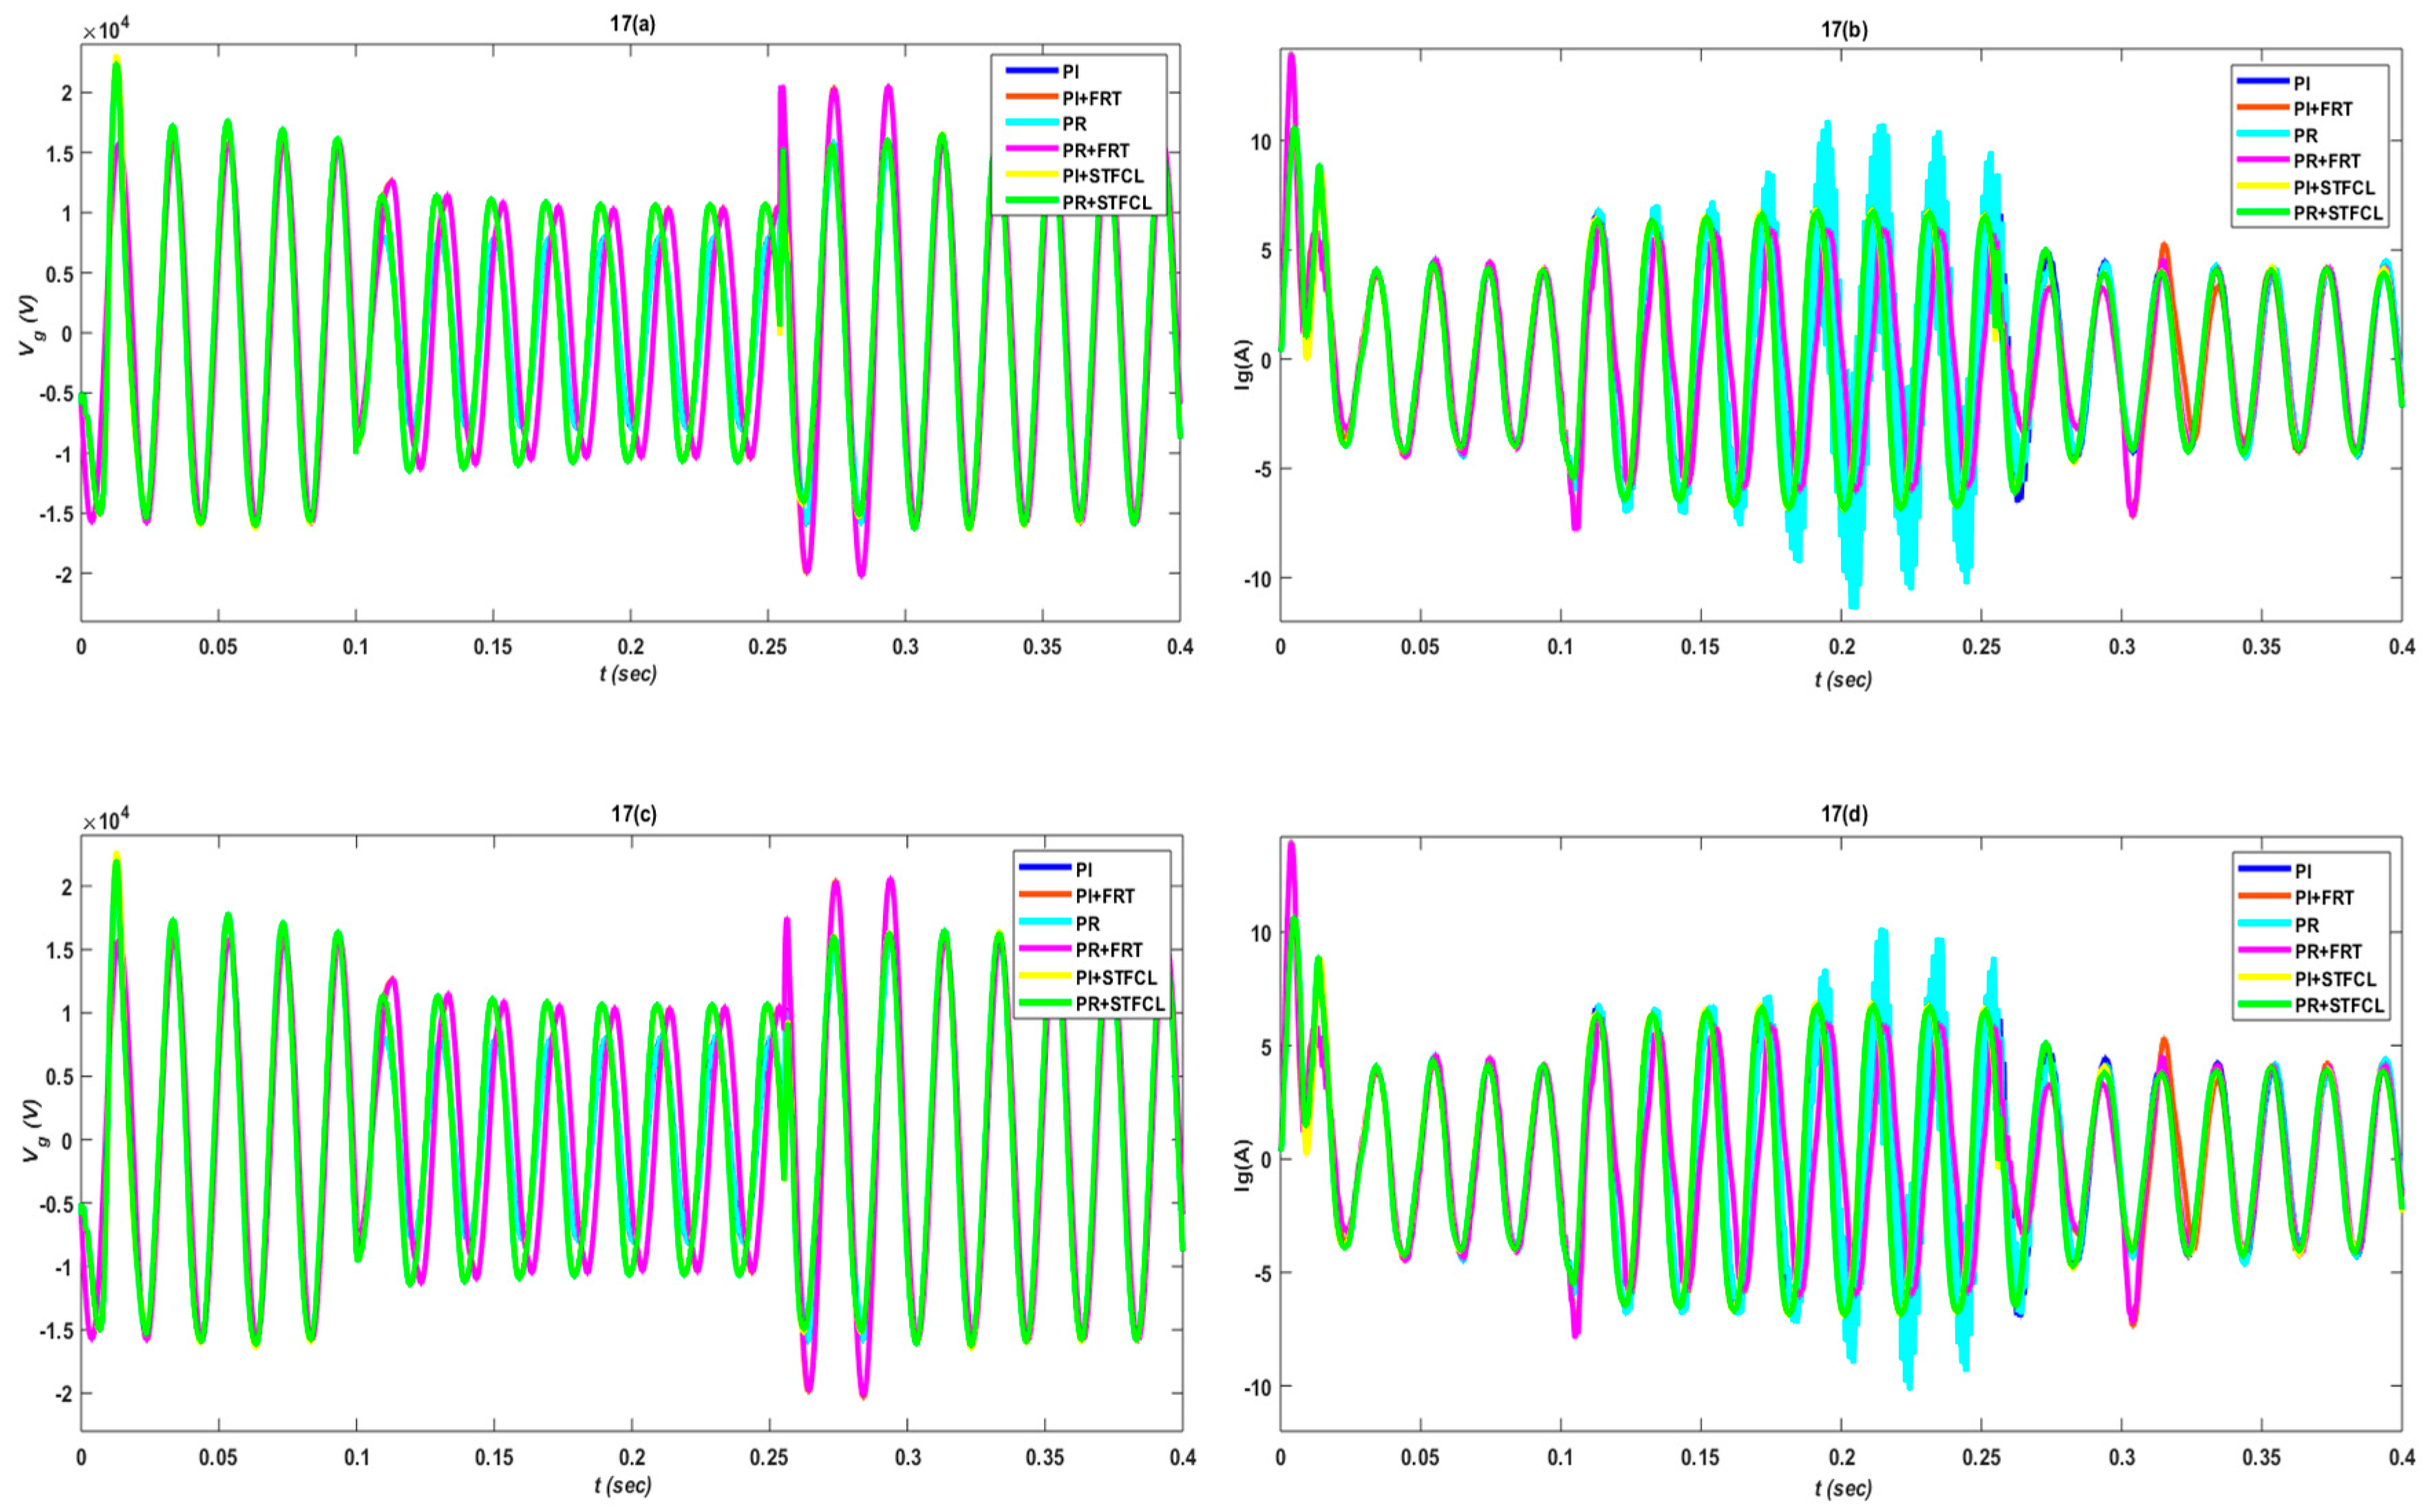
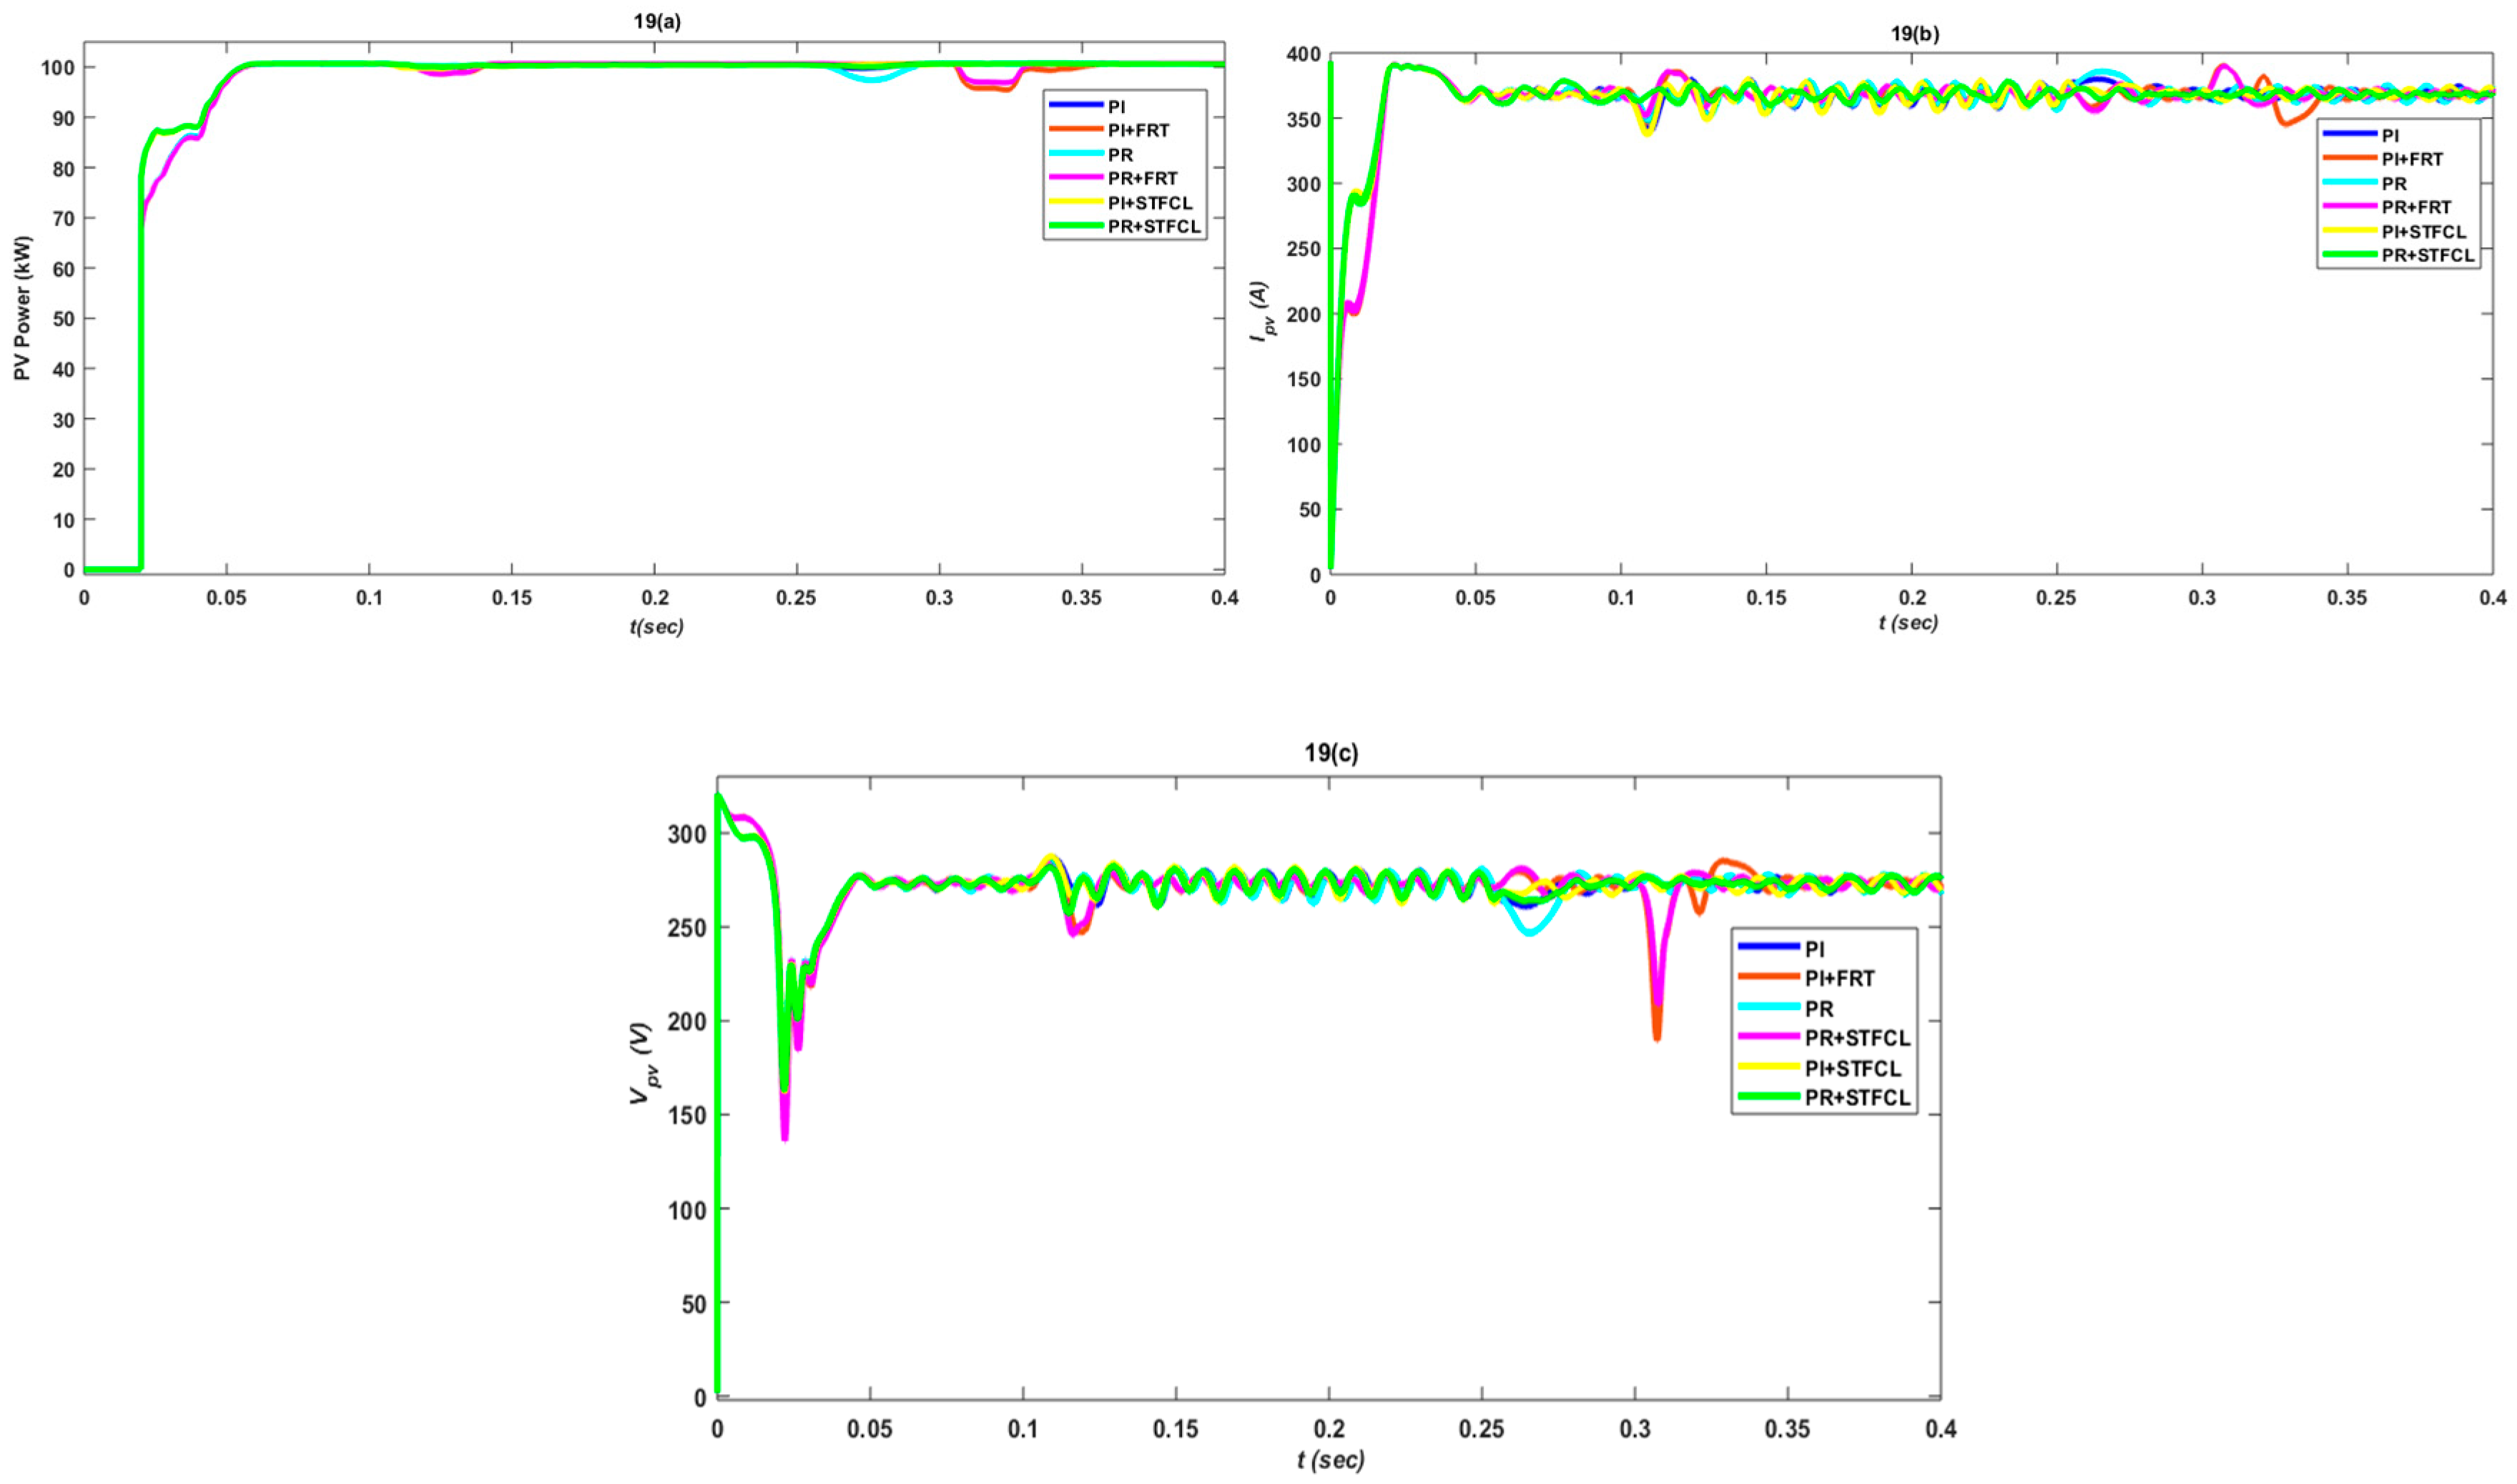
3.1. Single-Phase to Ground Fault
3.2. Phase-to-Phase Fault
4. Conclusions
Author Contributions
Acknowledgments
Conflicts of Interest
Appendix A

| Parameters | Values |
|---|---|
| Rated PV Power | 100.7 kW |
| PV Line Voltage | 275 V (L-L, rms) |
| Phases | 3 |
| Full Load PV current | 365 A |
| System Frequency | 50 Hz |
| Boost converter Frequency | 5 kHz |
| VDC | 500 V |
| Grid voltage | 20 KV |
| Inductor-capacitor-Indictor (LCL) filter (Lg, Li, Cf) | 250 × 10−6 H, 150 × 10−6 H, 22.4 × 10⁻⁶ F |
| Input sun irradiance | 1000 (W/m2) |
| Input temperature | 25 °C |
| MPPT algorithm | Incremental conductance |
| Full load Grid current | 2.94 A |
| Inverter Frequency | 2 kHz |
| Control Schemes | Parameters | VDC | Id | Iq |
|---|---|---|---|---|
| PI | 7 | 0.3 | 0.3 | |
| 800 | 20 | 20 | ||
| PR + RHC | 7 | 0.5 | 0.31 | |
| 800 | 5 | 20 | ||
| 3rd harmonics compensation | 12 | 12 | 12 | |
| 5th harmonics compensation | 8 | 8 | 8 | |
| 7th harmonics compensation | 2 | 2 | 2 |
| FRT Strategies | Parameters | Value/Type |
|---|---|---|
| Crowbar | 1500 Ω | |
| STFCL | ||
| 1800 Ω | ||
| 5000 × 10−6 F | ||
| 400 Ω | ||
| 36 × 10−3 F |
References
- Willisand, H.L.; Scott, W.G. Distributed Power Generation: Planning and Evaluation; Marcel-Dekker: New York, NY, USA, 2000. [Google Scholar]
- PVPS Report—A Snapshot of Global PV—1992-2012, Preliminary information from the IEA PVPS Programme; Report IEA-PVPS T1-22:201; IEA PVPS Programme: Ursen, Switzerland, 2012.
- EPIA. Global Market Outlook for Photovoltaics 2013–2017; EPIA: Belgium, European Kingdom, 2013. [Google Scholar]
- REN21 Renewables 2014: Global Status Report. 2014, pp. 15–16. Available online: http://www.webcitation.org/6SKF06GAX (accessed on 16 October 2018).
- Iov, F.; Hansen, A.D.; Sørensen, P.E.; Cutululis, N.A. Mapping of Grid Faults and Grid Codes; Tech. Rep., Risø National Laboratory; Technical University of Denmark: Lyngby, Denmark, 2007. [Google Scholar]
- E. ON GmbH. Grid Code—High and Extra High Voltage. Available online: http://www.eon-netz.com/ (accessed on 24 October 2018).
- Braun, M.; Arnold, G.; Laukamp, H. Plugging into the Zeitgeist. IEEE Power Energy Mag. 2009, 7, 63–76. [Google Scholar] [CrossRef]
- Comitato Elettrotecnico Italiano. CEI0-21: Reference Technical Rules for Connecting Users to the Active and Passive LV Distribution Companies of Electricity. Available online: http://www.ceiweb.it/ (accessed on 28 September 2018).
- Altin, M.; Goksu, O.; Teodorescu, R.; Rodriguez, P.; Jensen, B.B.; Helle, L. Overview of recent grid codes for wind power integration. In Proceedings of the 2010 12th International Conference on Optimization of Electrical and Electronic Equipment, Basov, Romania, 20–22 May 2010; pp. 1152–1160. [Google Scholar]
- Beach, T.; Kozinda, A.; Rao, V. Advanced Inverters for Distributed PV: Latent Opportunities for Localized Reactive Power Compensation; Cal x Clean Coalition Energy C226; Cal x Clean Coalition: Menlo Park, CA, USA, 2013. [Google Scholar]
- Ding, G.; Gao, F.; Tian, H.; Ma, C.; Chen, M.; He, G.; Liu, Y. Adaptive dc-link voltage control of two-stage photovoltaic inverter during low voltage ride-through operation. IEEE Trans. Power Electron. 2016, 31, 4182–4194. [Google Scholar] [CrossRef]
- Stetz, T.; Marten, F.; Braun, M. Improved low voltage grid-integration of photovoltaic systems in Germany. IEEE Trans. Sustain. Energy 2013, 4, 534–542. [Google Scholar] [CrossRef]
- Tsili, M.; Papathanassiou, S. A review of grid code technical requirements for wind farms. IET Renew. Power Gener. 2009, 3, 308–332. [Google Scholar] [CrossRef]
- Lin, W.M.; Hong, C.M. A new Elman neural network-based control algorithm for adjustable-pitch variable-speed wind-energy conversion systems. IEEE Trans. Power Electron. 2011, 26, 473–481. [Google Scholar] [CrossRef]
- Gaing, Z.L. Wavelet-based neural network for power disturbance recognition and classification. IEEE Trans. Power 2004, 19, 1560–1568. [Google Scholar] [CrossRef]
- Rodriguez, P.; Timbus, A.V.; Teodorescu, R.; Liserre, M.; Blaabjerg, F. Flexible active power control of distributed power generation systems during grid faults. IEEE Trans. Ind. Electron. 2007, 54, 2583–2592. [Google Scholar] [CrossRef]
- Teodorescu, R.; Liserre, M.; Rodriguez, P. Grid Converters for Photovoltaic and Wind Power Systems; Wiley: Hoboken, NJ, USA, 2011; Volume 29. [Google Scholar]
- Camacho, A.; Castilla, M.; Miret, J.; Borrell, A.; de Vicuna, L.G. Active and reactive power strategies with peak current limitation for distributed generation inverters during unbalanced grid faults. IEEE Trans. Ind. Electron. 2015, 62, 1515–1525. [Google Scholar] [CrossRef]
- Uddin, W.; Zeb, K.; Khan, B.; Ali, S.M.; Mehmood, C.A.; Haider, A. Control of DC link voltage for grid interfaced DFIG using Adaptive Sliding Mode & Fuzzy based on Levenberg-Marquardt algorithm during symmetrical fault. In Proceedings of the 2016 International Conference on Computing, Electronic and Electrical Engineering (ICE Cube), Quetta, Pakistan, 11–12 April 2016; pp. 1–6. [Google Scholar]
- Liu, Z.; Li, H.X. A probabilistic fuzzy logic system for modeling and control. IEEE Trans. Fuzzy Syst. 2005, 13, 848–859. [Google Scholar]
- Cardenas, R.; Pena, R.; Alepuz, S.; Asher, G. Overview of control system for the operation of DFIGs in wind energy application. IEEE Trans. Ind. Electron. 2013, 60, 2776–2798. [Google Scholar] [CrossRef]
- Li, H.X.; Liu, Z. A probabilistic neural-fuzzy learning system for stochastic modeling. IEEE Trans. Fuzzy Syst. 2008, 16, 898–908. [Google Scholar] [CrossRef]
- Zeb, K.; Khan, I.; Uddin, W. A Review on Recent Advances and Future Trends of Transformerless Inverter Structures for Single-Phase Grid-Connected Photovoltaic Systems. Energies 2018, 11, 1968. [Google Scholar] [CrossRef]
- Massawe, H.B. Grid Connected Photovoltaic Systems with SmartGrid functionality. Master’s Thesis, Dept. ElKraft, NTNU, Trondheim, Norway, 2013. [Google Scholar]
- Makhlouf, M.; Messai, F.; Benalla, H. Modeling and control of a single-phase grid connected photovoltaic system. J. Theor. Appl. Inf. Technol. 2012, 37, 289–296. [Google Scholar]
- Available online: www.mathworks.com (accessed on 12 September 2018).
- Banu, I.V.; Istrate, M. Modeling of maximum power point tracking algorithm for PV systems. In Proceedings of the 2012 International Conference and Exposition on Electrical and Power Engineering (EPE), Iasi, Romania, 25–27 October 2012; pp. 953–957. [Google Scholar]
- Kazmierkowski, M.; Krishnan, R.; Blaabjerg, F. Control in Power Electronics—Selected Problems; Academic: New York, NY, USA, 2002. [Google Scholar]
- Yuan, X.; Merk, W.; Stemmler, H.; Allmeling, J. StationaryFrame Generalized Integrators for Current Control of Active Power Filters with Zero Steady-State Error for Current Harmonics of Concern under Unbalanced and Distorted Operating Conditions. IEEE Trans. Ind. App. 2002, 38, 523–532. [Google Scholar] [CrossRef]
- Daniel, Z.; Cyril, S.S. Design of PR current control with selective harmonic compensators using MATLAB. J. Electr. Syst. Inf. Technol. 2017, 4, 347–358. [Google Scholar]
- Zeb, K.; Uddin, W.; Khan, M.A. A Comprehensive Review on Inverter Topologies and Control Strategies for Grid Connected Photovoltaic System; Elsevier: Amsterdam, The Netherlands, 2018; Volume 94, pp. 1120–1141. [Google Scholar]
- Uddin, W.; Zeb, K.; Tanoli, A.; Haider, A. Hardware-based hybrid scheme to improve the fault ride through capability of doubly fed induction generator under symmetrical and asymmetrical fault. IET Gener. Transm. Distrib. 2018, 12, 200–206. [Google Scholar] [CrossRef]


| Control Strategies | Single-Phase | Two-Phase | ||||
|---|---|---|---|---|---|---|
| IAE | ISE | ITAE | IAE | ISE | ITAE | |
| PI | a. 0.0111 | a. 0.0033 | a. 0.0009 | a. 0.0754 | a. 0.0233 | a. 0.0160 |
| PI + FRT | a. 0.0158 | a. 0.0038 | a. 0.0025 | a. 0.0175 | a. 0.0041 | a. 0.0028 |
| PR | a. 0.0106 | a. 0.0032 | a. 0.0008 | a. 0.0612 | a. 0.0145 | a. 0.0130 |
| PR + FRT | a. 0.0143 | a. 0.0036 | a. 0.0020 | a. 0.0157 | a. 0.0039 | a. 0.0023 |
| PI + STFCL | a. 0.0126 | a. 0.0048 | a. 0.0007 | a. 0.0629 | a. 0.0171 | a. 0.0132 |
| PR + STFCL | a. 0.0122 | a. 0.0047 | a. 0.0006 | a. 0.0188 | a. 0.0065 | a. 0.0188 |
| Control Strategies | Single-Phase | Two-Phase | ||||
|---|---|---|---|---|---|---|
| IAE | ISE | ITAE | IAE | ISE | ITAE | |
| PI | a. 0.0357 | a. 0.0096 | a. 0.0051 | a. 0.1164 | a. 0.0500 | a.0.0290 |
| PI + FRT | a. 0.1107 | a. 0.0633 | a. 0.0269 | a. 0.1204 | a. 0.0755 | a.0.0296 |
| PR | a. 0.0273 | a. 0.0061 | a. 0.0041 | a. 0.1424 | a. 0.0833 | a.0.0354 |
| PR + FRT | a. 0.0935 | a. 0.0405 | a. 0.0228 | a. 0.1030 | a. 0.0496 | a.0.0257 |
| PI + STFCL | a. 0.0338 | a. 0.0110 | a. 0.0042 | a. 0.1114 | a. 0.0486 | a.0.0278 |
| PR + STFCL | a. 0.0258 | a. 0.0071 | a. 0.0030 | a. 0.1002 | a. 0.0412 | a.0.0257 |
| Control Strategies | Single-Phase | Two-Phase | ||||
|---|---|---|---|---|---|---|
| IAE | ISE | ITAE | IAE | ISE | ITAE | |
| PI | a. 0.0426 | a. 0.0513 | a. 0.0028 | a. 0.0834 | a. 0.0672 | a. 0.0113 |
| PI + FRT | a. 0.0655 | a. 0.0574 | a. 0.0096 | a. 0.0746 | a. 0.0601 | a. 0.0113 |
| PR | a. 0.0426 | a. 0.0516 | a.0.0027 | a. 0.0997 | a. 0.0931 | a. 0.0142 |
| PR + FRT | a. 0.0531 | a. 0.0531 | a. 0.0053 | a. 0.0626 | a. 0.0557 | a. 0.0070 |
| PI + STFCL | a. 0.0371 | a. 0.0368 | a. 0.0021 | a. 0.0747 | a. 0.0490 | a. 0.0099 |
| PR + STFCL | a. 0.0391 | a. 0.0392 | a. 0.0019 | a. 0.0734 | a. 0.0495 | a. 0.0089 |
© 2018 by the authors. Licensee MDPI, Basel, Switzerland. This article is an open access article distributed under the terms and conditions of the Creative Commons Attribution (CC BY) license (http://creativecommons.org/licenses/by/4.0/).
Share and Cite
Islam, S.U.; Zeb, K.; Din, W.U.; Khan, I.; Ishfaq, M.; Busarello, T.D.C.; Kim, H.J. Design of a Proportional Resonant Controller with Resonant Harmonic Compensator and Fault Ride Trough Strategies for a Grid-Connected Photovoltaic System. Electronics 2018, 7, 451. https://doi.org/10.3390/electronics7120451
Islam SU, Zeb K, Din WU, Khan I, Ishfaq M, Busarello TDC, Kim HJ. Design of a Proportional Resonant Controller with Resonant Harmonic Compensator and Fault Ride Trough Strategies for a Grid-Connected Photovoltaic System. Electronics. 2018; 7(12):451. https://doi.org/10.3390/electronics7120451
Chicago/Turabian StyleIslam, Saif Ul, Kamran Zeb, Waqar Ud Din, Imran Khan, Muhammad Ishfaq, Tiago Davi Curi Busarello, and Hee Je Kim. 2018. "Design of a Proportional Resonant Controller with Resonant Harmonic Compensator and Fault Ride Trough Strategies for a Grid-Connected Photovoltaic System" Electronics 7, no. 12: 451. https://doi.org/10.3390/electronics7120451
APA StyleIslam, S. U., Zeb, K., Din, W. U., Khan, I., Ishfaq, M., Busarello, T. D. C., & Kim, H. J. (2018). Design of a Proportional Resonant Controller with Resonant Harmonic Compensator and Fault Ride Trough Strategies for a Grid-Connected Photovoltaic System. Electronics, 7(12), 451. https://doi.org/10.3390/electronics7120451