Article

Passive Vector Sensing for Non-Cooperative Emitter Localization in Indoor Environments

1
Department of Electrical Engineering, Pennsylvania State University, University Park, State College, PA 16802, USA
2
Applied Research Laboratory, Pennsylvania State University, University Park, State College, PA 16802, USA
*
Author to whom correspondence should be addressed.
Electronics 2018, 7(12), 442; https://doi.org/10.3390/electronics7120442
Submission received: 26 October 2018 / Revised: 12 December 2018 / Accepted: 13 December 2018 / Published: 15 December 2018
(This article belongs to the Section Microwave and Wireless Communications)

Abstract

:
Indoor emitter localization is a topic of continued interest for improving wireless security as wireless technologies continue to become more advanced. Conventional methods have focused on the localization of devices relative to multi-sensor systems owing to ease of implementation with pre-existing infrastructures. This work, however, focuses on enhancing wireless security via non-cooperative emitter localization in scenarios where only a single receiver can be employed. A vector sensor is simulated and experimentally developed that extracts three-dimensional signal characteristics for room-based emitter localization and is compared to conventional methodologies such as Received Signal Strength (RSS), Time of Arrival (ToA), and Direction of Arrival (DoA). The proposed method generates time-frequency fingerprints and extracts features through dimensionality reduction. A second stage extracts spatial parameters consisting of Channel State Information (CSI) and DoAs that are analyzed using a Gaussian Mixture Model (GMM) to segregate fine-grained regions of interest within each room where the non-cooperative emitter resides. Blind channel equalization cascaded with a least squares channel estimate is used for acquiring the CSI, whereas the DoAs are obtained by unique trigonometric properties of the vector sensing antenna. The results demonstrate that a vector sensor can improve non-cooperative emitter localization and enhance wireless security in indoor environments.

1. Introduction

Although the Global Positioning System (GPS) is extraordinarily effective in outdoor applications, GPS is less effective when used as an Indoor Positioning System (IPS) since it encounters Non-Line-of-Sight (NLoS) signal propagation. IPS approaches have been addressed from a variety of perspectives pertaining to commercial and military applications. The two methods used in user localization are primarily based on device-based or device-free system designs. For intrusion detection from an electronic security perspective, we propose a system based on a vector sensing antenna using device-based emissions. The main systems evaluated in commercial device-based IPS systems have revolved around Wi-Fi networks and Received Signal Strength (RSS) estimation owing to ease of implementation in pre-existing infrastructures [1,2,3,4,5,6,7,8,9]. The techniques provide strong evidence confirming the feasibility of localization; however, the methodologies require multiple access points and cooperative communication with the Device Under Test (DUT) since the devices can readily connect to the wireless network. Most importantly, the analytics never consider potential polarization transitions of the linearly polarized devices and the transitions’ impact on device localization performance. Other techniques utilize Channel State Information (CSI) adding both amplitude and phase attributes; however, such systems only consider cooperative devices that connect to Commercial Off-The-Shelf systems (COTS) [10,11,12].
The implementation of COTS is more advantageous for cooperative emitter applications in commercial domains. However, the consideration of COTS is less useful in this work as the study is more geared towards the analysis of non-cooperative emitters when performing indoor localization for improved wireless security for domains such as law enforcement and public safety. The extraction of spatial parameters that capture environmental propagation anomalies such as sensor signal timing, frequency deviations, and positioning, commonly found using Time Difference of Arrival (TDoA), Frequency Difference of Arrival (FDoA), and Direction of Arrival (DoA), have shown to be efficient in law enforcement, emergency services, and public safety applications [13,14,15,16]. Such systems, however, predominantly require multiple receivers to obtain the localization estimates based on the propagation paths and arrival times at each spatially separated sensor. Limited investigations have explored non-cooperative emitter localization with single receiver systems by extracting ToA information from a mobile receiver along with time deviations embedded within multipath channels [17,18,19,20]. However, these studies have not been experimentally validated.
Therefore, our proposed approach considers the novelties associated with the aforementioned, state-of-the-art, research studies in indoor environments where only a single receiver is employed for investigating non-cooperative cellular emissions using the three-dimensional (3D) received signal acquisitions via a vector sensing antenna. Vector sensing antennas are predominantly used for polarization tracking via adaptive filtering, direction of arrival estimation, interference rejection, and unknown source separation [21,22,23,24]. The antenna has proven adequacy primarily in direction finding for military applications; however, its purpose in this work is to extract 3D spatial characteristics embedded in a received waveform and be resilient to potential polarization transitions while optimizing room localization performance of a machine learning model. The analytical waveform evaluated in the simulations is the Universal for Mobile Telecommunications System (UMTS) in which a method is proposed based on time-frequency representations, similar to [25,26]. In addition, other solutions via machine learning, vector sensing, and the Wavelet Transform (WT) are investigated in conjunction with the proposed vector sensor. Localization performance is first evaluated by exploring room-based localization (i.e., detecting the room in which the non-cooperative emitter resides) from a Weighted K-Nearest-Neighbor (WKNN) classifier that analyzes time-frequency features of the proposed approach, compared to conventional features extracted from signals received by a dipole antenna such as RSS, ToA, DoA, and their combinations from a simulation standpoint.
After ensuring that the employment of the vector sensor and time-frequency features is more robust than RSS, ToA, and DoA from a synthesized perspective, an experimental configuration is implemented that extends and validates the proposed approach from a UMTS emission to other non-cooperative waveforms such as Global System for Mobile Communication (GSM). The final analysis of this work explores fine-grained location estimation through cascaded room-localization with a Region of Interest (RoI) generated by a Gaussian Mixture Model that clusters CSI and DoAs in a probabilistic manner. The procedure acquires the CSI by performing blind channel equalization and system identification through a developed algorithm comprised of the Modified Constant Modulus Algorithm (MCMA) and a least squares channel estimate. The results demonstrated in this work will reveal that adding polarization diversity at the receiver via vector sensing methodologies can allow for simplistic machine learning algorithms such as the WKNN to perform indoor localization to a high degree of accuracy. The proposed procedure invokes the capability of extracting and exploiting unique information embedded within a received signal without needing multiple receivers or access points to be scattered throughout the building. The novelty of this work lies in the first implementation of the three-element vector sensor for use with machine learning algorithms and a proposed fingerprinting approach when localizing a non-cooperative device in an indoor environment with a single receiver.

2. Vector Sensing with a Triad Dipole Vector Sensor

Conventional methods that evaluate non-cooperative emissions from stationary devices in stationary indoor environments utilize uni-dimensional (i.e., single element) dipole antennas in the form of omni-directional radiation patterns. The resultant received signal is of the form
y ρ ( t ) = i = 0 P 1 h i A ρ i e j ( ω ( t τ i ) + θ i ) + n ρ i ( t ) ,
where A ρ is the amplitude of the signal as a function of the antenna polarization ρ , h i is the static time-invariant complex wireless channel impulse response for the i-th channel, ω is the modulating angular frequency, P is the number of received signals impinging on the receiver, τ i denotes propagation delay for the i-th channel, θ describes the phase, and n ρ ( t ) is system-contributed complex Additive White Gaussian Noise (AWGN) of zero-mean and variance σ n 2 . One limitation to the received signal model in (1) is its non-consideration of potential polarization changes caused by the device or the environment which can effectively degrade indoor localization performance. A second limitation to the azimuthal omni-directional antenna model is its inability to extract propagation information from the non-cooperative emission from a 3D perspective [27].
The realization that the wireless channel, h, is a space-time function of Cartesian coordinates ( x , y , z ) corresponding to the non-cooperative emitter’s position [28], indicates that the traditional received signal model cannot heuristically obtain such information regarding the wireless channel characteristics. Analogous to the space-time wireless channel, changes in polarization yield varying 3D characteristics of the electric field associated with the amplitude of the received signal, A, which also cannot be obtained heuristically with a standard receiver configuration.
To overcome the above drawbacks, a more sophisticated receiver can be built with emphasis on fundamental electromagnetic theory which obtains all properties of the 3D electric field signal, A. For such a receiver, the received signal, y, can be expressed in the form y ( t ; x , y , z ) = [ y x ( t ) , y y ( t ) , y z ( t ) ] T , where y x , y y , and y z are the signal components along the three coordinate axes. Vector sensing has proven adequacy in obtaining such a relation using three orthogonally co-located dipoles known as the Triad Dipole Vector Sensor (TDVS) [21,22,23,24]. Most commonly, the TDVS is employed for DoA estimation, however, it is only proposed here for acquisition of three perspectives of the received signal along the x-, y-, and z-axis of the receiver. The received non-cooperative signal on the vector sensor is modeled as
y ( t ; x , y , z ) = i = 0 P 1 h i A e j ( ω ( t τ i ) ) + n i ( t ) ,
where
A = A x ( i ) e j θ x ( i ) , A y ( i ) e j θ y ( i ) , A z ( i ) e j θ z ( i ) ,
with h i = [ h x , h y i , h z i ] T in (2) denoting the i-th complex wireless channel impulse responses accompanied by 3D amplitude A described in (3), and n i ( t ) = [ n x i ( t ) , n y i ( t ) , n z i ( t ) ] T described the 3D AWGN present on each dipole antenna of the TDVS. The received signal model allows for the entire electric field to be obtained in vector form regardless of multipath, scattering, and polarization changes from varying non-cooperative emitters found in the indoor environment. A synthetic version of the TDVS model is constructed in an electromagnetic solver, FEKO ® , and is depicted in Figure 1.
The design and intuition of the TDVS is four-fold when being employed for use in indoor localization systems. First, the TDVS model is polarization diverse such that it can acquire unique polarization transitions induced by a change in transmitter orientation (i.e., if the antenna is linearly polarized) or even polarization degradations invoked by the wireless channel. The model can obtain DoA estimates based solely on received signal amplitude on each orthogonal axis of the TDVS receiver [21,22,23,24]. The receiver can obtain the entire realization of the 3D electric field. Lastly, the TDVS offers the capability of rejecting interfering sources based on the diverse polarization characteristics embodied in the structure of the antenna [23], which is imperative when performing non-cooperative indoor emitter localization.

3. Simulated Room Localization of Non-Cooperative Emitters

The development of a single receiver system was performed in Wireless InSite ® . The ray-tracing simulation was used to explore different methods of localization commonly found in Indoor Positioning System (IPS) literature and to guide the development of a new method of non-cooperative device localization for a single receiver system. The simulation serves as a method of obtaining a fundamental realization of signal propagation in an ideal scenario that encompasses parameters of the real-world setting. The purpose of the simulation is to promote the utilization of the TDVS for indoor localization and compare the simulated performance of the TDVS results with an experimental verification. Specific features such as ToA and DoA are only considered in the simulation to further provide evidence of the superior performance of the TDVS, however, they are not further evaluated with experimentation as they are considered to be the ground truth in the simulation.

3.1. Indoor Environment

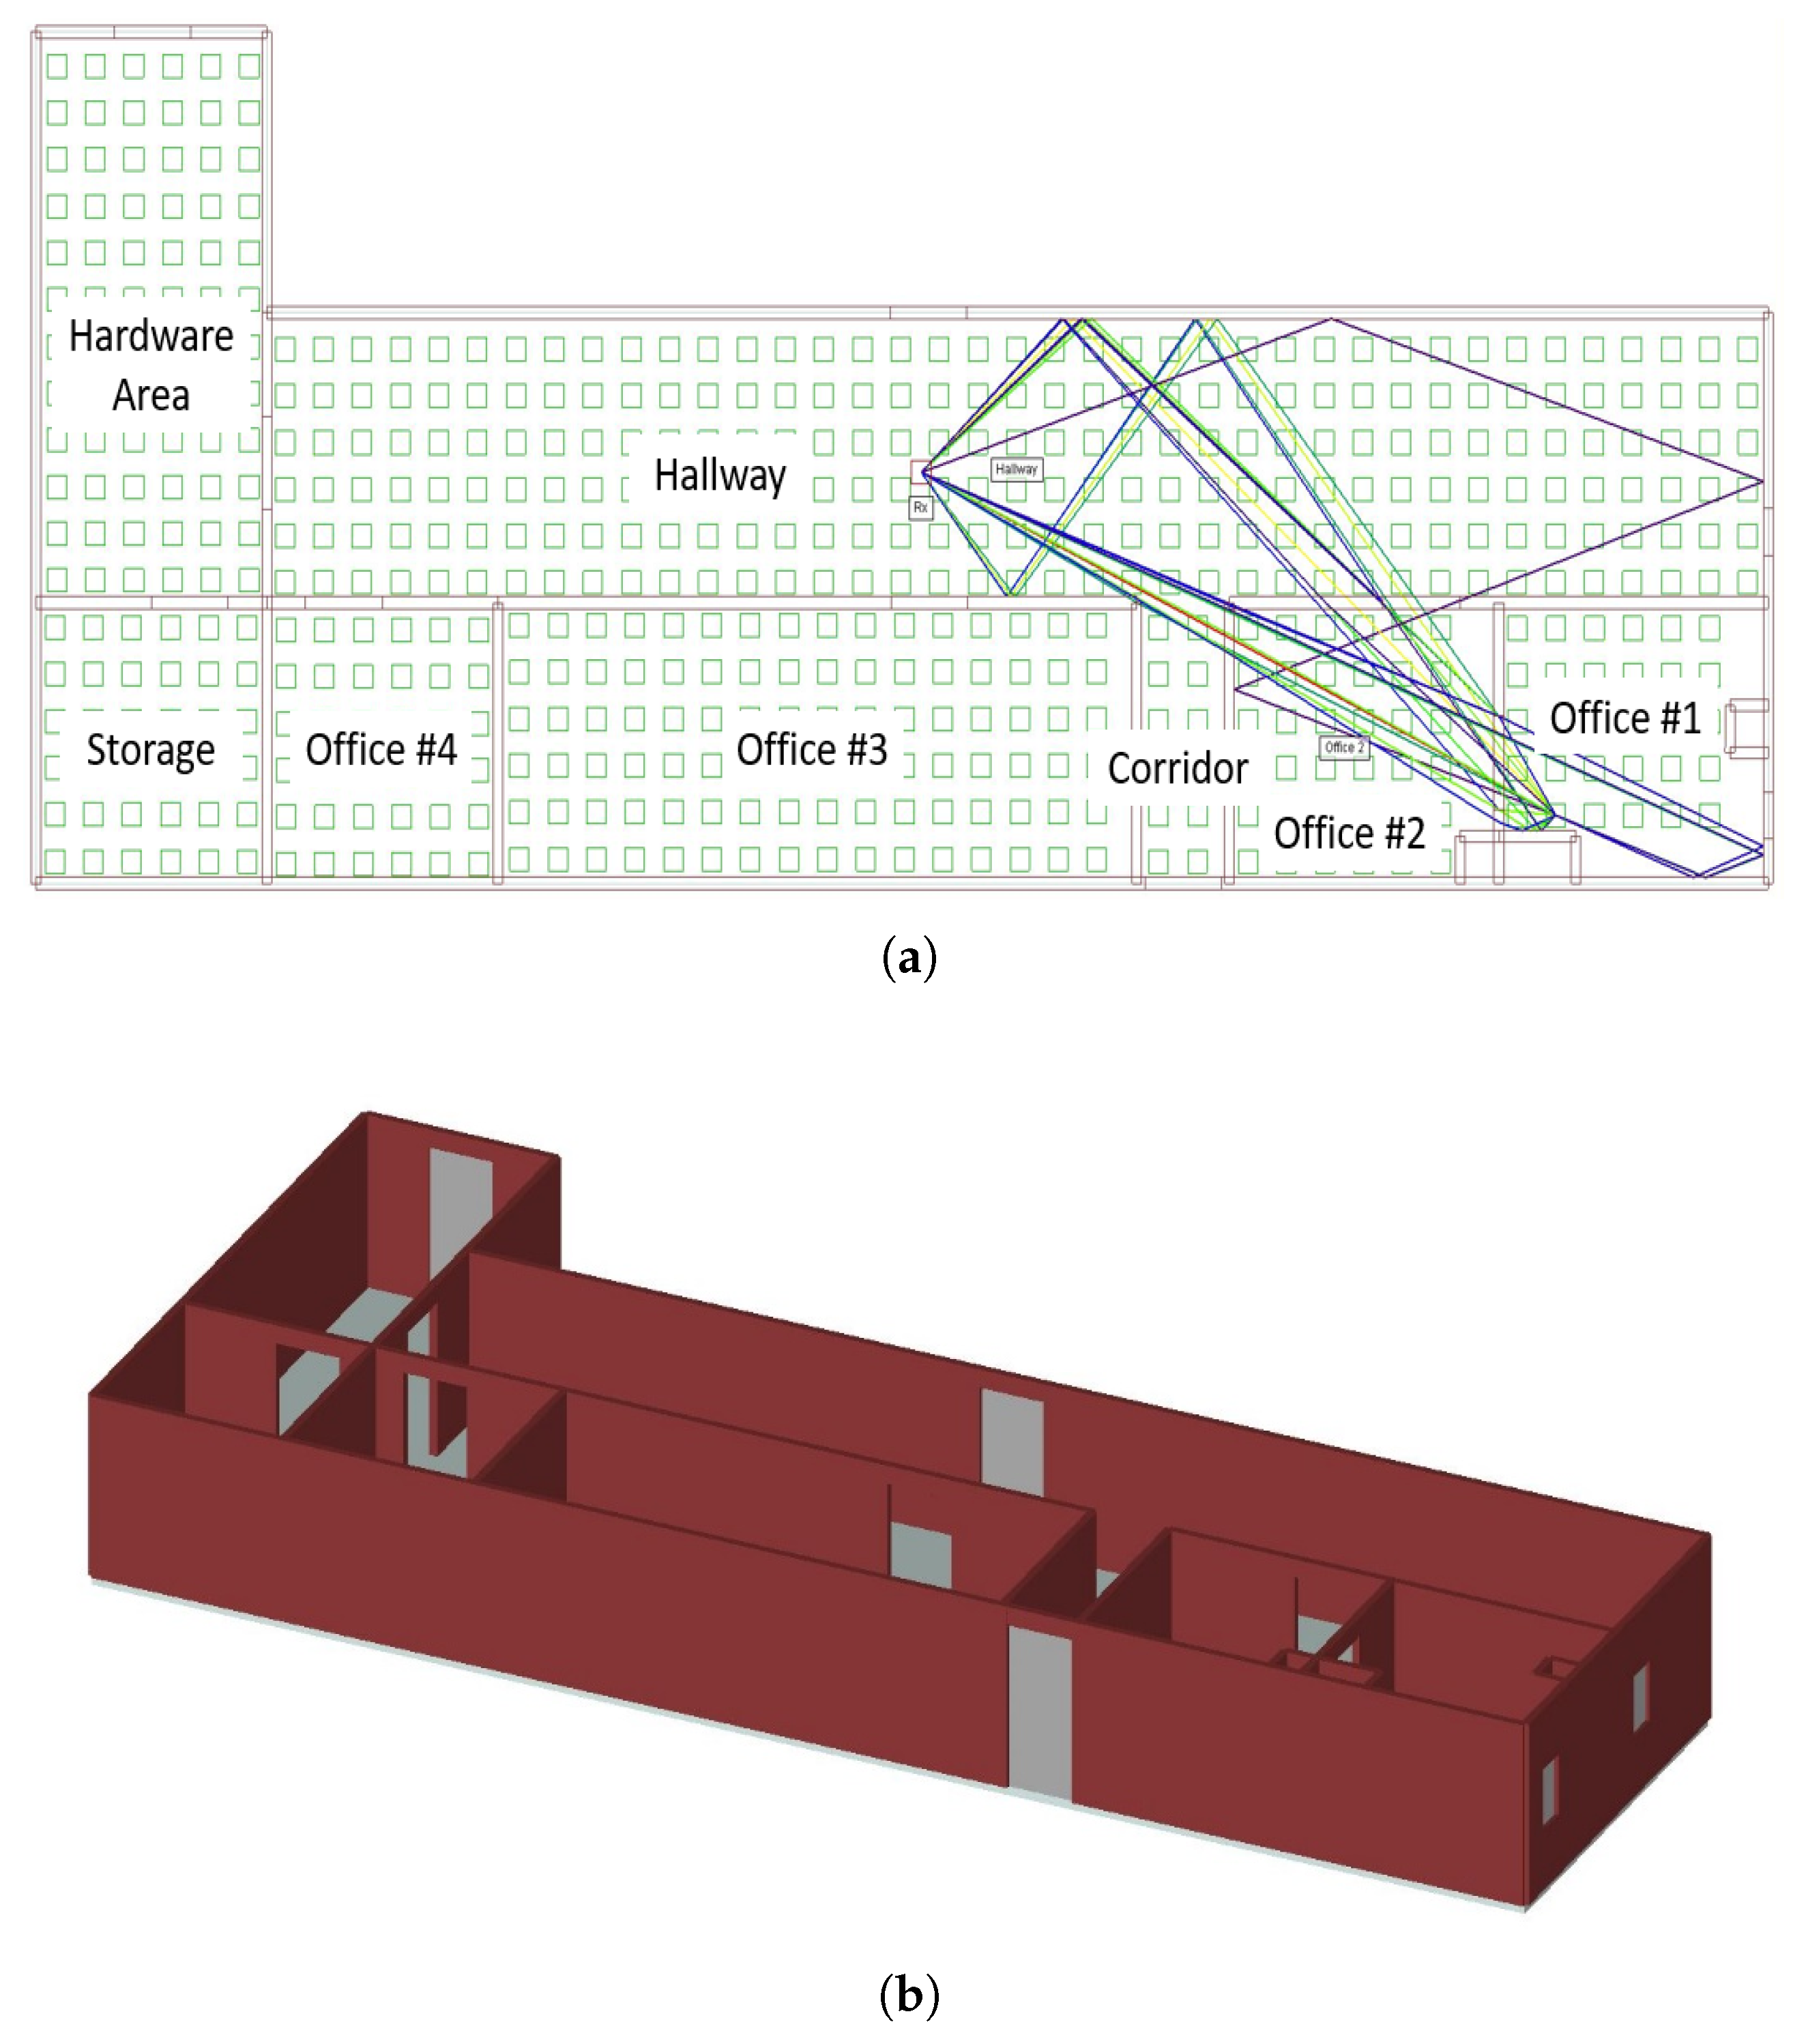
The indoor environment generated in Wireless InSite ® was modeled to resemble the office environment in which experimentation was performed (see Figure 2). The building was modeled as 23 m in length, 9 m in width, and 3 m in height with the walls made of brick material, the ceiling made of ceiling board, the floor modeled as concrete, the closed doors modeled as metal, and the windows modeled as glass. A total of eight rooms were created as 552 potential transmitter locations were evaluated inside the simulated indoor environment with a spacing of 0 . 5 m at a constant height of 1 . 8  m. The specific height is used for realization of a device located in an area above the waist similar to the work performed in [4]. It can be inferred that changing the height of the transmitter would invoke different wireless channel effects and in turn yield a potential change in room localization performance; however, we do not believe that the changes in the room localization performance would be substantial in areas above a standing person’s waist. This conclusion is based on [29] which experimentally revealed that transmitters located near the surface would experience the highest fades in received signal strength at a receiver and increased separation between the surface and the transmitter improves fading effects. Therefore, as a preliminary study with the proposed vector sensor, only emitters located above a person’s waist are considered in this work.
The transmitters were modeled as UMTS emitters and evaluated one at a time for both horizontal and vertical polarizations to analyze the robustness of conventional features used in localization to features acquired from the TDVS. The total number of data samples on a per-room basis (i.e., the number of transmitter locations per-room) are as follows: 72 locations in the Hardware area, 36 locations in the Storage area, 234 locations in the Hallway, 36 locations in Office #4, 96 in Office #3, 12 locations in the Corridor area, 36 in Office #2, and 30 in Office #1. The extraction of RSS, ToA, and DoA was performed on signals received by a dipole antenna (i.e., omni-directional in the azimuth plane) of vertical polarization mounted to the ceiling in the Hallway, whereas the proposed approach implemented the TDVS antenna in the exact same location.

3.2. Room Localization

Since RSS, ToA, and DoA are features that are extracted from signals received by the traditional dipole antenna and do not require further post-processing, a machine learning model can be directly applied. The proposed approach of obtaining the 3D signal vector y ( t ; x , y , z ) from an emitter at each location, however, requires further processing for fingerprint generation and feature extraction. The proposed procedure is a two-fold approach comprised of fingerprint generation through time-frequency/scale signal analysis followed by feature extraction through dimensionality reduction.

3.2.1. Fingerprint Generation

Radio Frequency (RF) fingerprints are unique and identifiable signatures that are extracted from RF signals and used in exploiting non-cooperative devices in the localization procedure. The proposed procedure encompasses time-frequency/scale signal analysis comprised of the short-time Fourier transform (STFT) and the wavelet transform (WT). The motivation behind employing the STFT and WT for fingerprint generation is based on the realization that the transformations allow for the decomposition of a non-cooperative signal to be evaluated in both time-frequency and time-scale surfaces. As the non-cooperative emission propagates through the indoor wireless channel, instantaneous transients, frequency selective artifacts induced by multipath, and wireless channel characteristics become entangled in the received signal which can be resolved via time-frequency signal decomposition. Applying such a decomposition to a signal for analysis in time-frequency/scale allows for machine learning algorithms to exploit such characteristics (as will be revealed in the next section) when performing feature extraction.
The discrete STFT is employed on all three signals. As an example, the discrete STFT as a function of the z-axis signal is computed as
STFT { y z [ n ] } ( m , l ) = n y z [ n ] g * [ n m ] e j 2 π N l n ,
where ( · ) * denotes the complex conjugate, g denotes a Hamming window of fixed length, N denotes the transform length, y z [ n ] is equivalent to y z [ n T s ] as T s is the sampling interval, m describes the time index, and l describes the frequency index. As can be inferred from (4), the STFT is limited by the selection of the window due to the requirement of having a windowing function of fixed length. Such a subtle conclusion provides the motivation for using a transformation that employs a varying window as abrupt changes found in the STFT analysis could be potentially missed due to the fixed windowing and trade-off between time-frequency resolution. Thus, the windowed Wavelet Transform (WT) allows for such transients to be obtained through a discretized time-scale decomposition via approximation of the continuous wavelet transform, mathematically described as
WT { y z [ n ] } ( m , s ) = T s s n y z [ n ] ψ * n m s .
where ψ is a mother wavelet that measures the variation of y z [ n ] around the delay, m, and is proportional to scale, s, which has important applications in transient detection in modulating signals [30,31]. A matrix of complex coefficients corresponding to the z-axis received signal is then constructed for the STFT in (4) or the WT in (5) as
S ˜ z = S ˜ z ( 0 ) ( 0 ) S ˜ z ( 1 ) ( 0 ) S ˜ z ( 2 ) ( 0 ) S ˜ z ( B 1 ) ( 0 ) S ˜ z ( 0 ) ( 1 ) S ˜ z ( 1 ) ( 1 ) S ˜ z ( 2 ) ( 1 ) S ˜ z ( B 1 ) ( 1 ) S ˜ z ( 0 ) ( 2 ) S ˜ z ( 1 ) ( 2 ) S ˜ z ( 2 ) ( 2 ) S ˜ z ( B 1 ) ( 2 ) S ˜ z ( 0 ) ( M 1 ) S ˜ z ( 1 ) ( M 1 ) S ˜ z ( 2 ) ( M 1 ) S ˜ z ( B 1 ) ( M 1 ) ,
where B is the number of frequency bins or scales extracted from the bandwidth of the transmitted UMTS signal and M is the number of time instances, respectively. It is worth further emphasizing that we only extract spectral information from the frequency spectra centered around the carrier of the received signals up to the bandwidth of the emission. The information extracted by the STFT or WT is solely from the propagation of the waveform through the wireless channel. An RF fingerprint is then constructed by horizontally concatenating the matrix in (6) with the x- and y-axis fingerprints of the TDVS such that the fingerprint contains 3D spectral information of the non-cooperative emission as a function of time, defined mathematically as
X c l o c = S x ( 0 ) ( 0 ) S y ( 0 ) ( 0 ) S z ( 0 ) ( 0 ) S z ( B 1 ) ( 0 ) S x ( 0 ) ( 1 ) S y ( 0 ) ( 1 ) S z ( 0 ) ( 1 ) S z ( B 1 ) ( 1 ) S x ( 0 ) ( 2 ) S y ( 0 ) ( 2 ) S z ( 0 ) ( 2 ) S z ( B 1 ) ( 2 ) S x ( 0 ) ( M 1 ) S y ( 0 ) ( M 1 ) S z ( 0 ) ( M 1 ) S z ( B 1 ) ( M 1 ) ,
is the resulting fingerprint matrix X c l of size ( M × D ) as D is three times the size of B, c is the class label (i.e., the room where the emitter resides), S x ( 0 ) ( 0 ) is the magnitude of S ˜ x ( 0 ) ( 0 ) , and l o c denotes the finite location where the non-cooperative emitter resides within room c. The procedure in (7) is repeated per location inside the indoor environment generating a database of 552 fingerprints which is found by stacking fingerprints in a column, i.e.,
X = X 1 1 X 2 1 X 8 30 ,
where X 1 1 is the fingerprint of the first transmitter located in the Hardware Area and X 8 30 is the 30th transmitter location in the fingerprint database located in Office #1. The fingerprints in (8) are then converted from matrices to vectors realizing 552 independent observations. This formulation allows for a database of time-frequency and time-scale representations to be generated and stored for localization purposes in indoor environments based on received non-cooperative UMTS emissions.

3.2.2. Feature Extraction

After formulating the database of unique RF fingerprints for the x-, y-, and z-axis received signal y ( t ; x , y , z ) , unique signatures can be extracted that vary per location of the non-cooperative emitter. The proposed approach of utilizing the time-frequency representations has been attempted by [25] and [26] for localization of signals obtained from omni-directional dipole antennas; however, the redundancy in frequency content can degrade localization performance, and therefore, utilization of dimensionality reduction based on the vector sensor receiver is a more effective approach to capture the 3D wireless channel characteristics embedded in the received non-cooperative signal. The procedure of extracting unique signatures begins by performing two linear transformations on X in the form
y = W T x n ,
where W is a matrix of orthonormal weights and x n is a row vector from the fingerprint database X . The first linear transformation used in (9) is Principal Component Analysis (PCA) which aims to orthogonally project the data onto a linear subspace (i.e., principal space) and maximize the projections with respect to the variance in an unsupervised manner [32]. PCA has proven to be extremely useful in image classification [33]. The PCA weights, or eigenvectors, are computed as a maximization of the total covariance matrix of X expressed as
W PCA = arg max W | W T S T W | ,
with S T denoting the total covariance defined as
S T = 1 N n = 1 N ( x n μ ) ( x n μ ) T ,
where μ denotes the mean of X and N the number of samples in the fingerprinted database. After computing all of the principal components in (10) based on the total covariance in (11), the second linear transformation is performed as a mechanism to extract features that maximize class separation in a supervised manner. This method used is Linear Discriminant Analysis (LDA) where the weights are found based on Fisher’s criterion expressed as
W LDA = arg max W | W T S B W W T S W W | ,
where S B and S W represent the within-class and between-class covariance matrices, defined as
S B = c = 1 C N c ( μ c μ ) ( μ c μ ) T ,
S W = c = 1 C n c ( x n μ c ) ( x n μ c ) T ,
where c is the class label and μ c is the class mean [34]. The projection in (9) based on the weights computed in (12) results in a dimension reduction from the D dimensional fingerprint space to a ( c 1 ) dimensional subspace. The resulting linear transformations from PCA and LDA are then combined to form a feature space representing RF signatures for training a classifier that maximize the total variance of the fingerprints and maximize the ratio of the between-class (13a) and within-class separation (13b), modeled as
X ˜ = [ W PCA T X , W LDA T X ] .

3.2.3. Classification

The method used for classification is a Weighted K-Nearest-Neighbor (WKNN) which searches the fingerprint database, X ˜ in (14), for the closest neighbors to a test sample and assigns the class label based on the distance measurement computed in the feature space. The WKNN is used in this work to perform indoor localization via simplistic/lazy machine learning to evaluate the richness of information extracted by the proposed approach compared to traditional methodologies that use dipole receivers. The classifier can evaluate the richness of information extracted from traditional features such as DoA, RSS, and ToA relative to the simplistic yet effective classifier model, as well as, to demonstrate the superior performance of the WKNN when trained on features extracted via the proposed STFT/WT fingerprinting approach. Depending on the features being evaluated (i.e., RSS, ToA, DoA or the proposed PCA and LDA), the classifier is trained on the features and a model is constructed as
y ^ WKNN ( f m ) = k = 1 K w k D ( k ) NN ( x ˜ n , f m ) k = 1 K w k ,
with the weights, w k , defined as the squared inverse of the distance, i.e.,
w k = 1 D NN ( x ˜ n , f m ) 2 ,
where K in (15) describes the number of neighbors, and y ^ W K NN is the room estimate based on D NN in (16) which describes a Nearest-Neighbor (NN) Euclidean distance expressed as
D NN ( x ˜ n , f m ) = arg min m = 1 M n = 1 N | x ˜ n f m | 2 ,
with x ˜ n in (17) denoting the nth row of the training feature space, X ˜ in (14), and f m denoting the mth row of the testing feature space, respectively.

3.3. Room Localization Discussion

We started the analysis by extracting the commonly used features such as DoA, RSS, and ToA from the signals received by a traditional dipole antenna, as well as the features extracted from signals received by the TDVS. A summary of the parameters used in extracting information from the simulated ray-tracing software is presented in Table 1. The table gives an overview of the aforementioned parameters prior to revealing the results of the room localization performance of the WKNN. The table also describes the parameters used in the proposed fingerprinting approach such as the basis functions (i.e., window and wavelet basis), analytical waveform, sampling frequency, channel complexity (number of multipath signals), and the number of optimum neighbors used in each WKNN model (i.e., 5). When evaluating the classifiers, the training percentage is used as a mechanism to demonstrate the effectiveness of the algorithm when evaluating smaller amounts of data for training to larger amounts. This evaluation realizes not only the effectiveness of the WKNN at performing room localization, but also the richness of information extracted by the features used in localization. Training percentage is analytically defined as the percentage of the overall data used in training the classifier model (i.e., 80% training indicates that we hold out 20% of the data for testing the classifier and perform five-fold cross-validation uniformly over all combinations of the data for training).
Each training set is uniformly sampled from the dataset, X, where the remaining unseen (i.e., not used for training) samples are used as the testing samples. After performing the cross-validation, the room localization results are averaged with respect to the number of folds used in the cross-validation. Room localization results according to the specific training percentage were then obtained using a Monte Carlo simulation with respect to the various training and testing data splits and averaged once again over 100 trials per training percentage. Each Monte Carlo trial randomly permutes X and redefines the training and testing sets on every iteration. A description of the way training percentage is defined from a pseudo-code perspective and uniform sampling for cross-validation is shown in Algorithm 1 with reference to the Monte Carlo simulation. It is evident that we only consider training and testing samples that provide uniform sampling intervals in constructing cross-validation (CV) sets such that training on 20% of the data and 80% of the data both perform 5-fold CV.
Algorithm 1 Training Percentage and Cross-Validation without Monte Carlo Trials
 1:  for i = 1 to 2 do
 2: 
 3:  for c = 2 to 10 do
 4: 
 5:     if i = 1 then▹ Perform C-fold cross-validation
 6: 
 7:      X train = X ( n c , : ) ▹ Training % = 1 c 100
 8: 
 9:      X test = X ( n n c , : )
10: 
11:      y ^ W K NN ( X train , X test )
12: 
13:     else▹ Perform C-fold cross-validation
14: 
15:      X test = X ( n c , : )
16: 
17:      X train = X ( n n c , : ) ▹ Training % = c 1 c 100
18: 
19:      y ^ W K NN ( X train , X test )
20: 
21:     end if
22: 
23:  end for
24: 
25:  end for

3.4. Room Localization Results

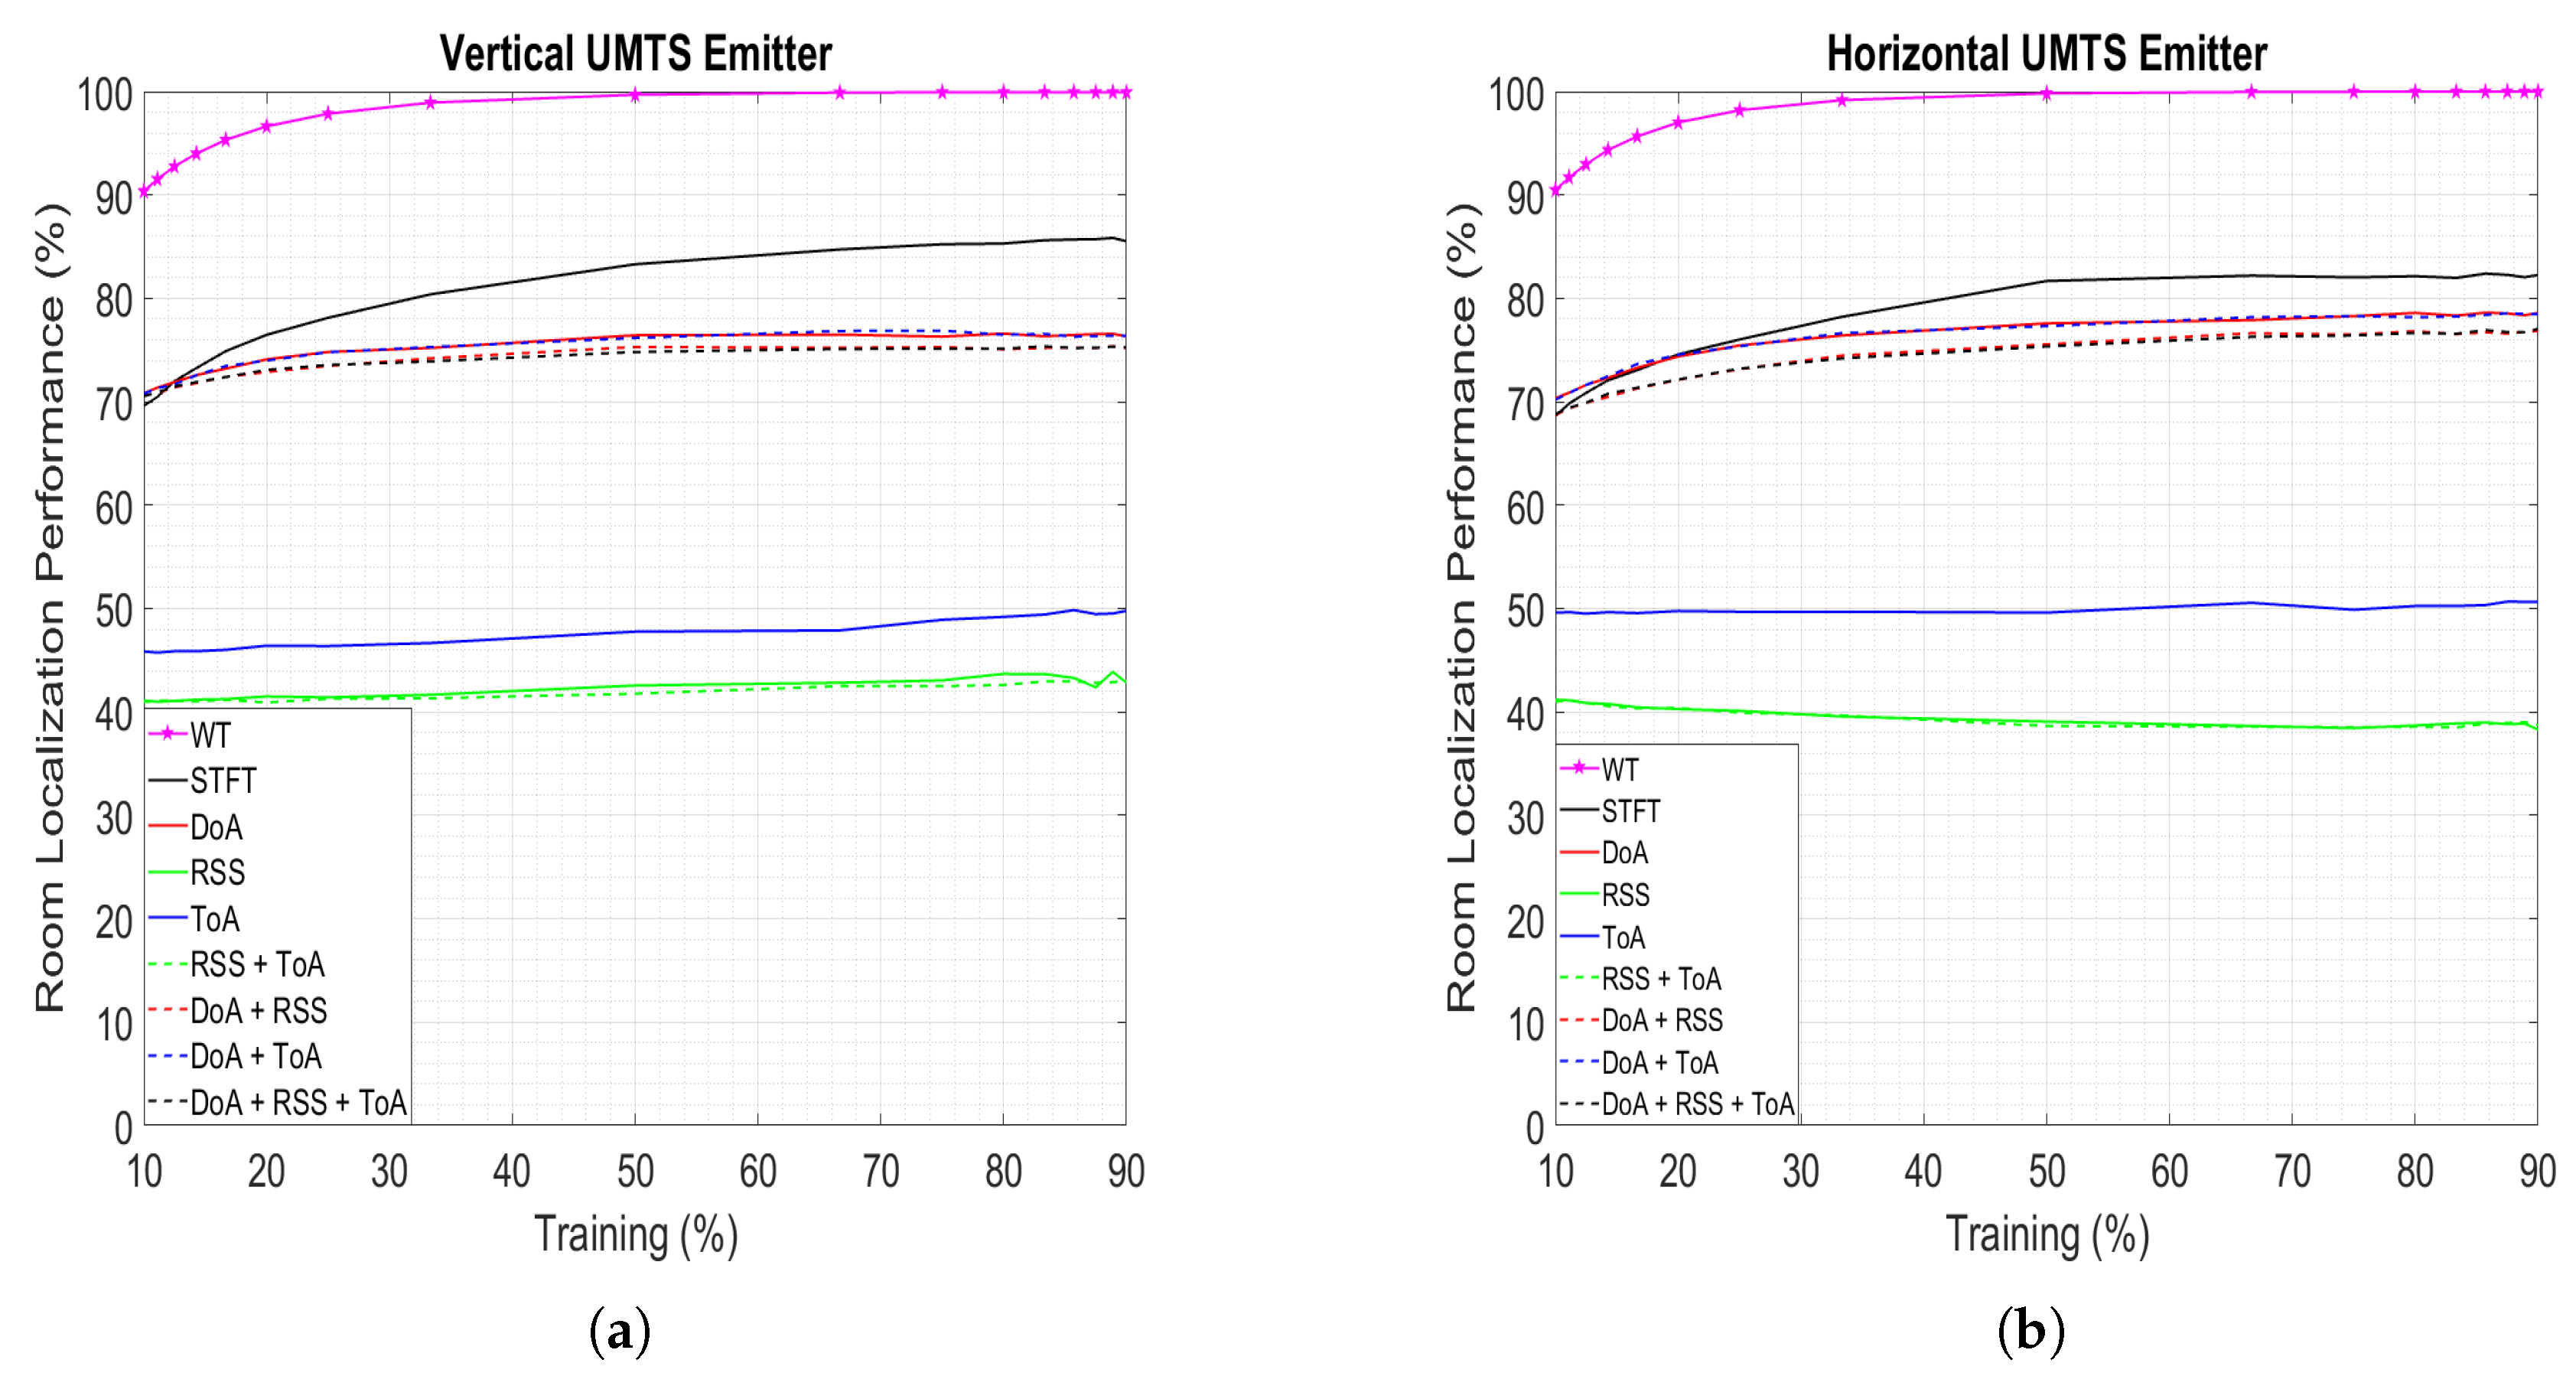
The room localization results of the WKNN are displayed in Figure 3 as a function of the training percentage for both vertically and horizontally polarized non-cooperative UMTS emitters. The results demonstrate the robustness of the proposed approach of constructing time-frequency/scale fingerprints as the approach for a vertically polarized transmitter and using 80% of the data for training yields 86 % room classification performance for STFT fingerprints and nearly 100% for WT fingerprints. The proposed procedure obtains approximately 10– 20 % room localization improvement over the second best method (i.e., the combination of DoA and ToA) which achieves 76 % room localization performance when only using 80% of the data for training. It is clear that RSS and ToA are less informative when used individually for the WKNN as accuracies reach room localization performances of 43 % and 50 % , respectively, when 80% of the entire dataset is trained.
The second analysis takes into account the consideration of a potential polarization transition at the non-cooperative transmitter with respect to room localization performance. The results for the change in polarization from vertical to horizontal show that RSS provides a localization performance of 38 % when using 80% of the data for training, resulting in a degradation of 5 % compared to the vertically polarized scenario. It is also observed that the proposed method achieves 84 % and nearly perfect accuracy for STFT and WT fingerprints, causing a less significant loss of 2 % in room localization performance when training on 80% of the dataset and testing on the remaining 20%. The realization that RSS and ToA achieve the lowest performance can be understood as the receiver is placed in the middle of the indoor environment, as such, distance contributions towards ToA and RSS are similar when moving leftward and rightward of the receiver. Thus, room localization degrades due to this distance impact on computing RSS and ToA with a single receiver system.
It will be shown in the upcoming section that RSS can be further improved with the TDVS based on this realization and the incorporation of polarization diversity. As the TDVS can obtain directional changes regarding polarization and RSS characteristics of an impinging waveform, similar tendencies embedded within the primary polarization component (i.e., vertical or horizontal) can be further characterized with the incorporation of the two additional polarization perspectives available in the TDVS design.

4. Experimental Room Localization of Non-Cooperative Emitters

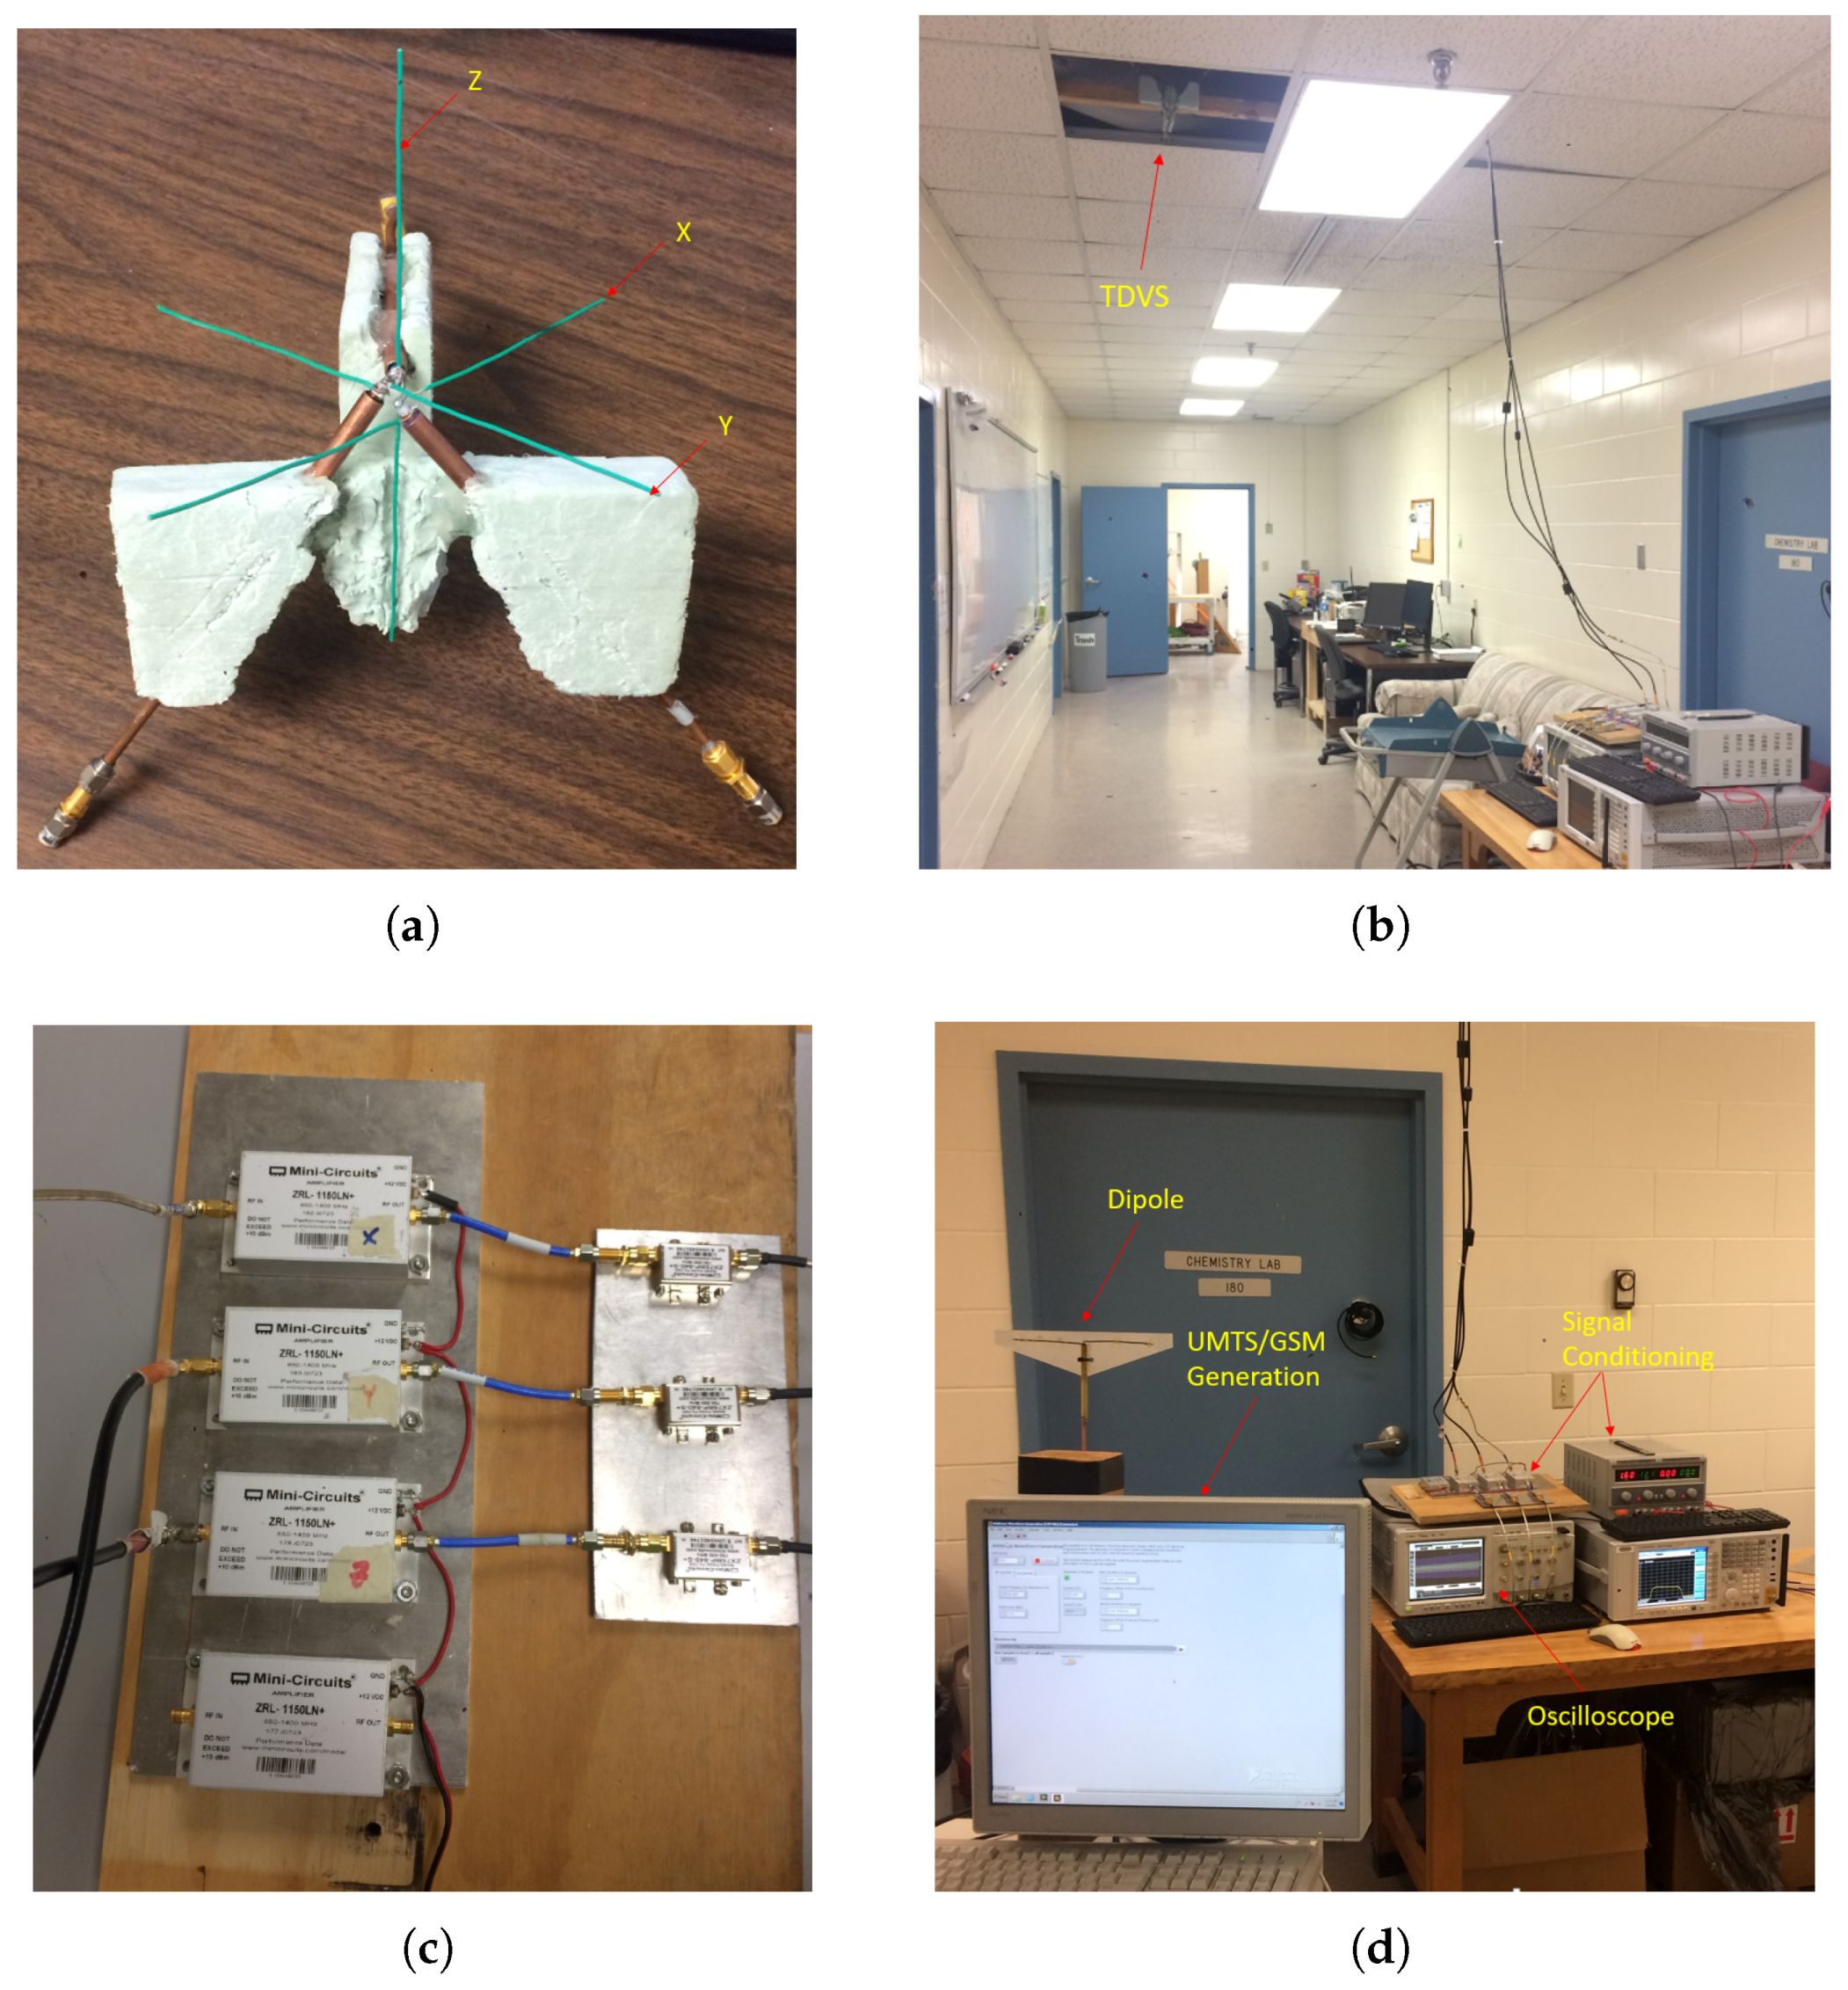
Although the aforementioned simulation leveraged sophisticated electromagnetic ray-tracing software in analyzing conventional approaches in localizing non-cooperative UMTS emitters, an experimental validation experiment was performed. The experimental verification began by constructing the TDVS and receiver system (see Figure 4) based on the synthetic model used in Wireless InSite ® . The TDVS was mounted to the ceiling in the Hallway where 118 transmitter locations were used as the potential transmitter locations inside the office environment. The locations were mapped out such that the majority of the area in the rooms was covered; however, the transmitters were specifically placed in positions where a user would be able to freely walk around. The number of unique transmitter locations used in each room were as follows: 16 locations in the Hardware area, 10 positions in the Storage room, 26 locations in the Hallway, 13 in Office #4, 21 in Office #3, 8 in the Corridor, 11 in Office #2, and 13 in Office #1.
The experiment considered both GSM and UMTS non-cooperative emissions generated in LabVIEW ® for realization of narrowband and wideband non-cooperative emissions. The waveforms utilized pseudo-random NRZ streams to construct the GSM and UMTS emissions for realization of a true non-cooperative device. The transmitter height of each GSM/UMTS emission was at 1.8 m, staying consistent with the simulation. The experiment began by orienting the transmitting dipole of vertical/horizontal polarization in a direction towards the TDVS and propagating a GSM/UMTS non-cooperative emission. The signals were captured 5 times per location and stored for post-processing analytics. After capturing the five signal samples of different GSM/UMTS-NRZ sequences at both vertical and horizontal polarizations, the transmitter is moved to the next location.
Regarding the receiver system, three Low-Noise Amplifiers (LNAs) were used, each cascaded with a Bandpass Filter (BPF) spanning from 790-890 MHz for optimization of the signal-to-noise ratio (SNR) on all three channels of the TDVS receiver (i.e., x-, y-, z-axis dipoles). The emissions were received by the TDVS and sampled at 10 GHz by an oscilloscope. The experiments were performed between the hours of 8:00 p.m. and 4:00 a.m. to minimize potential opportunities for interference. The results of the STFT-generated fingerprints from one location inside each room are shown in Figure 5. Sparse fingerprint representations are found for emitters placed in locations that are in line-of-sight with the TDVS such as the Hallway and Office #3 as the TDVS adequately achieves polarization tracking. For instances where the non-cooperative emitter is in regions considered to be non-line-of-sight with respect to the TDVS, smearing effects are found in the fingerprints due to increased multipath contributions.

4.1. Room Localization Discussion

The methods of performing fingerprint generation through STFT and WT followed by feature extraction via PCA/LDA were performed on the experimental data in an identical manner to that of the simulation. RSS is also extracted from signals impinging a vertical dipole to compare the proposed approach with that of one of the most commonly used features used in indoor positioning systems. DoA and ToA are not extracted in the experimentation due to the underlying principle of requiring high precision of time synchronization and the necessity of having extreme manifold learning with the dipole (i.e., the ability to measure all possible DoAs that could be found at the dipole receiver). The simulation of DoA and ToA was a means of only comparing the features’ room localization performance relative to the proposed STFT/WT procedure ensuring the superiority of the TDVS approach. It is highly probable that the proposed method will also outperform the other methods based on the comparison of RSS experimental measurements evaluated in this section. Room localization performance was found when performing 5-fold cross-validation (i.e., 80% training and 20% testing splits) with the WKNN in a 100 trial Monte Carlo simulation as shown in Table 2 (consistent with the procedure defined in the simulated version of room localization). Since we obtain five measurement samples of the GSM/UMTS waveforms per location, we proclaim that each waveform obtained from a distinct location is independent from the other recorded samples (i.e., we randomly generate new GSM/UMTS emissions on each recording).

4.2. Room Localization Results

The results found in Table 2 correspond to the room localization performance of the WKNN when trained on STFT, WT, and RSS features extracted from GSM and UMTS emissions of vertical and horizontal polarizations. Specific room localization performances correspond to the true positive performance of the WKNN at correctly classifying the room where the non-cooperative device is residing. The results indicate that the STFT achieves better overall room localization than the WT and RSS approach for both GSM and UMTS emissions regardless of the polarization. The room localization performance of the STFT features is optimum for narrowband GSM sources as performance reaches approximately 99% regardless of transmitter polarization when trained on 80% of the data. For the UMTS signal, the STFT achieves approximately 94% room localization performance for vertical emitters and 90% for horizontal emitters, respectively, when using 80% training and 20% testing splits. When using the WT features, the WKNN room localization performance reaches an overall accuracy of approximately 82% for both vertical and horizontal polarizations (again when only trained on 80% of the data). For the UMTS signals, the WT features with the WKNN achieve room localization performances of approximately 89% and 83% for vertical and horizontal polarizations, respectively.
The comparison between the simulated and experimental room localization performances of the STFT and WT features differ as the STFT outperforms the WT room localization performance of the UMTS emissions in the experimental setting. Further analysis of Table 2 gave insight as to why this phenomenon had occurred. For rooms where the UMTS emitter is in line-of-sight with the TDVS, such as the Hallway and Office #3, the WT outperforms STFT by approximately 2%. In all other circumstances, the emitter is located in cluttered rooms warranting non-line-of-sight signal propagation where it is apparent that the WT realizes a marginal drop in room localization performance. This specific realization grants the understanding that the inclusion of clutter such as furniture (not considered in the simulations) severely degraded the WT performance. The furniture, such as desks and tables, residing in all rooms, were hypothesized to cause confusion for the classifier model as the varying wavelet basis function obtains the unique environmental characteristics embedded in the multipath wireless channels at the cost of confusing the WKNN classifier (i.e., cluttered rooms appear correlated to the classifier leading to increased misclassification). Nonetheless, wideband UMTS sources allow for the WT to obtain unique frequency selective fading signatures embedded in the received fingerprints caused by the multipath channels realizing minimally improved performances when compared to GSM non-cooperative emitters.
After evaluating the performance of room localization when using STFT/WT fingerprints, RSS features were extracted from signals received by a vertical dipole antenna and analyzed by the WKNN in an identical manner to that of the simulation. The results of the WKNN when trained on 80% of the data realized approximately 20–25% room localization performance for GSM and UMTS emissions. This evidence demonstrates the superior performance of the TDVS antenna relative to traditional methodologies that use uni-dimensional antennas and RSS. The concluding evidence in Table 2 demonstrates that the STFT achieves accurate room localization performances for vertical and horizontal GSM/UMTS non-cooperative emitters, reaching optimal performance for the narrowband GSM signals. The fixed windowing basis function of the STFT mitigates the abrupt changes caused by frequency-selective fading effects and clutter anomalies, thus formulating resilient fingerprints and information for the WKNN classifier to evaluate.

Improving RSS Room Localization Performance via TDVS

The poor performance of uni-dimensional antenna elements further promotes the importance of adding diversity to an antenna as drastic improvements can be produced in single-receiver localization systems. This statement was justified by exploring the opportunistic functionality of the TDVS by extracting 3D RSS defined as the power received along each orthogonal axis of the vector sensor antenna. Feature vectors are created and evaluated by the WKNN, defined as
RSS 3 D = RSS x , RSS y , RSS z ,
where each RSS vector defined in (18) is extracted from all 590 signals obtained in the experiment. It is apparent that the only difference between traditional RSS extracted from signals received by a vertical dipole and the 3D RSS via TDVS antenna is an additional two-dimensional observation of the power along the x- and y-axis of the TDVS. The room localization performance of the WKNN with respect to the 3D RSS is demonstrated in Table 3. The results indicate that the additional perspectives of RSS in the TDVS design grants opportunistic capabilities as it realizes drastic improvements when compared to traditional RSS with the WKNN as results are propelled to 90% and 78% room localization performance for vertical and horizontal polarizations when trained on 80% of the data. Similarly, the UMTS analysis realizes room localization performances of 77% and 67% for vertical and horizontal polarizations, respectively. The demonstration yields improvements in the GSM localization performance of 64.49% and 56.03% for vertical and horizontal polarizations, whereas, UMTS is improved by 50.7% and 45.89%. The additional analysis provides the fundamental limitation of traditional single-receiver systems in indoor localization and ensures that the additional components of the TDVS can drastically improve single-receiver localization performance through polarization diversity.

4.3. Noise Considerations on Room Localization Performance

A secondary analysis was performed to evaluate the robustness of the STFT, WT, and RSS feature vectors with respect to system conditions and WKNN room localization performance as a function of degrading SNR. Since the majority of localization systems train on ‘offline’ measurements and perform ‘online’ localization, the consideration of environmental changes in system noise and their contributions on training feature vectors is imperative to compare room localization performances and their stability with respect to increased system noise. Therefore, complex AWGN with zero-mean and variance, σ n 2 , was added to the experimental received testing signals prior to fingerprint generation, feature extraction, and classification by the trained WKNN. The simulation began by constructing received signal vectors associated with the dipole elements as
y ˜ x [ n ] = y x [ n ] + n x [ n ] ,
y ˜ y [ n ] = y y [ n ] + n y [ n ] ,
y ˜ z [ n ] = y z [ n ] + n z [ n ] ,
where y [ n ] in (19a)–(19c) is the ground truth received bandpass waveform obtained in the experiment, y ˜ [ n ] is the noise corrupted received waveform, and n [ n ] is an independent and identically distributed (i.i.d) AWGN source present on each dipole element. The performance of the WKNN classifier model was evaluated based on the root-mean-square error (RMSE) defined as
RMSE = 1 N M C i = 1 N M C 1 C c = 1 C ( x ^ c ( i ) x c ( i ) ) 2 ,
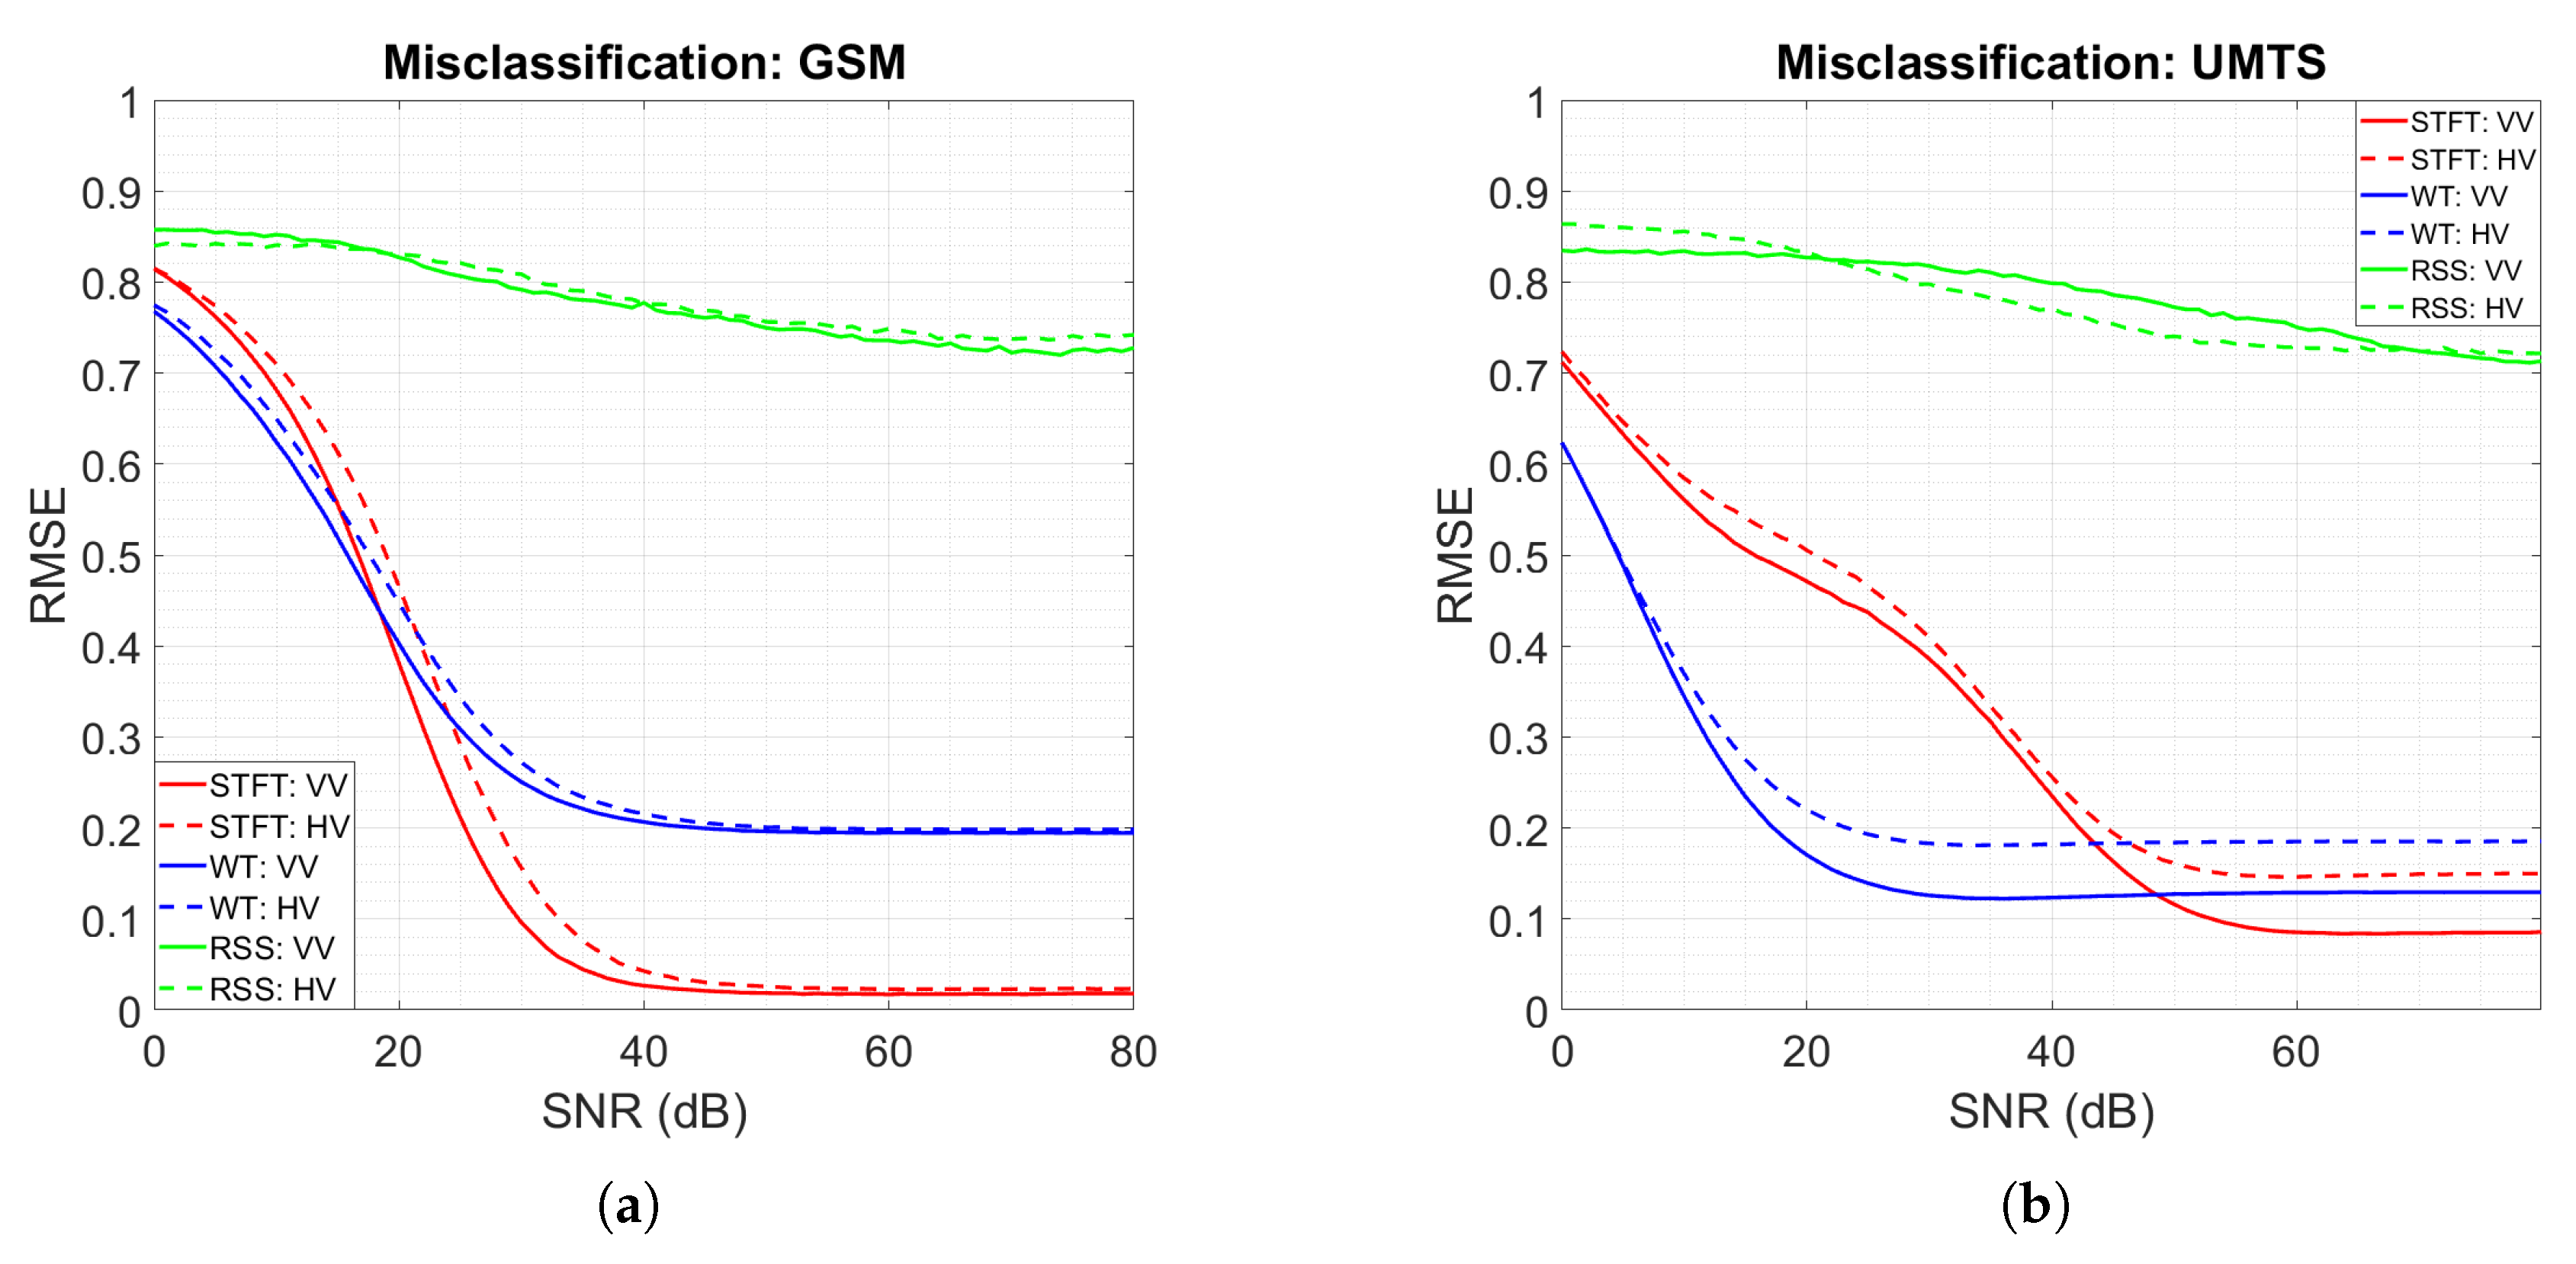
where x ^ denotes the room label estimates, x denotes the ground truth, N M C denotes the number of Monte Carlo iterations (i.e., 100), and C describes the number of cross-validations (i.e., 5). For the case of the RSS features, the WKNN is trained on the ground truth RSS and tested on the noisy observations. The impact of noise on the three techniques (see Figure 6) yielded an interesting result on the WKNN localization performance when trained on 80% of the entire dataset. In the case of wideband UMTS emissions, the WT was far more robust to noise contributions on the testing data with respect to the RMSE in (20). This ensures the WT’s capability of acquiring unique multipath characteristics from the varying Morlet wavelet basis function, whereas, the STFT fingerprints are more severely impacted by the decreased SNR. For the narrowband GSM signals, the STFT and WT fingerprints achieved comparable performance degradations with respect to SNR which is presumably due to the minimized frequency-selective fading effects at the receiver due to the narrower GSM bandwidth. It is still apparent that RSS is less effective than the proposed features extracted from the signals received by the TDVS as the STFT/WT outperform RSS across all SNR considerations. Nonetheless, the WT achieves more robust stability with respect to decreased SNR for the wideband UMTS signals, whereas, the STFT achieves best performance for the narrowband GSM signals.

5. Simulated Region of Interest Localization

The above sections strictly compared the performance of a machine learning classifier model to detect the room where a non-cooperative emitter resides based on radio frequency fingerprinting and a designed TDVS receiver. Further work was performed in Wireless Insite ® to determine the feasibility of obtaining regions of interest (RoIs) where the adversarial device is residing in each room (i.e., obtain further information regarding the position of the non-cooperative/adversarial device). The preliminary results for RoI localization in this section assume room classification is first performed using the WKNN on STFT/WT-generated fingerprints. The room estimate is then cascaded with a Gaussian Mixture Model (GMM) that forms probabilistic clusters on DoAs and Channel State Information (CSI) extracted from the trigonometric properties of the TDVS along with a cascaded blind channel equalization and estimation algorithm. Thus, this section reveals the method of performing RoI localization of non-cooperative emitters through CSI and DoA obtained from the simulated TDVS model and evaluated by the designed GMM. In general, RoI localization is evaluated to ensure that DoA and CSI estimation via blind channel equalization and trigonometric properties of the TDVS can be effective in obtaining further information about the location where the adversarial device resides within a room. Traditional systems leverage waveform characteristics on a carrier-basis such as in OFDM systems to obtain CSI estimates; however, our application requires the blind equalization and estimation of the CSI such that it can be leveraged to perform RoI localization for various types of non-cooperative emitters.

5.1. Feature Vectors

The features extracted from the signals received by the vector sensor are CSI and DoAs. Since DoA is readily available in the ray-tracing Wireless Insite ® simulation, the method proposed for practical applications is through either the trigonometric characteristics of the vector sensor using methods proposed in [21,22] or through experimental measurements of the various DoA in the environment. Obtaining the CSI within the simulation, however, required post-processing on the 3D received signal. The acquisition of the CSI begins by performing channel equalization with the Modified Constant Modulus Algorithm (MCMA). After obtaining the NRZ information sequence of the UMTS waveforms in the simulation, a least squares channel estimate is performed to estimate the CSI.

5.1.1. Channel Equalization

Since a priori information regarding the UMTS symbol sequence is unavailable at the receiver due to the non-cooperative nature of the device, channel equalization is first performed on the received waveform to obtain the non-return-to-zero (NRZ) information stream (i.e., a sequence of +1 and −1 used in creating GSM and UMTS emissions). The algorithm was developed in [35] for performing blind channel equalization of complex wireless channels. The algorithm was designed to mitigate the need for hardware such as phase locked loops and phase synchronization systems for recovering phase errors present at the receiver. The MCMA procedure begins with the analysis of the following received, baseband signal
y l [ n ] = 1 2 i = 0 P 1 H l [ i ] α [ n i ] + n [ n ] ,
where P is the number of multipath signals impinging on the receiver, H l [ i ] is a sampled complex-valued baseband channel coefficient of the wireless channel convolved with the transmit and receive filters [36], α [ n ] is a complex NRZ information sequence, and n [ n ] is system-generated AWGN modeled as a complex random variable that is i.i.d with zero-mean and variance, E [ | n [ n ] | 2 ] = σ n 2 . The method of channel equalization employs the MCMA to resolve the information stream in a blind adaptation of the cost function
J ( w ) = J R ( w ) + J I ( w ) ,
= 1 4 E | z R [ n ] | 2 γ R 2 + E | z I [ n ] | 2 γ I 2 ,
where E [ · ] denotes statistical expectation, J R and J I denote the real and imaginary cost functions, respectively, of the equalizer output, and z R , I [ n ] denotes the impulse response of the MCMA equalizer output. The predetermined constants, γ R and γ I , expressed in (22b) are used to drive the received NRZ symbols towards the constant modulus and are dependent on the dispersion around the NRZ bit values. The equalizer weights are updated via stochastic gradient descent on the cost function, J ( w ) in (22a), such that the weights of the MCMA equalizer are found as
w [ n + 1 ] = w [ n ] μ e [ n ] y l H [ n ] ,
with e R [ n ] and e I [ n ] describing the error functions for the real and imaginary cost functions, defined as
e [ n ] = e R [ n ] + j e I [ n ] ,
= | z R [ n ] | 2 γ R z R [ n ] + j | z I [ n ] | 2 γ I z I [ n ] ,
where μ denotes a fixed step-size parameter in (23) and e[n] describes the complex error function of the equalizer in (24a) and (24b). Using the above derivations for the MCMA equalizer, estimates of the NRZ information sequence can be made with a sign detector defined as
α ^ R , I [ n ] = + 1 , for z R , I [ n ] 0 , 1 , for z R , I [ n ] < 0 .

5.1.2. CSI Estimation

After performing unsupervised channel equalization to obtain the NRZ information sequence via MCMA, an estimate is made about the impulse response of the CSI. Recalling (21), a sum of squares error, ε , is constructed between the estimated received signal and the actual received signal as
ε = 1 2 n = 1 N { y l [ n ] y ^ l [ n ] } 2 .
A minimization of the error, ε in (26), is computed by finding the derivative of the error with respect to a sample estimate, H ^ [ l ] , found within the CSI sequence, H [ n ] , such that
ε H ^ [ l ] = r y α ^ [ l ] i = 0 P 1 H ^ l [ i ] r α ^ α ^ [ l i ] ,
with r y α ^ [ l ] and r α ^ α ^ [ l i ] denoting cross- and auto-correlation, respectively. The CSI estimate is then formulated based on manipulation of (27) via least squares and described in vector notation as
H ^ = R α ^ α ^ 1 r y α ^ ,
where R α ^ α ^ is an ( P × P ) invertible Hermitian Toeplitz autocorrelation matrix and r y α ^ is a cross-correlation vector as both are functions of the NRZ sequence estimated in (25). The method of obtaining the CSI via least squares solution in (28) allows for a blind equalization/estimation to be performed on received baseband signals. Since spatial information is embedded within the CSI as it is a function of the non-cooperative emitter’s position, the information can be exploited by machine learning procedures such as cluster modeling.
Using the non-cooperative signals obtained from the Wireless Insite ® simulation model, the mean CSI and DoA are obtained and used for constructing feature vectors of four dimensions at each discrete location within the indoor environment, defined as
F = H ¯ R , H ¯ I , ϕ ¯ , θ ¯ ,
where H ¯ R are the mean of real-valued components of the CSI, H ¯ I describe the mean of the imaginary CSI, and ϕ ¯ and θ ¯ describe the mean directions of arrival in both azimuth and elevation planes of the TDVS. An MCMA equalizer of length 30 was used on each received non-cooperative UMTS waveform propagated through 25 different paths. The step-size parameter of 0.005 was used in order to ensure convergence for the MCMA equalizer.

5.2. Probabilistic Cluster Modeling for RoI Localization

The probabilistic clustering model used for RoI localization of the non-cooperative UMTS emitters is the Gaussian Mixture Model (GMM), comparable to the K-means clustering algorithm. A mixture of Gaussians can be obtained from a linear superposition of Gaussian distributions in the form
p ( x ) = k = 1 K π k N ( x | μ k , Σ k ) ,
where μ k is the mean of the k t h distribution (i.e., mixture), Σ k is the k t h covariance, and π k is an unknown probability i.e., weight of the Gaussian distribution [32]. The distribution can be interpreted by first selecting one of the mixing components in (30) that corresponds to the marginal distribution p ( z k = 1 ) = π k , which is defined as selecting a mixture component, k, with probability π k , based on binary random variable z of length K as z k { 0 , 1 } , in which only one element in z is equal to 1 and all else are 0. A responsibility (i.e., conditional distribution of assigning z k to a specific mixture defined as a soft-class membership), r ( z k ) , can be generated that helps infer the probability of assigning random variable z to a cluster given the sample x based on Bayes’ theorem described as
r ( z k ) π k N ( x | μ k , Σ k ) j = 1 K π j N ( x | μ j , Σ j ) .
The parameters μ k , Σ k , and π k in (31) are estimated as follows:
  • Initialize the component mixture probability π k with equally-likely probability (i.e., 1 K ) and define the covariance Σ k to be diagonal and identical, i.e.,
    Σ k = σ 1 2 0 0 0 0 σ 2 2 0 0 0 0 σ 3 2 0 0 0 0 σ K 2 ,
    as σ k 2 is the variance of the data in the k th cluster, σ 1 2 = σ 2 2 = = σ K 2 , and K is the number of clustering components selected. The cluster mean μ k is then selected by minimizing the cost as a function of the squared Euclidean distance via K-means between the data sample and k th cluster mean described as
    J ( x ) = n = 1 N k = 1 K z n k | | x n μ k | | 2 ,
    where x n denotes the n t h data sample and z n k is defined as
    z n k = 1 , if k = arg min i | | x n μ i | | 2 , 0 , otherwise .
    where μ i in (34) defines the i t h mean within the set of K cluster means such that z n k = 1 if the data sample is assigned to cluster k, and z n i = 0 for i k . The selection of z n k and μ k is performed through the minimization of J ( x ) in (33) until convergence is obtained.
  • Initialize the GMM with defined parameters μ k and Σ k in (32) that are initialized in the K-means process and iteratively perform the expectation step (E-step) followed by the maximization step (M-step) according to [32] until convergence is achieved and all responsibilities (31) are assigned.
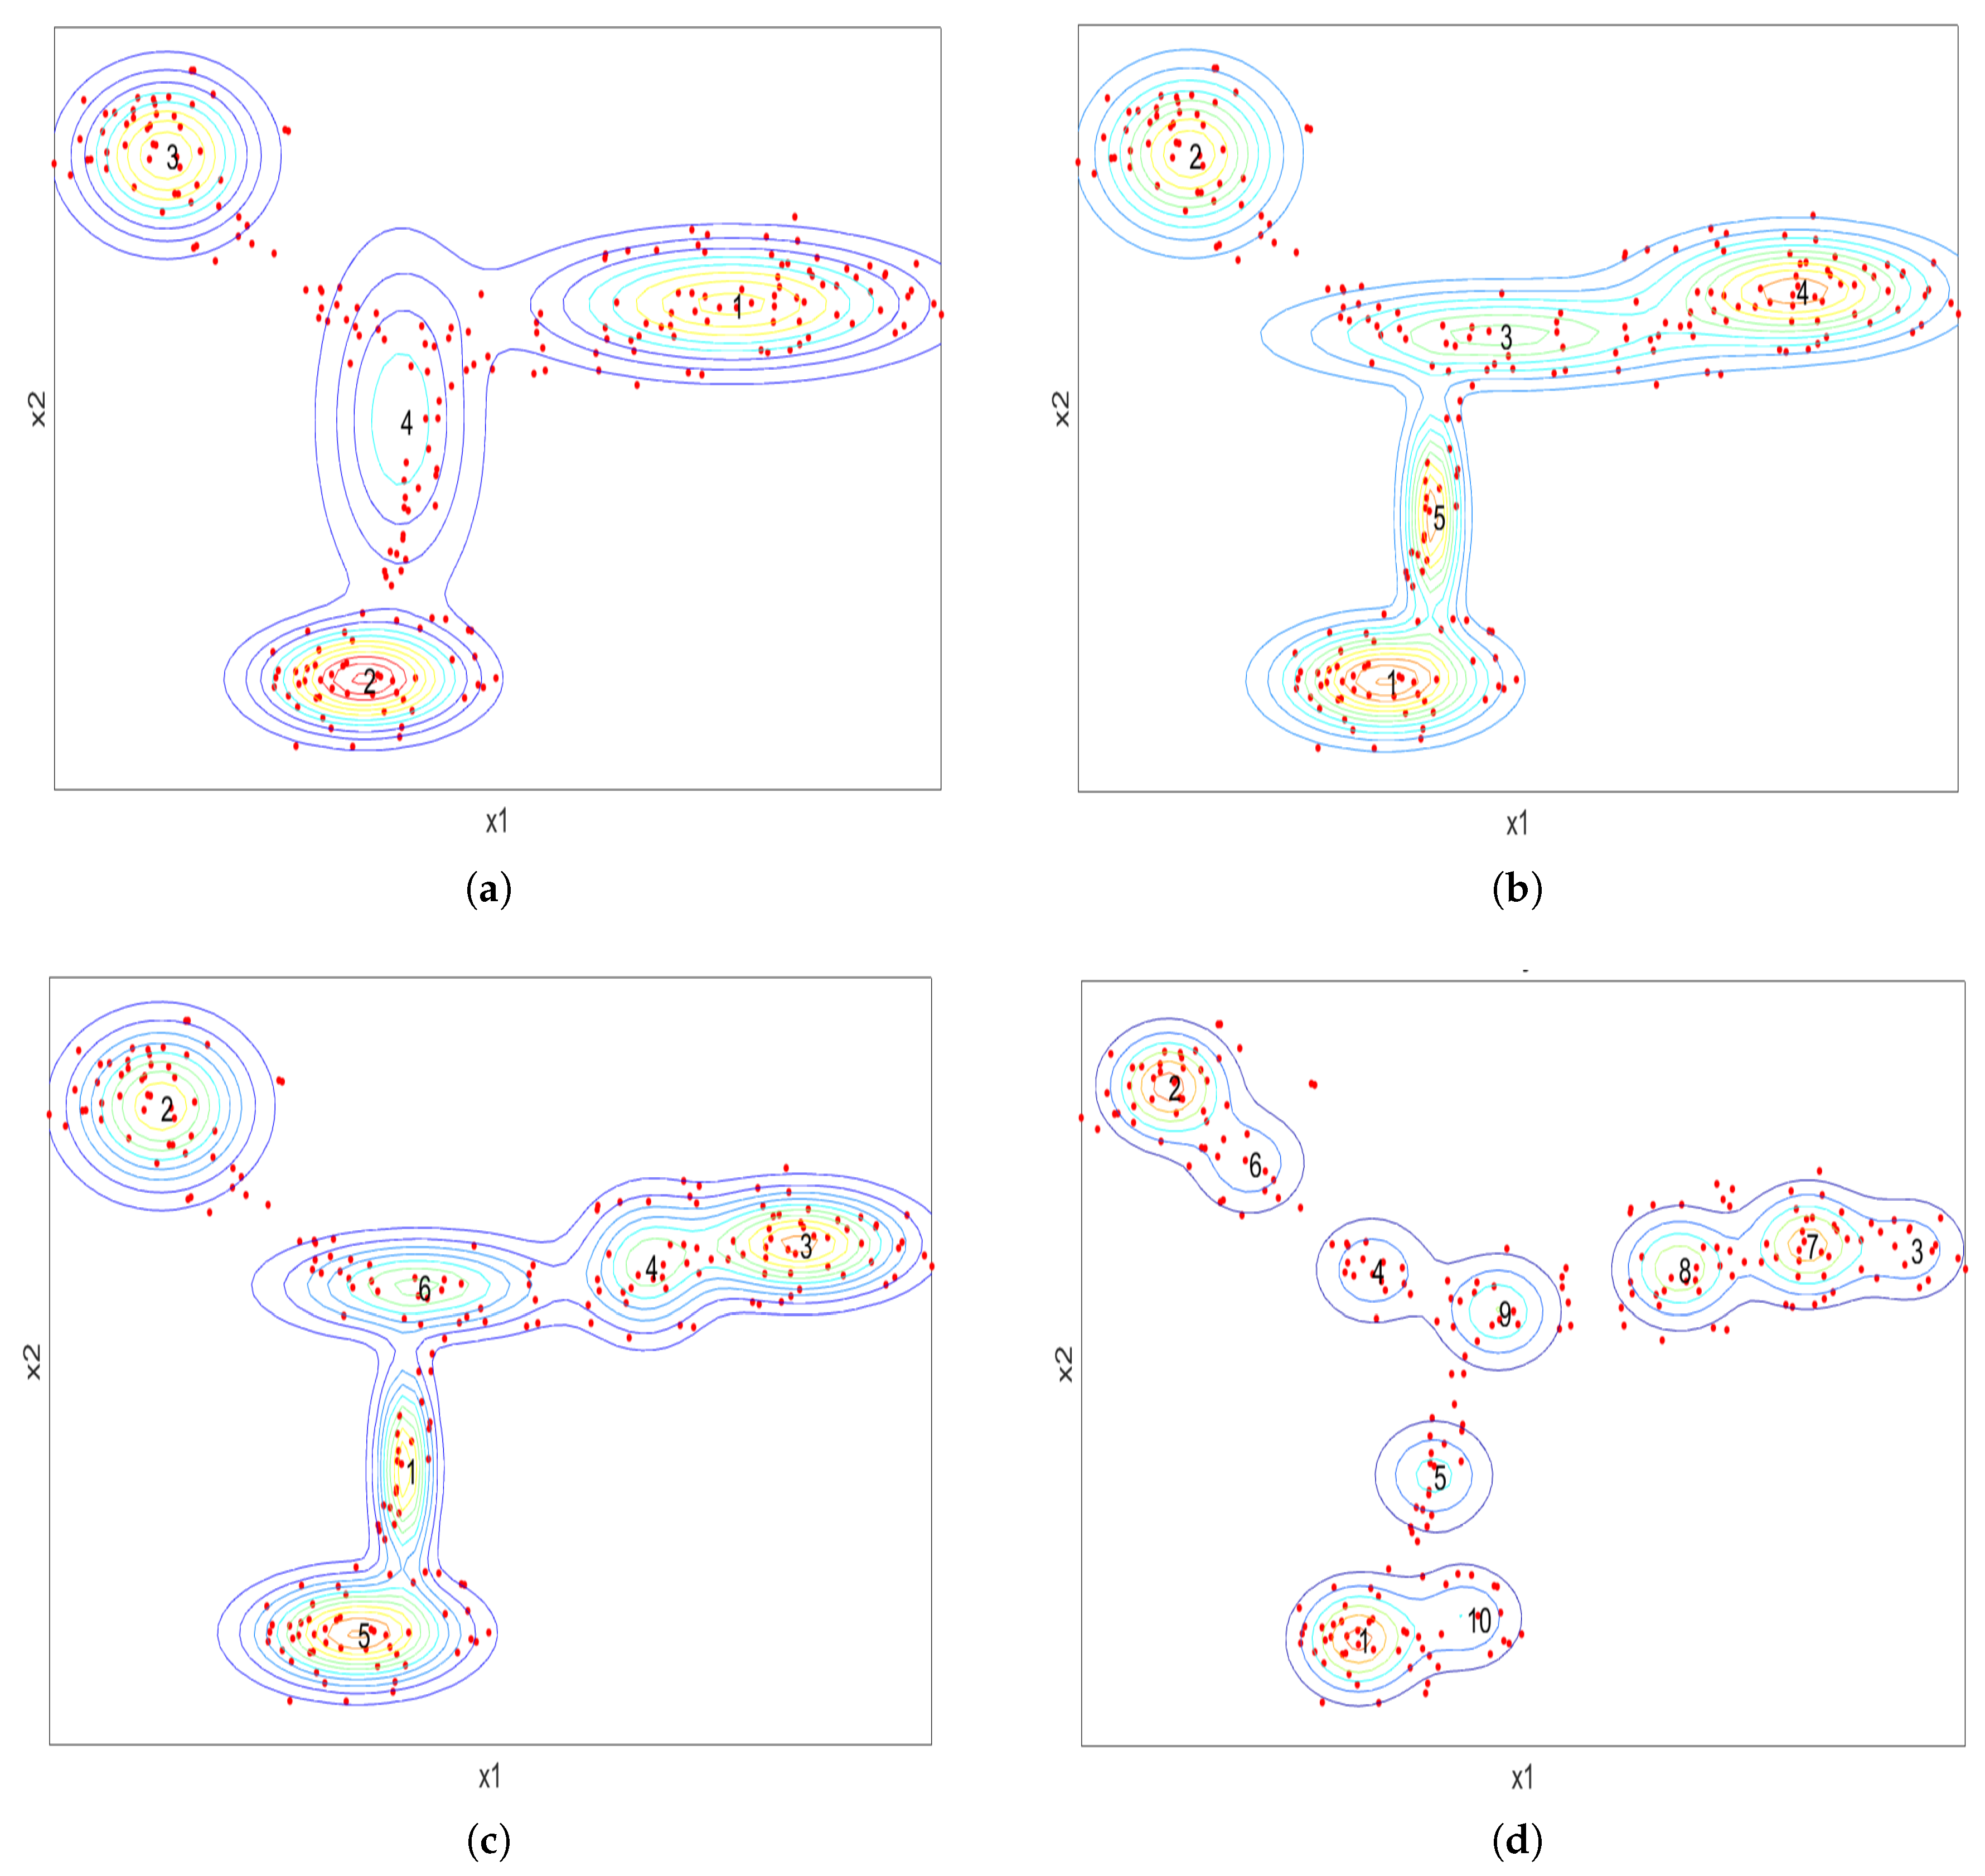
For visualization of the GMM models, each discrete feature vector, F in (29), is projected to a 2D space using the t-Distributed-Stochastic-Neighbor-Embedding algorithm (t-SNE) [37]. The t-SNE algorithm projects the high-dimensional data to a lower-dimensional feature space based on pairwise similarities. The results of the GMM for various clusters is described by Figure 7 for dimensionally reduced feature vectors obtained from the Hallway. We want to further emphasize that the depicted results in Figure 7 only correspond to the GMM cluster models on the data in the Hallway area. The same exact procedure performed on the Hallway area data is also performed on the other rooms using different GMM parameters. This is due to the fact that we first estimate the room where the non-cooperative emitter resides followed by a further estimate with a trained GMM model trained for a specific number of K clusters. The results indicate the ability of the GMM to realize various clusters within the feature vectors received from non-cooperative UMTS transmitters inside the Hallway area. The GMM realizes spatial correlation between locations based on the CSI- and DoA-acquired information at the TDVS. As the K-value increases, it is apparent that more discretized clusters are formed indicating that specific regions inside the Hallway area are more statistically related than others from the perspective of the GMM covariance matrices.
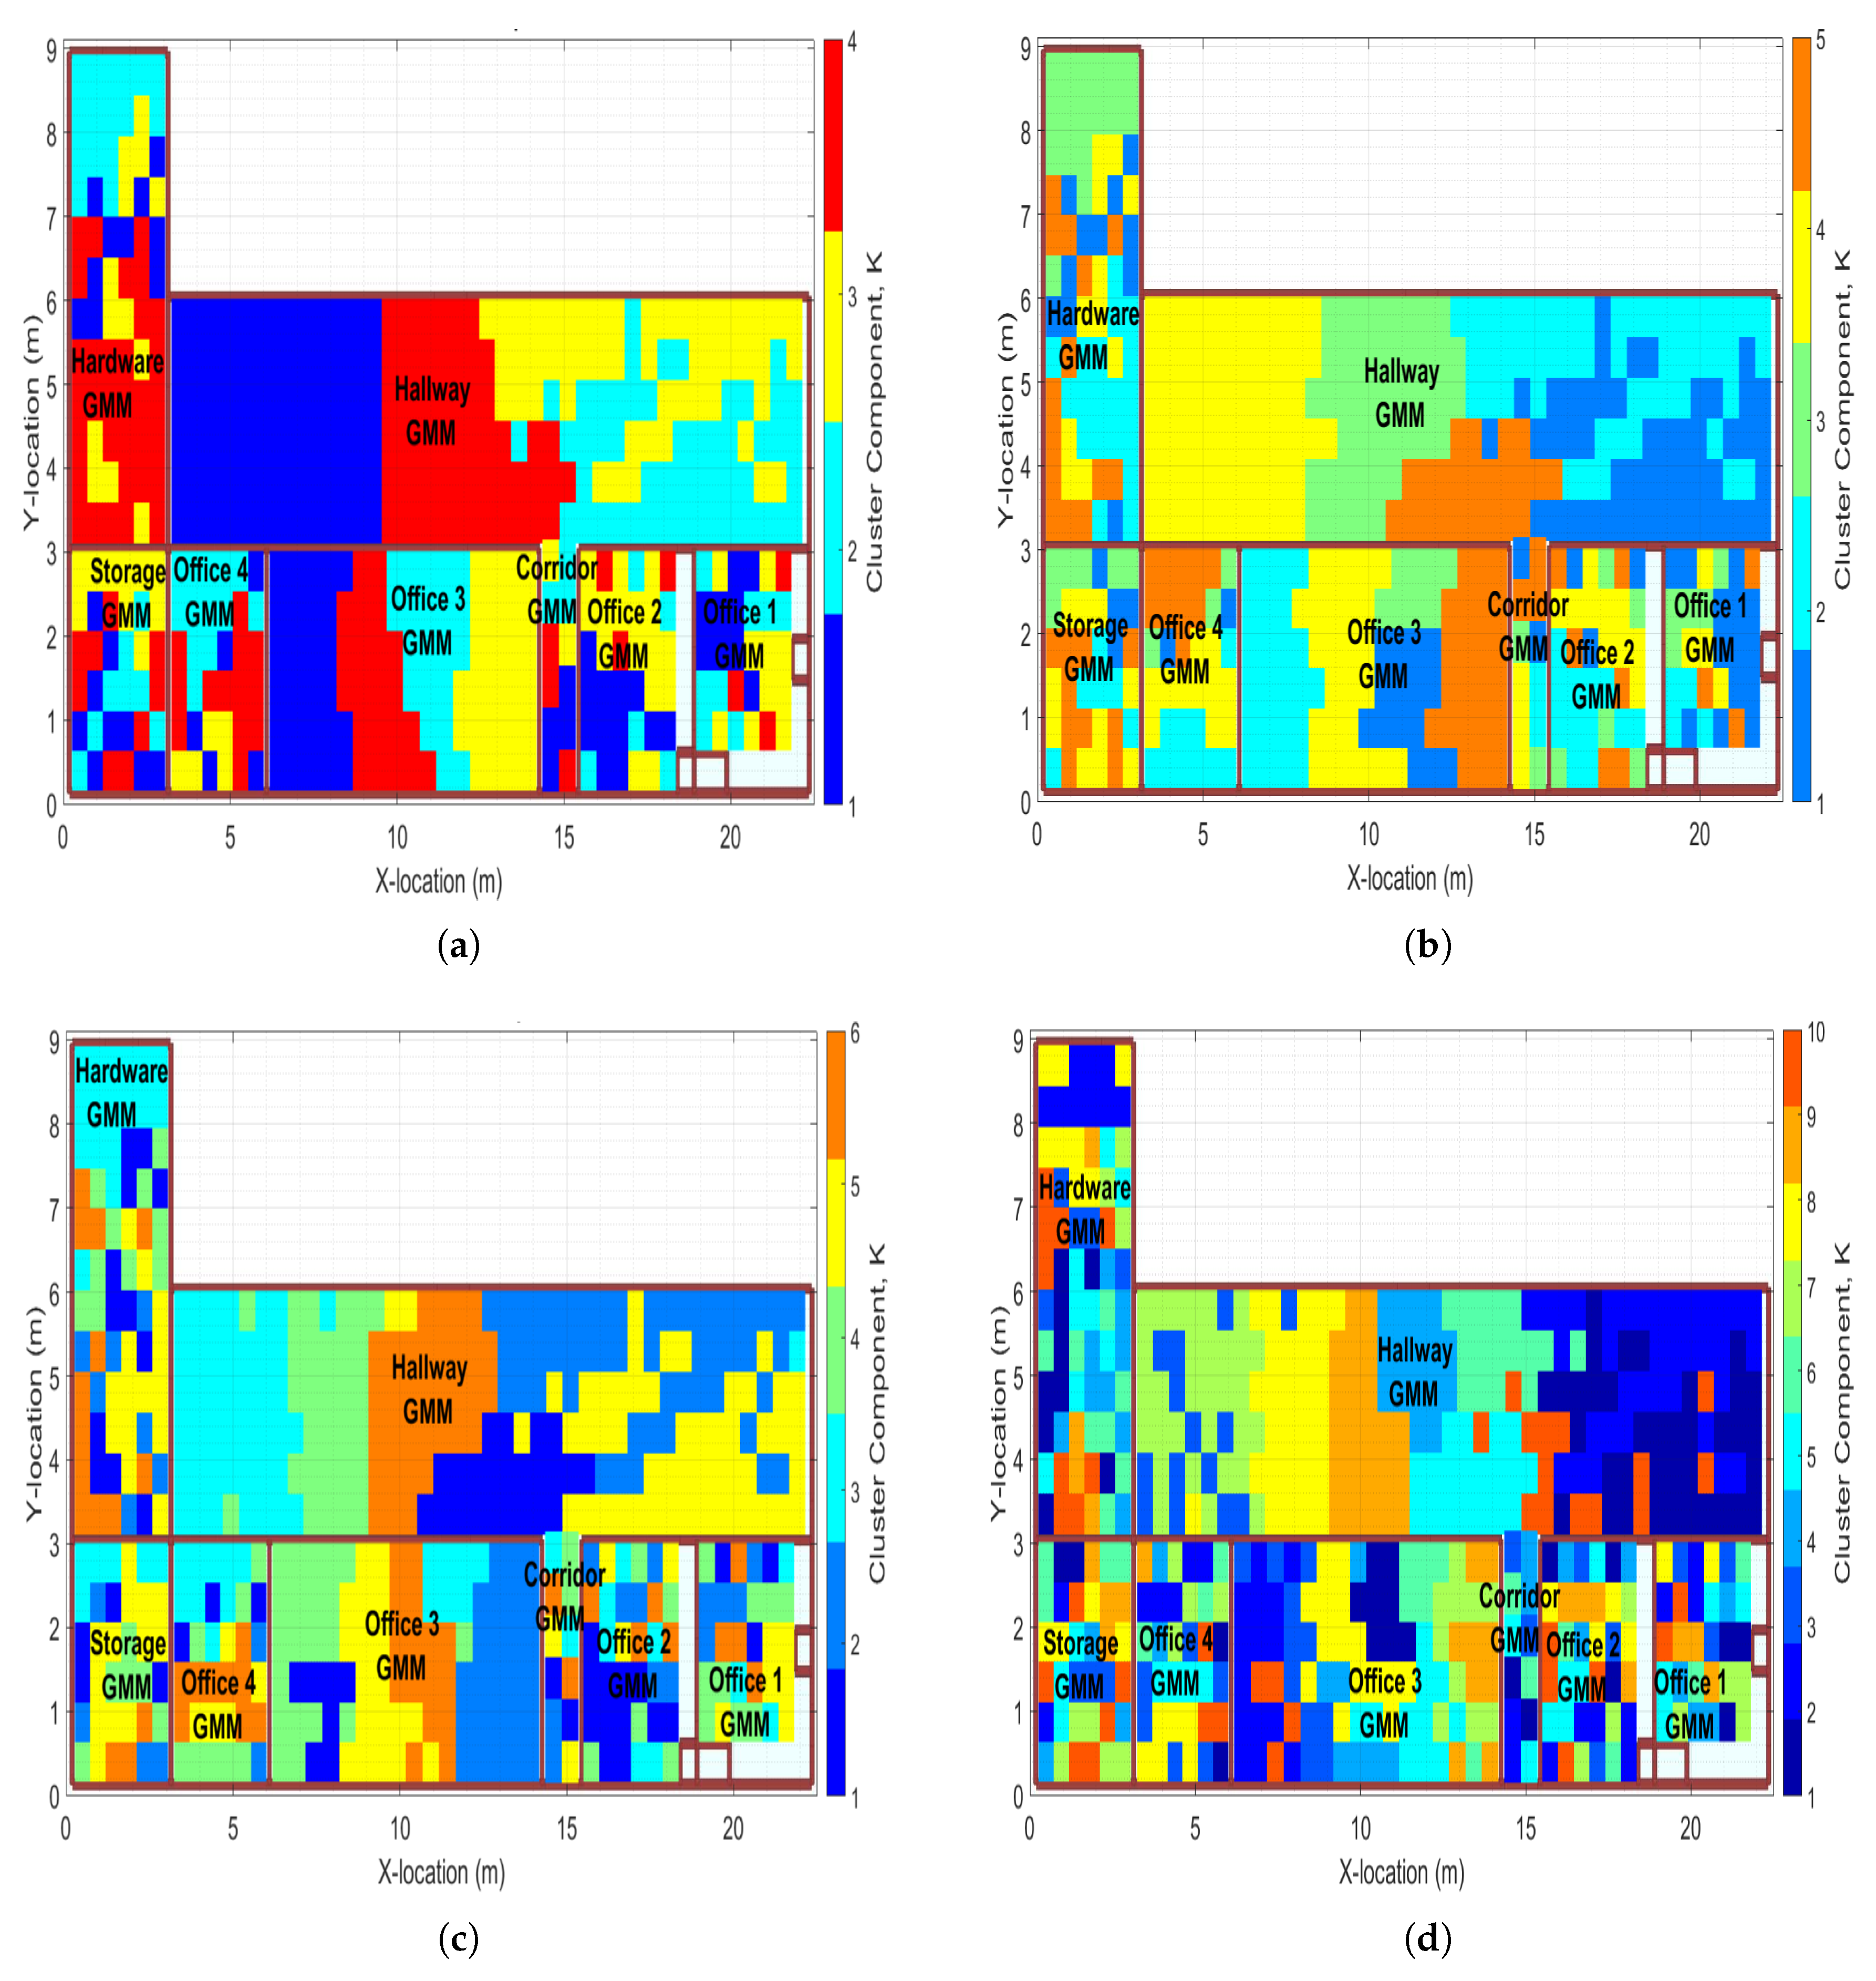
After creating a distinct GMM per room for various K clustering components, location assignment is performed based on the covariance matrix from the GMM model such that feature vectors located in similar clusters are assigned a specific k value [ 1 , K ] . For instances, where feature vectors were located on GMM contours of uncertain covariance relationship, a K-means algorithm is invoked to assign the feature vector to a specific mixture in the GMM. The K-means algorithm is used to arrive at clusters by assigning a component, k, to data points that are close in feature space distance similar to K-Nearest-Neighbor (KNN) classification. The notion of assigning a cluster component, k, to a data point is intuitively found by evaluating the K clusters built of centralized mean values, μ k , that denotes the mean of the k t h cluster in the GMM model. The K-means algorithm describes a ‘hard assignment’ of data point x n to one distinct cluster based on the sum of squares distance measure. The approach is only employed when the GMM gives uncertain probabilities to CSI and DoA feature vectors. The results of the RoI localization based on GMM and K-means are shown in Figure 8. The results depict correlated locations on a per-room basis.
The results demonstrate the ability of the GMM to perform RoI localization for various K clustering components. It is evident that the GMM allows the TDVS to localize emitters to smaller regions within each room depending on the order of K. The GMM offers the ability to localize the non-cooperative emitter to specific regions on a per-room basis, with optimal RoI localization in rooms such as the Hallway and Office #3. As the emitter resides in rooms that resemble NLoS signal characteristics, the GMM begins to cluster the locations with respect to the multipath channel information (i.e., locations with similar multipath phenomena and scattering characteristics). Thus, the GMM can be fine-tuned to meet the end-user’s application needs when performing RoI localization with the TDVS receiver.

6. Conclusions

Conventional indoor device localization methods exploit characteristics regarding signal properties based on RSS owing to ease of implementation in pre-existing infrastructures. In certain cases, however, the ability to localize non-cooperative signals may become a priority and multi-sensor or multi-receiver systems may not be readily available. Therefore, it is imperative to construct single receiver systems that can obtain high localization accuracies for estimating the positions of non-cooperative transmitters to improve wireless security in cases where only one receiver is available.
This work encompassed the development of a vector sensor for acquiring 3D received signal properties that are exploited by machine learning methodologies to perform room localization based on the short-time Fourier transform and the wavelet transform. The results in the simulation stage revealed that the proposed algorithm grants higher room localization performance than RSS, ToA, DoA regardless of the non-cooperative emitter’s polarization. Further verification via experimentation revealed room localization accuracies above 90 % for two common wideband and narrowband wireless communication signals modeled as non-cooperative transmissions.
A second simulation evaluated the ability of the TDVS to perform RoI localization within each room to explore the idea of cascading a room estimate with a definitive location where the transmitter resides. The approach leveraged a GMM to perform probabilistic clustering on CSI and DoA feature vectors obtained from trigonometric properties of the TDVS along with a developed algorithm for blind channel identification. The results indicate that the GMM is capable of obtaining fine-grained RoI location estimates in rooms that are in line-of-sight with the TDVS. In rooms that are in non-line-of-sight with the TDVS, the GMM clusters the spatial CSI and DoA features based on multipath channel characteristics measured by the TDVS. Nevertheless, the procedure can be effective in multipath environments and can perform highly accurate room localization regardless of the signal type and polarization, granting a new method of performing non-cooperative device localization in indoor environments with a single receiver.
The implementation of the TDVS, as shown in this work, improves indoor localization of single receiver systems through antenna diversity and its ability to effectively acquire 3D wireless channel characteristics of an impinging waveform. This specific design is the first attempt at using vector sensing methodologies in the field of indoor localization and serves as a novel contribution as it can be used as a benchmark for future research in the field of machine learning and indoor positioning. It has been shown that RSS alone is greatly inferior to 3D RSS extracted from signals received by the TDVS antenna when used with simplistic machine learning models such as the WKNN. It has also been demonstrated, both synthetically and experimentally, that the TDVS and STFT/WT fingerprints can achieve high-precision room localization performance without the need to use more than one sensor or complex machine learning algorithms. Thus, the TDVS allows for new research to be formulated and addressed in the field of indoor localization of non-cooperative emitters as this work demonstrates the opportunistic results that can be obtained by assessing the 3D wireless channel properties of a received communications waveform.

Author Contributions

D.L.H. performed the simulations and experiments and wrote the first draft of the paper; R.M.N. supervised the research and assisted in the signal processing; E.H.L. suggested the idea of using the vector sensor and helped with the electromagnetic formulation; D.M.J. provided assistance with the classification algorithms; all authors participated in refining the paper.

Funding

This research was funded by The Pennsylvania State University Applied Research Laboratory under the Walker Fellowship program.

Conflicts of Interest

The authors declare no conflict of interest.

Abbreviations

The following abbreviations are used in this manuscript:
CSIChannel State Information
DoADirection of Arrival
GMMGaussian Mixture Model
GSMGlobal System for Mobile Communication
LDALinear Discriminant Analysis
LoSLine-of-Sight
MCMAModified Constant Modulus Algorithm
NLoSNon-Line-of-Sight
NRZNon-Return-to-Zero
PCAPrincipal Component Analysis
RoIRegion of Interest
RRCFRoot-Raised-Cosine Filter
RSSReceived Signal Strength
STFTShort-Time Fourier Transform
TDVSTriad Dipole Vector Sensor
ToATime of Arrival
UMTSUniversal for Mobile Telecommunications System
WCDMAWideband Code Division Multiple Access
WKNNWeighted K-Nearest-Neighbor
WTWavelet Transform

References

  1. Aly, H.; Youssef, M. An analysis of device-free and device-based WiFi-localization systems. Int. J. Ambient. Comput. Intell. 2014, 6, 1–19. [Google Scholar] [CrossRef]
  2. Roos, T.; Myllymäki, P.; Tirri, H.; Misikangas, P.; Sievänen, J. A probabilistic approach to WLAN user location estimation. Int. J. Wirel. Inf. Netw. 2002, 9, 155–164. [Google Scholar] [CrossRef]
  3. Guo, L.; Wang, L.; Liu, J.; Zhou, W. A survey on motion detection using WiFi signals. In Proceedings of the 12th IEEE International Conference on Mobile Ad-Hoc and Sensor Networks (MSN), Hefei, China, 16–18 December 2016; pp. 202–206. [Google Scholar] [CrossRef]
  4. Xiao, F.; Guo, Z.; Zhu, H.; Xie, X.; Wang, R. AmpN: Real-time LOS/NLOS identification with WiFi. In Proceedings of the IEEE International Conference on Communications (ICC), Paris, France, 21–25 May 2017. [Google Scholar] [CrossRef]
  5. Wu, C.; Yang, Z.; Xiao, C. Automatic radio map adaptation for indoor localization using smartphones. IEEE Trans. Mob. Comput. 2018, 17, 517–528. [Google Scholar] [CrossRef]
  6. Zou, H.; Zhou, Y.; Jiang, H.; Huang, B.; Xie, L.; Spanos, C. Adaptive localization in dynamic indoor environments by transfer kernel learning. In Proceedings of the 2017 IEEE Wireless Communications and Networking Conference (WCNC), San Francisco, CA, USA, 19–22 March 2017. [Google Scholar] [CrossRef]
  7. Ghosh, D.; Roy, P.; Chowdhury, C.; Bandyopadhyay, S. An ensemble of condition based classifiers for indoor localization. In Proceedings of the IEEE International Conference on Advanced Networks and Telecommunications Systems (ANTS), Bangalore, India, 6–9 November 2016. [Google Scholar] [CrossRef]
  8. Bulten, W.; Rossum, A.C.V.; Haselager, W.F.G. Human SLAM, indoor localisation of devices and users. In Proceedings of the 1st IEEE International Conference on Internet-of-Things Design and Implementation (IoTDI), Berlin, Germany, 4–8 April 2016; pp. 211–222. [Google Scholar] [CrossRef]
  9. Youssef, M.; Agrawala, A.K. The Horus location determination system. Wirel. Netw. 2008, 14, 357–374. [Google Scholar] [CrossRef]
  10. Wang, X.; Gao, L.; Mao, S. CSI phase fingerprinting for indoor localization with a deep learning approach. IEEE Internet Things J. 2016, 3, 1113–1123. [Google Scholar] [CrossRef]
  11. Zhu, D.; Pang, N.; Li, G.; Liu, S. WiseFi: Activity localization and recognition on commodity off-the-shelf WiFi devices. In Proceedings of the 2016 IEEE 18th International Conference on High Performance Computing and Communications; IEEE 14th International Conference on Smart City; IEEE 2nd International Conference on Data Science and Systems (HPCC/SmartCity/DSS), Sydney, NSW, Australia, 12–14 December 2016; pp. 562–569. [Google Scholar] [CrossRef]
  12. Wu, K.; Xiao, J.; Yi, Y.; Chen, D.; Luo, X.; Ni, L.M. CSI-based indoor localization. IEEE Trans. Parallel Distrib. Syst. 2013, 24, 1300–1309. [Google Scholar] [CrossRef]
  13. Mušicki, D.; Koch, W. Geolocation using TDOA and FDOA measurements. In Proceedings of the 11th IEEE International Conference on Information Fusion, Cologne, Germany, 30 June–3 July 2008. [Google Scholar]
  14. Tseng, P.-H.; Lee, K.-T. A femto-aided location tracking algorithm in LTE-A heterogeneous networks. IEEE Trans. Veh. Technol. 2017, 66, 748–762. [Google Scholar] [CrossRef]
  15. Lin, D.-B.; Juang, R.-T. Mobile location estimation based on differences of signal attenuations for GSM systems. IEEE Trans. Veh. Technol. 2005, 54, 1447–1454. [Google Scholar] [CrossRef]
  16. Van Doorn, E.; Bhat, A.; Lonske, B.; Guo, Z.; Hovareshti, P.; Gaddam, S. Time Difference of Arrival System for Cell Phone Localization in Correctional Facilities; Final Report on National Institute of Justice, Contract No. # 2011-IJ-CX-K002; U.S. Department of Justice: Washington, DC, USA, 2015; 72p.
  17. Tzoreff, E.; Bobrovsky, B.Z.; Weiss, A. Single receiver emitter geolocation based on signal periodicity with oscillator instability. IEEE Trans. Signal Process. 2014, 62, 1377–1385. [Google Scholar] [CrossRef]
  18. O’Connor, A.; Setlur, P.; Devroye, N. Single-sensor RF emitter localization based on multipath exploitation. IEEE Trans. Aerosp. Electron. Syst. 2015, 51, 1635–1651. [Google Scholar] [CrossRef]
  19. Narayanan, R.M.; Phelan, B.R.; Lenzing, E.H. Source geolocation in urban environments using multipath fingerprinting. Int. J. Antennas Propag. 2015, 2015, 453157. [Google Scholar] [CrossRef]
  20. Zou, Y.; Wan, Q. Emitter source localization using time-of-arrival measurements from single moving receiver. In Proceedings of the 2017 IEEE International Conference on Acoustics, Speech and Signal Processing (ICASSP), New Orleans, LA, USA, 5–9 March 2017; pp. 3444–3448. [Google Scholar] [CrossRef]
  21. Daldorff, L.K.S.; Turaga, D.S.; Verscheure, O.; Biem, A. Direction of Arrival estimation using single tripole radio antenna. In Proceedings of the IEEE International Conference on Acoustics, Speech and Signal Processing (ICASSP), Taipei, Taiwan, 19–24 April 2009; pp. 2149–2152. [Google Scholar] [CrossRef]
  22. Chen, L.; Aminaei, A.; Falcke, H.; Gurvits, L. Optimized estimation of the Direction of arrival with single tripole antenna. In Proceedings of the 2010 Loughborough Antennas & Propagation Conference, Loughborough, UK, 8–9 November 2010; pp. 93–96. [Google Scholar] [CrossRef]
  23. Compton, R.T. The tripole antenna: An adaptive array with full polarization flexibility. IEEE Trans. Antennas Propag. 1981, 29, 944–952. [Google Scholar] [CrossRef] [Green Version]
  24. Lundback, J.; Nordebo, S. Analysis of a tripole array for polarization and direction of arrival estimation. In Proceedings of the 2004 IEEE Sensor Array and Multichannel Signal Processing Workshop Proceedings, Barcelona, Spain, 18–21 July 2004; pp. 284–288. [Google Scholar] [CrossRef]
  25. Zhang, T.; Jia, Y.; Jiang, W.; Gao, J.; Yan, S.; Meng, H. Wireless indoor localization based on multispectral waterfall maps. In Proceedings of the 2014 XXXIth URSI General Assembly and Scientific Symposium (URSI GASS), Beijing, China, 16–23 August 2014. [Google Scholar] [CrossRef]
  26. Tarzia, S.P.; Dinda, P.A.; Dick, R.P.; Memik, G. Indoor localization without infrastructure using the acoustic background spectrum. In Proceedings of the 9th ACM International Conference on Mobile Systems, Applications, and Services (MobiSys’11), New York, NY, USA, 28 June–1 July 2011; pp. 155–168. [Google Scholar] [CrossRef]
  27. Leong, S.; Zheng, Y.R.; Xiao, C. Space-time fading correlation functions of a 3-D MIMO channel model. In Proceedings of the 2004 IEEE Wireless Communications and Networking Conference, Atlanta, GA, USA, 21–25 March 2004; pp. 1127–1132. [Google Scholar] [CrossRef]
  28. Durgin, G.D. Space-Time Wireless Channels, 1st ed.; Prentice Hall Press: Upper Saddle River, NJ, USA, 2002; ISBN 978-0130656476. [Google Scholar]
  29. Thompson, R.; Cetin, E.; Dempster, G. Unknown source localization using RSS in open areas in the presence of ground reflections. Proceedings of 2012 IEEE/ION Position, Location, and Navigation Symposium, Myrtle Beach, SC, USA, 23–26 April 2012; pp. 1018–1027. [Google Scholar] [CrossRef]
  30. Mallat, S. A Wavelet Tour of Signal Processing: The Sparse Way, 3rd ed.; Academic Press, Inc.: Burlington, MA, USA, 2008; ISBN 978-0123743701. [Google Scholar]
  31. Najmi, A.; Sadowsky, J. The continuous wavelet transform and variable resolution time-frequency analysis. Johns Hopkins APL Tech. Dig. 1997, 18, 134–140. [Google Scholar]
  32. Bishop, C.M. Pattern Recognition and Machine Learning; Springer: Berlin, Germany, 2016; ISBN 978-0387310732. [Google Scholar]
  33. Turk, M.; Pentland, A. Eigenfaces for recognition. J. Cognit. Neurosci. 1991, 3, 71–86. [Google Scholar] [CrossRef] [PubMed]
  34. Duda, R.O.; Hart, P.E.; Stork, D.G. Pattern Classification, 2nd ed.; Wiley-Interscience: New York, NY, USA, 2001; ISBN 978-0471056690. [Google Scholar]
  35. Oh, K.N.; Chin, Y.O. Modified constant modulus algorithm: blind equalization and carrier phase recovery algorithm. In Proceedings of the 1995 IEEE International Conference on Communications, Seattle, WA, USA, 18–22 June 1995; pp. 498–502. [Google Scholar] [CrossRef]
  36. Xiao, C.; Wu, J.; Leong, S.; Zheng, Y.R.; Letaief, K.B. A discrete-time model for triply selective MIMO Rayleigh fading channels. IEEE Trans. Wirel. Commun. 2004, 3, 1678–1688. [Google Scholar] [CrossRef]
  37. Van der Maaten, L.; Hinton, G. Visualizing data using t-SNE. J. Mach. Learn. Res. 2008, 9, 2579–2605. [Google Scholar]
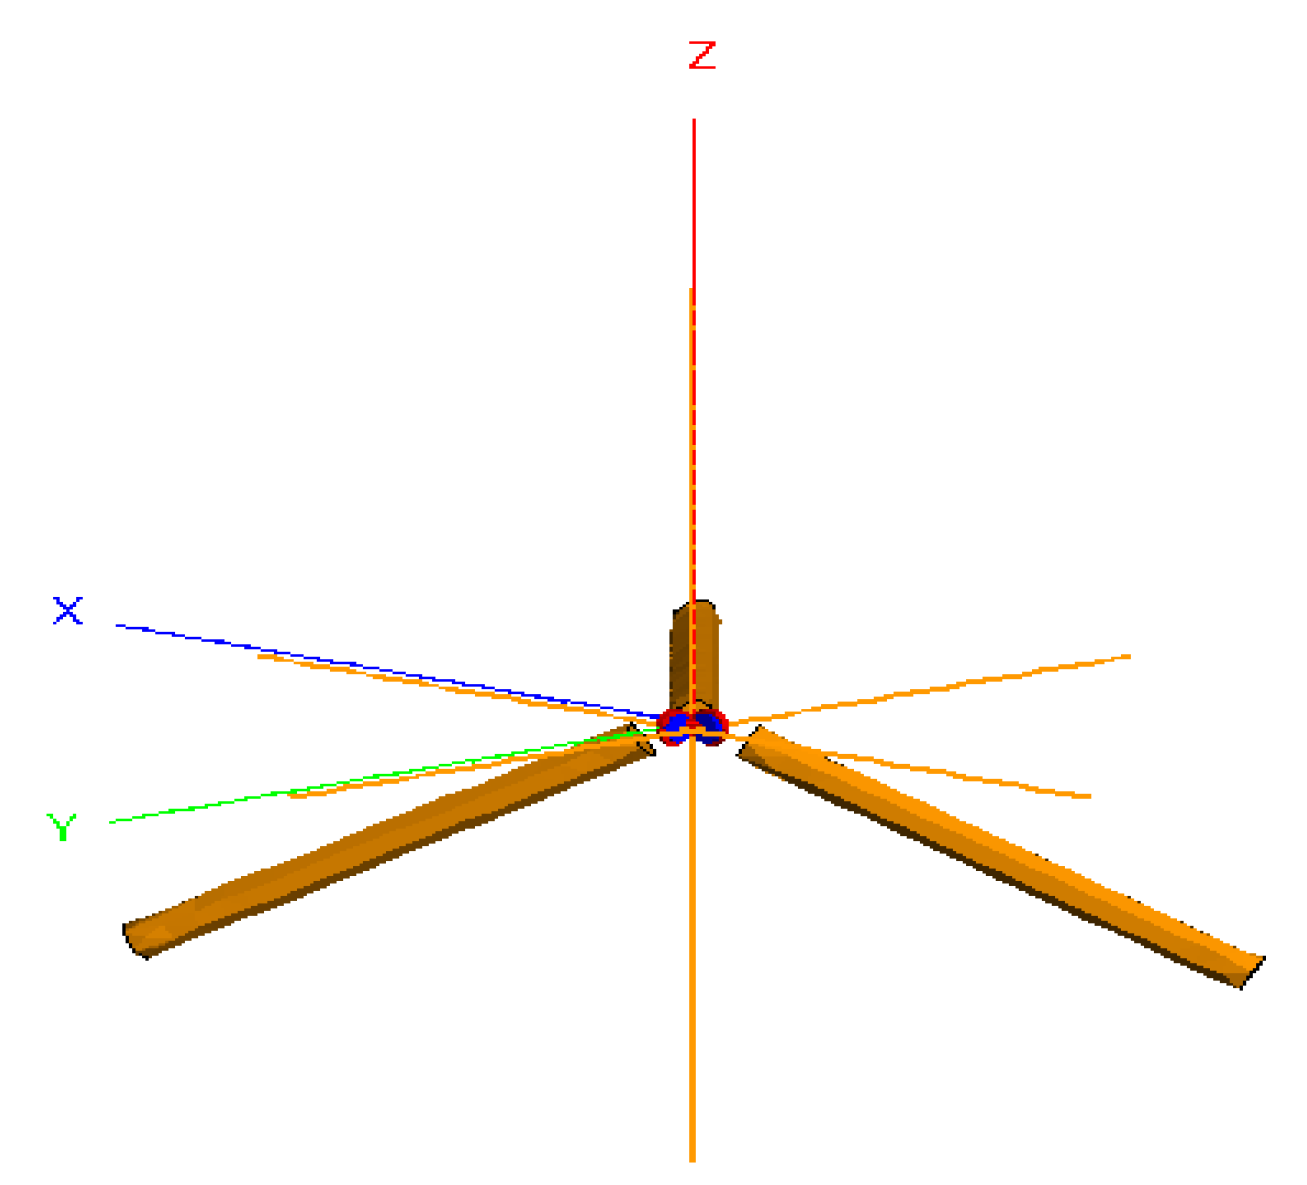
Figure 1. FEKO ® model of the Triad Dipole Vector Sensor (TDVS) with three-orthogonally co-located half-wave dipole elements and three copper baluns oriented 45 away from the radiating elements to minimize coupling effects.
Electronics 07 00442 g001
Figure 2. Simulated indoor environment and demonstration of different signal paths emitted from a non-cooperative Universal for Mobile Telecommunications System (UMTS) emitter in Office #1. (a) Plan View, (b) Perspective View.
Electronics 07 00442 g002
Figure 3. Room localization performance as a function of increased Weighted K-Nearest-Neighbor (WKNN) training percentages for both vertically and horizontally polarized UMTS non-cooperative emissions. (a) Vertical UMTS Transmitter, (b) Horizontal UMTS Transmitter
Electronics 07 00442 g003
Figure 4. Experimental configuration. (a) TDVS, (b) Mount/Receiver Setup, (c) LNA-BPF, (d) Transmit/Receive.
Electronics 07 00442 g004
Figure 5. STFT-generated fingerprints recorded by the TDVS from one non-cooperative emitter location inside each room of the indoor environment.
Electronics 07 00442 g005
Figure 6. Misclassification of the WKNN as a function of varying SNR for both GSM and UMTS non-cooperative emissions. (a) GSM, (b) UMTS.
Electronics 07 00442 g006
Figure 7. Gaussian mixture models and the corresponding probability contours of CSI and DoA feature vectors in the Hallway area of the simulated indoor environment. (a) Hallway GMM with four clusters, (b) Hallway GMM with five clusters, (c) Hallway GMM with six clusters, (d) Hallway GMM with 10 clusters.
Electronics 07 00442 g007
Figure 8. GMM results for region of interest (RoI) localization of non-cooperative emitters with respect to various K clustering components. (a) RoI with four clusters, (b) RoI with five clusters, (c) RoI with six clusters, (d) RoI with 10 clusters.
Electronics 07 00442 g008
Table 1. Parameters Defined in the Wireless InSite ® Simulation.
ParametersConventionalProposed
Reflections55
Diffractions11
Propagation Paths2525
Signal TypeUMTSUMTS
Carrier Frequency ( f c ) 831.86 MHz831.86 MHz
Bandwidth (BW)4.68 MHz4.68 MHz
Sampling Frequency ( f s ) 20 f c 20 f c
Filter Roll-Off0.220.22
Transmitter PolarizationVertical & HorizontalVertical & Horizontal
Receiver PolarizationVerticalVertical
AntennaDipole3-Element Vector Sensor
Output FeaturesRSS, ToA, DoA3D Received Signal, y ( t ; x , y , z )
WKNN Neighbors55
STFT Window-Hamming
WT Wavelet-Morlet
Principal Components-5 (85% Total Variance)
Linear Discriminants-7 ( c 1 )
Table 2. Experimental WKNN Room Localization Performance for UMTS and Global System for Mobile Communication (GSM) Non-Cooperative Emitters.
Room Localization Performance
Net.: Pol.ApproachHardwareStorageHallwayOffice #4Office #3CorridorOffice #2Office #1Overall
GSM: VSTFT98.77%98.75%99.21%99.27%98.80%98.25%99.85%99.83%99.01%
WT74.04%79.80%92.51%77.65%85.47%76.01%83.67%82.81%81.49%
RSS28.85%56.05%47.93%16.91%23.08%21.65%13.95%23.63%25.25%
GSM: HSTFT98.98%97.45%98.43%97.29%99.30%99.69%98.64%98.90%98.58%
WT70.47%71.31%91.81%79.87%90.44%85.62%81.16%79.43%81.26%
RSS17.24%14.50%39.35%8.20%37.23%16.75%16.51%22.82%21.58%
UMTS: VSTFT94.21%92.83%96.60%92.33%96.31%96.74%94.35%93.75%94.64%
WT81.92%74.71%98.63%86.67%97.43%96.09%85.90%86.73%88.51%
RSS31.07%23.92%42.97%14.89%30.04%12.70%19.96%31.65%25.90%
UMTS: HSTFT87.48%88.69%93.82%89.88%90.50%89.22%89.39%91.17%90.01%
WT74.83%78.81%95.83%82.63%91.75%79.18%79.75%83.97%83.30%
RSS20.07%18.38%37.08%12.05%29.55%11.80%15.82%21.17%20.74%
Table 3. Experimental WKNN Room Localization Performance for 3D RSS.
Room Localization Performance
Net.: Pol.ApproachHardwareStorageHallwayOffice #4Office #3CorridorOffice #2Office #1Overall
GSM: VRSS 3 D 82.41%89.74%89.34%90.46%94.72%95.77%84.89%90.58%89.74%
GSM: H66.70%85.86%84.78%69.51%80.19%65.53%89.02%78.28%77.61%
UMTS: V80.03%86.84%86.32%70.40%81.32%68.70%67.20%72.49%76.67%
UMTS: H73.54%59.30%82.92%58.49%63.70%68.45%65.85%60.65%66.63%