Abstract
Reusing the retired lithium-ion batteries from electric vehicles can generate considerable economic benefits. In this paper, a novel screening method based on partial discharge curves using a genetic algorithm and back-propagation (GA-BP) neural network for the retired cells is proposed. First, the discharge curves of the retired cells with different aging degrees were investigated. Based on this, the calculation method of internal resistance of retired cells was developed. Second, a novel capacity screening model based on a partially discharging process using a GA-BP model was proposed. In this model, the capacity and discharge characteristic data of a small number of sample cells were selected to train the capacity model using GA-BP, and the capacity of a large number of the remaining unsampled cells was estimated using the trained capacity model. Third, the screening simulation model with 108 retired cells was established, and the simulation results showed the effectiveness and rapidity of our proposed method. Finally, experimental verification was performed on the 20 retired cells with different aging degrees. The results showed that our proposed method is feasible, and the maximum error of capacity estimation was 2.951%.
1. Introduction
Electric vehicles (EVs) are of great significance for reducing dependence on foreign oil and emissions of greenhouse gases. Therefore, EVs are expected to gain a significant market share in the next few decades [1,2,3,4]. Lithium-ion batteries (LIBs) are widely used in EVs for their high energy density, long service life, and environmental friendliness [5,6,7]. However, the cost of power LIBs is too high to limit the popularization of EVs. In recent years, battery manufacturers and local governments have been facing great recycling and disposal pressure from the large number of LIBs retired from EVs [8,9]. As a result, the cascade utilization of power LIBs has attracted increasing attention. In practice, LIBs retired from EVs still retain approximately 70%–80% of their initial capacity, which is sufficient for safe usage in secondary applications such as electric bicycles, excursion vehicles, low-speed EVs, smart grids, and energy storage for wind and solar power [10,11]. Through the cascade utilization of power batteries, the pressure of a large number of batteries entering the recovery stage can be alleviated. More importantly, the establishment of a power battery recycling and reuse system can effectively share the cost of EVs, which can help to promote the popularization and generalization of EVs [9,12,13]. Therefore, it is necessary to study the cascade utilization method of retired LIBs for the sustainable development of EVs.
Retired LIBs cannot be used directly in second-life applications because of their poor consistency, mainly due to inconsistencies in LIB manufacturing. More importantly, LIBs in EVs are confronted with various complex environments that result in diverse decay patterns of battery performance, thus exacerbating inconsistency among batteries. LIBs with poor consistency are easily overcharged or overdischarged [14,15], which leads to problems such as premature aging, heat runaway, and risk of explosion. Therefore, it is necessary to evaluate and screen retired EV batteries to both maximize exploitation of their residual capacity and ensure continuing safety. LIBs are prone to degradation from cycling, which leads to capacity fade and increased internal resistance [13,16]. Generally, the cascade utilization of the retired LIBs can be divided into four levels [17,18]. The first level is used in EVs when the state of health (SOH) of the LIBs ranges from 100% to 80%. The second-level battery (when SOH ranges from 80% to 50%) is applied to energy storage devices such as power grids and new energy generation. The third-level battery (when SOH ranges from 50% to 40%) is applied to low power applications. The fourth-level battery (when SOH is less than 40%) is dismantled and recycled. Therefore, SOH is the key metric in determining the application level of the retired LIBs. Capacity is a reliable index to describe the SOH in batteries [19]. If the capacity of each retired battery is directly measured, the test time is too long to be suitable for practical application. Therefore, some scholars have studied other criteria, which are often called health factors, to characterize the aging of LIBs. The widely reported health factor estimation methods [20,21,22,23] include those such as internal resistance, incremental capacity analysis, and open circuit voltage. However, the testing environment and the conditions of these methods are special and are usually completed in the laboratory. Therefore, to maximize the economic value of retired batteries, it is essential to quickly evaluate the capacity of retired batteries for practical applications.
The published studies show that most screening procedures for retired batteries are conducted at the module level. Cell-level screening is not used for several reasons, including: (1) Cells in EVs are usually connected in parallel through welding, making them inconvenient and time-consuming to disassemble, and (2) cell screening is more inefficient because it deals with large quantities. However, the screening and regrouping of LIBs at the cell level is necessary in some cases. Although the time cost of cell-level screening is increased, the flexibility of regrouping is also increased. Therefore, it is more important to improve the efficiency of the cell screening procedure. The present study focuses on approaches for rapid screening and regrouping of cells.
In this paper, a fast capacity and internal resistance screening method is proposed based on a genetic algorithm (GA) and back-propagation (BP) neural network, and the simulation and experiment results verified the rapidity and accuracy of the proposed method. The remainder of this paper is structured as follows: In Section 2, the principle and method of capacity and internal resistance is introduced. In Section 3, the simulation model is established, and the validity of the proposed method is verified by simulation results. In Section 4, the experiment results are displayed and discussed, and in Section 5, the main conclusions are summarized.
2. Methods
2.1. Fast Screening of Capacity
Theoretically, the open circuit voltage (OCV) of the echelon cells is basically the same when the state-of-charge (SOC) is 100%. If the retired cells with a SOC of 100% are discharged in a series, the terminal voltage of each cell is closely related to its SOC. The terminal voltage of a cell with a large SOC value is larger than that of a cell with a small SOC. Obviously, the capacity of the cell is equal to the sum of the SOC and the discharged electricity (Qdischar). Moreover, the Qdischar of each cell is the same due to all cells being connected in a series. Therefore, at the end of the constant current discharge, the capacity of the cell with a high SOC value is larger than that of the cell with a smaller SOC. Based on the above principle, the capacity of retired cells with an initial SOC of 100% can be fast-screened according to the relationship between the terminal voltage and the capacity of the cells at the end of discharge.
Assuming that a large number of retired cells with unknown capacity and internal resistance need to be quickly screened for capacity and internal resistance, the following screening processes were developed. First, a large number (N) of cells were selected for charging with constant current and constant voltage (CC-CV), and 100% SOC and the same OCV of each cell were obtained. Then, M cells (M <= N) were selected for series constant-current discharging. Figure 1 shows the discharging curve of M cells in the serial-discharging process. The voltage of each cell remained unchanged in the rest stage between 0 and t1. During t1 to t2, cells in a series were discharged with a constant current (1/3 C). In the discharge process, the terminal voltage of each cell continued to decrease, and the quantity of electricity also decreased. The voltage of each cell rose gradually between t2 and t3. Therefore, the voltage curves of N cells from 0 to t3 were obtained. Obviously, the terminal voltage of each cell was affected by the internal resistance during the discharging process. Finally, the residual voltage after excluding the influence of internal resistance could be described as follows:
where is the terminal voltage of cell excluding the influence of internal resistance at , and ,, and are the terminal voltage at ,, and , respectively.
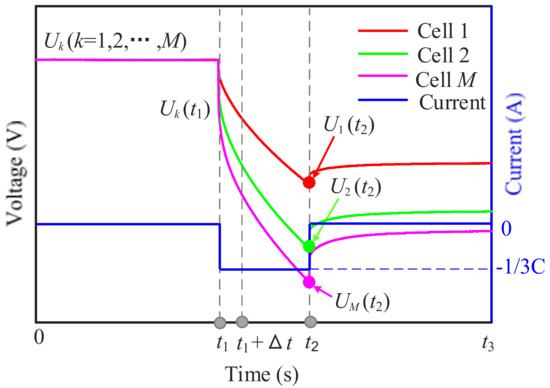
Figure 1.
Screening principle based on partially discharging curve.
We randomly chose a small number of sampled cells from the M cells for standard capacity tests, and then the screening model was established through these test data. The capacity of a large number of the remaining unsampled cells () could be indirectly screened based on the established screening model. Therefore, the most critical step in achieving fast screening was to build a capacity screening model through the measured data of a small number of sampled cells.
2.2. Fast Screening of Internal Resistance
Usually, the internal resistance of a cell is obtained using the pulse method [24,25]. As shown in Figure 1, the internal resistance can be obtained as follows:
where is the discharging internal resistance at time , and is the discharging current.
According to Equation (2), the internal resistance of all retired cells could be directly calculated by the partially discharging curve. Moreover, the fast acquisition of internal resistance also provided conditions for the fast capacity screening.
2.3. Capacity Screening Model Based on GA-BP Neural Network
In this section, a capacity screening model based on a GA-BP neural network is proposed to describe the relationship between and based on a small number of sampled cells. A BP neural network is the most widely used artificial neural network. The structure of a BP neural network is composed of input layers, hidden layers, and output layers. The neural network is trained to set all weights before it can be used for forecasting. The initial weights are randomly set. The weights are modified according to the differences between output data and desired data in the backward process. This is repeated until the difference between the output data and the desired data is small enough.
Although a BP neural network can obtain the final convergence, the time of learning and training is very long, and it may converge to local optimization. To solve this intractable problem, in our study an improved BP neural network is proposed by adding GA, which is called a GA-BP neural network. A GA is a powerful stochastic algorithm based on the theory of evolution, and it imitates genetic inheritance in biology (i.e., it follows the law of natural selection and survival of the fittest). GA starts with an initial set of random solutions called a population, and each individual in the population is called a chromosome. The fitness of each chromosome is evaluated according to the objective function. After a series of operations including selection, crossover, and mutation, chromosomes with lower fitness are eliminated, and a new population is obtained. These operations are repeated until the chromosome can satisfy certain criteria.
The schematic of a GA-BP neural network is shown in Figure 2. The training started with GA, which performed a global search on weight ranges and found out the best initial weights for the BP neural network. Then, the BP neural network started the training process with the best initial weights provided by GA and pursued the optimum solution. Our study employed a three-layer BP neural network model. The first layer was the input layers to characterize the input variables, the second layer comprised one hidden layer, and the third layer was the output layer to characterize the output variables. The detailed steps could be described as follows.
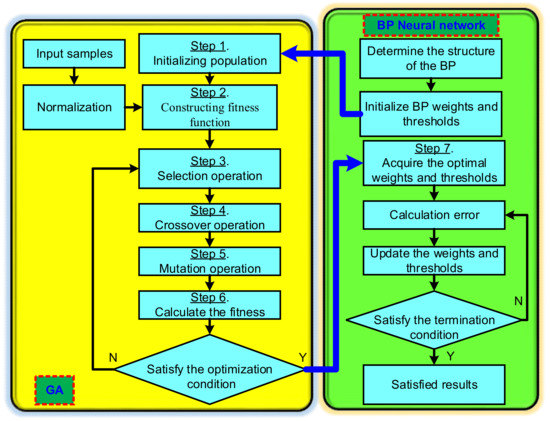
Figure 2.
Schematic of a genetic algorithm and back-propagation (GA-BP) neural network.
Step 1. Initializing the population, where each individual was composed of four parts: The connection weight between the input layer and the hidden layer (), the threshold of the hidden layer (), the connection weight between the hidden layer and the output layer (), and the threshold of the output layer ().
Step 2. Constructing the fitness function: The absolute value of the error between the predicted output and the expected output of the BP neural network was used as the individual fitness function. It could be expressed as follows:
where is the fitness function, is the number of network output nodes, is the expected output of the BP neural network at node , is the predicted output of the BP neural network at node , and is a coefficient.
Step 3. Fitness proportionate selection: A roulette wheel selection method was used to determine the choice probability of the individual. If is the fitness of individual in the population, its probability of being selected () could be expressed as follows:
where N is the number of individuals in the population.
Step 4. Cross operation, where the crossover of the chromosome and the chromosome in position was as follows:
where b is a random number between 0 and 1.
Step 5. Mutation operation: The jth gene from the ith individual () was selected for mutation. The mutation method was as follows:
where and are the upper bound and lower bound of , respectively, is a random number, is the current number of iterations, and is the largest number of evolutions.
Step 6. We decoded the gene codes of the above weight and threshold and brought them into Equation (3) to determine whether the evolution satisfied the end conditions. If it obtained the optimal weights and thresholds, it went to Step 7. If not, it returned to Step 3.
Step 7. Updating weights and thresholds of the neural network obtained by GA: In this three-layer BP neural network, the number of the hidden layer node was 4, the learning rate was 0.1, the number of the iteration was 100, and a sigmoid function was used for the node transfer function. The detailed descriptions about BP neural network are not listed here for brevity, but can be found in References [26,27,28].
3. Simulation
3.1. Simulation Model
In this study, we implemented a second-order resistor-capacitor (2RC) model to simulate the dynamic characteristics of the LIB [5]. As shown in Figure 3, is the equivalent Ohmic resistance, is the voltage source, and are the diffusion resistances, and and are diffusion capacitances. The terminal voltages of the two series-connected RC circuits are denoted by and , the current is denoted by I, and the terminal voltage is denoted by . Based on the circuit principle, the discretization equations of the 2RC model could be expressed as:
where and are time constants (, ), and is the sampling period, which was set to 1 s in this study.
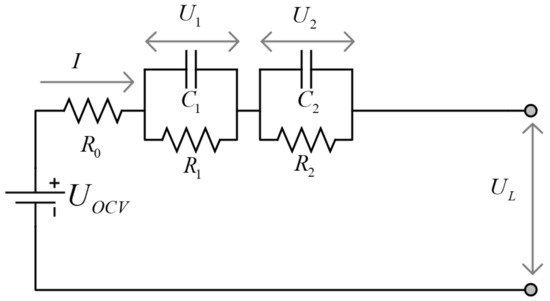
Figure 3.
Model structure of second-order resistor-capacitor (2RC).
Figure 4 shows the basic structure of the simulation model. The established model included the 2RC model, the thermal model, the capacity loss model, the coulomb efficiency model, and the internal resistance model. These models are described as follows.
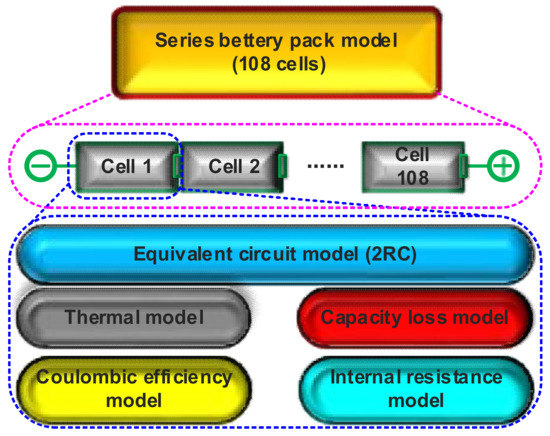
Figure 4.
Structure of simulation model.
The performance of LIBs is greatly affected by temperature. When the temperature decreases, the diffusion rate of Li-ion in the electrode decreases, and the internal resistance of LIBs increases, which results in the increase of the Joule heat of internal resistance during discharge. Therefore, it is necessary to consider the influence of temperature on the battery in modeling. The thermal model used in this paper could be expressed as [29]:
where T is the temperature of the cell, q is the heat dissipation coefficient, T0 is the ambient temperature, A is the heat dissipation area, m is the mass, and Cm is the specific heat capacity. The model is a simple description of the heat balance process of internal heat release and convection heat dissipation.
An empirical model proposed by Wang was used as a capacity loss model in this paper, which could be expressed as follows [30]:
where is the capacity loss, is the discharge rate, R is the gas constant, T is the absolute temperature, Ah is the Ah-throughput, and B is the exponential factor.
According to our previous findings [29,31,32], the coulombic efficiency model could be expressed as
where is coulombic efficiency and is the temperature coefficient.
According to Reference [33], the internal resistance model could be expressed as
where is internal resistance, is the activation energy, and is the internal resistance coefficient.
The series battery pack system (108 cells) model was established based on the above models using MATLAB. The model could be used to simulate and verify our proposed screening method. In this simulation, the simulation parameters were set as follows: The initial temperature was set to 25 °C, the initial SOC of each cell was set to 100%, the capacity of the 108 cells was randomly distributed (as shown in Figure 5a), the series constant current discharge was 11 A, and the discharge time was 10 min, as shown in Figure 5b.
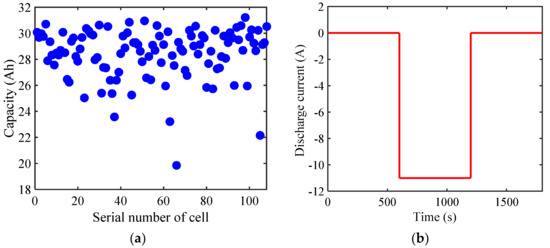
Figure 5.
Simulation parameters: (a) Real capacity of the 108 cells; (b) constant current discharge curve of series battery pack.
3.2. Simulation Results and Discussion
In this simulation, 108 cells were first rested for 10 min, then discharged for 10 min at 1/3 C, and then rested for 10 min after discharge stopped. The voltage curves of 108 cells in the discharge process are shown in Figure 6.
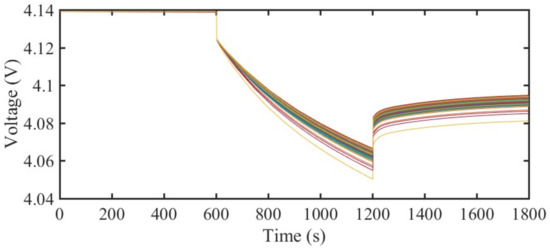
Figure 6.
Voltage curves of 108 cells.
As shown in Figure 6, the voltage of each cell remained unchanged during the rest stage (t = 0–600 s), and the voltage of each cell decreased and differentiated during the constant current discharge stage (t = 601–1200 s). At the rest stage after constant current discharge (t = 1201–1800 s), the voltage of each cell gradually increased and tended to be stable. The internal resistance and capacity of the 108 cells were screened using the above simulation results.
Figure 7 displays the calculation results of discharge internal resistance. It can be seen that the internal resistance of each cell could be calculated quickly by our proposed method, and the screening of internal resistance was very convenient.
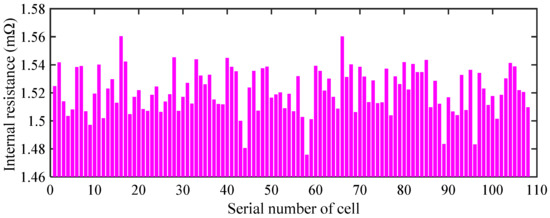
Figure 7.
Calculation results of discharge internal resistance.
Simulation verification of the capacity screening was carried out. First, was calculated through Equation (1), and the result was shown in Figure 8. Then, the voltage and capacity of 70% of the cells () were used to train the screening model using GA-BP. Finally, the capacity of the remaining 30% () of the cells was estimated by the trained screening model, and the estimated error was obtained through comparison to the real capacity. Capacity estimation results and errors are shown in Figure 9. The results showed that our proposed method is feasible and that the maximum error of capacity estimation was less than 3%.
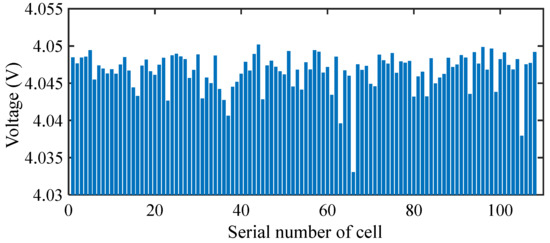
Figure 8.
Voltage distribution after excluding internal resistance ().
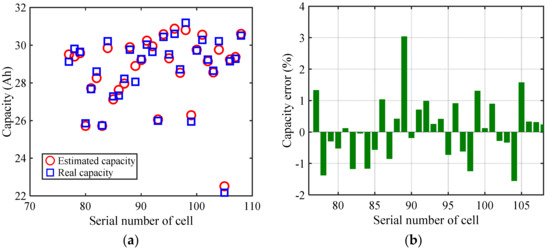
Figure 9.
Capacity estimation results: (a) Capacity; (b) capacity error.
In practice, the number of series-discharge cells could be very large. Few cells were used to train the GA-BP model, which could then be used for estimating the capacity of the remaining cells with large numbers. Therefore, the larger the number of series-discharge cells, the higher the screening efficiency was.
4. Experiment Verification and Discussion
4.1. Experiment Bench and Procedure
In this experiment, 20 cells with different aging degrees were selected as the experimental objects. The cathode materials of these cells were LiCoxNiyMn1−x−yO2, and their basic parameters are shown in Table 1. A battery test bench was established as shown in Figure 10. The battery test bench was composed of a host computer, a battery tester (NEWARE BTS-600), and a temperature chamber. The host computer was used for online experiment control and data recording. The battery tester was used to load the battery with constant or dynamic current profiles, and the temperature chamber was used to provide temperatures for the cells.

Table 1.
Main parameters of the test cell.
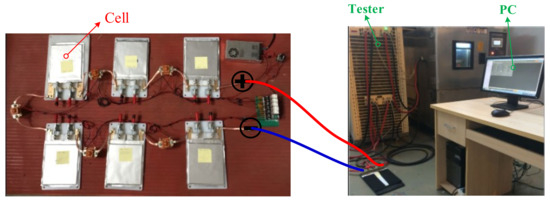
Figure 10.
Schematic of the battery test bench.
The experimental steps were as follows.
- Twenty cells (numbered Cell 1–Cell 20) were charged to SOC 100% and then rested for 10 min.
- Twenty cells were installed in the battery test bench. Since the battery test system could only install six cells at a time, we divided the above 20 cells into four groups, six cells in each group from the first to the third and two cells in the fourth. Series constant current discharge was carried out for each group.
- Each group of cells were discharged in series at a constant current of 11 A (C/3). The discharge time was 10 min, and the voltage data were recorded at a frequency of 1 Hz.
- Step 3 was repeated until the discharging of four groups with 20 cells was completed.
- The internal resistance of each cell was calculated by Equation (2). Standard capacity test of all cells was performed, and was obtained by Equation (1). Then, a screening model was trained by and the of partial cells using GA-BP.
- The capacity of the remaining battery was estimated, and the estimation error was investigated using the proposed capacity screening model.
4.2. Experiment Results
Figure 11 shows the voltage curves during discharge. It can be seen that different cells had different discharge voltage curves. The main reason for this phenomenon was the inconsistency of capacity and internal resistance among cells. In this paper, the internal resistance and capacity screening of retired cells could be realized by using these curves.
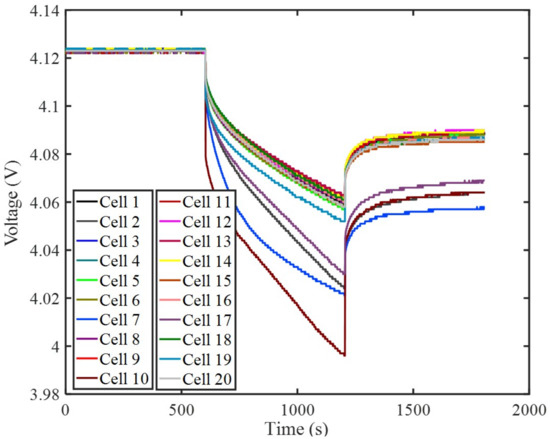
Figure 11.
Voltage curves during discharge.
The internal resistance of 20 cells could be obtained by Equation (2), and the results are listed in Table 2. According to the experiment manual, the real capacity of 20 cells could be obtained by a cyclic charging and discharging test. The test was repeated three times, and the mean value of the test capacity was chosen as the cell capacity. Table 3 lists the test capacity of 20 cells. These test data could be used to train the model and verify the proposed method.
Table 2.
Internal resistance of 20 cells (mΩ).
Table 3.
Test capacity of 20 cells (Ah).
4.3. Experiment Verification of Capacity Screening
The voltage values of each cell after excluding internal resistance at 1200 s () were obtained. The results are shown in Table 4. We selected 14 cells (Cell 1–Cell 14) to train the capacity screening model, then used the model to estimate the capacity of the remaining six cells (Cell 15–Cell 20) and compared it to the test capacity to investigate the estimation error. The results are shown in Figure 12.
Table 4.
of 20 cells.
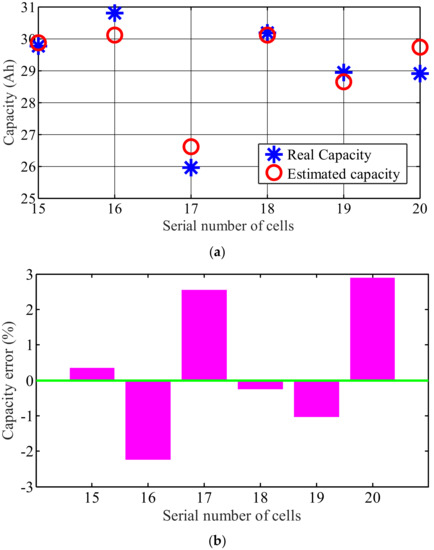
Figure 12.
Estimated results: (a) Capacity estimation results; (b) estimation error.
Figure 12 shows that the screening model based on GA-BP could accurately screen the capacity of retired cells. The maximum error was 2.951%, and the minimum error was 0.1691%. In practical applications, we could select the measured data of a small number of cells to train the screening model, and then the capacity of the remaining large number of cells could be screened through the trained model.
Traditional cell capacity screening requires repeated charging and discharging tests on each cell, so the test time is very long. For example, the cell with a capacity of 32 Ah used in this experiment needed at least three hours to discharge from 100% SOC to 0% SOC at 1/3 C. Therefore, the more the retired cell, the longer the test time. For our proposed method, it only took 10 minutes to train the screening model for the cells with 100% SOC. The capacity of a large number of cells could be estimated very fast using our trained model. Note that the proposed method and the traditional method need to first charge the cells to 100% SOC, but our method only needed to discharge 10 minutes to complete the capacity screening. Moreover, the trained model could not only screen the series cells with the same batch, but could also screen the series cells with other batches. Therefore, the screening efficiency was greatly improved.
Taking the experiment cells as an example, we selected 100, 300, and 500 cells to compare the screening efficiency of the traditional screening method and our proposed screening method. Since all retired cells in the two methods needed to be charged to 100% SOC from the initial state, the time of this process was not counted and compared. Moreover, 10 charging and discharging devices were used for screening, and the charging and discharging currents were set to 1/3 C. The comparison results are shown in Table 5. It can be seen that when the number of screening cells was 100, the screening time of our proposed method was only 55.56% of that of the traditional method, and when the number of the retired cells was 500, the screening time of our proposed method was only 17.78% of that of the traditional method. Obviously, the greater the number of screened cells, the higher the screening efficiency of the proposed method.
Table 5.
Comparison of the screening time.
5. Conclusions
In this paper, a fast screening method for the retired cells was proposed based on the different discharging voltage curves of cells with different aging degrees. First, the cells were charged to 100% SOC to get the same initial state. Then the retired cells were discharged with constant currents in a series. Then, the internal resistance of the retired cells was obtained based on the discharge voltage curve. For capacity screening, we proposed a fast screening method based on a partially discharging curve. In this method, the voltage and capacity of a few cells were used to train the screening model using the GA-BP model, and then the capacity screening model was used to quickly screen the remaining cells. Finally, simulation and experiment results showed that the capacity screening time was only 10 minutes, and the maximum error of capacity estimation was 2.951%. The rapidity and accuracy of the proposed screening method were verified.
Due to the limitation of the number of retired cells, only 20 retired cells were selected for the screening experiment, resulting in a failure to highlight the screening efficiency. In practical applications, a capacity screening model could be established by selecting a small number of cells for a standard capacity test, and then a large number of cells could be screened for capacity using the GA-BP model. Therefore, the screening efficiency is very high. Finally, the screening effect of series constant current discharge at different discharge rates is future work.
Author Contributions
All authors contributed to the paper. Conceptualization, X.L. and Y.Z.; data curation, D.Q.; investigation, X.L. and W.Y.; methodology, X.L.; project administration, X.L. and Y.Z.; software, X.L.; validation, X.L. and W.Y.; writing (original draft), X.L. and D.Q.; writing (review and editing), X.L., Y.Z.
Funding
This research was funded by the National Natural Science Foundation of China (NSFC) under the grant numbers 51505290 and 51877138.
Conflicts of Interest
The authors declare no conflicts of interest.
References
- Hannan, M.A.; Lipu, M.S.H.; Hussain, A.; Mohamed, A. A review of lithium-ion battery state of charge estimation and management system in electric vehicle applications: Challenges and recommendations. Renew. Sust. Energ Rev. 2017, 78, 834–854. [Google Scholar] [CrossRef]
- Lai, X.; Jiang, C.; Zheng, Y.; Gao, H.; Huang, P.; Zhou, L. A Novel Composite Equalizer Based on an Additional Cell for Series-Connected Lithium-Ion Cells. Electronics 2018, 7, 366. [Google Scholar] [CrossRef]
- Lai, X.; Yi, W.; Zheng, Y.; Zhou, L. An All-Region State-of-Charge Estimator Based on Global Particle Swarm Optimization and Improved Extended Kalman Filter for Lithium-Ion Batteries. Electronics 2018, 7, 321. [Google Scholar]
- Lai, X.; Qin, C.; Gao, W.K.; Zheng, Y.J.; Yi, W. A state of charge estimator based extended kalman filter using an electrochemistry-based equivalent circuit model for lithium-ion batteries. Appl. Sci. 2018, 8, 1592. [Google Scholar] [CrossRef]
- Lai, X.; Zheng, Y.J.; Sun, T. A comparative study of different equivalent circuit models for estimating state-of-charge of lithium-ion batteries. Electrochim. Acta 2018, 259, 566–577. [Google Scholar] [CrossRef]
- Zheng, Y.J.; Ouyang, M.G.; Han, X.B.; Lu, L.G.; Li, J.Q. Investigating the error sources of the online state of charge estimation methods for lithium-ion batteries in electric vehicles. J. Power Sources 2018, 377, 161–188. [Google Scholar]
- Tie, S.F.; Tan, C.W. A review of energy sources and energy management system in electric vehicles. Renew. Sust. Energ Rev. 2013, 20, 82–102. [Google Scholar] [CrossRef]
- Bubbico, R.; Greco, V.; Menale, C. Hazardous scenarios identification for li-ion secondary batteries. Saf. Sci. 2018, 108, 72–88. [Google Scholar] [CrossRef]
- Neubauer, J.; Pesaran, A. The ability of battery second use strategies to impact plug-in electric vehicle prices and serve utility energy storage applications. J. Power Sources 2011, 196, 10351–10358. [Google Scholar] [CrossRef]
- Jiang, Y.; Jiang, J.C.; Zhang, C.P.; Zhang, W.G.; Gao, Y.; Guo, Q.P. Recognition of battery aging variations for lifepo4 batteries in 2nd use applications combining incremental capacity analysis and statistical approaches. J. Power Sources 2017, 360, 180–188. [Google Scholar] [CrossRef]
- Wood, E.; Alexander, M.; Bradley, T.H. Investigation of battery end-of-life conditions for plug-in hybrid electric vehicles. J. Power Sources 2011, 196, 5147–5154. [Google Scholar] [CrossRef]
- Debnath, U.K.; Ahmad, I.; Habibi, D. Quantifying economic benefits of second life batteries of gridable vehicles in the smart grid. Int. J. Electr. Power 2014, 63, 577–587. [Google Scholar] [CrossRef]
- Tong, S.J.; Same, A.; Kootstra, M.A.; Park, J.W. Off-grid photovoltaic vehicle charge using second life lithium batteries: An experimental and numerical investigation. Appl. Energy 2013, 104, 740–750. [Google Scholar] [CrossRef]
- Lai, X.; Zheng, Y.J.; Zhou, L.; Gao, W.K. Electrical behavior of overdischarge-induced internal short circuit in lithium-ion cells. Electrochim. Acta 2018, 278, 245–254. [Google Scholar] [CrossRef]
- Lu, L.G.; Han, X.B.; Li, J.Q.; Hua, J.F.; Ouyang, M.G. A review on the key issues for lithium-ion battery management in electric vehicles. J. Power Sources 2013, 226, 272–288. [Google Scholar] [CrossRef]
- Gao, W.; Zheng, Y.; Ouyang, M.; Li, J.; Lai, X.; Hu, X. Micro-short circuit diagnosis for series-connected lithium-ion battery packs using mean-difference model. IEEE Trans. Ind. Electron. 2019, 66, 2132–2142. [Google Scholar] [CrossRef]
- Xu, Y.M. Capacity estimation and cascade utilization method of retired lithium ion batteries. J. Nanoelectron. Optoectron. 2017, 12, 803–807. [Google Scholar] [CrossRef]
- Gu, F.; Guo, J.F.; Yao, X.; Summers, P.A.; Widijatmoko, S.D.; Hall, P. An investigation of the current status of recycling spent lithium-ion batteries from consumer electronics in china. J. Clean. Prod. 2017, 161, 765–780. [Google Scholar] [CrossRef]
- Goh, T.; Park, M.; Seo, M.; Kim, J.G.; Kim, S.W. Capacity estimation algorithm with a second-order differential voltage curve for li-ion batteries with nmc cathodes. Energy 2017, 135, 257–268. [Google Scholar] [CrossRef]
- Hu, C.; Youn, B.D.; Chung, J. A multiscale framework with extended kalman filter for lithium-ion battery soc and capacity estimation. Appl. Energy 2012, 92, 694–704. [Google Scholar] [CrossRef]
- Mohan, S.; Kim, Y.; Stefanopoulou, A.G. Estimating the power capability of li-ion batteries using informationally partitioned estimators. IEEE Trans. Control Syst. Technol. 2016, 24, 1643–1654. [Google Scholar] [CrossRef]
- Lajara, R.; Perez-Solano, J.J.; Pelegri-Sebastia, J. Predicting the batteries’ state of health in wireless sensor networks applications. IEEE Trans. Ind. Electron. 2018, 65, 8936–8945. [Google Scholar] [CrossRef]
- Barai, A.; Uddin, K.; Widanage, W.D.; McGordon, A.; Jennings, P. A study of the influence of measurement timescale on internal resistance characterisation methodologies for lithium-ion cells. Sci. Rep. 2018, 8, 21. [Google Scholar] [CrossRef] [PubMed]
- Ouyang, M.G.; Ren, D.S.; Lu, L.G.; Li, J.Q.; Feng, X.N.; Han, X.B.; Liu, G.M. Overcharge-induced capacity fading analysis for large format lithium-ion batteries with liyni1/3co1/3mn1/3o2 + liymn2o4 composite cathode. J. Power Sources 2015, 279, 626–635. [Google Scholar] [CrossRef]
- Lai, X.; Qiao, D.; Zheng, Y.; Zhou, L. A fuzzy state-of-charge estimation algorithm combining ampere-hour and an extended kalman filter for li-ion batteries based on multi-model global identification. Appl. Sci. 2018, 8, 2028. [Google Scholar] [CrossRef]
- Hannan, M.A.; Lipu, M.S.H.; Hussain, A.; Saad, M.H.; Ayob, A. Neural network approach for estimating state of charge of lithium-ion battery using backtracking search algorithm. IEEE Access 2018, 6, 10069–10079. [Google Scholar] [CrossRef]
- Maity, S.; Roy, A.; Maiti, M. An imprecise multi-objective genetic algorithm for uncertain constrained multi-objective solid travelling salesman problem. Expert Syst. Appl. 2016, 46, 196–223. [Google Scholar] [CrossRef]
- Lai, X.; Gao, W.; Zheng, Y.; Ouyang, M.; Li, J.; Han, X.; Zhou, L. A comparative study of global optimization methods for parameter identification of different equivalent circuit models for Li-ion batteries. Electrochim. Acta 2019, 295, 1057–1066. [Google Scholar] [CrossRef]
- Zhou, L.; Zheng, Y.J.; Ouyang, M.G.; Lu, L.G. A study on parameter variation effects on battery packs for electric vehicles. J. Power Sources 2017, 364, 242–252. [Google Scholar] [CrossRef]
- Wang, J.; Liu, P.; Hicks-Garner, J.; Sherman, E.; Soukiazian, S.; Verbrugge, M.; Tataria, H.; Musser, J.; Finamore, P. Cycle-life model for graphite-lifepo(4) cells. J. Power Sources 2011, 196, 3942–3948. [Google Scholar] [CrossRef]
- Han, X.B.; Ouyang, M.G.; Lu, L.G.; Li, J.Q. A comparative study of commercial lithium ion battery cycle life in electric vehicle: Capacity loss estimation. J. Power Sources 2014, 268, 658–669. [Google Scholar] [CrossRef]
- Zheng, Y.J.; Ouyang, M.G.; Lu, L.G.; Li, J.Q. Understanding aging mechanisms in lithium-ion battery packs: From cell capacity loss to pack capacity evolution. J. Power Sources 2015, 278, 287–295. [Google Scholar] [CrossRef]
- Matsushima, T. Deterioration estimation of lithium-ion cells in direct current power supply systems and characteristics of 400-ah lithium-ion cells. J. Power Sources 2009, 189, 847–854. [Google Scholar] [CrossRef]
© 2018 by the authors. Licensee MDPI, Basel, Switzerland. This article is an open access article distributed under the terms and conditions of the Creative Commons Attribution (CC BY) license (http://creativecommons.org/licenses/by/4.0/).