Article

An Embedded Sensing and Communication Platform, and a Healthcare Model for Remote Monitoring of Chronic Diseases

1
Dipartimento Ingegneria della Informazione-Università di Pisa; via G. Caruso 16, 56122 Pisa, Italy
2
IngeniArs srl, via Ponte a Piglieri 8, 56121 Pisa, Italy
*
Author to whom correspondence should be addressed.
Electronics 2016, 5(3), 47; https://doi.org/10.3390/electronics5030047
Submission received: 18 June 2016 / Revised: 24 July 2016 / Accepted: 25 July 2016 / Published: 4 August 2016

Abstract

:
This paper presents a new remote healthcare model, which, exploiting wireless biomedical sensors, an embedded local unit (gateway) for sensor data acquisition-processing-communication, and a remote e-Health service center, can be scaled in different telemedicine scenarios. The aim is avoiding hospitalization cost and long waiting lists for patients affected by chronic illness who need continuous and long-term monitoring of some vital parameters. In the “1:1” scenario, the patient has a set of biomedical sensors and a gateway to exchange data and healthcare protocols with the remote service center. In the “1:N” scenario the use of gateway and sensors is managed by a professional caregiver, e.g., assigned by the Public Health System to a number N of different patients. In the “point of care” scenario the patient, instead of being hospitalized, can take the needed measurements at a specific health corner, which is then connected to the remote e-Health center. A mix of commercially available sensors and new custom-designed ones is presented. The new custom-designed sensors range from a single-lead electrocardiograph for easy measurements taken by the patients at their home, to a multi-channel biomedical integrated circuit for acquisition of multi-channel bio signals, to a new motion sensor for patient posture estimation and fall detection. Experimental trials in real-world telemedicine applications assess the proposed system in terms of easy usability from patients, specialist and family doctors, and caregivers, in terms of scalability in different scenarios, and in terms of suitability for implementation of needed care plans.

Graphical Abstract

1. Introduction

One of the main trends in biomedical applications is developing telemedicine systems for the remote monitoring of people affected by chronic diseases [1,2,3,4,5,6,7,8,9,10,11,12,13,14,15,16]. Particularly in developed countries such as the United States, Canada, Europe, Japan, South Korea, and Australia, the increasing percentage of elderly people and the need for public health systems (PHS) to cut the budget for hospitalization are fostering the rise of a new healthcare paradigm: hospitalization should be reserved only for patients with acute syndromes that can be solved in a short period. The healthcare model for patients affected by chronic illness, and needing continuous and long-term monitoring of some vital parameters should be based on telemedicine. According to a medical protocol established by a doctor, some biomedical parameters of the patient are periodically measured at home or in a point of care (e.g., a pharmacy) by the patients themselves, their relatives, or a professional caregiver (e.g., a nurse paid by the PHS or by medical insurance). The biomedical signals to be measured depend on the specific illness and may include measurements of ECG (ElectroCardioGraphy), blood pressure, body temperature and weight, oxygen saturation level in the blood (SpO2), chest impedance, hearth rate and breath rate, and glycemia. These are the main parameters relevant for the three main chronic illnesses in western countries: Chronic Heart Failure (CHF), Chronic Obstructive Pulmonary Disease (COPD), and diabetes. These types of chronic illness affect approximately 15 million people in Europe, with an incidence of 3.6 million new cases every year; and the trend is the same in the United States [4]. Moreover, in this work we add proper motion sensors to measure the posture of the patient, which influences the measure of some biomedical parameters. Indeed, false alarms can be generated if the vital signs are acquired in a non-correct position of the patient. As an additional service, motion sensors are also useful for fall detection and consequent alarm generation. Fall detection is one of the main causes of home accidents for elderly people. Telemedicine is also a key technology for overcoming the problem of remote regions with low population density, where hospitals can be far from the town where people live (e.g., internal and/or mountain zones of Europe or the United States).
It is worth noting that the technologies discussed in this paper can enable telemedicine to reduce the hospitalization of patients, but cannot decide which patients will be hospitalized and when. The decision about how many patients (and which ones) are acute and should be hospitalized, and how many patients (and which ones), although affected by a chronic illness, are non-acute and should be monitored remotely will depend on the medical protocol defined by specialist doctors, and on the budget constraints of the PHS. If during the remote monitoring the patient’s biomedical parameters get worse, according to the medical protocol established by the doctors, the patient can be re-hospitalized.
In the rest of the paper, Section 2 presents the state of the art and highlights the main contributions of this work. Section 3 presents the remote healthcare model and the embedded processing/communication platform. Section 4 is focused on the communication between the gateway at the client side and the e-Health service center at the server side. Section 5 deals with biomedical sensors using COTS (Commercial off the Shelf) components and three new custom-designed biomedical devices. The new custom-designed sensors include a single-lead ECG for easy CHF measurements taken by the patients at their home; a multi-channel biomedical ASIC (Application Specific Integrated Circuit) for acquisition of multi-channel ECG, EEG (ElectroEncephaloGraphy) or EMG (ElectroMioGraphy), blood pressure, and body temperature; and a new motion sensor for patient posture estimation and fall detection. Experimental trials are addressed in Section 6. Conclusions are drawn in Section 7.

2. Review of the State of the Art and Main Contributions of the Work

Several state-of-the-art wearable sensors and telemedicine platforms [3,4,17,18,19,20,21,22,23,24,25,26,27,28,29,30,31,32,33,34,35,36,37,38,39] have been proposed in the literature, but a successful and universal healthcare model is still missing. The main reason is that most works are only focused on a specific sub-part of the system, or on a specific type of disease. For example, [17,19,20,21,22,23,27,28,29] are focused on integrated smart sensors. Many studies (e.g., [18,25,30,31]) are focused only on the acquisition and communication gateway or on the remote server connected to the hospital information system (HIS). Moreover, [3,4,17,25,33,34,35,36,37,38,39] and [26,27] deal only with the monitoring of patients affected by heart disease and diabetes, respectively. Studies [19,20,21,22,23] are focused only on posture estimation and fall detection in patients. In [28,29,30] only contactless detection measurement of breath rate and/or heart rate is presented. Furthermore, most of these works come from academia and fail to address the qualification and certification issues of real-world biomedical applications. Most of the above works present just a new sensor, without any integration of real-world telemedicine scenarios that are characterized by multiple actors: patients and their relatives, professional caregivers (family doctor, nurse, specialist doctor), call centers, which are operating at home, or the hospital or points of care such as a pharmacy or a residence for elderly people.
Most current biomedical monitoring platforms try to exploit the computational and communication capabilities of smartphones with touchscreen user interface, or even with smartwatches [21,24,26,30,31,32]. This way, state-of-the-art works are missing one of the key features of a telemedicine service: easy usability of the interface for users, who are mainly elderly people. Smartphones and smartwatches are more suited for wellness applications targeting younger people.
To address these issues, this paper presents a new remote healthcare model, exploiting wireless biomedical sensors that can be scaled to different telemedicine scenarios:
-
The “1:1” scenario, where each of the patient has a set of biomedical sensors and an embedded acquisition, processing, and communication platform (hereafter called a gateway) to exchange data and healthcare protocols with a remote service center and/or HIS for telemedicine, where a doctor is connected.
-
The “1:N” scenario where the embedded acquisition and communication telemedicine platform is manged by a nurse, e.g., assigned by the PHS to a number N of different patients. The nurse is visiting and taking care of data acquisition from a set of N patients. The relevant biomedical data are then transmitted to the remote service center and/or HIS. In the “1:N” scenario it is the nurse that is moving and visiting patients at their homes.
-
The “point of care” scenario where a local building, e.g., a pharmacy, or a point of care in a school or a residence for elderly people, hosts the embedded acquisition and communication telemedicine platform and the set of sensors. The patients, instead of being hospitalized, with increased cost and waiting lists, can take the needed measurements at a specific point of care, which is then connected to the remote service center and/or HIS. In this scenario the patients are moving toward the point of care where a nurse supervises the biomedical measurement acquisitions to be collected and transmitted.
In this paper, different from the state of the art, the whole value chain is implemented from the health care model at the top, down to the technical implementations of sensors, data acquisition and communication platform, and integration with the service center and HIS. The work is the result of the collaboration between academia (the University of Pisa) and industry (IngeniArs S.r.l.), the latter being responsible for integration in different real-world telemedicine scenarios, taking care of all actors involved, including certification and qualification issues.
The communication between the home gateway and the HIS is based on approved medical protocols such as HL7 CDA (Clinical Document Architecture). The communication is physically running on wireless technologies available everywhere, like 3G or 4G cellular network, or satellite connections, wired technologies like ADSL/VDSL (Asymmetric or Very-high speed Digital Subscriber Line), or Fiber to the Cabinet/Home (FTTC/FTTH).
The platform can be used to implement a predefined measuring protocol, i.e., a care plan assigned remotely by the family or specialist doctor. Extra-protocol measurements can be taken by the patient or the caregiver in case of necessity or can be requested remotely by the doctor. A mixture of COTS sensors and custom ones specifically designed by the research group are presented and used in this work. With respect to previous publications of the authors in [4,17,25,28], this work is extended in terms of:
-
Support of any chronic illness and not only CHF as in [4,17,25].
-
Analysis of the system-level telemedicine model with differentiation of the biomedical monitoring kit according to the above scenarios: “1:1”, “1:N,” and “point of care,” which is missing in [4,17,25,28].
-
Development of new custom sensors, particularly the single-lead ECG one for easy self-measurements at home, whereas [4,25,28] were mainly based on commercial sensors.
-
Integration of motion sensors for fall detection and patient’s posture analysis, missing in [4,17,25,28].
This work also presents real-world results from experimental trials carried out in the field of several European and regional research and health projects such as Health@Home (EU Ambient Assisted Living program), RIS and RACE (EU-Tuscany Region FESR program), and Domino (Tuscany region PHS project).

3. Remote Healthcare Model and Embedded Sensing/Communication Platform

According to Figure 1, the proposed telemedicine model includes several elements to cover the different sub-systems belonging to a distributed health care system. The key blocks in Figure 1 are:
-
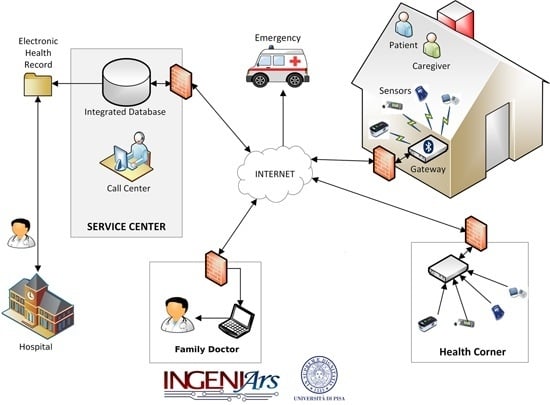
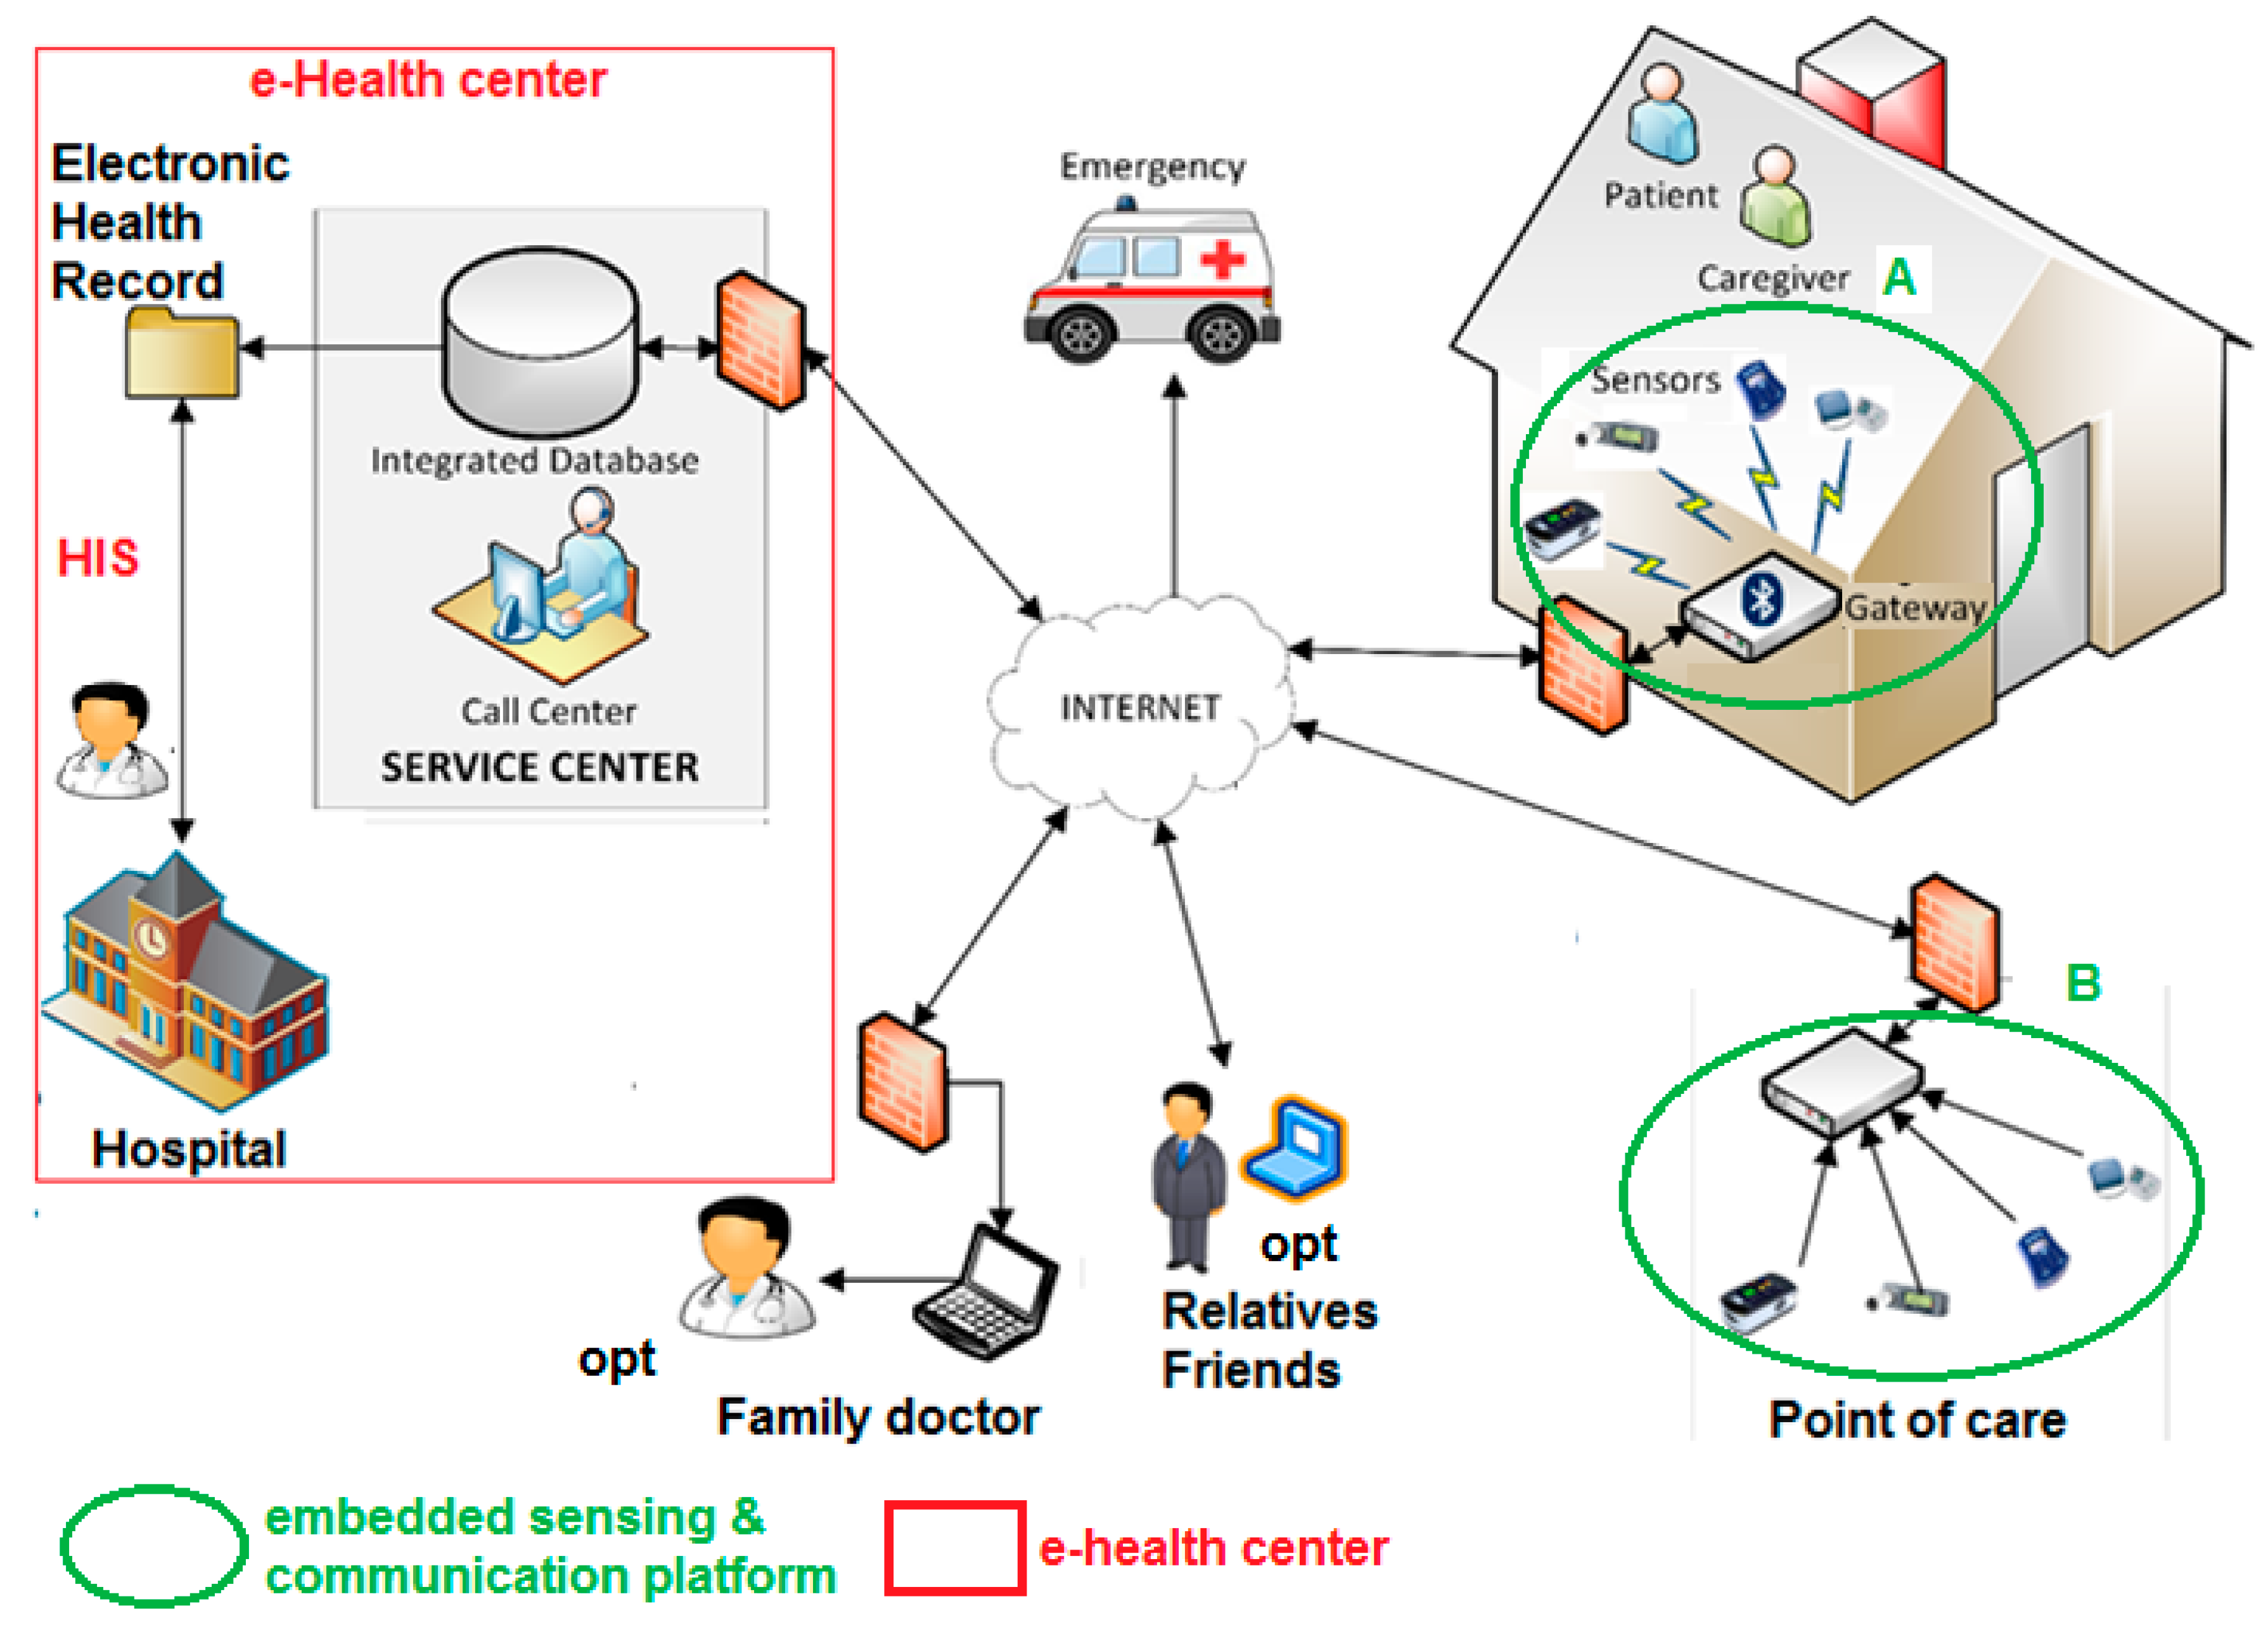
A monitoring kit (embedded sensing and communication platform, oval A with green borders in Figure 1, whose description is detailed in Section 3.1, Section 3.2 and Section 3.3) which, depending if the “1:1” or “1:N” scenario is implemented, can be used by patients for self-measurement or by caregivers, e.g., nurses, during planned home visits.
-
A totem for the monitoring of the biomedical parameters to be installed at point of cares (e.g., pharmacies, residences for elderly people, or other healthcare points); this is the embedded sensing and communication platform indicated with oval B with green borders in Figure 1, whose description is detailed in Section 3.1 and Section 3.4).
-
Management platform of the electronic health record and of the home-care plan (e-Health center detailed in Section 4), integrated with the HIS, and available to specialist doctors directly or through operators of a service center. Optionally, through the service center the data of the electronic health record can also be made available to the family doctor. Alarms can be automatically generated by the embedded sensing/communication units (thanks to local signal processing capability) at home or at the point of care, or by a caregiver analyzing the data. Automatically generated alarms should be validated by a caregiver. An alarm, generated or validated by a caregiver, is communicated to emergency units for a fast re-hospitalization of the patient and, optionally, to a pre-selected list of relatives/friends.

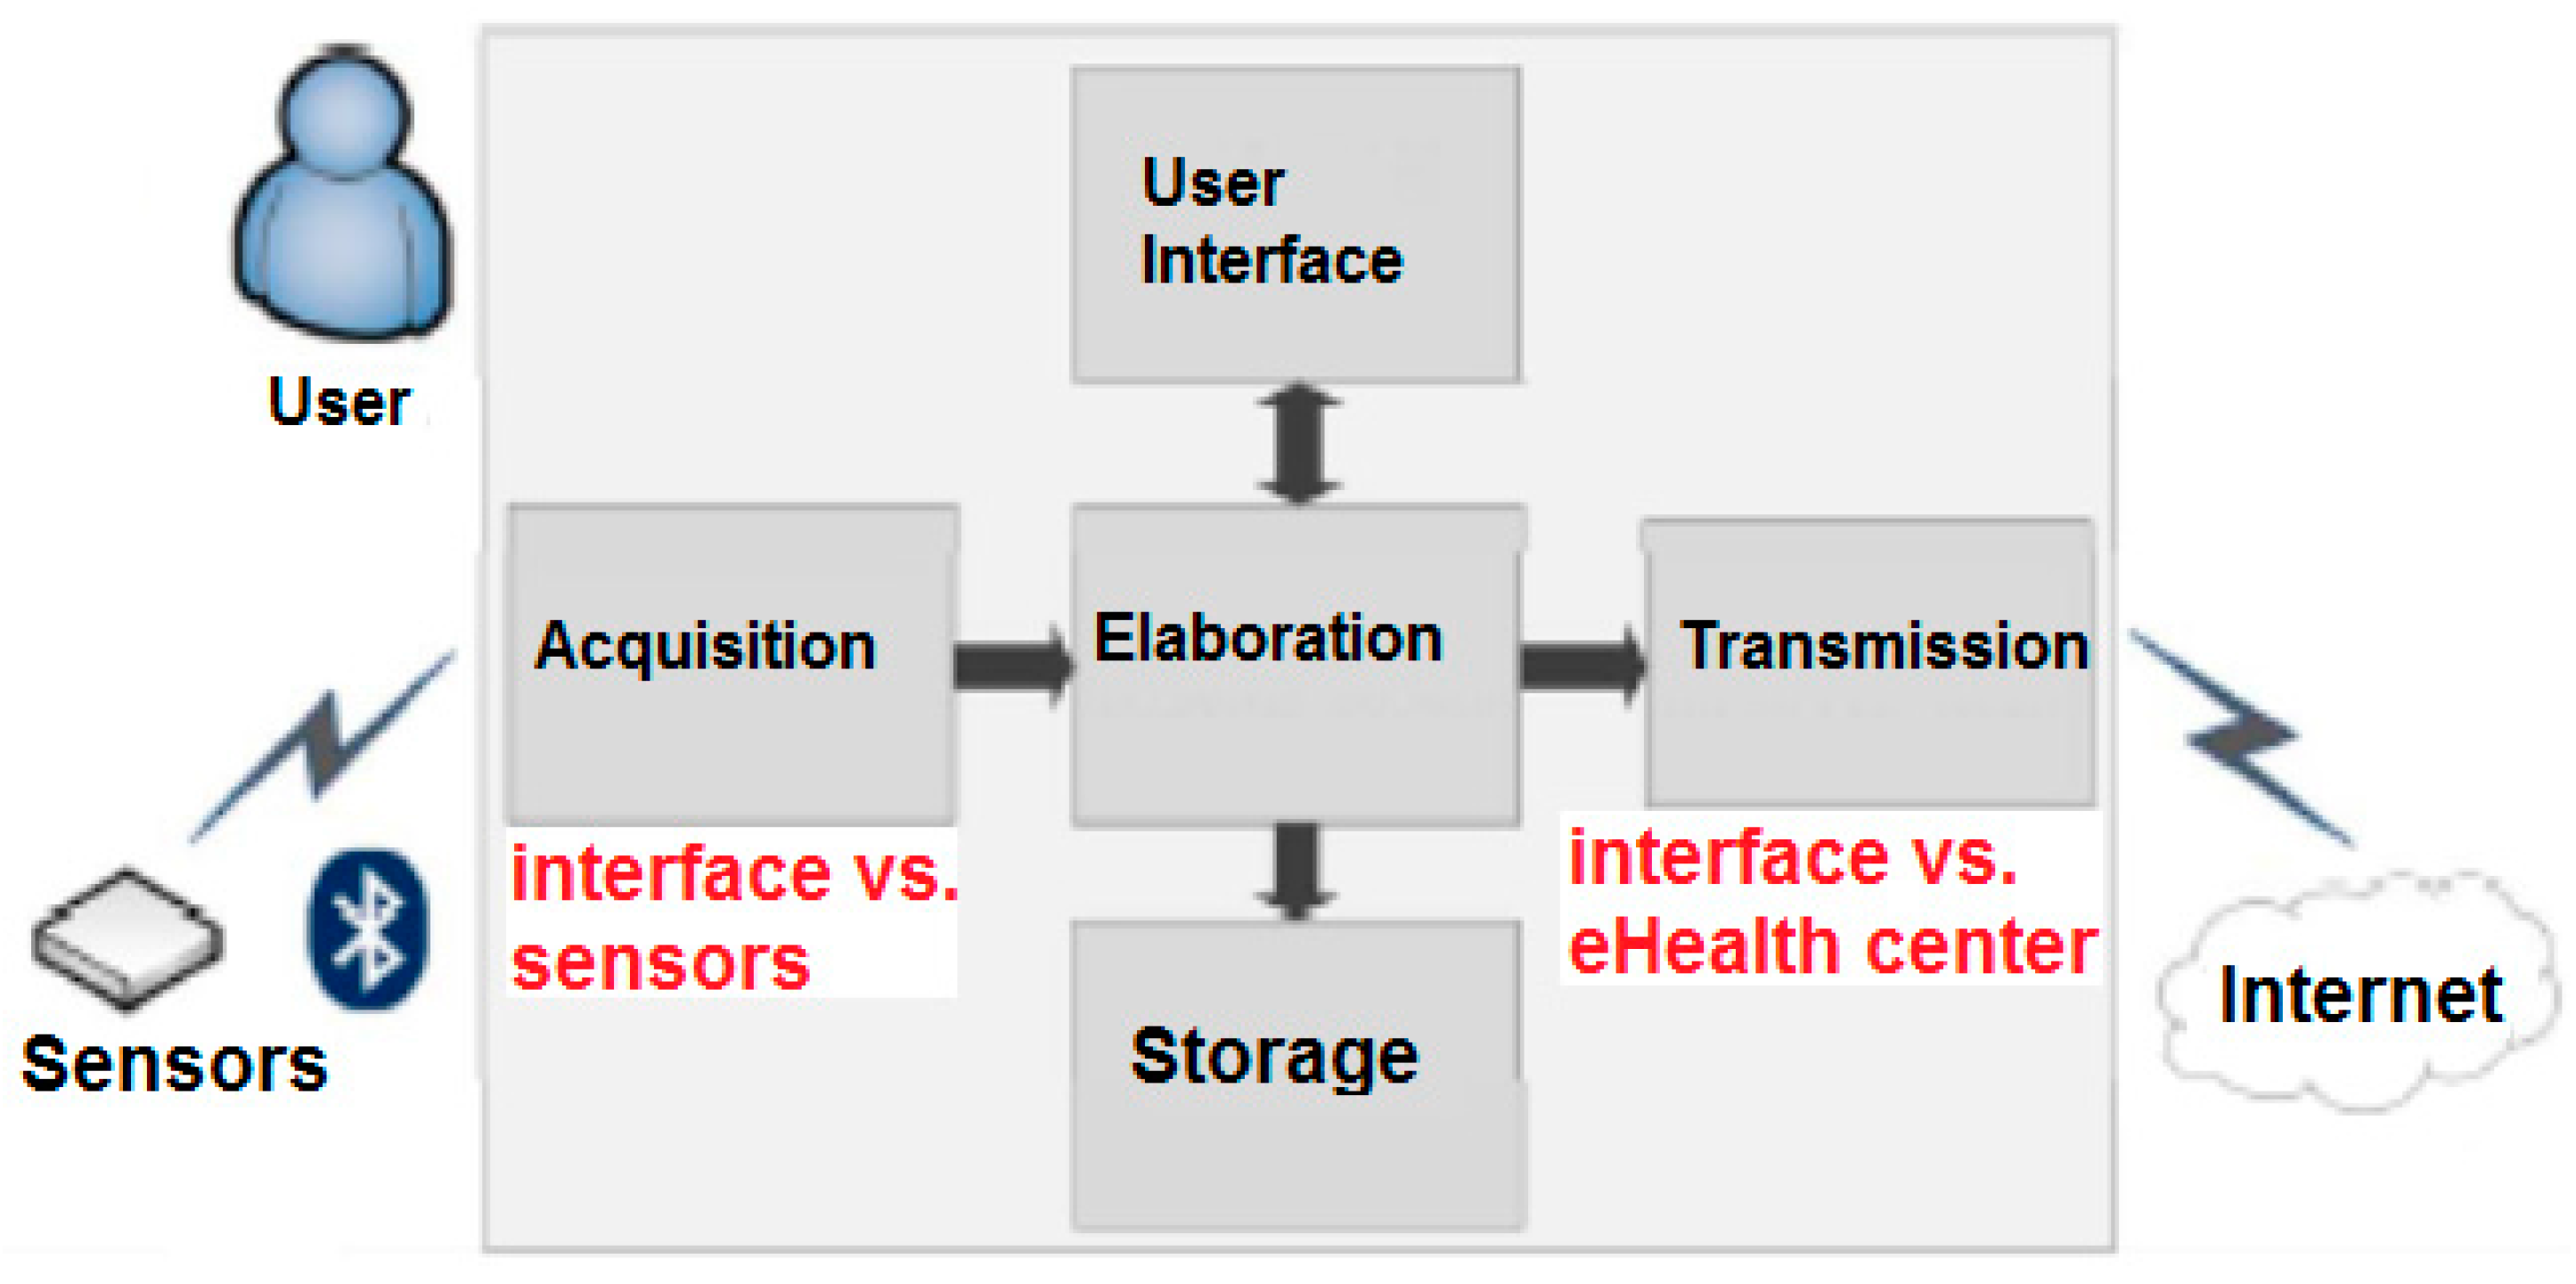
3.1. Biomedical Sensing and Communication Platform

The reference architecture of the biomedical monitoring kit is reported in Figure 2. It includes: a set of wireless sensors, connected through a Bluetooth wireless technology to an embedded system (called gateway) in charge of biomedical sensor signal acquisition, local processing, and data storage, and three interfaces: one for the user, one for the sensors, and the other for the e-Health center.
The latter exploits the SOAP web service paradigm on standard wired or wireless communication technologies (e.g., WiFi, Mobile Broadband, Ethernet, etc.). To increase the system flexibility, besides the HL7 CDA standard data format, the proposed system also supports other protocols for client–server communication like JSON (JavaScript Object Notation) and XML (eXtensible Markup Language).
For the sensors interface, Bluetooth (BT) technology has been preferred to other 802.11x WLAN (Wireless Local Area Network) or 802.15x WPAN (Wireless Personal Area Network) technologies for its large diffusion, increasing the number of commercial sensors that can be selected and used. The gateway handles the communication via the dual-mode BT interface: the RFCOMM protocol (Serial Port Profile SPP) is used to handle legacy Bluetooth 2.0 sensors, whereas the profiles HDP (Health Device Profile) [32] or GATT (Generic Attribute Profile) are used to communicate with Bluetooth Low-Energy (BLE) devices. Relying on a dual-mode BT chipset, the gateway is able to handle both legacy BT and BLE devices, acquiring data from a single sensor per time. The number of connectable sensors is unlimited and the gateway is able to manage both master and slave sensors. Pin-based pairing procedure and eventual data encryption are available. The performance of BT, even in a low-power protocol version, is well suited for telemedicine applications. Indeed, the main features of BLE are: data rate up to 1 Mb/s; connection distance up to 100 m outdoor line-of-sight but at least meters indoor; supported security technology (128 bit Advanced Encryption Standard) and robustness techniques (Adaptive frequency hopping, Lazy Acknowledgement, 24-bit Cyclic Redundant Code, 32-bit Message Integrity Check), low communication latency of few ms, and low power consumption limited to a few tens of mW, since a current well below 15 mA is drained from a power supply of few Volts.
It is worth noting that the gateway can also implement local signal processing tasks and not only acquisition, communication, and user interface tasks. Supported signal processing functionalities are:
-
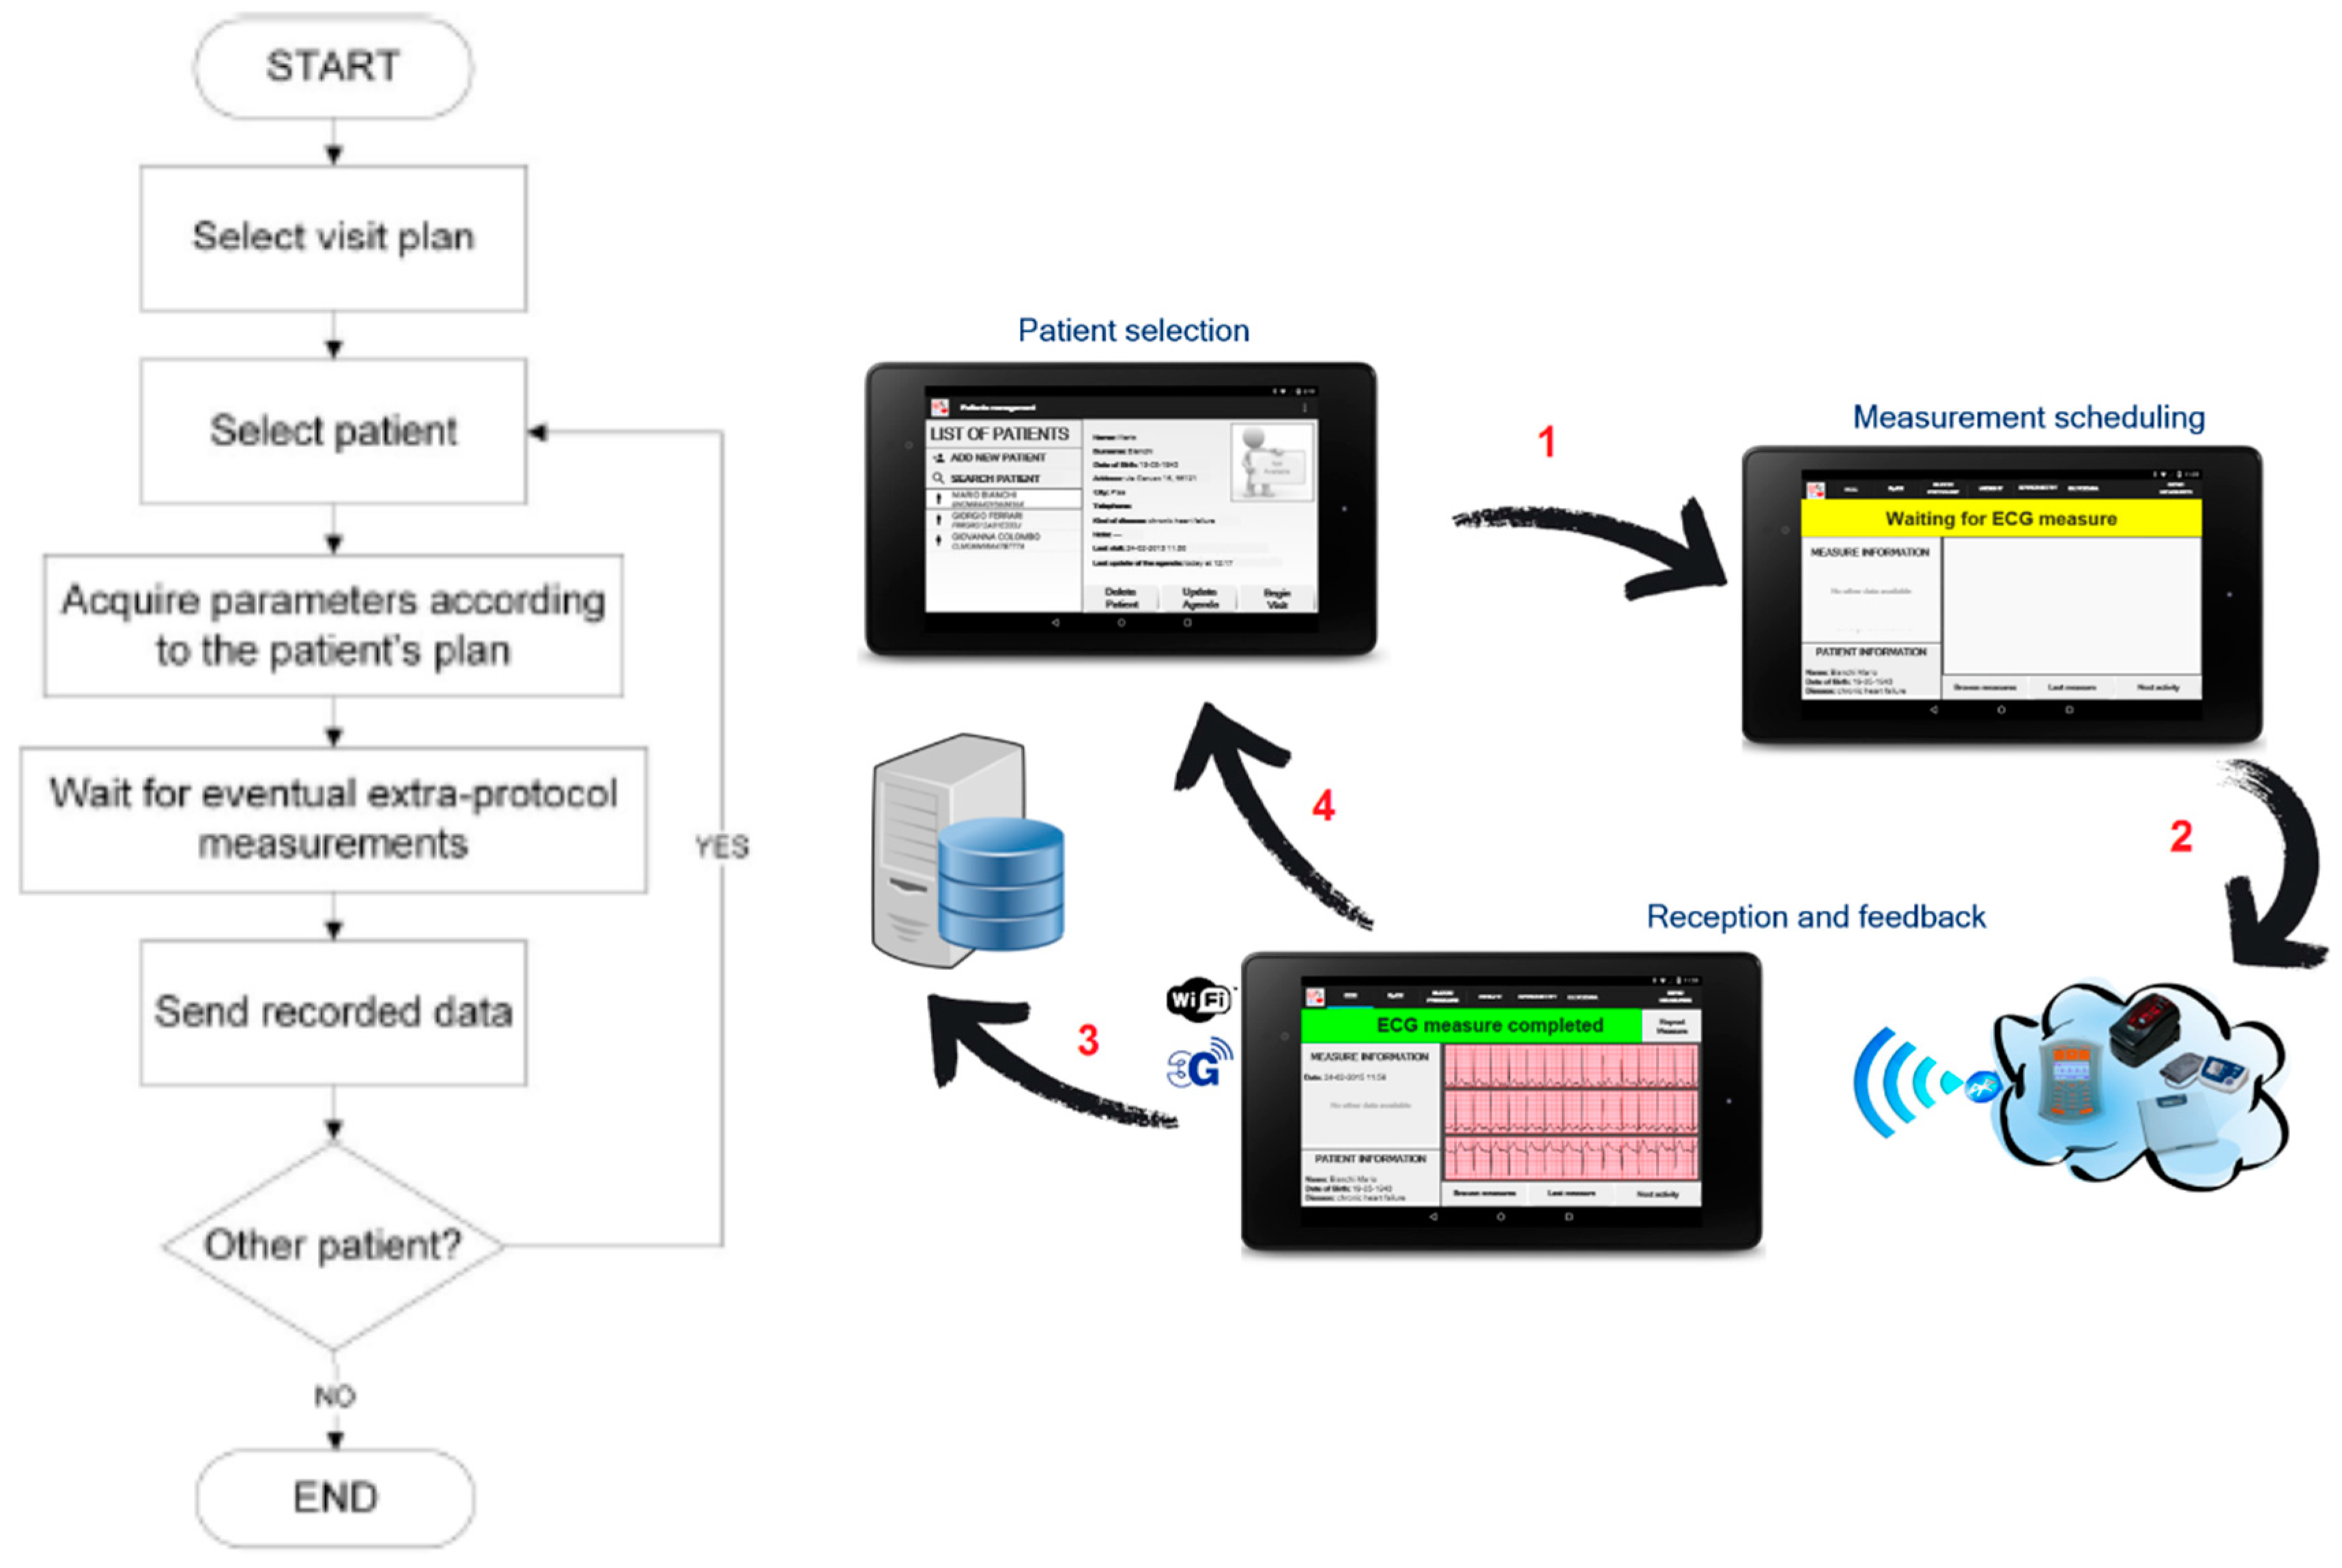
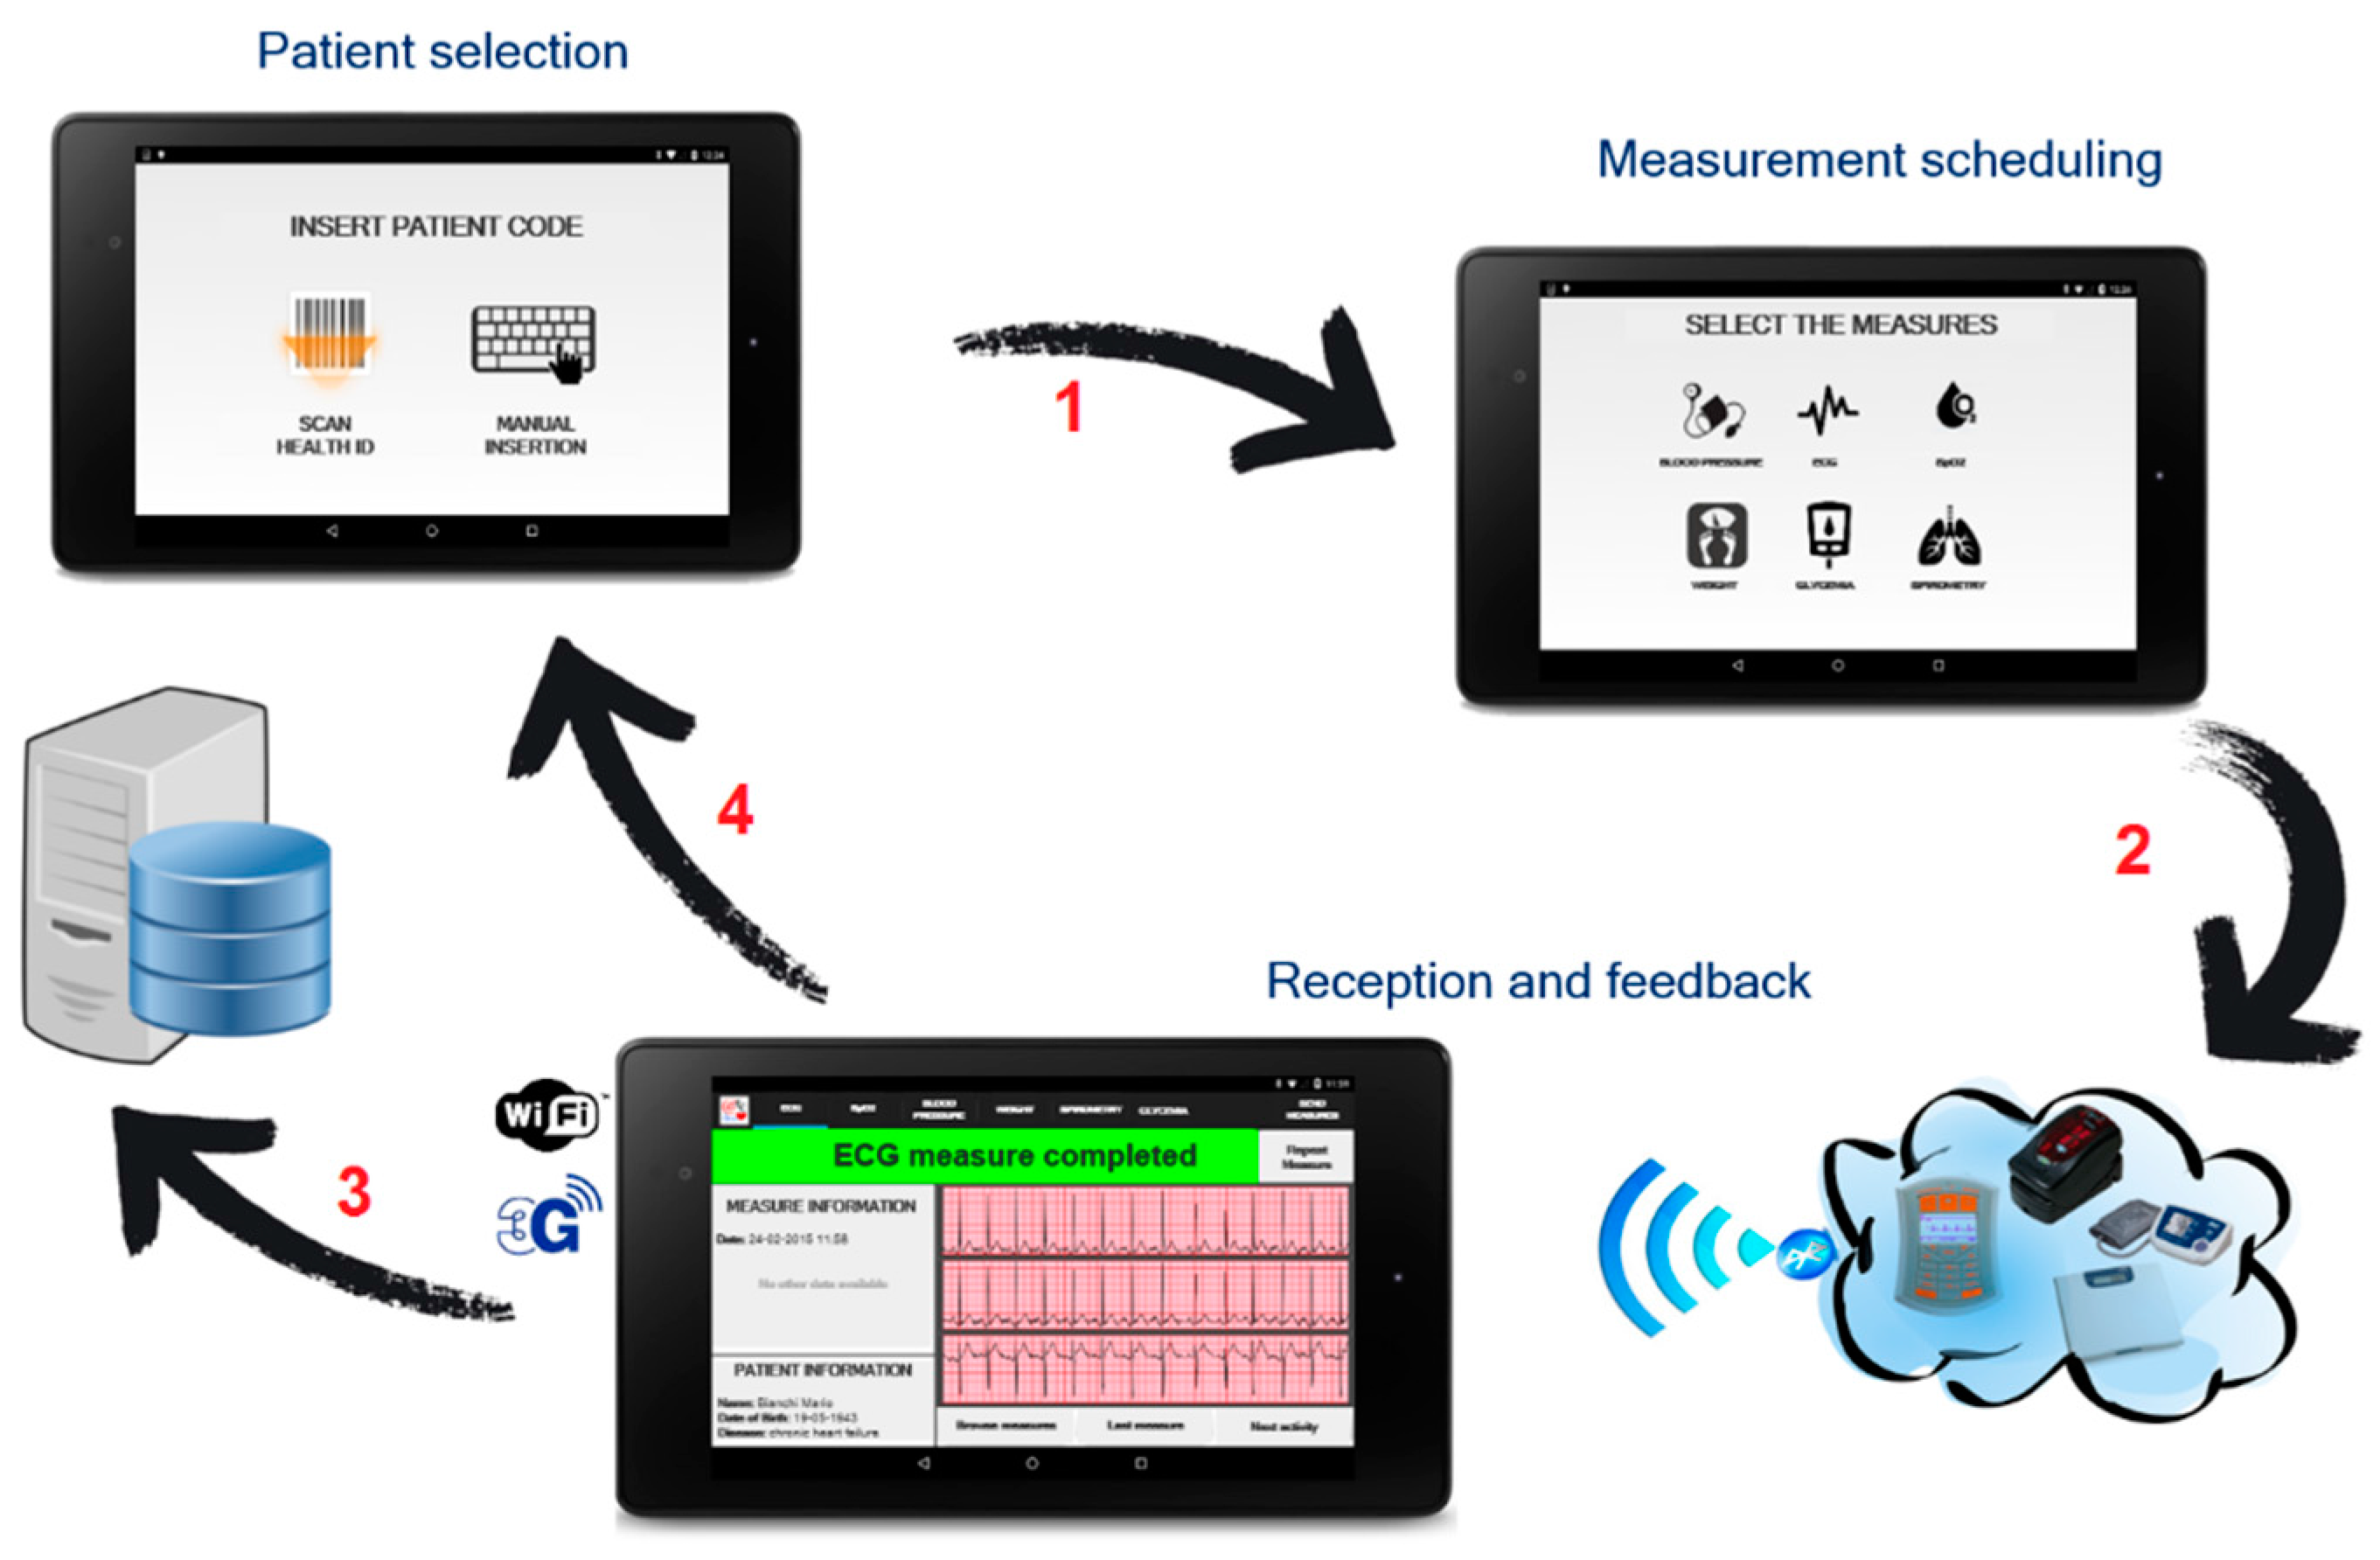
Collection of the acquired data from the configured BT or BLE sensors to create statistics of the biomedical parameters acquired according to the specific plan.
-
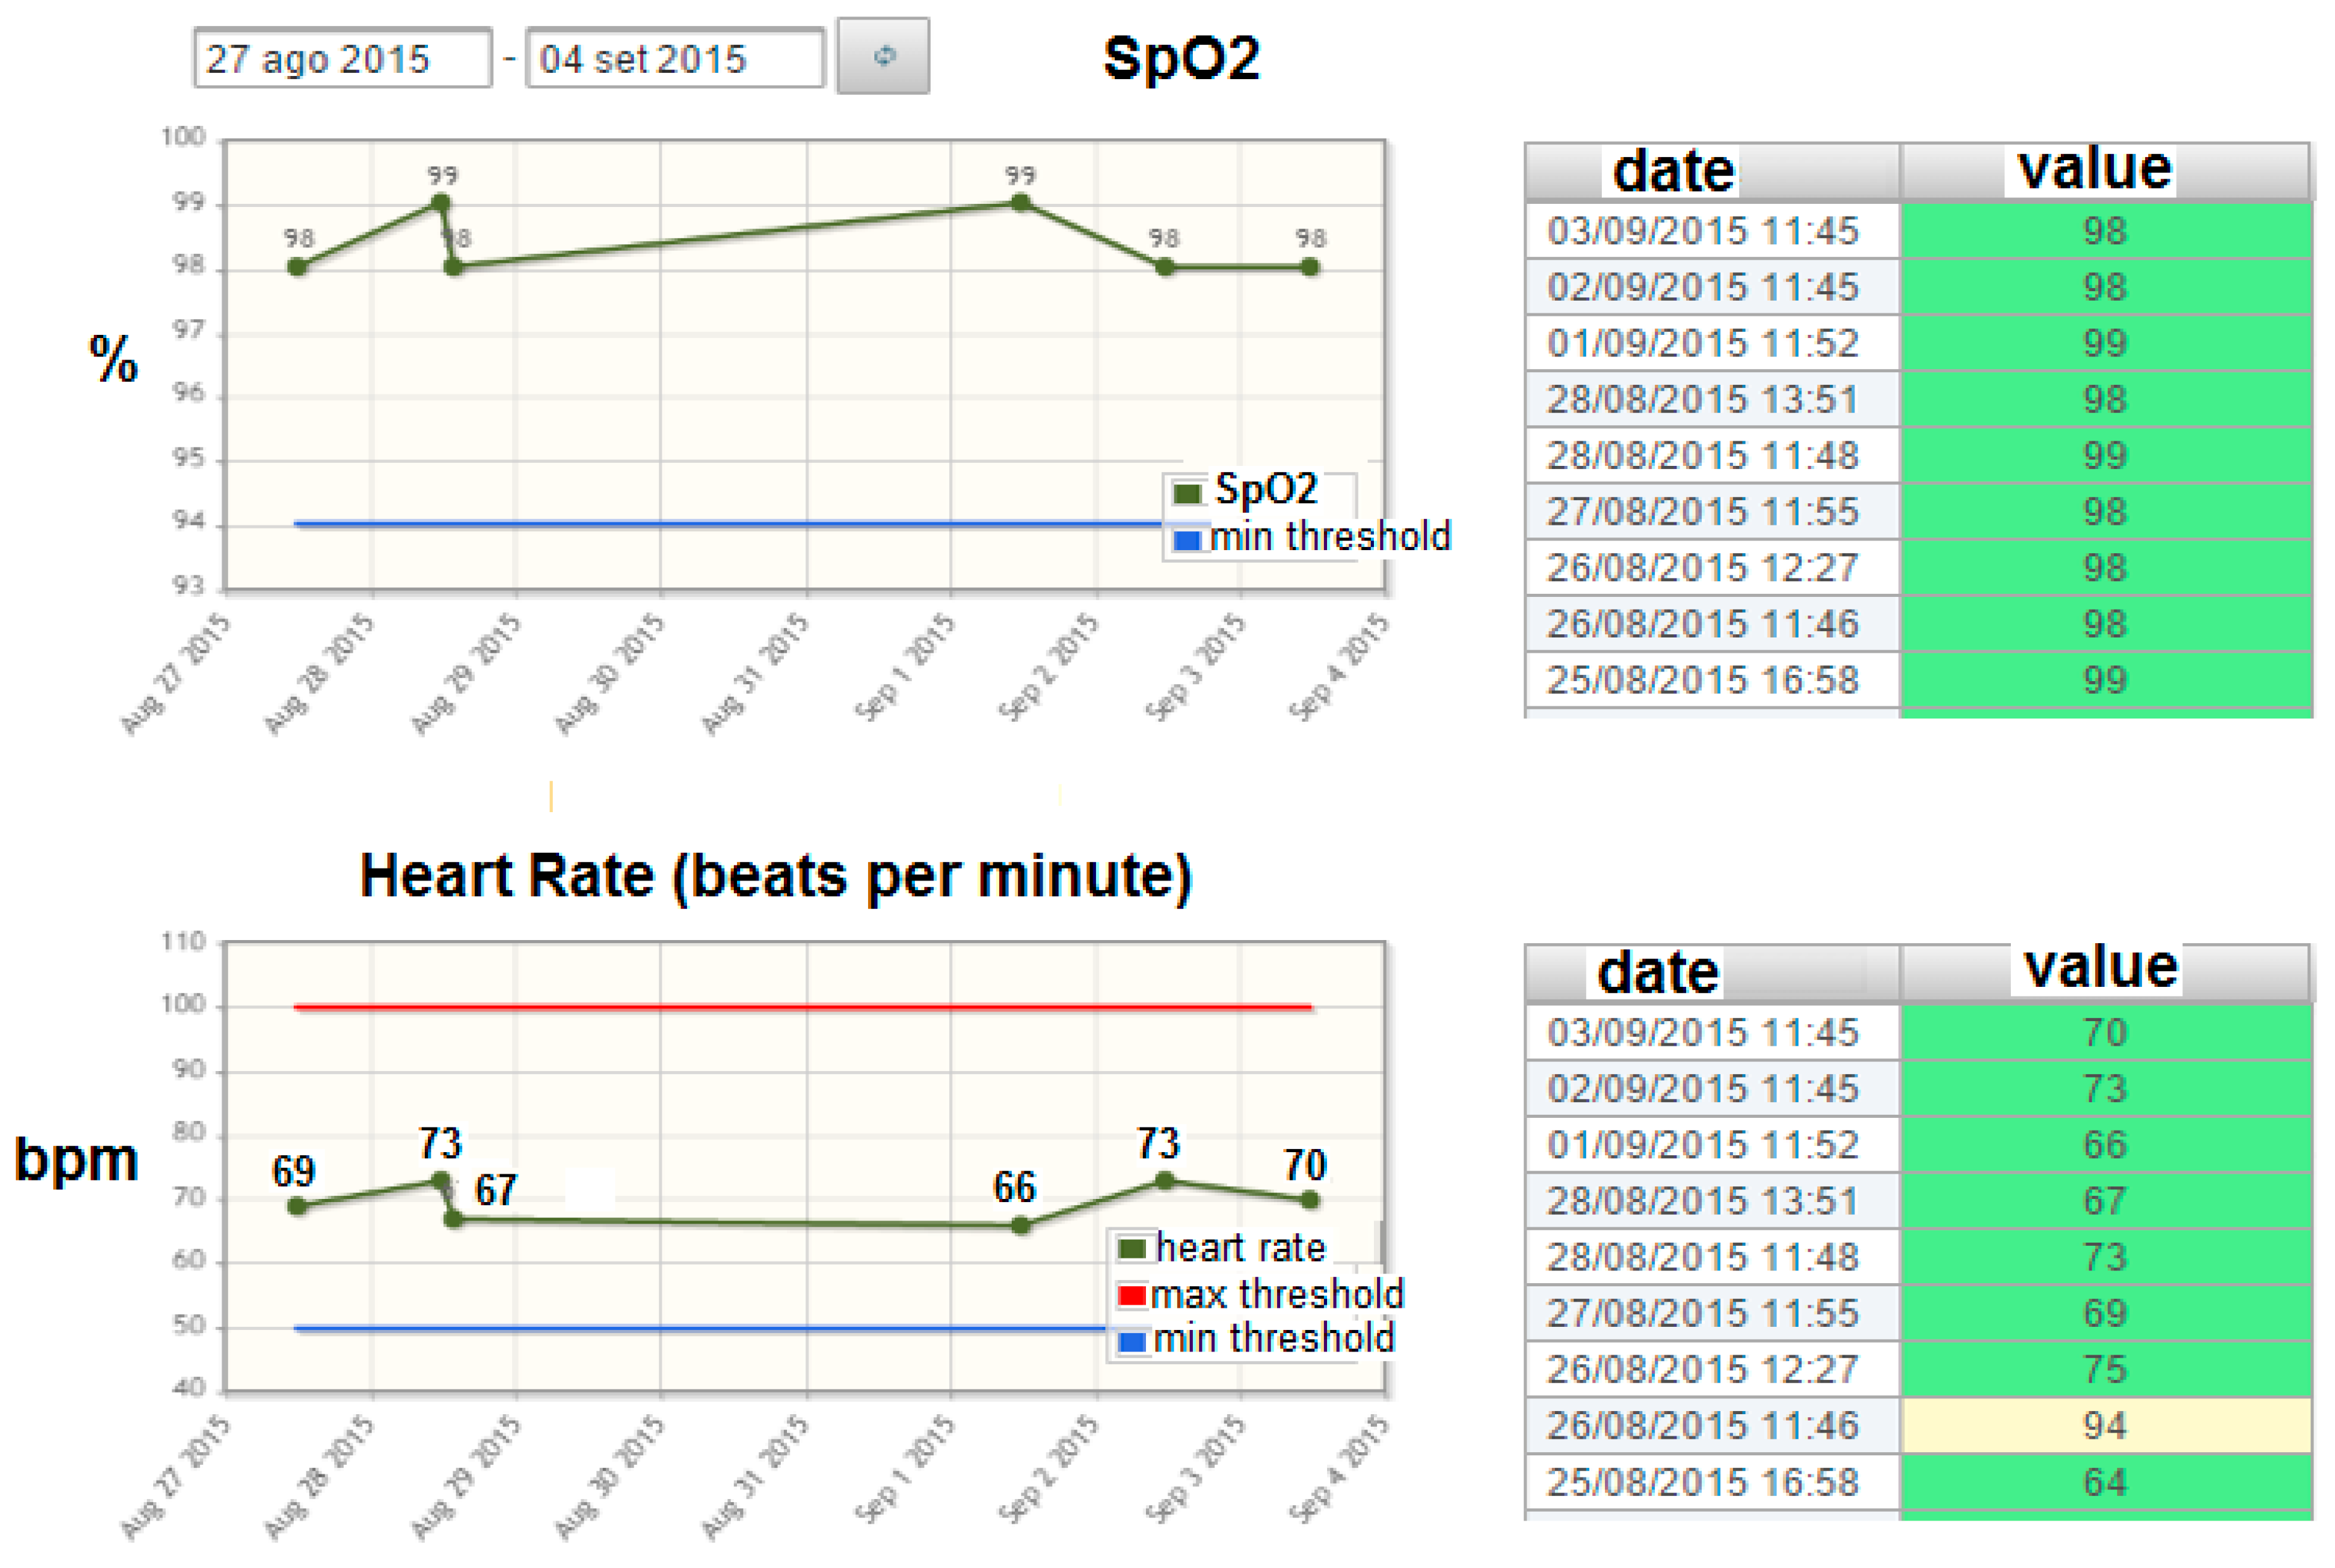
Graphical rendering for the visualization of the historical evolution of the biomedical parameters acquired according to the specific plan (see an example in Figure 3 related to the evolution of the SpO2 parameter). The statistics and graphical rendering of the historical evolution of biomedical parameters are useful at the gateway side mainly in the “1:N” and in the “point-of-care” scenarios (where the remote acquisition of bio-signals is supervised by a professional caregiver). They are also made available at the remote server side (service center and HIS).
-
Threshold-based analysis of the acquired data so that an early warning can be sent when one of the acquired parameters is above or below a specific threshold that can be changed dynamically and remotely by the doctor. The early warning can be used to force an immediate hospitalization in case the chronic illness enters into an acute phase.
From a hardware point of view, the gateway can be implemented on a general purpose system such as smartphones, tablets, or custom boards. The minimal requirements for the implementation are: 32 bit ARM Cortex processor, 1 GB RAM memory, at least 4 GB Flash Non-volatile storage, dual-mode Bluetooth chipset, network connectivity (e.g., Wifi, Ethernet, mobile broadband), and Android OS. On top of the hardware, a custom software layer has been developed using Java and the Android Software Development Kit (SDK). The strategic decision to use Java technology provides extreme flexibility concerning the configurability. Java also guarantees easy portability. The system is easily scalable in different processors and Printed Circuit Boards (PCBs). For example, one implemented configuration resulted in a compact size of 15 cm × 7 cm × 7 cm. Instead, in a configuration requiring a screen of 10 inches, the hardware is organized so that a size of about 22 cm × 14 cm × 1 cm is obtained. Solutions based on commercial tablets and smartphones have also been developed.

3.2. “1:1” Scenario

Changing the scenario (“1:1” or “1:N” or “point of care”) means changing who is supervising the biomedical measurement activity: the patient or his/her relatives (non-professional users), or a nurse (professional user). With reference to the architecture of the monitoring kit in Figure 2 (which includes a set of wireless sensors connected through a BT or BLE technology to the embedded platform for data acquisition and communication), which is valid for all scenarios, the user interface and also the type of sensors to be used have to be specifically adapted to the different scenarios and the different users.
For example, a conventional 12-lead ECG biomedical instrumentation, providing complete and accurate measurements of heart activity, is not suited to the “1:1” scenario where a non-professional caregiver (the patient or his/her relatives) is supervising the measurement acquisition. If used by a non-professional caregiver, an ECG with lots of derivations will often have the electrodes placed in the wrong position or with a bad electrode–body contact, thus giving inaccurate results. This is why, in the following, for the different scenarios, different sets of building blocks must be used. Moreover, for some specific blocks, e.g., ECG, a new custom instrumentation has been designed (e.g., the single-lead ECG in Section 5.2).
In the “1:1” healthcare model, already described in Section 2, the gateway allows the user to view the individual care plan established by the family or specialist doctor, collect the measurements from medical sensors, through a BT or BLE connection, and send them to the e-Health Center (a service center and/or the HIS) through a wired or wireless Internet connection (see Figure 4 and Figure 5). The patient also has the possibility to carry out a measurement not foreseen in the standard care plan. At a time when the activity is required, visual and audible signals inform the patient that a new measurement is required (see Figure 5). An animated image guides the patient on how to use the device to complete the task. The numbers near the arrows in Figure 5, Figure 6 and Figure 7 highlight the temporal consecution of the different steps. After the measurement, the gateway notifies the patient if the activity was successful or s/he will need to repeat the operation. The user interface has been optimized for elderly people with a simplified graphic, using a touch-screen display of at least 10 inches with large buttons. The language can be customized for the specific nation where the system is used.

3.3. “1:N” Scenario

In the “1:N” scenario, instead, the professional monitoring kit allows the nurse to take measurements of vital signs during home visits to different patients. As reported in Figure 6, first the gateway allows the nurse to select the specific patient (based on his/her health card or fiscal code, for example) and view the individual care plan for each patient. The user interface then guides the operator in the execution of the measures indicated in the plan. The system also allows the collection of unplanned measures and allows the repetition of the measurements made. Since the user is a professional one, more complex visualizations such as the ECG trace are available. The gateway can also work in offline mode, by sending all the measurements acquired at the end of the home visits. The professional operator selects the patient from the list of the clients and takes the measures foreseen in the individual care plan, making sure that the quality of the measurement is satisfactory. If it is not, s/he can proceed with a repetition of the measurement. The acquired measurements are sent to the e-Health Center, through the Internet connection. Figure 6 reports the complete flow.

3.4. “Point of Care” Scenario

In the “point of care” scenario, also called Totem mode (see Figure 7), the telemonitoring totem allows the measurement of the principal vital signs at dedicated facilities (pharmacies, residence for elderly people, etc.) and their transmission in the patient’s electronic file through the Internet connection. The professional caregiver identifies the patient through his/her fiscal code or by scanning his/her health card and takes the measures provided for the individual care plan, making sure that the quality of the measurement is satisfactory. If it is not, s/he can proceed with a repetition of the measurement. The acquired measurements are sent to the e-Health Center, through the Internet connection. This scenario is similar to the “1:N” scenario, but here the patients are moving toward the health center. Moreover, the patient database is larger since a larger number of patients are followed. In all of the above cases the access by the user is done in secure mode through a login–password protocol.

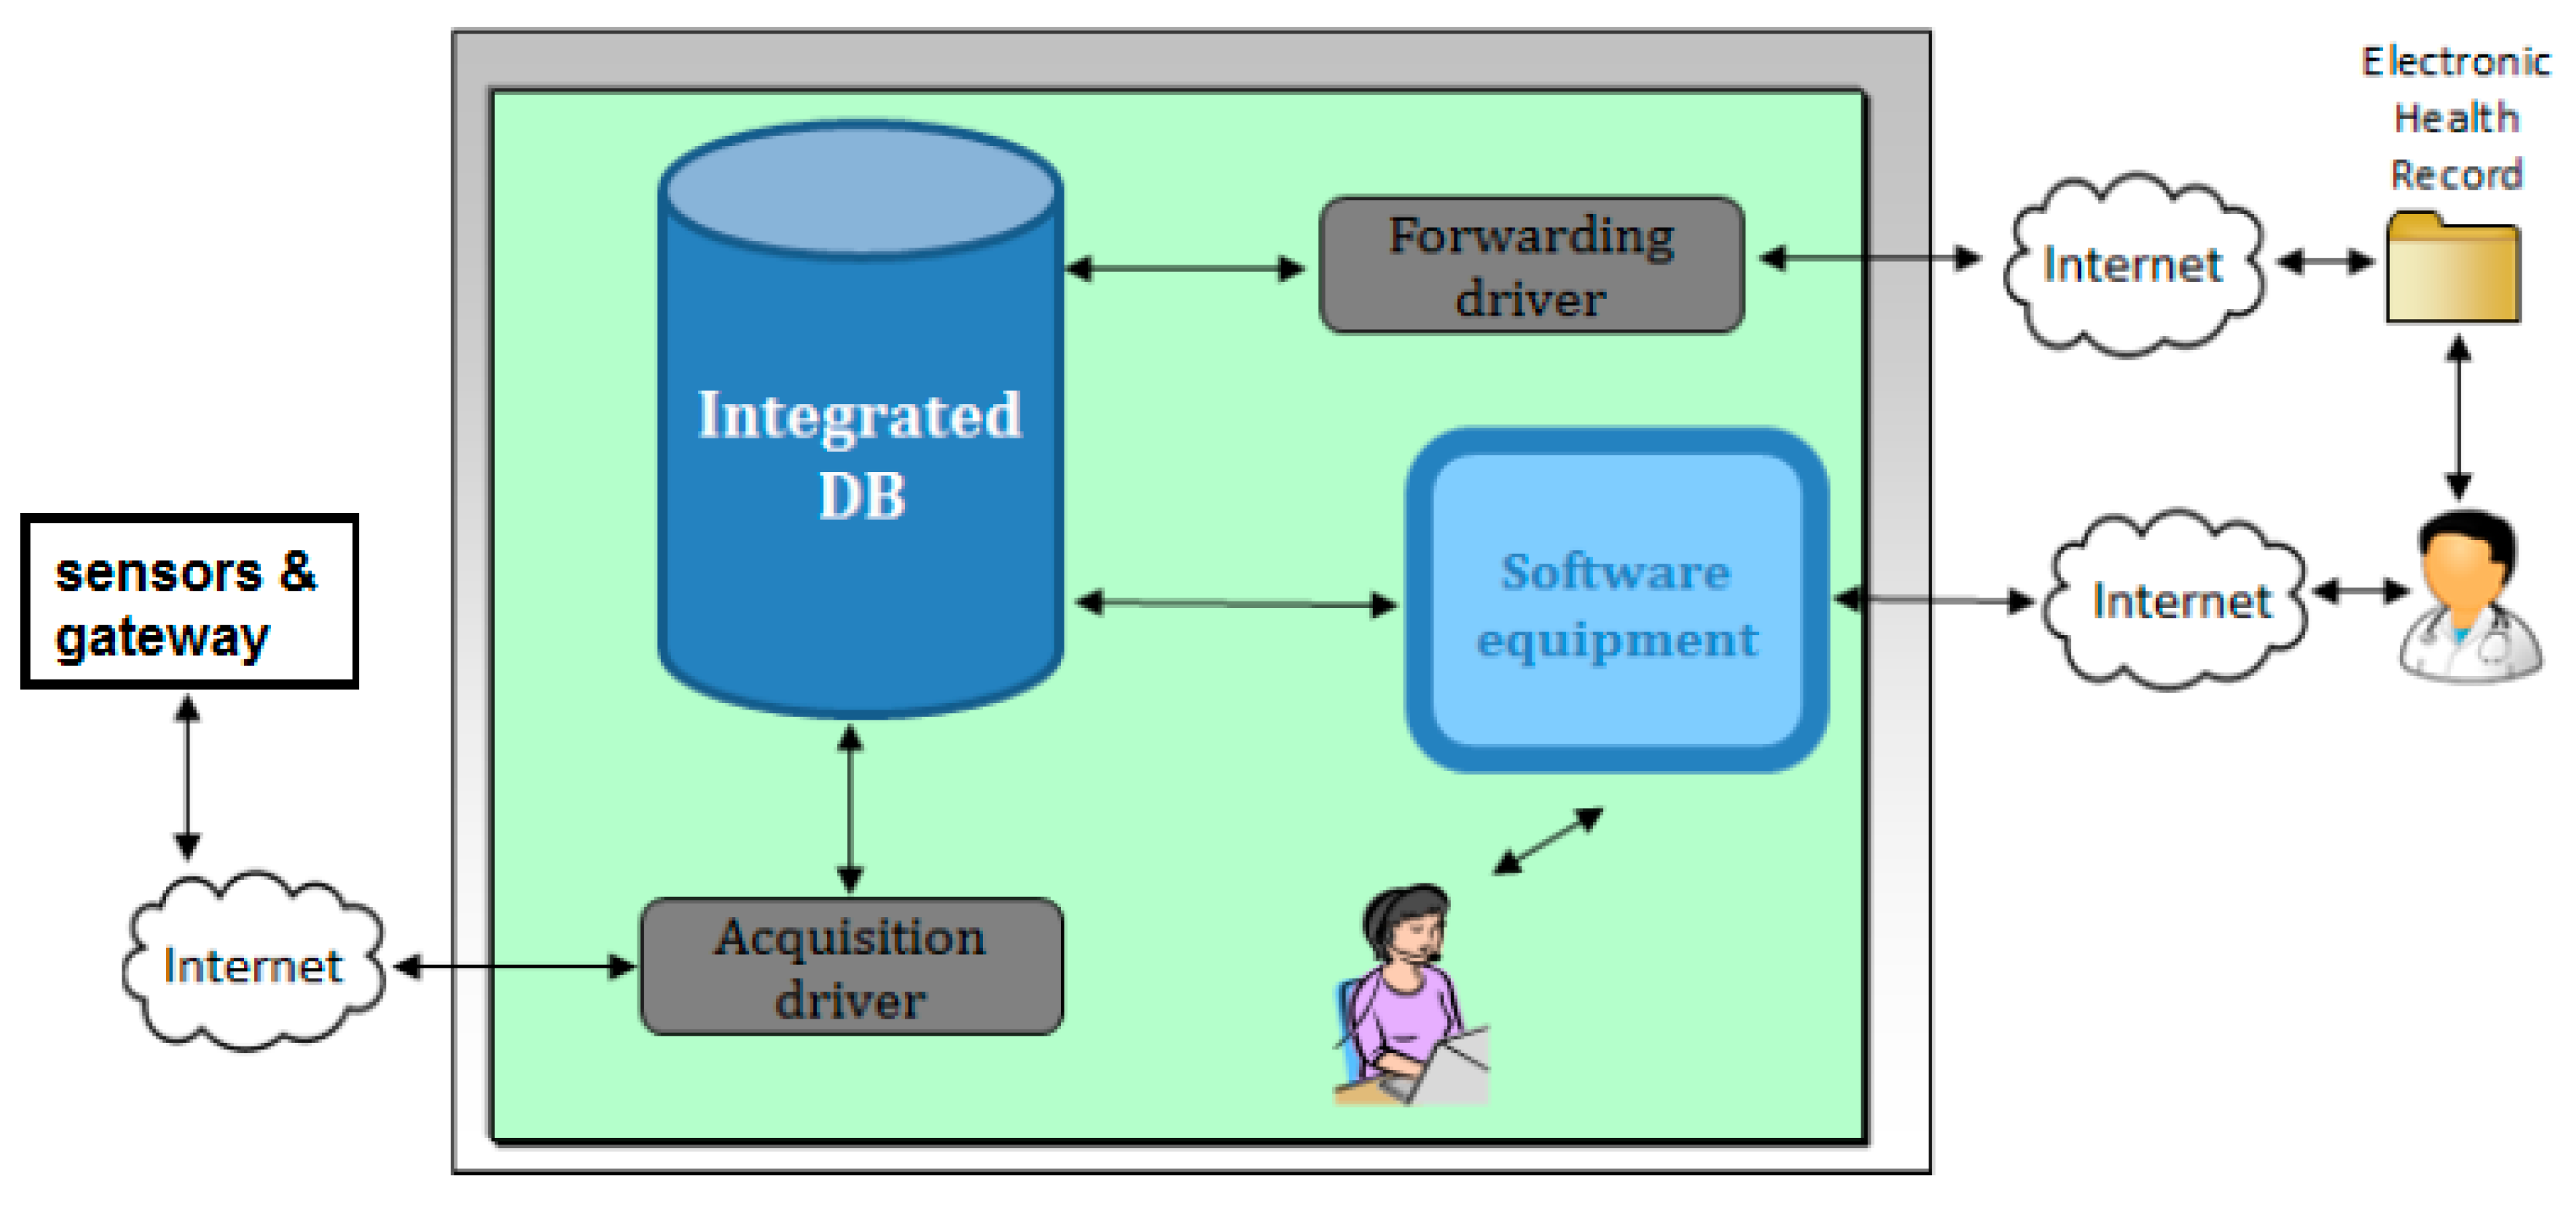
4. Home Monitoring Unit vs. e-Health Center Client–Server Communication

In the proposed health model the remote e-Health center in Figure 8 plays an essential role, since it integrates the services performed on the territory within the medical environment and the HIS. As reported in Figure 1 and Figure 8, it includes a service center and the interface toward the HIS. The e-Health center is the central element of the overall modular system, in which specialized human operators and ICT resources allow for managing data flows and events.
Concerning the presented telemedicine platform, the e-Health center is in charge of three important tasks. The first one is to manage the bidirectional communication with the gateway of the home monitoring module to receive data and send configurations. The second task is to provide the data processing capabilities and interfaces for the local service center operators and the other remote human operators of the system, respectively (i.e., users of the other modules). The last task is the synchronization of the clinical data with the electronic health record. Figure 8 shows the block diagram of the remote e-Health center including an intermediate node, the service center, and the connection with the HIS where the electronic health record of the patient is stored and where the specialist doctor can access and manage the telemedicine data and care plan.
Communications between the gateways, which are distributed throughout the area, and the acquisition block of the remote e-Health center take place through the public network. The acquisition driver implements the receiving endpoint, which is a SOAP (Simple Object Access Protocol) web service based on the HTTPS (Hyper Text Transfer Protocol, known as HTTP, over Secure Socket Layer, known as SSL) protocol able to manage both XML and HL7 CDA standard contents. Data coming from gateways are the results of the measurements performed by the caregivers. These are stored in the integrated database in order to be available for the other actors of the distributed telemedicine system. The remote e-Health center also manages the personalized monitoring protocol for each patient enrolled in the telemedicine program in terms of measurements to take and thresholds for alarm generation. The protocols of several patients can be loaded and updated remotely by calling from the gateway a dedicated configuration endpoint.
Dedicated software processes the received data by means of specific algorithms in order to find critical situations or dangerous alterations of vital signs. For example, those for CHF have already been published by the authors in [4]. It is possible to define personalized analysis profiles based on the needs of a specific patient. The processed information is stored into the integrated database and made available to the operators through different levels of the interface. The local interface is available only to service center operators and enables them to manage all the phases of telemedicine service provision. It allows for the enrollment and classification of new patients, the definition and updating of the treatment protocol for each patient, the establishment of personalized vital signs analysis profiles, and visualization and interaction with current and past measurements of vital signs. Moreover, it permits the operator to manage alarms or critical situations, eventually involving territorial emergency services or other appointed modules of the integrated system. Indeed, the remote interface allows professional operators (e.g., family doctors in Figure 1, etc.) to remotely access a subset of clinical information contained in the integrated database.
Another important role of the e-Health center is that of the relay agent for the clinical information received from the gateways with respect to the final destination, i.e., the electronic health record (see Figure 8). This process is completely transparent to the medical personnel and allows the information collected by the caregiver on the territory to be available in a few minutes in all offices that have access to the HIS. In this way, the electronic health record of each patient represents a deep anamnestic database and helps the medical personnel to improve the quality of treatment by developing therapy tailored to the specific patient’s needs.
In such a system, in which critical and personal information are exchanged through the public Internet, the confidentiality, data integrity, and authenticity of the communicating parts are among the major requirements. In the presented platform we selected the HTTPS protocol to protect all the communications between the gateways and the e-Health center. This protocol provides the normal HTTP request–response mechanism typical of web-based or web service-oriented applications over an SSL or TSL (Transport Layer Security) encrypted end-to-end tunnel. The communicating parties firstly authenticate themselves using the X.509 certificate, then use their asymmetric keys to establish and exchange a symmetric session key that will be used to encrypt all the traffic. Message hashing ensures the data integrity over the session tunnel.
Concerning hardware and software implementation, the service center consists of a room where specialized operators (i.e., trained operators, nurses, or specialist doctors) interact with the ICT infrastructure through dedicated terminals of a Linux-based server machine that hosts the integrated database (Oracle), runs the communication drivers and the processing software for alarm generation, and finally provides the graphical user interfaces. All the equipment running on the service center server received the CE certification according to the 93/42/CEE directive following integrations for data generation, interpretation, and visualization. In fact, this software has been classified as a class IIa medical device. It is compliant with the standard ISO 62304—medical software life-cycle, the standard ISO 14971—Risk management in medical devices, the standard ISO 60601—alarm systems in medical devices, and ISO 62366—usability engineering in medical devices.
In this telemedicine platform, vital signs data collected by CE certified biomedical devices are provided and interpreted for diagnostic purposes only through CE certified software. In this way, the acquisition and transmission chain involves certified elements and medical devices only at the extremities, while the gateway and the other intermediate elements simply propagate the information without dealing with the content. Patients use the wireless medical devices assigned to them, and the data is sent automatically to the e-Health Center through a gateway. The data received by the gateway are managed in raw format and wrapped in XML before transmission. The e-Health Center parses the raw data received through a CE-marked data interpretation driver in order to allow their use for medical purposes (diagnosis, therapy, etc.). In this way, even in case the intermediate gateway is not CE-marked as medical devices, the whole chain maintains the certification, because critical data are only generated by and managed by CE-certified elements.
The e-Health Center is a multi-disease, multi-device, multi-parameter, multi-language, multi-tenant web platform for the management of patients and the remote monitoring of their vital parameters. An alarm is signaled every time a parameter is not received within the patient’s schedule, and also if a parameter falls outside the ranges. Each patient has different ranges for red, yellow, and cyan alarms on each parameter. Specialized operators receive the alarms and handle them with appropriate protocols, which typically include contacting in a defined order one or more of: the patient, his/her caregivers, agreed neighbors and relatives, the family doctor, emergency services as ambulance, the fire brigade, etc. Depending on the established medical protocol, in the proposed system, the specialized operator in charge of alarm management can be the specialist doctor taking care of that specific patient, or a generic caregiver (i.e., trained operators, doctors of the hospital, or also a nurse). The operator performs further calls as needed and monitors the situation until resolved, recording in the e-Health Center all his/her activities and their outcomes. Patients can also have emergency (“panic”) buttons to directly call operators for remote assistance. The server application for the e-Health center is composed of the following software components:
-
Relational database: stores all the data and contains most application logic—including object-oriented PL/SQL data models, patient schedules, and alarm triggers. It is in charge of enforcing users’ permissions.
-
Java Enterprise Edition (JEE) web application, which implements and publishes the AJAX-based web 2.0 interface.
-
Driver: receives the raw data sent by gateways, parses them, and inserts the parsed measurements into the database.
-
Audit and Security System: monitoring component that detects and reports any malfunctioning. It also records the system activity.
The other main element of the architecture is the server gateway integration engine. This element is the link between data and the large set of heterogeneous management platforms on which the telemedicine services are based on. The technology used for the development of this part of the system is the JEE. From the functional point of view this module:
-
Receives raw data embedded into XML tags from the client gateway.
-
Transmits to the client gateway the agenda of the configured patient.
-
Allows the complete management of patients.
-
Transmits data to the server of the service centers with specific adapters.
-
Receives agenda by external clinical data management tools.

5. Wireless Biomedical Sensors

5.1. Wireless Sensor Selection

As discussed in previous sections, the proposed system exploits wireless biomedical sensors with BT and BLE connectivity. The telemedicine market is still growing, so standards are not frozen. Moreover, qualification and CE certification for medical use of a new device entail significant development time and costs. Development of a new sensor makes also sense for devices with high added value, with a key difference vs. the state of the art, or with a high potential market. For this reason, the approach we followed is developing custom sensors in three cases:
-
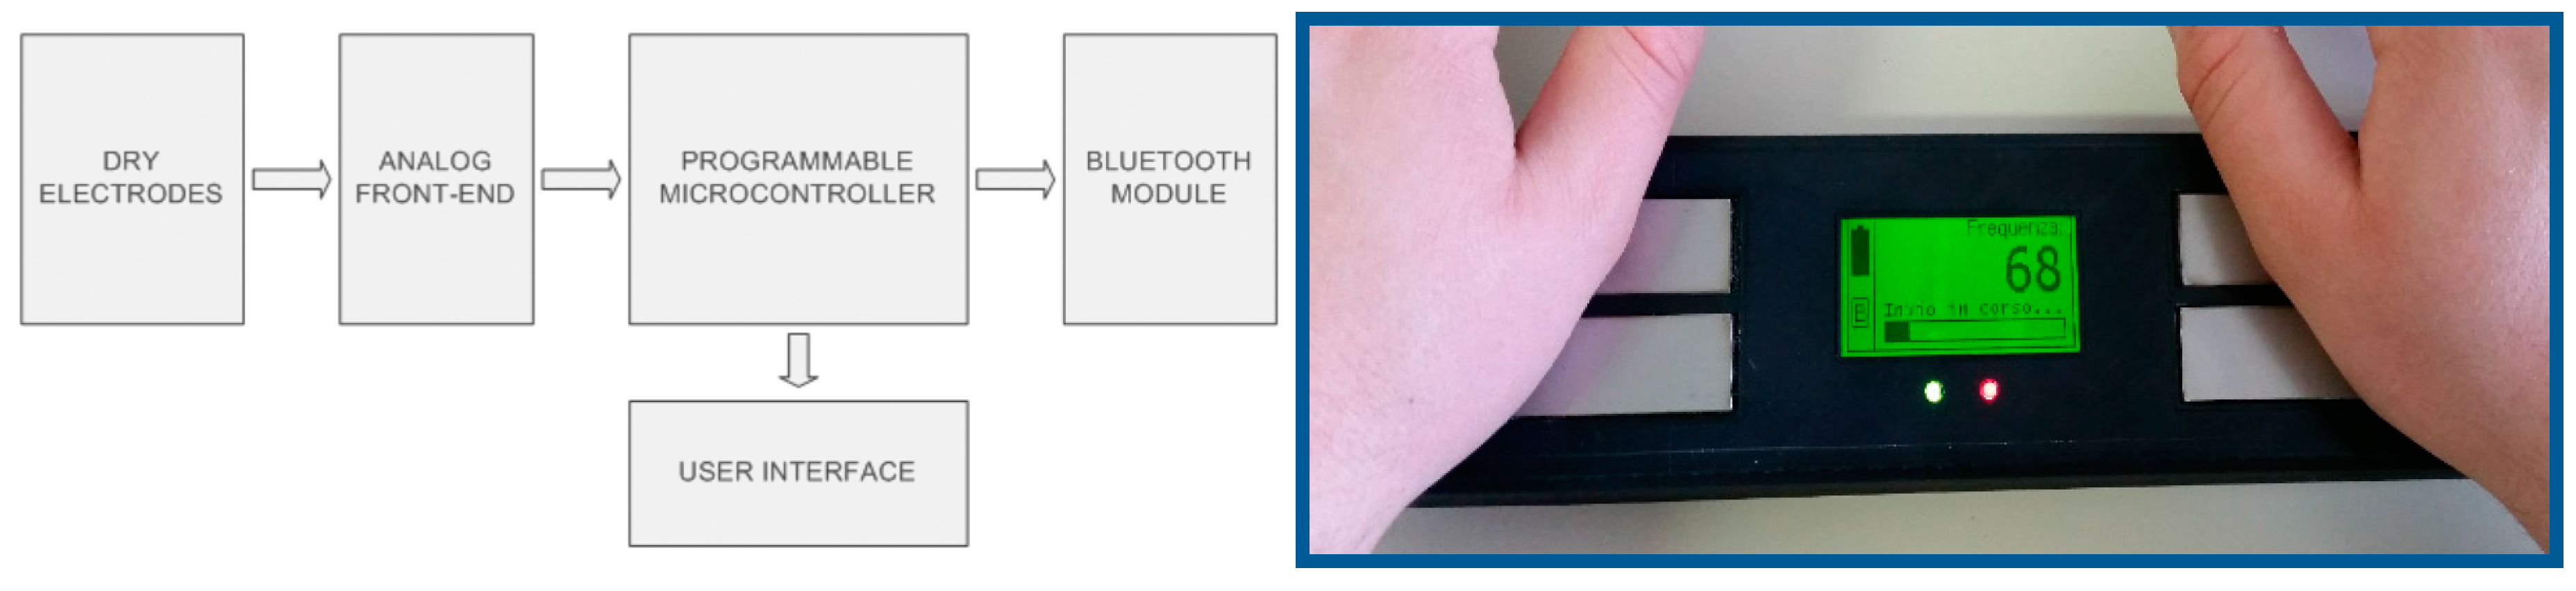
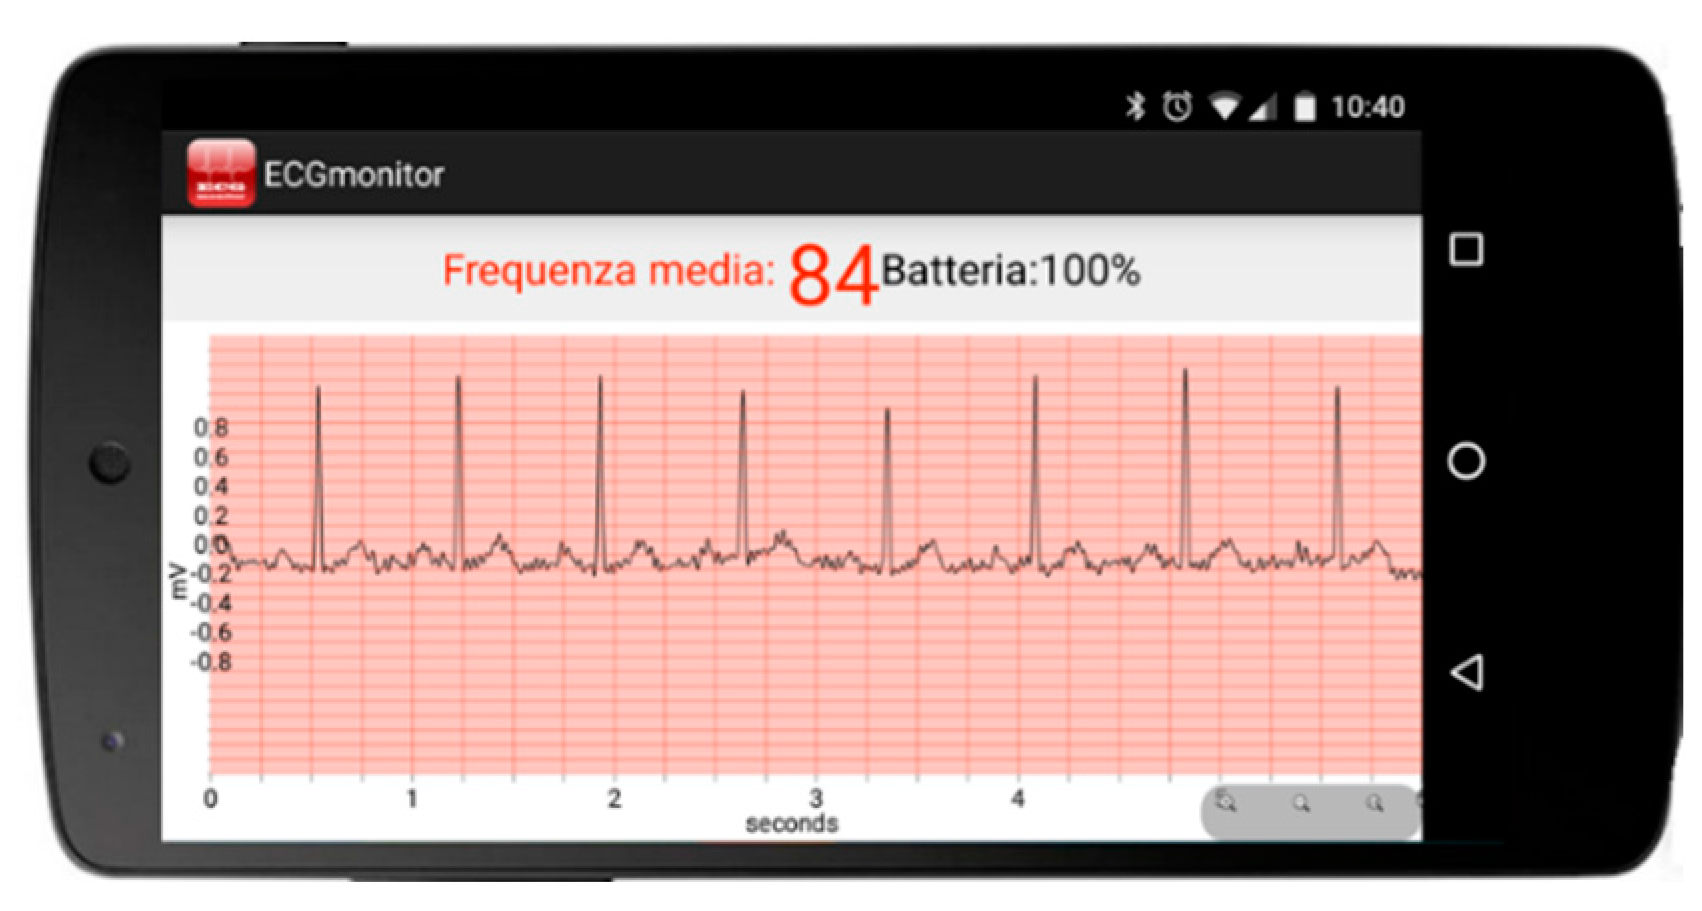
A single-lead ECG sensing device, patent-filed technology [33], which allows for self-monitoring of the heart in an easy way without the need to connect lots of electrodes in different parts of the body, but simply placing the two hands of the patient on top of a couple of electrodes. This sensor is further discussed in Section 5.2. This sensor, although simple and easy to use, can provide a graphical trace of the ECG and automatic measurement of heart rate and its statistics, thus being useful for arrhythmia monitoring.
-
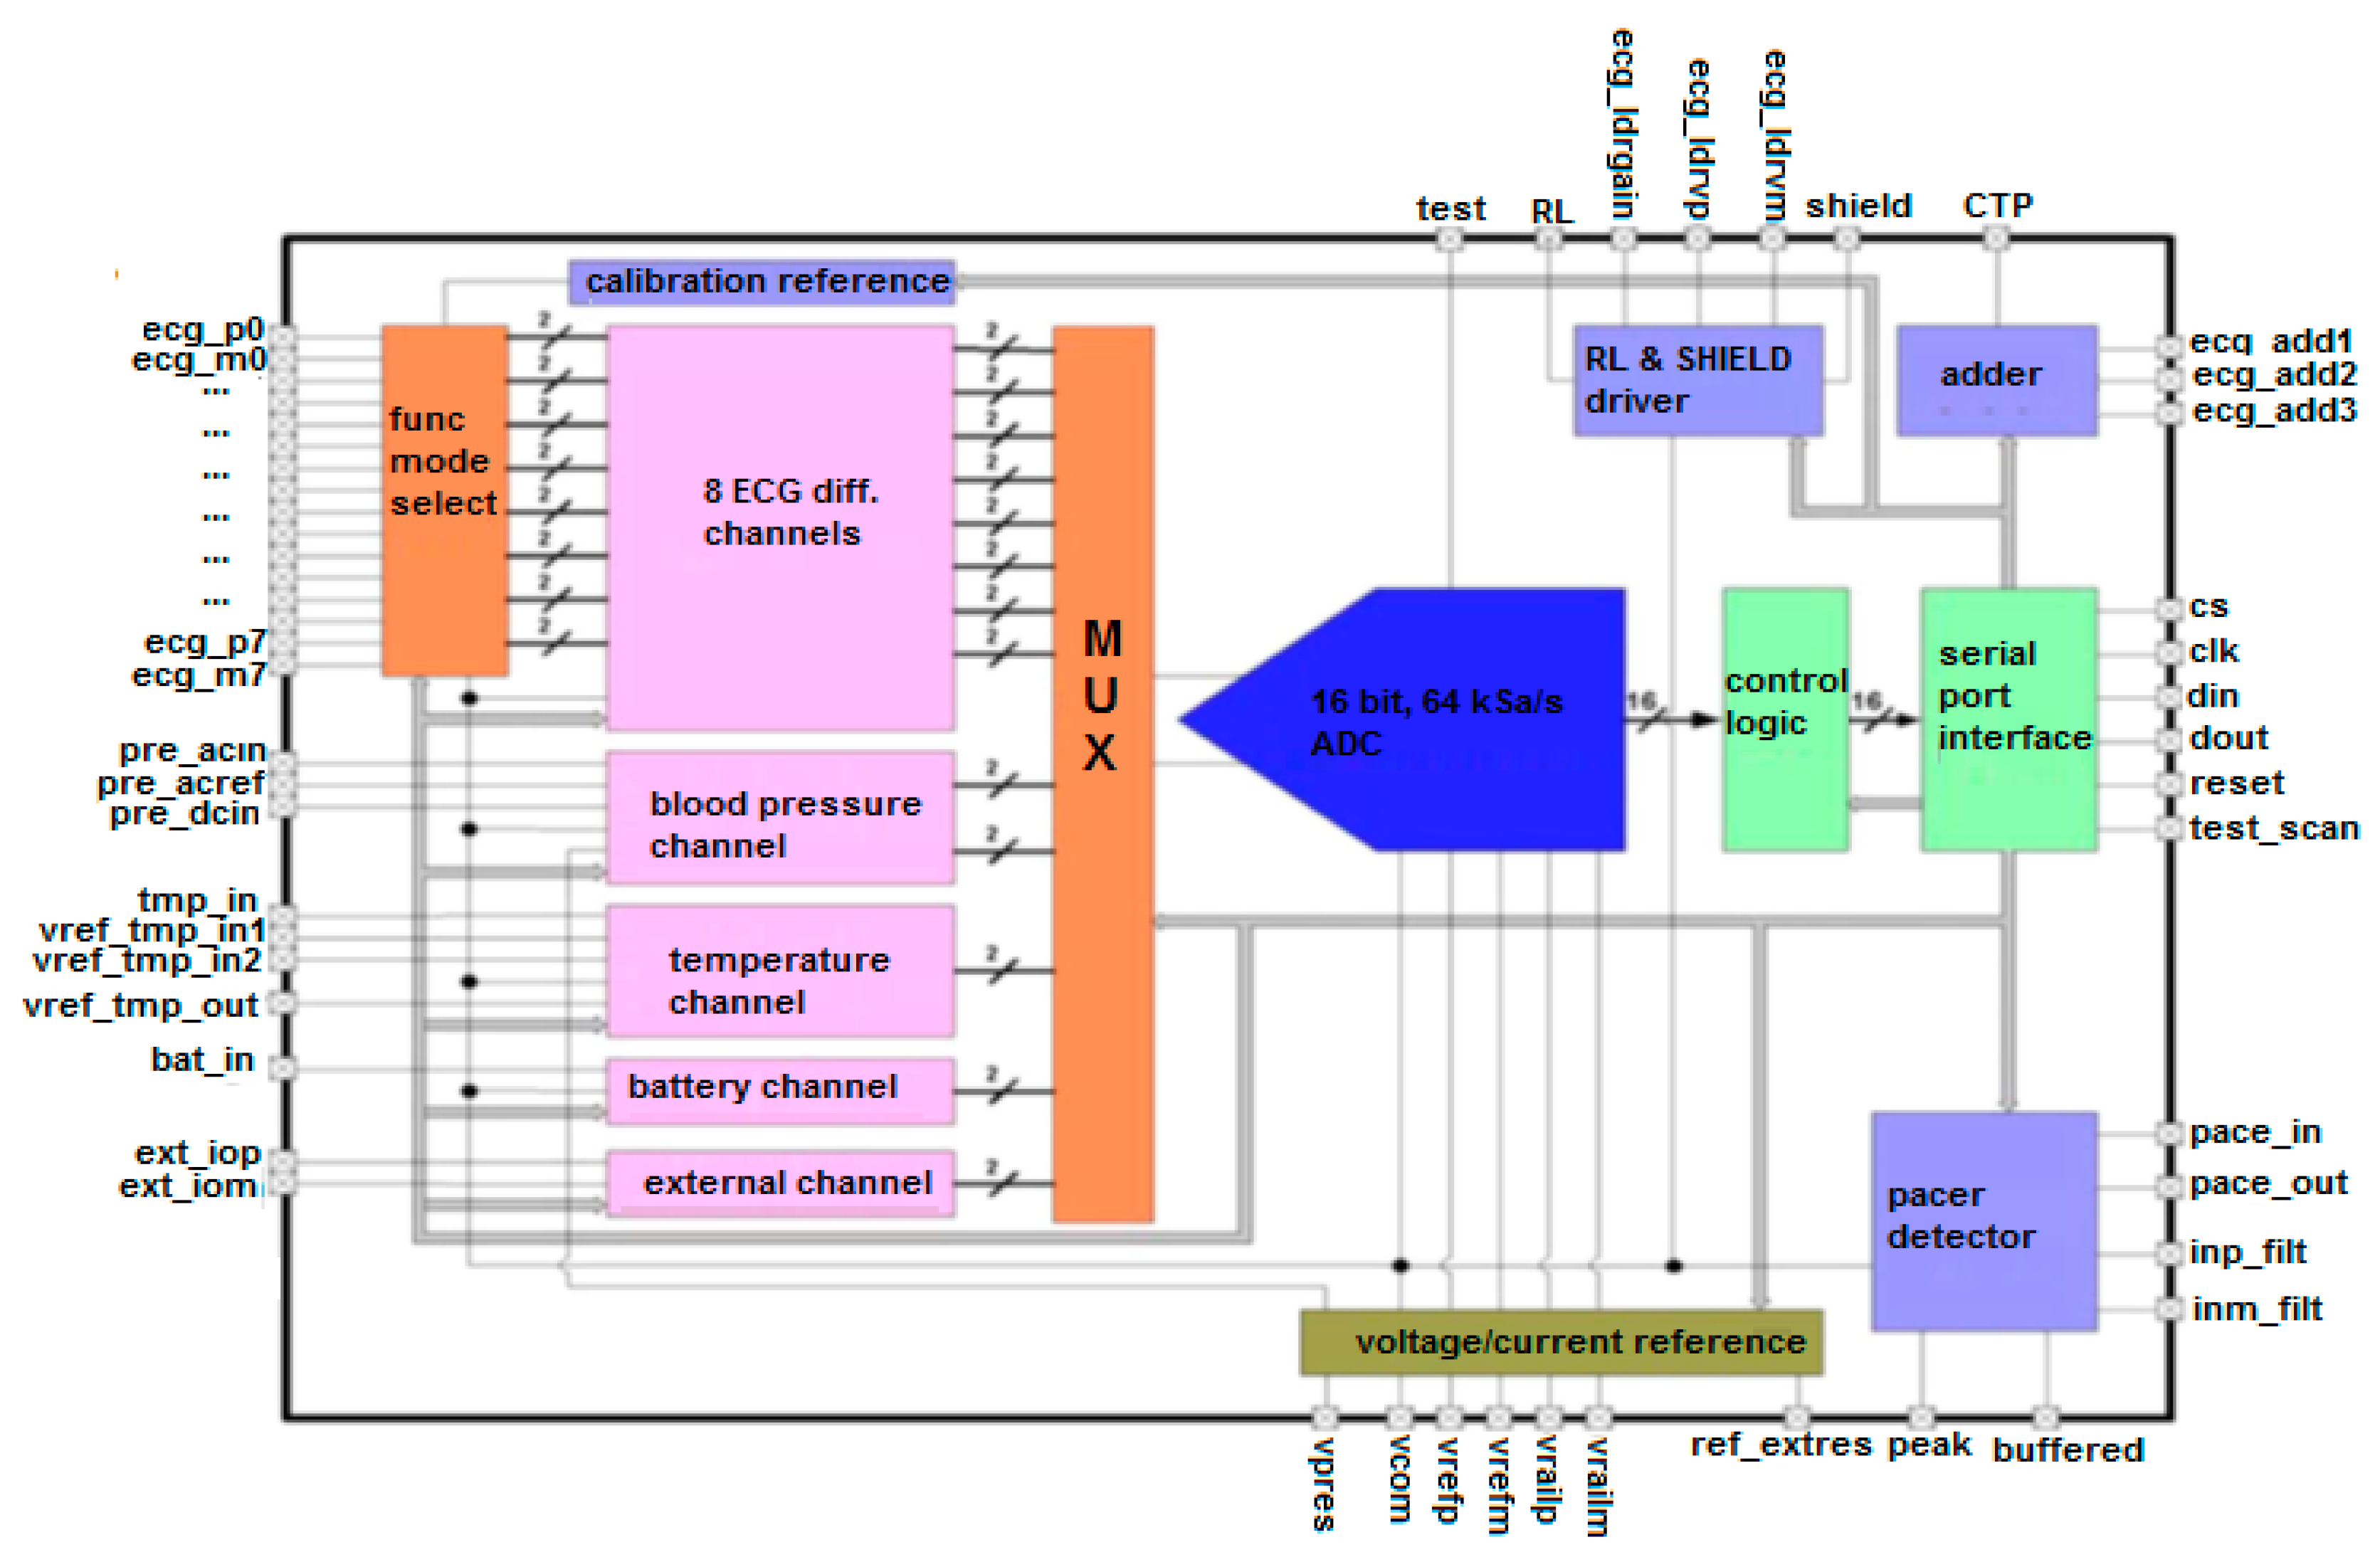
An integrated multi-channel Biomedical ASIC with a configurable sensor front-end [40,41], which allows multiple electrodes for multi-channel ECG or EEG or EMG measurements plus body temperature and blood pressure monitoring. The ASIC also supports automatic detection of pacemaker signals to avoid false alarm generation. This sensor is further discussed in Section 5.3.
-
A motion sensor for correct detection of the patient’s posture and possible falls. Indeed, the measurement of most biomedical parameters is influenced by posture. Therefore, the posture of the patient has to be acquired during remote monitoring to reduce the rate of false alarms or missed detection. As an additional service, motion sensors allow for the detection of patient falls and consequent alarm generation. Falls in elderly people are one of the main causes of accidents at home. This sensor is further discussed in Section 5.4.
The other sensors we selected are already qualified (i.e., CE certified) commercial wireless medical devices. Here the focus of our work has been first, together with medical staff from Fondazione Toscana Gabriele Monasterio, to define the set of measurements to take for each of supported chronic illness (CHF, diabetes, COPD) and the relevant requirements. Sensor specifications have been set in terms of dynamic range, acceptable noise and interference levels, signal bandwidth, sensitivity, and usability. Starting from this analysis, a set of BT and BLE sensors has been selected and integrated within the acquisition platform discussed in previous sections. Table 1 shows the main characteristics of the commercial sensors that have been used for the different illnesses monitored by the proposed biomedical platforms. Power consumption of commercial devices, as reported in their respective user manuals, is suitable for two or three months of use in a telemedicine service that requires one or two measurements per day. For example, the Cardioline Microtel Cardiette ECG device ensures at least 7 h of use with the same battery. This means that, assuming 2 min per measurement, the batteries need to be replaced about every 100 days.

5.2 Single-Lead ECG Sensor

5.2.1. State of the Art Review and Specifications of Devices for Patient ECG Self-Measurements

Many modern ECG devices for telemonitoring use a wide variety of technologies and methods to record the electrocardiogram from the patient and send it to the service center. For example, systems like Intelsens V-Patch [34], Iansys Lifecare [35], or Lifewatch Lifestar ACT [36] make use of adhesive disposable electrodes attached to the chest in order to detect the ECG. Then, proprietary wireless protocols and gateways are used for the transmission of the ECG through an Internet connection. A different method of ECG acquisition is adopted by DOCOBO doc@home [37], which uses four dry metal electrodes in contact with the hands and transmits the recorded ECG through a wired telephone connection. Other devices like Card Guard PMP4 SelfCheck ECG [38] or SolutionMD ECG Mobile [39] use Bluetooth technology for sending data to a third party gateway. The device in [38] acquires the signal through two dry metal electrodes put directly on the chest or, as an alternative, using 10 wet adhesive electrodes connected to the device by a cable. The device in [39] instead uses a number of capacitive wearable electrodes embedded in clothing. In many of these solutions the ECG measurement device has a complex human–machine interface (HMI), presenting many different functions and showing much information.
The main objective of the proposed ECG device is to be ergonomic and easy to use in order to encourage patients to periodically record and send their own electrocardiograms following an assigned plan. To achieve this goal patients, mostly elderly, should be able to use and maintain the device in complete autonomy. Thus, it is important to ensure that a low number of simple operations are required to record and send the ECG. Moreover, the interaction with the device should be easy and immediate. The need to provide supplies of disposable specific materials, such as the electrodes, could represent a problem especially for elderly people, who often have poor mobility. To develop an ECG device satisfying the requirements described above, the main issue is represented by the electrical contacts with the patient. The most practiced solutions involve the use of adhesive electrodes placed on the chest, arms, and legs, connected to the ECG device with cables. A less frequent alternative is the use of dry or wet metal electrodes, located on the device, to be put directly in contact with the chest. Although these devices are able to acquire a number of ECG leads ranging from three to 12, these solutions are not optimal for our purpose. An affordable solution may be to reduce the number of leads to one and to find an easy way to establish and maintain the contact of the electrodes with the body. For example, the patient could record the first lead of his/her own ECG signal just by placing his/her hands on the device. Then the recorded ECG is sent to the gateway discussed in Section 3, through an automatic preconfigured Bluetooth connection. Once the ECG device is paired with the gateway, the user only has to make sure that both are switched on and wait for the ready-to-record signal. Another important aspect is the HMI, which should be as simple as possible in order to allow the device to be user-friendly. Since elderly patients usually do not have confidence with technology, an interface that presents more than one or two buttons and many functions and indicators may be a cause of rejection. The proposed solution involves a HMI with only one button for switching the device on/off, a few LED indicators (green for power and red for heart rate), and a simple display LCD (128 × 64 pixels).

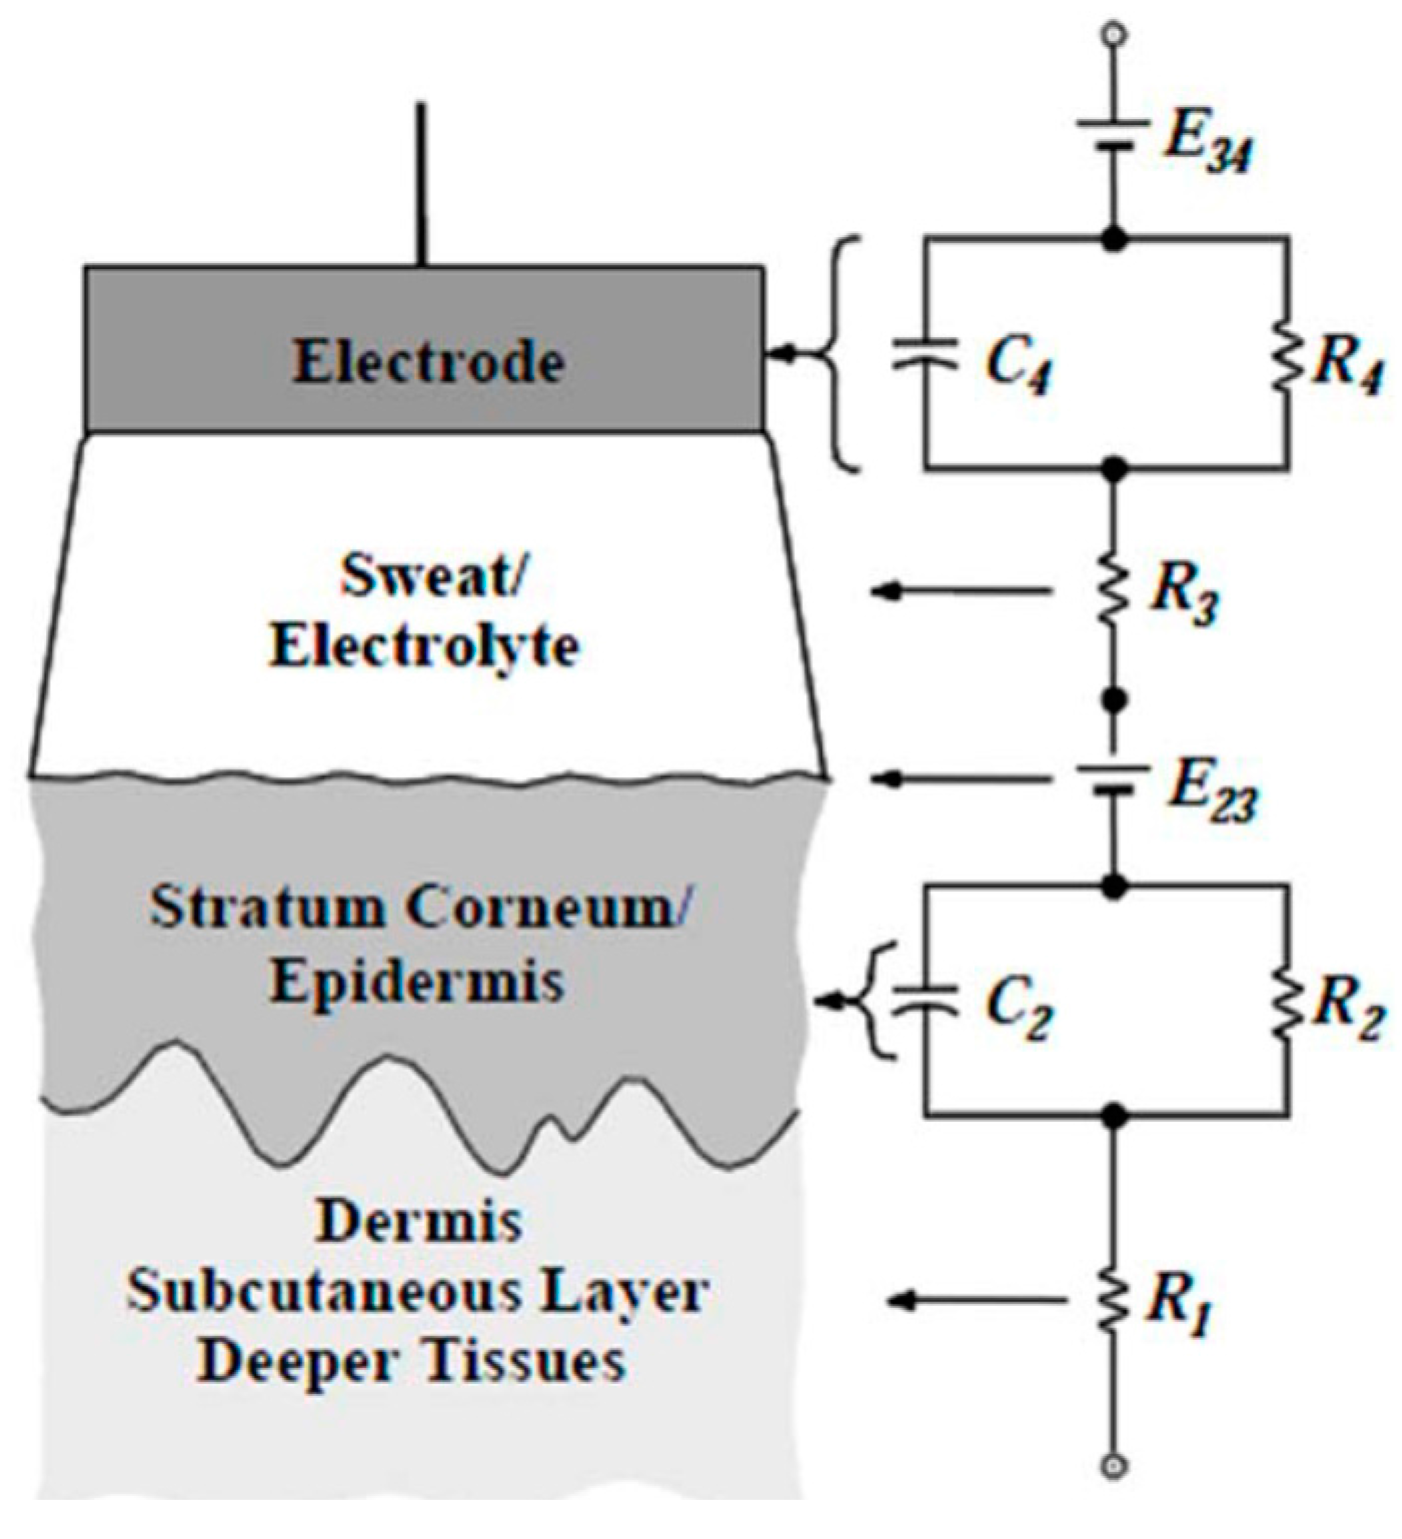
5.2.2. Analysis of the Skin–Electrode Contact and the Shape of a Hand-Based Single-Lead ECG Device

To acquire a good-quality ECG in a comfortable, quick, and easy way for the patient, it is important to find the best configuration for contact with the hands and an ergonomic shape for the device. Thus, one of the first steps was a study about the position of the hands on the contacts that was carried out with the help of Lifepak 15, a commercial professional electrocardiograph. The Lifepak 15 is equipped with two metal paddles, used for defibrillation, with which it is also possible to detect an ECG lead. By placing the hands on the paddles in different configurations, it was possible to compare the different qualities of the signal detected. In a previous work [17] we tested several different configurations, of which the four most interesting configurations are reported here:
(1)
paddles kept singularly in each hand with the palms in contact with the metal electrodes;
(2)
paddles attached to each other on the insulated back and kept in contact with the skin through the pressure of the hands;
(3)
paddles placed on a plane with the electrodes on the top, in contact with the fingers of each hand;
(4)
paddles placed on a plane with the electrodes on the top, in contact with the proximal part of the palm of each hand.
Comparing the ECG obtained, the best quality signal is achieved in the case where the palms of the hands are placed on the electrodes. In the other cases, where the fingers are involved or where muscle tension is needed to keep contact, the ECG presents some artifacts due to the difficulty of avoiding small movements that cause variations in the pressure of the skin over the electrodes.
Once we assessed the best hand–electrode contact configuration, another step was to investigate the best shape for an ECG device that will be ergonomic and comfortable to use. Several different shapes and ways to handle them were proposed to tens of elderly people. From the feedback of the testers, the configuration that best allows one to keep stable contact with the electrodes is a parallelepiped having dimensions of about 30 × 5 × 3 cm3, with the electrodes placed on a plane with the long side parallel to the chest, on which the user lays the proximal part of the palm of the hand. Testers also reported that the greatest comfort is obtained when laying the hands on the shape instead of keeping it steady with one’s hands. Furthermore, it is better to keep only the proximal part of the hand on the electrodes to avoid pressure on the wrists. This will cause an annoying feeling of pulsation during the measurement.
One of the most important aspects to be considered when using dry metal electrodes concerns the contact impedances of the electrodes with the skin, which represents the source impedances of the system [42]. Figure 9 shows a simplified model of the skin–electrode contact impedance that presents resistive and capacitive components.
When a differential amplifier is used to capture the electrical cardiac signal between two electrodes, the values of the two source impedances have a significant influence on the quality of the output signal. If the source impedances are unbalanced, an amount of common mode signal transforms into a differential component at the input of the amplifier, worsening the Common Mode Rejection Ratio (CMRR) of the system. Since it is impossible to guarantee two identical contact impedances, especially if dry electrodes are used, it is important that the impedance values are as low as possible in order to minimize the absolute value of the difference. Moreover, the impedances are susceptible to variations in time due to changes in the pressure of contacts or in the local conductivity of the skin. This introduces low-frequency artifacts over the desired signal. Furthermore, the presence of a capacitive component of the electrode–skin interface could also introduce a phase distortion in the signal if the magnitude of the contact impedances is not negligible with respect to the value of the input differential impedance of the amplifier. Thus, it is important to study the properties of the contact impedances at the point of the body where the signal is detected.
To understand the order of magnitude of the source impedances, a simple frequency characterization of the impedance of the hand–electrode contacts was made. A steel electrode, obtained from pediatric defibrillation paddles, was fixed to each hand using an elastic bandage to keep a constant pressure. A voltage-to-current converter and voltage amplifier circuit was realized to impose a current between the two contact interfaces and to measure the voltage that occurs between the two electrodes. By comparing the output signal with the input measured at different frequency values with the aid of an oscilloscope, it was possible to obtain the sum of the two contact impedances. Assuming the two impedances are equal, the value of one of them is half of the observed value. From experimental measurements the maximum value of the impedance is about 10 kΩ at low frequencies (DC to 3 kHz), while it decreases at higher frequencies. Since the magnitude of the skin–electrode impedance is negligible with respect to the input impedance of a common instrumentation amplifier, the phase value of the former was considered irrelevant.

5.2.3. Architecture of a Single-Lead ECG Device

Figure 10 represents the block diagram of the single-lead ECG biomedical device. It includes two dry electrodes, an analog front-end, a microcontroller, a Bluetooth module, and a user interface. The analog front-end circuit used to detect the ECG signal from the two contacts and to condition the signal includes as input stage an instrumentation amplifier (IA). The IA stage converts the differential input signal to a single-ended signal. The gain of this stage is low to avoid saturations due to input offsets caused by the half-cell potential of the skin–electrode interfaces, usually ranging from 300 mV to 1 V when unbalanced source impedances are present. The feedback loop on the reference pin of the IA has been sized to implement a first-order high-pass filter that eliminates the output DC offset acting on the reference voltage of the IA. The output of the IA is then amplified by a gain stage that realizes a single pole low-pass filter and is finally supplied to the A/D converter of the microcontroller. Filters are sized so that the overall band of the analog front-end is in the range of 0.5 Hz to 50 Hz. The common mode unwanted signal at the input of the first stage is collected in the middle point of the gain resistance of the IA. Then it is amplified by an inverting amplifier and inserted again into the body through a third electrode in order to realize a negative feedback on the common mode disturbing signal. This feedback loop is historically called “Right Leg Drive” and allows us to substantially reduce the noise caused by the pairing of the patient with many sources of disturbing signals such as power lines.
An eight-bit RISC microcontroller evaluation board, the Atmel XMEGA-A3BU Xplained, was used to realize the sampling, the digital elaboration, and the control of the system. The firmware performs a fine-grained filtering of the ECG signal in the digital domain, provides the elaborated samples to the Bluetooth 2.0 module with SPP profile, and manages the user interface. Moreover, an algorithm calculates the heart rate. The sampling rate is 500 sps and the filter applied is a highly selective FIR filter, built with 516 coefficients, having a passband ranging from 0.6 Hz to 37 Hz, and presenting a notch response at 50 Hz (i.e., the power line frequency in Europe; for other nations the filter response can be moved to 60 Hz). This filter achieves a clean signal in a frequency range defined “monitoring band” that is suitable for ECG monitoring. The lower band limit of the filter is as low as possible in order to allow the low-frequency components of the ECG signal to pass, but high enough to attenuate the oscillations caused by the hand–electrode contact impedance variations. The heart rate is calculated using the method of thresholding of the energy signal. In order to highlight the QRS complex, the ECG signal is filtered again with a 15-Hz low-pass FIR filter and the resulting samples are squared, obtaining a power signal. The power signal is then compared with a threshold that is proportional to the mean value of the power signal itself over a time window, which represents the local energy of the signal. When the threshold is exceeded, a QRS complex is detected and the time distance between near QRS complexes allows us to calculate the heart rate. The microcontroller uses an UART port to send to the Bluetooth module the filtered ECG samples to be forwarded to the gateway using the SPP profile. The module can be configured in two working modes by pressing one of two buttons while powering on the ECG device. In slave mode the module always waits for Bluetooth connection requests from the gateway, whereas in the master mode the module itself sends connection requests when a previously paired device is found. When a button is pressed the paired list is cleared and the device always waits for a pairing request. Pairing procedure requires a PIN. The master mode allows the user to keep the gateway always on and to establish an automatic connection just by powering on the ECG device. Once connected, the firmware of the microcontroller provides autonomy and transparency to send the ECG samples to the gateway. The microcontroller also drives the user interface, consisting of four LEDs indicating the status of the device and a LCD that shows the heart rate value and the progress of the acquisition.
For the overall power consumption let us consider a current consumption of about 100 mA, drained from a supply voltage of 3.3 V. The 4-AA battery pack ensures more than 15 h of continuous data streaming, which, considering its typical use in a telemedicine service (i.e., one measurement per day), means approximately six months of autonomy.

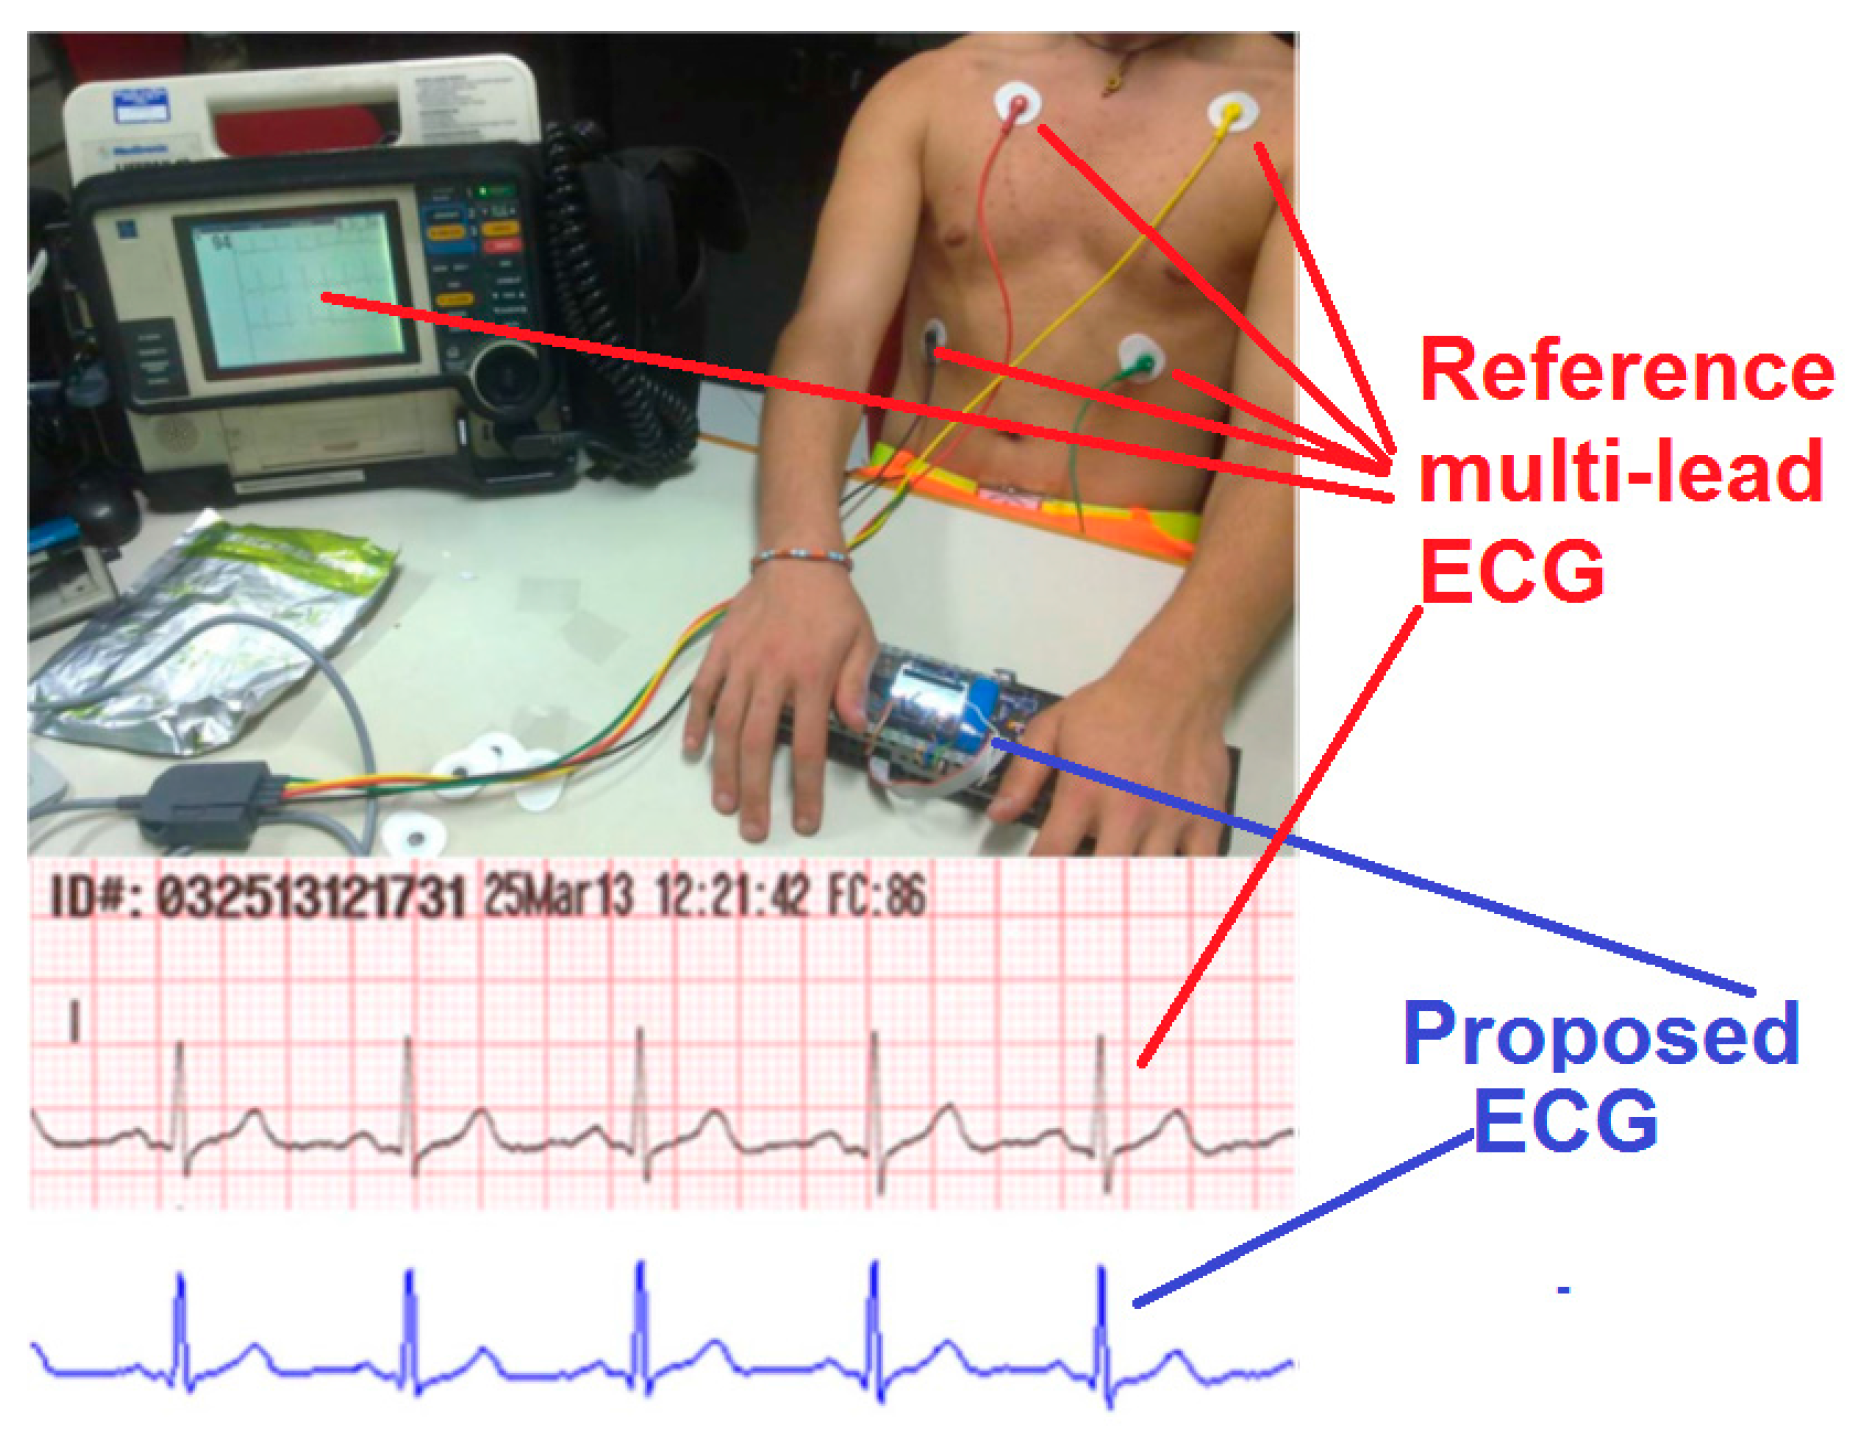
5.2.4. Testing of a Prototype Single-Lead ECG Device

The first prototype was realized and its performance in terms of user-friendliness and ECG quality was analyzed in an experimental trial with tens of testers, among them 12 elderly people with an average age higher than 60. While simplicity is important to ensure usability by all patients, ergonomics also has a relevant role in the quality of the ECG signal because it influences the stability of the position of the patient during the acquisition. After receiving a few instructions, all the testers were able to use the device without any help and reported as feedback that the position of the hands was comfortable and easy to keep for some minutes. Figure 10 and Figure 11 show the hands of a tester on the prototype and the related ECG acquired. Another test campaign was done for comparing the quality of the ECG obtained using the prototype with the ECG obtained using the Lifepak 15 configured in the “monitor band” mode (i.e., 0.5 Hz–40 Hz). Figure 11 shows the result obtained, acquiring an ECG simultaneously on the same tester using both the prototype (by placing the hands on the electrodes) and the Lifepak 15 (by attaching the adhesive electrodes on the chest). The black trace on the graph paper in Figure 11 is the printed output of the Lifepak, whereas the blue trace is the prototype data using the new single-lead ECG device. The first two leads obtained at the same time with the two different devices are very similar and overlap almost perfectly. The minimal worsening of the signal quality, mainly due to the limits imposed by the skin–electrode contact set-up, is acceptable considering the significant improvements to the device usability.
Differently from [17], the newly developed single-lead ECG sensor can also be used as a stand-alone personal care device in connection with a smartphone or tablet acting as a storage and display unit (see Figure 12; the interface, in Italian in this specific example, can be regionalized according to the device language settings). Through the BT connection the acquired signal is transmitted to an Android OS-based terminal where a custom-developed app exploits the terminal processing and memory hardware resources to filter the signal in the digital domain, displays the ECG trace on the LCD screen, and allows us to build a repository of recorded ECG traces. Table 2 summarizes the main characteristics of the single-lead ECG device.

5.3. Multi-Channel Biomedical ASIC Sensor

5.3.1. General Architecture of the Biomedical ASIC

As discussed in Section 5.1, an ASIC has been designed and manufactured in AMS CMOS 2 Metal Layers 2 Poly technology, to ensure multi-sensor integration in the same wearable and portable medical device. The ASIC is assembled in a 14 × 14 × 1.4 mm3 TQFP (Thin Quad Flat Package) with 128 pins and used at 3.3 V. The current drained from the power supply is 10 mA in typical operating mode (i.e., 33 mW power consumption). Its operating temperature range is from 0 °C to 70 °C, which is fully compliant with use at home. It ensures multiparametric biomedical signal acquisition. The ASIC has been designed in the framework of the Health@Home European (EU) project in collaboration with CAEN spa, taking into account the typical constraints of biomedical signals monitoring like multi-lead ECG, blood pressure monitoring, and body temperature. With reference to the ASIC functional block in Figure 13, the main building blocks of the ASICs are described hereafter. A fully configurable multi-channel ECG block is present, with eight input differential channels (e.g., 16 input pins) for signal conditioning including amplification, filtering, and offset regulation for 3-5-12-leads ECG systems. There is also an adder generating the Central Terminal Point (CTP) for precordial leads, a right leg (RL) driver, and a SHIELD driver to reduce the Common Mode 50 Hz noise. A pacemaker detector section allows for pace pulses detection on a dedicated pin. All is in conformity with the IEC 60601-2-51 2003-02 standard. There is also one analog channel designed for decoupling and amplifying a blood pressure signal coming from an optional external pressure Sensor. Another input analog channel is used to process a temperature signal provided by an external temperature sensor. One programmable analog MUX allows for switching among the channels to be converted by the ADC. A 16-bit SAR (Successive Approximation Register) ADC is used to convert the voltages from the analog channels. The relevant Effective Number of Bits (ENOB) is 12. A serial peripheral interface (SPI) [41] is used to configure the chip settings and for data readout. A dedicated battery channel is present to monitor the battery status. On-chip diagnostic features, as in [43], are also integrated in the biomedical ASIC.

5.3.2. Analysis of Specific ASIC Channels

Hereafter we describe the architecture of the specific channels for the monitoring of ECG, blood pressure, temperature, and device battery status.
Each single ECG channel is composed of an IA with high CMRR, a programmable gain amplifier (PGA), a BUFFER, and an offset regulator block. The IA has a high CMRR (100 dB typical; 92 dB minimum) in order to reduce environmental electric interferences, like the 50 Hz noise from the industrial network, always present in both electrodes that are connected with human body, and the ground. The power supply rejection ratio (PSRR) is 100 dB typical, 96 dB minimum. A first-order high-pass filter, obtained through an external capacitor, removes the low-frequency baseline wandering that is so common in ECG circuits (usually due to electrodes). An anti-aliasing filter is obtained with an external RC network. A PGA is used to provide four gains, 18, 24, 36, and 48, for standard ECG measurement. The IA has a gain of 15.6 set with an external resistor of 1.2 MΩ. Therefore, the total gain can be configured up to roughly 700. The third stage is a buffer section with fast settling that sends out the signal to the ADC. Each ECG channel has some switching MUXs placed in the input section, and is configurable via SPI command. The architecture of the ECG channel implements a baseline, therefore quickly rectifying any time variations in the signals due to artifacts that cause a temporary saturation of the IA. Offset regulator and gains regulator procedures are also available for each channel. If the ECG measurement is chosen, a cyclic procedure is activated, and the analog MUX connects this section to the ADC. Within 100 μs (worst case), all the channels are processed. Each ECG processing channel has also been characterized in terms of noise: the input referred noise measured in the range 0.1 Hz to 150 Hz is within 10 μVrms.
The Adder block is used to obtain the CTP signal reference to be used as inverting input for each channel that receives a pre-cordial signal. A driven RL circuit (RL Driver block) helps to set the common mode, and is safer than connecting the RL to voltage reference. The circuitry, able to drive in active mode the shield of the ECG cables (SHIELD Driver block), helps reduce the Common Mode 50 Hz noise.
A pacemaker detector block is also integrated in the ASIC to provide band pass filtering on the ECG signal, full wave rectification for detecting pacemaker pulses of either polarities, peak detection on the filtered and rectified signals, and discrimination relative to a programmable threshold level. Once a pacemaker pulse is detected, it provides on the dedicated output digital pin a pulse whose duration is configurable via SPI.
The Blood Pressure section includes two channels. One is an analog channel that converts a DC single-ended, ground-referred voltage to a differential voltage suitable to be converted by the on-chip ADC; it amplifies this signal. Input signal ranges between 0.5 V (0 mmHg) and 1.7 V (300 mmHg). The offset voltage for single-ended/differential conversion is provided by the internal references generator block. Another analog channel amplifies the AC component of the input pressure signal and translates the DC component around a reference voltage. Extraction of the AC component is assured by two external capacitors and one external resistor. If the BP measurement is chosen, a cyclic procedure is activated, and the MUX connects this section to the ADC.
The skin temperature measurement channel uses an NTC resistor as input sensor: the NTC resistor has a nonlinear voltage–temperature characteristic so an additional circuit is used to improve the linearity of the response in the range of the acquisition system from 32 °C to 42 °C, including body temperature.
The ADC structure used in this design is a SAR architecture, made by three main blocks: a sample and hold stage, a comparators stage, and a residue-multiplying DAC stage. ADC needs 16 clock cycles (1 MHz) to produce a 16-bit output code. The ADC has an INL of ±1 LSB and a DNL of 0.75 LSB (worst case). The offset and error gain of the ADC are below 0.5% and 1.5% of the full scale range, respectively.
Finally, the battery channel is used to monitor the battery status. Integrated bandgap circuits are used to internally generate reference levels from 1.1 V to 3.5 V.
In the experimental trials in Section 6, the biomedical ASIC has been configured so that the ECG is acquired involving three channels and the RL driver. The blood pressure channel and the temperature monitoring are also used in some configurations. Table 3 summarizes the characteristics of the biomedical ASIC.

5.4. Motion Sensor for Fall and Posture Detection

As discussed in Section 5.1, a custom mobility sensor to study body movement has been developed in the framework of the EU-Tuscany Region FESR project RIS (Research and Innovation in Healthcare Systems) in collaboration with TD Nuove Tecnologie S.p.a. In more detail, the newly developed sensor is able to extract the following parameters: fall detection, static detection (no movement is detected), step detection, and stride estimation. The sensor has been designed to be small enough and have a low enough weight that it can be worn, also for medium-term periods, without any impairment of normal activities for the patient. The sensor in Figure 14 has been implemented on a small PCB, equipped with System in Package (SiP) device containing a nine-axis MEMS Inertial Measurement Units (IMU). The sensor contains a 3-axial gyroscope plus a three-axis accelerometer and a three-axis digital compass. To fuse the information coming from the three sensors avoiding realignment or calibration issues, proper digital signal processing algorithms are implemented in real time on a 32-bit ARM Cortex-M processor. Two built-in algorithms run on the device: the first computing the step detection, stride estimation, and energy consumption; the second determining falls or the absence of movement. Communication with the gateway is based on a Bluetooth 4.0 LE chipset, integrated into the device. The motion sensor can be supplied at 3.3 V draining a current of few mA in normal operating mode. The onboard Li-Po rechargeable battery (3.7 V, 240 mAh) ensures about 80 h of continuous data streaming. Its size is comparable to the size of a 50 euro cent coin.
The algorithm implemented for step detection consists of four main stages. In the first stage, the magnitude of the acceleration ai for each sample i, captured by the accelerometer, is computed. In the second stage, the local acceleration variance is computed to remove gravity. The third stage uses two thresholds: the first (T1) is applied to detect the swing phase, whereas the second (T2) is applied to detect the stance phase (B2i) in a single step while walking. The fourth stage is detected in sample i when a swing phase ends and a stance phase starts. Estimating the Stride Length (SL) is necessary, at every detected step, in order to calculate the total forward movement of a person while walking. Here, SL depends on the person, his/her leg length and walking speed, and the nature of the movements during walking, etc. The algorithm proposed by Weinberg [20] assumes that SL is proportional to the bounce, or vertical movement, of the human hip. This hip bounce is estimated from the largest acceleration differences at each step. The algorithm implemented for SL estimation consists of the following steps. The first step computes the magnitude of accelerations ai. The second step estimates the SL using the Weisberg expression in Equation (1) [19], where the maximum and minimum operations are applied over the filtered accelerations in a window of size 2w+1 around the sample i(p) corresponding to the p stance detection. In Equation (1) K is a constant that has to be selected experimentally or calibrated. If the length SL, estimated by the method above, and the frequency of the step is known, it is possible to derive the velocity of each step as the ratio of the two sizes.
S L = K · m a x j = ( i p ± w ) a j ˜ 4 m i n j = ( i p ± w ) a j ˜
If the length SL, estimated by the method above, and the frequency of the step is known, it is possible to derive the velocity of each step as the ratio of the two sizes. The algorithm implemented to determine a fall is based on the controls of the thresholds. A fall-like event is defined as an acceleration peak of magnitude greater than 3 g followed by a period of 2500 ms without further peaks exceeding the threshold. The accelerometer-sampling rate has been set at 50 Hz, a trade-off between resolution and power consumption. Threshold values around 3 g (ranging from 2.5 g to 3.5 g) have been widely used in other fall detection systems [22]. The value 3 g is small enough to avoid false negatives, since real falls are likely to present an acceleration pattern containing a peak that exceeds such a value. Several sensor placements have been already tested, e.g., the waist, trunk, leg, hip, and foot. From our test, although data from all locations provided similar levels of accuracy, the hip was the best single location for recording data for activity detection. It provides better accuracy than the other investigated placements [23]. This location is optimal for the implementation of more efficient algorithms, as it allows a cleaner signal from the IMU. However, the exact position and orientation of the platform on the hip are not important, because many algorithms only work with the magnitude of sensor readings. Table 4 summarizes the characteristics of the motion sensor.

6. Experimental Trials

6.1. Experimental Trial Projects and Motivations

The proposed telemedicine platform, comprising remote monitoring kits (i.e., biomedical sensors and gateways), service center applications, and Electronic Health Records, has been developed and improved in the framework of different funded projects (ongoing or recently closed).
Health@Home EU Ambient Assisted Living project: remote monitoring of CHF patients recently dismissed from hospital through self-measurement of the main vital signs.
Domino project, funded by Arezzo’s local health authority: remote monitoring of chronic patients (mainly cardiac) with periodic in-house visits performed by nurses and circulation of clinical data among all personnel involved in the patients’ care (e.g., family doctors, specialists, etc.).
RIS (Research and Innovation in Healthcare Systems) EU-Tuscany Region FESR project: personalized and integrated remote monitoring of chronic patients, connecting in-hospital care and out-of-hospital follow-up based on the “1:1” scenario (self-measurements) or “1:N” scenario (measurements made by professional caregivers).
RACE (Research and Accuracy in Cardiology based on Evidence of clinical data) EU-Tuscany Region FESR project: long-term trial with health economic analysis in order to evaluate the impact of the telemedicine model on the economic burden of the PHS.
All these projects included a trial phase in the real-world telemedicine scenario with the involvement of patients and medical personnel. An exhaustive in-field demonstration phase is crucial to assess and improve the effectiveness of telemedicine platforms. The primary outcomes of our validations were, from a technical point of view, the usability of the system and its affordability, whereas from the medical point of view they were the quality of the clinical data and the ability to improve patient care.

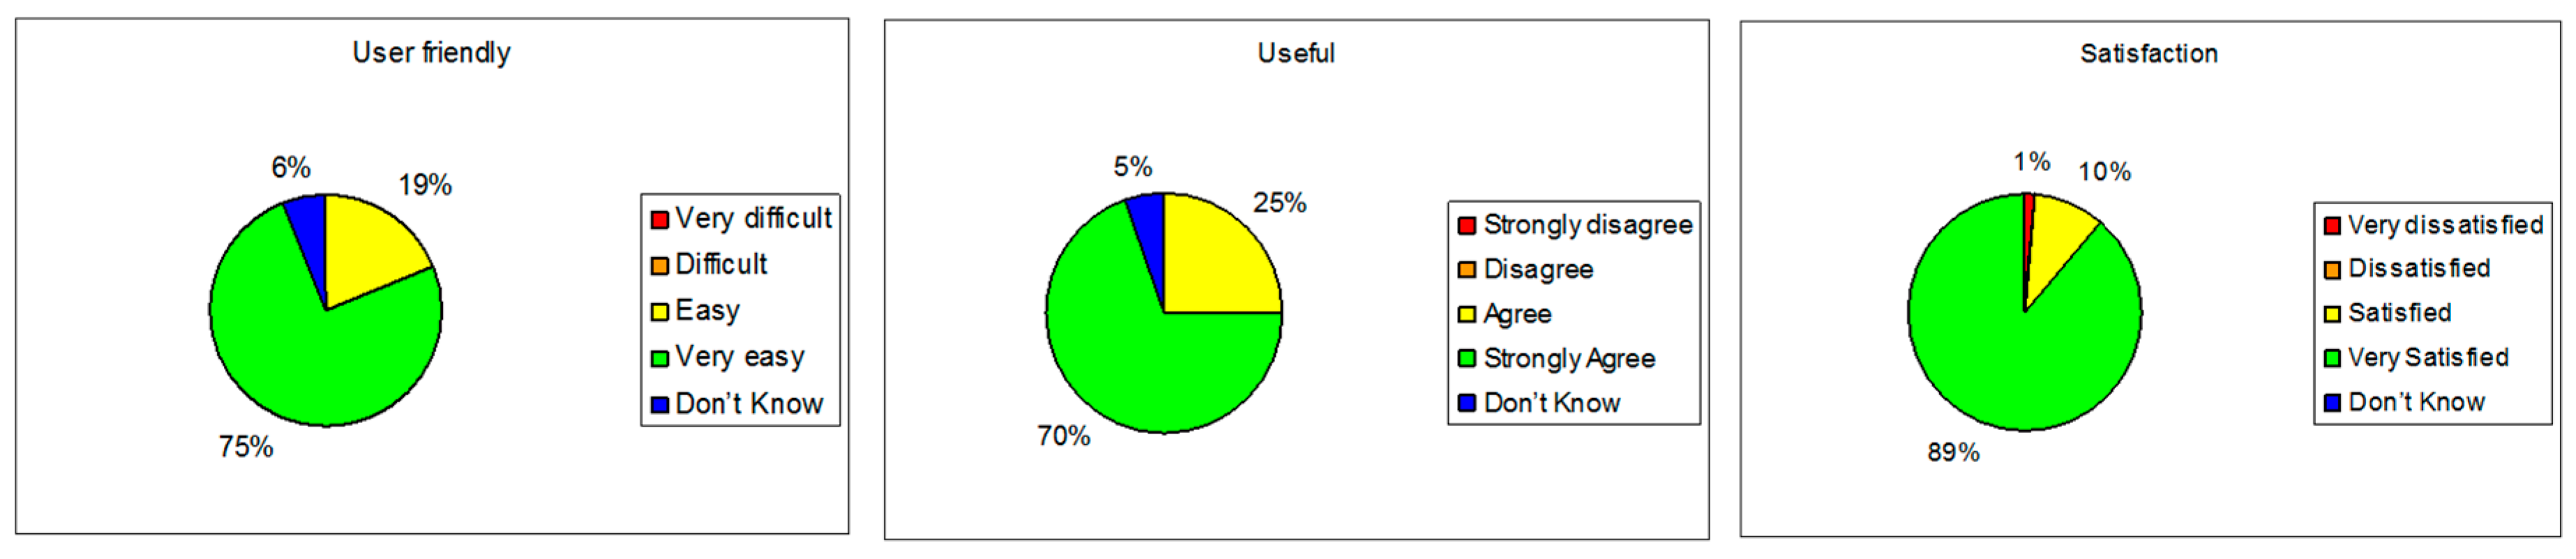
6.2. Health@Home Experimental Trial Results

In the trial prepared for the Health@Home project, the platform was used according to the “1:1” scenario. The validation of the telemedicine platform was implemented involving 30 patients (average age of 62 years) affected by CHF coming from three different hospitals (Hospitales Universitarios Virgen del Rocio in Spain, Zdravstveni Dom Koper in Slovenia, and Fondazione Toscana Gabriele Monasterio in Italy), under the supervision of two doctors specializing in cardiology from each hospital. The minimum monitoring period was three months. Inclusion criteria included diagnosis of heart failure, New York Heart Association (NYHA) classes III and IV, at least one hospitalization for acute heart failure in the previous six months, and agreement to take part in the study. Acute coronary syndrome within three months before the enrollment was the only exclusion criterion. Patients were enrolled in the study at time of discharge from the hospital where they were admitted for acute heart failure or during a routine ambulatory visit. At enrollment time they received a monitoring kit with digital scale, blood pressure monitor, oximeter, ECG device, telemedicine gateway, and brief training on how to use the system. Both a technical and a medical contact were available for patients during the trial.
In order to validate the platform, specialist doctors were asked to check the information that arrived to HIS, evaluating the quality and coherence of the data collected and the relevance of the alarms automatically generated by the platform. Moreover, a specific questionnaire was developed to gather feedback from patients, caregivers, family, and specialist doctors about the end-user usability. The robustness of data storage and data transmission was also evaluated.
The results show a very limited number of activity misses (<3%), mostly in the first days of monitoring, also confirming the property of such a telemedicine system to improve the therapy compliance. Additionally, the number of false positive alarms is less than 5%. No connectivity, storage, and transmission problems, including data loss, occurred. All end-users reported valid impressions of the platform and a good satisfaction level in the final questionnaire. Table 5 and Figure 15 show the scores reached in each macro-parameter for medical staff and patients, respectively. Medical personnel reported that the use of this platform does not impinge on their regular activity, while it represents a valid means of controlling at a distance the progress of their patients thanks to the high quality of acquired signals and alarm detection capability. All specialist doctors are definitively in favor of the adoption of the platform. In addition, 89% of patients report a very high satisfaction level, highlighting the friendliness of the solution and the ease of following the daily therapy.

6.3. Domino Experimental Trial Results

The trial carried out in the Domino project exploited the potential of the presented platform for the provisioning of a telemedicine service according to the “1:N” scenario. In particular, under the supervision of the Local Health Authority of the city of Arezzo in Italy (ASL8), a group of 50 consenting chronic patients mainly affected by cardio-respiratory diseases (e.g., CHF, COPD) and already following the Chronic Care Model procedures was monitored for a period of six months. According to the “1:N” scenario, the proposed telemedicine equipment was used by two nurses allocated by the ASL8 to this trial during the domiciliary visits. In this study, a telemedicine kit with a gateway and a set of biomedical sensors (i.e., 12-lead ECG device, oximeter digital scale, blood pressure monitor, glucometer, and spirometer) was provided to each nurse in order to collect vital signs during the domiciliary visits scheduled according to the personalized healthcare plan of each patient. This ICT-assisted method allowed an almost real-time distribution of the acquired vital signs to all people interested in the patient’s care thanks to the automatic transmission of data directly after the acquisition from the gateway to the online platform.
In order to evaluate the platform in term of usability, impact with respect to the traditional method, and capacity to improve the management of the chronic patients, medical personnel involved in the pilot were interviewed at the end of the period. Additionally, the robustness of data storage and data transmission was evaluated.
From a technical point of view, no data loss occurred during the trial. In some cases real-time transmission of the collected data was not possible due to missing availability of mobile broadband connectivity. The main benefits of the “1: N” solution, highlighted by the medical staff, are:
-
Synchronization of the vital signs of the patients as soon as they are acquired in the e-Health center, through an automatic procedure that minimizes the possibility of errors due to manual insertion of values.
-
Clinical information sharing among the family doctor, the specialists, and the rest of the caregivers, without any time or distance barriers.
-
Reduction of the duration of the domiciliary visits, and a better scheduling of the work flows.
Table 6 summarizes the interviews with the nurses who used the telemedicine kit.

6.4. RIS Experimental Trial Results

In the framework of the RIS project, the complete telemedicine platform described in previous sections was extensively tested. The rationale was to test the ability of the platform to provide effective telemedicine services involving in an integrated and coordinated fashion the hospitals, the territorial services (i.e., family doctors, local Health Authorities, etc.) the clinical specialists, and in general all the caregivers and stakeholder of the healthcare system. For these reasons, all paradigms described in Section 3 were used in the pilot: self-measurements performed by the patients, domiciliary visits assigned to nurses and health corners in public places (e.g., pharmacies, medical centers, residences for elderly people, etc.). Moreover, the platform enhanced the role of the service center as a central point of the architecture for the circulation, management, and sharing of clinical information. Operators received specific training in how to manage the data coming from the telemedicine systems and how to handle alarms. A group of 10 chronic patients, with CHF as the main complaint but also affected by some comorbidities such as diabetes, was monitored for at least one month according to a structured and personalized healthcare program that included self-measurements and periodic (i.e., weekly) in-house visits.
At the end of the trial, the overall platform was evaluated through questionnaires and direct interviews. The metrics established for the evaluation of the system belong to two main categories: objective and subjective. The first are related to items that are unequivocally measurable; the latter depend on the personal experience during the demonstration and the individual’s feeling about the system. The quality of the vital signs, self-measured by the patients or collected by the nurses allocated to domiciliary visits, was confirmed by specialist doctors, who also assessed the capability of the platform to improve the treatment of chronic patients in terms of therapy compliance, clinical outcomes, alarm situation handling, and better allocation of medical resources. The platform, as already assessed in the previous pilots, confirmed its robustness and flexibility, avoiding data loss and ensuring secure circulation of clinical information.

7. Conclusions

This paper has presented the implementation and experimental verification of a remote monitoring system including the whole value chain from the top (health care model) down to the technical implementations of sensors, data acquisition, processing, a communication platform (gateway), and integration with a service center and HIS. The proposed system is scalable in different telemedicine scenarios involving different roles for all the actors in a health system (patients, their family, nurses, doctors, institutions, local health corners, call center operators): to this end the “1:1,” “1:N,” and “point of care” scenarios are presented and discussed. A mixture of commercially available sensors and new custom ones are presented and used. The new custom-designed sensors range from a single-lead ECG for easy self-measurements at home, to a multi-channel biomedical ASIC for acquisition of multi-channel bio signals (e.g., ECG, EEG, EMG), to a new motion sensor for patient posture estimation and fall detection. Specific focus has been placed on aspects such as the user interface and easy use of the device for non-professional users. From a communication point of view, BT and BLE wireless PAN links are used between sensors and gateway, whereas wireless LAN or wired technologies are used between the gateway and the remote server. All data can be transferred though several protocols, including HL7 CDA. Experimental trials in real-world telemedicine applications assess the proposed system in terms of easy usability for patients, family members, specialist doctors, and caregivers; in terms of scalability in different scenarios; and in terms of suitability for the implementation of needed care plans.
Since the number and type of patients involved in the reported experimental trials (see Section 6.2, Section 6.3 and Section 6.4) are still not enough to claim a complete survey and reliable statistics, there is ongoing experimental activity. The aim of the ongoing activity is also to validate the efficacy, in terms of economic advantages and impact on the conventional organization of people and infrastructures, of the telemedicine scenarios for the PHS. The psychological acceptance of the telemedicine model from a large part of the population should also be validated. To this end, the telemedicine system can also be supported by a remote videophone service, exploiting compression technologies we already developed in [44,45,46]—thus the patient can also “see” the doctor. Moreover, ongoing activity is focused on implementing a reliable, automatic check of the quality of the acquired biomedical measurements. Currently, an automatic check is done by the system but with a coarse grain (e.g., if acquired data or their difference with previous acquisitions are above or under some specific thresholds), whereas a fine-grain analysis of the quality of the acquired signal is left to the subjective analysis of the professional caregiver. Finally, in the current implementation the alarms generated by the gateway must be first validated by the caregiver before an emergency plan is activated and the patient is re-hospitalized. This increases the latency of reaction to an alarm, which can be critical particularly if the patient’s home is far from a hospital (e.g., mountainous zones and/or regions with low population density). In the future, when reliable automatic diagnosis of the quality of the measurements is reached and the system has been tested on a large population of patients with reliable statistics, automatic activation of the emergency plan can be instituted.

Acknowledgments

The authors gratefully acknowledge discussions with L. Benini from the University of Pisa, C. Passino from the Fondazione Toscana Gabriele Monasterio, and P. Barba from CAEN S.p.a.

Author Contributions

S.S. and L.F. defined the specifications and conceived the architecture of the telemedicine platform, whereas M.D. and A.C. managed its implementation (hardware and software) and testing.

Conflicts of Interest

The authors declare no conflict of interest.

References

  1. Go, S.A.; Mozaffarian, D.; Roger, V.L.; Benjamin, E.J.; Berry, J.D.; Borden, W.B.; Bravata, D.M.; Dai, S.; Ford, E.S.; Fox, C.S.; et al. Heart disease and stroke statistics 2013 update: A report from the American Heart Association Statistics Committee and Stroke Statistics Subcommittee. Circulation 2013, 127, 6–245. [Google Scholar] [CrossRef] [PubMed]
  2. Berry, C.; Murdoch, D.R.; McMurray, J.J. Economics of chronic heart failure. Eur. J. Heart Fail. 2001, 3, 283–291. [Google Scholar] [CrossRef]
  3. Masella, C.; Zanaboni, P.; Borghi, G.; Castelli, A.; Marzegalli, M.; Tridico, C. Introduction of a telemonitoring service for patients affected by chronic heart failure. In Proceedings of the 11th International Conference on e-Health Networking, Applications and Services, Sydney, Australia, 16–18 December 2009; pp. 138–145.
  4. Fanucci, L.; Saponara, S.; Bacchillone, T.; Donati, M.; Barba, P.; Sanchex-Tato, I.; Carmona, C. Sensing Devices and Sensor Signal Processing for Remote Monitoring of Vital Signs in CHF Patients. IEEE Trans. Instrum. Meas. 2013, 62, 553–569. [Google Scholar] [CrossRef]
  5. Parissis, J.; Athanasakis, K.; Farmakis, D.; Boubouchairopoulou, N.; Mareti, C.; Bistola, V.; Ikonomidis, I.; Kyriopoulos, J.; Filippatos, G.; Lekakis, J. Determinants of the direct cost of heart failure hospitalization in a public tertiary hospital. Int. J. Cardiol. 2015, 180, 46–49. [Google Scholar] [CrossRef] [PubMed]
  6. McMurray, J.J.V.; Adamopoulos, S.; Anker, S.D.; Auricchio, A.; Böhm, M.; Dickstein, K.; Falk, V.; Filippatos, G.; Fonseca, C.; Gomez-Sanchez, M.A.; et al. ESC guidelines for diagnosis and treatment of acute and chronic heart failure 2012. Eur. Heart J. 2012, 14, 803–869. [Google Scholar] [CrossRef]
  7. Go, A.S.; Mozaffarian, D.; Roger, V.L.; Benjamin, E.J.; Berry, J.D.; Blaha, M.J.; Dai, S.; Ford, E.S.; Fox, C.S.; Franco, S.; et al. Heart disease and stroke statistics, 2014 Update. Circulation 2014, 129, 28–292. [Google Scholar] [CrossRef] [PubMed]
  8. Zannad, F.; Agrinier, N.; Alla, F. Heart failure burden and therapy. Europace 2009, 11, 1–9. [Google Scholar] [CrossRef] [PubMed]
  9. Gardner, R.S.; McDonagh, T.A. Chronic heart failure: Epidemiology, investigation and management. Medicine 2014, 42, 562–567. [Google Scholar] [CrossRef]
  10. Ambrosy, A.P.; Ambrosy, A.P.; Fonarow, G.C.; Butler, J.; Chioncel, O.; Greene, S.J.; Vaduganathan, M.; Nodari, S.; Lam, C.S.; Sato, N.; et al. The global health and economic burden of hospitalization for heart failure. J. Am. Cardiol. 2014, 63, 1123–1133. [Google Scholar] [CrossRef] [PubMed]
  11. Lee, W.C.; Chavez, Y.E.; Baker, T.; Luce, B.R. Economic burden of heart failure: A summary of recent literature. Heart Lung 2004, 33, 362–371. [Google Scholar] [CrossRef] [PubMed]
  12. Fergenbaum, J.; Bermingham, S.; Krahn, M.; Alter, D.; Demers, C. Care in the home for the management of chronic heart failure. Cardiovasc. Nurs. J. 2015, 30, 44–51. [Google Scholar] [CrossRef] [PubMed]
  13. Ekeland, A.G.; Bowes, A.; Flottorp, S. Effectiveness of telemedicine: A systematic review of reviews. Int. J. Med. Inform. 2010, 79, 736–771. [Google Scholar] [CrossRef] [PubMed]
  14. Finet, P.; Le Bouquin Jeannès, R.; Damerond, O.; Gibaudb, B. Review of current telemedicine applications for chronic diseases. IRBM 2015, 36, 133–157. [Google Scholar] [CrossRef]
  15. Kligfield, P.; Gettes, L.S.; Bailey, J.J.; Childers, R.; Deal, B.J.; Hancock, E.W.; van Herpen, G.; Kors, J.A.; Macfarlane, P.; Mirvis, D.M.; et al. Recommendations for the standardization and interpretation of electrocardiogram. Circulation 2007, 155, 1306–1324. [Google Scholar]
  16. Lopez Sendon, J. The heart failure epidemic. Medicographia 2011, 33, 363–368. [Google Scholar]
  17. Benini, A.; Donati, M.; Iacopetti, F.; Fanucci, L. User-friendly single-lead ECG device for home telemonitoring application. In Proceedings of the 2014 8th International Symposium on Medical Information and Communication Technology (ISMICT), Firenze, Italy, 2–4 April 2014.
  18. Donati, M.; Bacchillone, T.; Fanucci, L.; Saponara, S.; Cstalli, F. Operating protocol and networking issues of a telemedicine platform integrating from wireless home sensors to the hospital information system. Hindawi J. Comput. Netw. Commun. 2013, 2013, 1–12. [Google Scholar] [CrossRef]
  19. Li, J.-F.; Wang, Q.-H.; Liu, X.-M.; Cao, S.; Liu, F.-L. Pedestrian Dead Reckoning System Integrating Low-Cost MEMS Inertial Sensors and GPS Receiver. J. Eng. Sci. Technol. Rev. 2014, 7, 197–203. [Google Scholar]
  20. Weinberg, H. Using the ADXL202 in Pedometer and Personal Navigation Applications; AD AN-602 App. Note; Analog Devices: Norwood, MA, USA, 2002. [Google Scholar]
  21. Abbate, S.; Avvenuti, M.; Bonatesta, F.; Cola, G.; Corsini, P.; Vecchio, A. A smartphone-based fall detection system. Pervasive Mobile Comp. 2012, 8, 883–899. [Google Scholar] [CrossRef]
  22. Bourke, A.K.; O’Brein, J.V.; Lyons, G.M. Evaluation of a threshold-based tri-axial accelerometer fall detection algorithm. Gait Posture 2007, 26, 194–199. [Google Scholar] [CrossRef] [PubMed]
  23. Cleland, I.; Kikhia, B.; Nugent, C.; Boytsov, A.; Hallberg, J.; Synnes, K.; McClean, S.; Finlay, D. Optimal placement of accelerometers for the detection of everyday activities. Sensors 2013, 13, 9183–9200. [Google Scholar] [CrossRef] [PubMed]
  24. World Health Organization. mHealth: New Horizons for Health through Mobile Technologies: Second Global Survey oneHealth; WHO: Geneva, Switzerland, 2011; p. 1. [Google Scholar]
  25. Bacchillone, T.; Donati, M.; Saponara, S.; Fanucci, L. A flexible home gateway system for telecare of patients affected by chronic heart failure. In Proceedings of the 2011 5th International Symposium on Medical Information and Communication Technology, Montreux, Switzerland, 27–30 March 2011; pp. 1–5.
  26. Zhou, F.; Yang, H.-I.; Reyes Álamo, J.M.; Wong, J.S.; Chang, C.K. Mobile personal health care system for patients with diabetes. In Aging Friendly Technology for Health and Independence; Lecture Notes in Computer Science; Springer: London, UK, 2011; Volume 6159, pp. 94–101. [Google Scholar]
  27. Yadav, J.; Rani, A.; Singh, V.; Murari, B.M. Near-infrared LED based non-invasive blood glucose sensor. In Proceedings of the 2014 International Conference on Signal Processing and Integrated Networks (SPIN), Noida India, 20–21 February 2014; pp. 591–594.
  28. Gan, K.B.; Yahyavi, E.S.; Ismail, M.S. Contactless respiration rate measurement using optical method and empirical mode decomposition. Technol. Health Care 2016, 1–8, preprint. [Google Scholar]
  29. Daw, W.; Kingshott, R.; Scott, A.; Saatchi, R.; Elphick, H. Development of the ‘BreathEasy’ contactless portable respiratory rate monitor (CPRM). Eur. Respir. J. 2015, 46, PA1583. [Google Scholar] [CrossRef]
  30. Fang, D.; Hu, J.; Wei, X.; Shao, H.; Luo, Y. A Smart Phone Healthcare Monitoring System for Oxygen Saturation and Heart Rate. In Proceedings of the IEEE International Conference on Cyber-Enabled Distributed Computing and Knowledge Discovery, Shanghai, China, 13–15 October 2014; pp. 245–247.
  31. Lutze, R.; Waldhor, K.A. Smartwatch Software Architecture for Health Hazard Handling for Elderly People. In Proceedings of the IEEE International Conference on Healthcare Informatics, Dallas, TX, USA, 21–23 October 2015; pp. 356–361.
  32. Stankevich, E.; Paramonov, I. Using Bluetooth on Android Platform for mHealth Development. In Proceedings of the 10th Conference of FRUCT Association, Tampere, Finland, 7–11 November 2011; pp. 140–145.
  33. Fanucci, L.; Benini, A.; Donati, M.; Iacopetti, F. Self Electrocardiogram Acquisition Device. Patent N. WO2015083036 A1, 11 June 2015. [Google Scholar]
  34. V-Patch Medical System. Available online: http://www.vpatchmedical.com (accessed on 18 June 2016).
  35. Isansys Lifecare. Available online: http://www.isansys.com (accessed on 18 June 2016).
  36. LifeWatch. Available online: http://www.lifewatch.com/ACT (accessed on 18th June 2016).
  37. Docobo. Available online: http://www.docobo.co.uk (accessed on 18 June 2016).
  38. Augustyniak, P.; Tadeusiewicz, R. Telemedical Solutions in Cardiac Diagnostics. In Chapter 2 in Ubiquitous Cardiology: Emerging Wireless Telemedical Applications, Medical Information Science Reference; IRMA book: Hershey, PA, USA, 2009; pp. 72–109. [Google Scholar]
  39. SolutionMD. Available online: http://www.solutionmd.com (accessed on 18 June 2016).
  40. Saponara, S.; Petri, E.; Fanucci, L.; Terreni, P. Sensor modeling, low-complexity fusion algorithms, and mixed-signal IC prototyping for gas measures in low-emission vehicles. IEEE Trans. Instrum. Meas. 2011, 60, 372–384. [Google Scholar] [CrossRef]
  41. Bacciarelli, L.; Lucia, G.; Saponara, S.; Fanucci, L.; Forliti, M. Design, testing and prototyping of a software programmable I2C/SPI IP on AMBA bus. In Proceedings of the IEEE PRIME, Otranto, Italy, 12–15 June 2006; pp. 373–376.
  42. Baba, A.; Burke, M.J. Electrical characterisation of dry electrodes for ECG recordings. In Proceedings of the 12th WSEAS International Conference on Circuits, Heraklion, Greece, 22–24 July 2008.
  43. Costantino, N.; Serventi, R.; Tinfena, F.; D’Abramo, P.; Chassard, P.; Tisserand, P.; Saponara, S.; Fanucci, L. Design and test of an HV-CMOS intelligent power switch with integrated protections and self-diagnostic for harsh automotive applications. IEEE Trans. Ind. Electron. 2011, 58, 2715–2727. [Google Scholar] [CrossRef]
  44. Saponara, S.; Martina, M.; Casula, M.; Fanucci, L.; Masera, G. Motion estimation and CABAC VLSI co-processors for real-time high-quality H.264/AVC video coding. Microprocess. Microsyst. 2010, 34, 316–328. [Google Scholar] [CrossRef]
  45. Fanucci, L.; Saleti, R.; Saponara, S. Parametrized and reusable VLSI macro cells for the low-power realization of 2-D discrete-cosine-transform. Microelectron. J. 2001, 32, 1035–1045. [Google Scholar] [CrossRef]
  46. Chimienti, A.; Fanucci, L.; Locatelli, R.; Saponara, S. VLSI architecture for a low-power video codec system. Microelectron. J. 2002, 33, 417–427. [Google Scholar] [CrossRef]
Figure 1. Distributed health care system for chronic illness monitoring.
Electronics 05 00047 g001
Figure 2. Main building blocks of the gateway.
Electronics 05 00047 g002
Figure 3. Graphical rendering of the historical evolution of SpO2 and heart frequency.
Electronics 05 00047 g003
Figure 4. Gateway user interface in the 1:1 scenario.
Electronics 05 00047 g004
Figure 5. Evolution of the acquisition flow in multiple steps (from idle, to reminder, to reception and feedback, to communication towards the remote server, and again to idle).
Electronics 05 00047 g005
Figure 6. Evolution of the acquisition flow in case of the 1:N scenario; e.g., gateway for nurse.
Electronics 05 00047 g006
Figure 7. Evolution of the acquisition flow in the point-of-care scenario.
Electronics 05 00047 g007
Figure 8. Block diagram of the remote e-Health center.
Electronics 05 00047 g008
Figure 9. Skin–electrode contact electric model.
Electronics 05 00047 g009
Figure 10. Architecture of the single-lead ECG biomedical device (left) and its implementation (right).
Electronics 05 00047 g010
Figure 11. Comparison of the ECG acquisition with the new single-lead ECG biomedical device (blue trace) vs. a golden reference multi-lead ECG instrumentation (black trace). Electrodes placed on the chest are needed only for the reference ECG. The proposed ECG device just requires placing the hands, without any conductive gel, on top of the ECG device, where a couple of electrodes are placed.
Electronics 05 00047 g011
Figure 12. Single-lead ECG application running on an Android device.
Electronics 05 00047 g012
Figure 13. Multi-channel front-end of the biomedical ASIC.
Electronics 05 00047 g013
Figure 14. Newly developed motion sensor.
Electronics 05 00047 g014
Figure 15. Aggregated feedback from patients.
Electronics 05 00047 g015
Table 1. List of COTS biomedical sensors.
SensorChronic IllnessDevice Characteristics
Cardioline Microtel CardietteCHF3/6/12 channels derivation; ECG continuous measurement; 0.05–150 Hz; sampling rate 500 Hz; pacemaker detection; BT 2.0 SPP
A&D weighting scale (UC-321PBT)CHFRange 0–200 kg, resolution 100 g; BT 2.0 SPP
A&D blood pressure (UA-767PBT)CHF, COPDRange: pressure 20–280 mmHg, pulse: 40–200 bpm; Accuracy: pressure ± 3 mmHg, pulse: ±5%; BT 2.0 SPP
Nonin saturimeter (Onyx II 9560)CHF, COPDRange: SpO2 0%–100%, pulse 20–250 bpm; Accuracy: SpO2 ± 1, pulse ± 3 bpm
Lifescan Glucometer (onetouch ultraeasy)diabetesRange: 20–600 md/dL; Accuracy: ±5%; BT 2.0 SPP
MIR spirometer (Spirodoc)COPDRange: flux ± 16 L/s, Accuracy: flux ± 5%; BT 2.0 SPP
Table 2. Characteristics of the single-lead ECG.
Dimensions (mm)SamplingAnalog Band (Hz)Digital Band (Hz)Notch Filter (Hz)ECG TraceProcessingOutputs
300 × 70 × 4012 bit 500 sps0.5–500.6–3750First leadHeart rate detectionLCD display 128 × 64 pixel Green and red LEDs BT 2.0 SPP 115 kbps
Table 3. Characteristics of the biomedical ASIC.
Tech.Temp. V SupplyADCChannelsECG ChannelGateway Connection
CMOS 0.8 μm0 to 70 °C16 b 64 kSa/s8 ECG, 1 blood press100 dB CMRR, 57 dB gainBT 2.0 SPP
TQFP128 pin3 V to 5 VINL/DNL1/0.75 LSB1 temp., 1 batt status100 dB PSRR, 0.1 to 150 Hz
14 × 14 × 1.4 mm3 offset/gain error 0.5/1.5%Pacer detect,10 µVrms/150 Hz input noise
Table 4. Characteristics of the motion sensor.
Sampling RareV SupplySensorDigital CoreProcessingOutput
50 sps3.3 V9D IMU (gyroscope, accelerometer, digital compass)STM32Fall event detection
Posture detection
BLE 4.0
Table 5. Aggregated feedback from specialist doctors.
Macro-ParameterScore
Simply decision and increase effectiveness of diagnosis and treatment of patient based on better evidence9,125/10
In general terms, easy to use with clear and understandable interactions9,5/10
Flexibility of the system and compatibility with other systems already in use9,75/10
Quality of the provided signal9,1/10
Sensibility of the alarm detection function9,15/10
In favor of the adoption of the H@H system9,2/10
Table 6. Nurses interviewed in Domino project.
“The patient selection process and the measurement acquisition process are quickly and easy to use”
“The medical devices provided with the gateway cover acquisition of all the requested vital signs”
“The telemedicine kit, composed of a gateway and medical devices, represents an important improvement and optimization of the domiciliary visit with respect to the traditional model”

