Article

Skin Admittance Measurement for Emotion Recognition: A Study over Frequency Sweep

1
Department of Information Engineering and Research Center “E. Piaggio“, School of Engineering, University of Pisa, 56122 Pisa, Italy
2
School of Computer Science and Electronic Engineering, University of Essex, Colchester CO4 3SQ, UK
*
Author to whom correspondence should be addressed.
Electronics 2016, 5(3), 46; https://doi.org/10.3390/electronics5030046
Submission received: 26 June 2016 / Revised: 28 July 2016 / Accepted: 1 August 2016 / Published: 4 August 2016

Abstract

:
The electrodermal activity (EDA) is a reliable physiological signal for monitoring the sympathetic nervous system. Several studies have demonstrated that EDA can be a source of effective markers for the assessment of emotional states in humans. There are two main methods for measuring EDA: endosomatic (internal electrical source) and exosomatic (external electrical source). Even though the exosomatic approach is the most widely used, differences between alternating current (AC) and direct current (DC) methods and their implication in the emotional assessment field have not yet been deeply investigated. This paper aims at investigating how the admittance contribution of EDA, studied at different frequency sources, affects the EDA statistical power in inferring on the subject’s arousing level (neutral or aroused). To this extent, 40 healthy subjects underwent visual affective elicitations, including neutral and arousing levels, while EDA was gathered through DC and AC sources from 0 to 1 kHz. Results concern the accuracy of an automatic, EDA feature-based arousal recognition system for each frequency source. We show how the frequency of the external electrical source affects the accuracy of arousal recognition. This suggests a role of skin susceptance in the study of affective stimuli through electrodermal response.

Graphical Abstract

1. Introduction

Emotions play a fundamental role in the daily life and a possible continuous monitoring of them could be very beneficial in understanding and managing personal well-being promoting mental healthy state [1,2]. In the last decades, several studies have been proposed to increase knowledge on emotion recognition, and, consequently, develop an automatic emotional detection systems. Even though a scientific definition of emotion is still controversial, many models of emotions have been developed [3,4,5,6,7]. Among them, the circumplex model of affect [3] describes emotions as a combination of an arousal level (i.e., the intensity of the emotion perception) and a valence level (i.e., the degree of pleasantness). According to these emotional models, many human–machine systems have been developed in order to automatically recognize humans’ affective and mood states [8,9,10,11,12,13,14,15,16,17,18,19] by interpreting physiological changes as a response to an external triggering event. To this extent, several psychophysiological features extracted from different peripheral biosignals have been widely used in the literature [20,21,22,23]. Some of the most commonly used physiological signs in affective recognition are: electrocardiogram and related heart rate variability series, electrodermal activity (EDA), respiration, muscle activity, peripheral temperature, eye gaze, as well as brain activity [24,25,26,27,28,29].
Among these, EDA has been widely used to assess the arousal level in humans because of its ability to quantify changes in the sympathetic nervous system (SNS) [30,31]. EDA signal is comprised of a low-frequency tonic component, and a higher frequency phasic component [30,32]. Anatomically, EDA changes are due to the sudomotor nerve activity (SMNA), which is part of the SNS, that directly control the eccrine sweat glands [30]. Therefore, EDA can be easily monitored through voltage/current measures between two fingers, where there is a higher concentration of the eccrine sweat glands with respect to other body sites [30].
In this context and aiming at continuously monitoring the EDA signal in a ecological scenario, wearable monitoring systems are the most interesting and advantageous devices. In fact, wearable sensors are greatly valued due to their comfort, portability, non-invasiveness, and their wireless communication capabilities with either a computer, a mobile embedded system or other wearable sensors [33,34,35,36,37].
Referring to EDA measure, three standard methodologies are usually employed. The first one is called endosomatic measurement. This is rarely used and consists in measuring, directly on the skin, the potential difference between two skin sites, in a passive way. It does not need special amplifiers and coupling electrical circuits. Although it is a quite unknown bioprocess, it is accepted that changes in skin potential during sympathetic activity may be provoked by the sodium reabsorption across the duct walls and the consequential change of the ionic potential in the sweat ducts [30].
The other two methods are based on an exosomatic approach, i.e., a small external current is directly injected into the skin. Consequently, two different methods are used: the direct current method (DC) and the alternating current method (AC) at different frequency levels. Generally, they perform a measure of resistance (impedance) or conductance (admittance: “conductance + j susceptance”), where j is the imaginary unit. When DC source is used, resistance and conductance are inversely related. Instead, when AC source is used, the inverse paradigm between resistance and conductance is not valid, but can be applied to the complex impedance and complex admittance. Moreover, in the AC regime, the impedance is represented by a circuit comprised of a resistor-capacitor in series, instead the admittance is represented by a parallel circuit (of a resistor and a capacitor). The Parallel equivalent should be preferred since ionic conduction and polarization are in parallel in biological tissues. More in detail, the skin can be considered as a dielectric whose permittivity and conductivity are complex due to free charges and the AC losses of bound charges [38].
Although AC methods allow measuring capacity changes in the electrodermal responses, DC procedures are the most implemented [39]. Within DC methodology, even if much effort has been spent to standardize, an agreement concerning the use of either constant-voltage or constant-current scheme has not yet been achieved. Therefore, different designs can be found. In constant-voltage sources, the conductance of the skin can be directly measured as an output of the circuit without the need of any further transformation. However, constant-current sources provide more stability and exhibit less tolerance, but, in this method, much attention must be payed to possible damage to the sweat ducts due to the injected current through a small area of the skin [34].
Unfortunately, a very low number of studies have been published on the difference among AC and DC stimulation in EDA measurement. One of the most interesting works [39] showed that, when using an AC source at 88 Hz, the major contribution to EDA is given by the conductance term and not by the susceptance. More specifically, the authors found that, at the instant of the conductance response, there were no susceptance responses, and this could indicate the absence of a significant capacitance in the sweat ducts. Moreover, to the best of our knowledge, in the current literature, no specific wearable systems, which are able to perform both DC and AC electrical stimulations, have already been reported. As a matter of fact, in a previous study, we have already proposed a fabric-based sensorized glove [40]. However, this system was also able to continuously record the EDA using only a DC source.
Starting from the above considerations and from the recommendations provided in [41,42,43], we propose a novel textile wearable system, which is able to perform an exosomatic EDA measurement using both AC and DC methods. Using this novel device, our study aims at investigating whether the admittance contribution at different frequency sources (in the range from DC to 1 kHz of AC) could affect the ability of EDA of inferring the central state during emotional stimulation. To this end, we designed an experimental paradigm using visual affective stimuli, and we developed an automatic arousal recognition system, in order to test potential differences in inferring the arousal state of the two approaches.

2. Materials and Methods

Exosomatic EDA measures changes in the electrical conductance (DC method) or admittance (AC method) due to both the psycho-physiological state of a person and the response to an external event. The EDA signal has a frequency bandwidth of 0–2 Hz [44] and, for a correct analysis, should be decomposed in two sub-components containing different and complementary information: a low-frequency tonic component, which reflects the subject’s general psycho-physiological state and its autonomic regulation [30], and a phasic component, which is the superposed higher-frequency change directly related to an external stimulus [45]. A frequent issue in the decomposition process consists in the overlapping of consecutive phasic responses, which occur in the case of inter-stimulus intervals less than around 10–20 s [46,47].
Measurement of EDA changes provides evidence of eccrine sweat gland activity. The eccrine sweat glands are innervated by sympathetic fibers, and, in normal ambient temperatures, palmar, finger (or plantar) glands reflect responses to psychological rather than thermoregulatory stimuli [48]. Therefore, EDA is considered as an ideal way to monitor the autonomic nervous system and, more specifically, its sympathetic branch [30].
In this section, we first report on the EDA acquisition system prototype and then briefly describe details on the cvxEDA models, which is presented in [49]. Note that this method is able to discern overlapping consecutive electrodermal responses (EDRs), likely to be present in the case of an inter-stimulus interval shorter than the EDR recovery time.

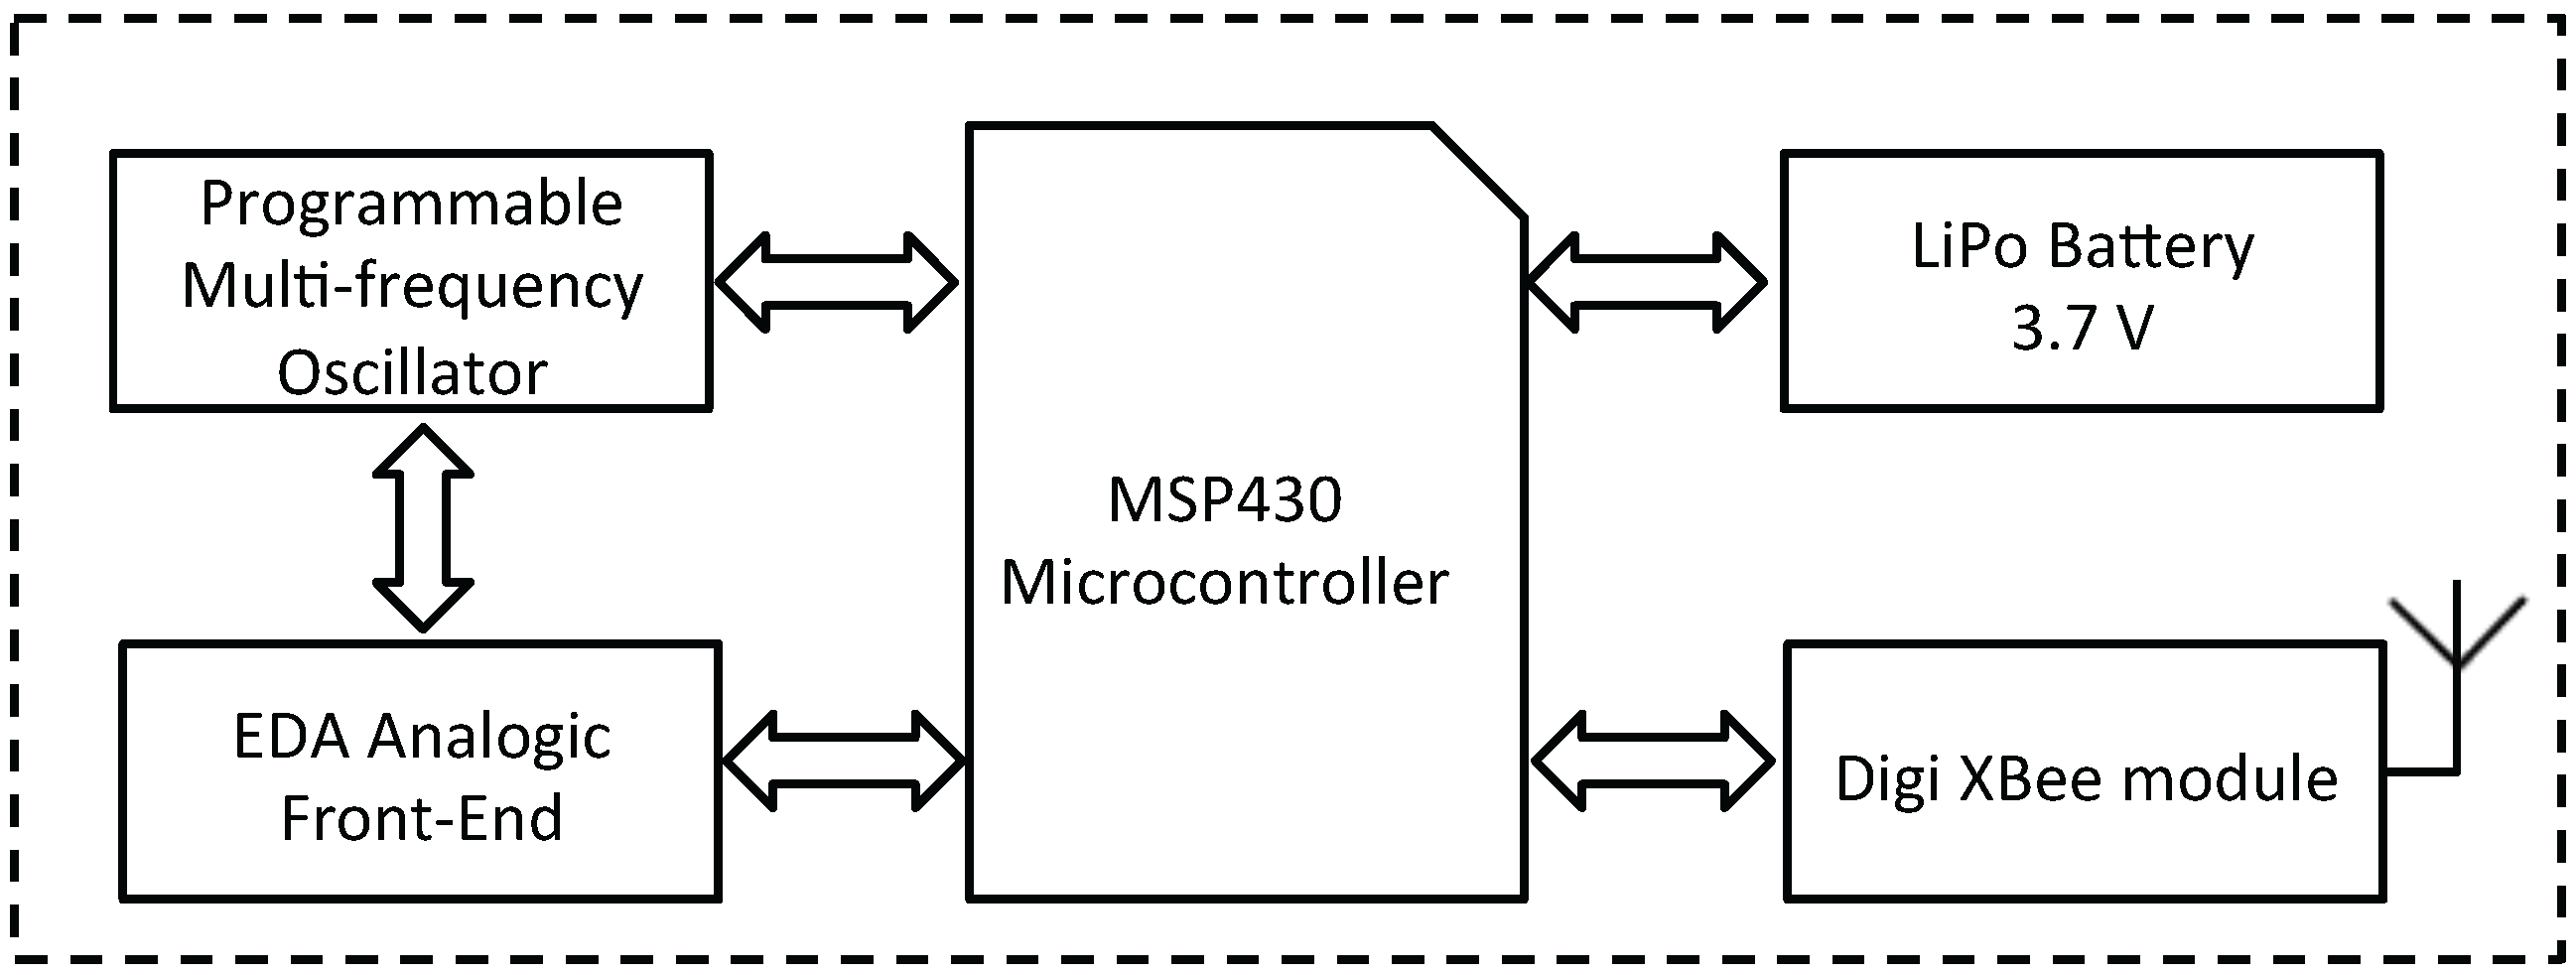
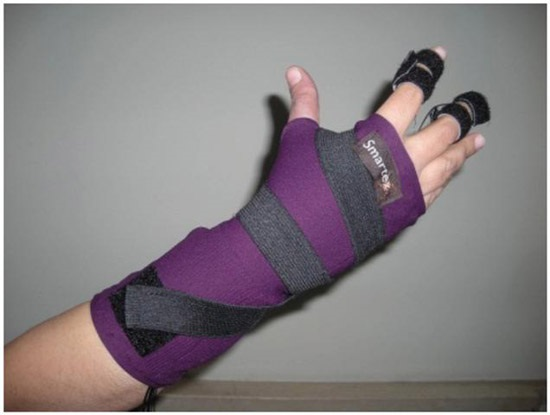
2.1. Multi-Frequency Sensorized Glove

EDA is acquired by a glove where integrated textile electrodes were placed at the distal phalanges of the index and middle fingers (Figure 1). Textile electrodes, provided by Smartex s.r.l. [40] (Pisa, Italy), are made up of 80% polyester yarn knitted with 20% steel wire, with a dimension of 1 × 2 cm. In one of our previous studies [40], we performed a comparison of textile sensors with Ag/AgCl electrodes demonstrating comparable performance. More specifically, reported results on electrode characterization, performed by means of the voltage-current characteristics, and its electric impedance showed that textile electrode achieves a good electrical and thermal coupling with biological site. Moreover, the use of a wearable textile system exhibits several advantages in terms of portability and usability for long-term monitoring, and gives minimal constraints. This latter characteristic is very significant when the system is used in an ecological environment.
The analog front-end of the designed electronics, which is responsible for measuring the DC and AC exosomatic EDA, is based on a variable-gain current-to-voltage operational amplifier. The electric current injected into the skin is variable and programmable (from 0 to 1 kHz), and for this purpose we used the AD9833 provided by Analog Device [50] (Norwood, MA, USA). This chip is a low power, programmable waveform generator, which is used to switch up the frequency of the skin electrical stimulation among 0 (i.e., DC), 10, 100 and 1000 Hz [39]. Moreover, a low-pass filter (cutoff frequency of 3 Hz) and a further amplification stage were applied to the raw EDA data before the successive digitalization step.
The preprocessed EDA signal was digitally converted with a sampling frequency of 15 kHz, thanks to the 12-bit analog-to-digital converter built in the Texas Instrumen (Dallas, TX, USA) MSP430 microcontroller (Figure 2). The MSP430fxx family of microcontrollers are designed to be low cost and, specifically, low power consumption embedded applications. It is a very popular choice especially in wireless networking systems and it is built around a 16-bit RISC (Reduced instruction set computing) CPU. In our prototype, we used the MSP430x6xx Series, which are able to run up to 25 MHz, have up to 512 KB flash memory and up to 66 KB RAM. Moreover, this series includes an innovative power management module for optimal power consumption [51].
Moreover, wireless communication was implemented by an Xbee module (Minnetonka, MN, USA) connected to the USART (Universal Synchronous Receiver-Transmitter) of the MSP430. Specifically, it was used to exchange data between the transceiver and a dedicated multi-platform software application. Finally, a lithium-polymer battery with a voltage of 3.7 V and a capacity of around 750 mAh was chosen as power supply [34]. The large capacitance of the battery allows a long-term-continuous monitoring, and it is an essential characteristic to stream the data wirelessly. An external circuit was developed to support the rechargeable battery through a USB port. Finally, a voltage regulator is responsible for supplying 3.0 volts from the battery to all the components of the device.

2.2. EDA Processing Using cvxEDA Algorithm

CvxEDA proposed a representation of the phasic responses as the output of a linear time-invariant system to a sparse non-negative driver signal. The model assumes that the observed EDA (y) is the sum of the phasic activity (r), a slow tonic component (t), and an additive independent and identically distributed zero-average Gaussian noise term ϵ:
y = r + t + ϵ .
Physiologically-plausible characteristics (temporal scale and smoothness) of the tonic input signal can be achieved by means of a cubic spline with equally-spaced knots every 10 s, an offset and a linear trend term:
t = B + C d ,
where B is a tall matrix whose columns are cubic B-spline basis functions, is the vector of spline coefficients, C is an N × 2 matrix (where N is the length of the EDA time series) with C i , 1 = 1 and C i , 2 = i / N , d is a 2 × 1 vector with the offset and slope coefficients for the linear trend.
The phasic component is the result of a convolution between the SMNA, p, and an impulse response h ( t ) shaped like a biexponential Bateman function [52,53,54]:
h ( t ) = ( e - t τ 1 - e - t τ 2 ) u ( t )
where τ 1 and τ 2 are, respectively, the slow and the fast time constants of the phasic curve shape, and u ( t ) is the unitary step function.
Taking the Laplace transform of Equation (3) and then its discrete-time approximation with sampling time δ (using a bilinear transformation), we obtain an autoregressive moving average (ARMA) model (see details in [49]) that can be represented in matrix form as
H = M - 1 A ,
where M and A are tridiagonal matrices with the MA and AR coefficients along the diagonals. Using an auxiliary variable q such that
q = A - 1 p , r = M q ,
we write the final observation model as
y = M q + B + C d + ϵ .
Given the EDA model Equation (6), the goal is to identify the maximum a posteriori (MAP) neural driver SMNA (p) and tonic component (t) parametrized by [ q , , d ] , for the measured EDA signal (y). CvxEDA rewrites the MAP problem as a constrained minimization Quadratic Programming (QP) convex problem (see details in [49,55]):
minimize 1 2 M q + B + C d - y 2 2 + α A q 1 + γ 2 2 2 subj . to A q 0 .
This optimization problem can be re-written in the standard QP form and solved efficiently using one of the many sparse-QP solvers available. After finding the optimal [ q , , d ] , the tonic component t can be derived from Equation (2) while the sudomotor nerve activity driving the phasic component can be easily found as p = A q .
The objective function Equation (7) to be minimized is a quadratic measure of misfit or prediction error between the observed data and the values predicted by the model. Moreover, the prior knowledge about the spiking sparse nature and nonnegativity of the SMNA (p) and the smoothness of the tonic component are accounted for by the regularizing terms and the constraint.
The strength of the penalty is regulated by α and γ terms. A sparser estimate is yielded by large values of α. Concerning γ, higher values mean a stronger penalization of , i.e., a smoother tonic curve. Of note, fixed values of τ 1 = 0 . 7 s , τ 2 = 3 . 0 s , α = 0 . 008 and γ = 0 . 01 , which were chosen during previous exploratory tests on separate data, were employed throughout this analysis.
CvxEDA algorithm is implemented in Matlab language and the software is available online [56].

2.3. Experimental Protocol

Forty healthy subjects were enrolled in the experiment, aged 26 ± 4 (18 females). All subjects gave written informed consent before taking part in the study, which was approved by the local Ethics Committee. The experiment was designed as following:
  • initial resting phase of 1 min;
  • maximal expiration task phase of about 1 min;
  • affective visual stimulation phase of 2 min;
  • final resting phase of 1 min;
(The two elicitation phases will be described in detail in the next sub-sections.) Subjects were comfortably seated in an acoustically insulated room in front of a computer screen while their EDA was recorded using the presented acquisition system.
Textile electrodes were placed for 10 min before the acquisition for achieving a stable skin/dry-electrode coupling and limiting the temporal and thermic effect [57].
Note that the group of 40 healthy subjects was split into four subgroups, each of which comprised of 10 subjects. Each subgroup were acquired with a different exosomathic method such as DC (group 1), AC with a frequency of 10 Hz (group 2), AC with a frequency of 100 Hz (group 3) and AC with a frequency of 1 kHz (group 4).

2.3.1. Maximal Expiration Task

In this session of the experiment, all of the 40 subjects performed a forced maximal expiration task [58], in which they were asked to breathe out with the maximum possible intensity in order to trigger the SNS-mediated expiration reflex.
After the initial resting state session, the subjects breathe normally and rest in front of the computer monitor for about 20 s. Then, they had to perform a deep expiration twice with an inter-stimulus interval of about 20 s, after a neutral visual input on the screen.
The use of the forced expiration task is justified by the need of having a stimulus whose EDA response was as reliable and objective as possible. In fact, previous studies have demonstrated that this stimulation is a reliable way to evoke phasic responses unaffected by emotional change with better reproducibility, less habituation, and more stable waveform patterns than other experimental paradigms (including electrical) [58]. In this way, the presence of at least one phasic response after each stimulus was ascertained. Therefore, we could investigate whether the cvxEDA algorithm was able to identify each phasic response for each acquisition method.

2.3.2. Affective Visual Stimulation

In the second elicitation session, each group of 10 participants was stimulated by projecting on a screen images selected from the official IAPS (International Affective Picture System) database [59]. The IAPS dataset is a collection of images ranked in terms of arousal (i.e., intensity of perception) and valence (pleasantness of perception). This protocol session is designed to assess the pattern recognition system ability on each data group (i.e., of each method) to correctly classify stimulations with different arousal content and provide meaningful information about SNS activation.
The slideshow timeline consists of three neutral images, six aroused images and three other neutral images. Each image was shown for 10 s.

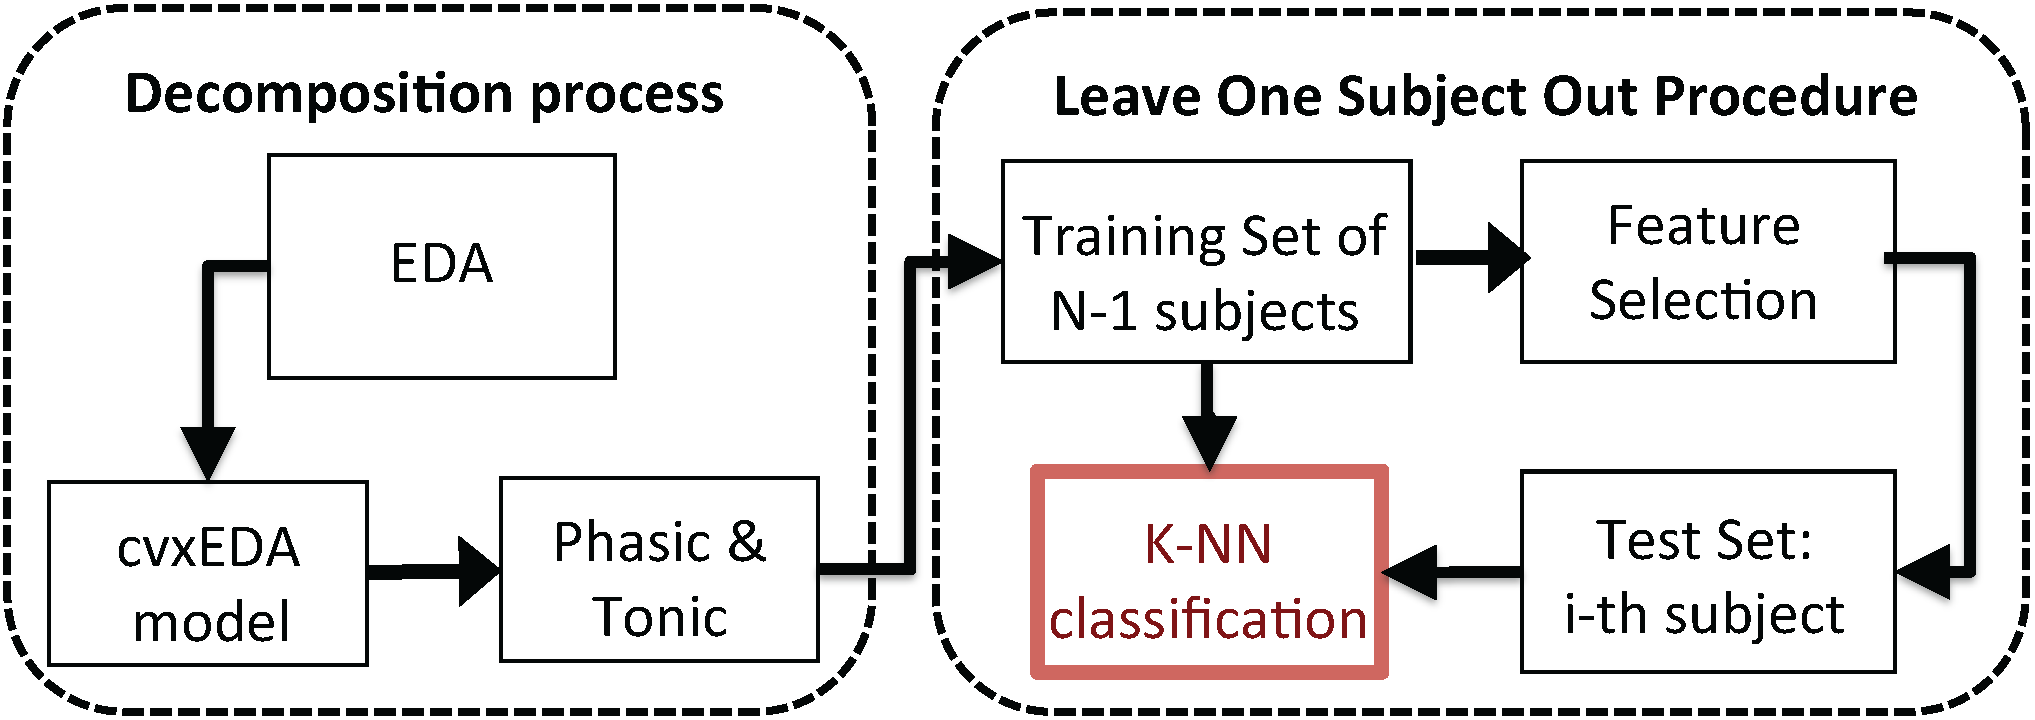
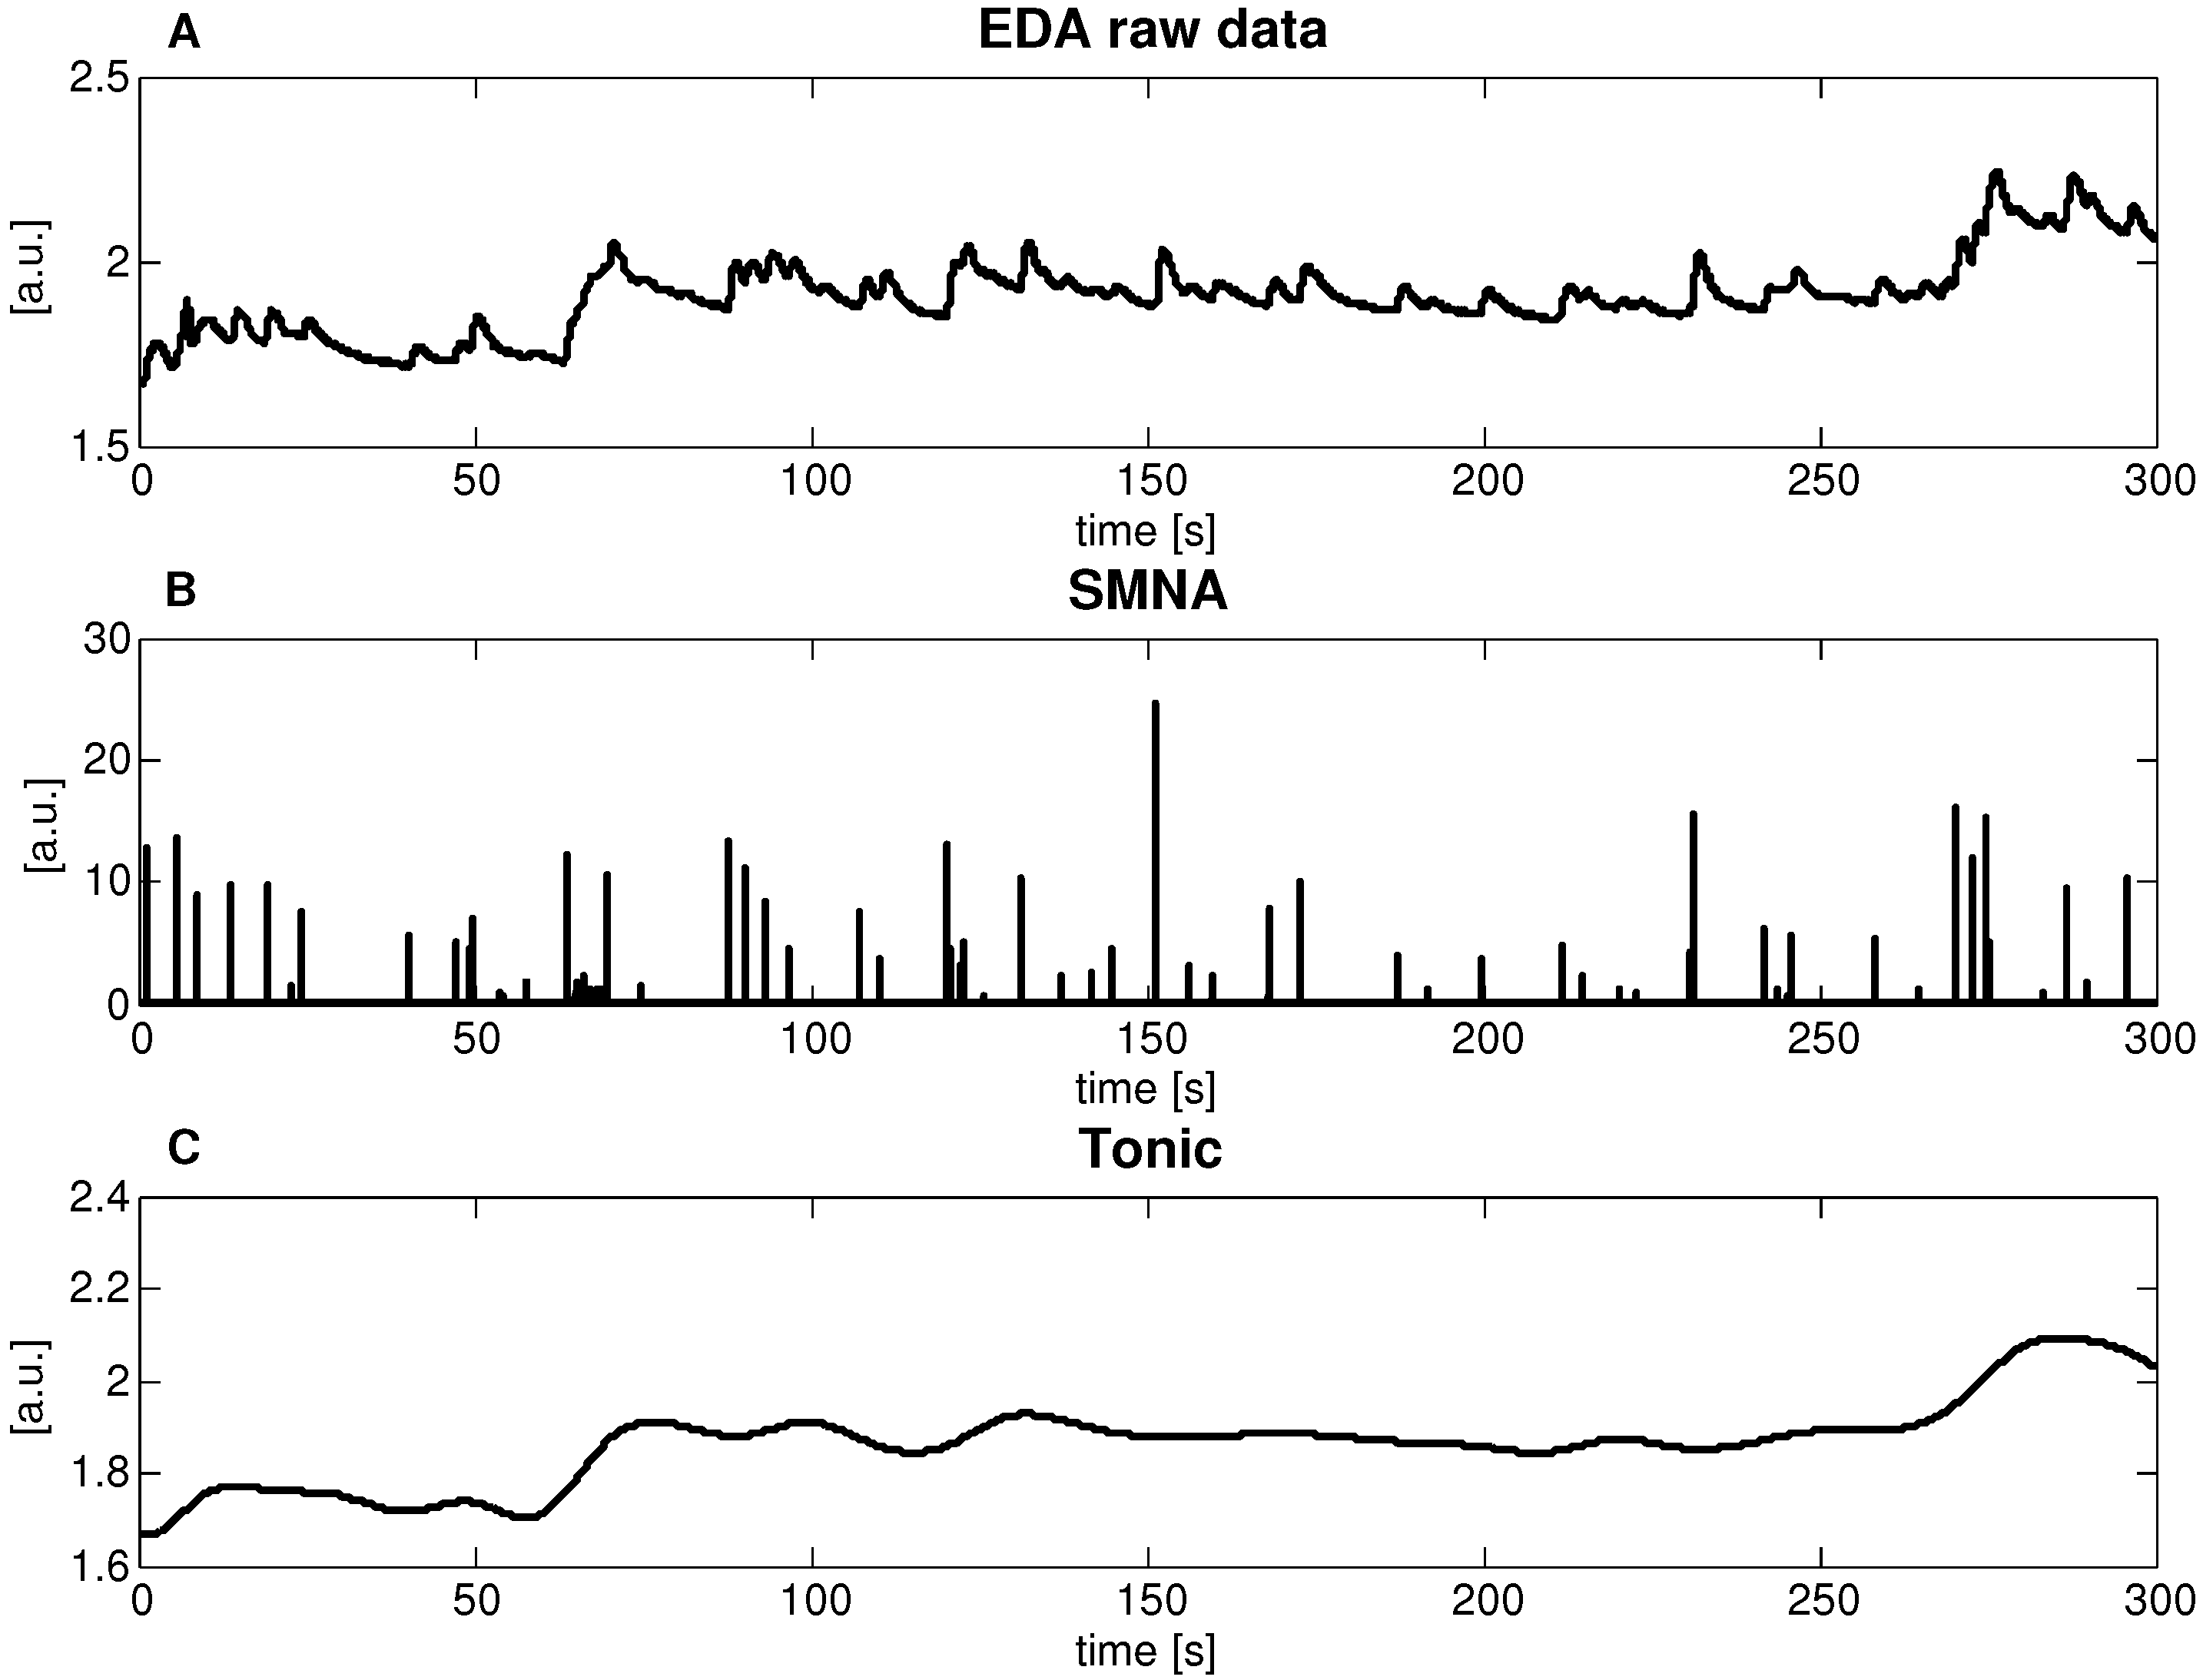
2.4. EDA Analysis and Classification Procedure

For each dataset, the convex-optimization-based EDA model (cvxEDA) described in Section 2.2 was applied to each time series after a Z-score normalization (this is not a mandatory step before applying the cvxEDA algorithm, but an increase in the speed of the QP-solver). Concerning the Impulse Response Function (IRF) parameters considered for this study, values of τ 2 = 0 . 7 s , τ 1 = 0 . 7 s , α = 0 . 4 and γ = 0 . 01 were employed throughout this analysis, according to previous exploratory tests on separate data.
In the respiratory stimulation dataset, the presence of an estimated burst of SMNA activity was verified in each 5 s time window following a stimulus onset, in order to prove the model’s ability to correctly detect partially overlapped phasic responses.
As summarized in Table 1, we segmented each signal in correspondence to each IAPS image time window, and we extracted several features from both the tonic and phasic component.

Classification Procedure

The feature set, extracted from each single IAPS image, was used as the input of a pattern recognition algorithm in order to classify the two arousal levels, according to the IAPS rates. The supervised classification of the feature set was implemented following a Leave-One-Subject-Out procedure (LOSO) applied to a K-nearest neighbors (K-NN)-based classifier. For each of the N iterations (where N is the total number of participants), the whole dataset was split into a training set including ( N - 1 ) subjects and a test set including the cvxEDA feature values of the the remaining subject N t h . Moreover, for each iteration of the LOSO scheme, a feature selection procedure was performed in order to identify the combination of parameters that resulted in the highest recognition accuracy within the training set examples. Each selected feature constituted a single dimension of the feature space. The LOSO pattern recognition procedure is illustrated in Figure 3.

3. Results

According to the cvxEDA model, all EDA data (Figure 4a) were decomposed into two signals, a sparse component p and a smooth component t. Of note, we interpret p as the activity of the sudomotor nerve (Figure 4b), and t as the tonic level (Figure 4c)).

3.1. Maximal Expiration Task Results

We performed both a visual and a statistical inspection of time series to verify whether the effectiveness of the protocol in eliciting phasic responses was confirmed for all different kinds of acquisition method (DC and AC).
After the application of the cvxEDA model, we considered a time windows of 5 s after the onset of each expiration task, and we looked for peaks of the SMNA signal (in fact, the phasic response is defined as the part of the signal arises within a predefined response window of 1–5 s [30,45]). Of note, due to the stimulus intervals of about 20 s, no overlap between consecutive responses occurred.
Results of an intersubject analysis showed that cvxEDA was able to correctly detect the corresponding phasic peak response over 97 . 5 % of the respiratory stimuli. Moreover, a visual inspection of the small percentage of cases that were not correctly identified revealed a very low signal-to-noise ratio of the signal.

3.2. Automatic Arousal Recognition Results

Results of the arousal-level-classification-procedure on the four datasets, namely, DC, AC 10 Hz, AC 100 Hz, AC 1 kHz, are shown in Table 2, Table 3, Table 4 and Table 5. The recognition accuracy is reported in the form of a confusion matrix. An element r i j of the confusion matrix indicates a percentage of mismatches, i.e., how many times a pattern belonging to class i was erroneously classified as belonging to class j. Terms r i j on the main diagonal of the confusion matrix correspond to correct classifications.
Both DC and AC measures did not show very high average recognition accuracy. However, it is worth noting that, using 100 Hz of the frequency current source, we obtain an average accuracy significantly higher than in the other cases. More specifically, using DC, 10 Hz and 1 kHz, the average accuracy was in the range of 62.5% to 63.34%, whereas at 100 Hz, the pattern recognition system showed an accuracy of 71.67%.

4. Discussions and Conclusions

In this study, we proposed a novel wearable EDA acquisition system prototype. It consisted of a sensorized glove provided with textile electrodes at the fingertips able to acquire the exosomatic EDA using both DC and AC methods. In order to test the usability of the novel sensorized glove and to investigate about possible differences between DC and AC stimulation (i.e., 10 Hz, 100 Hz, 1 kHz), we designed an experimental paradigm where 40 healthy subjects were stimulated by means of a mechanical expiration task and visual affective stimuli selected from the IAPS database. From this collection of pictures ranked in terms of arousal and valence level, two groups of images were selected: a group of neutral images and a group of negative aroused images.
The EDA signals were analyzed by means of the cvxEDA model [49]. The cvxEDA algorithm is based on the three concepts of sparsity, Bayesian statistics and convex optimization. It provides a decomposition of the EDA in its two components, i.e., phasic and tonic, and estimates the sudomotor nerve activity that control the eccrine sweat process, giving a window into the sympathetic nerve activity.
Results from the application of the cvxEDA algorithm showed no differences in the identification of the phasic peak response after the deep respiration stimulus among the DC and three AC methods. In fact, over 97% of the peaks were identified in the SMNA signal in the time response window of 5 s after the stimulus onset (i.e., directly evoked by the stimulus [30,45]). We could conclude that all of the investigated methods for the exosomatic measurement of the EDA reliably measure the phasic responses to eliciting stimuli.
Considering the four groups of data separately (i.e., DC, AC 10 Hz, AC 100 Hz, AC 1 kHz), in the second part of the experiment, we investigated possible differences in inferring the arousal state. Specifically, we performed a classification procedure of the arousal levels in the four groups of signals. Results showed that an alternating current method at 100 Hz could improve the arousal recognition accuracy up to 71% (while other acquisition modalities did not overcome an average accuracy of 63.5%). These results suggested that not only the skin conductance plays an important role in the electrodermal affective response, but also the susceptance (i.e., imaginary part of the skin impedance) may contain relevant information about the SNS. Moreover, this relationship between AC frequency and recognition accuracy is strongly nonlinear due to the nonlinear relationship between skin impedance, and amplitude and frequency of the external electrical source [60]. Specifically, it is well-known that the current density under a surface plate electrode could be non-uniform, and electrode surfaces present fractal properties creating local areas of different current densities. The onset of non-linearity may therefore be gradual, and start very early at very limited areas on the electrode surface (e.g., it has been shown that very weak non-linearity is measurable at voltages than 100 mV). Hence, it may be difficult to differentiate between the non-linearity of the electrode processes and the tissue processes [61].
We are aware that works stated that the role of the susceptance is less important with respect to the conductance at low frequency [39], but our results seem to indicate that a significant difference in EDA results are frequency dependent even more when they are not mechanical but emotionally evoked.
In other words, we assume that it could be feasible that emotional stimuli may involve a capacitive component in the medium under investigation that has a bigger contribution at 100 Hz.
Moreover, we should take into account that Ohm’s law, given by J = σ E , in such a medium could be not valid, and it may be useful to treat σ as a complex quantity in order to incorporate dielectric losses and frequency dependence, therefore defining σ as: σ = σ + j σ .
Future works will investigate the real and imaginary components of the admittance in the analysis of the EDA dynamics by involving time varying methods that could highlight the nonlinear nature of the electrodermal response.

Acknowledgments

This work was partially supported by the European Commission–Horizon 2020 Program under Grant 689691 “NEVERMIND” (NEurobehavioural predictiVE and peRsonalised Modelling of depressIve symptoms duriNg primary somatic Diseases with ICT-enabled self-management procedures).

Author Contributions

A.G., A.L., and E.P.S. conceived and designed the experiments; A.G. performed the experiments and analyzed the data; A.G. and L.C. developed the analysis tools; G.V., N.V. and E.P.S. contributed to the result interpretation; A.G., A.L., G.V. and E.P.S. wrote the paper.

Conflicts of Interest

The authors declare no conflict of interest.

References

  1. Gross, J.J.; Muñoz, R.F. Emotion regulation and mental health. Clin. Psychol. Sci. Pract. 1995, 2, 151–164. [Google Scholar] [CrossRef]
  2. Berking, M.; Wupperman, P. Emotion regulation and mental health: recent findings, current challenges, and future directions. Curr. Opin. Psychiatry 2012, 25, 128–134. [Google Scholar] [CrossRef] [PubMed]
  3. Posner, J.; Russell, J.A.; Peterson, B.S. The circumplex model of affect: An integrative approach to affective neuroscience, cognitive development, and psychopathology. Dev. Psychopathol. 2005, 17, 715–734. [Google Scholar] [CrossRef] [PubMed]
  4. Schlosberg, H. Three dimensions of emotion. Psychol. Rev. 1954, 61, 81. [Google Scholar] [CrossRef] [PubMed]
  5. Ortony, A.; Clore, G.L.; Collins, A. The Cognitive Structure of Emotions; Cambridge University Press: Cambridge, MA, USA, 1990. [Google Scholar]
  6. Lisetti, C.L.; Gmytrasiewicz, P. Can a rational agent afford to be affectless? A formal approach. Appl. Artif. Intell. 2002, 16, 577–609. [Google Scholar] [CrossRef]
  7. Reisenzein, R.; Hudlicka, E.; Dastani, M.; Gratch, J.; Hindriks, K.; Lorini, E.; Meyer, J.J.C. Computational modeling of emotion: Toward improving the inter-and intradisciplinary exchange. IEEE Trans. Affect. Comput. 2013, 4, 246–266. [Google Scholar] [CrossRef] [Green Version]
  8. Greco, A.; Valenza, G.; Nardelli, M.; Bianchi, M.; Citi, L.; Scilingo, E.P. Force–Velocity Assessment of Caress-Like Stimuli Through the Electrodermal Activity Processing: Advantages of a Convex Optimization Approach. IEEE Trans. Hum. Mach. Syst. 2016, 1–10. [Google Scholar] [CrossRef]
  9. Calvo, R.A.; D’Mello, S. Affect detection: An interdisciplinary review of models, methods, and their applications. IEEE Trans. Affect. Comput. 2010, 1, 18–37. [Google Scholar] [CrossRef]
  10. Valenza, G.; Greco, A.; Citi, L.; Bianchi, M.; Barbieri, R.; Scilingo, E. Inhomogeneous Point-Processes to Instantaneously Assess Affective Haptic Perception through Heartbeat Dynamics Information. Sci. Rep. 2016, 6, 1–14. [Google Scholar] [CrossRef] [PubMed]
  11. Valenza, G.; Nardelli, M.; Gentili, C.; Bertschy, G.; Kosel, M.; Scilingo, E.P. Predicting Mood Changes in Bipolar Disorder through Heartbeat Nonlinear Dynamics. Biomed. Health Inform. 2016, 20, 1034–1043. [Google Scholar] [CrossRef]
  12. Rukavina, S.; Gruss, S.; Hoffmann, H.; Tan, J.W.; Walter, S.; Traue, H.C. Affective Computing and the Impact of Gender and Age. PLoS ONE 2016, 11, e0150584. [Google Scholar] [CrossRef] [PubMed]
  13. Valenza, G.; Citi, L.; Gentili, C.; Lanata, A.; Scilingo, E.P.; Barbieri, R. Point-process nonlinear autonomic assessment of depressive states in bipolar patients. Methods Inf. Med. 2014, 53, 296–302. [Google Scholar] [CrossRef] [PubMed]
  14. Lanata, A.; Greco, A.; Valenza, G.; Scilingo, E.P. A pattern recognition approach based on electrodermal response for pathological mood identification in bipolar disorders. In Proceedings of the 2014 IEEE International Conference on Acoustics, Speech and Signal Processing (ICASSP), Florence, Italy, 4–9 May 2014; pp. 3601–3605.
  15. Valenza, G.; Lanatà, A.; Scilingo, E.P.; De Rossi, D. Towards a smart glove: Arousal recognition based on textile electrodermal response. In Proceedings of the 2010 Annual International Conference of the IEEE Engineering in Medicine and Biology, Buenos Aires, Argentina, 31 August–4 September 2010; pp. 3598–3601.
  16. Cowie, R.; Douglas-Cowie, E.; Tsapatsoulis, N.; Votsis, G.; Kollias, S.; Fellenz, W.; Taylor, J.G. Emotion recognition in human-computer interaction. IEEE Signal Process. Mag. 2001, 18, 32–80. [Google Scholar] [CrossRef]
  17. Mazzei, D.; Greco, A.; Lazzeri, N.; Zaraki, A.; Lanata, A.; Igliozzi, R.; Mancini, A.; Stoppa, F.; Scilingo, E.P.; Muratori, F. Robotic social therapy on children with autism: preliminary evaluation through multi-parametric analysis. In Proceedings of the 2012 International Conference on Privacy, Security, Risk and Trust (PASSAT), and 2012 International Confernece on Social Computing (SocialCom), Amsterdam, The Netherlands, 3–5 September 2012; pp. 955–960.
  18. Betella, A.; Zucca, R.; Cetnarski, R.; Greco, A.; Lanatà, A.; Mazzei, D.; Tognetti, A.; Arsiwalla, X.D.; Omedas, P.; De, R.D. Inference of human affective states from psychophysiological measurements extracted under ecologically valid conditions. Using Neurophysiol. Signals Reflect Cognit. Affect. State 2015, 66. [Google Scholar] [CrossRef] [PubMed]
  19. Anagnostopoulos, C.N.; Iliou, T.; Giannoukos, I. Features and classifiers for emotion recognition from speech: A survey from 2000 to 2011. Artif. Intell. Rev. 2015, 43, 155–177. [Google Scholar] [CrossRef]
  20. Lanatà, A.; Valenza, G.; Greco, A.; Gentili, C.; Bartolozzi, R.; Bucchi, F.; Frendo, F.; Scilingo, E.P. How the Autonomic Nervous System and Driving Style Change With Incremental Stressing Conditions During Simulated Driving. IEEE Trans. Intell. Transp. Syst. 2015, 16, 1505–1517. [Google Scholar] [CrossRef]
  21. Valenza, G.; Greco, A.; Gentili, C.; Lanata, A.; Sebastiani, L.; Menicucci, D.; Gemignani, A.; Scilingo, E. Combining electroencephalographic activity and instantaneous heart rate for assessing brain-heart dynamics during visual emotional elicitation in healthy subjects. Philos. Trans. R. Soc. A 2016, 374, 20150176. [Google Scholar] [CrossRef] [PubMed]
  22. Kim, J.; André, E. Emotion recognition based on physiological changes in music listening. IEEE Trans. Pattern Anal. Mach. Intell. 2008, 30, 2067–2083. [Google Scholar] [PubMed]
  23. Koelstra, S.; Muhl, C.; Soleymani, M.; Lee, J.S.; Yazdani, A.; Ebrahimi, T.; Pun, T.; Nijholt, A.; Patras, I. Deap: A database for emotion analysis; using physiological signals. IEEE Trans. Affect. Comput. 2012, 3, 18–31. [Google Scholar] [CrossRef]
  24. Jang, E.; Rak, B.; Kim, S.; Sohn, J. Emotion classification by machine learning algorithm using physiological signals. Proc. Comput. Sci. Inform. Technol. Singap. 2012, 25, 1–5. [Google Scholar]
  25. Healey, J.A.; Picard, R.W. Detecting stress during real-world driving tasks using physiological sensors. IEEE Trans. Intell. Transp. Syst. 2005, 6, 156–166. [Google Scholar] [CrossRef]
  26. Koji, N.; Nozawa, A.; Ide, H. Evaluation of emotions by nasal skin temperature on auditory stimulus and olfactory stimulus. IEEJ Trans. Electron. Inform. Syst. 2004, 124, 1914–1915. [Google Scholar] [CrossRef]
  27. Lanata, A.; Valenza, G.; Scilingo, E.P. Eye gaze patterns in emotional pictures. J. Ambient Intell. Hum. Comput. 2013, 4, 705–715. [Google Scholar] [CrossRef]
  28. Lanata, A.; Scilingo, E.P.; De Rossi, D. A multimodal transducer for cardiopulmonary activity monitoring in emergency. IEEE Trans. Inform. Technol. Biomed. 2010, 14, 817–825. [Google Scholar] [CrossRef] [PubMed]
  29. Krupa, N.; Anantharam, K.; Sanker, M.; Datta, S.; Sagar, J.V. Recognition of emotions in autistic children using physiological signals. Health Technol. 2016. [Google Scholar] [CrossRef]
  30. Boucsein, W. Electrodermal Activity; Springer Science & Business Media: Berlin/Heidelberg, Germany, 2012. [Google Scholar]
  31. Greco, A.; Valenza, G.; Lanata, A.; Rota, G.; Scilingo, E. Electrodermal Activity in Bipolar Patients during Affective Elicitation. IEEE J. Biomed. Health Inform. 2014, 18, 1865–1873. [Google Scholar] [CrossRef] [PubMed]
  32. Olausson, H.; Cole, J.; Rylander, K.; McGlone, F.; Lamarre, Y.; Wallin, B.G.; Krämer, H.; Wessberg, J.; Elam, M.; Bushnell, M.C.; et al. Functional role of unmyelinated tactile afferents in human hairy skin: Sympathetic response and perceptual localization. Exp. Brain Res. 2008, 184, 135–140. [Google Scholar] [CrossRef] [PubMed]
  33. Hanson, M.A.; Powell, H.C., Jr.; Barth, A.T.; Ringgenberg, K.; Calhoun, B.H.; Aylor, J.H.; Lach, J. Body area sensor networks: Challenges and opportunities. Computer 2009, 42, 58. [Google Scholar] [CrossRef]
  34. Martínez-Rodrigo, A.; Zangróniz, R.; Pastor, J.M.; Fernández-Caballero, A. Arousal level classification in the ageing adult by measuring electrodermal skin conductivity. In Ambient Intelligence for Health; Springer: New York, NY, USA, 2015; pp. 213–223. [Google Scholar]
  35. Lee, Y.; Lee, B.; Lee, M. Wearable sensor glove based on conducting fabric using electrodermal activity and pulse-wave sensors for e-health application. Telemed. E-Health 2010, 16, 209–217. [Google Scholar] [CrossRef] [PubMed]
  36. Patel, S.; Park, H.; Bonato, P.; Chan, L.; Rodgers, M. A review of wearable sensors and systems with application in rehabilitation. J. Neuroeng. Rehabilit. 2012, 9, 1. [Google Scholar] [CrossRef] [PubMed]
  37. Garbarino, M.; Lai, M.; Bender, D.; Picard, R.W.; Tognetti, S. Empatica E3—A wearable wireless multi-sensor device for real-time computerized biofeedback and data acquisition. In Proceedings of the 2014 EAI 4th International Conference on Wireless Mobile Communication and Healthcare (Mobihealth), Athens, Greece, 3–5 November 2014; pp. 39–42.
  38. Martinsen, O.G.; Grimnes, S. Bioimpedance and Bioelectricity Basics; Academic press: Cambridge, MA, USA, 2011. [Google Scholar]
  39. Martinsen, Ø.; Grimnes, S.; Sveen, O. Dielectric properties of some keratinised tissues. Part 1: Stratum corneum and nailin situ. Med. Biol. Eng. Comput. 1997, 35, 172–176. [Google Scholar]
  40. Lanatà, A.; Valenza, G.; Scilingo, E.P. A novel EDA glove based on textile-integrated electrodes for affective computing. Med. Biol. Eng. Comput. 2012, 50, 1163–1172. [Google Scholar] [CrossRef] [PubMed]
  41. Martinsen, O.; Grimnes, S. On using single frequency electrical measurements for skin hydration assessment. Innov. Technol. Biol. Méd. 1998, 19, 395–400. [Google Scholar]
  42. Martinsen, Ø.G.; Grimnes, S. Facts and myths about electrical measurement of stratum corneum hydration state. Dermatology 2001, 202, 87–89. [Google Scholar]
  43. Martinsen, Ø.G.; Grimnes, S.; Nilsen, J.K.; Tronstad, C.; Jang, W.; Kim, H.; Shin, K.; Naderi, M.; Thielmann, F. Gravimetric method for in vitro calibration of skin hydration measurements. IEEE Trans. Biomed. Eng. 2008, 55, 728–732. [Google Scholar]
  44. Ishchenko, A.; Shev‘ev, P. Automated complex for multiparameter analysis of the galvanic skin response signal. Biomed. Eng. 1989, 23, 113–117. [Google Scholar] [CrossRef]
  45. Benedek, M.; Kaernbach, C. Decomposition of skin conductance data by means of nonnegative deconvolution. Psychophysiology 2010, 47, 647–658. [Google Scholar] [CrossRef] [PubMed]
  46. Breska, A.; Maoz, K.; Ben-Shakhar, G. Interstimulus intervals for skin conductance response measurement. Psychophysiology 2011, 48, 437–440. [Google Scholar] [CrossRef] [PubMed]
  47. Dawson, M.E.; Schell, A.M.; Filion, D.L. 7 the Electrodermal System. Handb. Psychophysiol. 2007, 159, 200–223. [Google Scholar]
  48. Christie, M.J. Electrodermal activity in the 1980s: A review. J. R. Soc. Med. 1981, 74, 616. [Google Scholar] [PubMed]
  49. Greco, A.; Valenza, G.; Lanata, A.; Scilingo, E.P.; Citi, L. cvxEDA: A Convex Optimization Approach to Electrodermal Activity Processing. IEEE Trans. Biomed. Eng. 2016, 63, 797–804. [Google Scholar] [CrossRef] [PubMed]
  50. Analog Device: AD9833 Low Power, Programmable Waveform Generator. Available online: http://www.analog.com/en/products/rf-microwave/direct-digital-synthesis-modulators/ad9833.html (accessed on 25 July 2016).
  51. Texas Instrument: MSP430 Ultra-Low-Power Microcontrollers. Available online: http://www.ti.com/lsds/ti/microcontrollers_16-bit_32-bit/msp/overview.page (accessed on 25 July 2016).
  52. Garrett, E.R. The Bateman function revisited: A critical reevaluation of the quantitative expressions to characterize concentrations in the one compartment body model as a function of time with first-order invasion and first-order elimination. J. Pharmacokinet. Biopharm. 1994, 22, 103–128. [Google Scholar] [CrossRef] [PubMed]
  53. Alexander, D.; Trengove, C.; Johnston, P.; Cooper, T.; August, J.; Gordon, E. Separating individual skin conductance responses in a short interstimulus-interval paradigm. J. Neurosci. Methods 2005, 146, 116–123. [Google Scholar] [CrossRef] [PubMed]
  54. Benedek, M.; Kaernbach, C. A continuous measure of phasic electrodermal activity. J. Neurosci. Methods 2010, 190, 80–91. [Google Scholar] [CrossRef] [PubMed]
  55. Greco, A.; Lanata, A.; Valenza, G.; Scilingo, E.P.; Citi, L. Electrodermal activity processing: A convex optimization approach. In Proceedings of the 2014 36th IEEE Annual International Conference of the Engineering in Medicine and Biology Society (EMBC), Chicago, IL, USA, 26–30 August 2014; pp. 2290–2293.
  56. cvxEDA. Algorithm for the Analysis of Electrodermal Activity (EDA) Using Convex Optimization. Available online: https://www.mathworks.com/matlabcentral/fileexchange/53326-cvxeda (accessed on 25 July 2016).
  57. Searle, A.; Kirkup, L. A direct comparison of wet, dry and insulating bioelectric recording electrodes. Physiol. Meas. 2000, 21, 271. [Google Scholar] [CrossRef] [PubMed]
  58. Kira, Y.; Ogura, T.; Aramaki, S.; Kubo, T.; Hayasida, T.; Hirasawa, Y. Sympathetic skin response evoked by respiratory stimulation as a measure of sympathetic function. Clin. Neurophysiol. 2001, 112, 861–865. [Google Scholar] [CrossRef]
  59. Lang, P.; Bradley, M.; Cuthbert, B. International affective picture system (IAPS): Digitized photographs, instruction manual and affective ratings. In Technical Report A-6; University of Florida: Gainesville, FL, USA, 2005. [Google Scholar]
  60. Mørkrid, L.; Qiao, Z.G. Continuous estimation of parameters in skin electrical admittance from simultaneous measurements at two different frequencies. Med. Biol. Eng. Comput. 1988, 26, 633–640. [Google Scholar] [CrossRef] [PubMed]
  61. Sawan, M.; Laaziri, Y.; Mounaim, F.; Elzayat, E.; Corcos, J.; Elhilali, M. Electrode-Tissues interface: Modeling and experimental validation. Biomed. Mater. 2007, 2, S7. [Google Scholar] [CrossRef] [PubMed]
Figure 1. Sensorized glove for the acquisition of the Electrodermal Activity (EDA).
Electronics 05 00046 g001
Figure 2. Block scheme of the electronic circuit.
Electronics 05 00046 g002
Figure 3. Overall block scheme of the proposed valence recognition system. The EDA is processed in order to extract the phasic and tonic components using the cvxEDA algorithm. According to the protocol timeline, several features are extracted. The K-nearest neighbors (K-NN) classifier is engaged to perform the pattern recognition by adopting a leave-one-subject-out procedure.
Electronics 05 00046 g003
Figure 4. Application of the cvxEDA decomposition procedure to the EDA signal recorded (i.e., admittance module) for a representative subject. (A) raw EDA signal, Z-score normalized; (B) estimated sparse phasic driver component p; (C) estimated slow tonic component t.
Electronics 05 00046 g004
Table 1. List of features extracted from Electrodermal Activity (EDA) phasic and tonic components.
FeatureDescription
Npeaknumber of significant SMNA peaks wrw
AUCArea under curve of reconstructed phasic signal wrw ( μ S s )
peakmaximum amplitude of significant peaks of SMNA signal wrw 1 ( μ S )
MeanTonicMean value of the tonic component within each image time window ( μ S )
wrw= within response window (i.e., 5 s after stimulus onset).
Table 2. Confusion matrix of Neutral vs. Arousal images using an cvxEDA feature set extracted with a Direct Current (DC) source.
K-NN (DC)NeutralArousal
Neutral63.33%35.00%
Arousal36.67%65.00%
K-NN means K-nearest neighbors.
Table 3. Confusion matrix of Neutral vs. Arousal images using cvxEDA feature set extracted with Alternating Current (AC) source at 10 Hz.
K-NN (AC 10 Hz)NeutralArousal
Neutral65.00%38.33%
Arousal35.00%61.67%
Table 4. Confusion matrix of Neutral vs. Arousal images using cvxEDA feature set extracted with AC source at 100 Hz.
K-NN (AC 100 Hz)NeutralArousal
Neutral68.33%25.00%
Arousal31.67%75.00%
Table 5. Confusion matrix of Neutral vs. Arousal images using cvxEDA feature set extracted with AC source at 1 kHz.
K-NN (AC 1 kz)NeutralArousal
Neutral63.33%38.33%
Arousal36.67%61.67%

