1. Introduction
The consolidation of distributed generation into modern power grids has motivated the development of control techniques that provide enhanced performance, reliability, modularity, robustness, and efficiency. Owing to the variability in environmental conditions, renewable energy systems are often subject to wide operating conditions of voltage, current, and processed power. To maximize generation and improve return on investments, the interface converter features a maximum power point tracking (MPPT) algorithm [
1]. However, these converters typically process a fraction of their rated power throughout their lifespans. For this reason, these parts of the efficiency curve receive greater weighting in figures of merit, such as the European or CEC efficiency [
2].
Several converter topologies have been developed with soft switching and other techniques aimed at reducing losses and volume for several classes of applications [
3,
4,
5,
6]. However, achieving high efficiency over a wide operating range, particularly over large load ranges, remains a major concern. Parallel-operated converters have become another approach for improving the global system efficiency [
7,
8,
9]. Additionally, this configuration facilitates redundancy, scalability, and increased reliability by utilizing semiconductors with reduced losses in modules with fractional power ratings [
10].
One common method for paralleling converters is to add interleaved parallel branches (phases) [
11,
12]. In this approach, one or more circuit branches are replicated in parallel to reduce the overall device effort, switching losses, and current ripple. Usually, in these cases, all branches have the same ratings and control is implemented to ensure that the power processed by each branch is the same. The modulation techniques for these systems can be modified to achieve different specific objectives, such as reducing the source or load current ripple [
13,
14]. For parallel-connected inverters, one should also consider the circulating current between converters, a problem that naturally arises from component mismatches, among other reasons. Methods to reduce these effects and improve the energy quality provided for loads were presented in [
15,
16,
17].
The droop method is frequently employed to parallelize converters. Simple, effective, and without requiring physical means of communication, this method shares the power demand among all converters, which is often proportional to their power ratings [
18,
19]. The droop method can be easily adapted to various power levels and systems built using completely distinct topologies. The applications of this method vary from power sharing in converters fed by a single source to modules powered by multiple sources, as in the case of microgrids [
20]. In addition to droop-based approaches, distributed control strategies have also been proposed for parallel converters supplied by multiple sources, focusing on voltage regulation and balanced current sharing without centralized coordination [
21].
Beyond droop-based techniques, several alternative control strategies have been proposed to overcome its limitations and improve power sharing among parallel converters. Active approaches were presented in [
22] to ensure that the power shared between multiple converters is proportional to their ratings, thereby correcting the inaccuracies of the droop method. In [
23], a distributed control strategy for a parallel resonant CLLC Dual Active Bridge (DAB) converter is proposed for independent control of power flow in an attempt to compensate for parametric deviations and achieve a balanced current sharing. A wireless master–slave method was presented in [
24] to avoid physical connections for communication. The authors also presented a stability analysis that considered communication delays. In [
25], authors evaluate the transient performance in systems of parallel converters and propose an improved virtual impedance control strategy to mitigate the unbalances caused by load steps. However, these methods focus only on addressing the power-sharing problem.
Parallel configurations also allow the use of a minimum number of converters to supply load demand in an attempt to reduce losses. In this sense, a supervisory system that enables appropriate power-sharing among converters is a design concern. This power management should allow the system to achieve optimal efficiency over its entire operating range. However, only few studies have addressed this issue.
A method of perturbation of the power sharing and observation of the global efficiency was presented in [
26], aiming to achieve high efficiency dynamically. A strategy for slicing the efficiency curve and assigning priorities to each slice was proposed in [
27]. The controller of each converter is responsible for maintaining the converter operating in a higher efficiency region or reducing its power until shutdown. In [
28], a sensorless strategy was formulated to equalize the processed power for Input-Parallel Output-Parallel (IPOP) DAB converters. The same system topology was covered in [
29], where a tunable power-sharing strategy improved the transient performance for input-voltage disturbances. An Active Current Sharing (ACS) is proposed in [
30] to balance the output currents and improve transient performance in the presence of disturbances.
All of these methods might improve global efficiency, but they do not ensure that the system will operate with optimal efficiency throughout all operating ranges. Several strategies have been proposed to overcome this issue. In [
31], a Lagrangian loss optimal load sharing for phase-shifted full-bridge converters was presented. For wind power systems, Ref. [
32] presented an optimization strategy based on an exhaustive search that lacks efficiency in complex systems. A hybrid heuristic optimization algorithm for DC-DC converters was introduced in [
33], reducing the computational effort compared to the previous method. However, these three alternatives perform the optimization of a single variable, that is, processed power.
The main objective of this paper is to present an improved approach for power sharing among parallel converters, providing optimal efficiency throughout the entire system operating range, particularly for light loads. The method here is based on [
33] and extends the optimization for input voltage variations while providing insights for control designers to implement sharing supervisor and loop controllers. More specifically, the proposed method differs from existing efficiency-oriented power-sharing approaches in three main aspects: (i) it determines the optimal power sharing among converters without enforcing equal power distribution, (ii) it considers a multivariable optimization framework that includes both processed power and input voltage, and (iii) it enables practical real-time implementation through an offline optimization stage combined with LUT-based control. This enhanced approach is particularly suitable for systems fed by renewable sources and battery-based systems, where the mission profile of the converters is to operate below half of the rated power most of the time and with varying input voltages.
The remainder of this paper is organized as follows. In
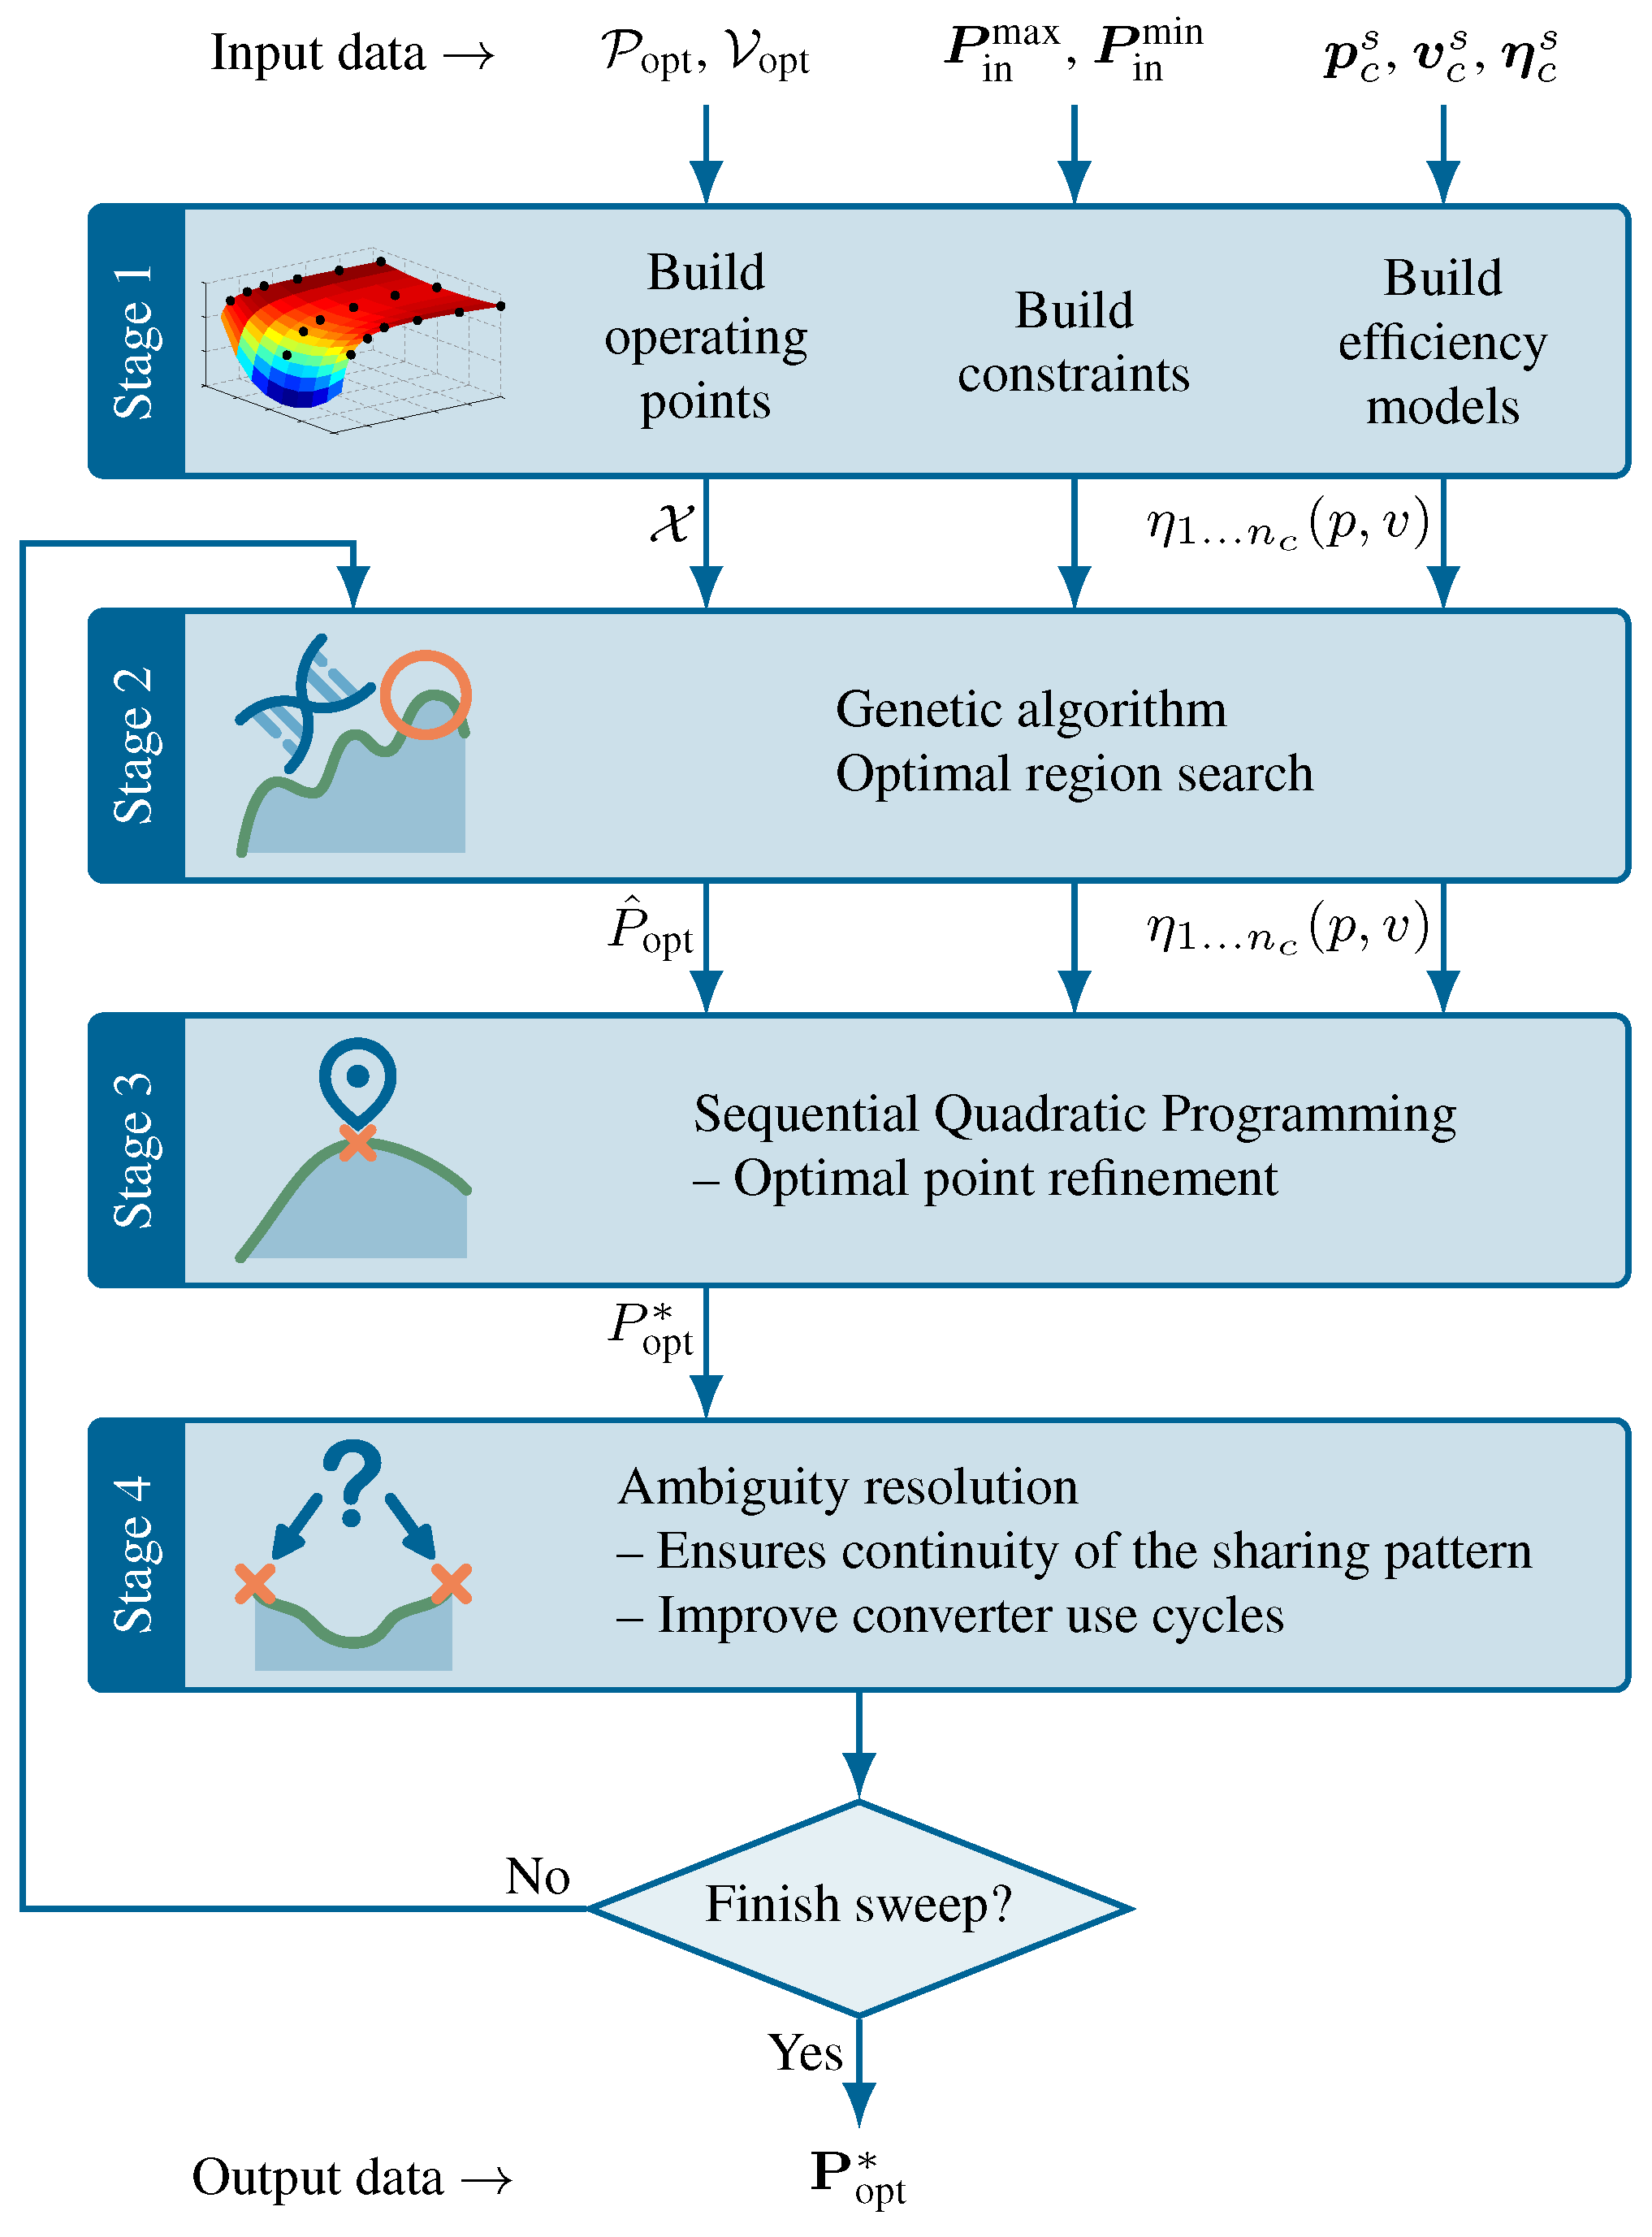
Section 2, the efficiency of the parallel converter system is discussed. The optimization problem is formulated, and its constraints and search spaces are presented. The proposed optimization methodology and its inner stages are described in
Section 3.
Section 4 introduces the design of the control strategy for implementing optimal power sharing. The experimental results and discussions on the decision variables for supervisory control are presented in
Section 5. Finally, the remarks and conclusions are presented in
Section 6.
2. System Efficiency and Problem Formulation
Power losses in electronic conversion systems occur because of various phenomena. Some examples include conduction or switching of semiconductors, power consumption of ancillary systems such as drive circuits, protection and signaling subsystems [
34,
35,
36]. The total losses of a converter vary depending on its operating point, and temperature, as well as in terms of their technological and constructive characteristics [
37,
38]. For light loads, the losses in the ancillary subsystems tend to be more significant and approximately constant. However, increasing the power level makes the switching and conduction losses more significant. The resulting converter efficiency (
) is usually plotted for all load ranges, and can be handled as a function of the output (
) or input power (
). It may be represented as a function of other relevant variables, such as the input (
) or output voltage (
). In [
39], the authors compared different approaches to model efficiency curves or surfaces. For cases considering power and voltage, it is shown that the double quadratic model can approximate surfaces with adequate correlation. This model is defined by
with
where
,
, and
are the coefficients to be determined by surface-fitting algorithms over experimental, simulation, or theoretical results. In this model,
p and
v correspond to the average power and voltage values, respectively, computed over one switching period
and measured under steady-state operating condition. This equation is generic enough that, at this point,
p or
v can represent input or output values.
For systems composed of
parallel converters, the global efficiency of the system (
) can be determined from the ratio between the sum of the output powers and the sum of the input powers of all converters, where
and
denote the output and input power of the
c-th converter, respectively, that is,
Inspecting (
5) and knowing that
one might suppose that, for the same output power, the resulting system efficiency will be different for different power distributions among the converters. This leads to the need for a methodology that establishes optimal power references for each converter to ensure that global efficiency is maximized for each operating point. If the efficiency model (
1) is fitted in terms of the input power and the input voltage, the output power can be computed as
. By substituting (
1) into this expression and subsequently replacing
in (
5), a cost function minimization problem can be written as
The solution to this problem provides an optimal set of
values that ensure the maximum system efficiency for all feasible operating points. For compactness, the vector of processed power values is defined as
, which represents a candidate or optimal solution throughout the optimization process. Although the objective is to maximize the efficiency, (
6) is formulated as the minimization of its negative value. This formulation is adopted because most optimization algorithms, including those employed in this work, are designed to minimize a cost function rather to maximize a merit function. The optimization problem (
6) is nonlinear and subject to certain constraints. The first states that the system power under optimization (
) must match the power processed by all converters, that is,
. Since the algorithms used in the methodology handle restrictions in matrix form, this linear equality can be expressed as
Another constraint states that the processed power of each converter (
) must be less than or equal to its rated value (
) and the minimum value (
). Thus, one has the linear inequality given by
where the inequality between vectors is understood componentwise; that is, for any
,
Defining a minimum power level in (
8) introduces a degree of freedom that can be used by the designer to prevent converters from operating in unsupported regions, whether due to the employed control strategy or hardware constraints. This degree of freedom can also be exploited to prioritize operation only in desired modes, such as continuous conduction mode.
The minimization function (
6), in addition to its nonlinear and constrained nature, may feature multiple local minima or even multiple global minima in cases where the system is composed of equal converters. This paper proposes a new method to solve this optimization problem and presents a control strategy that enables parallel converter systems to operate at optimal efficiency over all load and input-voltage ranges.
4. Control Strategy
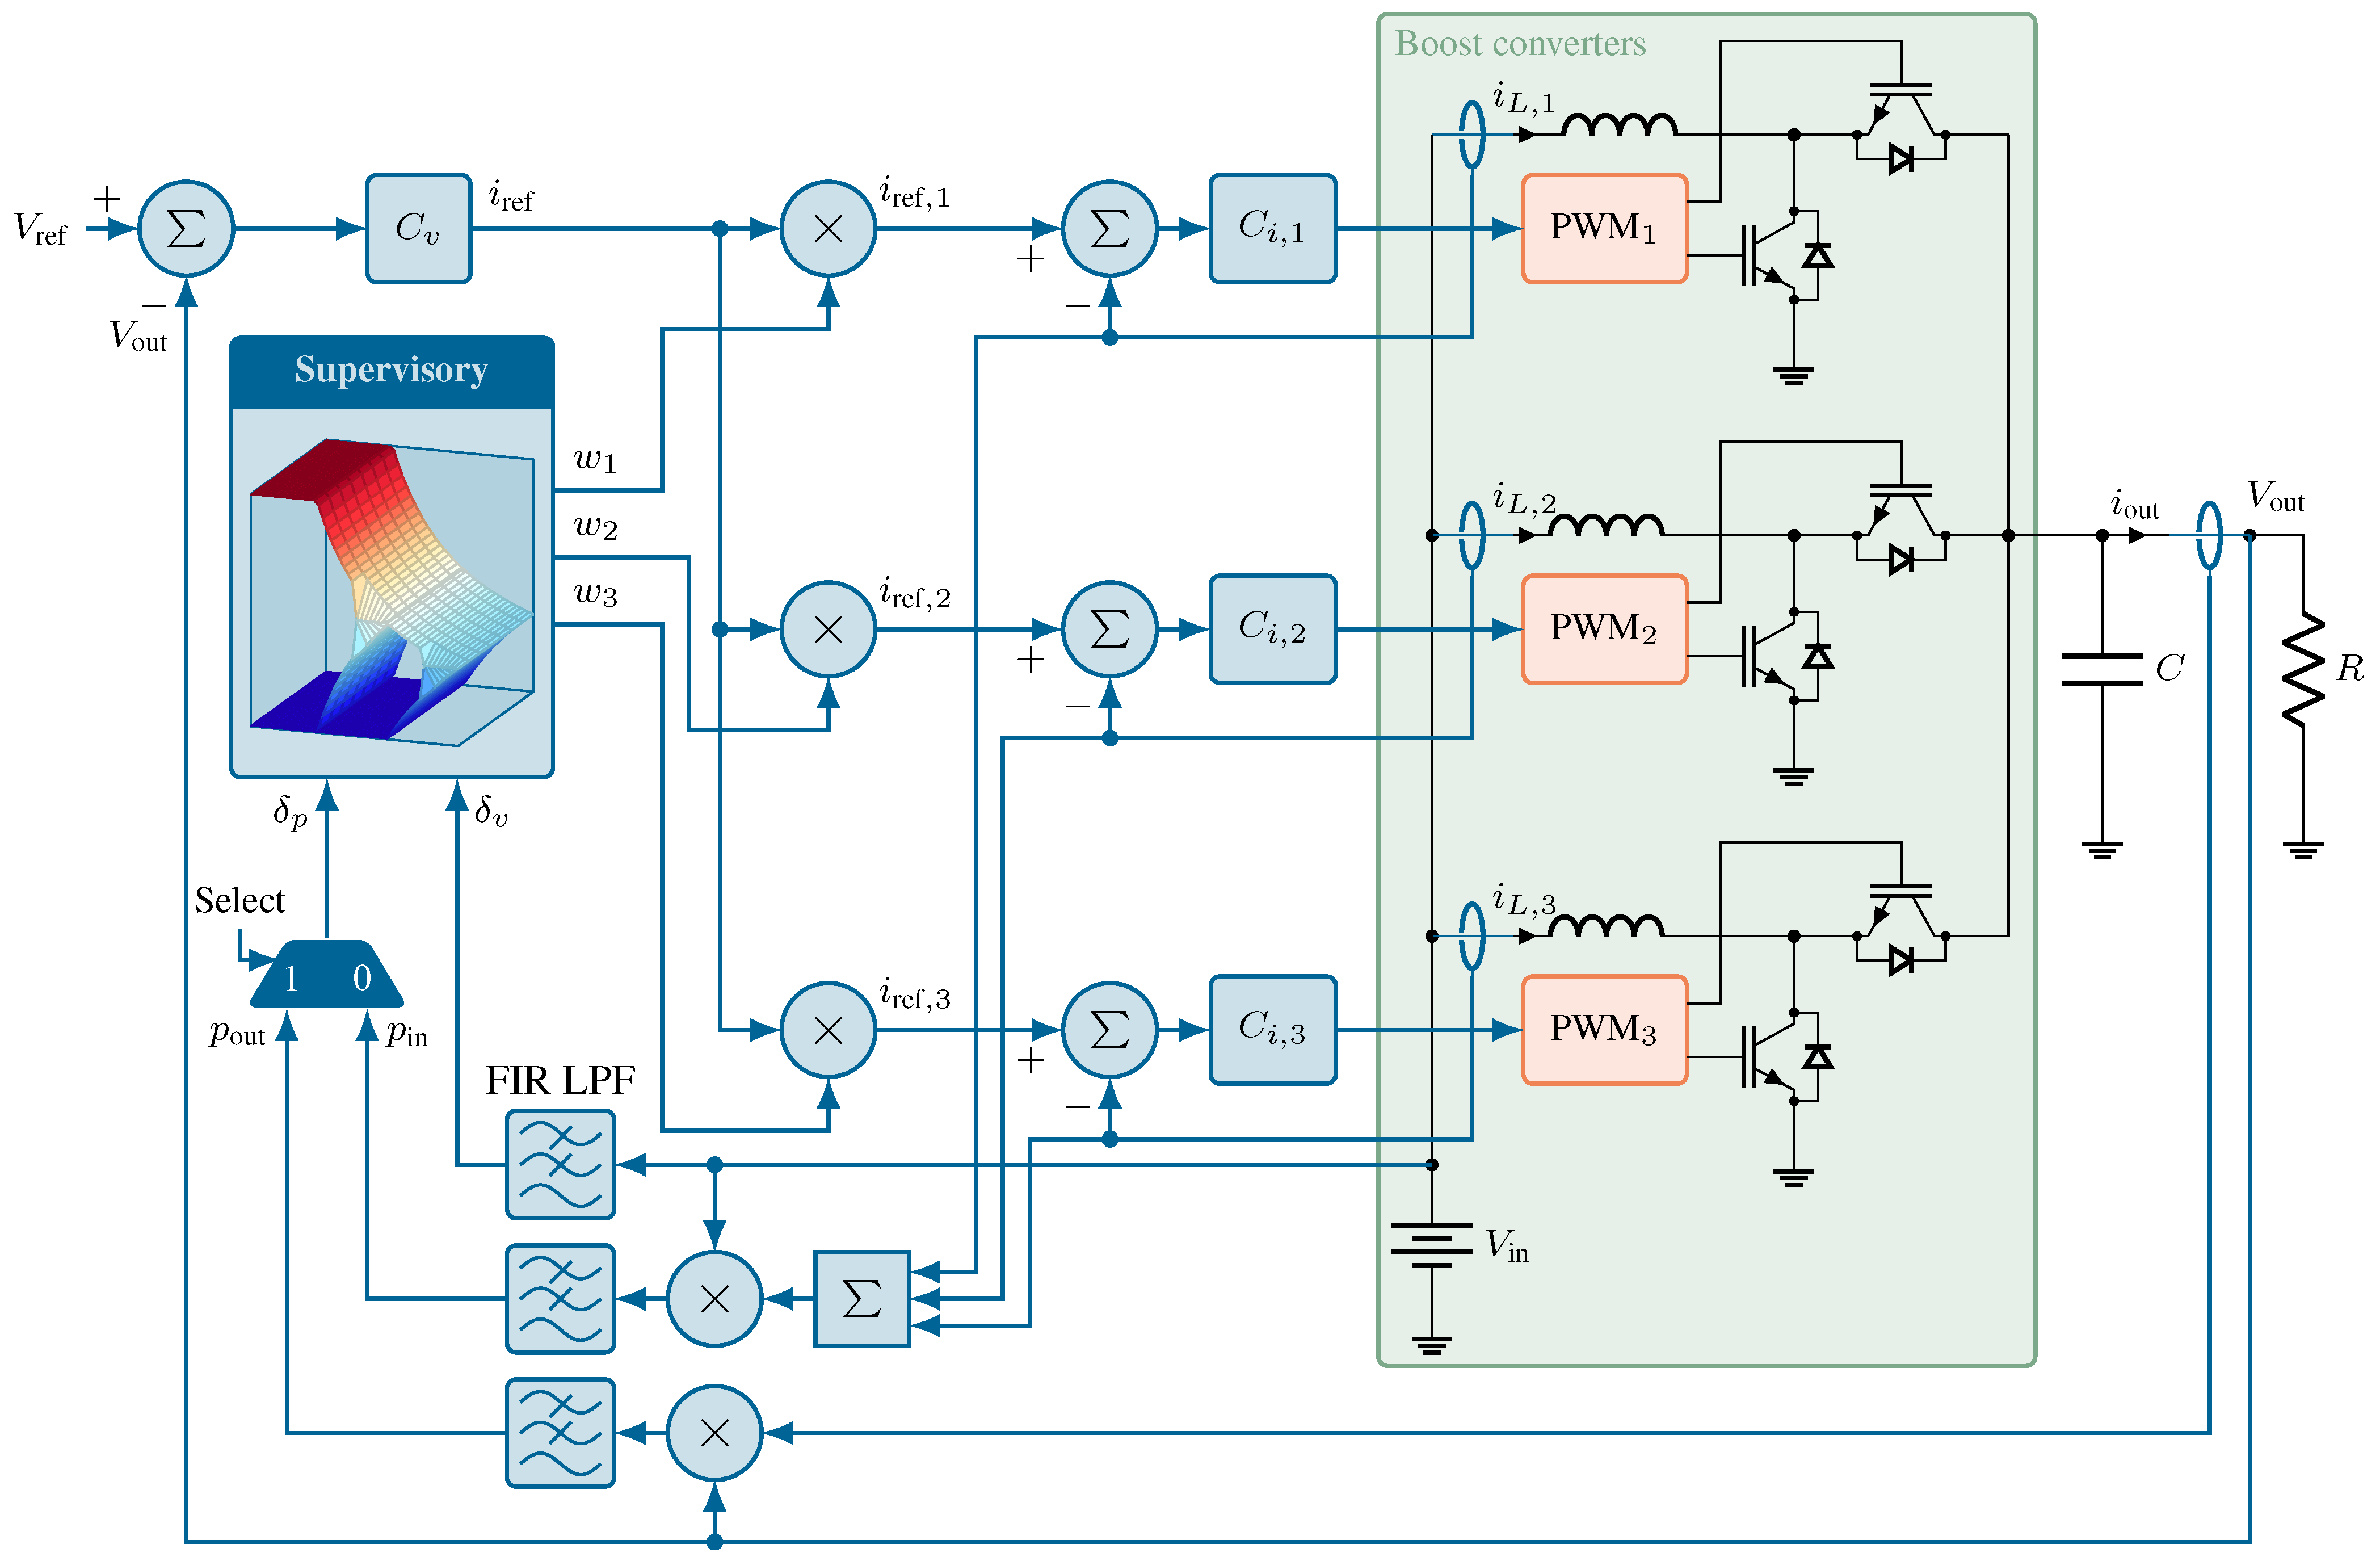
In this section, a simple and effective control strategy based on Active Current Sharing (ACS) is presented to implement the power-sharing surfaces obtained using the optimization methodology. A block diagram of the proposed control strategy is shown in
Figure 2 for a system of
parallel converters. An external voltage loop is responsible for regulating the DC bus voltage (
), where the voltage controller
generates a global input current reference
. A sharing supervisor uses two decision variables to identify the system operating point in terms of input voltage (
) and processed power (
). These variables are employed to query a look-up table (LUT) that stores the results of the optimization methodology as a three-dimensional matrix of weighting factors. The signals of the decision variables pass through low-pass filters to mitigate noise injection into the supervisory control and improve the system transient response in some cases. Based on the LUT results, a convex combination is applied to the global current reference, providing the current references
that are imposed on the internal current loop of each converter. Finally, the inner current controllers
are responsible for tracking the inductor current, enabling an optimal system efficiency. The following sections provide in-depth explanations and insights into the design of the most relevant blocks.
4.1. Supervisory Control
The optimization methodology proposed in
Section 3 determines the power required by each converter to achieve optimal system efficiency. Manipulation from power to current must be performed to apply these results to the proposed control system. Furthermore, because the voltage controller provides a system input current reference, the supervisory block must perform a weighting over this value to obtain the current references that will be applied to each converter. The conversion from power to convex weighting surfaces was performed using
where
c is the converter index,
k and
i correspond, respectively, to the discrete power and voltage levels for which the optimization was performed, maintaining the same correspondence defined in (
11).
Decision variables are used to map the values of the input voltage and processed power to indices i and k. For , the associated signal is the input voltage of the system. On the other hand, can be alternately defined according to the availability of sensors or signals. Choosing the most appropriate strategy is not straightforward; the final decision is made by the designer after carrying out a cost–benefit tradeoff.
As a first strategy for parallel boost converters, one can obtain the processed power by the product of
and the total input current
, which corresponds to the sum of all inductor currents
. However, as in many other converters, the input power does not instantaneously reflect the power absorbed by the load, which can be confirmed by the Tellegen theorem [
49].
Let
denote the average value of a signal
over one switching period. Neglecting the losses for the sake of simplicity, since their impact on system dynamics is negligible for this analysis, the circuit equations of a single boost converter can be written as
or, in a compact form
where
is the sum of the inductor and capacitor energy variations. From (
14), it can be observed that during transients, the averaged input power is affected by the energy variations required to lead the converter to a new operating point. It is only in the steady state, when the derivatives reduce toward zero, that the averaged input power can be considered the same as the averaged output power. In this sense, supervisory control cannot act instantaneously during transients because these energy variations result in erroneous load power estimations that may lead to inadequate power redistributions and cause performance degradation or even instabilities. To mitigate the adverse effects, filtering strategies must be implemented to limit the bandwidth, so
responds to nearly steady-state processed power. However, this should be done carefully, as large power steps could render the system unable to supply the load demand or force active converters to work under serious overload conditions. In-depth discussions will be presented along with the experimental results.
As a second strategy for one may employ only the output current in systems where the output voltage is known and fixed or regulated, which is a common case for DC-DC converters. The advantage of this approach is that the power consumed by the load is directly related to the output current, and the output voltage oscillations are usually sufficiently small to be neglected. From the implementation perspective, this approach typically requires an additional current sensor, which affects the system costs. In contrast to the first approach, input-current sensors are often available in boost or other converters.
4.2. Inner Current-Loop Controller
Applying the sharing strategy does not rely on a specific type of controller. Instead, different approaches may be employed to track the optimal references provided by the supervisory control while achieving the desired control system goals. A classical discrete-time proportional–integral (PI) controller was used to track the current references for each converter. To design this controller, the control-to-input current transfer function is given by
where
is the DC gain of the transfer function;
is the zero frequency;
is the natural frequency; and
is the quality factor. This transfer function can be obtained by employing the state-space averaging technique and applying the Laplace transform to the obtained model. The necessary parameters are obtained from
where
is the rated input voltage,
R is the equivalent load resistance,
D and
the duty ratio and its complement, respectively, such that
,
L is the input inductance, and
C is the DC-bus capacitor.
4.3. DC-Bus Voltage Controller
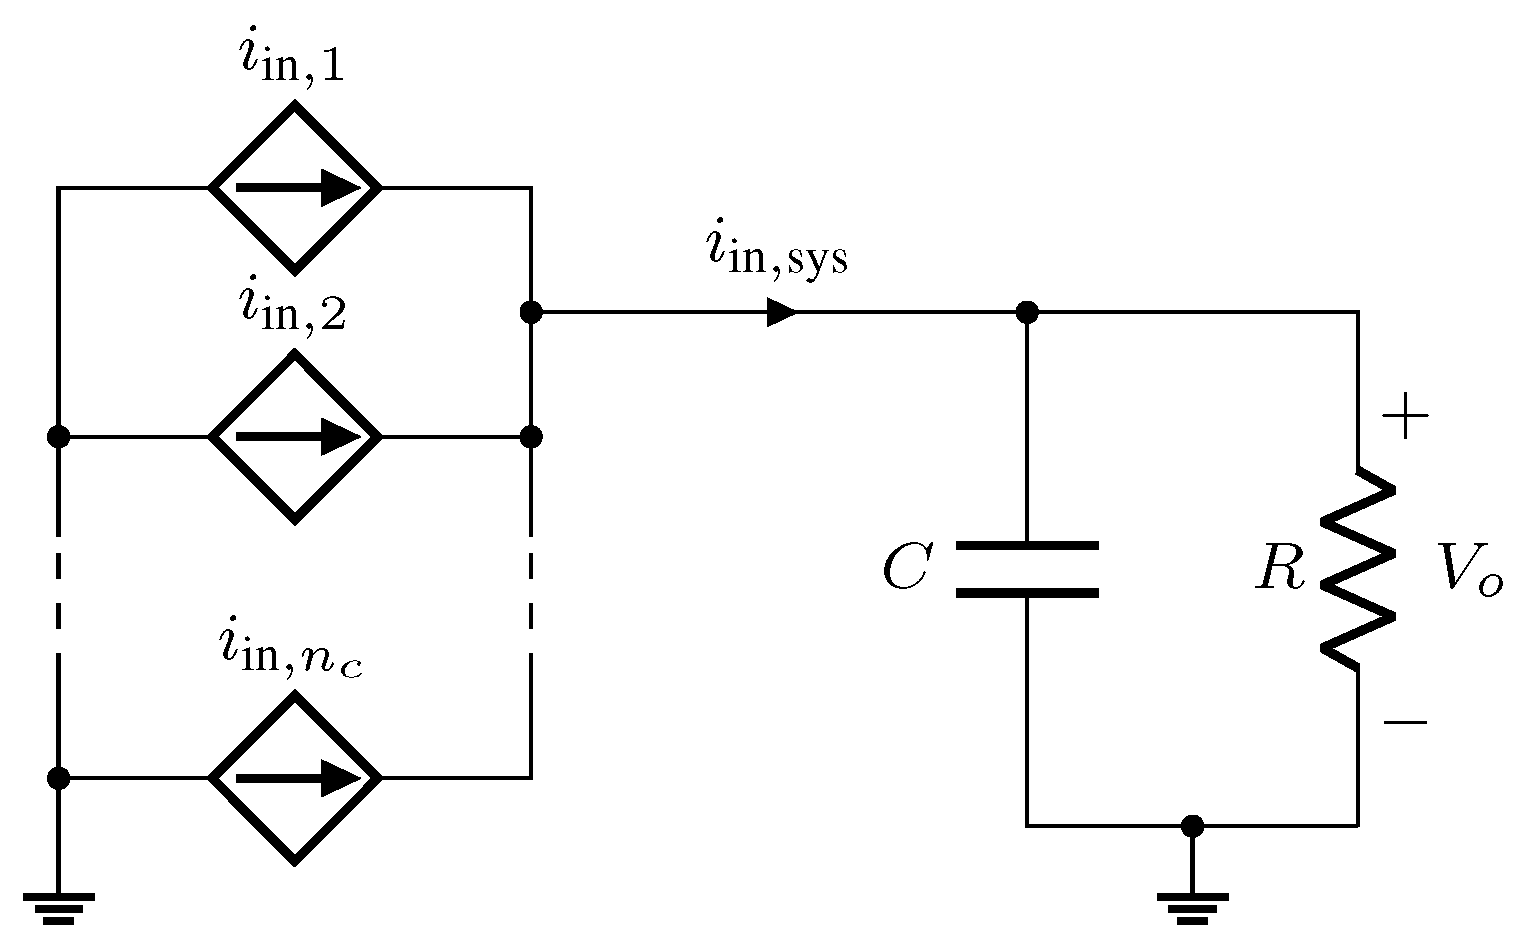
The design of the voltage controller may face some challenges owing to the optimal sharing strategy. Each boost converter may provide different current values or they can even be turned off to increase system efficiency, leading to a nonlinear and variable-structure system. A simplification of the complete dynamics must be assumed to continue using a classical control approach. With a fast and well-regulated inner current loop, each converter behaves as a controlled current source, feeding the output impedance comprising the resistive load and the DC-bus capacitor, as depicted in
Figure 3. The total output current is given by
. For the boost converter, the output current is related to the input current as
. Applying the Laplace transform to the circuit shown in
Figure 3, the transfer function of the DC-bus voltage can be obtained using the system input current as
The DC gain of the transfer function and pole frequency are defined by
Although
is a simplification, high-frequency dynamics can be neglected if the bandwidth of the DC-bus voltage controller is sufficiently narrower than that of the current loop.
5. Experimental Results
An experimental setup with three parallel boost converters was constructed to evaluate the proposed optimization methodology.
Table 1 summarizes the specifications of the proposed system. All the tests were conducted with the platform dSPACE DS1103 that works together with Matlab/Simulink (version R2021b). The platform was built around a PowerPC604e processor and a DSP TMS320F240 as a slave microcontroller for advanced I/O purposes, such as PWM signal generation. Efficiency measurements were performed using a Yokogawa WT1600 digital power meter (1
bandwidth).
The first step in applying the proposed methodology involves modeling the efficiency surface. A total of 64 samples were acquired across voltages ranging from 110
to 250
in steps of 20
. For each converter, the samples were collected at 12%, 20%, 28%, 41%, 59%, 89%, 93%, and 100% of the rated output power.
Table 2 presents the efficiency samples obtained for Converter 1. Converters 2 and 3 provide results with a difference of less than 1% and are therefore omitted here.
Applying the efficiency samples from
Table 2 to the surface-fitting algorithm for (
1) results in the efficiency surface model. The obtained coefficients are listed in
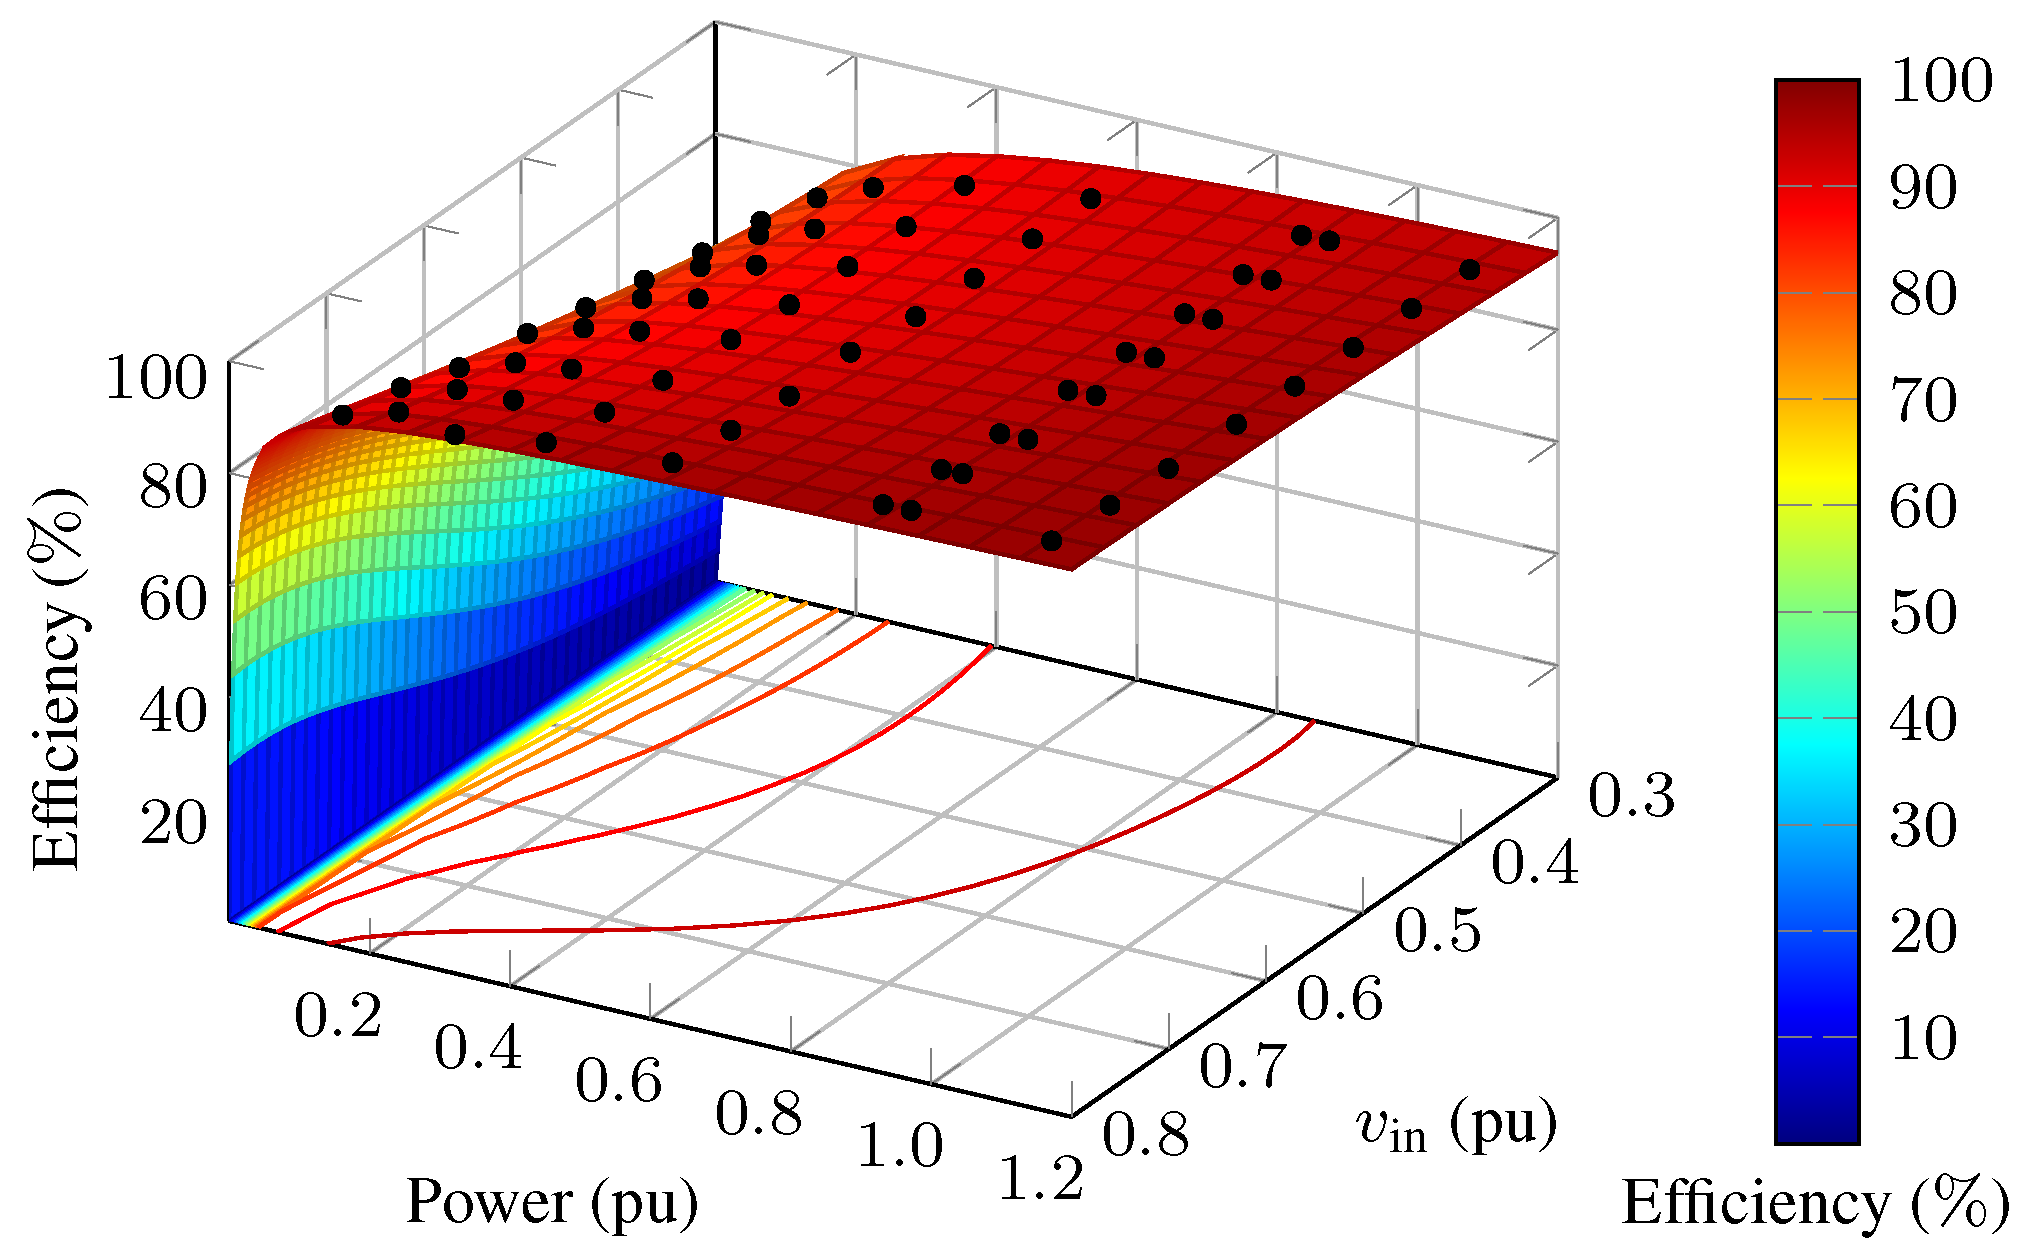
Table 3, and
Figure 4 shows the fitted surface and experimental samples. The quality of the fit is confirmed by a root-mean-square error (
) between the fitted surface and the experimental samples of
. Because the converters have identical specifications, their efficiency surfaces are assumed equal.
After properly modeling the efficiency surfaces, the following steps consist of running the global and local optimizations. The GA is configured with a population size of 50 individuals, crossover rate of 0.5, and mutation rate of 0.1. The proposed algorithm performs a sweep in the system power from 0.02 p.u. to 1.0 p.u., in steps of 0.02 p.u., and the input voltage varies from 110 V to 250 V, in steps of 20 V.
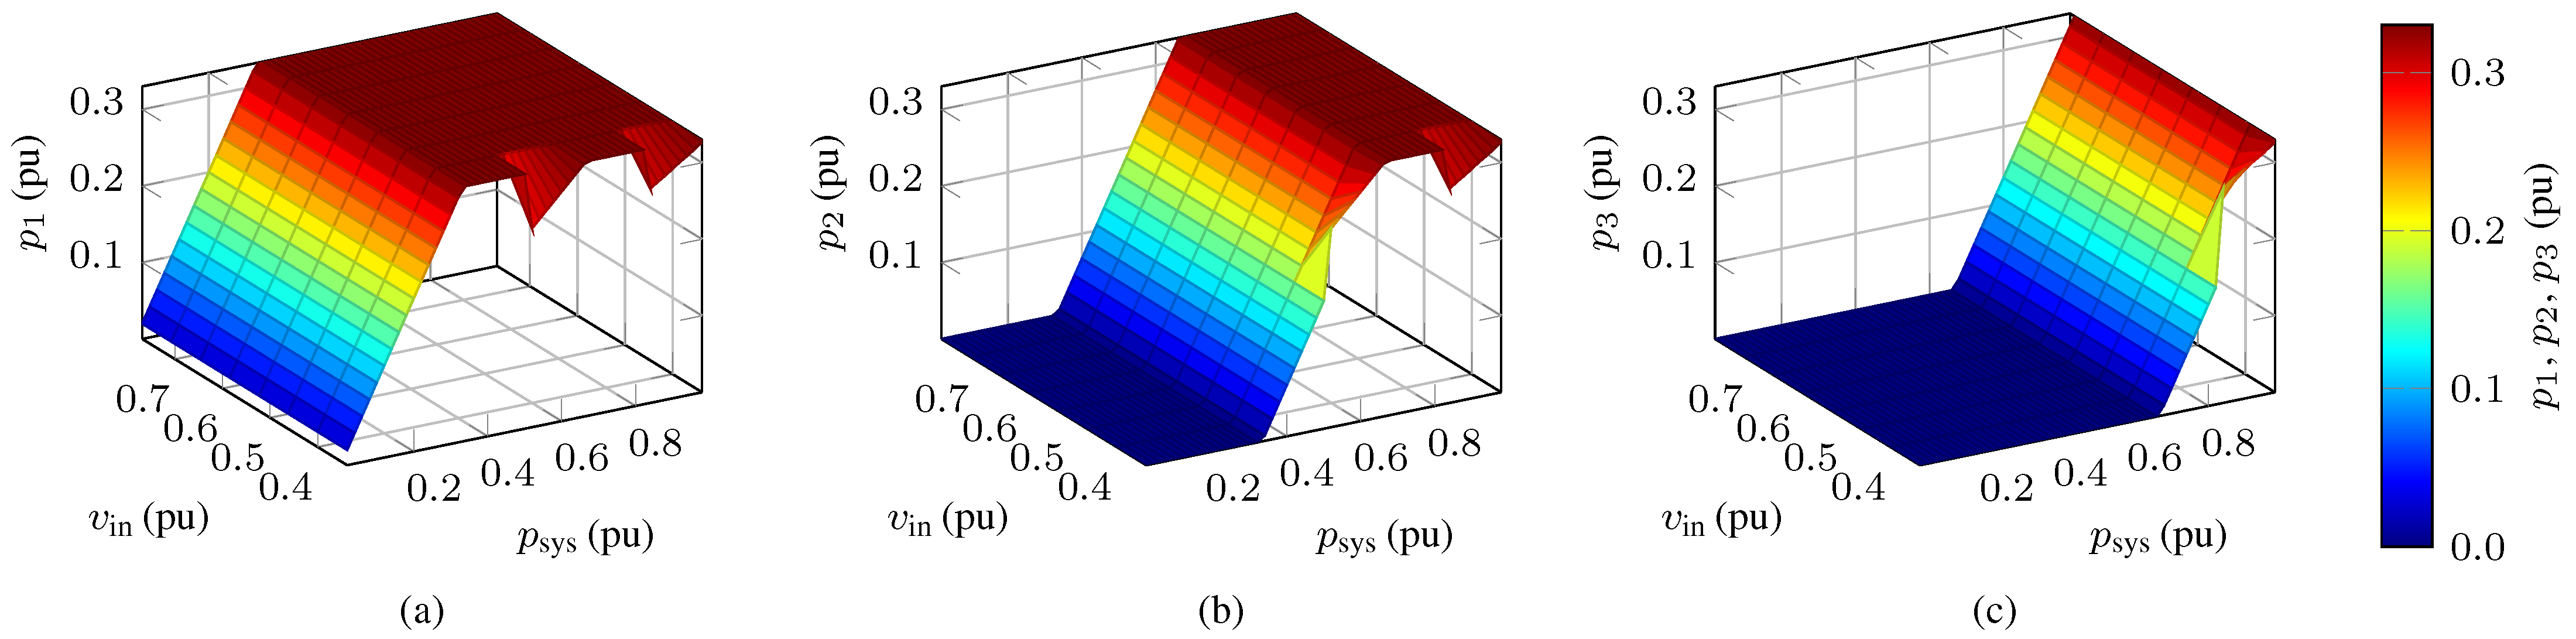
Figure 5 shows the resulting optimized power values that each converter must supply to achieve the optimal system efficiency. For this case study, the most noticeable difference in power distribution is for an input voltage of 110
. For higher voltage levels, the sharing follows a similar profile between adjacent voltage values. It is important to note that the almost intuitive power distribution surfaces are a special feature of the prototype. It has been verified that in several other scenarios, the optimal sharing surfaces are more complex than the ones presented. This feature is most commonly observed when the peak efficiency is at the rated power of the converter.
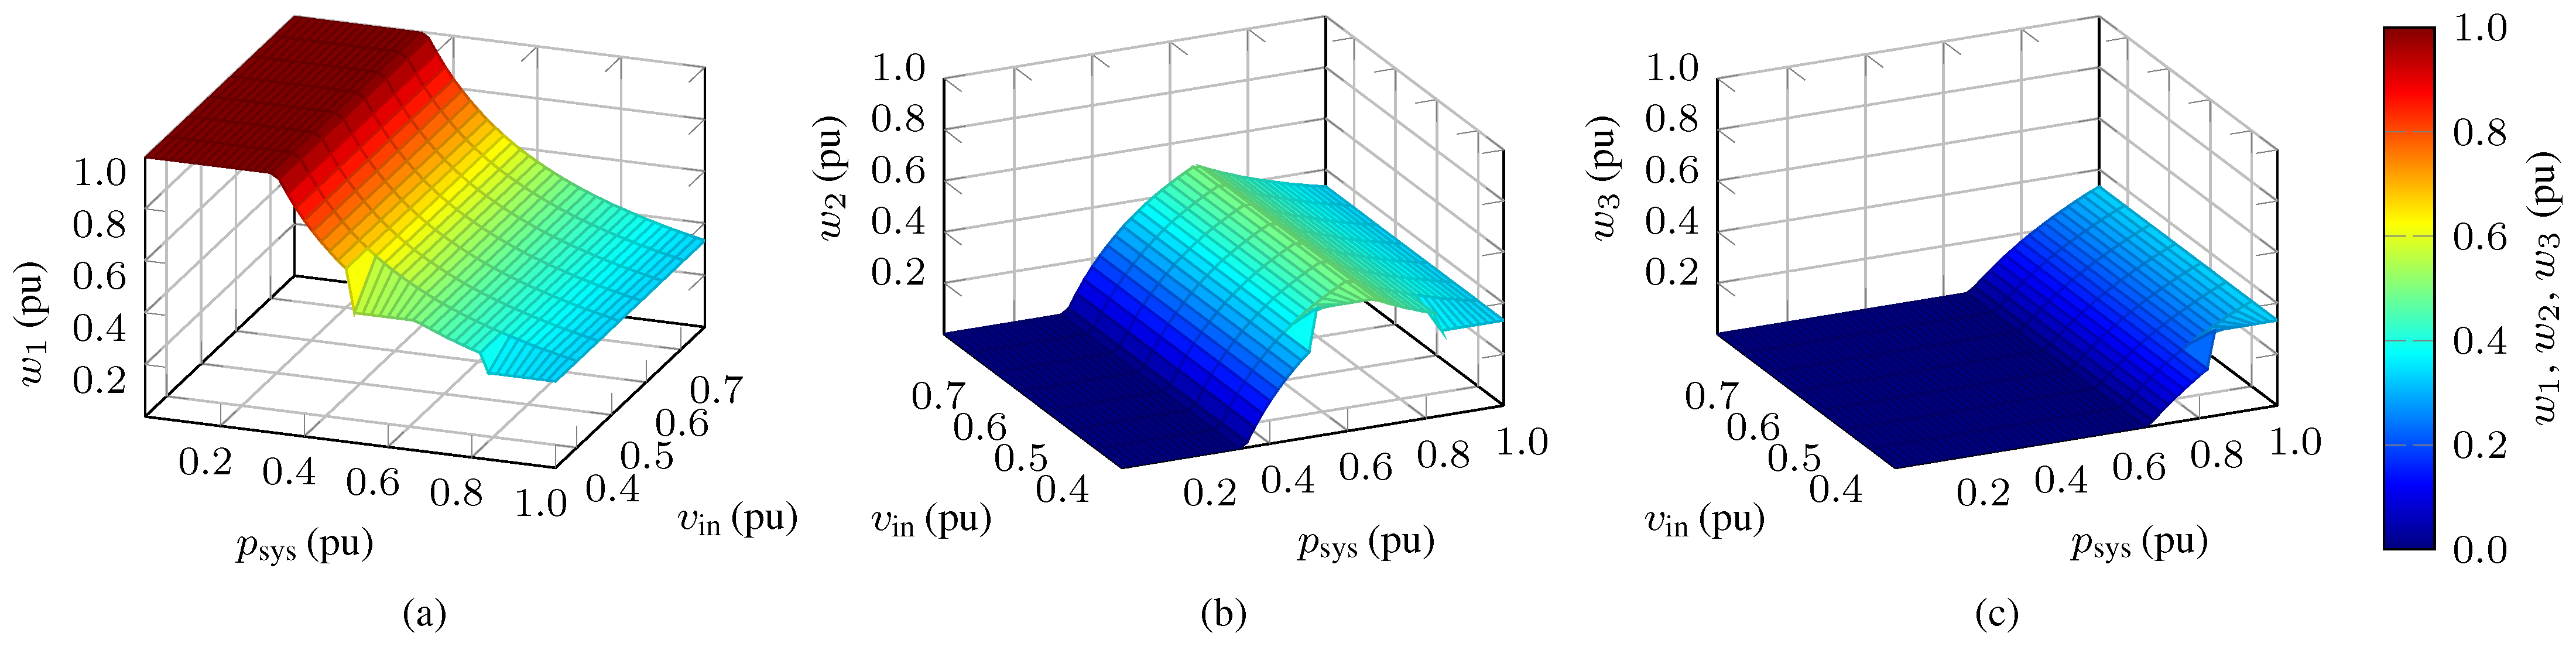
Applying (
12) to convert the optimization results shown in
Figure 5 from the power to weighting values, one obtains the surfaces depicted by
Figure 6. This set of values is stored in the supervisory control subsystem as one LUT for each converter.
The final step in designing the control system is tuning the current and voltage loops. After substituting the parameters from
Table 1 into the transfer function (
15), a current controller for the inner loop can be designed. Discretizing by a ZOH with the sampling frequency matching the switching frequency and considering one sample delay (
) for implementation, one can obtain the PI controller transfer function given by
which provides a bandwidth of 800
and a phase margin of 40°, approximately.
Substituting the parameters from
Table 1 and again discretizing by a ZOH with a sampling frequency matching the switching frequency, the outer PID controller for the DC-bus voltage is designed, and its transfer function is given by
which provides a bandwidth of 18
and a phase margin of approximately 80°.
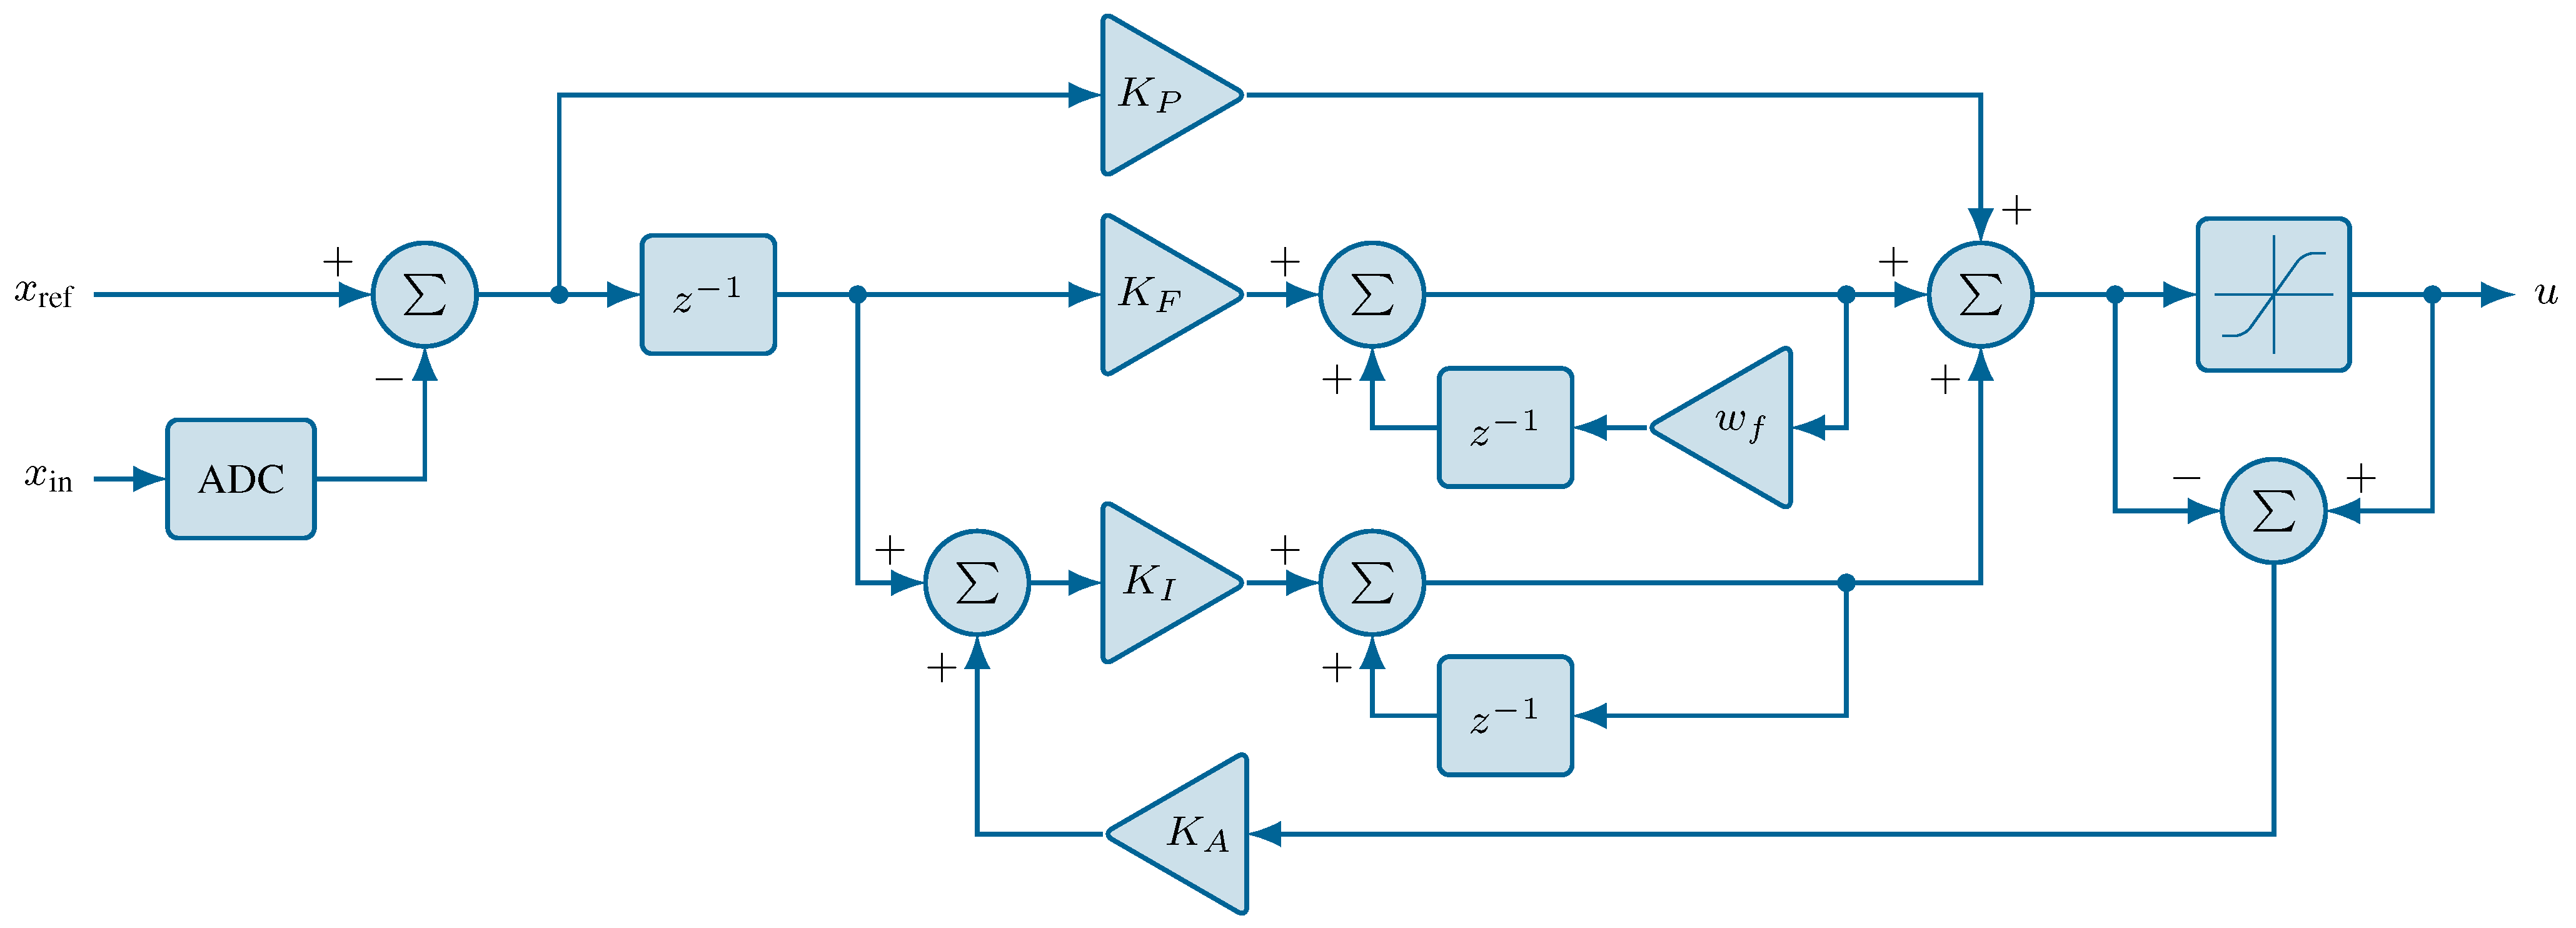
Figure 7 shows the block diagram used to implement each controller. Although not all terms must be used, it realizes a PI+filter action.
is related to the tracking time constant that configures the rate at which the integral term is reset, forming an anti-windup strategy based on back calculation. Here, defining a time constant
, the anti-windup gain can be calculated as
The other parameters of the control system were obtained by applying partial fraction decomposition to the controller transfer function. For the current controller (
23), this procedure results in parameters
,
, and
. Similarly, for the voltage controller, the obtained parameters were
,
,
= 575,643, and
.
5.1. Decision Variables and Bandwidth Considerations
Decision variables play a critical role in supervisory control and overall system performance. Therefore, care should be taken to mitigate undesirable dynamics and noise coupling. In this section, several filtering strategies are investigated, providing insights into the appropriate selection of decision variables and their impact on system performance in terms of bandwidth and filter complexity. This analysis proposes the main guidelines for applying the results of the efficiency optimization methodology. To avoid the cross-influence of the decision variables and investigate the differences between the implementation strategies for , the input voltage was fixed in the experimental setup at 190 (); therefore, so just was used as a decision variable.
In the first analysis, the output current was used as a decision variable, and
. In addition to quickly following variations in the power consumed by the load, this signal provides a wider bandwidth. Therefore, the objective of a low-pass filter is to simply attenuate and decouple noise that can degrade the performance of supervisory control.
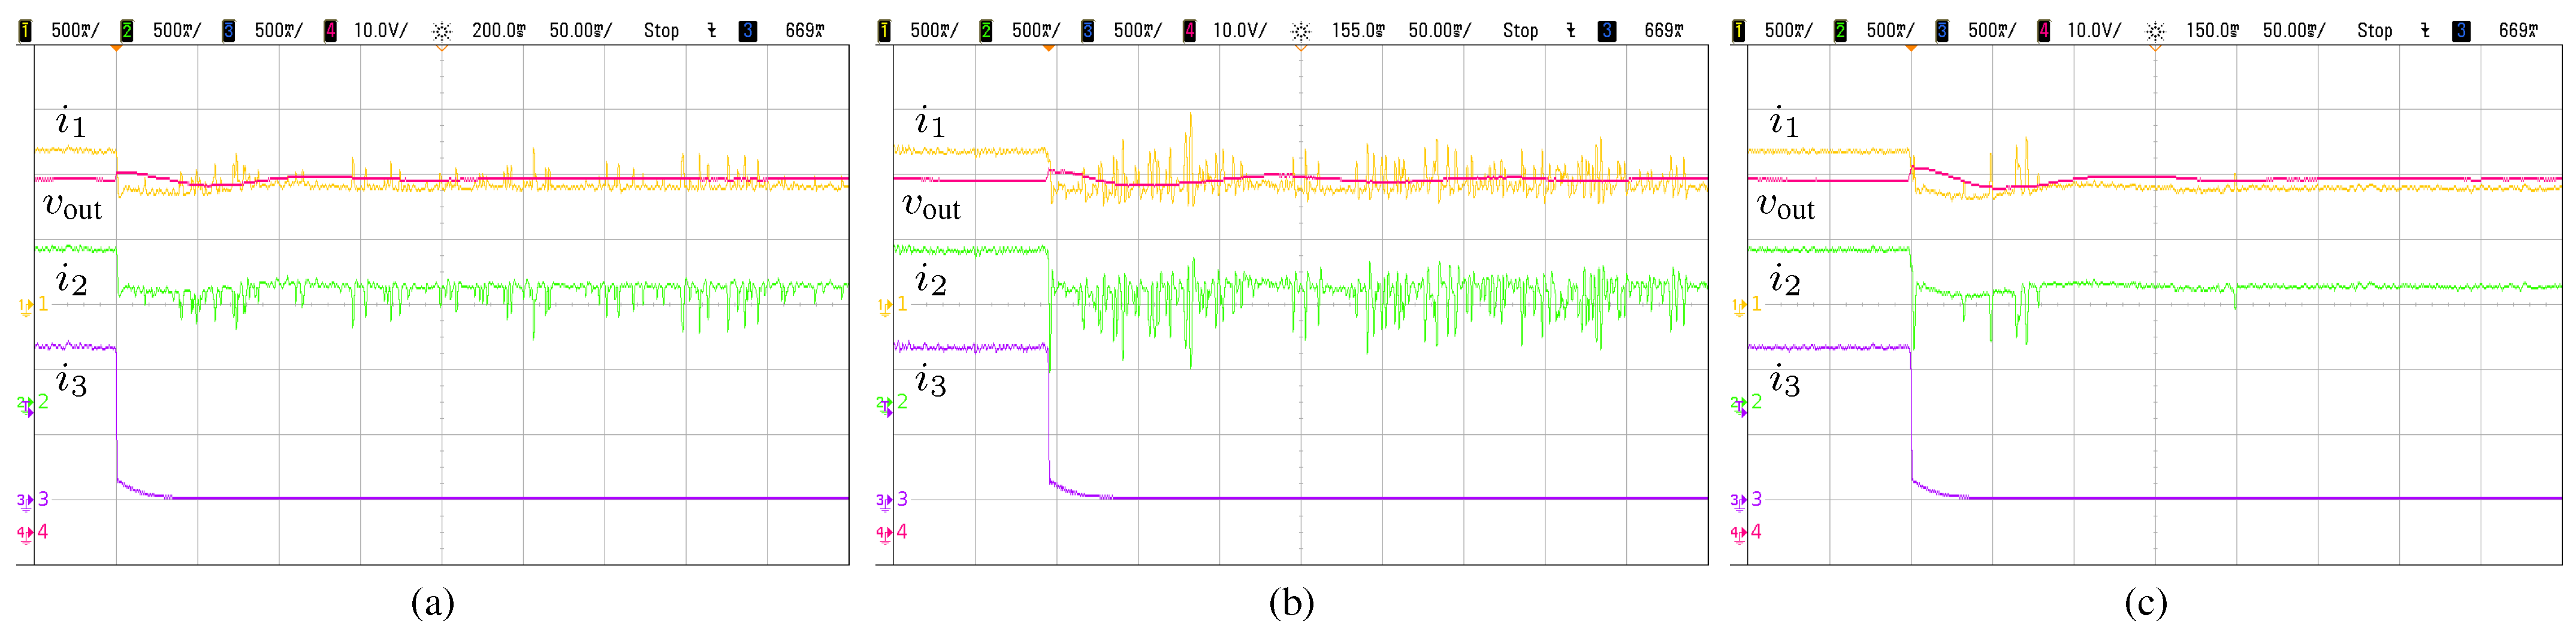
Figure 8 presents the experimental results for three different filtering strategies when the load is switched from 100% to 50% of its rated value. Initially, when the system operates at full power, the three converters deliver their rated power. When the load is reduced to half power, the optimal sharing algorithm establishes that Converter 3 must be turned off, whereas converters 1 and 2 operate at half power.
Starting with a simpler case,
Figure 8a depicts the waveforms for the three input currents and output voltage when using a first-order filter with a cutoff frequency of 500
. The notable noise present on currents
and
was introduced by supervisory control. Instrumentation noise, which might be inherent in the signals, causes the weightings applied by the supervisory control to the reference currents to become noisy. However, this problem can not be solved by using a heavier filter.
Figure 8b presents the results for a sixth-order IIR Butterworth filter with a bandwidth of 1000
. It can be observed that the steady-state performance is severely degraded compared with the previous case. Finally,
Figure 8c shows the results for a third-order IIR Butterworth filter with a bandwidth of 300
. In this case, converter currents have much smoother trajectories while still maintaining a fast decision to shut down Converter 3 and reduce the power of converters 1 and 2 by half.
The results in
Figure 8 show that the system performance is more sensitive to the decision variable bandwidth than to the filter complexity. Larger bandwidths allow coupling of noise to the weighting values provided by the supervisor. In addition to preventing the system from operating at optimal efficiency, it may lead to instability, depending on the magnitude of the noise affecting the decision variable. Among several other tests, it was verified that a second-order Butterworth FIR filter with a bandwidth of 500
is the most effective for the case
.
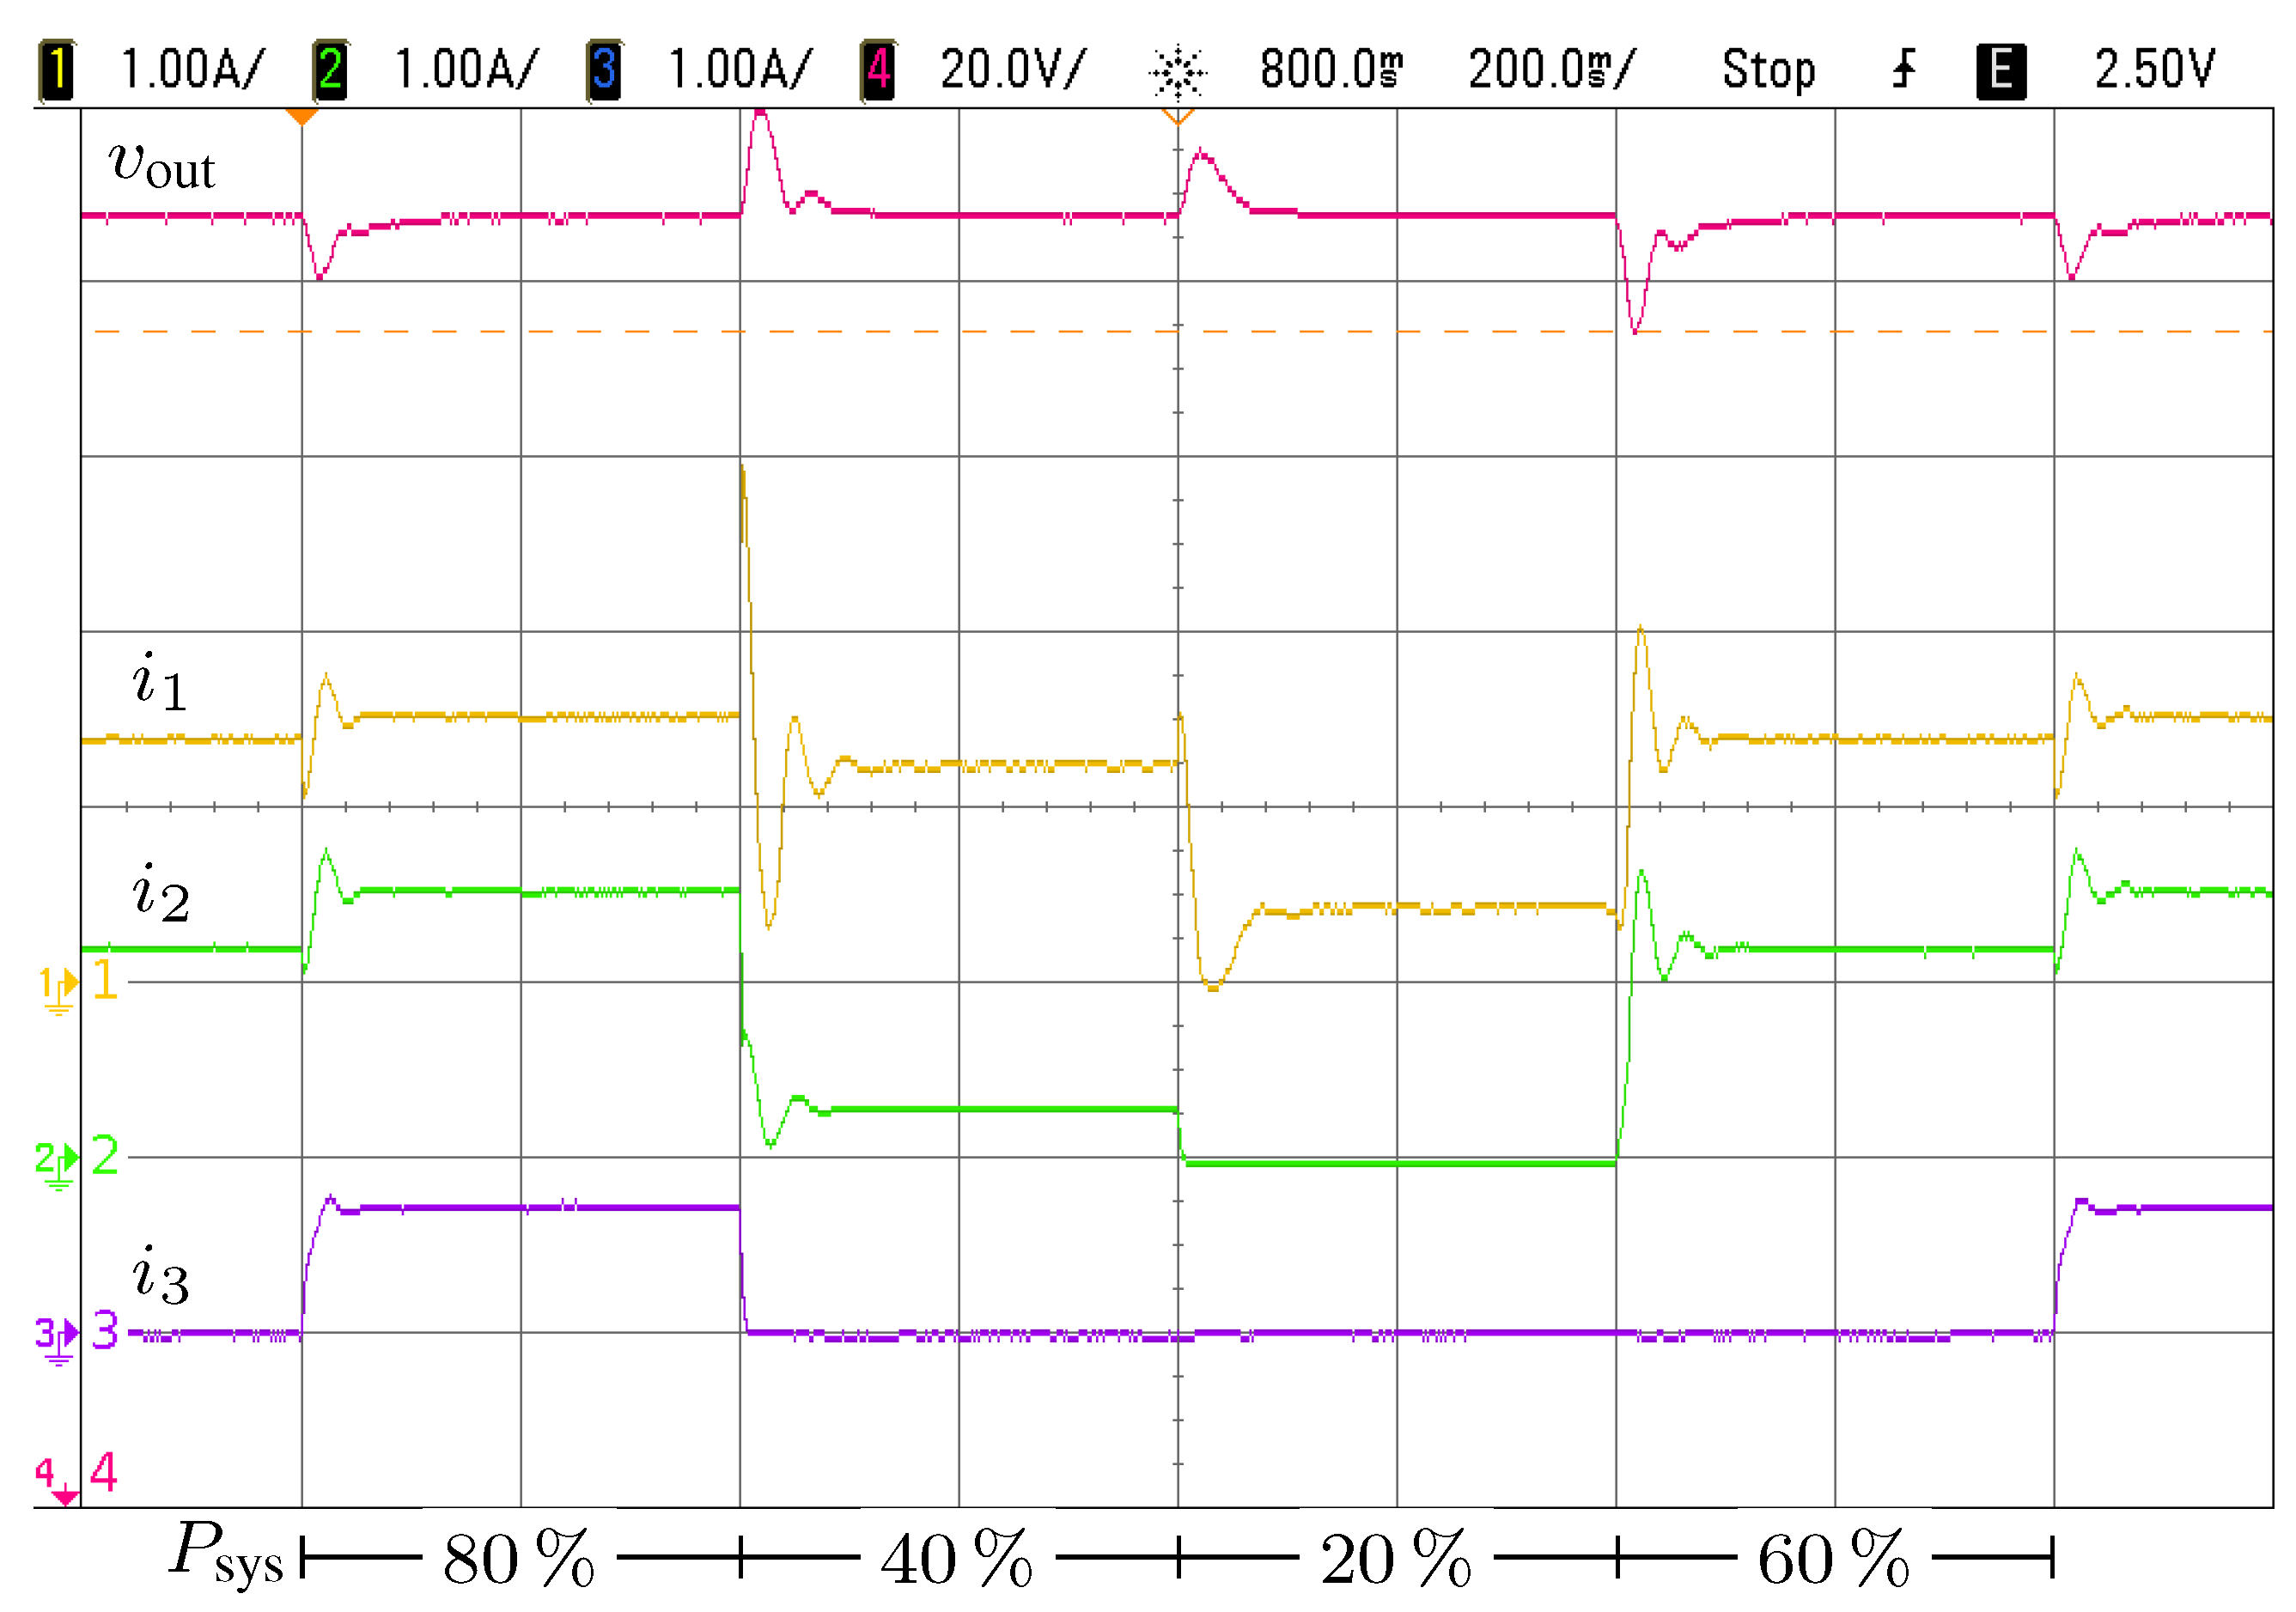
Figure 9 shows the results obtained using this configuration. In this test, different load steps were applied at every 400
following the sequence 80%, 40%, 20%, and 60% of the system’s rated power. The power sharing target to achieve the optimal system efficiency with each of these load values is presented in
Table 4.
Now, considering
, because the input voltage is fixed during this analysis, it has already been demonstrated by (
14) that its dynamics must be significantly reduced so that the supervisory control operates solely based on its steady-state values. In other words, the supervisory controller should not respond to the energy variations required to push the converters toward new equilibrium points. In the case of a boost converter, when the output power increases, the controller momentarily keeps the switch closed for a longer period to allow the inductor current to rise and reach a new steady state level. Furthermore, to achieve a fast dynamic response of the output voltage, the controllers may induce brief overcurrents. If the supervisory control reacts to these events, it may unnecessarily trigger additional converters that should be off, only to complement the current during the transient period.
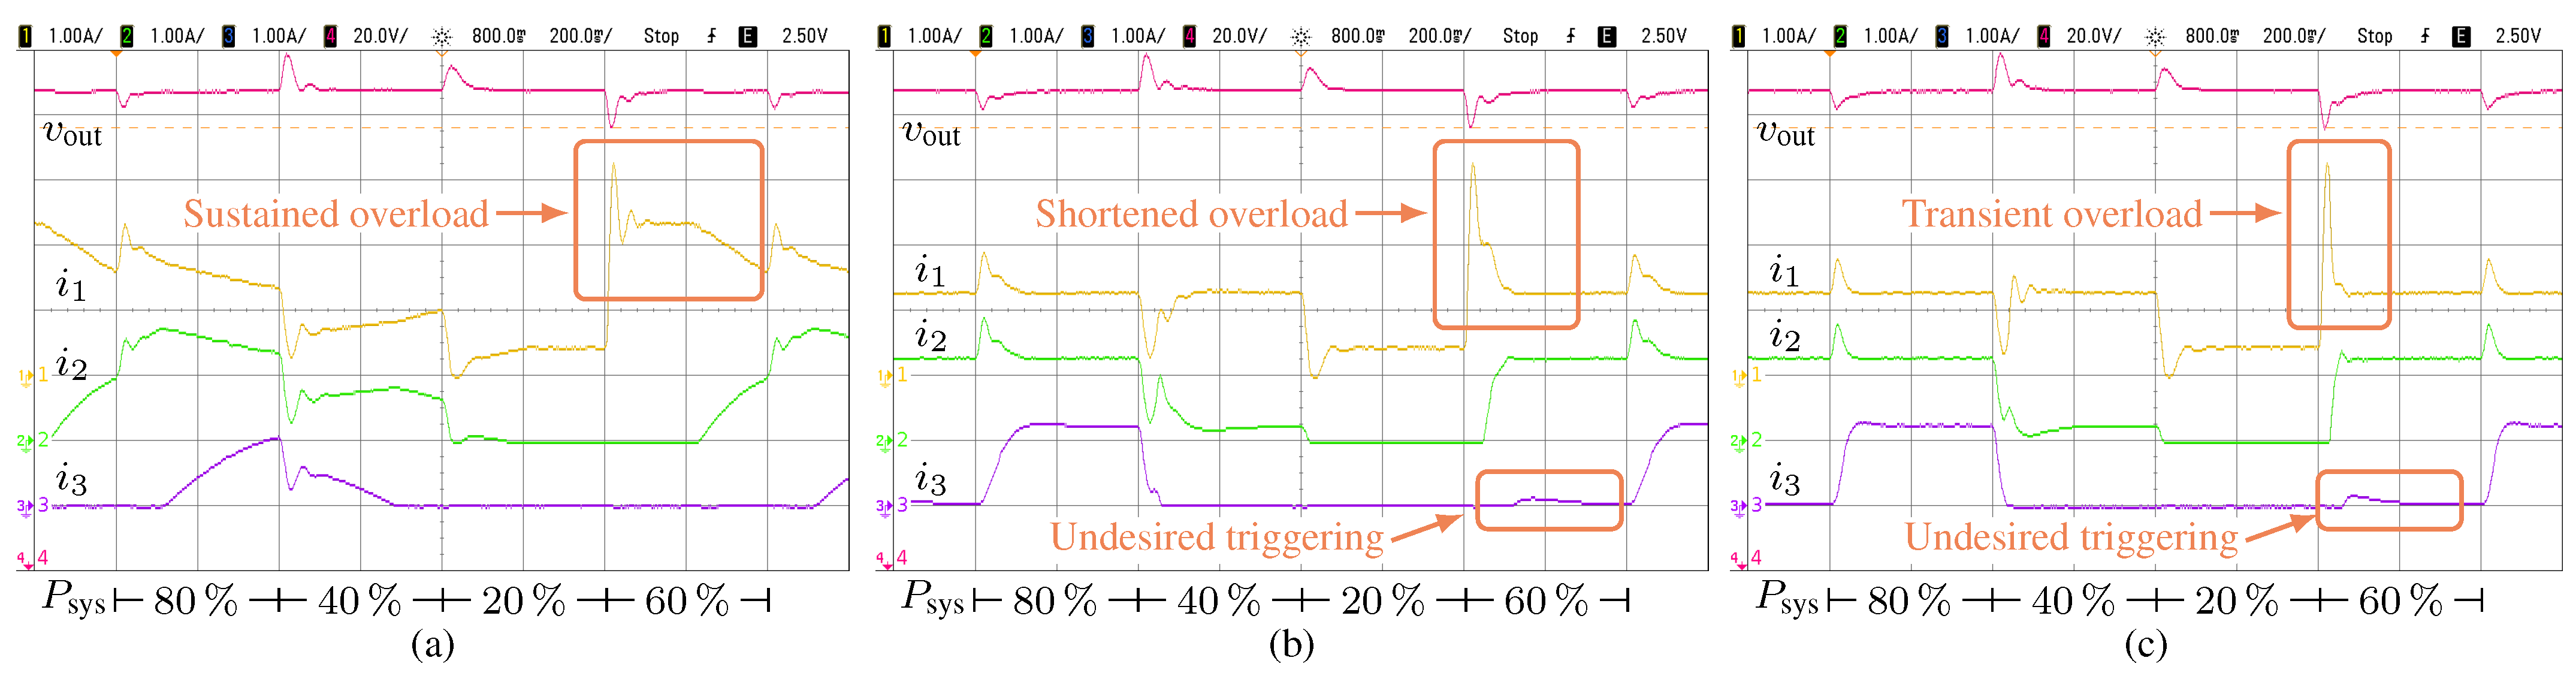
The filter topology of the second-order Butterworth FIR was kept the same for the following tests, allowing a more detailed evaluation of the bandwidth and system performance. The load switching sequence applied in the analysis presented by
Figure 9 is maintained.
Figure 10a depicts the results for a cutoff frequency of 1
, where a slower response in the power redistribution between the converters is observable. During the first load switch, Converter 3 takes a longer time to be turned on, causing Converters 1 and 2 to operate at higher power. When the load is increased to 60%, Converters 2 and 3 are initially off, and Converter 1 is set in an overload condition close to 200% during the first 200
. After this period, Converter 2 is turned on and Converter 3 is kept off as expected according to
Table 4.
Figure 10b presents the results when the filter bandwidth is increased to 5
. Power-sharing is performed with a faster dynamic, and the overload period when the power is increased to 60% is significantly reduced. Nevertheless, Converter 3 is improperly activated to help alleviate the overload. Finally, in an attempt to further improve the transient response for power sharing, the filter bandwidth is increased to 10
. Again, Converter 3 is not only put into operation incorrectly, but the current reference assigned to it is even higher. Although the wider bandwidth of the decision variable offers an improved transient response.
Comparing the results presented thus far, it is clear that the output current as a decision variable provides the best transient response and steady-state performance for the system. However, this option requires an additional sensor that is usually not present in the system. The major concern in this case is the avoidance of instrumentation noise coupling to the supervisory control. However, if the objective is to enable efficiency optimization without penalizing costs, employing the total input current may be the best approach. In this situation, a more thorough analysis of the transient response of the system is required, particularly regarding the potential for overcurrent events while pushing the converters to new operating points.
5.2. Transient Response and Power-Sharing Performance
Three power-sharing strategies are compared in the discussion that follows in terms of their transient response and system efficiency. In addition to the optimal power distribution employing the input power and output current as decision variables, a strategy of equal power sharing among converters is also tested, as it is one of the most employed strategies for parallel converters. Based on the considerations in the previous section, the input power signal was band-limited to 10 , whereas the output current was limited to 500 . Because no fast changes are expected at the input voltage, it is also band limited to 10 . Second-order Butterworth FIR filters were employed for all the supervisory signals.
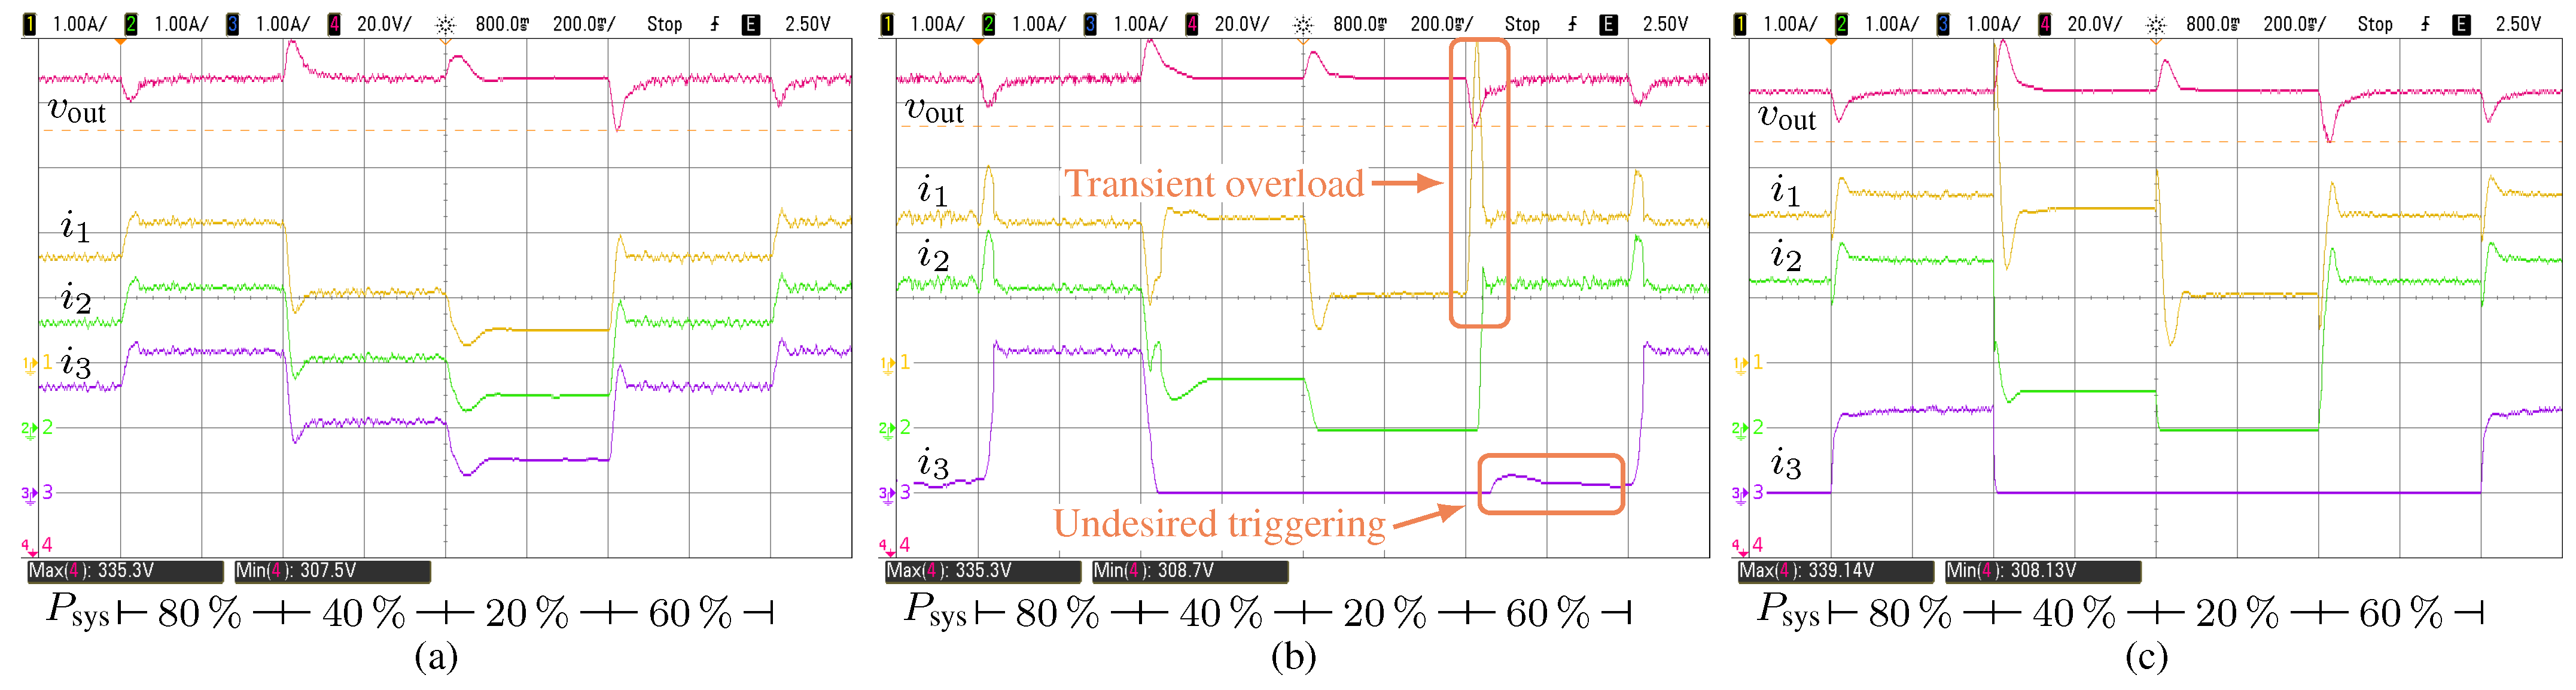
The same load step sequence as in the previous section was applied to analyze the transient behavior of the sharing strategies. However, for the upcoming analysis, the input voltage is varied and used as both a decision variable and input power estimation.
Figure 11 depicts these results for an input voltage of 110
.
Figure 11a presents the results for the equalized power-sharing strategy. The maximum overshoot and undershoot measured for the output voltage in this case were 5.38% and 3.17%, respectively. The waveforms presented in
Figure 11b were obtained by employing the optimized power distribution with the total input power (
) as a decision variable. In these cases, the maximum values for the overshoot and undershoot were 5.01% and 3.17%, respectively. However, a noticeable current overshoot occurred during the fourth transient (when the load increased from 20% to 60%). As mentioned earlier, this is due to the energy variations required by the system to reach a higher power operating point. An improved dynamic response is observed in
Figure 11c when the output current (
) is used as a decision variable. This is achieved thanks to the direct output power relationship and the wider bandwidth of the decision variable. The maximum overshoot and undershoot of the output voltage are 5.2% and 4.33%, respectively. This approach provides the best results with neither overcurrents nor erroneous power redistributions.
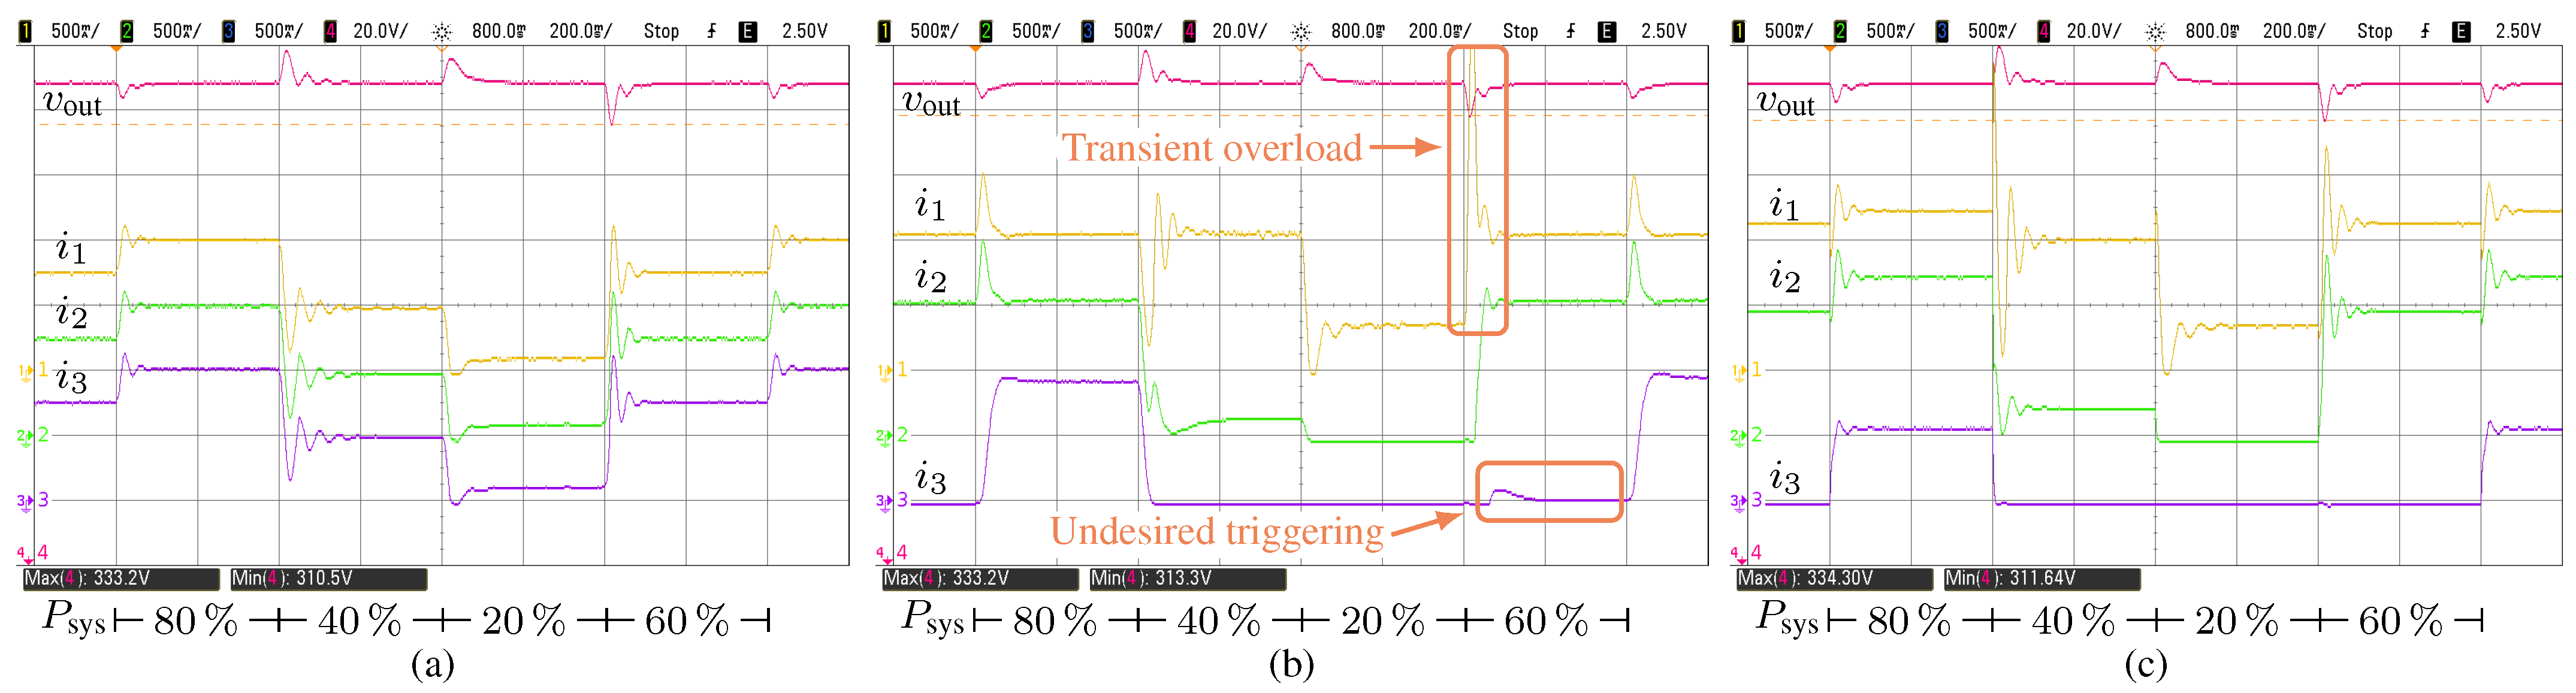
The experimental results for load variations with an input voltage of 230
are depicted in
Figure 12. The dynamic behavior when the power processed by each converter is the same is shown in
Figure 12a. The maximum overshoot and undershoot values observed for the output voltage were 4.43% and 2.52%, respectively. For the optimized power sharing, with the input power as a decision variable (
), these extremes were 3.6% and 2.52%, respectively. A similar response to was observed at 110
when the load is increased from 20% to 60%. Again, a high-current overshoot for converter 1 and a brief period with converter 3 turned on were verified. Finally,
Figure 12c presents the results for optimized sharing with the output current as a decision variable (
). Maximum overshoot and undershoot within the five transients are 4.12% and 2.86%, respectively. Again, the best transient results are obtained with this strategy. Although the transient results are presented for the extremes of the voltage range, the system was also tested with an input voltage of 150
and 190
. The performance is similar to what is presented in
Figure 11 and
Figure 12.
To conclude the analysis,
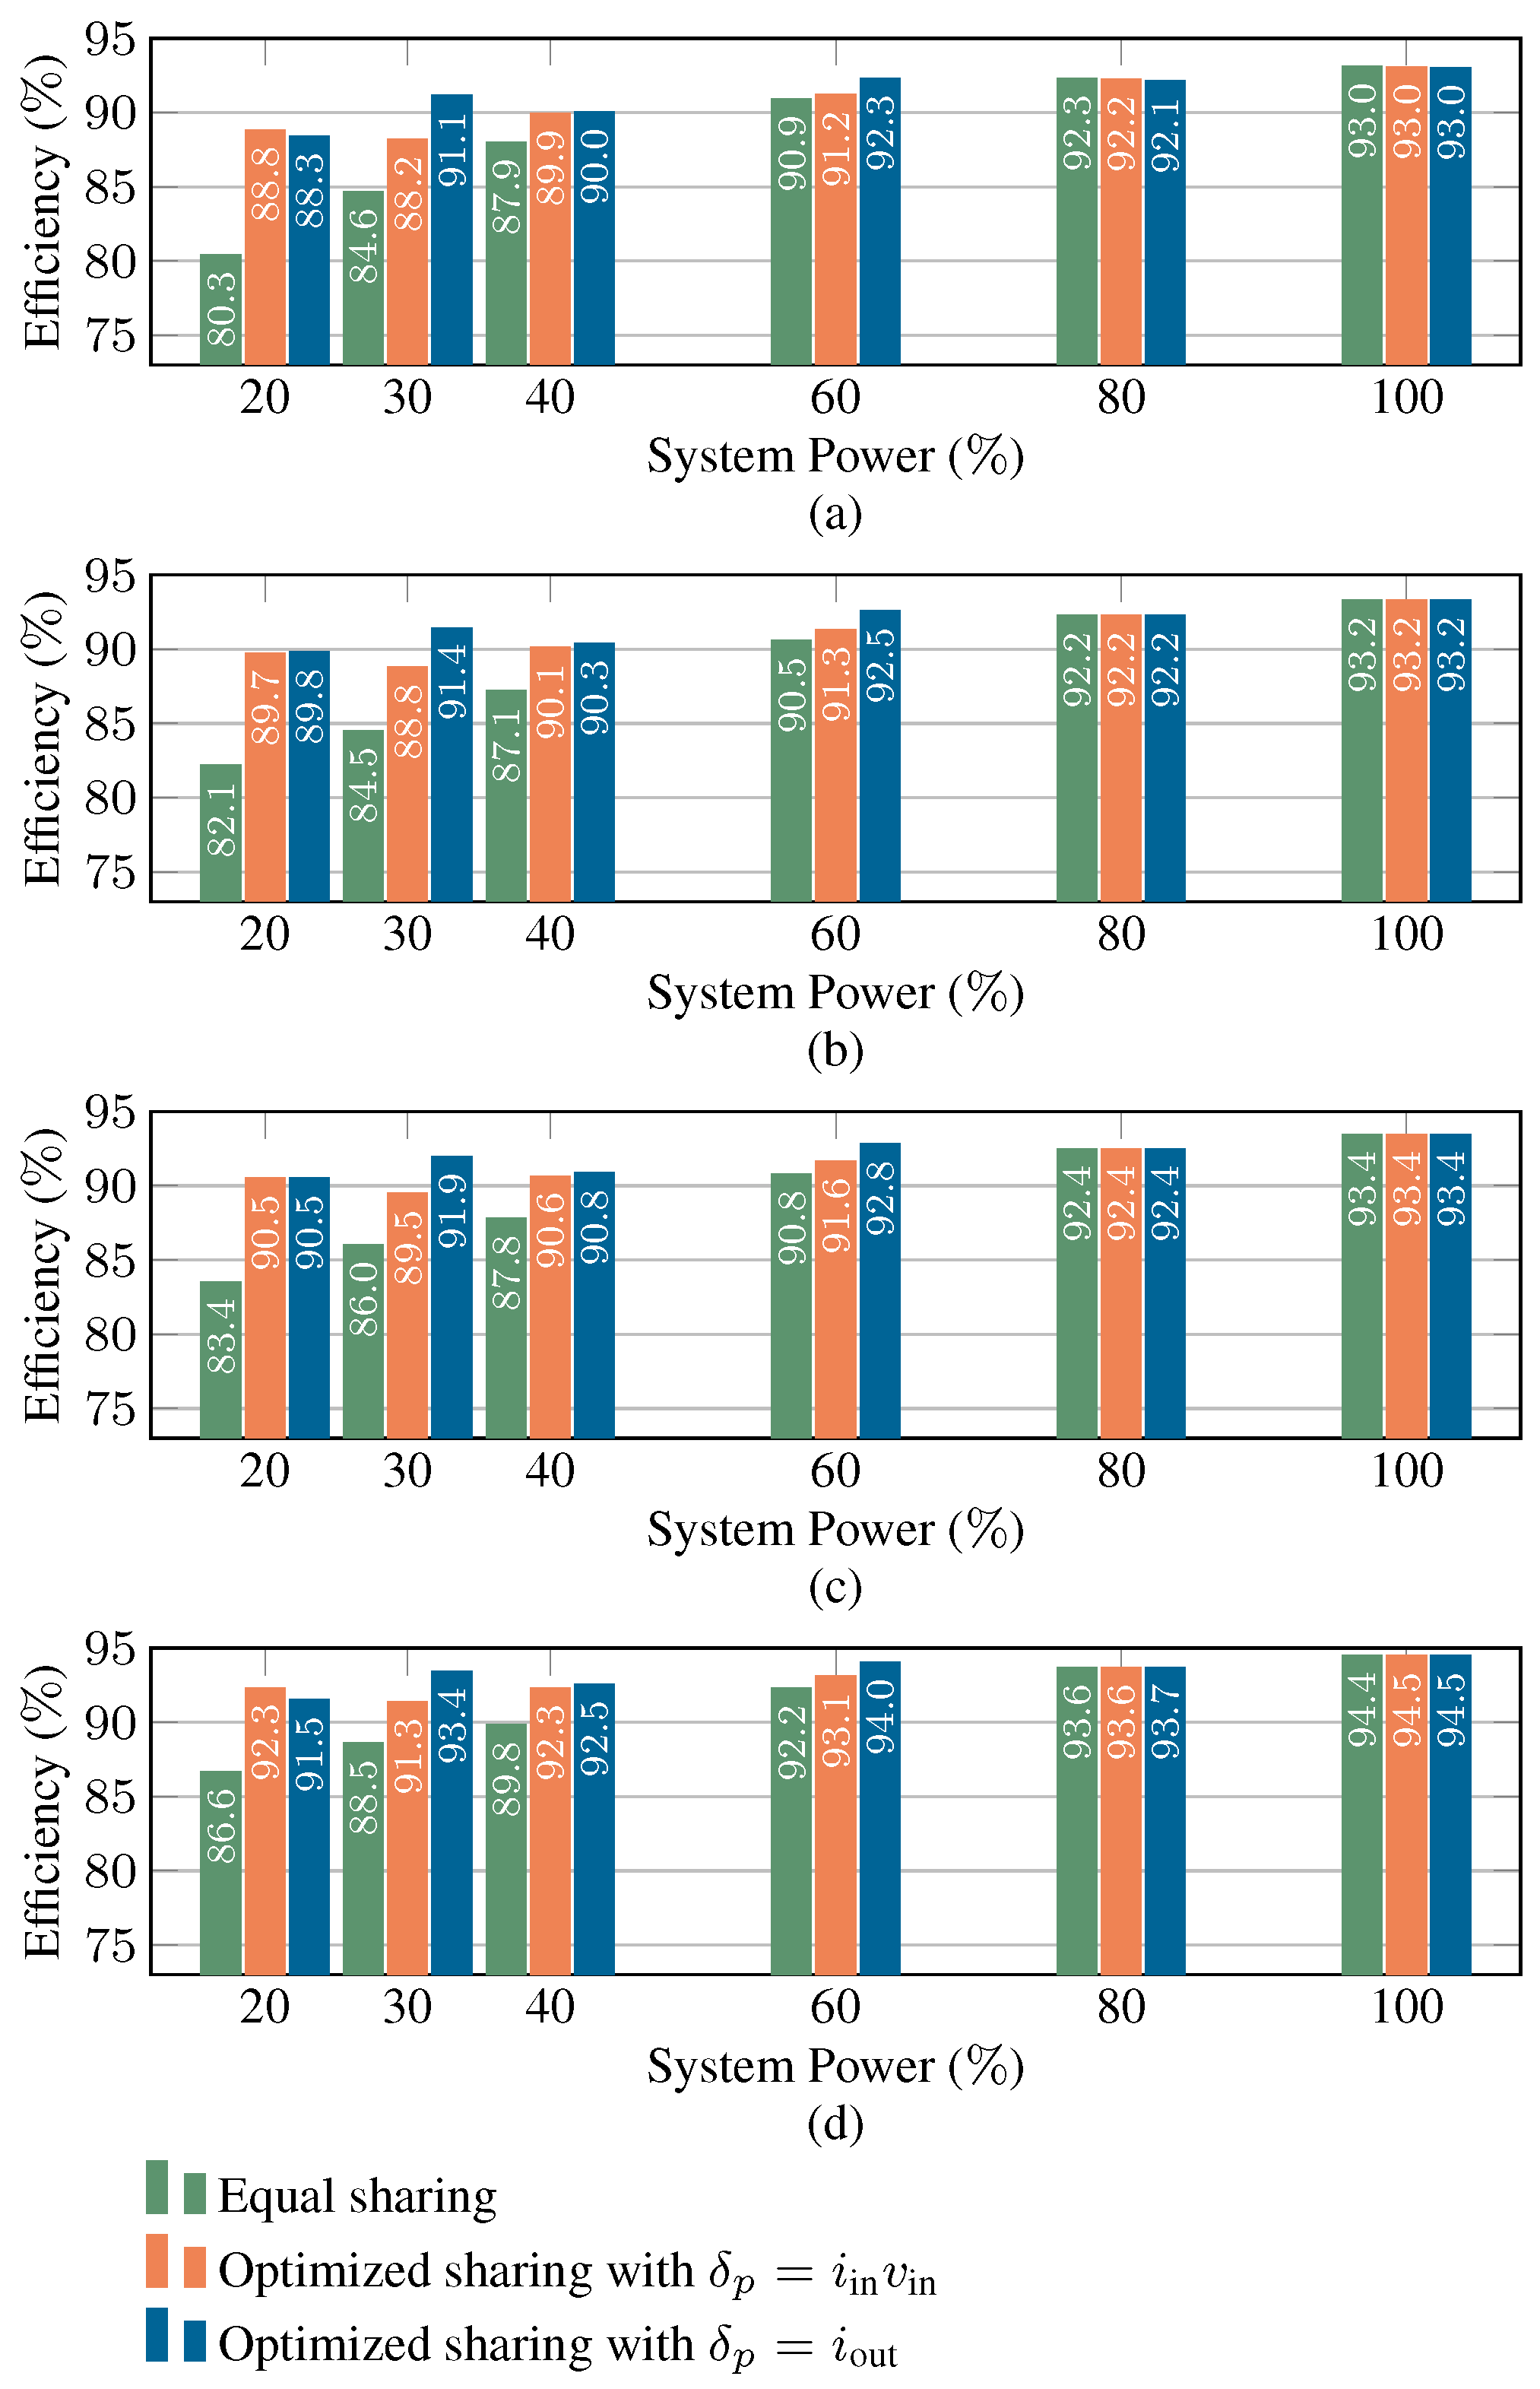
Figure 13 presents a comparison of the system efficiency when operating in steady state, considering variations in the input voltage and processed power. A significant improvement was achieved with the proposed power-sharing optimization strategy, with an increment of up to 8.5% when operating with 20% of its rated power and the lowest input voltage. It is worth noticing that this maximum efficiency improvement occurs at the lowest power range of the mission profile. In this condition, equalized sharing forces all converters to operate at very low efficiency points, whereas the proposed strategy reallocates the power to fewer modules operating closer to their efficiency peaks. A comparison between the proposed strategy and other methods is presented in
Table 5. The efficiency improvement values in the table are provided by each paper and are compared with the equalized power-sharing approach.
A broader statistical evaluation of the efficiency improvement across the full operating range has been conducted based on the experimental results provided in
Figure 13. The average efficiency gain considering all operating points, with respect to equalized power sharing, was 2.3% for the strategy using input power as a decision variable and 2.9% when using output current in addition to input voltage. The average efficiency gain was also evaluated for each system power level, considering all input voltage conditions. The results are presented in
Table 6. As can be observed, the highest average efficiency gains occur at light load conditions. As the system power increases, more converters become active, and the optimal solution tends to converge to equalized power sharing.
5.3. System Expansion and Computational Complexity
The inclusion of the efficiency optimization strategy does not introduce significant complexity to the real-time implementation. All optimization stages are executed offline, and the real-time controller relies solely on the resulting LUTs. Furthermore, depending on the decision variables selected for the supervisory control, it is possible to implement the optimization scheme without any impact on the hardware.
Table 7 summarizes the differences between the control requirements for the conventional three-phase interleaved boost converter and the proposed strategy. The computational overhead of the proposed strategy was evaluated by counting the elementary floating-point operations (FLOPs) required per control cycle. As summarized in
Table 8, the conventional interleaved control requires 4 PID controllers (one for voltage regulation and three for current loops). The proposed strategy adds three 2D Look-Up Table (LUT) queries with bilinear interpolation. Although the total number of operations increases from 104 to 197, this remains well within the capabilities of modern microcontrollers. For instance, in a 200
processor with a dedicated Floating-Point Unit (FPU), the entire proposed algorithm is estimated to execute in less than 2
, which is negligible compared to typical PWM periods (20–100
).
In the case of system expansion with a larger number of converters, only minor modifications are required to apply the proposed strategy. In the optimization stage, it is sufficient to perform the efficiency surface fitting for the additional converters and provide the corresponding parameters. Since this step is performed offline, increasing the number of converters does not significantly affect the real-time processing requirements. In the proposed implementation, the resulting solution is stored using independent LUTs for each converter, indexed by the system operating conditions (input voltage and load power). Therefore, the size of each LUT remains unchanged, and the total memory requirement increases linearly with the number of converters. From the perspective of real-time computational cost, adding another converter to the system corresponds only to adding another individual current controller and one additional power-sharing LUT. If a properly designed LUT is used, its computational effort is significantly reduced.
Although the proposed strategy relies on an offline optimization procedure followed by LUT implementation, its performance remains robust under moderate parametric variations. In practical scenarios, factors such as component tolerances, aging, and temperature effects may introduce deviations in the efficiency surface. However, due to the smooth nature of the optimization problem, these variations tend to result only in minor shifts of the optimal operating point, without compromising the overall effectiveness of the method. As a result, the proposed approach still provides performance improvements compared to conventional equalized power sharing. For applications requiring higher adaptability, the method can be extended to include periodic updates of the LUT based on measured or estimated operating conditions, without requiring real-time optimization.
Regarding the practical implementation in multi-converter systems, it is worth noting that for systems with identical converters, the optimization problem exhibits symmetry in its solution hyperplane. This characteristic allows for a rotation of the power-sharing assignments among the modules without affecting the global efficiency. Such flexibility can be strategically used for thermal balancing by periodically rotating the converter roles over long time intervals, although the specific implementation of thermal management is beyond the scope of this work.
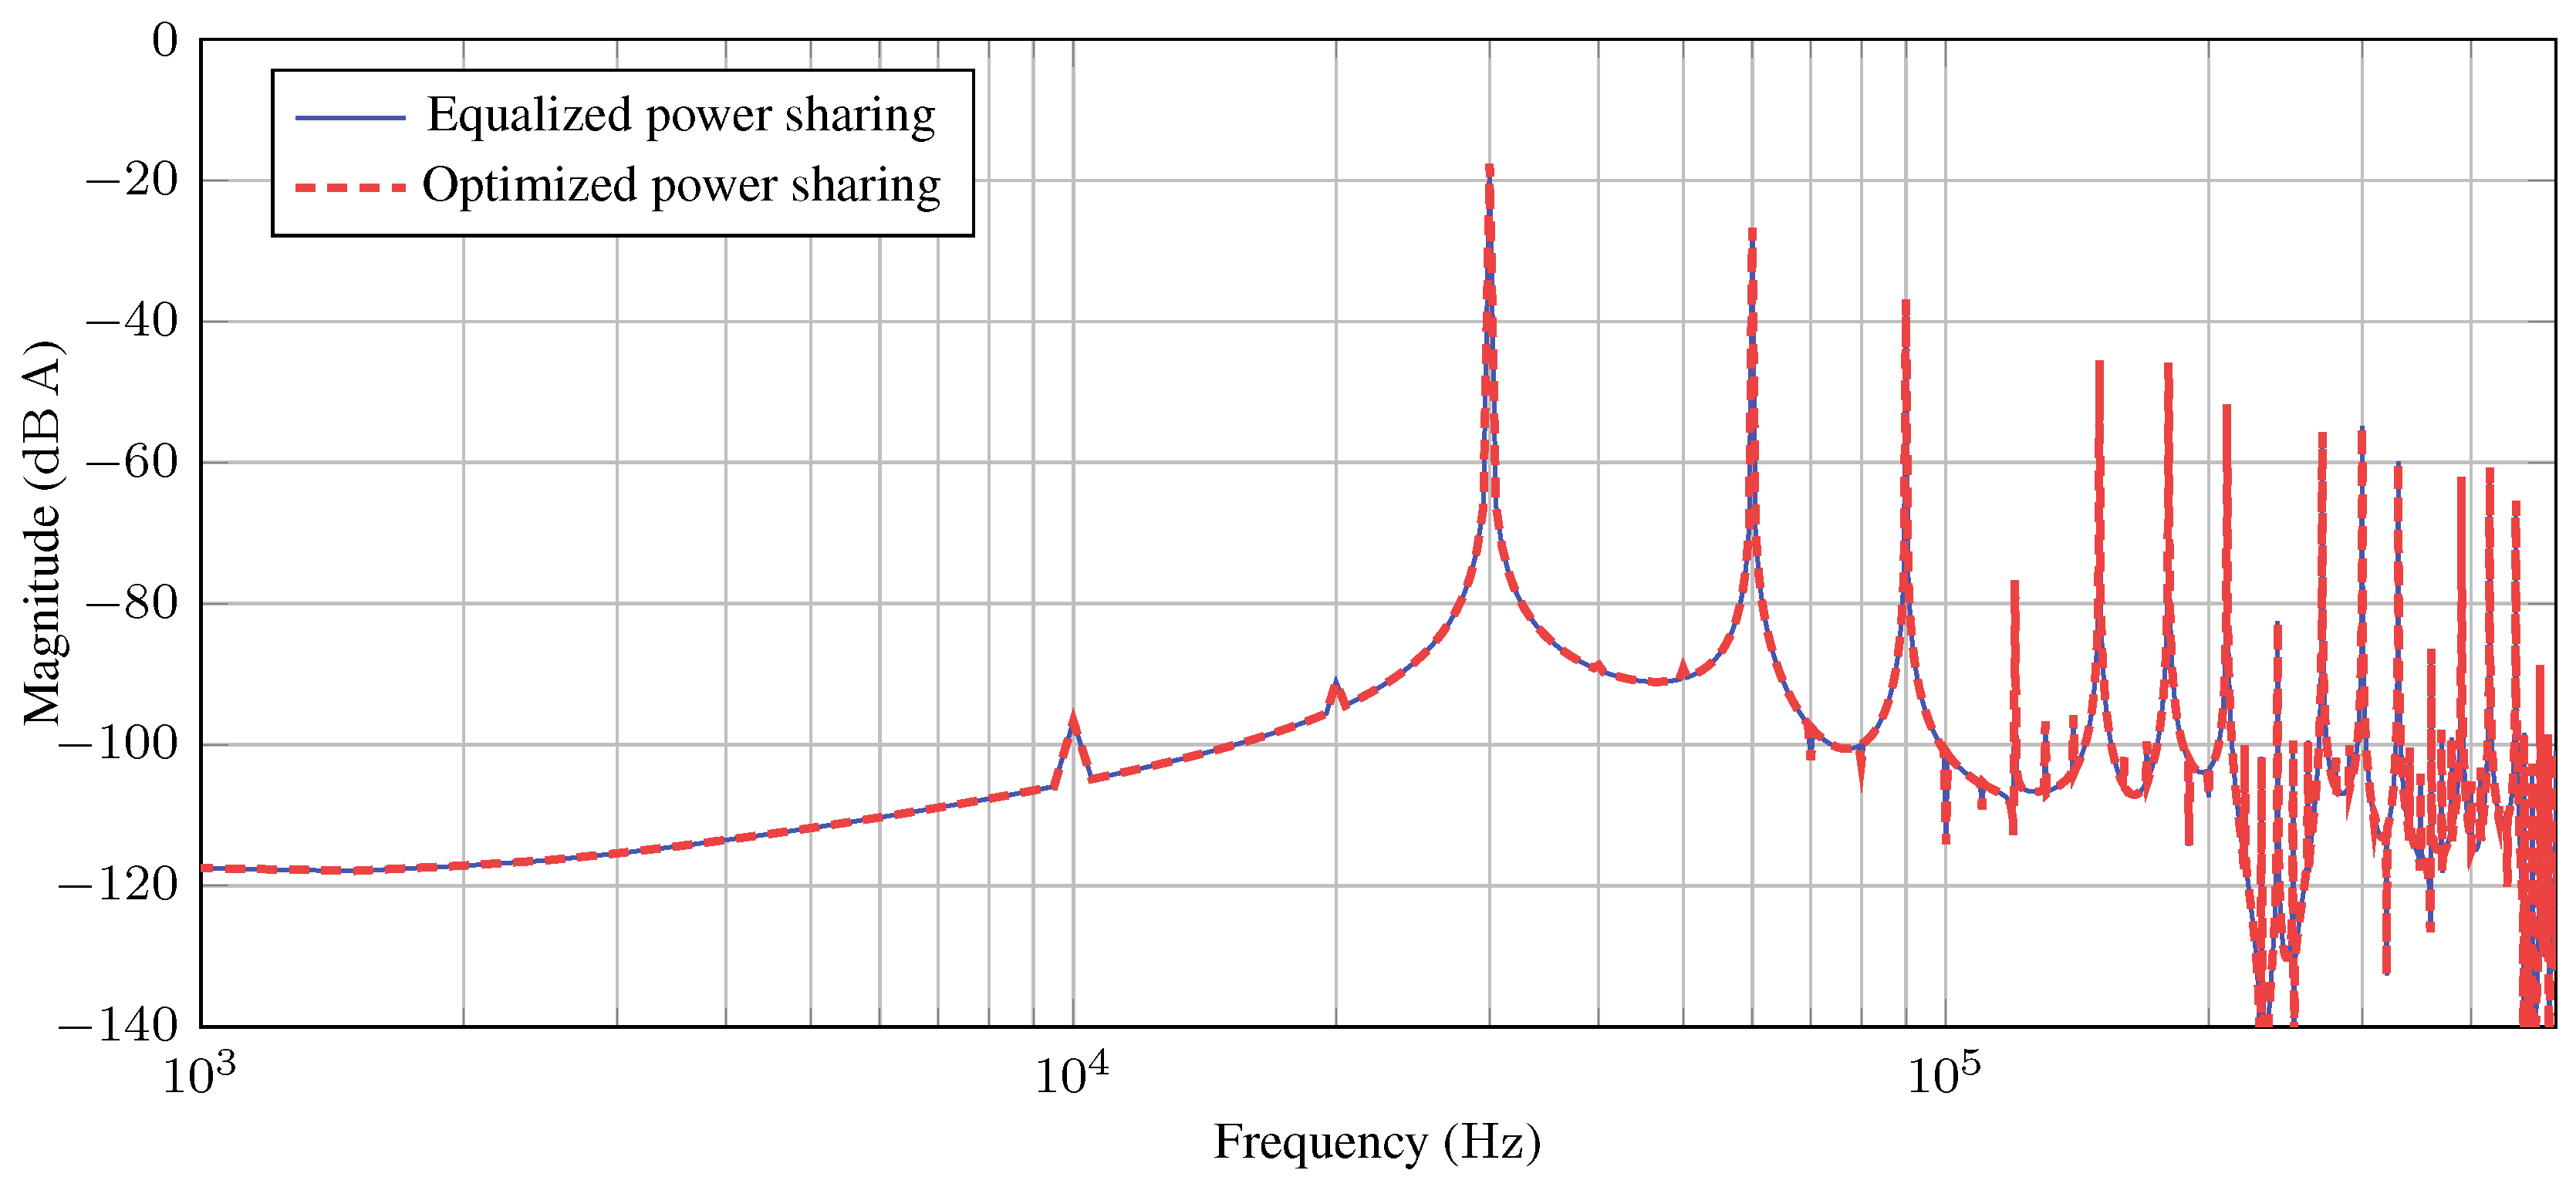
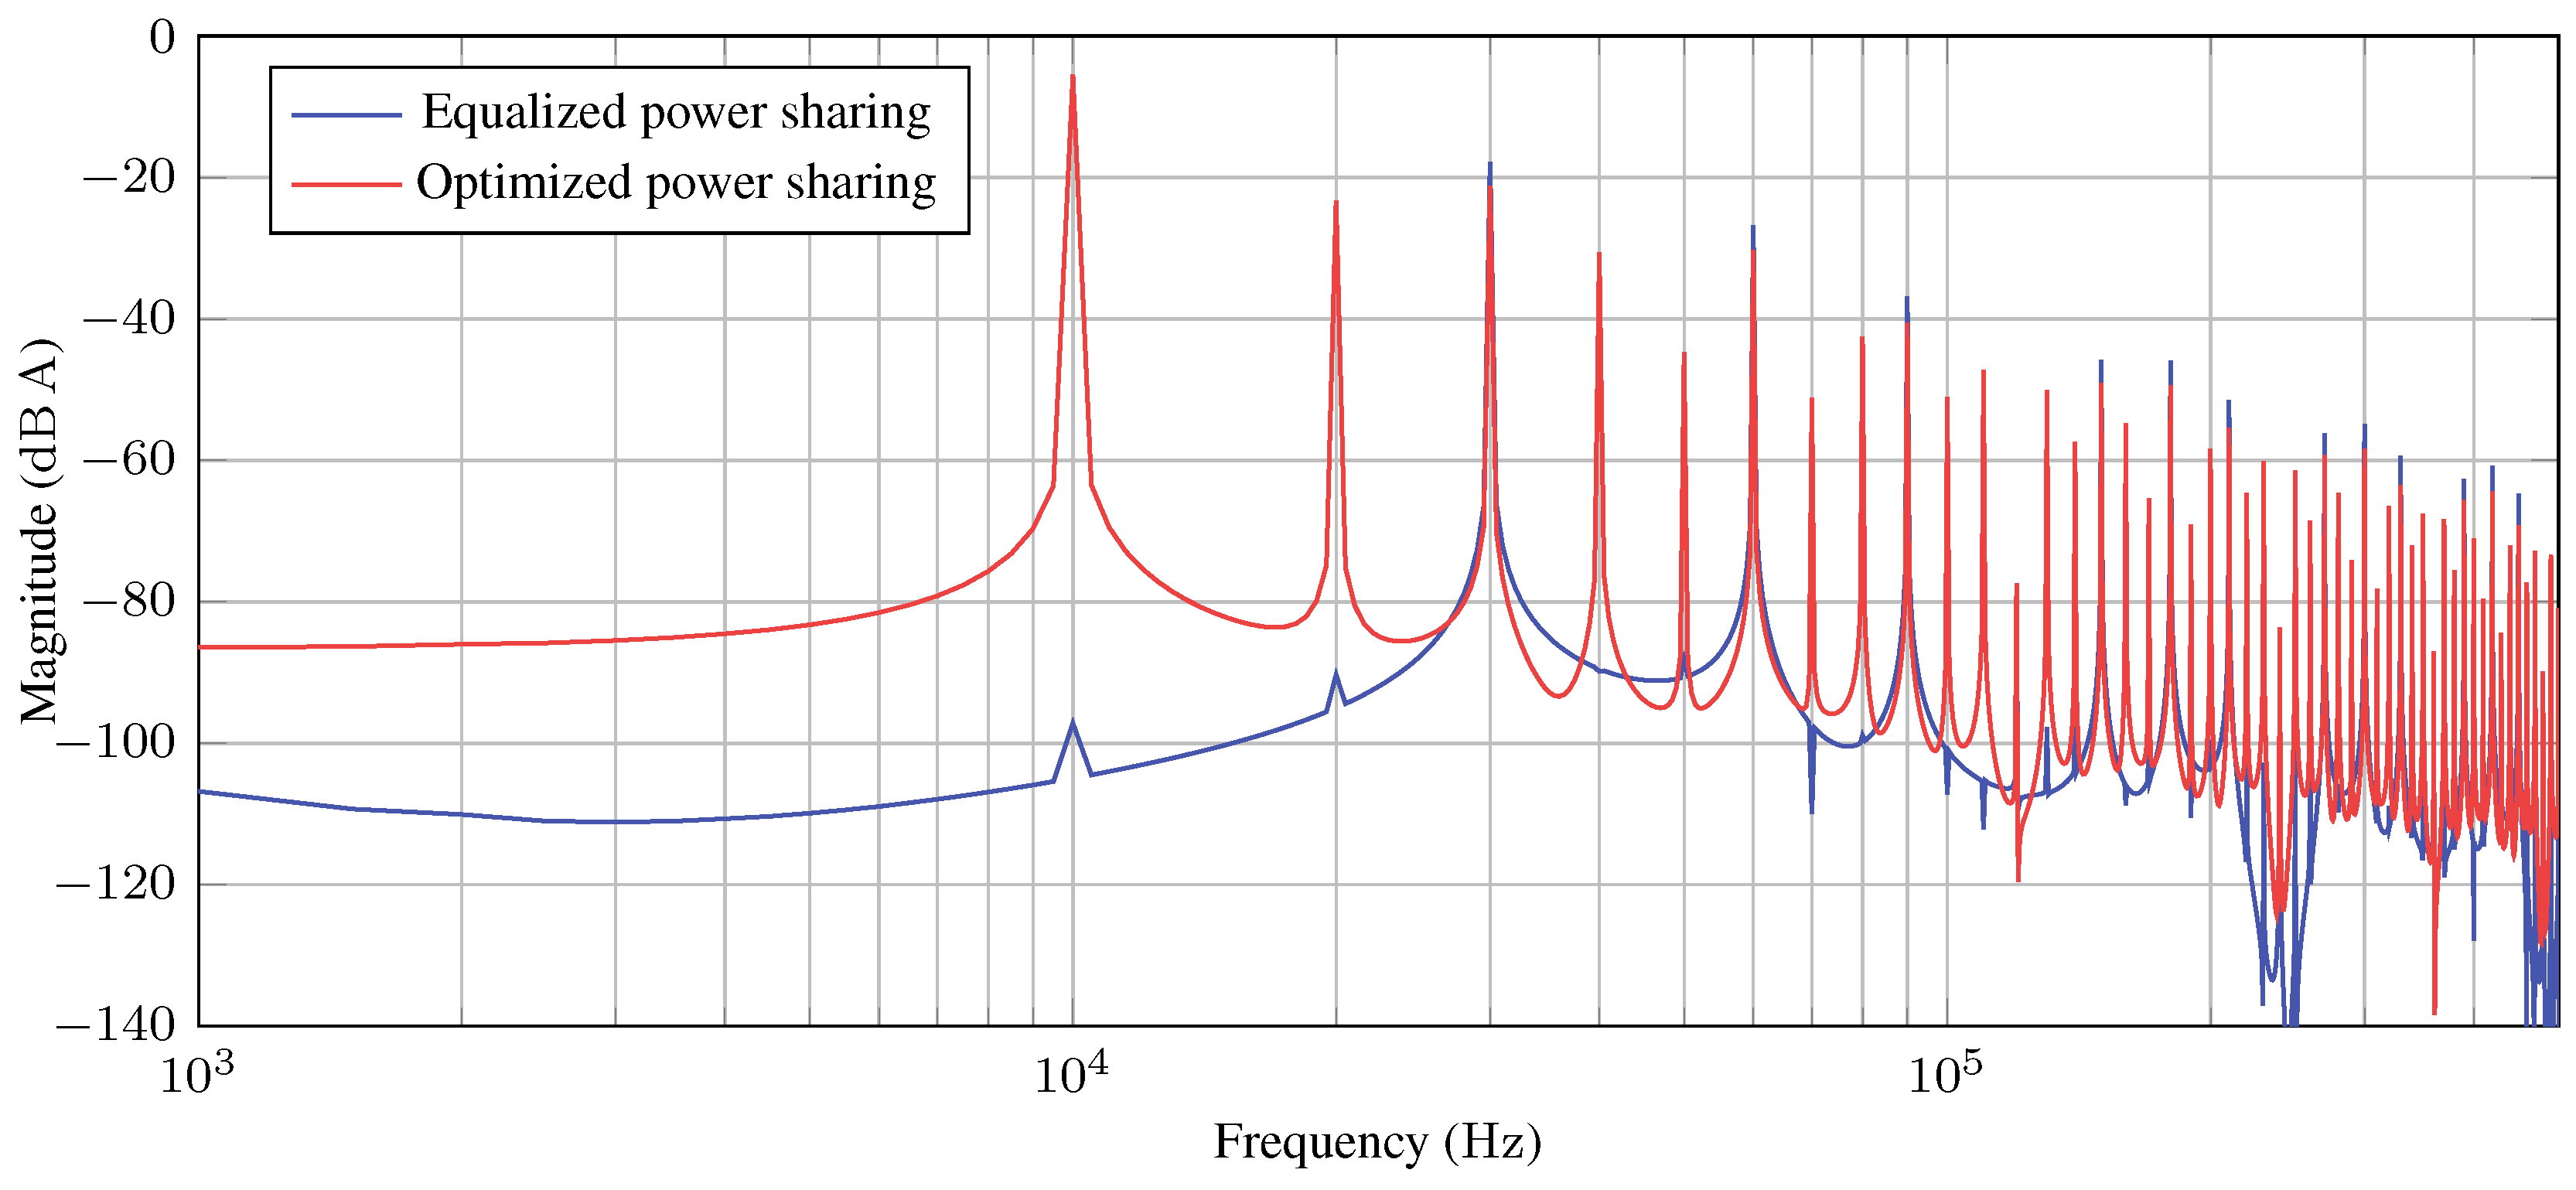
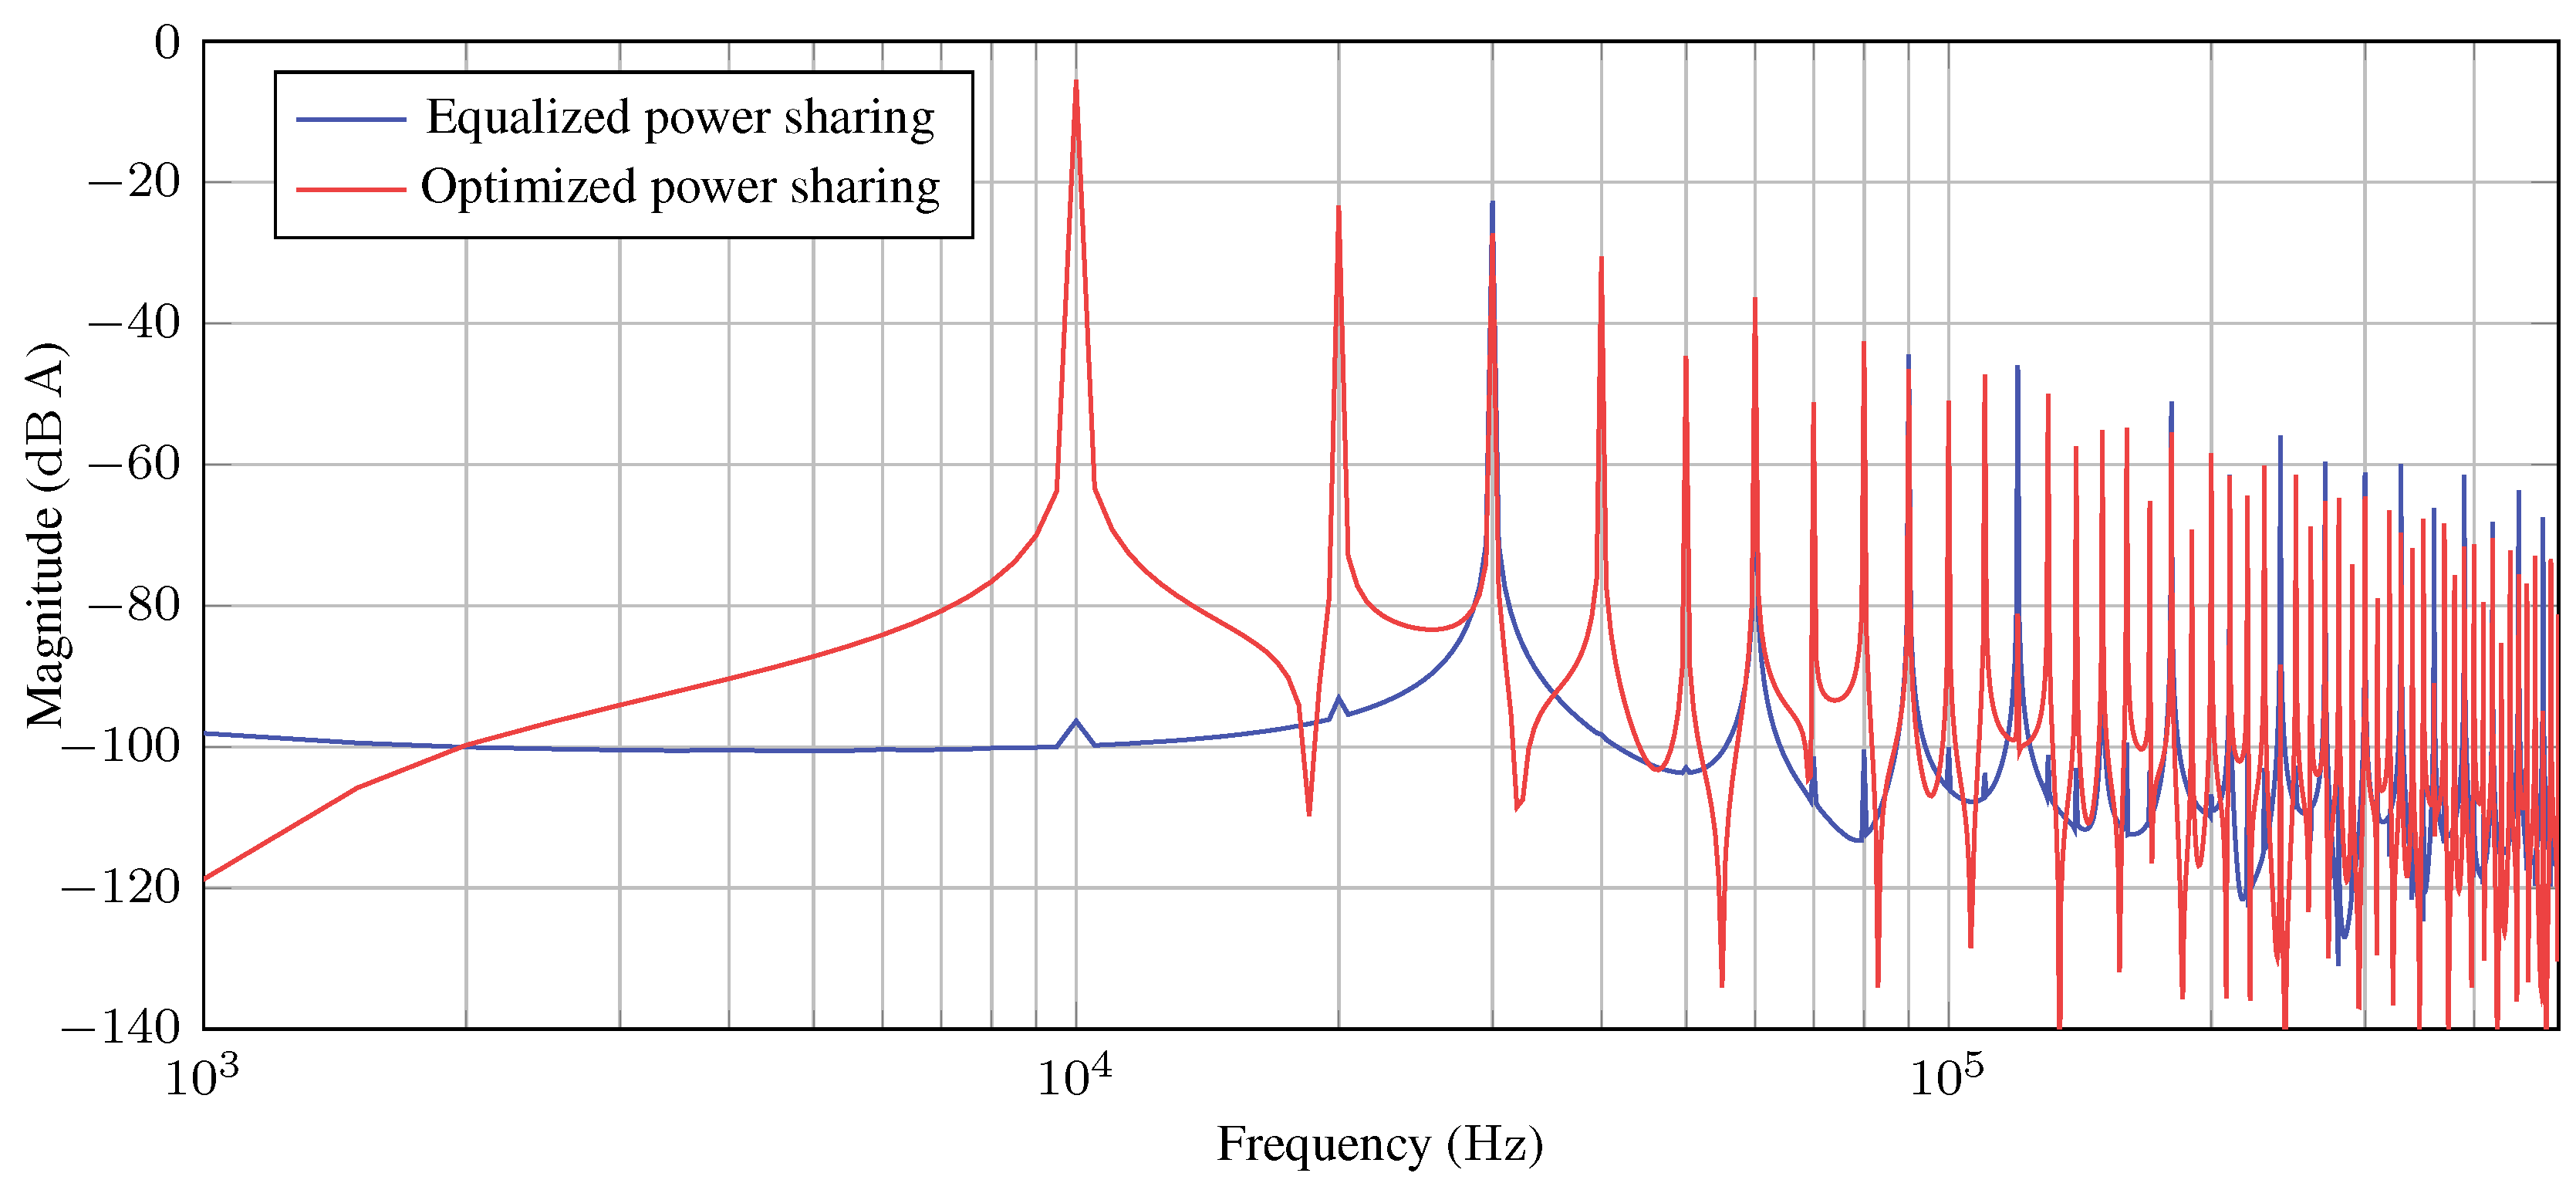
Finally, the impact of the proposed strategy on the system’s electromagnetic interference (EMI) profile is analyzed through the source current harmonic spectrum.
Figure 14,
Figure 15 and
Figure 16 compare the Fast Fourier Transform (FFT) of the input current for the optimized and equalized power-sharing methods at 100%, 66%, and 33% of nominal power, respectively. At full load, both strategies converge to an identical interleaved profile with a primary harmonic component at 30
(−20 dB). At partial loads, such as 33%, the optimized strategy deactivates redundant modules to maximize efficiency, which inherently reduces the interleaving cancellation effect and results in a higher low-order harmonic magnitude (−5.5 dB at 10
). However, this condition corresponds to a single converter operating at its rated current, a standard operating point for which EMI filters in modular systems are traditionally sized. Although a tradeoff between peak efficiency and low-frequency harmonic attenuation exists, the proposed strategy operates strictly within the hardware’s design envelope, ensuring that the efficiency gains do not compromise the physical integrity or the filtering requirements established for nominal operation.