1. Introduction
Next-generation of computing (e.g., soft computing, cloud computing, edge computing, parallel computing, quantum computing) and artificial intelligence (AI) are empowering smart cities and infrastructure for a shared common ground of human societies, ranging from infrastructure monitoring and operations to financial portfolio management, from transportation, energy and water network to medical and public health. By embedding computing and intelligence into transportation networks, utilities, buildings, and public spaces, cities can move from reactive management to predictive, adaptive, safe and optimized operations. Analytic hierarchy process (AHP) and fuzzy comprehensive evaluation have stimulated a wide range of methods based on pairwise-comparison matrix to derive weights for multi-criteria decision making (MCDM) and multi-objective decision-making (MODM), such as the eigen value approach, the least square approach and the min-max approach, and for group decision-making [
1,
2].
Fuzzy comprehensive evaluation-based infrastructure management of pavements, bridges, tunnels, rail systems, energy and water networks balance safety, performance, cost and environmental impact. Fuzzy comprehensive evaluation-based safety assessment of road and tunnel, and freeway emergency management offers a systematic decision-making framework under uncertainty based on physics and engineering principles for identifying potential hotspots and sections of high risk of relativity as a surrogate methodological framework to statistical learning, machine learning and AI approaches. These approaches are heavily data-driven and may not be suitable for situations where data availability is an issue (e.g., roads and tunnels that are newly constructed, or lack of historical accident records).
Computer vision applied to images and videos from drones, vehicles, and fixed cameras automatically detects cracks, spalling, deformation, corrosion, and surface distress with increasing accuracy and consistency beyond traditional manual inspections. Combined with Internet of Things (IoT) sensors measuring strain, vibration, temperature, moisture, and traffic loads, AI-driven multi-source data fusion provides a holistic understanding of structural health and safety conditions.
AI-driven data analytics support predictive maintenance by identifying early signs of deterioration and estimating remaining service life to allow agencies to prioritize interventions, allocate resources efficiently, and minimize lifecycle costs. Real-time AI-driven data analytics enable adaptive traffic control, rapid incident detection, reduced congestion, improved safety, lower emissions and resilient responses to extreme events such as floods, heat waves, and earthquakes. When integrated with digital twins, generative AI models can simulate infrastructure behavior under various scenarios, supporting planning, policy evaluation, and long-term sustainability goals.
In modern portfolio management of financial assets, leveraging advanced soft computing and AI-driven data analytics enhances investment decision-making, risk control, and long-term performance. By processing large volumes of structured and unstructured data, such as market prices, financial statements, macroeconomic indicators, news, and alternative data, the fuzzy-random-set approach and AI can provide deeper insights into market dynamics that are difficult to capture with traditional models. In the process of portfolio construction, AI-driven data modeling and identification techniques can support asset selection, weight allocation and diversification. Machine learning and deep learning models can identify non-linear relationships, systemic shifts, and latent risk factors across asset classes. Reinforcement learning and optimization algorithms, meanwhile, enable dynamic asset allocation by continuously adjusting portfolio weights in response to evolving market conditions, investor preferences, and constraints. These methodologies not only enhance model adaptability but also robustly balance return objectives with risk tolerance.
This paper presents a comprehensive review of monocular metrology and fuzzy random portfolio optimization (FRPO) that supports the aforementioned broad applications. The former focuses on vision-based sensing technology, data processing, analysis and intelligence for dimension measurement, with applications ranging from endoscopes in medical applications to condition assessment in smart cities and infrastructure. The latter focuses on portfolio modeling, uncertainty quantification, reliability assessment, and decision-making for performance optimization.
Since the output from monocular metrology is performance indicators that can be input into a decision-making framework in FRPO, the paper provides a complete review of a “sensing to decision-making” chain that is generally applicable to infrastructure and financial decisions. On the surface, these two domains appear to be in different fields, but methodology-wise, they are both built and are being strengthened on a common ground of soft computing and AI to enhance the performance, safety, efficiency, resilience, and sustainability of the built environment and decision-making, and to achieve reliable and optimal decision-making.
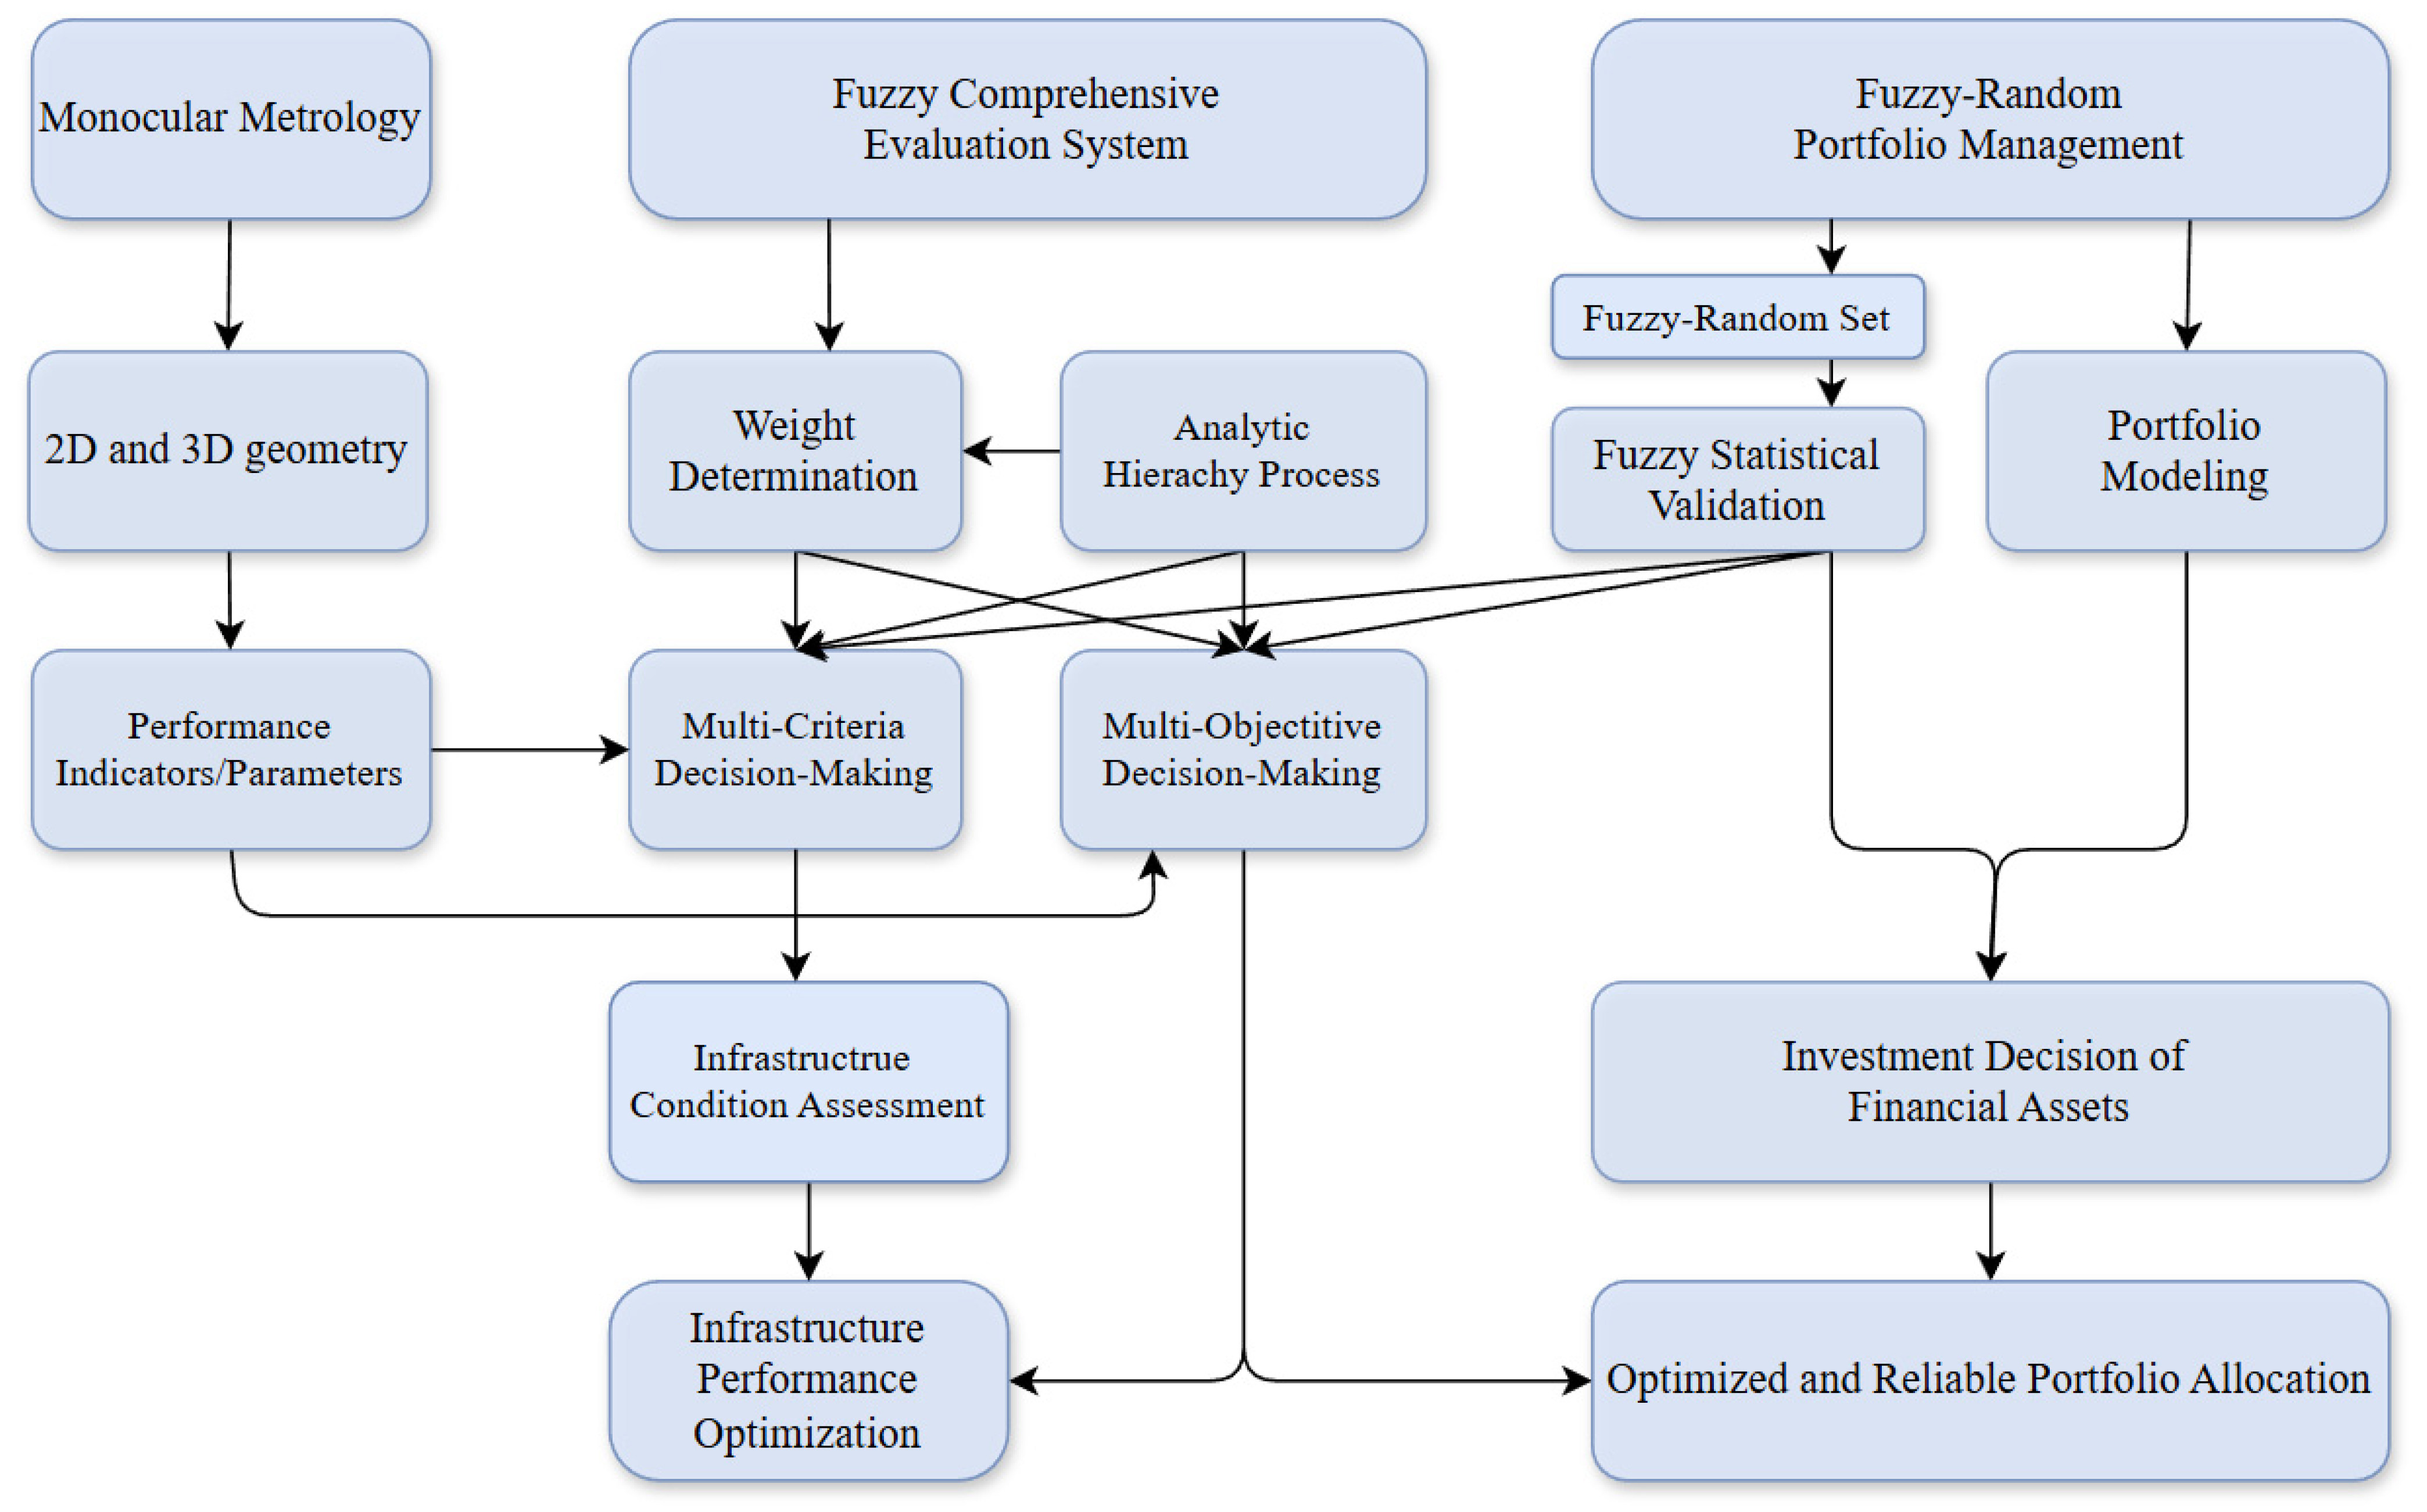
Figure 1 provides a block diagram of the sensing-to-decision chain, illustrating the connection between monocular metrology and fuzzy random portfolio management.
In this study we regard “fuzzy random-set computing” as a specialized AI-driven soft computing for handling inherently imprecise and ambiguous data generated by IoT sensors/electronic devices used for data collection in smart cities and infrastructure monitoring. The computational framework presented in
Figure 1 acts as a decision-making engine within a broader information-processing mechanism, thereby exhibiting the linkage between sensor-generated physical data and financial asset data.
The objective of this study is to shed the light on future perspectives of soft computing and AI-driven monocular metrology for smart cities and infrastructure, as well as fuzzy random portfolio management of financial assets, by illustrating that some decision-making parameters in fuzzy random portfolio and risk management come from monocular metrology measurement, and that measurement, monitoring, condition assessment and portfolio/asset management are different components of a decision-making chain and can be better examined coherently as a whole.
2. Monocular Metrology with Applications
Monocular metrology refers to the process of extracting quantitative spatial information, including distances, sizes, dimensions, and 3D surface reconstruction from a single camera. This approach leverages advanced computer vision algorithms to extract quantitative data from conventional two-dimensional images or video sequences, managing non-contact measurement of vibrations, displacements, and deformations in various applications [
3]. Such methods are significant for infrastructure monitoring because they use ubiquitous devices rather than more complex and expensive sensors.
Euclidean geometry is the framework for describing the angles and shapes of objects. However, Euclidean geometry is not suitable for explaining the concept of two parallel lines intersecting at a point at infinity, which is often a dispensable assumption used in monocular metrology. To overcome such an obstacle, the concept of projective space or projective geometry is used in monocular metrology, which extends Euclidean geometry by including points at infinity as intersections of parallel lines [
4]. Monocular metrology typically assumes the pinhole camera model, a linear central projection model without lens distortion. The full mapping or calibration from world point
X to image pixel (
x,
y) in homogeneous coordinates, involving factorization into intrinsic and extrinsic parameters of the camera, is fundamental to monocular metrology. In addition to camera calibration, a key theoretical ingredient of monocular metrology is single-view metric reconstruction via vanishing points: recovering distances, heights, and areas directly from a single-perspective image by exploiting vanishing points and vanishing lines of planes in the scene [
5].
In recent years, advances in deep learning and photogrammetry have greatly improved monocular metrology. Monocular depth estimation networks can infer relative depth from shading and learned priors. Traditional photogrammetric methods remain valuable when camera geometry or scene features are known.
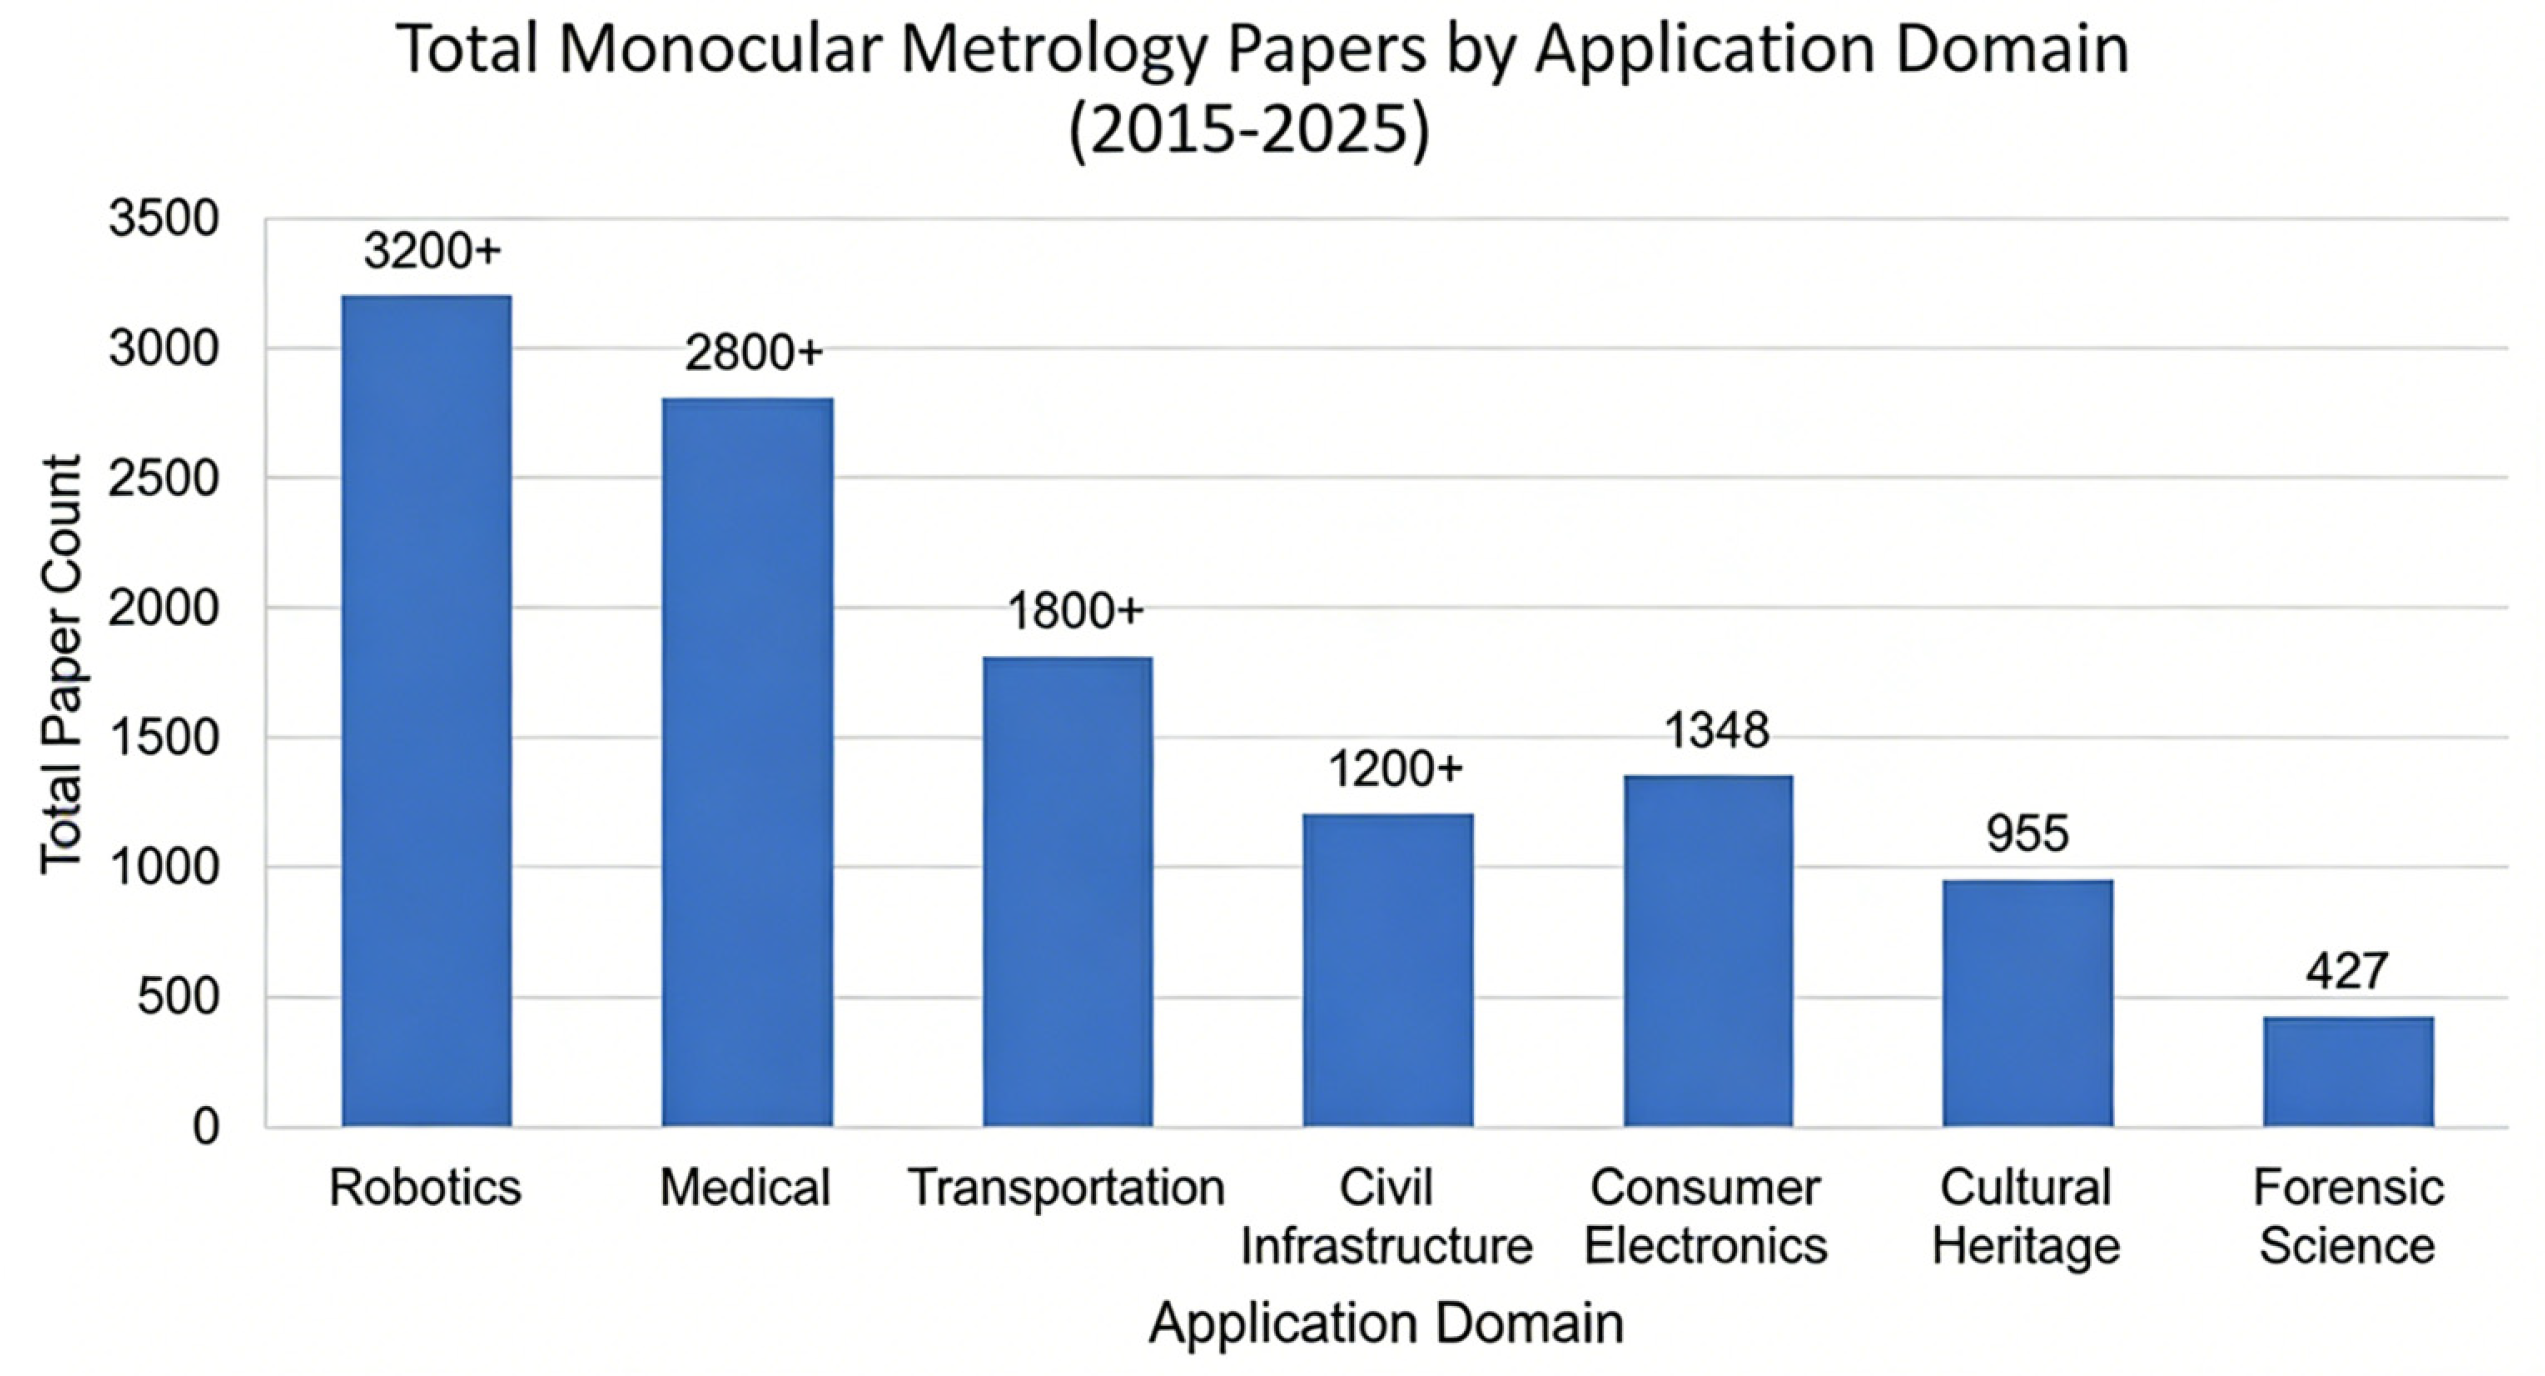
Figure 2 shows extensive applications of monocular metrology during 2015–2025 in different domains.
2.1. Robotics
Monocular Line-Scan Imaging and Spherical Unfolding. To solve the imaging challenges of highly reflective spherical surfaces, Wang designed an unfolding system based on a monocular line-scan camera [
6]. They designed a Parallel Ring Light and used a monocular line-scan camera with ring illumination to acquire spatiotemporal stripe images and applied unfolding-trajectory modeling to align scale and enhance defect cues. A spatial–temporal resolution normalization algorithm was developed to stretch or compress images at different latitudes, stitching them into an isotropic flat unfolded map. The system achieved continuous imaging of the entire bearing ball surface with a detection error lower than 0.001 mm
2. At the same time, experiments showed a 100% accuracy when detecting cracks, rust, or scratches, which reduces the cost of precision quality inspection equipment instead of using expensive multi-camera arrays.
To summarize, in highly reflective bearing balls, monocular inspection is fundamentally challenged by specular reflections, large curvature, and the non-developable surface, which jointly reduce defect contrast. Here, scale effectively becomes a high-level pixel-to-area mapping, implying implicit calibration dependency on kinematics and illumination stability. A practical solution is end-to-end, interpretable joint optimization of calibration and defect detection: encode unfolding geometry into a differentiable optimization graph, apply differentiable bundle adjustment for online compensation of speed jitter and pose bias, and add photometric consistency with specularity-suppression priors for robustness.
2.2. Medical
Metric-Scale Recovery for Monocular Endoscopic Simultaneous Localization and Mapping (SLAM). Traditional monocular SLAM techniques face two major challenges in endoscopic scenarios. Firstly, the sparse and repetitive textures within the digestive tract make feature point tracking difficult. Secondly, monocular SLAM faces uncertainty, which means it can only rebuild the shape, instead of the absolute size. Iranzo et al. [
7] developed the “EndoMetric” system, using the physical characteristic of the endoscope’s onboard light to solve the ambiguity in monocular vision. While traditional computer vision assumes light sources are at infinity, in endoscopy, the light source is positioned adjacent to the camera, and light intensity strictly follows the “inverse-square law” with distance. Batlle comprises photometric constraints into optimization equations of sparse SLAM [
7] and recovers an up-to-scale 3D model via Structure from Motion (SfM) and then constructs a photometric energy function involving surface albedo, surface normal, and light attenuation. By optimizing geometric and photometric errors, the algorithm obtains absolute distance from variations in shading successfully. The true metric scale recovered from standard monocular video without specific training data or external calibration objects is able to distinguish between polyps smaller than 10 mm, upgrading the common endoscopes into surgical tools with precision measurement capabilities.
Mobile Monocular 3D Reconstruction for Wound Surface. For chronic wounds such as diabetic foot ulcers and pressure ulcers, periodic assessment of the area turns out to be critical in the healing process. In the past, people could only use acetate tracing or simple ruler management; however, the former requires physical touch, increasing the risks of infection, while the latter suffers from extremely low accuracy. Davide Carnevali’s research team developed a monocular hybrid system based on mobile devices. The system uses structured light sensors or purely visual algorithms to reconstruct a high-precision 3D model of the wound surface from mobile video streams. The algorithm first separates color and texture segmentation on the wound area, automatically identifying necrotic tissue, slough, and granulation tissue. Subsequently, based on the 3D mesh, it calculates the wound’s surface area, perimeter, and volume parameters, which are difficult to measure manually. Additionally, this system integrates augmented reality (AR) functionality, being able to show the wound outline from the patient’s previous visit onto the current real-time video [
8]. Clinical comparative experiments showed that the system’s linear measurement precision reached 1.2%, with area precision reaching 1.7% and volume reaching 1.3%, which exceeds the accuracy of traditional manual measurements by errors of about 10–25%. The AR projection feature enabled “in situ comparison,” allowing doctors and patients to see directly on the skin whether the wound had shrunk or enlarged. This greatly improved treatment compliance and assessment objectivity, reducing the risk of cross-infection effectively.
To summarize, the main limitation in endoscopic monocular metrology is its unobservable absolute scale, together with non-Lambertian reflectance and specular highlights. The pipeline proposed in the “EndoMetric” system has high calibration dependency because it needs accurate light–camera geometry, radiometric correction, and stable multiview reconstruction. A stronger route is to move from offline reconstruction to online scale-aware SLAM. Differentiable photometric bundle adjustment, non-Lambertian modeling, and robust kernels can jointly estimate scale, exposure change, and specular outliers.
2.3. Transportation
Real-Time Monocular SLAM for Autonomous Navigation. Davison et al. achieved a real-time monocular SLAM (MonoSLAM) system by introducing Extended Kalman Filtering (EKF) and an Active Measurement strategy [
9]. The system predicts one camera’s pose in the next moment with probabilistic models, drastically reducing the search range for feature matching problems. Targeting the scale issue in monocular initialization, they use one known initial object to ensure absolute scale, and the depth uncertainty of feature points continuously converges through the probabilistic filter during operation. Moreover, the MonoSLAM system ensures operation at 30 Hz on standard hardware, demonstrating that a single low-cost camera suffices for real-time positioning of robots in unseen environments. This research establishes the theoretical foundation for modern visual SLAM, enabling autonomous navigation capabilities in low-cost robotic vacuum cleaners and consumer-grade drones.
Self-Supervised Monocular Depth Estimation for Autonomous Driving. Traditional supervised learning relies on vast amounts of paired “image–depth” data, incurring huge acquisition costs. Sun et al. [
10] are among the earliest researchers who developed a high-precision monocular depth estimation algorithm from multiple image frames of traffic video.
Figure 3 illustrates the idea of estimating the time-varying distance between the lead vehicle and the following vehicle for the travel time experiment [
10].
Self-supervised learning (SSL) has revolutionized this landscape by leveraging inter-frame geometric consistency in videos as the supervisory signal. Godard proposed the MonoDepth2 framework to address common blurring and artifact issues in self-supervised depth estimation [
11]. The core idea is to frame depth estimation as a “Novel View Synthesis” problem: if the network can predict the next frame’s image from the current frame, it implies an understanding of the scene’s 3D structure. The researchers introduced three key innovations: The first innovation is Minimum Reprojection Loss. Compared with matching errors across multiple adjacent frames, leading to the blurring of one object’s edge, MonoDepth2 backpropagates only the minimum error, enabling robust handling of occlusion. Then, in Auto-Masking, when cars moving at the same speed ahead appear static relative to the camera and are easily misjudged as infinite background, MonoDepth2 automatically filters out these relatively static regions by comparing pixels before and after transformation. Finally, in Multi-Scale Sampling, it calculates multi-level depth losses at full resolution in order to eliminate texture adhesion caused by upsampling. MonoDepth2 demonstrated that without any LiDAR ground truth, a neural network could learn to judge distance via motion parallax just through massive amounts of driving video, which may significantly reduce the cost of autonomous driving algorithms for vision-only autonomous driving systems like Tesla.
To summarize, in transportation applications, scale recovery remains a central issue. Classical monocular SLAM uses a known-size target at initialization and maintains covariance in a probabilistic framework, but the method has a high computational cost and limited tolerance to abrupt motion. Self-supervised monocular depth reduces manual supervision, yet it often assumes a moving camera and a mostly static scene. Many evaluations still rely on median scale alignment, so the true metric scale is not fully resolved. Robustness bottlenecks include dynamic objects, occlusion, weak texture, and weather variation. Decision-level uncertainty is rarely reported. A useful direction is to combine geometric anchors, learned depth priors, and uncertainty propagation. Road geometry, lane width, and camera mounting priors can provide interpretable scale sources. These cues can be fused with differentiable bundle adjustment or graph optimization to regularize depth over time. Evaluation can be escalated beyond relative metrics and report metric-scale error, night and weather robustness, and risk-aware reliability curves.
2.4. Civil Infrastructure
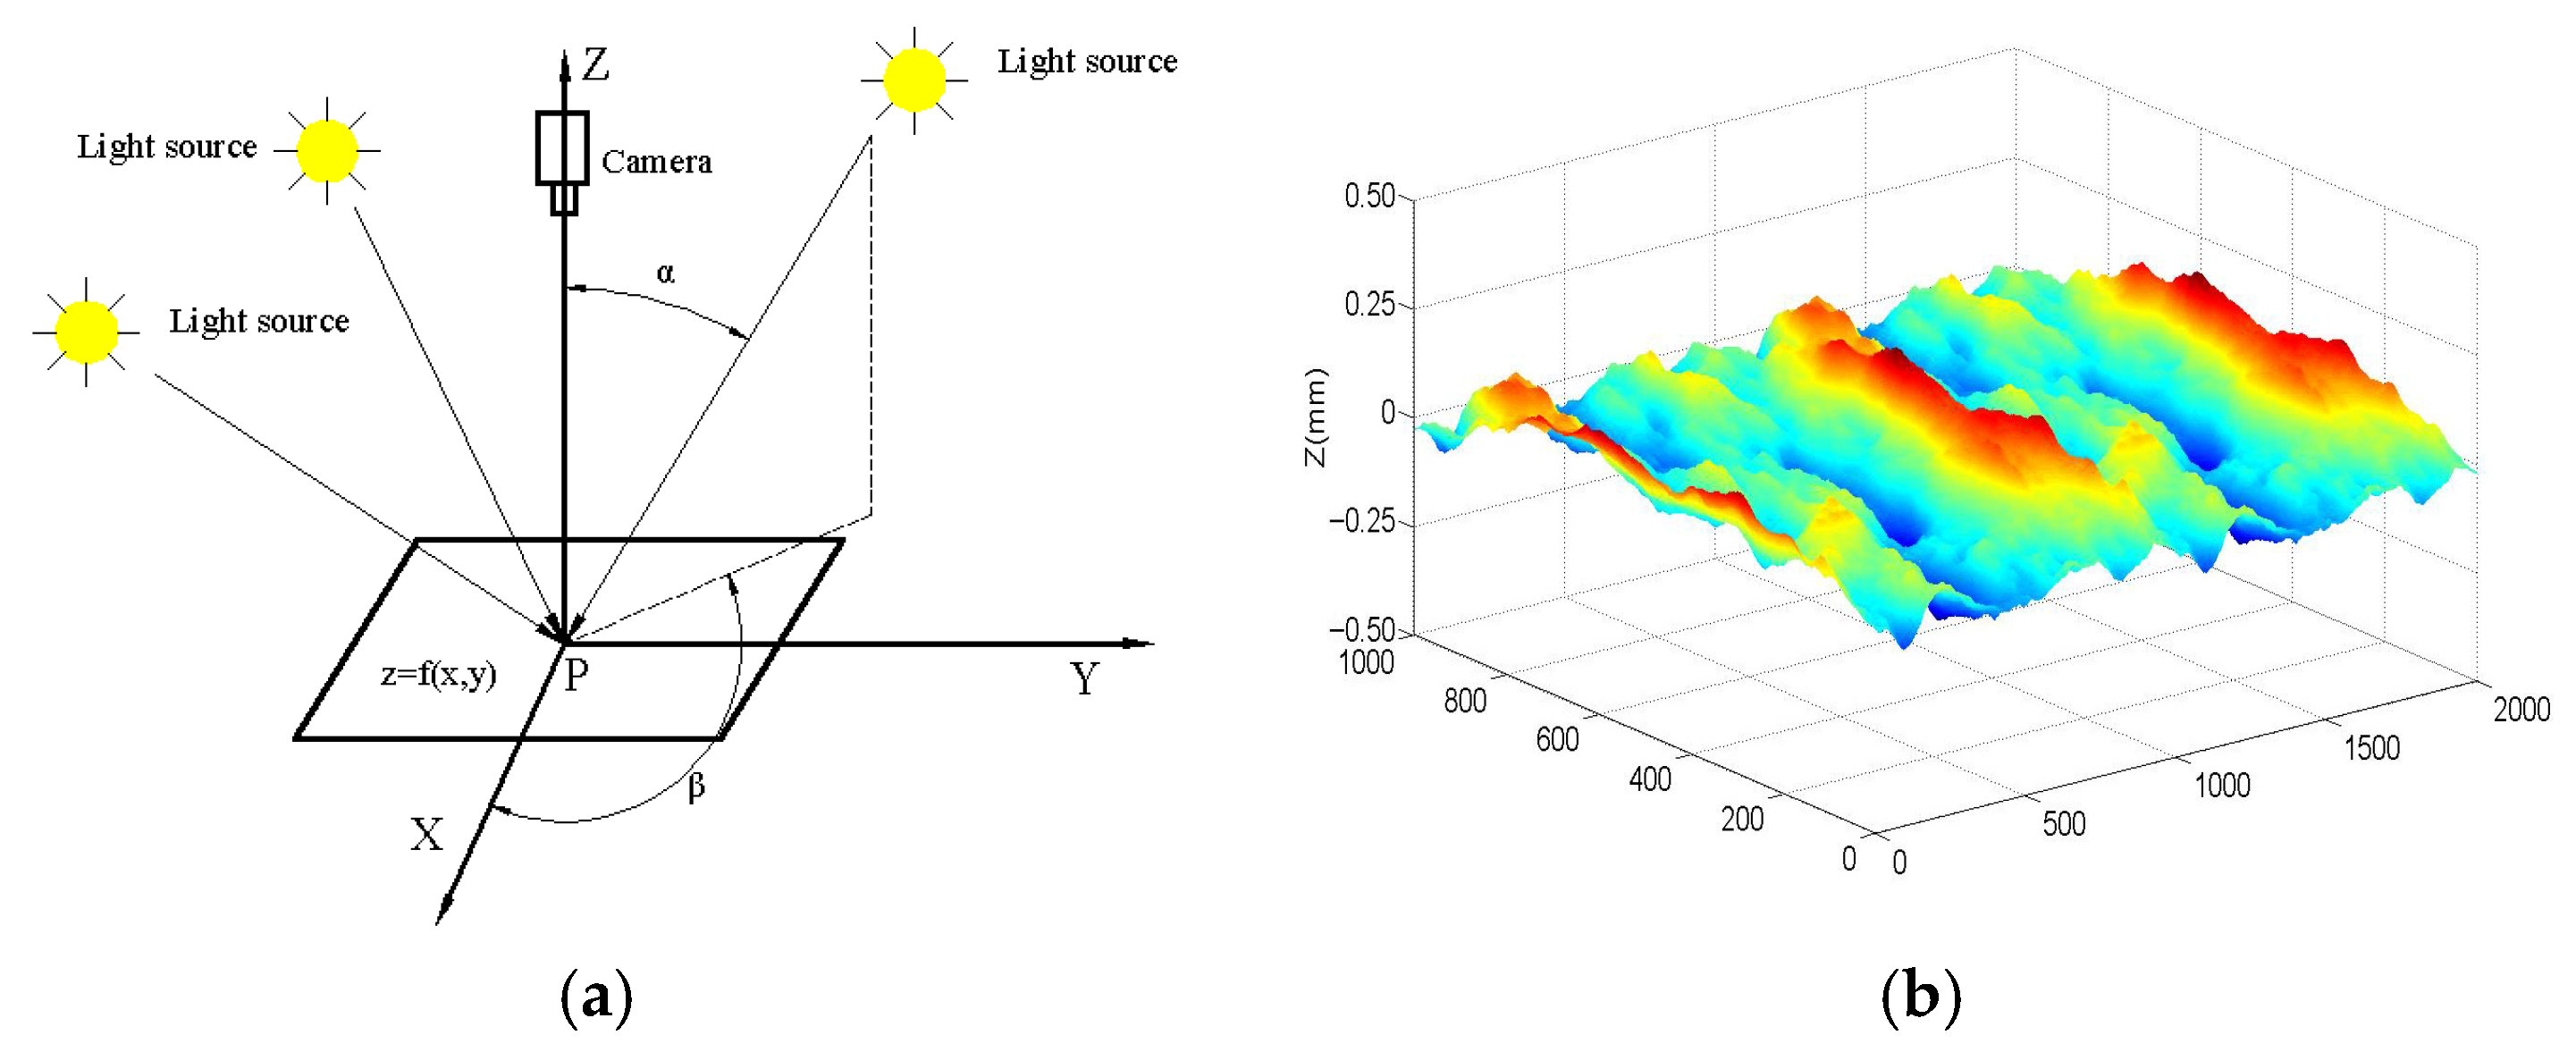
Road, Highway and Airport Pavement. Monocular systems have been used to detect and quantify pavement surface defects and other features. Sun et al. [
12] conducted a series of studies using 3D stereovision and 6-light photometric stereovision based close-range photogrammetry for high-precision pavement texture measurement (
Figure 4).
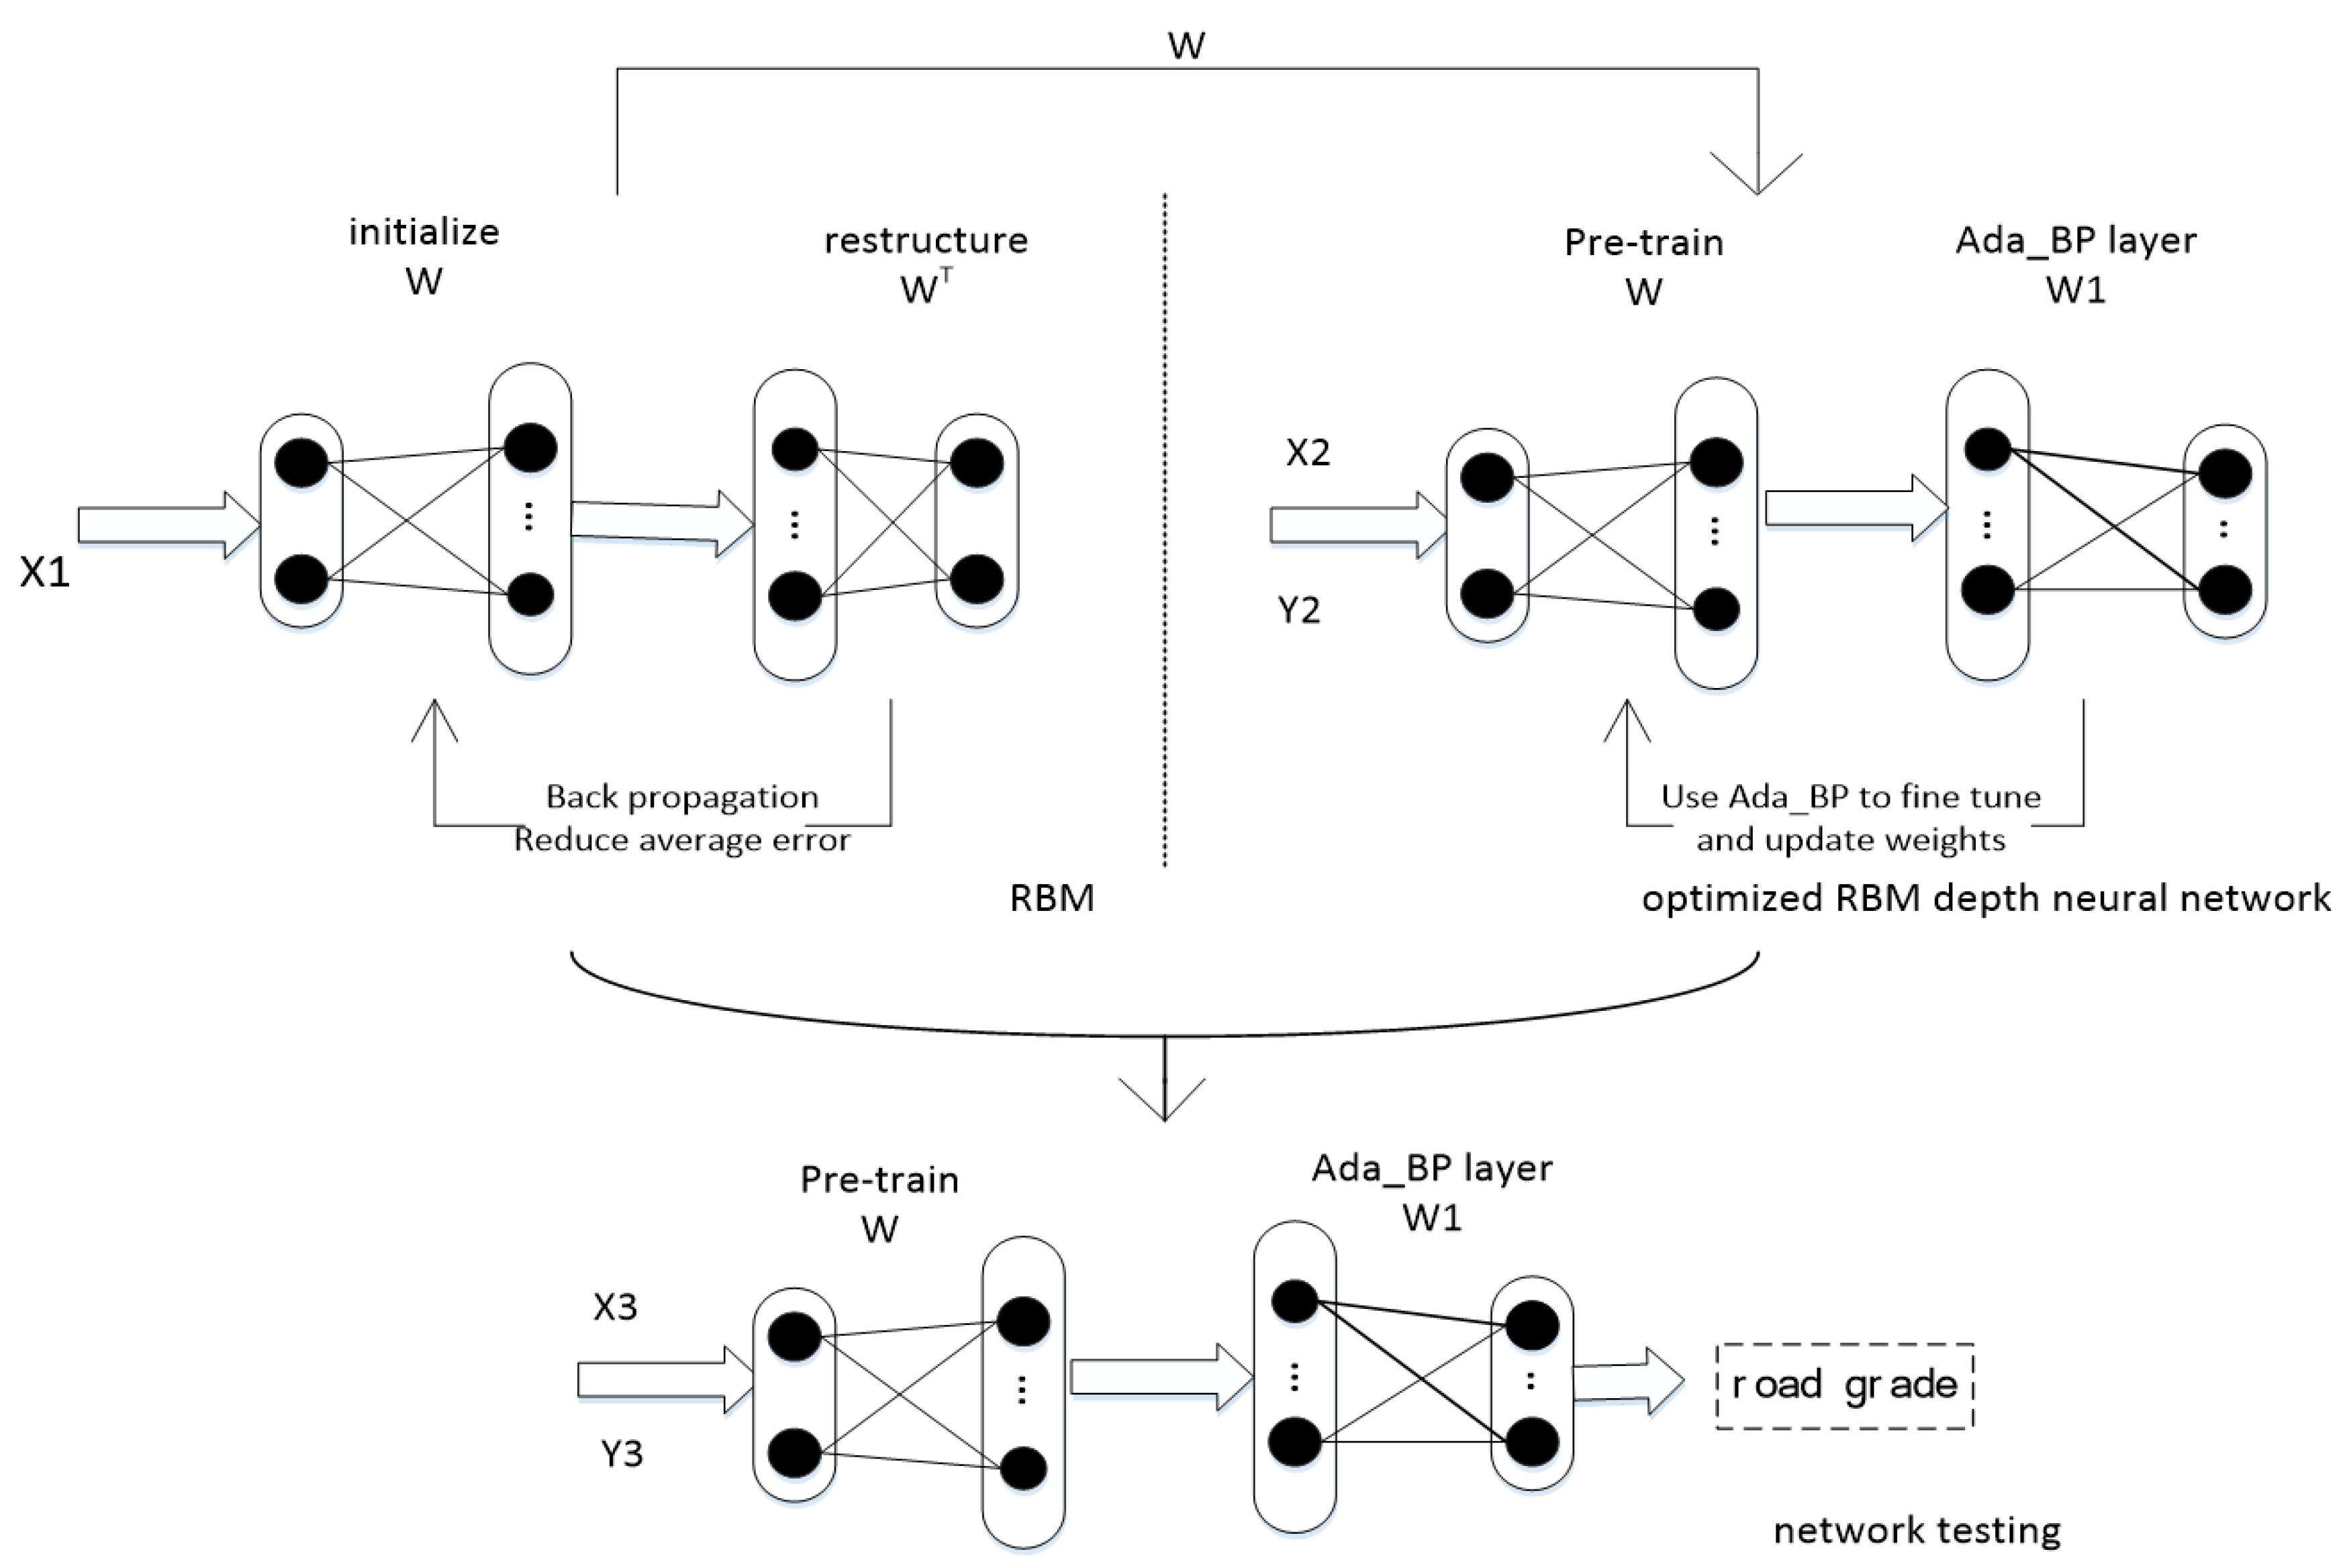
Our group developed an improved restricted Boltzmann machine deep learning algorithm based on Adaboost backward propagation for identifying the road roughness (
Figure 5) [
13]. Reference [
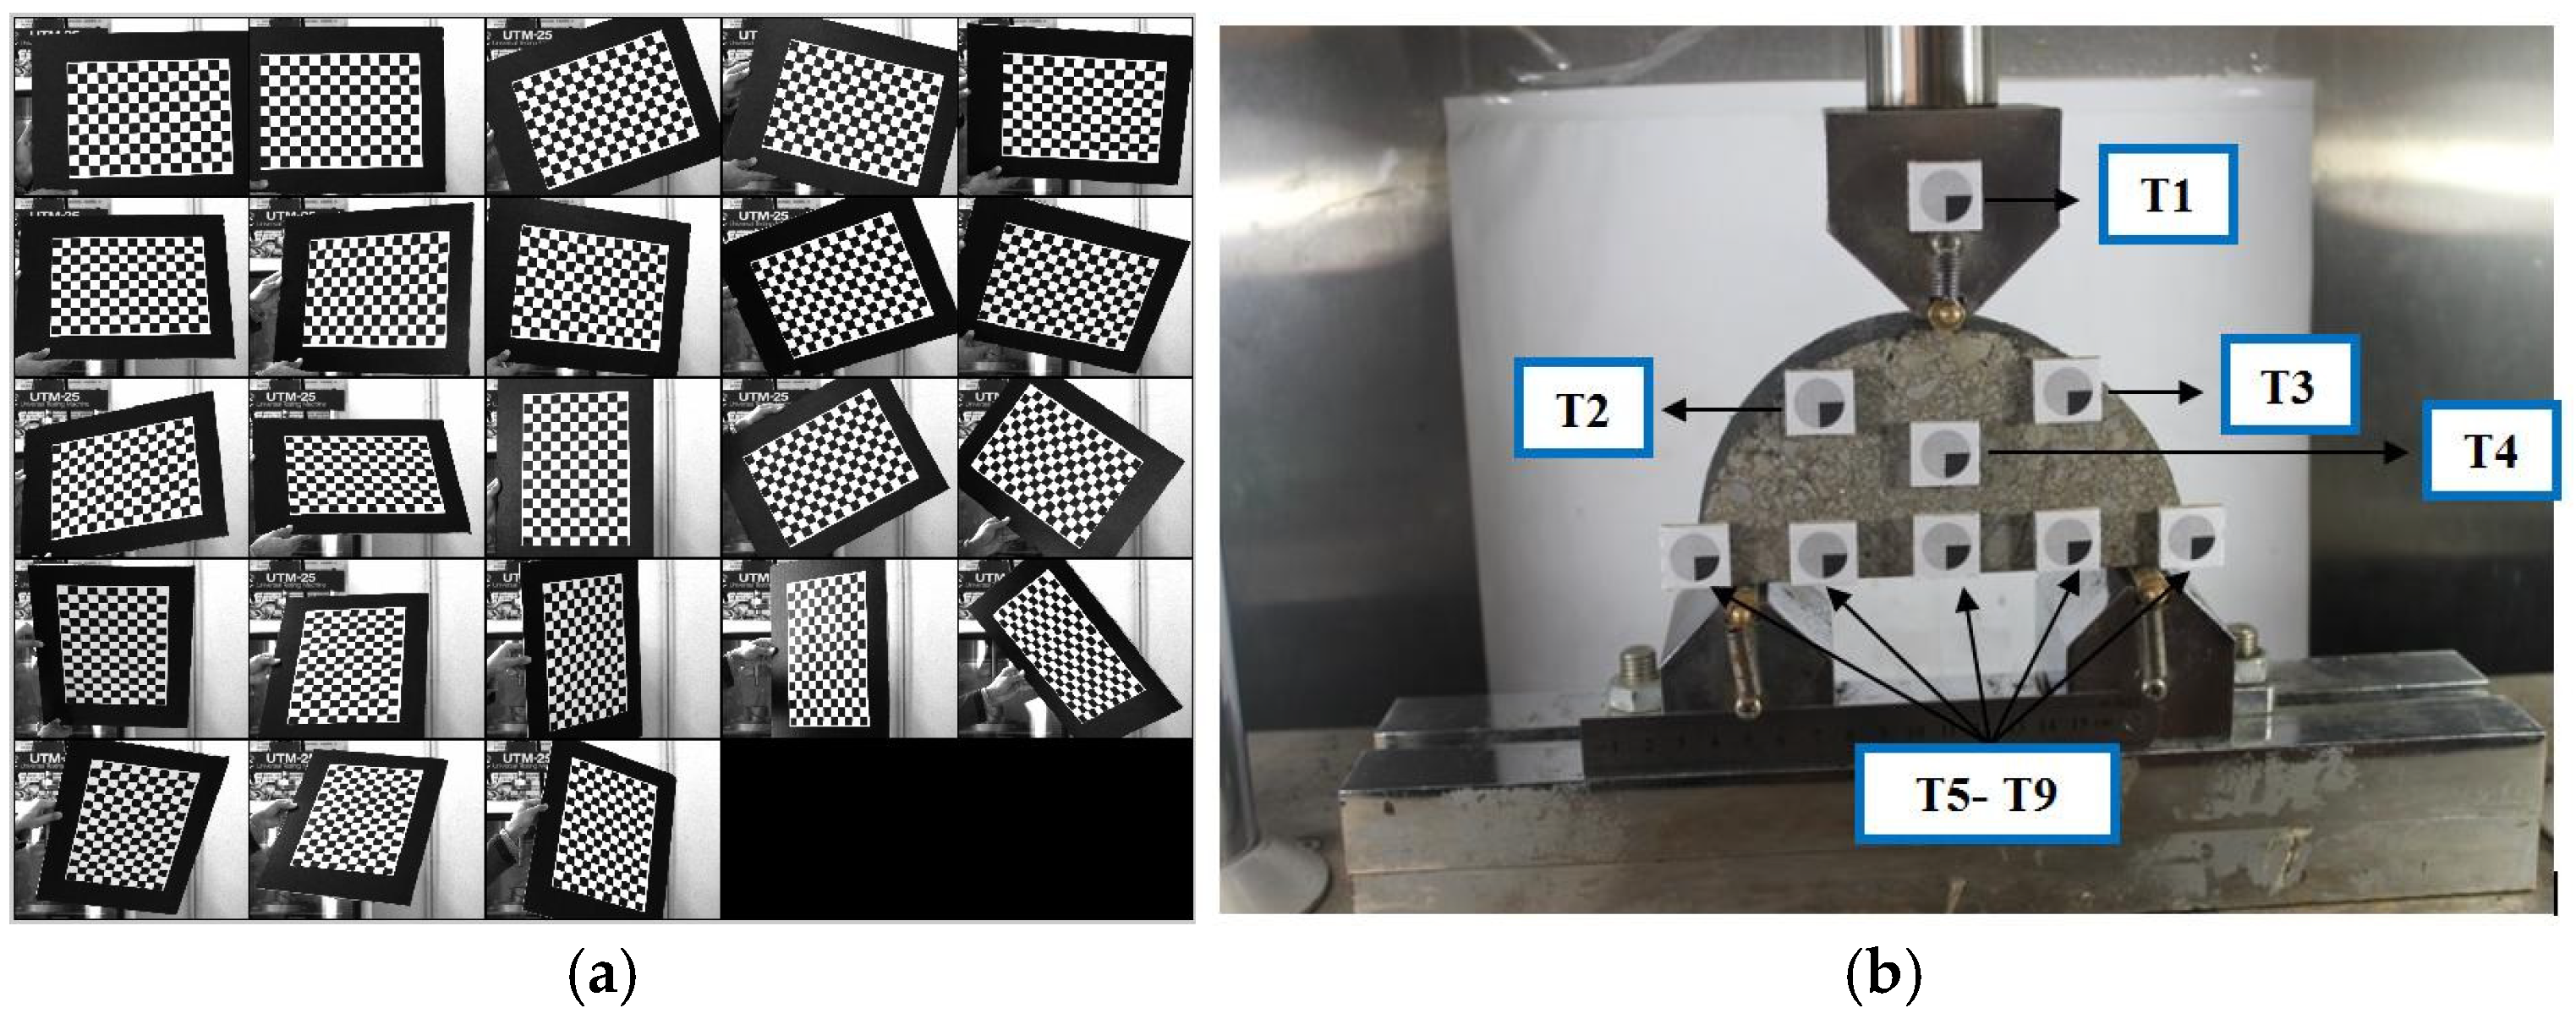
14] presented a non-contact 3D optical sensing system for measuring deformation of asphalt mixture concrete in order to determine module of elasticity and Poisson’s ratio, which used to be measured using LVDT (
Figure 6). Reference [
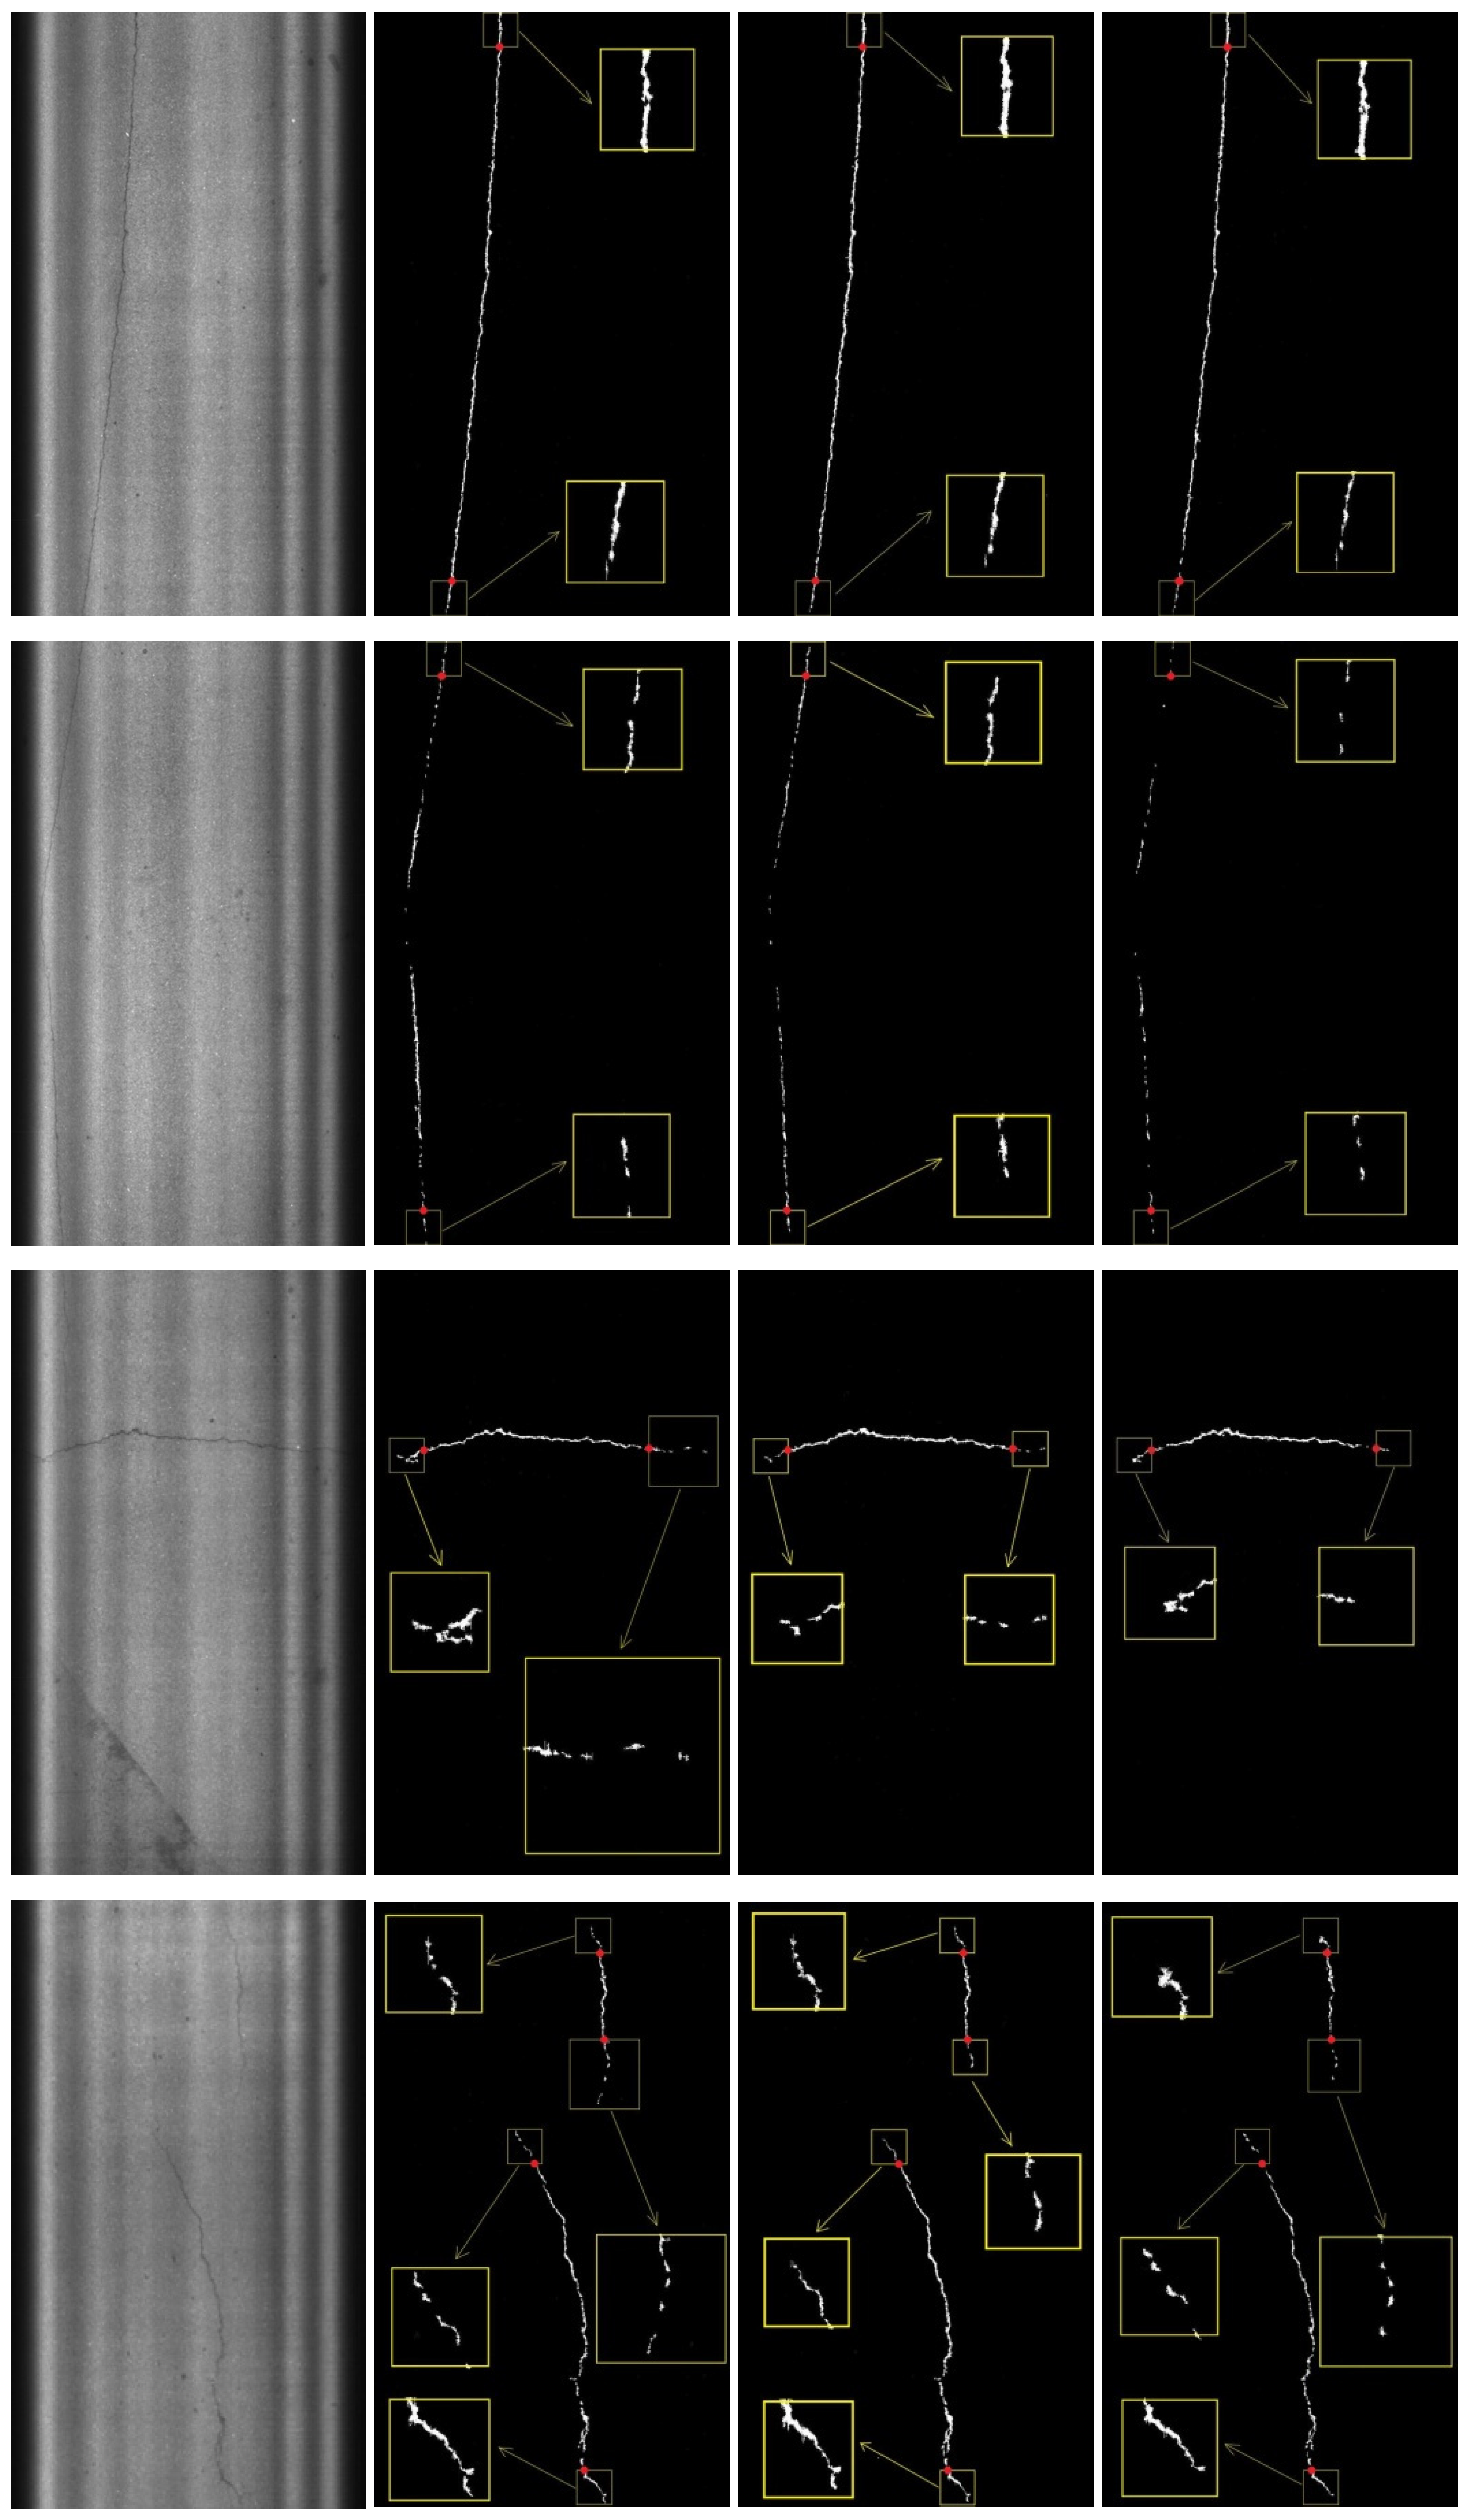
15] developed a novel and fast non-uniform background removal algorithm based on multi-scale wavelet transform for effectively extracting tiny cracks from images of pavement surface (
Figure 7). Reference [
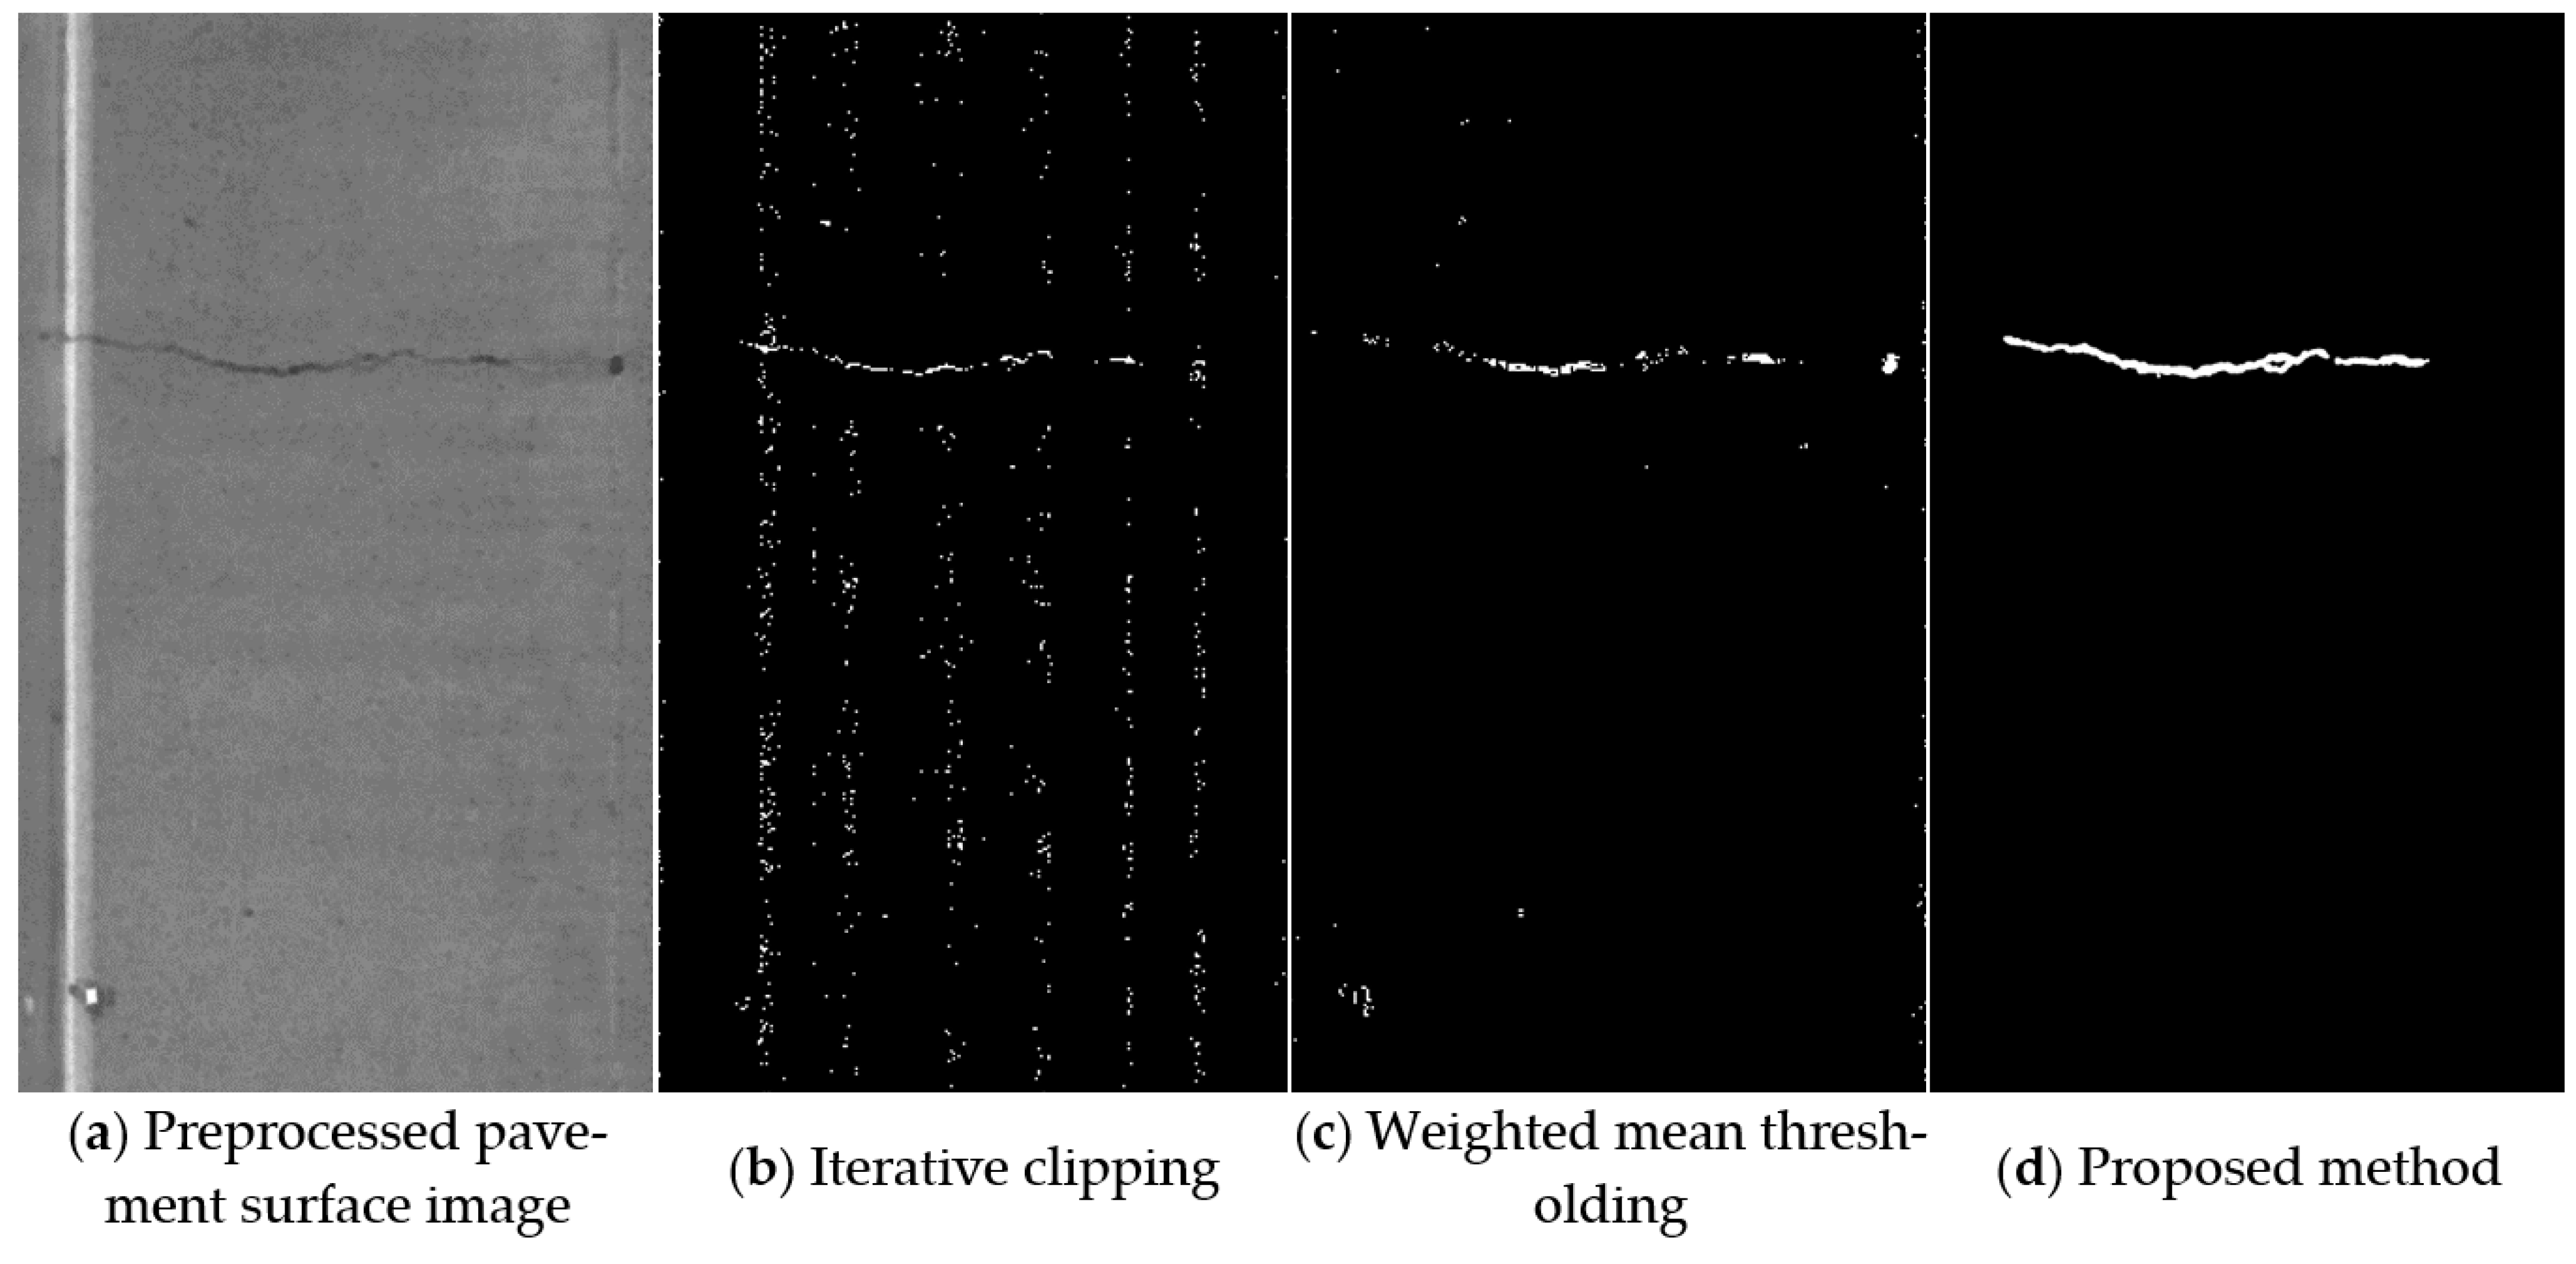
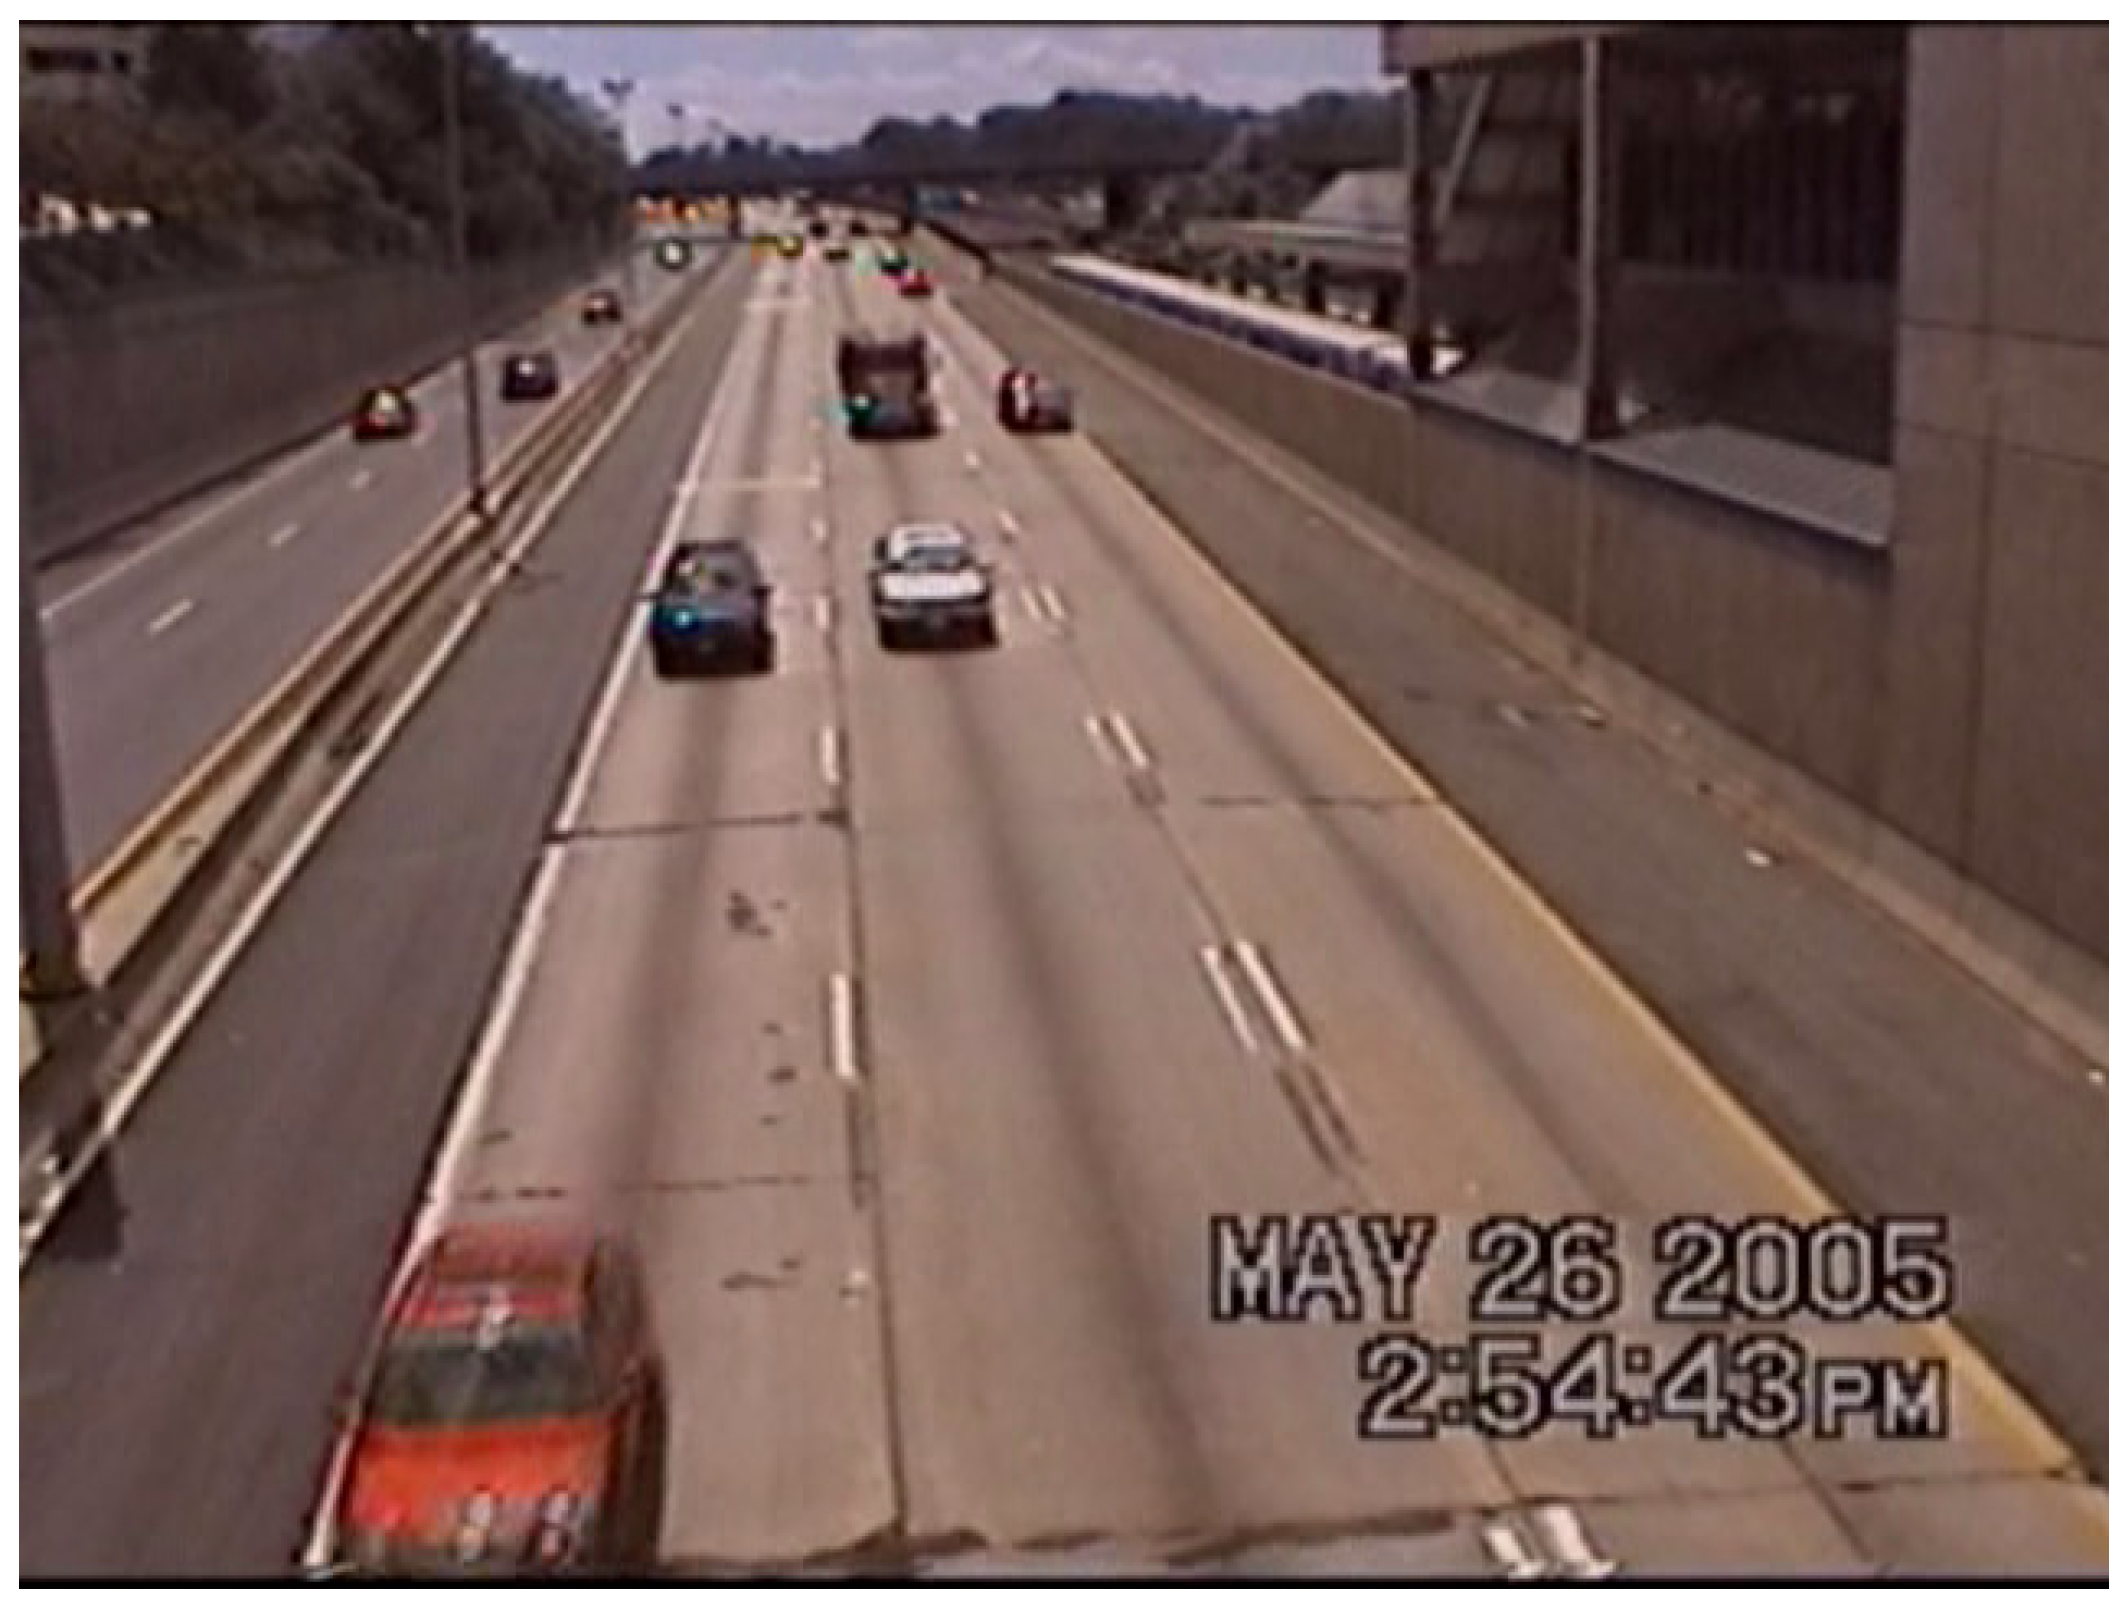
16] designed a new method to detect and segment a crack on a pavement surface image collected from an interstate highway in Maryland using Charge-Coupled Device (CCD) digital cameras (
Figure 8).
Badidey developed a pipeline where road cracks are segmented and sized from dashcam images. Their method first detects crack regions via semantic or instance segmentation, then estimates crack dimensions using combinations of inverse perspective mapping and monocular depth estimation [
17].
Hu proposed a monocular framework capable of simultaneously performing crack segmentation and depth and size estimation of pothole. By outputting a binary crack mask and a per-pixel depth map, the network achieves complete 3D reconstruction of detected cracks. Field tests on road surface imagery demonstrated that this method provides scale-sensitive measurements of crack length and width, achieving an average error below 10% [
18]. This monocular approach has also been applied to pothole detection and sizing.
Wang integrated YOLO-based pothole detection with a monocular depth network, employing cross-frame tracking to detect potholes, generating depth maps from multiple viewpoints, and utilizing novel triangulation to estimate pothole area. By employing cross-frame smoothing of estimates, this research enables a robust area estimation system more suitable for in-vehicle detection [
19].
Railway Safety and Monitoring. In railway safety and monitoring applications, monocular vision technology is also employed to estimate the distance of oncoming trains or obstacles. Hao et al. proposed a system that detects window features of moving trains and calculates distances using a pinhole camera model. The processing workflow employs a YOLOv8 instance segmentation network to localize train windows, subsequently extracting vertical and edge features. These features are then applied to a calibrated pinhole geometry model. This technique estimates the distance a train travels along the track using a single forward-facing lens [
20]. Such monocular ranging technologies are highly cost-effective for railway points and level crossings. Wang proposed the Near-Miss Detector (NMD), employing a train-mounted monocular camera to predict potential collision risks between trains and track obstacles. The NMD constructs a complete 3D scene by performing object detection and monocular depth estimation on a frame-by-frame basis. Its key innovation lies in employing known track gauge for depth calibration: the system assumes a fixed true width between rails to derive absolute scale [
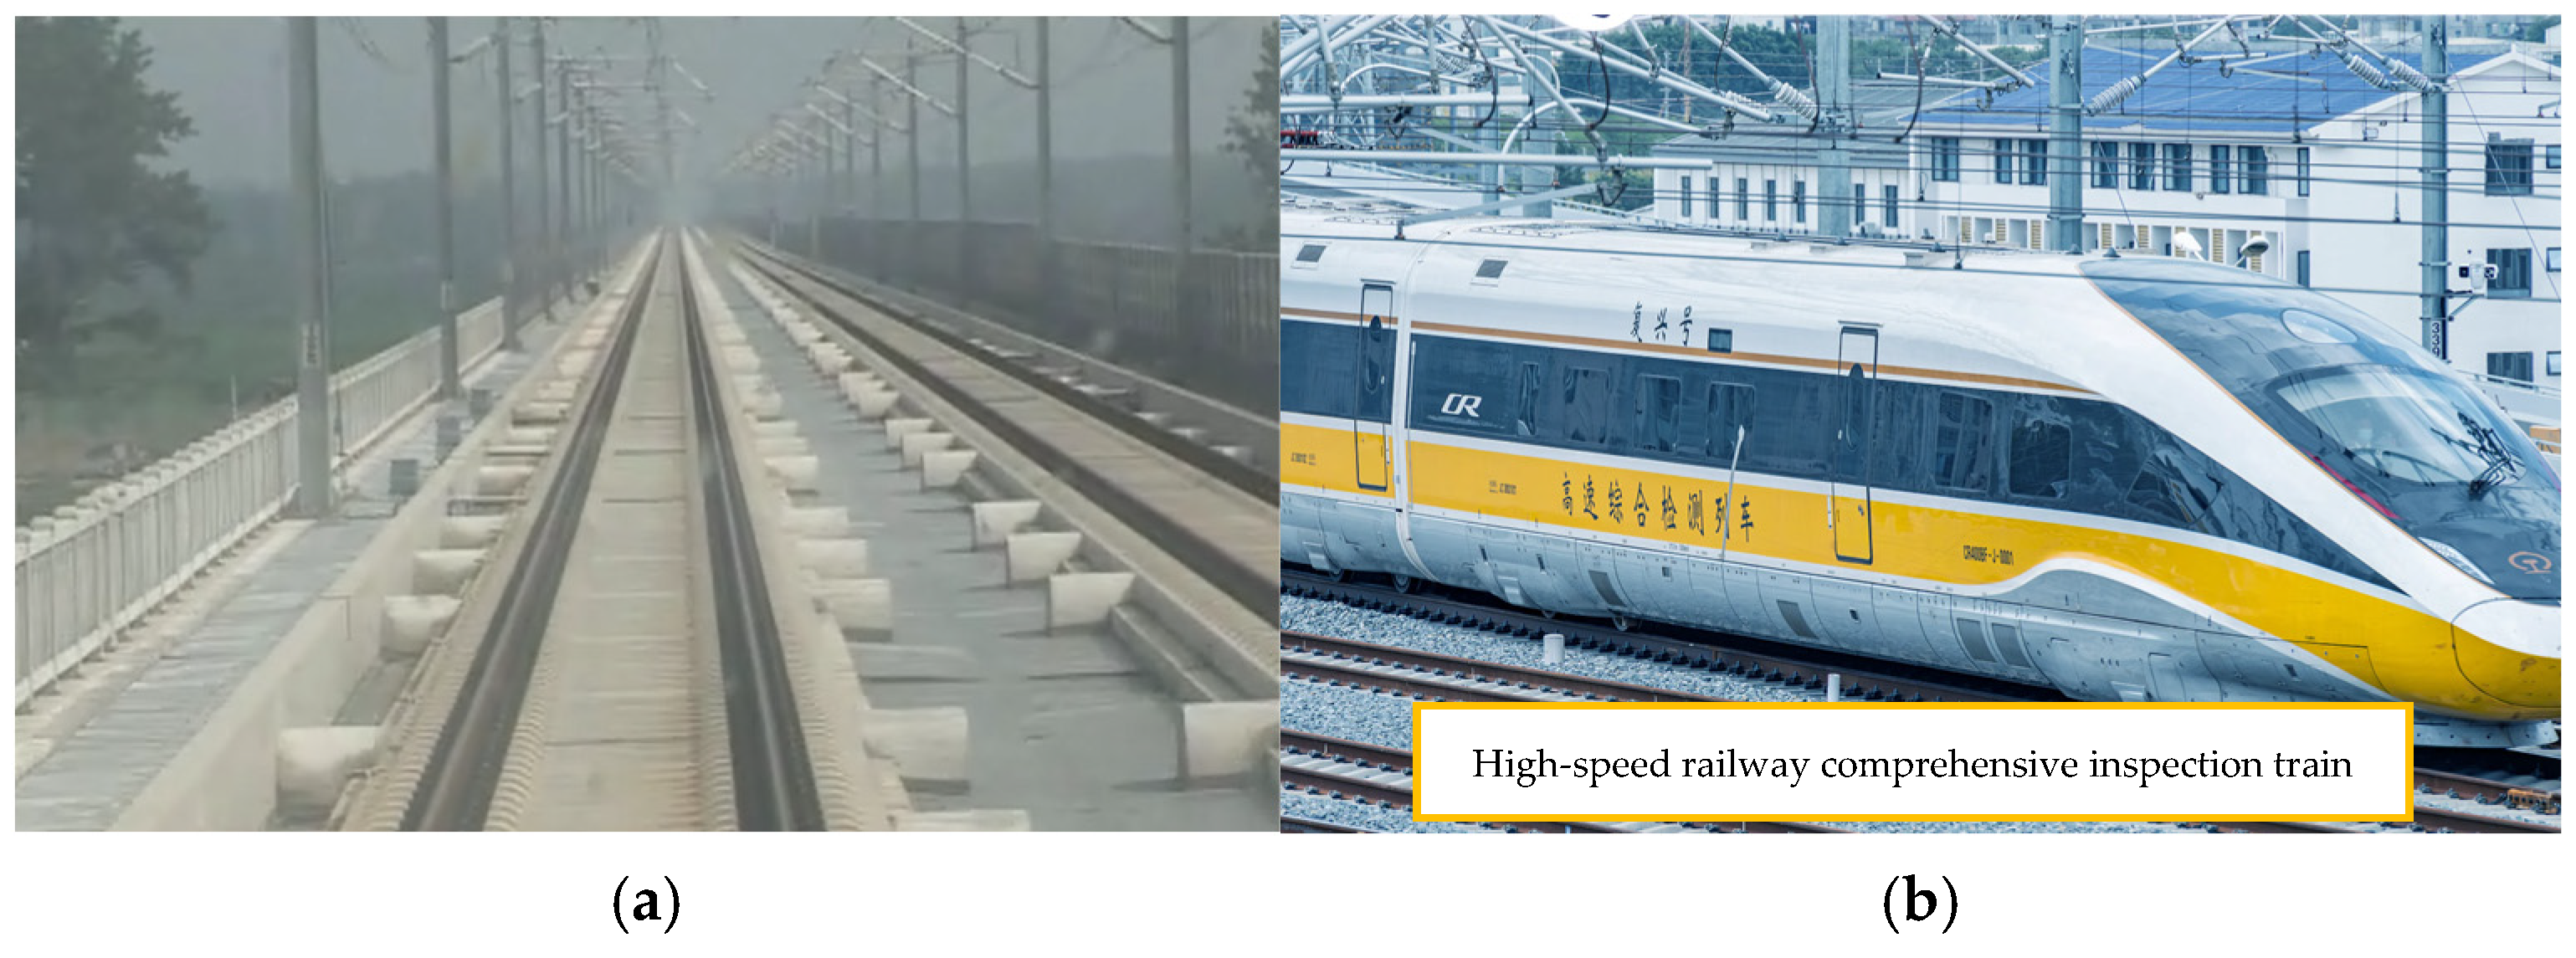
21]. Their research demonstrates that the NMD exhibits reliable detection and ranging performance. This outcome also illustrates that monocular vision technology can serve as a cost-effective complementary solution to high-end sensors, thereby enhancing railway safety protection. Sun (2012) constructed a monocular metrology system as well as a binocular metrology system for structural deformation inspection and 3D scanning based on the forward view of a high-speed train (
Figure 9a) [
22].
Figure 9b illustrates the latest Chinese high-speed railway comprehensive inspection train CR400BF-J [
23]. Sun et al. (2025) presented a comprehensive review and perspectives on the future of smart sensing, real-time monitoring and digital twin technology for train–track–subway/railway systems [
24].
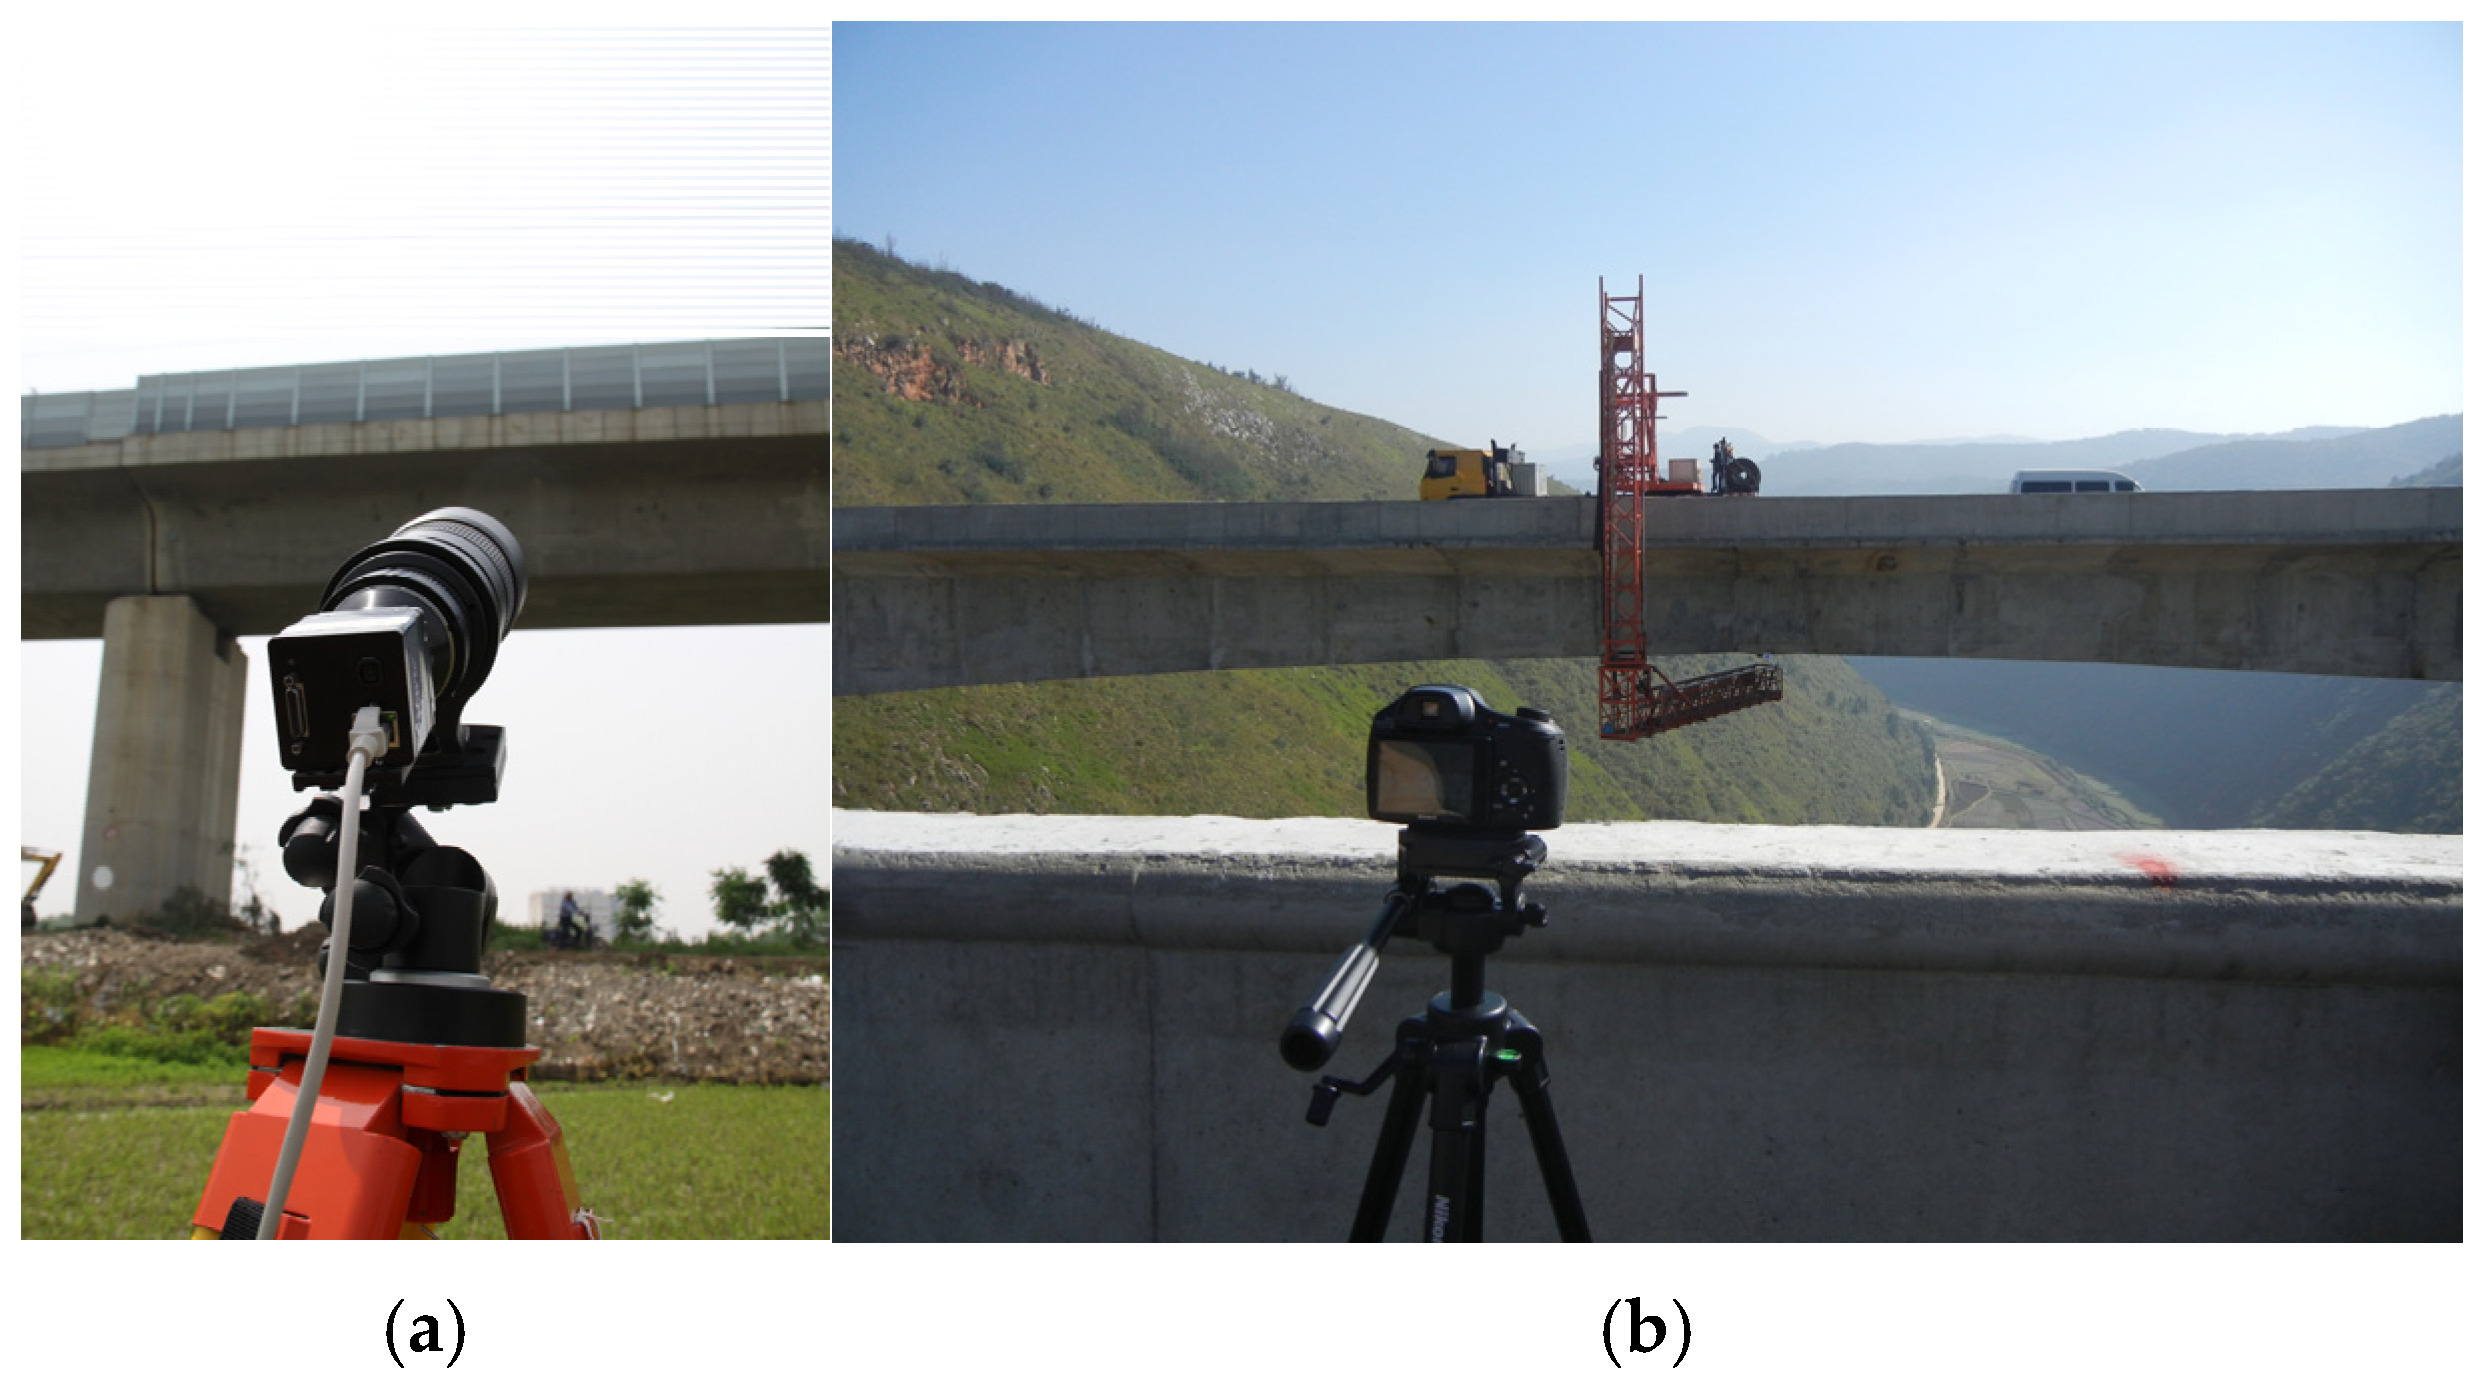
Deflection Monitoring of Bridge Structure. Monocular vision can measure bridge deflections or settlement by tracking marked points on a structure across video frames. Sun et al. (2012) [
22] developed a monocular photogrammetry based on the digital image correlation (DIC) technique for measuring the dynamic deflection of a high-speed railway bridge (
Figure 8) and a highway bridge (
Figure 10). In practice, many applications employ monocular depth estimation or template matching to quantify deformations. Overall, monocular methods for civil infrastructure offer the promise of quantitative 3D insights using widely deployed cameras.
Construction Site 3D Reconstruction. In civil structures, monocular metrology supports tasks like 3D reconstruction, displacement monitoring, and defect quantification. Recent work focuses on reconstructing 3D point cloud models of construction sites and structures from camera images. With known references or scene geometry, single-camera measurements can yield point displacements. Sun [
25] introduced a learning-based framework to reconstruct construction site point clouds from surveillance cameras. Their hierarchical system first uses sparse SfM on drone imagery to establish a base point cloud, then applies a deep neural network to dense surveillance images to generate 3D point clouds. These monocular-based reconstructions are aligned in real-world coordinates without requiring new calibration. The authors report that their method achieves continuous 3D reconstruction on site, with lower cost and higher automation than traditional LiDAR or offline SfM methods.
To summarize, in civil infrastructure, heterogeneous cameras and heterogeneous data sources amplify both scale and calibration errors. In road-damage sizing, varying intrinsics and partially known extrinsics make the pipeline from detection to measurement highly sensitive to error accumulation. Existing studies use inverse perspective mapping, lane width, track gauge, window size, or vanishing-point geometry as scale recovery strategies. These approaches remain limited by missing ground truth and scarce metric supervision. Robustness bottlenecks include cross-device deployment, sparse calibration information, and multistage error compounding. Most work reports point-estimate metrics, while uncertainty calibration is usually absent. A practical route is to combine multi-scale anchors, differentiable geometric optimization, and domain adaptation. Verifiable anchors such as track gauge, lane markings, road symbols, and repetitive sleepers can be injected into differentiable inverse perspective mapping (IPM) or differentiable bundle adjustment. The model can then jointly estimate scale, pose error, and intrinsic drift across devices. An uncertainty head should convert metric output from a single value to a calibrated interval. Evaluation should separate segmentation error, scale calibration error, and final metric error. It should also include cross-site, cross-line, and cross-camera tests.
2.5. Consumer Electronics
Mobile Metric Measurement. Apple’s “Measure” app is a culmination of Monocular Visual–Inertial Odometry (VIO) technology. It does not only rely on vision but using a Kalman Filter with fuses feature to track data from the monocular camera with high-frequency motion data from the IMU [
26]. The IMU provides rapid motion response gathering with double integration to obtain quick displacement, while the visual system corrects the IMU’s drift through plane detection and loop closure. In the iPhone Pro series, LiDAR data is also fused to further enhance accuracy in low light. Third-party validation studies indicate that in well-lit indoor environments, the Measure app’s Mean Absolute Error (MAE) for short distances is controlled under 3%. It successfully turns complex photogrammetry technology into a tool accessible to the public, making it the most widely deployed monocular metrology application in the world.
Food Calorie Estimation. To solve the inaccuracy of volume estimation in “photo-to-calorie” apps, Ma et al. proposed the MFP3D framework [
27]. Conventional monocular methods turn back to volume directly from 2D images, losing thickness information. MFP3D employs a multimodal strategy: first, it uses a depth-to-estimate network to generate a depth image from a single food picture; then, through a dual-stream feature extraction network, one stream extracts texture features from the RGB image, while the other uses PointNet++ to extract geometric characteristics from the point cloud; finally, it combines the two features to regress food volume. Tests on the MetaFood3D dataset showed that MFP3D significantly improved volume estimation accuracy compared to image-only methods. It demonstrated that even “pseudo-3D” point clouds generated from monocular images contain geometric structural cues crucial for volume regression, providing a new solution for automated precision nutrition assessment.
To summarize, in consumer applications, measurement performance is constrained by usability, scene diversity, and device variation. Mobile ranging tools depend on stable tracking, visible edges, and sufficient texture, so scale recovery is tightly coupled to device motion estimation. Food-portion estimation from a single RGB image suffers from missing 3D structure and weak real-scale information. Existing pipelines often rely on monocular depth, point-cloud reconstruction, and multimodal regression, but true metric size remains difficult to recover. Robustness bottlenecks include low texture, occlusion, specular surfaces, and cross-device intrinsic variation. A strong direction is to make user-visible reliability a core output. Mobile ranging systems can transform tracking statistics into measurement confidence intervals and display them directly. Food analysis systems can combine physical scale priors, differentiable camera calibration, and an uncertainty head to improve metric reconstruction. Additional modalities such as short video or text can supply missing scale cues.
2.6. Culture Heritage
Perspective Deconstruction and 3D Reconstruction for Painting. Criminisi’s team selected Antonello da Messina’s masterpiece “St. Jerome in his Study.” Since Renaissance painters strictly followed linear perspective, this painting can be considered as a monocular photo pictured in virtual world. Researchers determined the Principal Vanishing Point by extending lines from the floor tiles and calculated homograph matrices using geometric constraints from objects like books and steps [
28]. They both recover the 3D structure of the study in painting, and generate new viewpoints. The study revealed the secrets of how the painters distorted geometric proportions for visual aesthetics intentionally. Through the generated traveling videos, audiences may appreciate this classic painting from “God’s view” for the first time.
To summarize, in cultural heritage, the image itself may not represent a physically valid scene. Perspective consistency must be checked before any geometric measurement. Existing methods rely on vanishing points, vanishing lines, and planar homography for relative metrology, which reduces full calibration dependency but increases sensitivity to annotation quality and image resolution. Scale recovery is often relative or weakly anchored. Per-instance uncertainty calibration is rarely formalized. A useful path is to formalize uncertainty with Bayesian modeling and error propagation. Annotation uncertainty in vanishing structures can be propagated to geometric confidence intervals. Robust line detection, multi-hypothesis reconstruction, and ambiguity-set reasoning can replace single-solution interpretation. Evaluation should compare results with expert measurement, test robustness across styles and reproduction quality, and report how input quality affects geometric stability.
2.7. Forensic Science
Traffic Accident Speed Estimation. During traditional criminal surveys, recognizing the identity of a masked suspect in video often relies on biometric characteristics, while height is one of the most difficult values to disguise. Breakthroughs in monocular metrology depend on exploiting the geometric properties to recover the camera’s intrinsic and extrinsic parameters. Criminisi established a rigorous mathematical framework for “Single View Metrology.” The core of this method lies in using the “Cross-ratio Invariance” of projective geometry. In an uncalibrated monocular image, the researchers first compute the vanishing points and the vanishing line of the ground plane by detecting bundles of parallel lines in the scene [
29], in which geometric elements implicitly encode information such as the camera’s focal length and orientation. Once this data is collected, the algorithm can construct a homomorphism from the image plane to a vertical reference plane by introducing reference objects of known height. Specifically, their research demonstrates that determining the vertical vanishing point and vanishing line of the ground plane suffices to calculate the height ratio between any upright object in the image and the reference object. This technique enables forensic analysts to process surveillance footage retrieved days after an incident. Even when suspects occupy varying depths relative to the camera, their actual height can be precisely calculated through geometric derivation. With errors typically confined to the range of centimeters, this method has become the gold standard for image measurement in forensic science.
Surveillance Height Estimation. When examining methods for estimating speed from surveillance footage, many traffic accidents necessitate determining a vehicle’s speed immediately prior to collision. Traditional image-based speed measurement techniques typically assume a fixed frame rate (such as 25 fps or 30 fps) and calculate speed by measuring distance traveled within a unit of time. However, modern Digital Video Recorders (DVRs) predominantly employ Variable-Frame-Rate (VFR) technology. This technology causes significant deviations in calculations based on fixed-frame-rate assumptions, potentially leading to miscarriages of justice. To address speed estimation errors caused by unstable frame rates in digital footage, Epstein and Westlake proposed a comprehensive method integrating file forensics and visual metrology [
30]. This approach abandons reliance on nominal frame rates displayed by players, instead deeply analyzing metadata within the video container to precisely extract each frame’s Presentation Time Stamp (PTS), achieving microsecond-level timing accuracy. The research team employed “reverse-projection photogrammetry,” setting up cameras at precise locations at the incident site to recreate the surveillance camera’s viewpoint. By placing rulers or vehicles of known dimensions in the scene, they established an accurate mapping between pixels and physical distances. In an empirical case study of a fatal traffic collision, the team conducted a blind comparison between the vehicle’s average speed calculated using this method and the data extracted from the accident vehicle’s “Black Box”. The results revealed an average error of only ±2.3 km/h. This outcome demonstrates that in the analysis of monocular video evidence, the erroneous assumption of a ‘fixed frame rate’ must be abandoned. Instead, the integration of metadata timestamps with monocular spatial reconstruction can yield forensic evidence of extremely high confidence. The work of Epstein and Westlake reveals the pitfalls of monocular metrology within the temporal dimension. In his research work, failure to utilize the previously mentioned Presentation Time Stamps (PTSs) within metadata would result in excessively dynamic variations in frame intervals. Specifically, an actual 0.1 s interval might be erroneously interpreted as 0.033 s. Such misjudgments would lead to calculated velocity values three times higher than the actual value.
To summarize, in forensic metrology, the priority is explainability and traceable error bounds. Classical single-view methods recover affine distances from minimal projective cues and attach uncertainty through first-order error propagation. Case studies in speed estimation show that the pipeline is highly sensitive to video compression, pixel localization, timestamp fidelity, and assumptions about camera motion. Reverse-projection photogrammetry can improve metric estimation, but each step must remain auditable. This domain reports uncertainty more explicitly than many learning-based pipelines. A practical direction is to standardize the full measurement chain as an auditable probabilistic model. Geometric registration, pixel selection, and timestamp parsing can be optimized in one uncertainty-aware framework. A differentiable camera model, distortion correction, and robust key point detection can improve measurement stability while preserving interpretability. The output should include calibrated confidence intervals and sensitivity analysis. Validation should rely on external truth, such as radar or field measurements, then report coverage and robustness under compression and occlusion.
2.8. Cross-Domain Synthesis
Compared to previous approaches a decade ago, which rely solely on stereo vision or calibration methods, nowadays monocular metrology for road, highway and airport pavement applications is evolving towards deep learning-based geometric reconstruction (e.g., depth and size estimation of cracks and potholes) to achieve better performance, and towards combination with object detection techniques from standard RGB images to extract actionable defect indicators.
Table 1 provides a comparison that emphasizes the underlying measurement principle and the corresponding metric-scale characteristics. Although monocular metrology spans diverse domains, these applications converge into a limited number of recurring methodological families. Across these domains, the most fundamental distinction lies in how the metric scale is recovered.
Geometry-dominant methods, such as single-view projective metrology and calibrated pinhole modeling with known anchors, offer strong interpretability and clear physical meaning, but their performance is tightly constrained by scene structure, calibration quality, and anchor visibility. By contrast, learning-based monocular depth methods provide greater flexibility in visually complex environments and reduce the dependence on handcrafted geometric assumptions, yet they often recover only relative or weakly constrained scale and remain vulnerable to domain shift, texture ambiguity, and inconsistencies across devices and environments. Between these two paradigms, hybrid pipelines that combine learned depth, geometric anchors, photometric constraints, or multiview reconstruction are increasingly becoming the dominant practical solution, especially in transportation and infrastructure applications where both metric accuracy and operational robustness are required.
From a deployment perspective, the reviewed literature also reveals that the challenge of monocular metrology is not merely to infer geometry from images, but to produce measurements that are trustworthy under real operating conditions. In high-stakes settings such as endoscopic diagnosis, railway safety monitoring, structural inspection, and forensic analysis, the practical value of a method depends not only on its nominal accuracy, but also on the reliability of its scale calibration, its robustness to illumination and viewpoint changes, and its ability to remain stable under incomplete or imperfect observations. This means that deployment-ready monocular metrology should be understood as a system-level problem rather than a purely algorithmic one. Calibration, sensing configuration, environmental adaptation, uncertainty management, and computational efficiency must be considered jointly. In this sense, the most promising direction across domains is not the isolated improvement of any single model, but the construction of integrated measurement systems that combine interpretable physical constraints with adaptive data-driven inference.
More broadly, the cross-domain evidence reviewed in this paper suggests that monocular metrology contributes to smart cities and infrastructure not simply by providing low-cost measurement tools, but by advancing a broader paradigm of trustworthy AI-assisted decision support. The same issue appears repeatedly across application domains: reliable action requires not only prediction, but also quantified confidence, explicit assumptions, and transparent error sources. This insight provides a natural conceptual bridge to the second case study of this paper. While the monocular metrology literature focuses on measurement reliability in visual environments, the fuzzy portfolio literature addresses decision reliability under uncertainty in financial systems. Despite their different application contexts, both case studies point to the same methodological lesson: intelligent systems become truly useful only when accuracy, interpretability, and uncertainty-awareness are developed together rather than in isolation.
3. Challenges in Monocular Metrology
3.1. Depth Ambiguity and Scale Uncertainty
Past research indicates that monocular measurement inevitably loses certain dimensional information during projection, resulting in diminished accuracy for long-range 3D precision measurements. Furthermore, monocular spatial frame reconstruction (SfM) inherently suffers from scale ambiguity: its computational process preserves scale under similarity transformations, restoring structure and trajectory only to an unknown global scale. We cannot directly measure dimensions without external reference points. This characteristic is particularly critical in infrastructure inspection and medical measurement domains, as absolute dimensions constitute the core output for such applications.
3.2. Environmental Sensitivity
Early self-supervised deep learning modeling research relied upon photometric consistency, learning model features by minimizing the value of the projection loss function. However, in optically low-textured regions, photometric targets become a pathological problem, susceptible to interference from exposure variations, shadows, and specular reflections, leading to systematic biases in deep learning. Conversely, research on high-reflectivity bearing ball detection demonstrates that when material reflectivity dominates the imaging process, the system’s robustness remains constrained by observability unless sensor geometry and illumination conditions are deliberately engineered.
3.3. Computational Efficiency
When considering computational efficiency, achieving high accuracy in monocular measurement often demands substantial computational resources. This imposes significant constraints on real-time and on-site applications. However, existing advanced methods may involve large-scale deep neural networks or iterative optimization procedures, such as bundle adjustment, which also require considerable computational resources and time. Our earlier research demonstrated that through careful algorithmic design, such as processing high-resolution images with low latency, real-time performance can be achieved on limited hardware. Nevertheless, in practical applications, existing monocular systems often struggle to simultaneously deliver both high accuracy and real-time responsiveness. Algorithms that relentlessly pursue precision may become impractical due to excessively slow computation. The critical challenge remains how to strike a balance or enhance accuracy trade-offs to improve computational efficiency. This research topic is paramount for driving the widespread adoption of monocular measurement technology in time-sensitive field applications.
3.4. Data Scarcity and Domain Generalization
In terms of data availability and generalization capability, monocular measurement methods also present significant challenges. Numerous AI-driven research approaches rely on supervised learning using large-labeled datasets. However, in real-world applications, acquiring genuine measurement data across diverse environments proves costly, time-consuming, and labor-intensive. Due to limitations in cross-domain generalization caused by variations in appearance and scale, neural network models trained in one domain often perform poorly when directly applied to entirely different domains. Developing monocular algorithms capable of adapting to new scenes with minimal retraining or calibration remains an unsolved challenge. In current research, self-supervised learning has emerged as a partial solution. By leveraging geometric cues from unlabeled video, depth estimation models can be trained without explicit ground truth. Nevertheless, a significant challenge persists: these models may struggle when the visual features of the target environment differ markedly from the training data.
3.5. Limited Integration of Model-Based and Data-Driven Approaches
In monocular measurement techniques, a gap persists between geometry-based workflows and deep learning approaches. These are often executed in series rather than through collaborative design methods. That is, networks output depth or features which are then refined by geometry models; end-to-end models may neglect hard constraints, undermining physical plausibility. This separation leads to suboptimal interfaces, cumulative errors, and constrained end-to-end optimization. While our research on endoscopic-scale reconstruction has explored adding photometric constraints to SLAM or training deep CNNs, few studies integrate both approaches simultaneously. A similar divergence is evident in reflective surface detection. Consequently, we propose that future progress may require hybrid frameworks merging analytical geometry, physics, and learning theory.
4. Future Perspective for Monocular Metrology
4.1. Deep Learning and End-to-End Solutions
From the preceding sections, it is evident that deep learning and end-to-end approaches hold promise for resolving the longstanding issue of scale ambiguity in monocular depth measurement. By training on large datasets with known distances, deep neural networks can directly infer absolute depth, reducing reliance on manual calibration. Furthermore, end-to-end frameworks integrate feature extraction, depth prediction, and measurement into a single model, enhancing overall consistency. Such models employ high-capacity architectures like transformers to simultaneously capture local details and global context, thereby inferring missing scale cues from scene context. We propose that current research may further enhance accuracy by incorporating learned priors and geometric constraints (e.g., enforcing luminance consistency), thereby achieving robust monocular measurement techniques with true metric outputs. Moreover, compared to purely geometric pipelines, these models can learn semantic cues to further resolve the inherent scale ambiguity in single-view geometry.
4.2. Multi-Sensor Data Fusion
From past research, we know that integrating monocular vision with auxiliary sensors is a key method for overcoming the challenge of detecting complex environmental factors. When visual systems fail in scenarios such as low light or lack of texture, fusion between cameras and either an Inertial Measurement Unit (IMU) or liDAR can produce robust measurement results. By integrating data through filters or deep neural networks, the system leverages the strengths of each sensor: for instance, the IMU provides short-term scale and orientation information, while LiDAR offers absolute depth references, thereby stabilizing and extending monocular outputs. Such fusion techniques also exhibit redundancy: when one modality malfunctions, others can compensate, enhancing overall reliability. Therefore, we recommend continued research into real-time fusion algorithms and calibration techniques for tightly coupled modalities. These approaches ensure precise measurement capabilities across diverse environments while reducing sensitivity to variations in lighting or weather conditions.
4.3. Algorithmic Optimization and Real-Time Performance
As many state-of-the-art methods still involve computationally intensive operations, such as global beamforming steps for refinement and extremely deep models, they often prove challenging to implement on edge devices. Consequently, achieving real-time performance is critical for certain practical applications of monocular metrology, making computational efficiency a priority for future research. Current studies remain focused on substantially reducing algorithmic complexity while maintaining accuracy, particularly for high-resolution or high-density reconstruction tasks. Known approaches include accelerating feature matching and geometric computations through parallel processing, alongside leveraging sparsity properties. Lightweight network architectures and model compression techniques are advancing the feasibility of onboard inference. Future research will delve deeper into achieving real-time, precise field measurements through integrating optimized algorithms with hardware acceleration technologies.
4.4. Self-Supervised Learning and Generalization
Monocular measurement methods must generalize across diverse conditions, yet collecting substantial annotated data for every scenario proves impractical. Consequently, self-supervised learning and domain adaptation have emerged as pivotal techniques. For instance, by leveraging geometric and photometric consistency within videos, networks can synthesize neighboring-frame viewpoints as supervisory signals. This enables learning of depth information without requiring ground truth labels, substantially reducing data requirements. Concurrently, domain adaptation techniques strive to mitigate performance degradation when models are deployed to novel environments. Researchers are also exploring how to synthesize data generation techniques to cover extreme or rare cases. These strategies hold promise for enhancing the robustness and adaptability of monocular models, enabling them to better cope with real-world variability.
4.5. Standardization and Practical Deployment
In today’s complex environment, enhancing the reliability and integration of monocular measurement technology in practical applications is paramount. This entails establishing standardized calibration procedures and benchmark datasets to ensure consistent performance evaluation across studies. User confidence can be bolstered by providing measurements with known error ranges, alongside self-calibration and uncertainty quantification techniques. Future system development should prioritize seamless deployment, featuring intuitive software and cost-effective hardware to guarantee long-term stable operation without frequent recalibration. By addressing these practical considerations and fostering cross-disciplinary collaboration, monocular measurement solutions can transition from research tools into industry-trusted instruments.
6. Fuzzy Portfolio Models of Financial Assets
Fuzzy portfolio models have been extensively studied as effective tools for decision-making under uncertainty, particularly when financial returns, risks, and constraints are imprecise and defined in linguistic terms. Over the past two decades, two distinct yet interrelated research paradigms have emerged: statistically validated fuzzy portfolio models and performance-driven fuzzy random portfolio optimization (FRPO). To distinguish the distinct tracks within the field, it is necessary to examine not just the methods used, but the underlying philosophy behind data processing and application. Several early studies by Lin and co-authors focused on statistical hypothesis testing and probability distribution modeling for fuzzy data. These studies are relevant to the present review because they provide foundational statistical tools for validating fuzzy data used in portfolio decision-making.
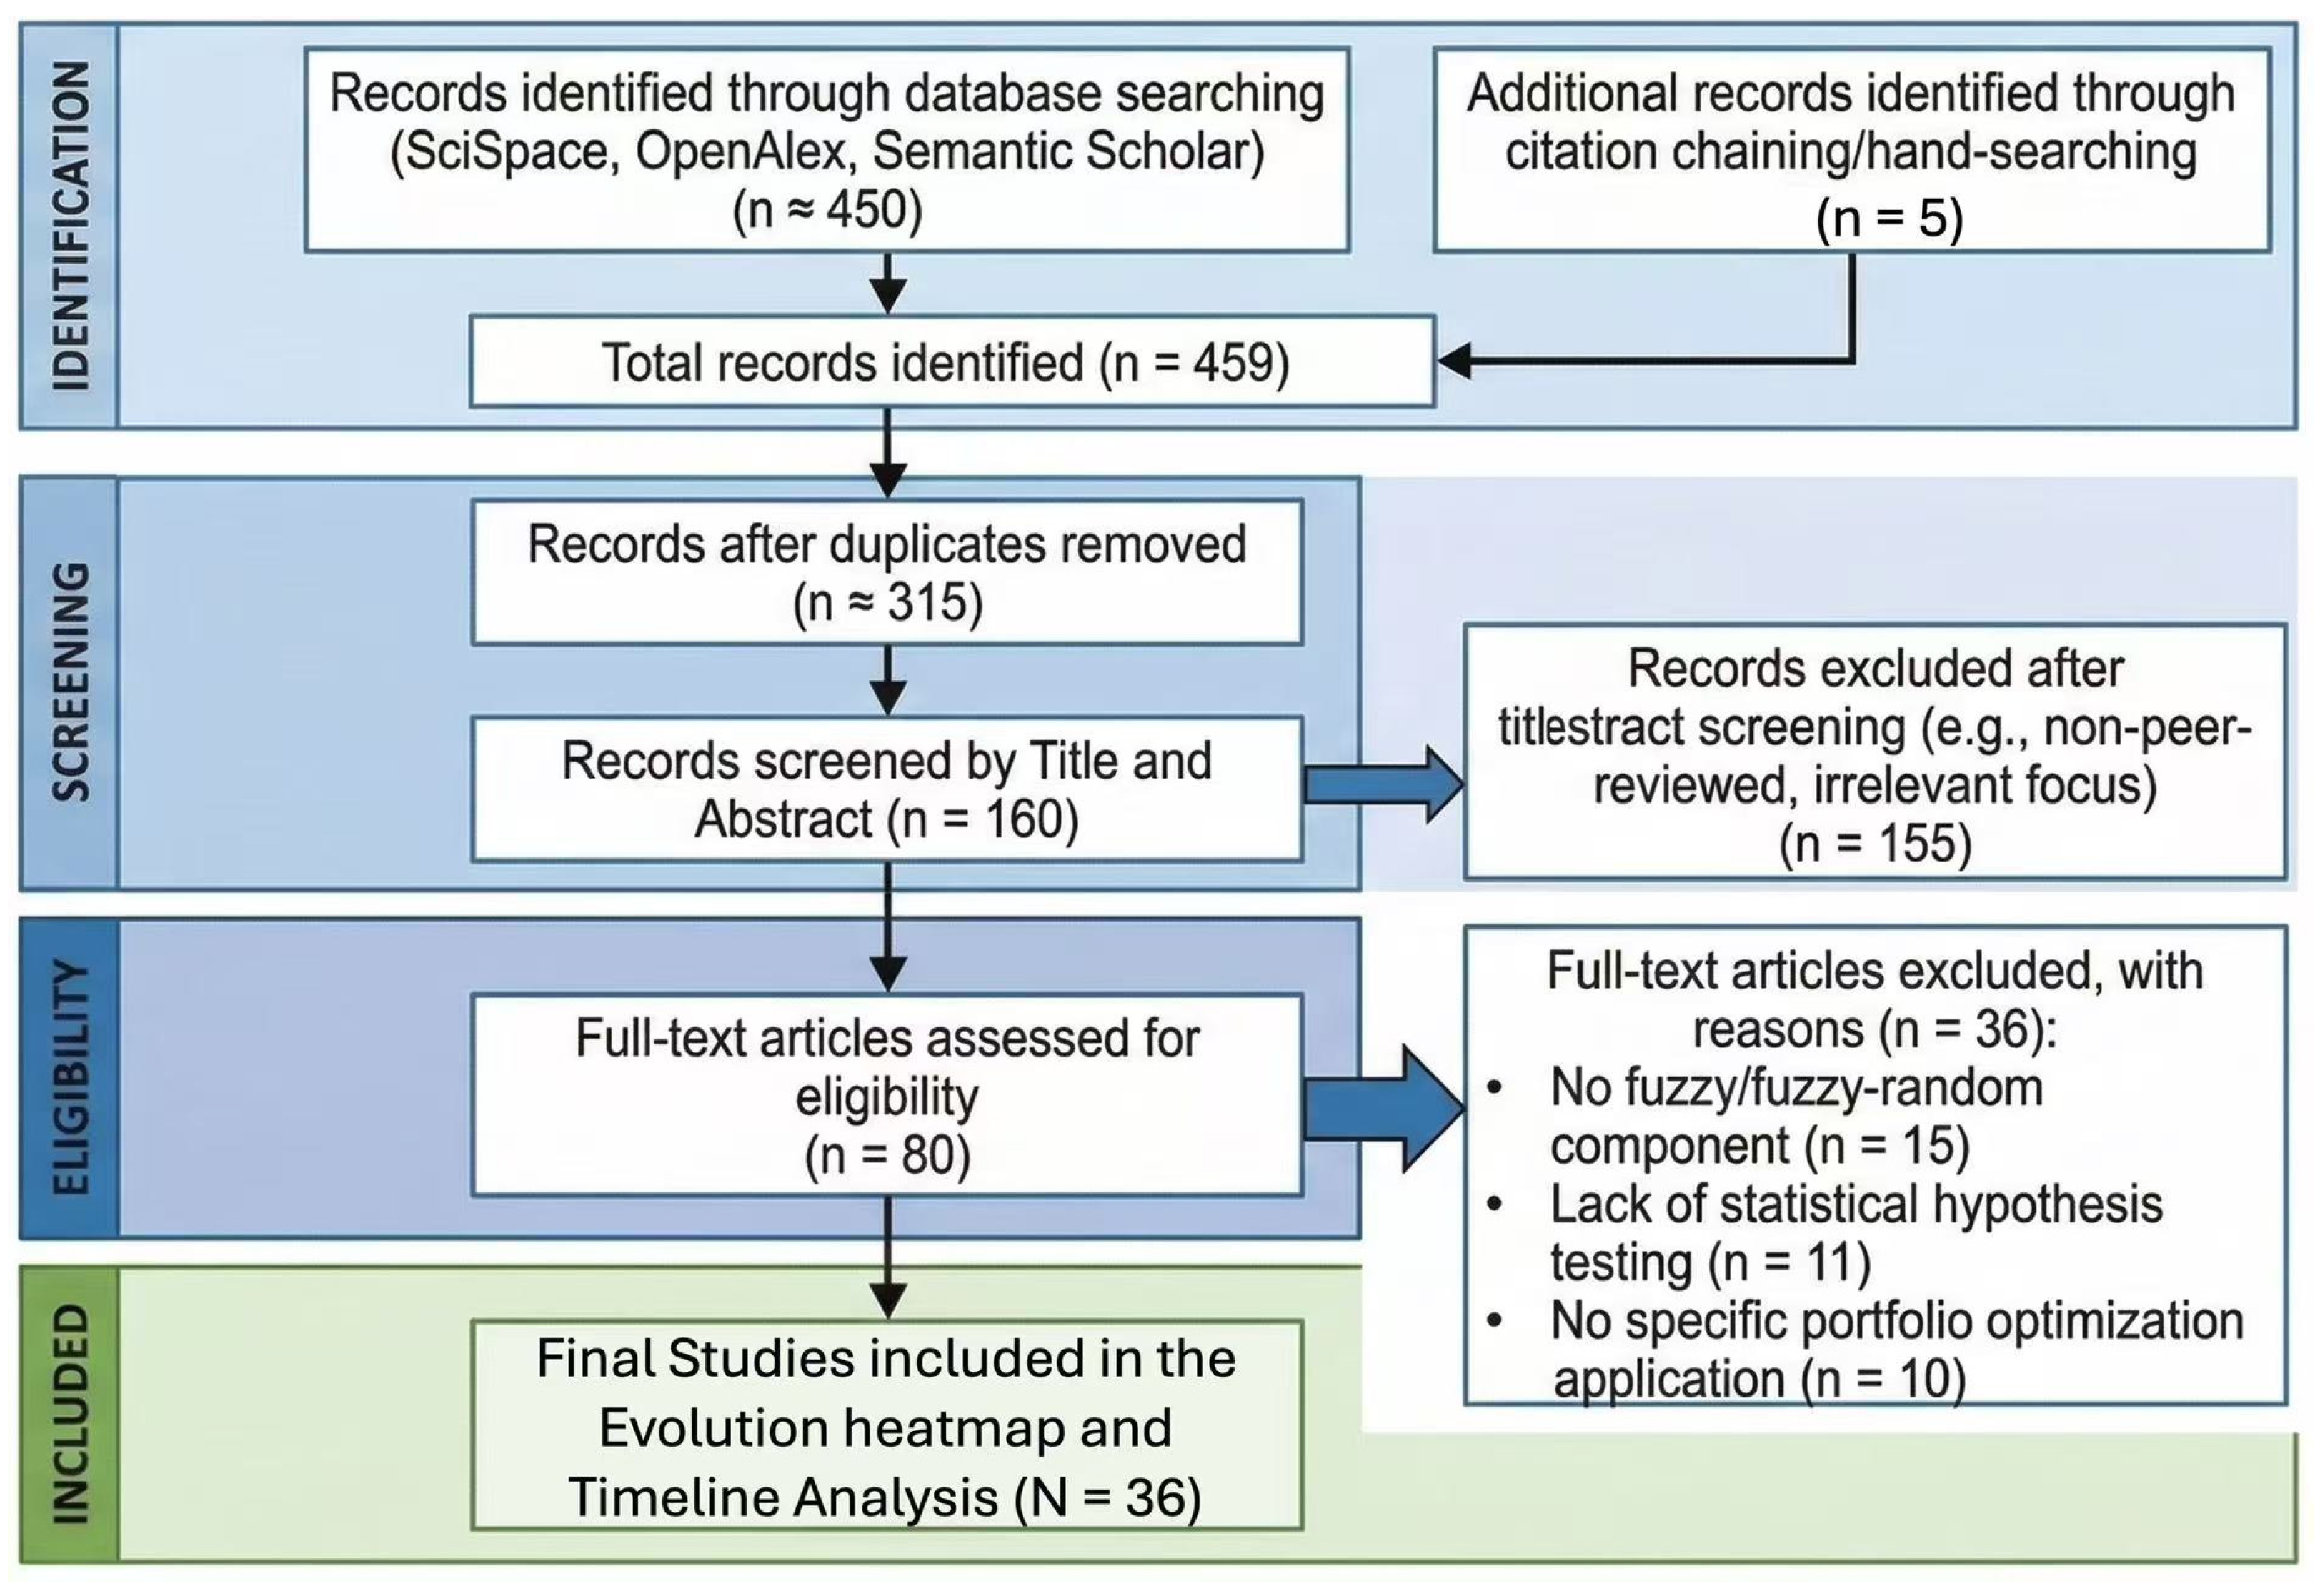
This study provides a rigorous literature review based on the PRISMA (Preferred Reporting Items for Systematic Reviews and Meta-Analyses) flow diagram and highlights the methodological gaps between data reliability and computational optimization through systematically comparing these two research fields. We propose the necessity of integrating fuzzy statistical validation mechanisms into the FRPO model and provide a structured instance for researchers to develop reliable, interpretable, and high-performance FRPO frameworks.
6.1. Literature Search Methodology
To ensure comprehensive coverage of recent developments in fuzzy portfolio optimization, the relevant literature was identified using the SciSpace academic search platform, which leverages NLP-based semantic search across a corpus of over 280 million papers. Our search query focused on the intersection of “Fuzzy/Fuzzy random Portfolio Optimization” and “Statistical Hypothesis Testing.” The selection process followed a multistage screening: initial identification based on semantic relevance, followed by a quality filter requiring JCR/SJR ranking (Q1/Q2), and a final eligibility check for mathematical contribution.
Figure 11 illustrates the PRISMA flow diagram for the literature selection process, encompassing identification, screening, and eligibility (inclusion/exclusion criteria), ultimately identifying 36 studies ([
65,
66,
67,
68,
69,
70,
71,
72,
73,
74,
75,
76,
77,
78,
79,
80,
81,
82,
83,
84,
85,
86,
87,
88,
89,
90,
91,
92,
93,
94,
95,
96,
97,
98,
99,
100]) for discussion in this paper.
We can see that the initial identification phase not only utilized the SciSpace academic search platform but also incorporated manually retrieved documents to ensure comprehensive coverage of historical and global contexts. The additional research works are on the topics of fuzzy hypothesis analysis [
70,
71,
77], foundational axiomatic works (e.g., [
97,
100]), and recent advances in explainable fuzzy systems from 2026 [
98]. Also, the future fuzzy decision-making methods are discussed in the papers [
96,
99]. Ultimately, 36 studies focusing on the intersection of fuzzy optimization and statistical validation were selected.
Note that SciSpace employs a semantic search engine rather than merely matching keywords. This means that we should give some criteria to ensure getting a rigorous and reproducible literature review. The criteria for selecting 31 core papers from SciSpace are as follows:
Search Query: Evolution of fuzzy and fuzzy random portfolio optimization models with statistical hypothesis testing.
Search Date: From 2000 to 2025.
Primary Keywords: Fuzzy portfolio optimization, fuzzy random variables, credibility theory, Entropy Risk, Type-2 fuzzy sets.
Inclusion Criteria: Peer-reviewed journal articles; published between 2000 and 2025; proposes a mathematical optimization model for assets under uncertainty.
Exclusion Criteria: Purely qualitative reviews; papers without fuzzy/fuzzy random; lack of statistical hypothesis testing; no specific portfolio optimization; non-English publications.
6.2. From Fuzzy Data to Fuzzy Random and Type-2 Fuzziness
In this subsection, we examined how fuzzy and fuzzy random portfolio models differ in terms of data representation, statistical validation, data handling strategies, portfolio modeling philosophy, and application focus. Based on a comparative study of 36 representative papers, two dominant research paradigms clearly emerge: statistical validation-oriented fuzzy portfolio modeling and optimization performance-driven fuzzy random portfolio optimization (FRPO). Within these two paradigms, we also discuss the papers that used the Classical Fuzzy Portfolio models and the emerging fuzzy decision methods. It is hard to say that these methods belong to statistical validation-oriented fuzzy portfolio modeling or FRPO Algorithms, because in the processes of building Classical Fuzzy Portfolio models, these methods use credibility measures to define the models (it considers statistics in the processes but does not use statistical hypothesis tests). Also, the Emerging Fuzzy Decision System has considered hybrid decision methods, even in data-type or model-building methods.
Lin and her collaborators [
70,
71,
73,
77] predominantly employ Type-1 fuzzy data such as defined in descripted membership functions [
73], and continuous membership functions such as interval fuzzy numbers [
73,
77], triangular fuzzy numbers [
70], trapezoid fuzzy numbers [
77] or Fuzzy Probability Distribution Functions (FPDF) [
71] to represent uncertainty in returns, risks, or demands. These representations assume that membership functions are known with sufficient confidence and focus on modeling imprecision at a significant level. In contrast, modern FRPO studies [
78,
79,
80,
81,
82,
83,
84,
85,
86,
87,
88,
89,
90,
91,
92,
93,
94,
95] increasingly adopt fuzzy random variables, possibilistic–probabilistic hybrids, and interval-valued fuzzy returns to capture both randomness and fuzziness simultaneously. For instance, some models assume purely fuzzy returns (possibilistic/fuzzy) [
79,
80,
89,
94], while others explicitly model returns as fuzzy random variables—capturing randomness (stochasticity) plus fuzziness (imprecision) [
81,
82,
83,
86,
88,
90,
92,
93,
95]—and use fuzzy/possibilistic returns without an explicit random component. Instead of classical variance-based risk, more recent research works incorporate entropy [
81], VaR [
87], semi-variance [
84], WCVaR [
93], or multi-criteria metrics (return, risk, liquidity, diversification).
Because fuzzy or fuzzy-random models typically generate non-convex/non-linear optimization problems, researchers employ meta-heuristics or heuristic methods such as genetic algorithms [
81,
85,
91], PSO [
78], simulated annealing [
80], NSGA-II [
82], hybrid heuristics [
92], or, where feasible, converting to deterministic equivalents [
79,
89,
90,
94]. Additionally, several studies have incorporated real-world portfolio constraints-transaction costs, position limits, minimum trade sizes, liquidity, investor preference modeling, and multi-period rebalancing [
84,
85,
86,
91,
92]. Some of the above research works integrate fuzzy returns with background probabilistic risk or randomness (hybrid models), such as (possibility + probabilistic background risk) [
90] or (random fuzzy returns + robust programming) [
89]. These models aim to better capture the uncertainties of ambiguity (fuzziness) and randomness (random noise) present in the real world.
In the fields of FRPO, the researchers also often considered fuzzy decision modelling. They employed various data types to represent uncertainty in financial returns and decision-making environments. For instance, FRPO models proposed by Mehlawat and Gupta [
66], Huang [
74], and Vercher et al. [
75] extend traditional mean–variance portfolio theory into fuzzy environments. They employed classical fuzzy data or fuzzy return representations, modelling asset returns through fuzzy numbers or membership functions to reflect imprecise market information. Similarly, Bonacic et al. [
68] and Zhou et al. [
81] optimize portfolio selection by combining fuzzy return data with entropy-based diversification measures. Other studies employ probabilistic fuzzy representations, modelling uncertainty through probability distributions rather than likelihood distributions, as demonstrated by Carlsson et al. [
69] and Zhang et al. [
67].
In addition, fuzzy decision-based frameworks are used in portfolio management problems such as portfolio rebalancing under transaction costs proposed by Fang et al. [
72]. We also found that some research works also rely on broader uncertainty modeling frameworks, such as uncertainty theory introduced by Liu [
76], which provides an alternative mathematical foundation for handling uncertain information beyond classical probability theory. Meanwhile, extensions of fuzzy portfolio modeling include higher-moment fuzzy return models, such as the mean–variance–skewness framework developed by Li et al. [
78].
Beyond financial portfolio applications, several studies address fuzzy data in general decision-making and intelligent systems contexts. For example, Trillo et al. [
96,
99] discuss fuzzy decision-making frameworks and emerging research challenges, while Trillo et al. [
98] apply fuzzy-based optimization within explainable artificial intelligence for medical data classification. Earlier foundational work by Sánchez [
97] introduces random setbased methods for identifying fuzzy models, and Liu [
100] proposes fuzzy random chance-constrained programming to model hybrid fuzzy-random uncertainty. In summary, these studies collectively reveal the diversity of data representation, including fuzzy numbers, possibilistic distributions, fuzzy random variables, and uncertainty theory, to capture the fuzziness and uncertainty inherent in portfolio optimization and decision-making models.
This shift reflects the increasing complexity of the financial environment, where uncertainty stems both from random market behavior and human subjective judgment. The latest methodological extensions represented by Watada et al. [
65], which explicitly model uncertainty by introducing Type-2 fuzzy sets and linguistic variables, point towards new avenues for higher-order fuzzy representations.
6.3. A Diminishing Yet Crucial Component: Statistical Hypothesis Testing
From the theoretical definitions of these two research fields, we can see that the biggest difference between them is whether the processes use statistical hypothesis testing. In research works [
70,
71,
73,
77], the researchers systematically integrated fuzzy statistical tests, including the fuzzy chi-squared test, Kolmogorov–Smirnov test, ANOVA, and goodness-of-fit tests into different applications. The researchers emphasized the necessity of verifying fuzzy data distributions and model assumptions before making decisions.
While recent research works in FRPO [
78,
79,
80,
81,
82,
83,
84,
85,
86,
87,
88,
89,
90,
91,
92,
93,
94,
95] have not employed statistical hypothesis testing methods, whether fuzzy hypothesis testing or traditional hypothesis testing. Instead of giving hypothesis testing, the researchers prefer to optimize outcomes, robustness, and computational efficiency. Although this transformation can handle large-scale, multi-period, and multi-objective problems, it often leads to losing the information of data credibility and interpretability. This is because the statistical properties of fuzzy or fuzzy random inputs are rarely observed.
Consequently, these fields require the axiomatic foundations of uncertainty theory [
76] and the statistical validation tools (such as the FHT [
70,
71,
73] and the K-S test [
71,
77]) to ensure the reliability of the data. On the other hand, the evolution of PRPO can be characterized by a shift from foundational utility theory to complex statistical verification. This trajectory began with the possibilistic utility approaches of Carlsson et al. [
69], who first addressed the subjective nature of investor preferences. Also, Liu [
76] significantly enhanced their method by using the Uncertainty Theory, which provides the axiomatic credibility measures that replaced traditional, and often inapplicable, probability assumptions in fuzzy environments. Huang [
74] emerged with these theories through the mean-variance frameworks and Li et al. [
78] sought to capture higher-order moments of fuzzy returns by the mean-variance-skewness models. Their models were further refined by Vercher et al. [
75], who focused on downside risk measures, and Fang et al. [
72], who integrated real-world transaction costs into fuzzy rebalancing models. In the above research works, they have considered statistical verification in their PRPO processes but still have not considered statistical hypothesis testing. Furthermore, in the second decade of the 21st century, we saw a move toward multi-objective complexity and hybrid risk metrics. Mehlawat and Gupta [
66] demonstrated how credibility measures can be used to model multi-objective constraints in emerging markets, while Zhang et al. [
67] combined possibilistic mean–semivariance with entropy to handle multi-period selection. Meanwhile, Bonacic et al. [
68] have successfully employed fuzzy entropy to achieve superior diversification effects in the highly volatile digital-asset sector. From the above research, we can observe that despite such robust progress in optimization modeling, critical gaps remain in the statistical validation of underlying fuzzy parameters.
Moreover, whilst studies [
66,
67,
68,
69,
72,
74,
75,
76,
78] demonstrate excellence in addressing portfolio problems, they often assume fuzzy distributions as given conditions. Consequently, the research works by Lin and collaborators in [
70,
71,
73] bridge this gap by introducing FHT. Their methodology involves establishing a statistical verification hierarchy prior to optimization. This concept not only strengthens the axiomatic foundation of Liu’s [
76] work but also refines the structural models of Zhang [
67] and Melawatt [
66], propelling the field towards a more empirical and verifiable framework.
6.4. Data Handling and Processing Techniques
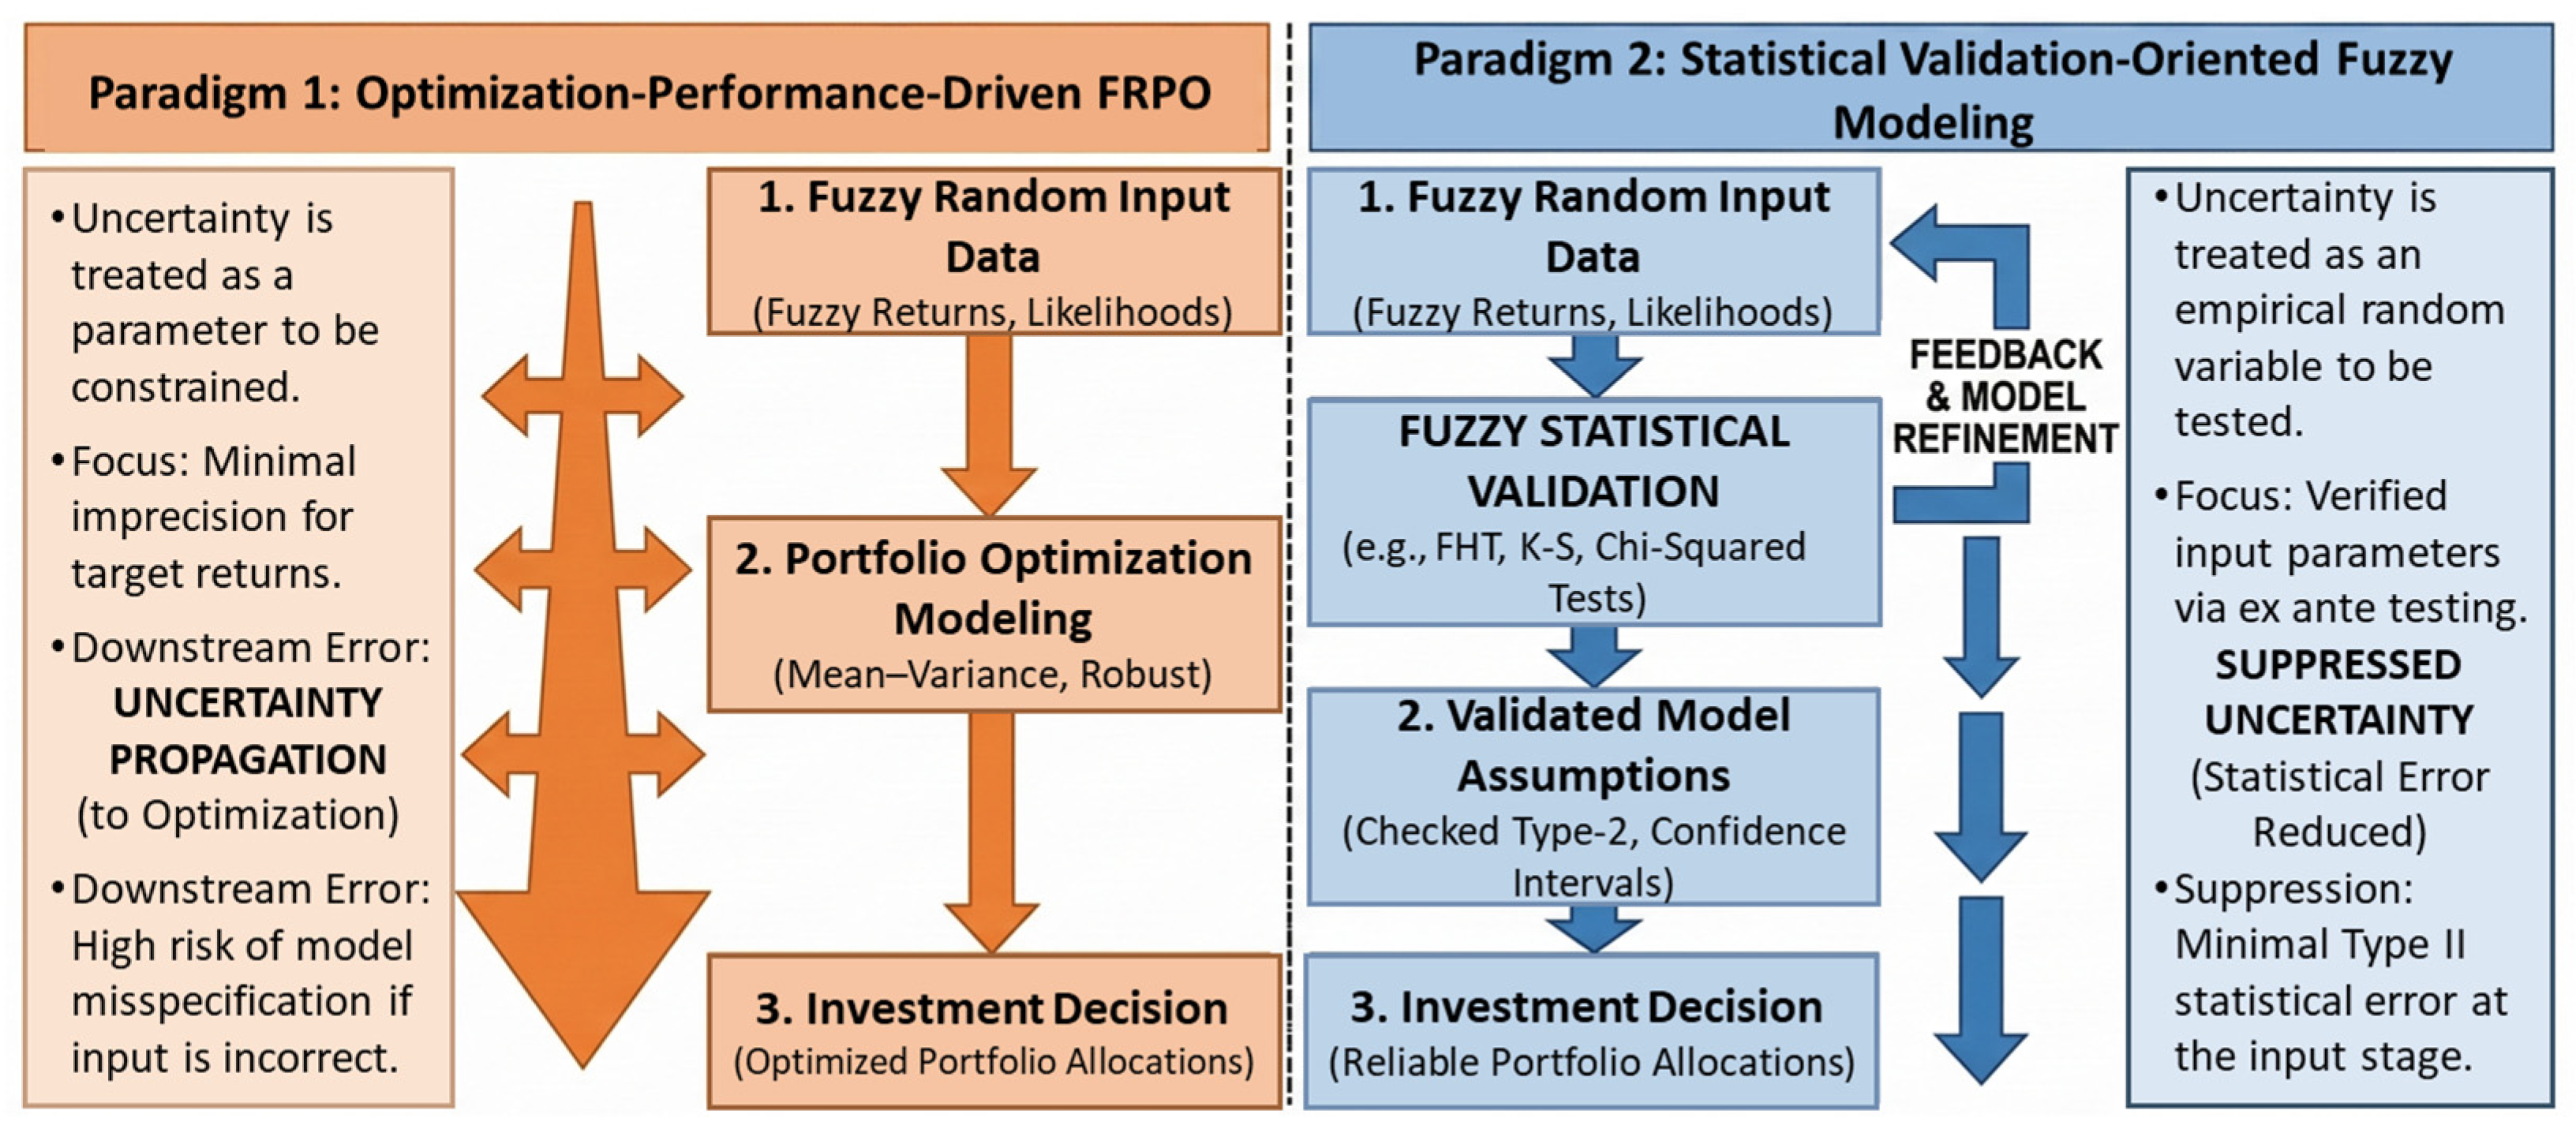
From a data processing perspective, we provided a theoretical distinction and comparative analysis of two paradigms in
Figure 12 to clarify how uncertainty traceability occurs in each step. Paradigm 1, on the left-hand side of
Figure 12, treats uncertainty as an optimization parameter. This methodology focuses on managing uncertainty at the decision point. It means that if the input specifications (fuzzy interval data) are in error, that will directly undermine the decision surface (portfolio efficient frontier), potentially leading to elevated out-of-sample regret values. Conversely, on the right-hand side of
Figure 12, Paradigm 2 treats uncertainty as empirical random variables requiring rigorous prior verification. This approach employs fuzzy statistical tests (K-S test, chi-squared test) to minimize Type II statistical errors, thereby preventing the failure to reject spurious fuzzy models.
From the research works [
70,
71,
73,
77], we can see that the authors primarily relied upon fuzzification techniques, α-cut operations, centroid methods, and fuzzy probability density estimation. These approaches aim to transform fuzzy information into analyzable formats while maintaining data interpretability through statistical hypothesis testing. Additionally, establishing formalized statistical confidence levels enables validation of the validity of fuzzy input parameters. This validation step not only suppresses the propagation of model misattribution errors downstream but also enhances the reliability of the entire optimization process.
There are some theoretical research works that may consider both paradigms, such as Carlsson et al. [
69], who introduced a possibilistic framework that converts fuzzy return information into utility-based portfolio evaluation. Meanwhile, Huang [
74] handled fuzzy asset returns through extensions of the classical mean-variance model using fuzzy numbers. Vercher et al. [
75] processed fuzzy return data by incorporating downside risk measures, enabling the evaluation of portfolio performance under asymmetric risk conditions. In addition, Li et al. [
78] extended the data processing framework by integrating higher statistical moments, developing a mean-variance-skewness model to better capture the characteristics of fuzzy financial returns. Despite establishing foundational formulas, these research endeavors omitted certain analytical components throughout the processes of both paradigms.
In recent FRPO models [
66,
67,
68,
69,
72,
74,
75,
76,
78,
79,
80,
81,
82,
83,
84,
85,
86,
87,
88,
89,
90,
91,
92,
93,
94,
95,
96,
97,
98,
99,
100], most researchers have adopted more diverse and sophisticated techniques, such as entropy-based measures, opportunity constraints, VaR and CVaR extensions, behavioral fuzzy modelling, and metaheuristic-driven evaluation. For example, Mehlawat and Gupta [
66] employed credibility theory to convert fuzzy returns into deterministic equivalents within a mathematical programming framework. Bonacic et al. [
68] utilized entropy measures to process fuzzy information for diversification and risk evaluation. Zhang et al. [
67] proposed a possibilistic mean-semivariance-entropy model that processes fuzzy return data within a multi-period portfolio optimization framework, incorporating transaction costs and temporal investment dynamics.
Other studies focused on decision-theoretic processing of fuzzy data, such as the portfolio rebalancing model proposed by Fang et al. [
72], which applies fuzzy decision theory to handle uncertain market conditions and transaction costs. Beyond portfolio optimization, several works provide broader data processing methodologies for uncertain information. Sánchez [
97] proposed a random set-based method for identifying fuzzy models, offering a systematic approach for representing imprecise data, while Liu [
76] introduced uncertainty theory as an alternative mathematical framework for modeling uncertain variables. Moreover, Liu [
100] developed the concept of fuzzy random variables and chance-constrained programming, which enables the integration of randomness and fuzziness in optimization models. Although the above approaches enhance optimization efficiency and adaptability, they frequently obscure the original fuzzy semantics. This makes it difficult to trace how data uncertainty propagates within the model. Consequently, the results produced by the model cannot be used to express the original fuzzy semantics.
We observe that in recent research, an increasing number of scholars are exploring advanced data processing paradigms within fuzzy decision systems and intelligent applications. For instance, Trillo et al. [
96,
99] examined emerging trends and methodological challenges in fuzzy decision frameworks. Additionally, Trillo et al. [
98] integrate adaptive optimization with explainable artificial intelligence to address uncertain data in medical classification problems. These studies demonstrate that data processing techniques within fuzzy portfolio research have evolved from fundamental fuzzy number representations towards more sophisticated frameworks. These encompass the fusion of entropy measures, credibility theory, random set modelling, and hybrid uncertainty representations. Such research advancements consequently enhance the robustness and interpretability of decision models operating within uncertain environments.
6.5. Validation Versus Performance in Portfolio Modeling
When examining the methodologies proposed in the literature [
65,
66,
67,
68,
69,
70,
71,
72,
73,
74,
75,
76,
77,
78,
79,
80,
81,
82,
83,
84,
85,
86,
87,
88,
89,
90,
91,
92,
93,
94,
95,
96,
97,
98,
99,
100] concerning the validation and performance of portfolio modeling, we observe that studies [
70,
71,
73,
77] frequently treat portfolio selection as a decision-making problem under uncertainty where statistical testing is regarded as a prerequisite for decision optimization. Many classical fuzzy portfolio models focus on improving the efficiency and robustness of portfolio allocation under uncertainty. For example, Carlsson et al. [
69] proposed a possibilistic portfolio model that evaluates asset allocation through a utility-based framework, emphasizing decision performance rather than empirical validation of fuzzy parameters. Similarly, Huang [
74], Vercher et al. [
75], and Li et al. [
78] extend traditional portfolio theories, such as mean–variance, downside risk, and higher-moment models, into fuzzy environments, with the primary objective of improving portfolio risk–return performance under imprecise financial data. In addition, Mehlawat and Gupta [
66] developed credibility-based and multi-objective fuzzy optimization models that transform fuzzy returns into solvable mathematical programming formulations, focusing on optimization efficiency and trade-offs between risk and return. Moreover, Zhang et al. [
67] introduced a multi-period possibilistic mean-semivariance-entropy model incorporating transaction costs, while Fang et al. [
72] addressed dynamic portfolio rebalancing using fuzzy decision theory to improve long-term investment performance.
In contrast, the research works in FRPO [
66,
67,
68,
69,
72,
74,
75,
76,
78,
79,
80,
81,
82,
83,
84,
85,
86,
87,
88,
89,
90,
91,
92,
93,
94,
95,
96,
97,
98,
99,
100], have largely focused on computational optimization problems for portfolio selection. The pivot is mostly on examining the performance metrics such as risk minimization, return maximization, robustness, and efficiency. In the above research works, portfolio feasibility and solution quality are primarily evaluated through numerical experiments rather than statistical validation. We observe that recent portfolio research works have moved toward algorithm-driven approaches. Although the algorithm-driven PRPO modeling could result in good performances, it still lacks statistical validation to support real applications. We found that some research works have considered more theoretical frameworks that also support performance-driven modeling, such as Liu [
76], who proposed uncertainty theory to support their model performances. Also, Liu [
100] introduced the concept of fuzzy random chance-constrained programming, which provides mathematical tools for constructing optimization models under hybrid uncertainty. In contrast, methodological studies such as Sánchez [
97] focus on identifying fuzzy models using random-set approaches, contributing to model representation rather than portfolio performance evaluation.
More recent works extend fuzzy decision modeling toward broader intelligent decision systems, where optimization effectiveness and interpretability remain central objectives. For example, Trillo et al. [
96,
98,
99] analyze emerging trends and challenges in fuzzy decision-making frameworks and integrate adaptive optimization with explainable artificial intelligence for decision support under uncertain data environments.
Overall, these studies illustrate that the majority of fuzzy portfolio research prioritizes optimization performance and decision quality, while formal statistical validation of fuzzy data remains comparatively limited, highlighting an important methodological gap in the existing literature.
7. Challenges in Fuzzy Portfolio Models
From an application perspective, the two research fields show that previous research works demonstrated a broader methodological scope by extending fuzzy statistical techniques to portfolio risk assessment, income analysis, consumer demand, and facility location problems. This illustrates the diversity of fuzzy statistical methods beyond finance. However, the FRPO research works have narrowed their focus to financial portfolio optimization by addressing practical constraints such as transaction costs, multi-period investment horizons, behavioral preferences, and tail risk measures. Although the depth of application in those research works has increased, the diversity of methodologies, particularly in statistical validation, has diminished.
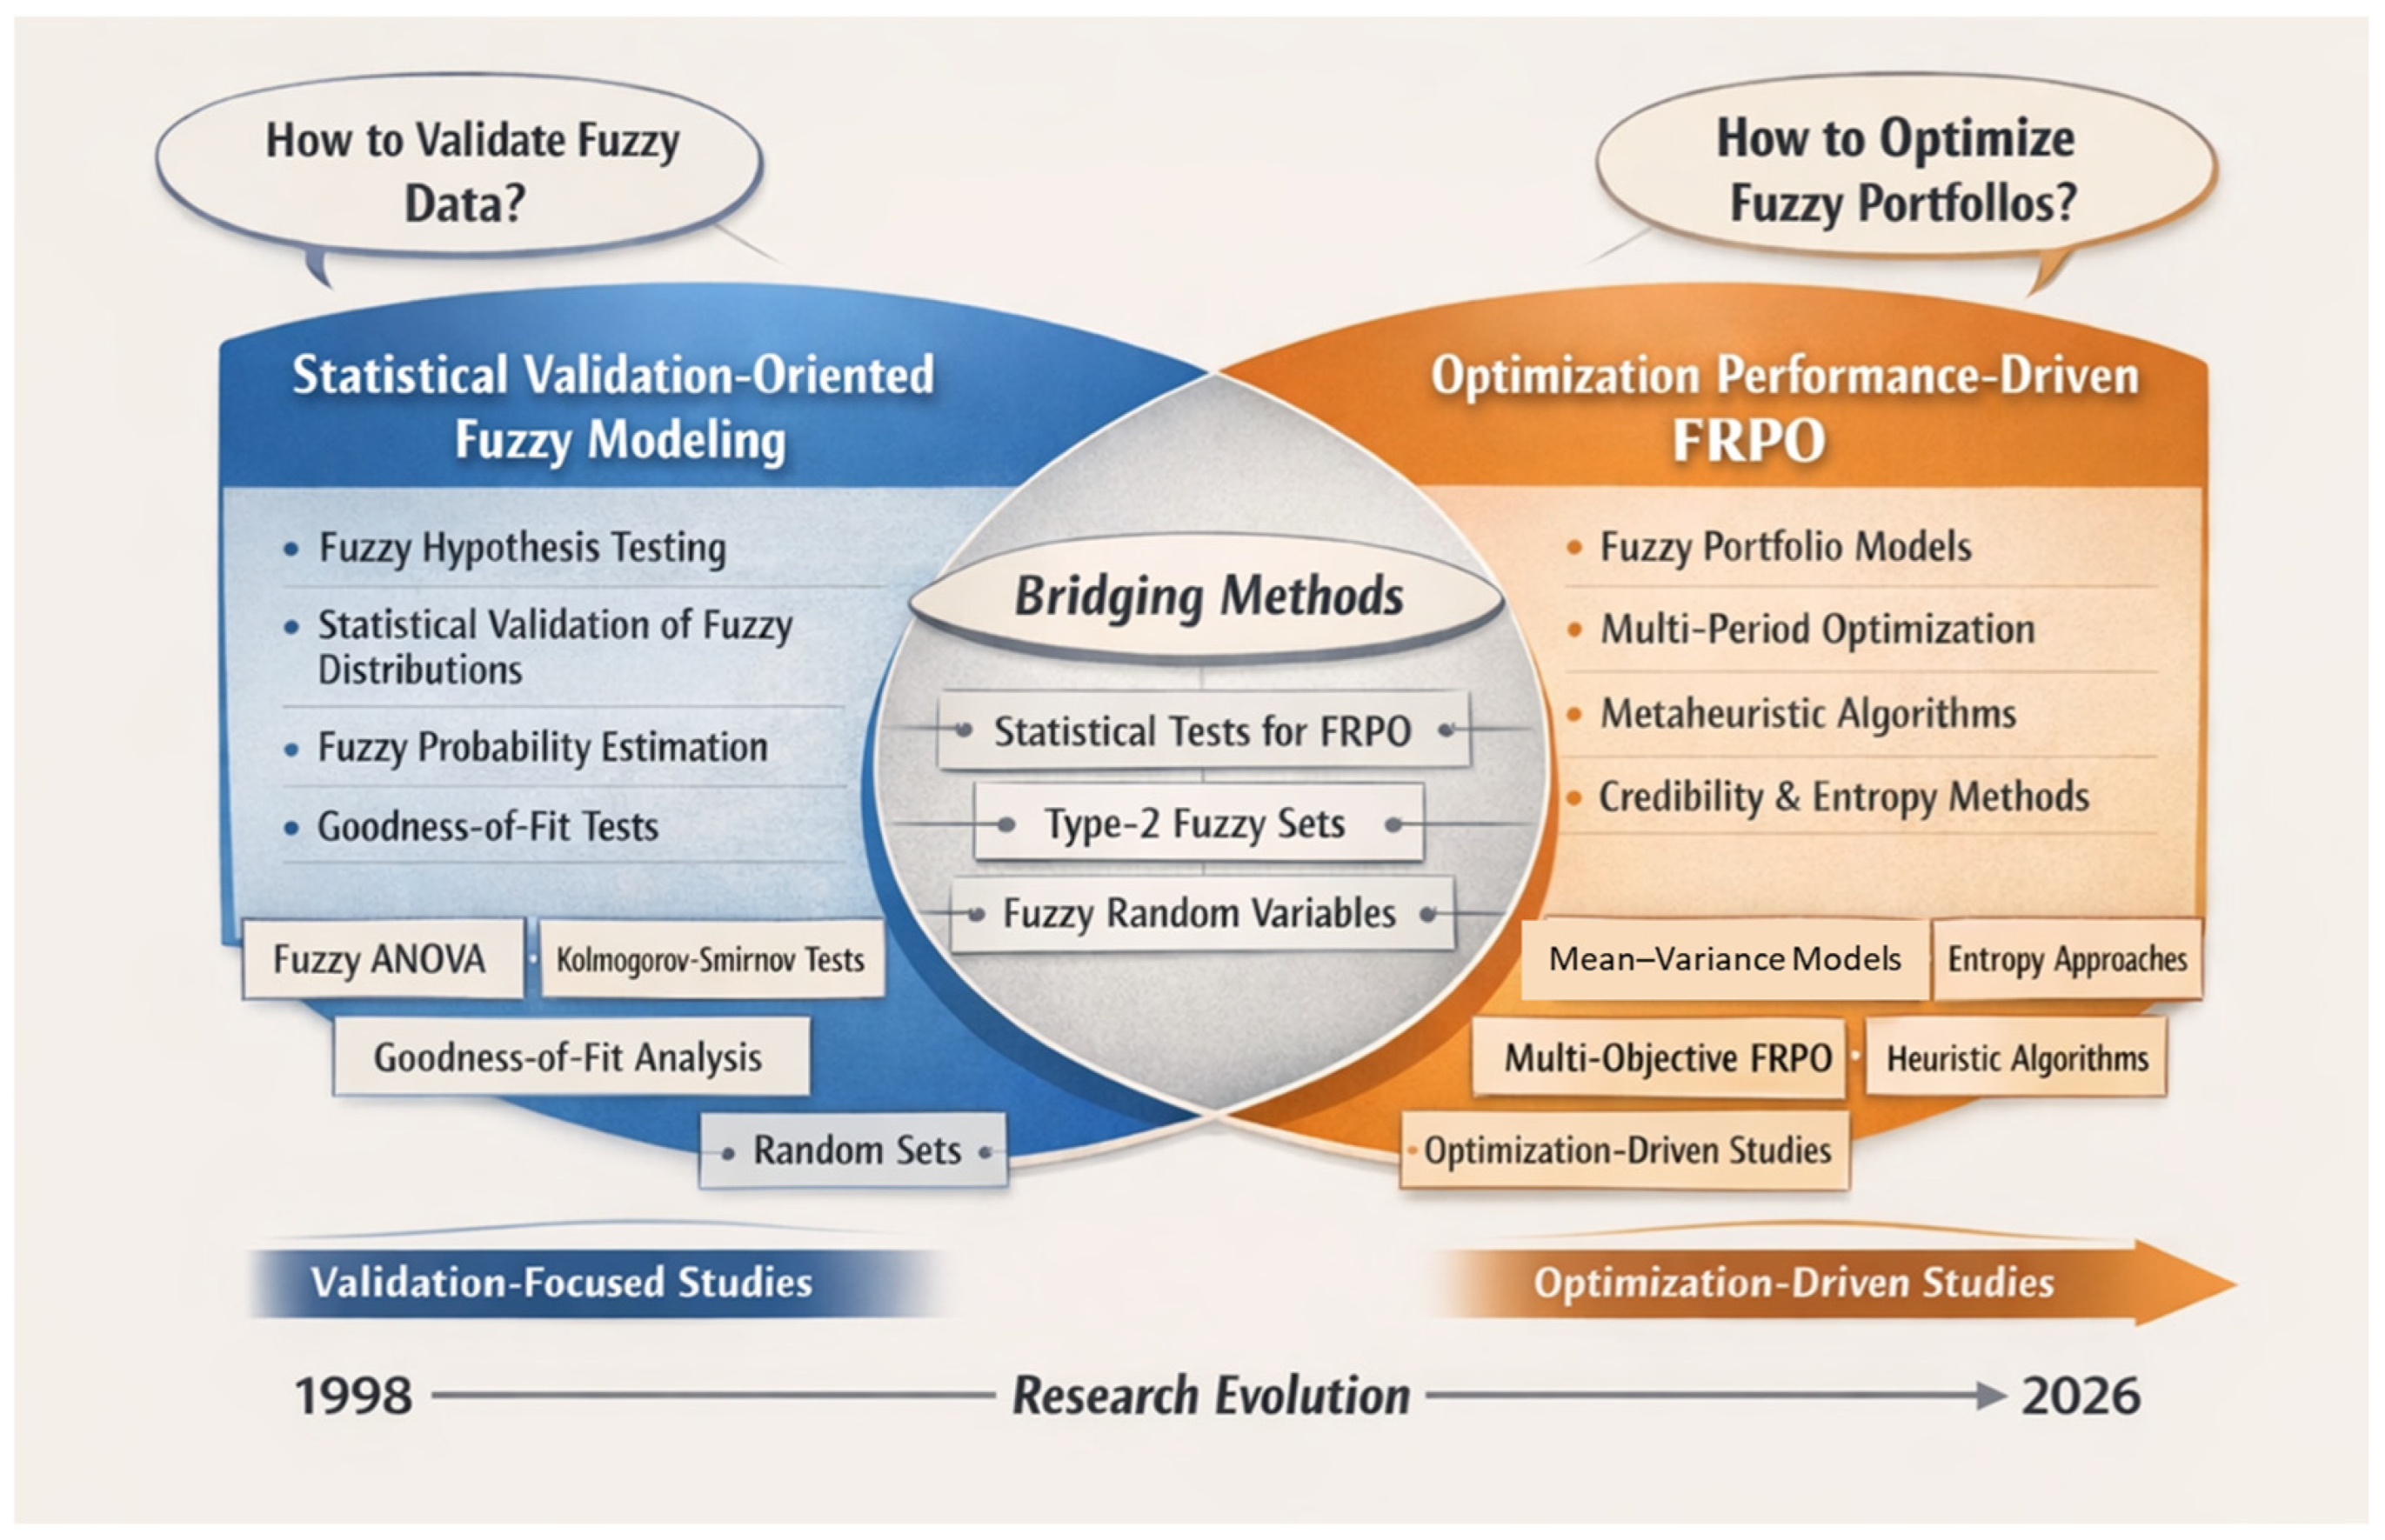
Figure 13 provides a timeline of two dominant research paradigms with various fundamental methods, some bridging methods. In the early research works by Lin and her collaborators, their fuzzy portfolio models emphasized statistical hypothesis testing and data credibility, employing fuzzy hypothesis testing such as fuzzy chi-squared tests, goodness-of-fit tests, Kolmogorov–Smirnov (K-S) tests, and ANOVA tests to validate fuzzy values before decision-making.
These research methodologies combine strong interpretability with theoretical rigor, ensuring portfolio decisions are based on statistically significant fuzzy information. However, when we want to apply these methodologies to complex, multi-period, or high-dimensional financial environments, those models often face limitations in scalability and flexibility. Recent FRPO models typically prioritized optimization efficiency, robustness, and practicality. Such research approaches usually integrate fuzzy random variables, entropy measures, risk metrics (such as VaR and CVaR), and meta-heuristic algorithms. While these models demonstrate exceptional computational performance and adaptability in their research results, they often lack explicit statistical validation mechanisms. Such research results often raise doubts about the reliability of data results and the feasibility of model optimization.
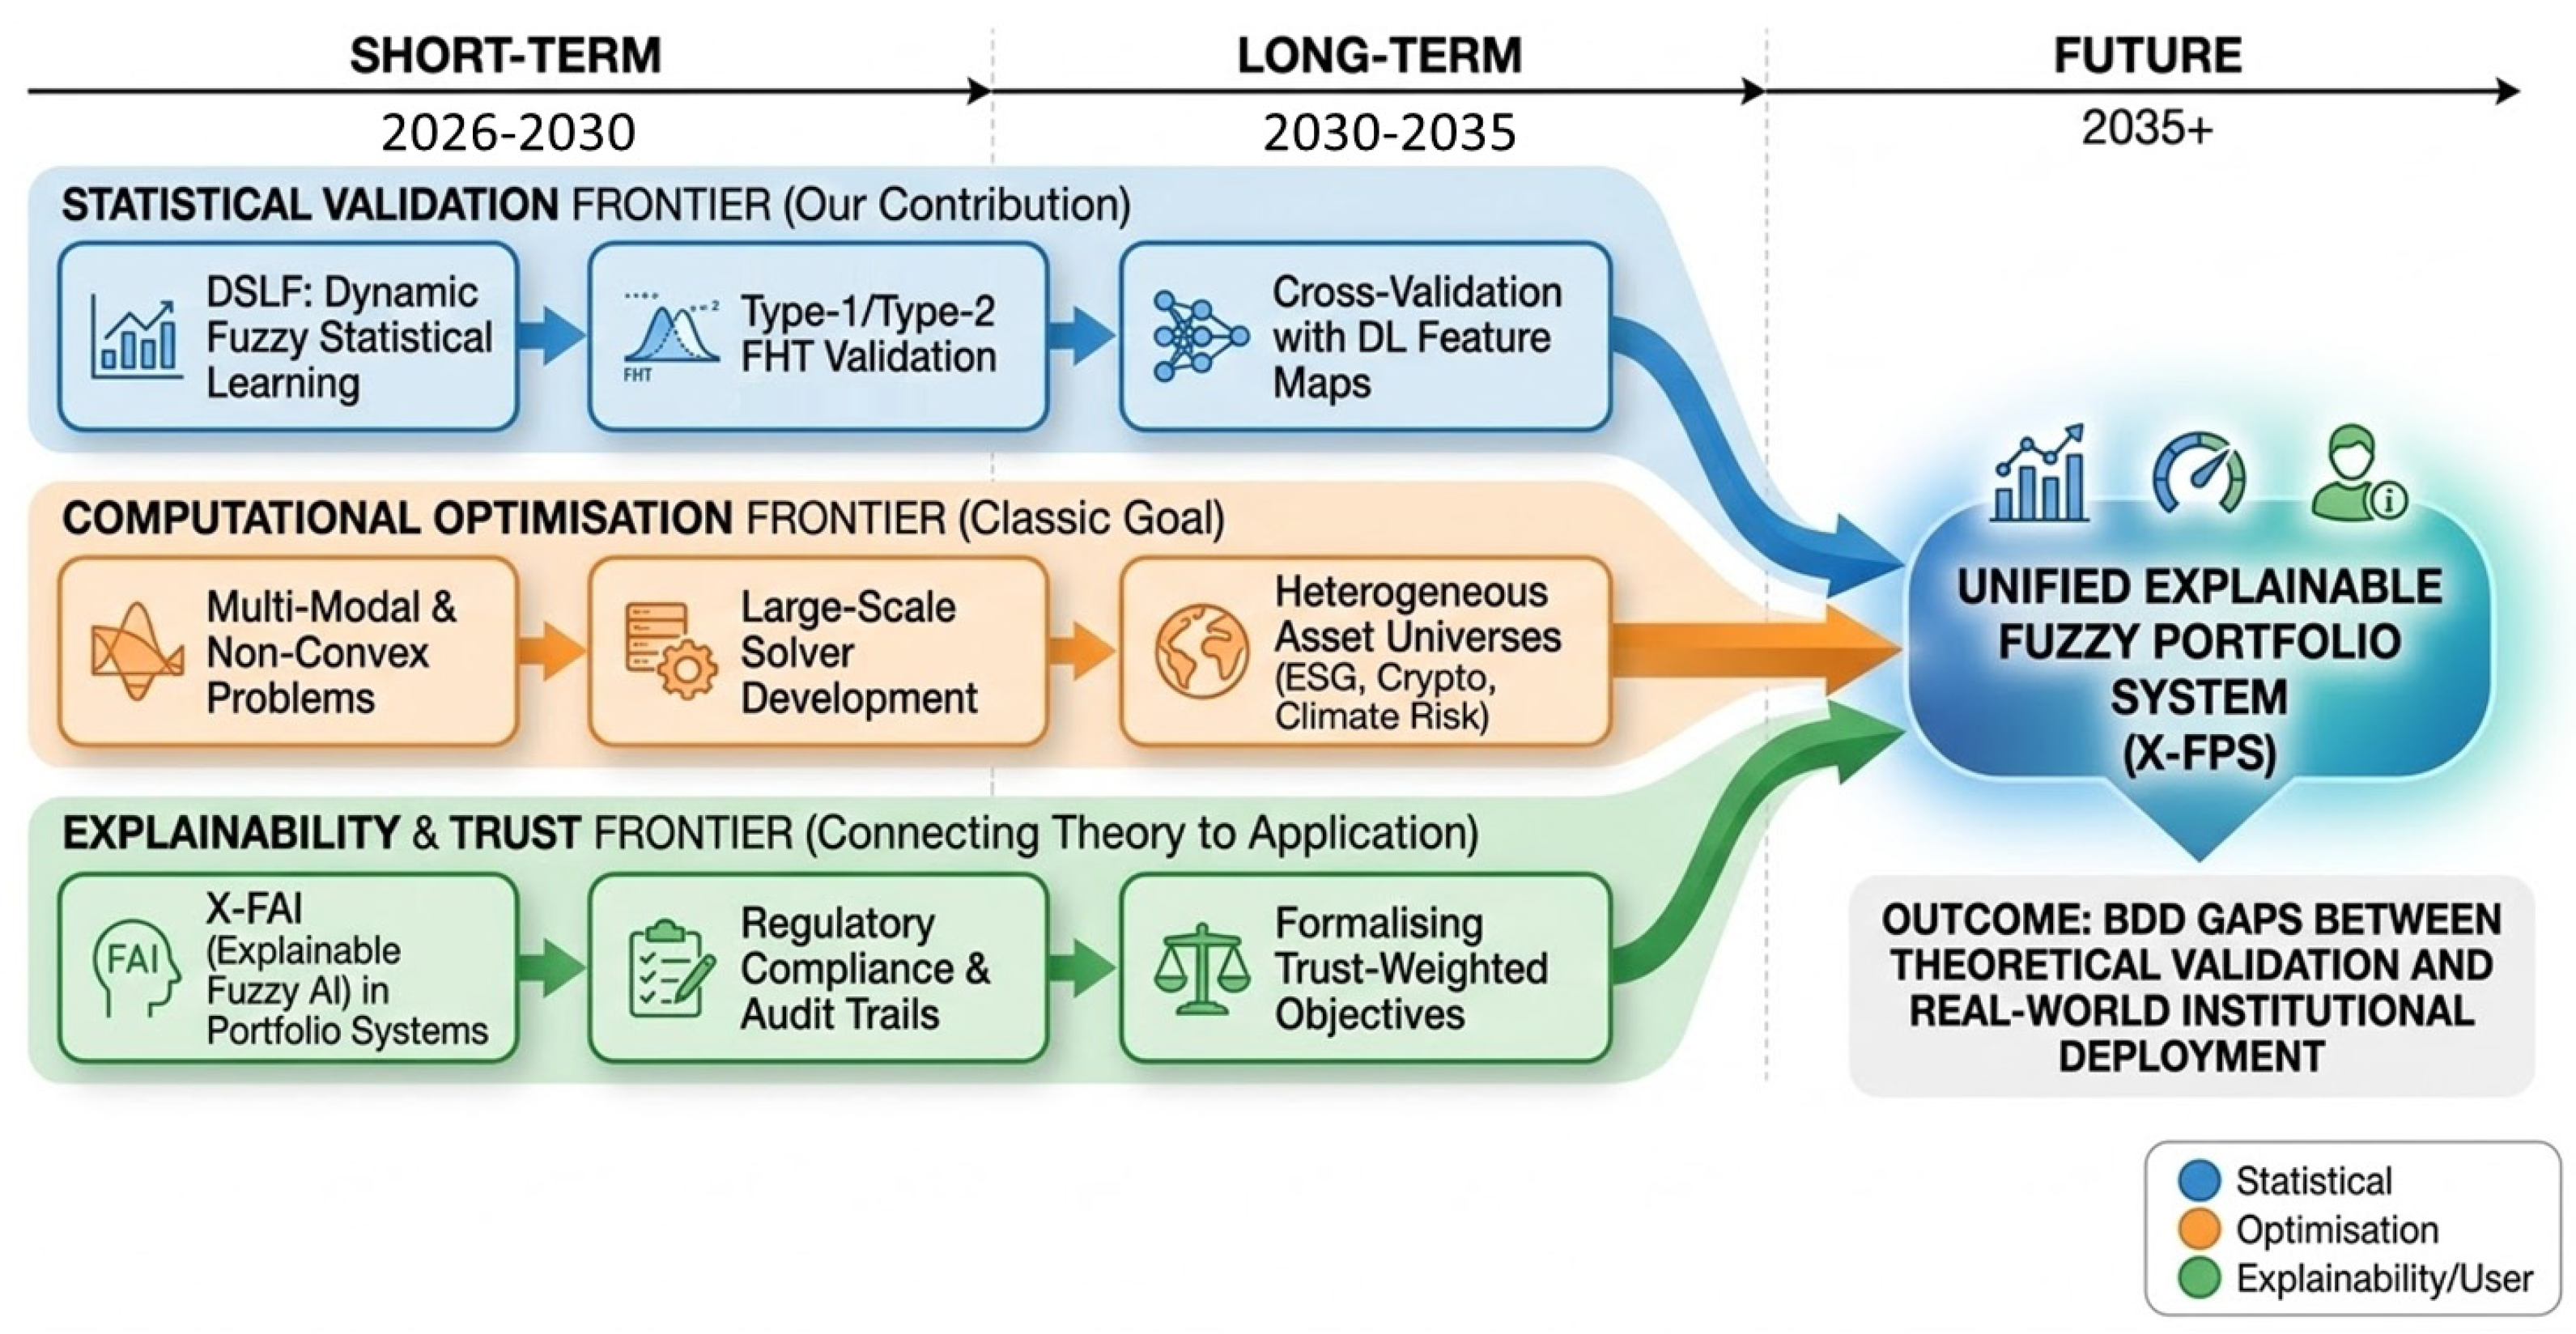
From the above five perspectives, the analysis reveals a growing methodological imbalance in fuzzy portfolio research. Research works that emphasize statistical validation indeed ensure the credibility, transparency, and interpretability of fuzzy data, while optimization-oriented fuzzy portfolios provide model scalability, robustness, and practicality. This imbalance between the two research approaches has also increased a significant research gap. Consequently, we propose that future fuzzy portfolio models should evolve towards a hybrid framework, such as integrating fuzzy statistical hypothesis testing with advanced fuzzy portfolio optimization techniques. Researchers can also consider the recent research works [
65] that employ Type-2 fuzzy modeling to balance interpretability and robustness and integrate data uncertainty with system optimization feasibility.
8. Future Perspective for Fuzzy Portfolio Models
In the preceding sections, we have systematically examined the evolution of fuzzy portfolio modeling and fuzzy stochastic portfolio optimization from 1998 to 2026, with particular emphasis on the methodological tension between statistical validation and optimization performance. We conducted a comparative analysis of 36 representative studies to understand the relevance and differences between two distinct yet complementary research domains. Comparative analysis highlights a critical methodological gap: statistical validation and performance optimization have long remained disconnected. We demonstrate that statistical validation or optimization performance alone is insufficient to support reliable fuzzy portfolio decision-making. This finding provides a structured reference for researchers developing reliable, interpretable, and high-performance fuzzy portfolio optimization frameworks.
We can draw conclusions for future fuzzy portfolio models as follows. We also provide an Example Roadmap for the Unified Explainable Fuzzy Portfolio System in
Figure 14 to help understand how to merge two paradigms with bridging methods in future research works.
Development of Hybrid Type-1 and Type-2 Fuzzy Portfolio Framework. In recent years, Type-2 fuzzy sets have provided a powerful mechanism for modeling the inherent fuzziness of membership functions themselves. Incorporating Type-2 fuzzy representations into established fuzzy statistical tests and integrating them with FRPO models can enhance the interpretability and robustness of the models.
Statistical Learning for Fuzzy Random Variables. For the performance analysis of models which incorporating fuzzy random variables, we must establish a systematic learning and estimation process encompassing hypothesis testing, distribution fitting, and goodness-of-fit analysis. Such research methodologies will enhance the accuracy of FRPO and enable the formulation of a robust system evaluation process.
Integration of Fuzzy Statistical Testing with FRPO Models. In this volatile environment, we recommend incorporating statistical hypothesis testing for fuzzy or fuzzy random variables into the optimization process of future portfolio models. Conducting statistical validation of fuzzy returns and risks prior to optimization would enhance the credibility and robustness of the FRPO model, particularly in markets characterized by high volatility or ambiguous data.
Explainable and Interpretable FRPO Models. In recent years, the research on optimization models has grown increasingly complex, primarily due to the ambiguous environmental factors. In view of this, model interpretability has become increasingly critical. Therefore, future research works should focus on developing interpretable fuzzy decision mechanisms, linguistic language modeling, and visualization techniques to bridge the gap between mathematical complexity and decision-making for real applications.
Unified Evaluation Benchmarks. Current research methods primarily rely on ad hoc datasets and performance metrics to evaluate portfolio models. In the future, establishing standardized benchmarks that can both assess optimization efficacy and statistical validity test will facilitate fair and meaningful model comparisons.
Automated Monitoring, Performance Attribution, and Compliance Checks. AI models enhance risk measurement capabilities by reducing human error, supporting consistent governance, and capturing volatility structures within financial portfolio management alongside correlations under tail risk and stress scenarios. Employing generative AI and simulation-based methodologies to strengthen scenario analysis and stress testing enables the assessment of portfolio behavior under extreme yet plausible market conditions. Early-warning systems driven by anomaly detection and sentiment analysis can identify emerging risks, liquidity shocks, or systemic vulnerabilities in real time.
Figure 14.
An Example Roadmap for the Unified Explainable Fuzzy Portfolio System.
Figure 14.
An Example Roadmap for the Unified Explainable Fuzzy Portfolio System.
Figure 14 illustrates how the three formerly distinct research frontiers (Statistical Validation, Computational Optimization, and Explainability and Trust) converge over time. In the short-term (2026–2030), we suggest that researchers could focus on technical prerequisites, such as integrating hybrid Type-1 and Type-2 fuzzy portfolio frameworks with statistical tests to enhance robustness. In the long-term (2030–2035), as stated in our conclusion, we suggest that researchers integrate Fuzzy Statistical Testing with FRPO models to enhance the credibility and robustness of the FRPO model. The final output is the Unified Explainable Fuzzy Portfolio System (X-FPS), where optimization performance is guaranteed within a statistically validated and explainable environment. To bridge theory (validation) and real-world application (explainability), we suggest that researchers use interpretable fuzzy decision mechanisms, linguistic language modeling, and visualization techniques to make complex fuzzy stochastic optimization palatable for real-world decision-makers. We also expanded our recommendations to include Automated Monitoring, Performance Attribution, and Compliance Checks. This links our core theoretical gap (validation) directly to modern deployment needs, such as stress testing using generative methods and early-warning systems, demonstrating how our roadmap makes fuzzy models compatible with institutional mandates and regulatory compliance. We hope that
Figure 14 could provide researchers with a more comprehensive understanding of this topic for future research works. Through our established roadmap, the next phase of research will not be defined by incremental performance improvements, but by the structural synthesis required to build deployment-ready, trustworthy fuzzy financial systems.