1. Introduction
The development of the ability of a medical student or resident to manage clinical complexity is of the outmost importance. Nowadays, clinical medicine is faced with more and more multimorbid patients, and we need advanced modeling tools both for clinical management and for medical education [
1]. Case-Based Learning (CBL) [
2] is a well-established methodology in medical education, used both in student training and in the professional development of doctors and healthcare professionals. In CBL, students are challenged with real or realist clinical cases, and they must answer some questions, make decisions, or critically review the whole case. The CBL exercises can be performed individually or in a small group, but in any case, they end with the discussion of the solution or critical analysis with a mentor [
3]. Clinical cases involving chronic patients with multiple diseases (complex clinical cases) typically present problems belonging to different medical disciplines, requiring the intervention of various specialists for comprehensive patient management.
However, for some learning activities, it is not necessary to show the entire clinical case, but, for example, only the portion relevant to the learner’s specialty. In fact, each specialist has their own diagnostic–therapeutic objectives and therefore their own view of the clinical case. Furthermore, the focus can be on different “levels” of analysis: (1) clinical level: evolution of clinical problems; (2) semiotic level: symptoms, signs, and test results; (3) socio-psychological level: social and psychological issues; and (4) patho-physiological level: biomolecular and genetic mechanisms. Furthermore, sometimes it is relevant to choose only a time interval that shows part of the case in detail, allowing for the development of complex clinical reasoning relating not only to diagnostic and therapeutic issues but also to prognostic ones.
The f-HINe™ model (see
https://www.healthissuenetwork.org/eng/home (accessed on 15 March 2026) for detailed information) represents real clinical cases (i.e., cases already treated according to a graphical formalism particularly suited to representing chronic multi-pathological conditions), with the possibility of accessing data sheets of the elements of the diagram [
4]. The f-HINe diagram represents the patient’s clinical history, indicating not only all past and present health issues (HI) but also how these issues have evolved over time and are connected to each other; the f-HINe diagram thus highlights the temporal reasoning behind the evolution of the complex case [
5]. The f-HINe diagram contains swimlanes, which are a way of grouping problems according to the ICPC-2 system [
6]. The f-HINe diagram also can display the different HIs in levels representing the clinical, semiotic, and patho-physiological histories. The presence of levels and swimlanes in a diagram means that the clinical case can respond to different teaching and learning objectives due to the different views of the clinical case. The clinical case, processed and classified for training purposes, becomes a “reference case” that is the basis for teaching according to the CBL approach. Different views can be generated from a reference case by appropriately combining swimlanes, levels, and time intervals. We therefore refer the results of this process of select as the views of the f-HINe
TM model, each of which serves a learning objective.
This multidimensional structure (swimlanes, levels, time) allows multiple views to be extracted from a single complex clinical case, giving the case itself a value of “educational flexibility”. In fact, flexibility should be understood as the possibility of extracting specialist views (descriptive views, analytical views) from a clinical case so that the exercise focuses on a suitably chosen “aspect” of the case itself. The educational flexibility of a clinical case can be defined as its ability to generate views through the combination of specialist views, levels of case evolution, and possible temporal situations present in the case.
The educational flexibility of a case can be stratified by considering three indicators: (1) swimlanes, (2) levels, and (3) time interval. These can in turn be combined to determine even more specific views. This breakdown allows us to define a significant number of combinations of possible HIN sub-networks that can be generated, expressed through the number of combinations of specialist swimlanes, levels, and time intervals.
Having a measure of the possible views that can be generated from a reference case allows for a more appropriate choice in education and training related to the management of complex cases, as it offers the possibility of analyzing the case from different points of view. Clearly, this is not the only indicator that can guide the choice of the reference case, but it adds the opportunity to see how various medical disciplines must interact with each other in the care of chronic patients with multiple pathologies.
The purpose of this work is the definition of the flexibility indicator of a reference case, but also the construction of the views that underlie the evaluation of a flexibility indicator.
The paper is organized as follows: after the introduction,
Section 2 illustrates the role of views in managing a complex case and the underlying educational theories;
Section 3 briefly presents the f-HINe™ model;
Section 4 presents the types of views that can be extracted from a reference case;
Section 5 illustrates the connection between view type and educational purpose;
Section 6 presents the procedure for extracting views from an f-HINe™ diagram;
Section 7 presents the procedures in the generation of a macro-evolution;
Section 8 presents the indicator of educational flexibility;
Section 9 discusses the problems of extracting views and the advantages of using flexibility. The paper concludes with a brief presentation of the formalization of view generation in the model f-HINe™.
Appendix B reports two examples of fHINe diagrams, with the calculation of their flexibility index.
2. The Flexibility of the Clinical Case in Medical Education
In a person-centered primary care setting [
7], a general practitioner more often treats the patient according to a treatment plan agreed upon with other specialists; therefore, the issue of teamwork must be considered. Even if training is “individual,” chronic diseases require a multidisciplinary approach to prevention and treatment. This implies the training of medical specialists who work on cases involving multiple pathologies: in teaching; this means assigning “roles” to learners. It is interesting to create exercises based on different “points of view” on the part of the learners and therefore views of the clinical case according to the different roles, considering the multidisciplinary perspective. This also includes the issue of promoting healthy lifestyles, which translates into the question “how could we have intervened, within the clinical evolution of the patient, to prevent the onset of the disease?”, a topic that is currently at the heart of public health. This is already possible because, in the f-HIN diagram, health issues (HIs) can have very different types, including risk factors, lifestyle habits, or socioeconomic or working conditions. Furthermore, the HIN™ model allows for the simulation of “possible” developments, both positive and negative, thanks to the possibility of isolating time intervals of the clinical case.
The concept of flexibility in education has been defined from various perspectives. The oldest and most widely used is the Theory of Cognitive Flexibility, developed by a team of psychologists led by Spiro [
8]. The theory suggests that in ill-structured domains like medicine or history, you cannot just memorize a textbook. The learner needs to adopt diverse perspectives, use various mental models and teaching methods to view a topic from different angles, and interconnect knowledge to build multiple “web-like” connections between pieces of information rather than single, linear paths.
A second definition of flexibility is focused on the timing of the curriculum, suggesting that learner-led progression offers advantages over fixed programming, especially if the goal is the acquisition of competencies rather than just knowledge [
9].
Finally, based on the Experiential Learning Theory (ELT) by Kolb [
10], adaptive flexibility in learning has been defined as the degree to which individuals change their learning style to respond to different learning situations in their life [
8].
The concept of flexibility that we propose in this article is consistent with the definitions of [
7,
9]: the need for students to adopt different perspectives, use various mental models, and be able to manage their own learning process independently. Our proposal addresses one operational aspect of these approaches: a flexible use of learning materials and methods, in the frame of the HIN approach. The measure of educational flexibility provides the teachers an indication on the amount of information contained in a reference case. A list of reference cases sorted by educational flexibility allows the teacher to design a progressive path of development of clinical reasoning for the students, extracting different types of views, as defined in
Section 4.1,
Section 4.2 and
Section 4.3. The same list allows the students a self-paced progression in dealing with cases of increasing difficulty.
3. The f-HINe™ Model
The f-HINe™ model is based on a diagram composed of nodes representing HI, and oriented edges representing the evolution of the input node. HI can be diagnosis, diagnostic hypothesis, sign, symptom, report, risk condition, iatrogenic problem, physio-pathological event, injury, disorder, need, etc.
There are two types of edges:
Solid, if the HI changes (bronchitis worsens into pneumonia: it is no longer bronchitis, but pneumonia). These types of evolutions are worsening, improvement, examining in depth, and implication.
Dashed line in cases where an HI generates a new HI (diabetes complicates by generating a diabetic foot ulcer: the patient has both diabetes and diabetic foot). Evolutions that present this situation are complication, comorbidity, co-presence, cause, and conditioning.
The terminology used for HIs and evolutions is taken from the ContSys standard, ISO 13940:2015 [
11]. A key feature is that HIs are ordered in time and by choice along the horizontal axis in a multidimensional space.
The data sheets are used to collect detailed information about both nodes (HIs) and transitions (evolutions): (i) the clinical data that characterizes the problem and the diagnostic–therapeutic procedures that were initiated because of the presence of the HI itself; and (ii) the threshold values of clinical parameters that identify the evolution itself. The need to structure and integrate such information reflects the intrinsic complexity of clinical data and multimorbidity management, as highlighted in recent studies on AI-based disease prediction, such as the case study on cardiovascular disease prediction [
1].
An alternative way to model multiple HIs in common compared to an evolution is to use a static branch node, a small black node in which multiple HIs converge at the input, or from which multiple HIs originate at the output, or both. Therefore, an evolutionary path of a problem that leads to a different problem is a succession of evolutions (greater than or equal to two) with relative input and output HIs/static branch nodes.
One way to improve the readability of an f-HINe diagram is to use swimlanes to highlight the evolution path of a problem by focusing attention on a well-defined body system, in accordance with the 17 chapters of the IPCP2 developed for continuity of care [
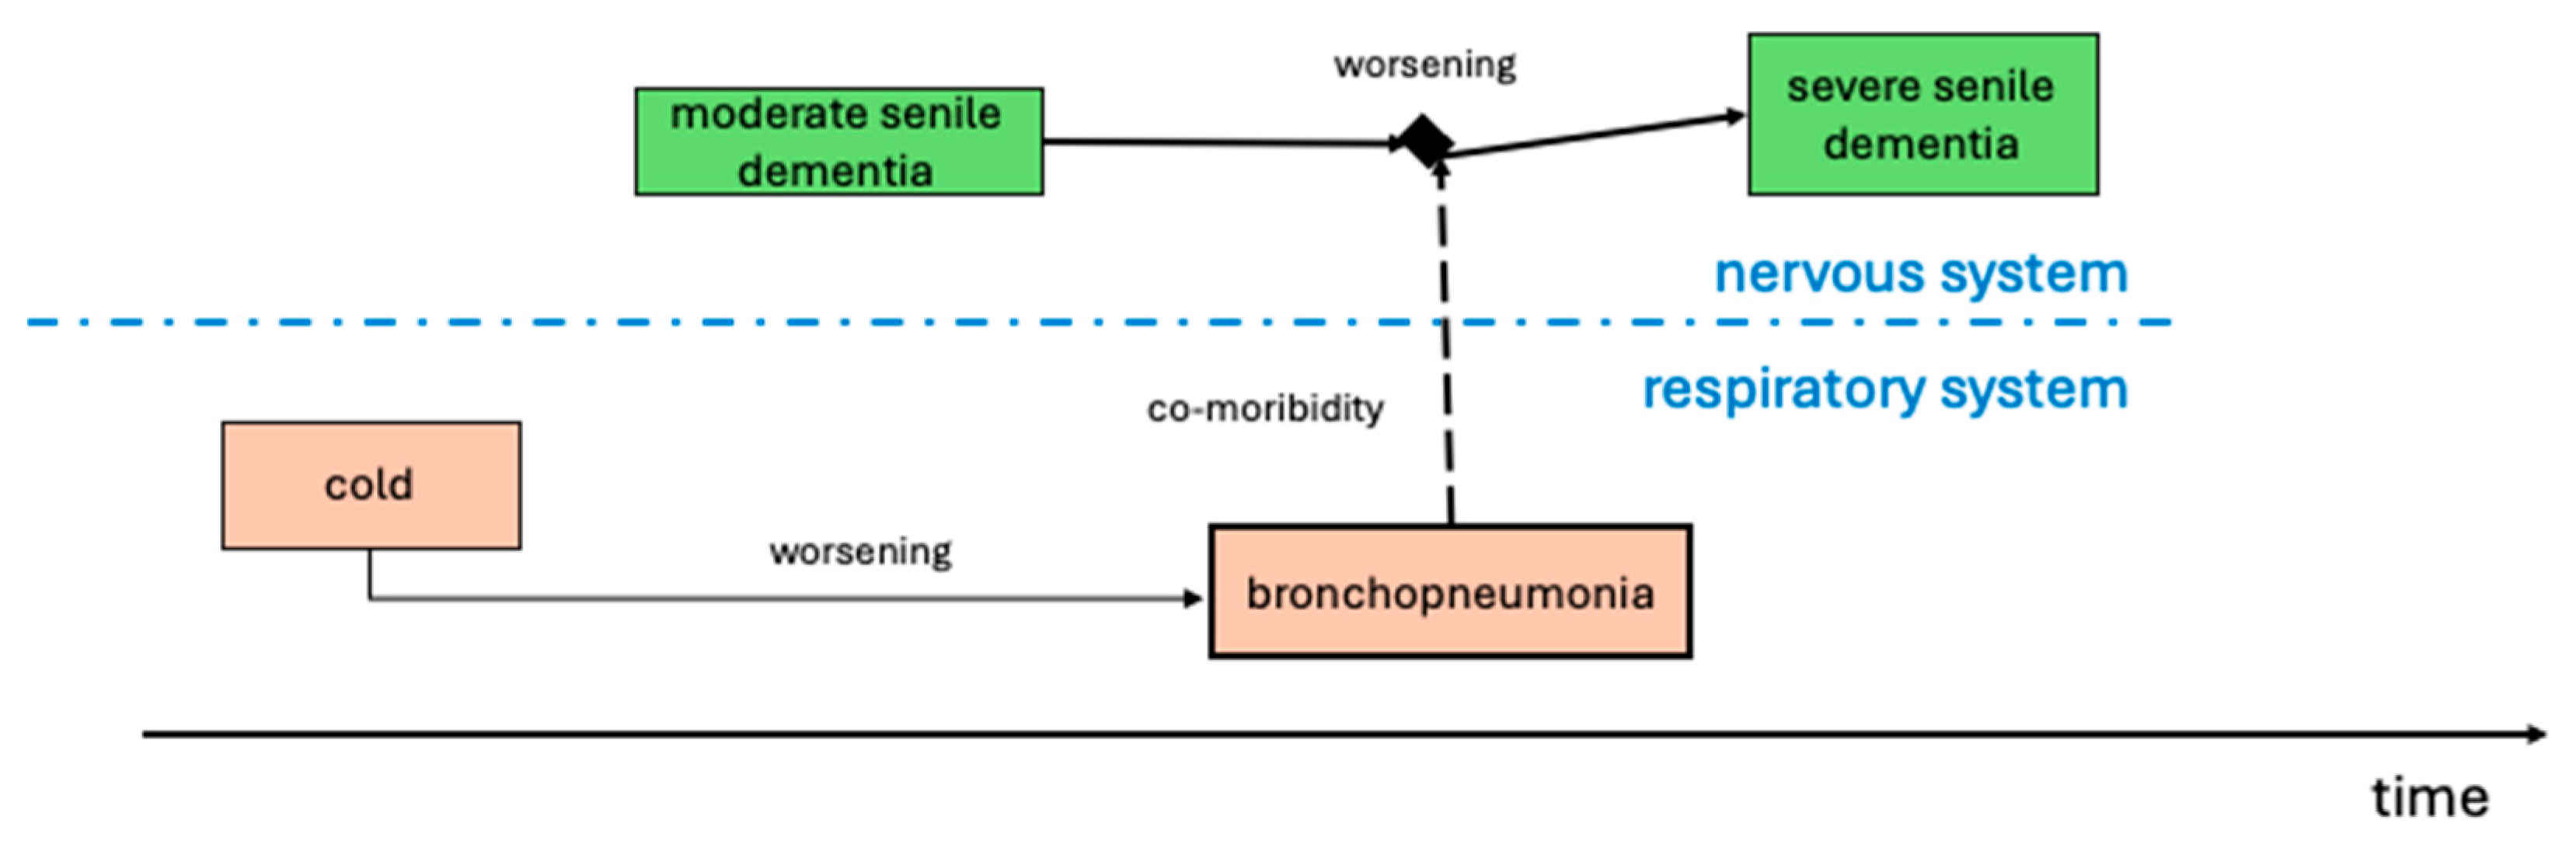
6]. The swimlanes are highlighted by coloring the relevant HIs, represented by rectangles. Another way to improve readability is to organize an f-HINe diagram according to levels, i.e., different perspectives (clinical, semiotic, physio-pathological, socio-psychological). Within the levels, the evolution paths can be represented within a swimlane. An example of an f-HINe diagram is shown in
Figure 1, drawn using fHINscene software version 1.6 released on 30 March 2025 [
4], where the swimlanes are also indicated. In addition to generating and manipulating diagrams, fHINscene software has a function to verify that the drawn diagram complies with the characteristics of an f-HINe diagram.
An f-HIN diagram has the following characteristics:
f-HIN can have isolated nodes.
Minimum f-HIN consists of a single node.
The branch node is only an intermediate node and is always connected (input and output) to HI nodes.
f-HIN may be unconnected, i.e., it may consist of several connected parts of the diagram (one for each health problem evolution) and isolated nodes.
Only a solid or dashed edge can enter the HI node, and only a solid edge and possibly one or more dashed edges can exit it.
There can be at most one and only one evolution between two nodes.
The dynamic aspect of the model is based on the use of tokens that move from one HI to another along the connection evolutions. The firing rules are those of Petri nets [
12], since the formal model on which the f-HINe model is based is a Petri net [
13].
4. The Views
The view is a projection of the original f-HINe diagram that isolates a part of the overall behavior, both maintaining structural and dynamic consistency and respecting the conditions set for its generation. The view is an f-HINe diagram that respects the following characteristics: (i) inclusion of nodes: each node (HI and static branch node) present in the view must exist in the original diagram; (ii) abstraction: it allows the teacher to show only what is necessary for teaching purposes, showing in a single evolution paths that connect two nodes of the view; (iii) minimality: it must contain the minimum set of elements (nodes and evolutions) necessary to meet the teaching purposes underlying the choice; (iv) homomorphism: there must be a direct correspondence between the paths in the view diagram and the paths in the original diagram, possibly with elements of abstraction; (v) behavioral consistency: the sequence of changes in health status observed in the view must be identical to that seen in the original diagram; and (vi) observational consistency: each marking reachable in the view must correspond to the projection of at least one marking reachable in the original diagram. This definition is based on (i) projection, an operation that allows you to select what the teacher wants the students to observe, and (ii) abstraction, an operation that allows the reconstruction of a coherent dynamic within what the teacher wants the students to observe.
In the HIN approach, students are given different possible exercises: observe a diagram and write a textual description or a critical interpretation of the case, complete hidden portions of a diagram, forecast the future evolutions, and draw a full f-HINe from a given clinical text [
4].
Views can be of various types depending on the perspective of the f-HINe diagram they represent. Not all possible extractions from a reference case must necessarily be considered, but only those useful for teaching while respecting the characteristics that an f-HINe diagram must possess [
4].
The f-HINe model features elements that facilitate the interpretation of an f-HINe diagram identifying three types of view: (i) specialized composed by a set of swimlanes; (ii) descriptive identified by levels (e.g., clinical, semiotic, social); and (iii) analytical that restricts the analysis of the clinical case on the event occurred between two timepoints.
4.1. The Specialized View
The specialized view represents the evolution path of the clinical case, focusing on a well-defined anatomical system. It represents the evolution of a patient’s clinical problems related to a specific anatomical system (body system), along with clinical problems external to that system that directly influence evolution.
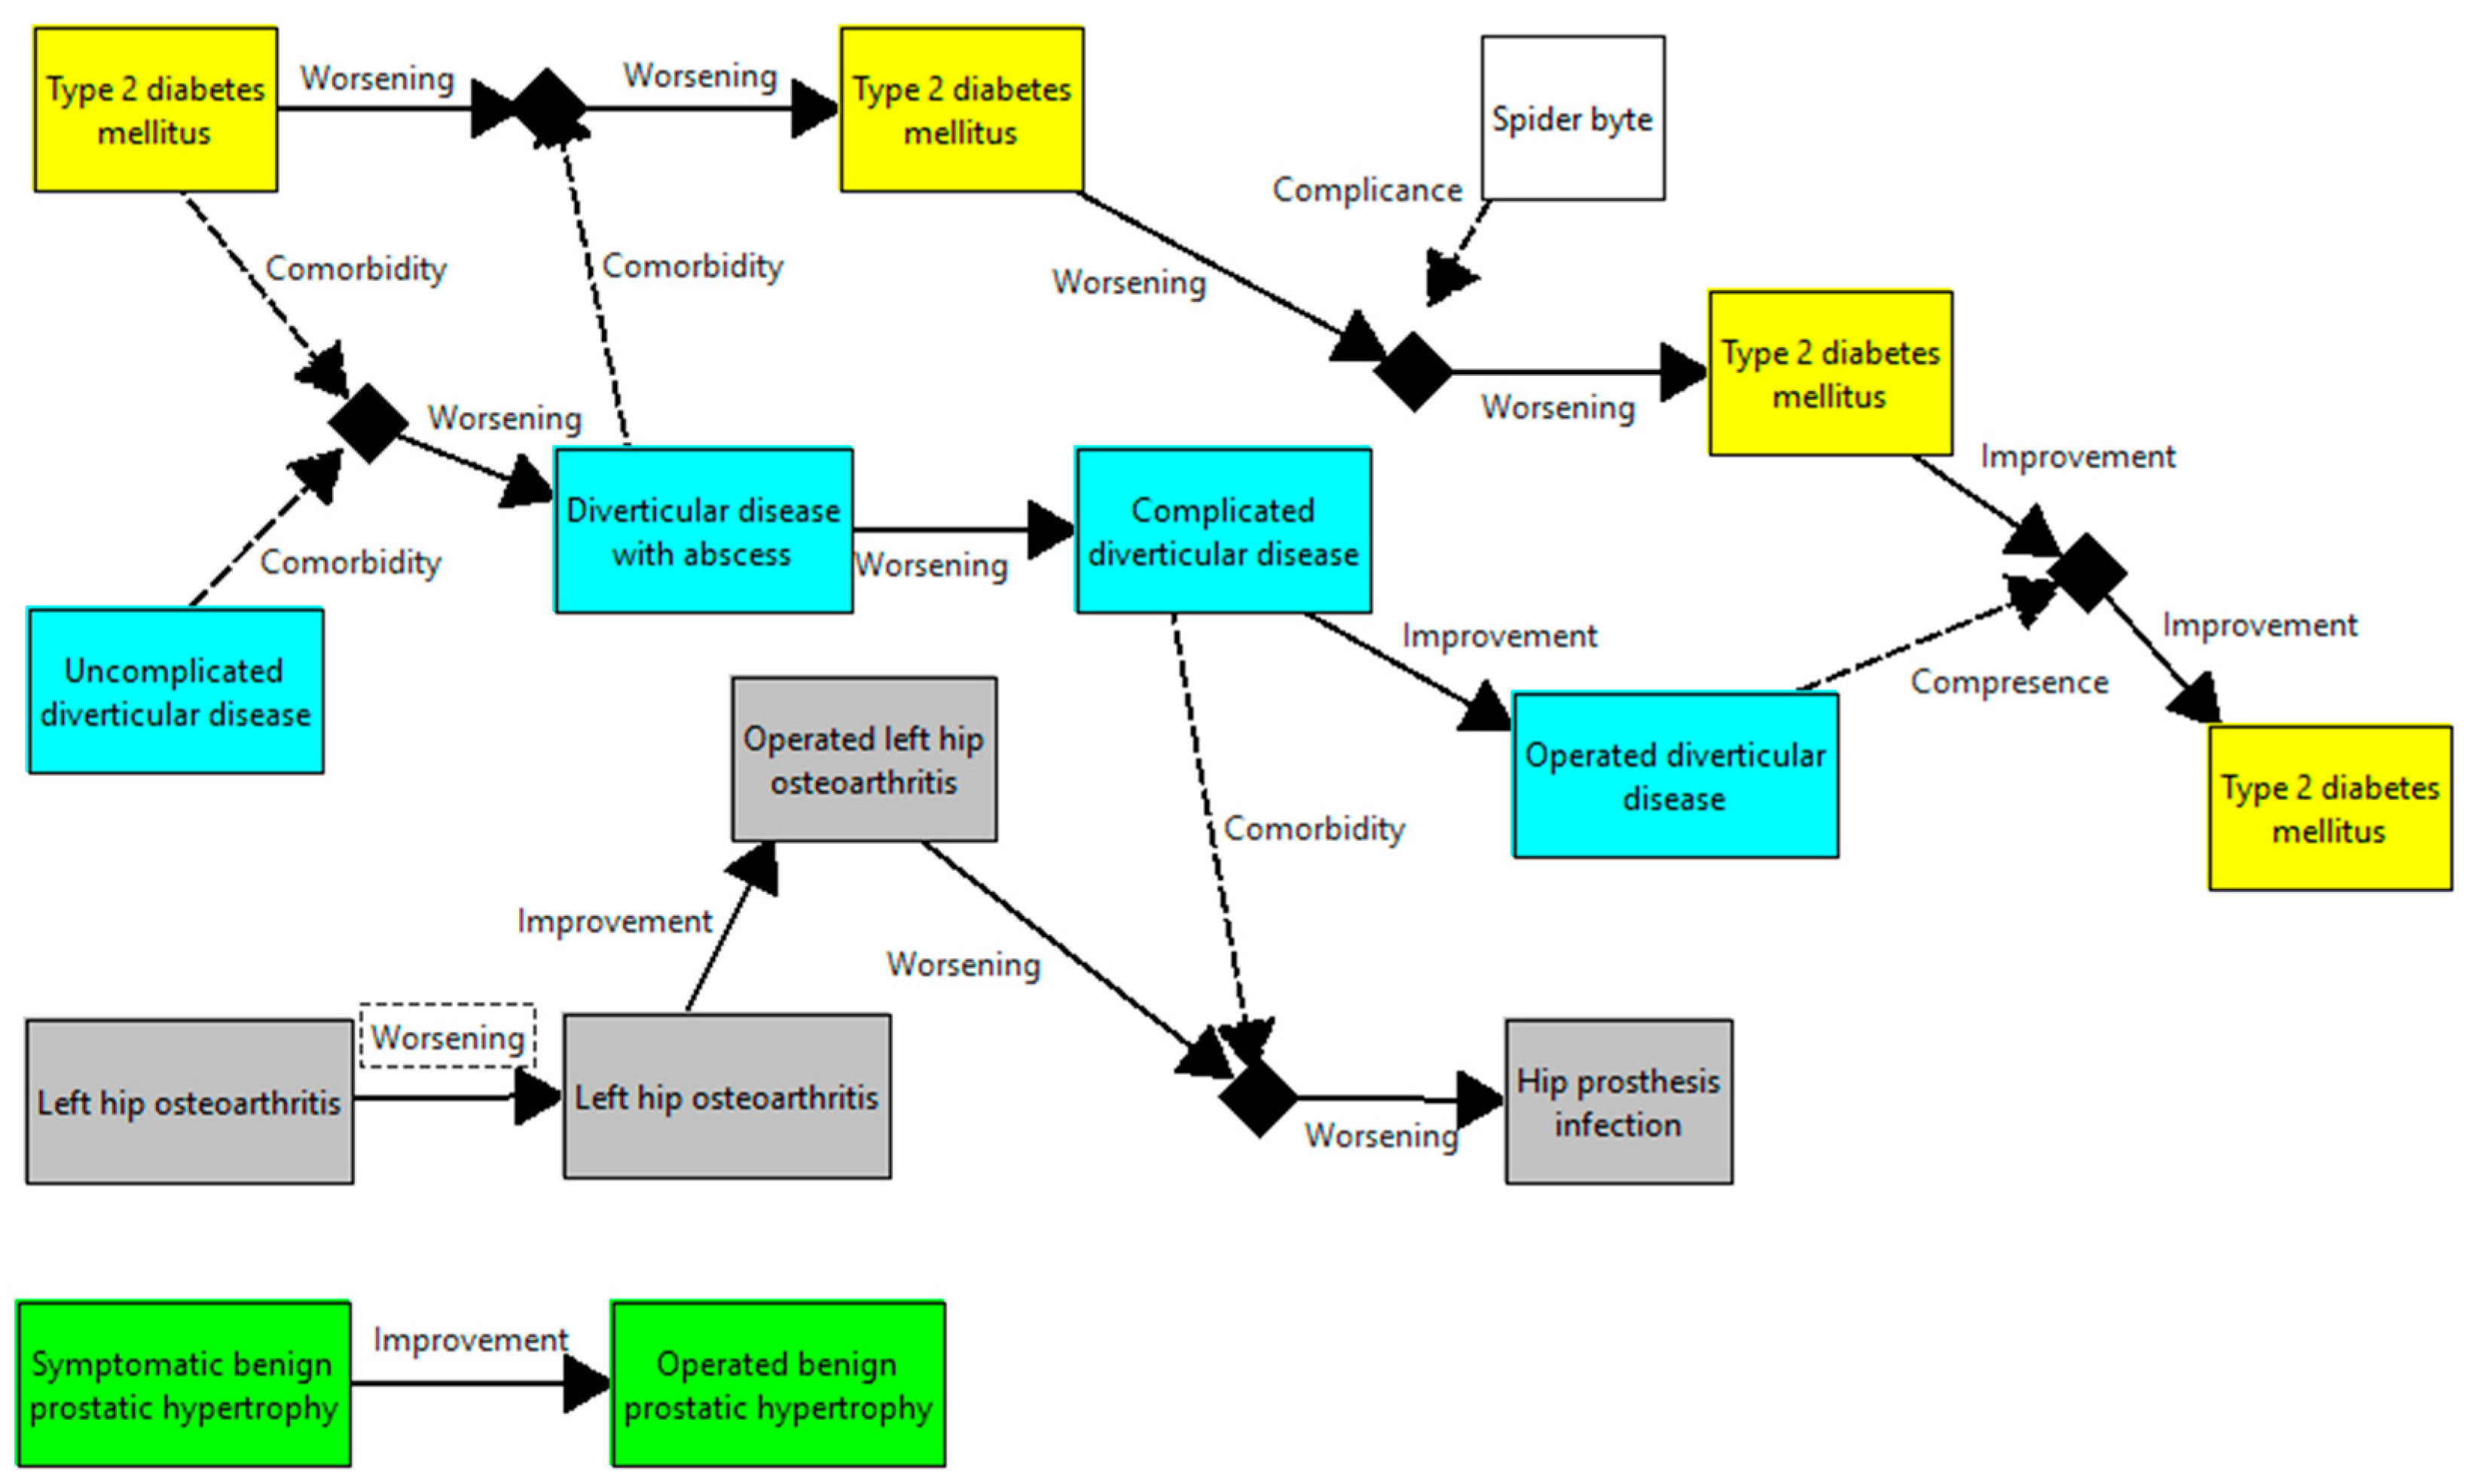
Consider the f-HINe diagram of the reference case presented in
Figure 2. It is composed of four swimlanes (metabolic, digestive, musculoskeletal, urological). Moreover, an additional injury-type HI (i.e., spider bite) is represented that is not classified within any specific swimlane.
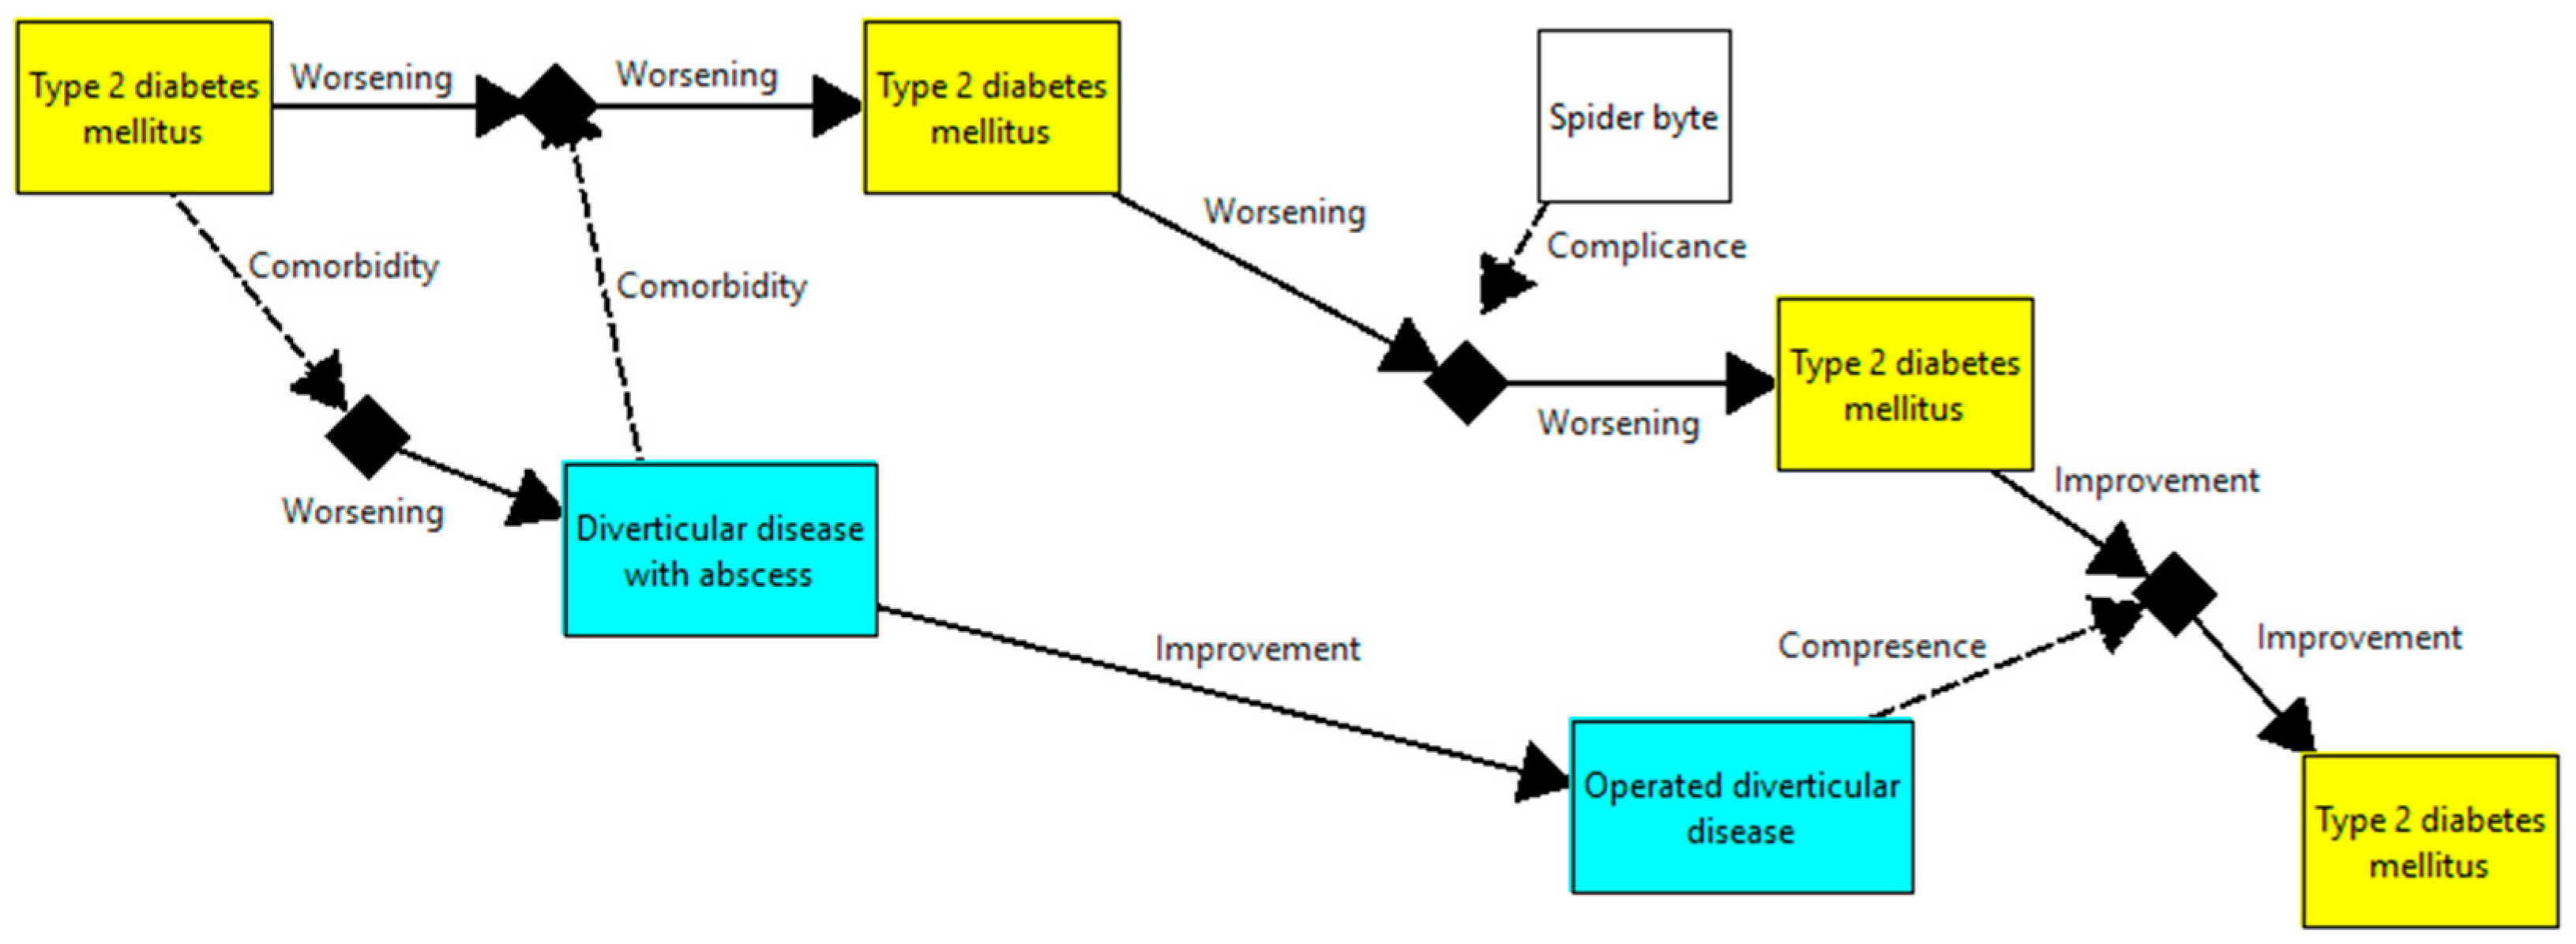
The specialist view focused on the metabolic swimlane is presented in
Figure 3.
This view is composed of the HIs that belong to the metabolic medicine specialty, together with those directly connected to them through a direct transition, as they may directly influence the progression of the conditions, such as the operated diverticular disease that, through its copresence, contributes to the improvement of the type 2 diabetes mellitus. Moreover, once all the HIs have been included in the model, a set of transitions is generated to highlight whether a relationship exists between two conditions that are not specific to the specialty under analysis. These transitions are not necessarily direct but can necessitate a macro-evolution. An example in the discussed case is represented by the improvement from diverticular disease with abscess to diverticular disease that in the comprehensive model is mediated by complicated diverticular disease, which represents a worsening of the HI diverticular disease with abscess.
4.2. The Descriptive View
The descriptive view offers a vision of a patient’s clinical history from a specific, possible perspective, clinical, semiotic, physio-pathological, social, or psychological. For instance, the nosographic history provides a detailed and structured narration patient’s history focusing only on signs and symptoms related to the clinical case.
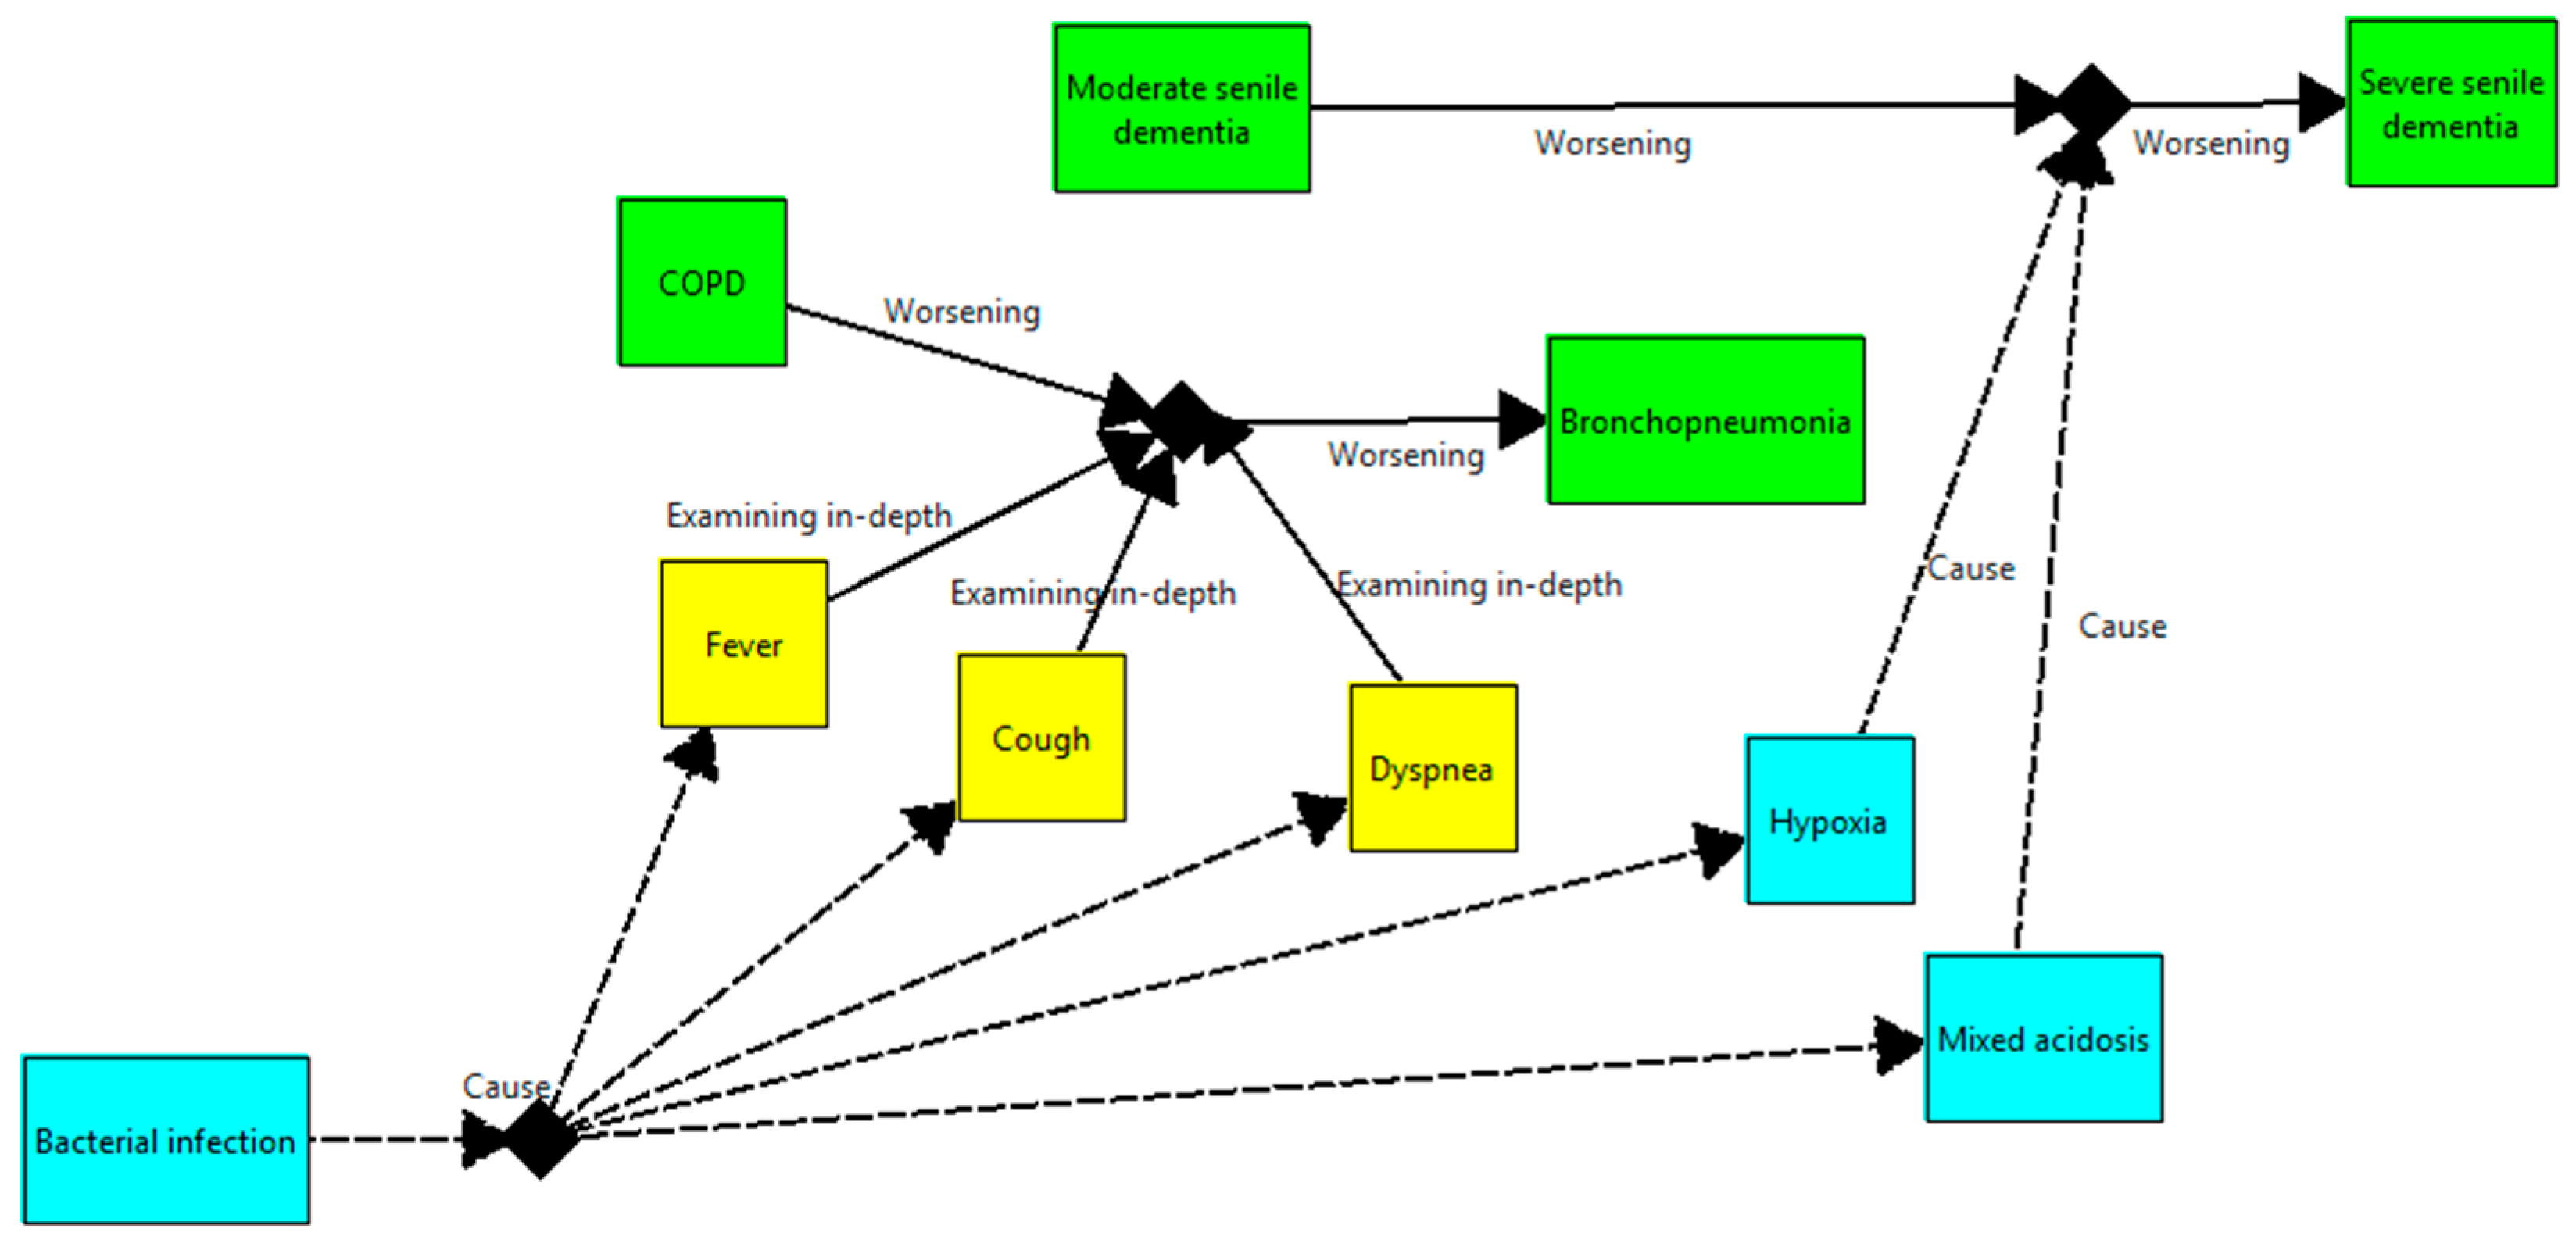
Consider the f-HINe diagram of the reference case presented in
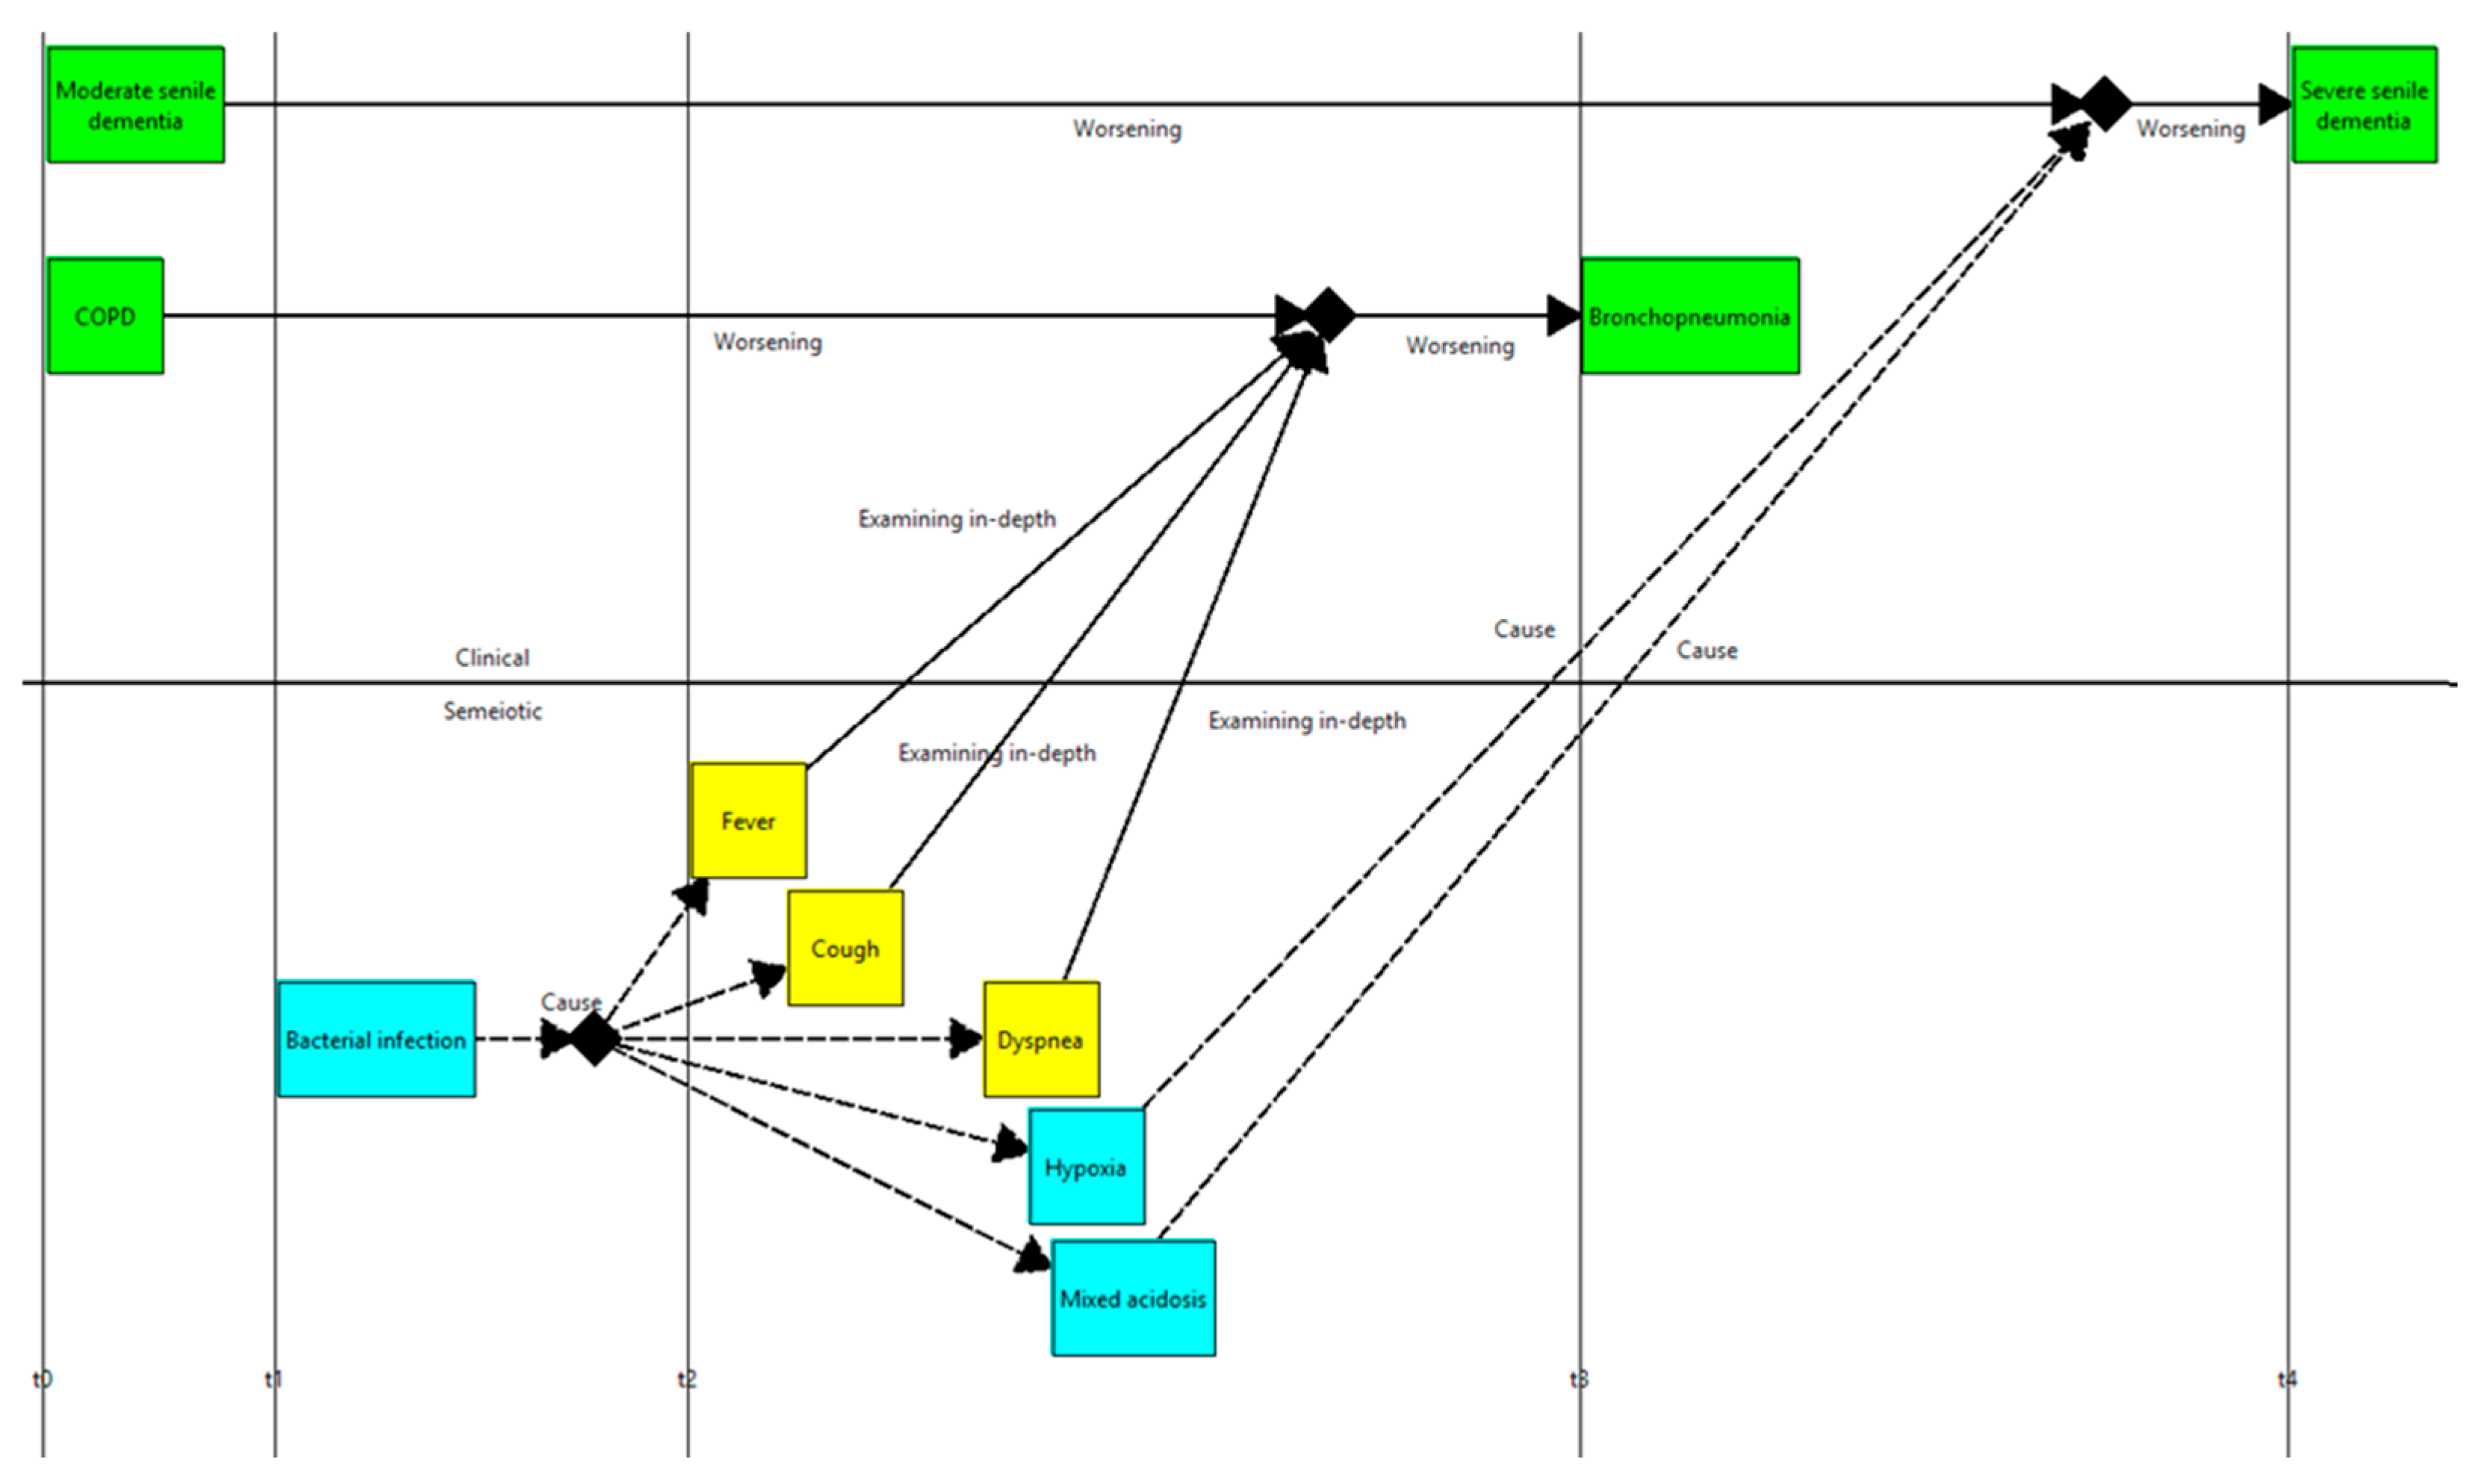
Figure 4. Three levels can be identified, each one represented by a specific color: clinical (green), semiotic (yellow), and physio-pathological (blue).
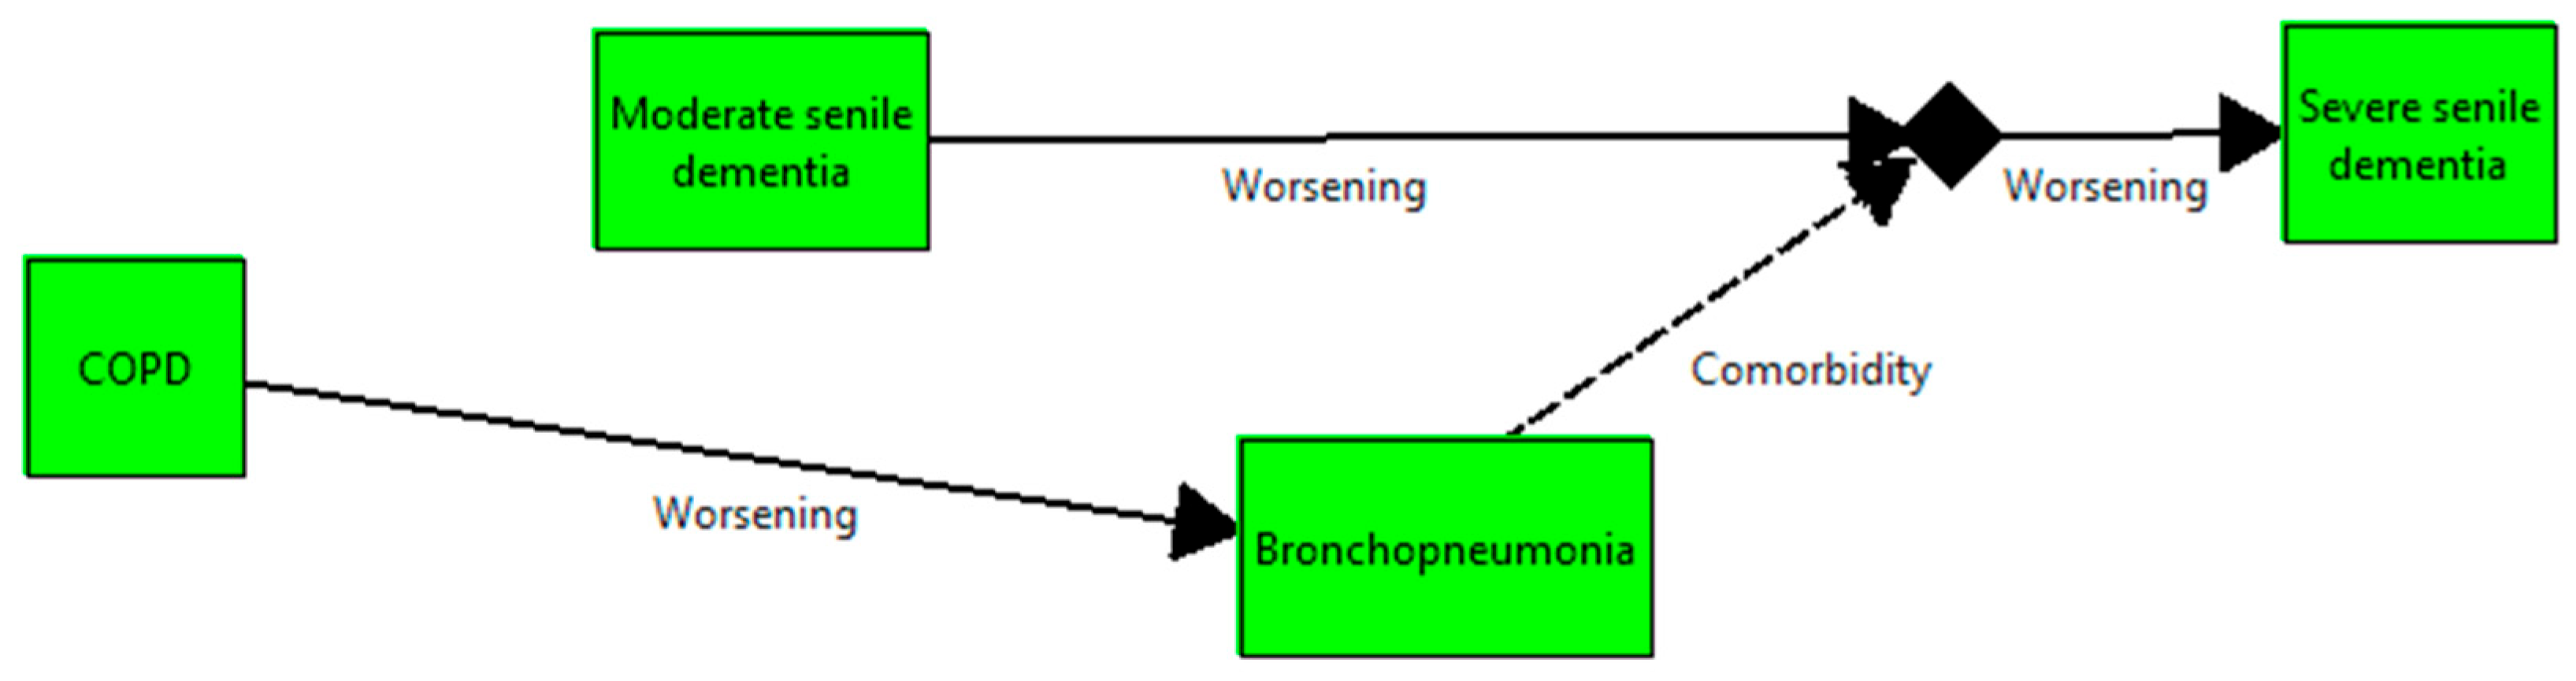
The specialist view focused on the clinical level is presented in
Figure 5.
This specific view is composed of the HIs that belong to the clinical side of the network. Also in this case, as in the specialized view, additional HIs that are directly connected to them through a direct transition and may directly influence the progression of the conditions are included. Examples from the semiotic dimension are fever, cough, and dyspnea that contribute to the worsening of the COPD; in the descriptive view on the clinical level, there is no contribution to the worsening of the COPD. Differently from the example shown for the specialty view, in this case no additional transitions exist between the HIs outside the clinical view; for this reason, the model is considered complete.
4.3. The Analytical View
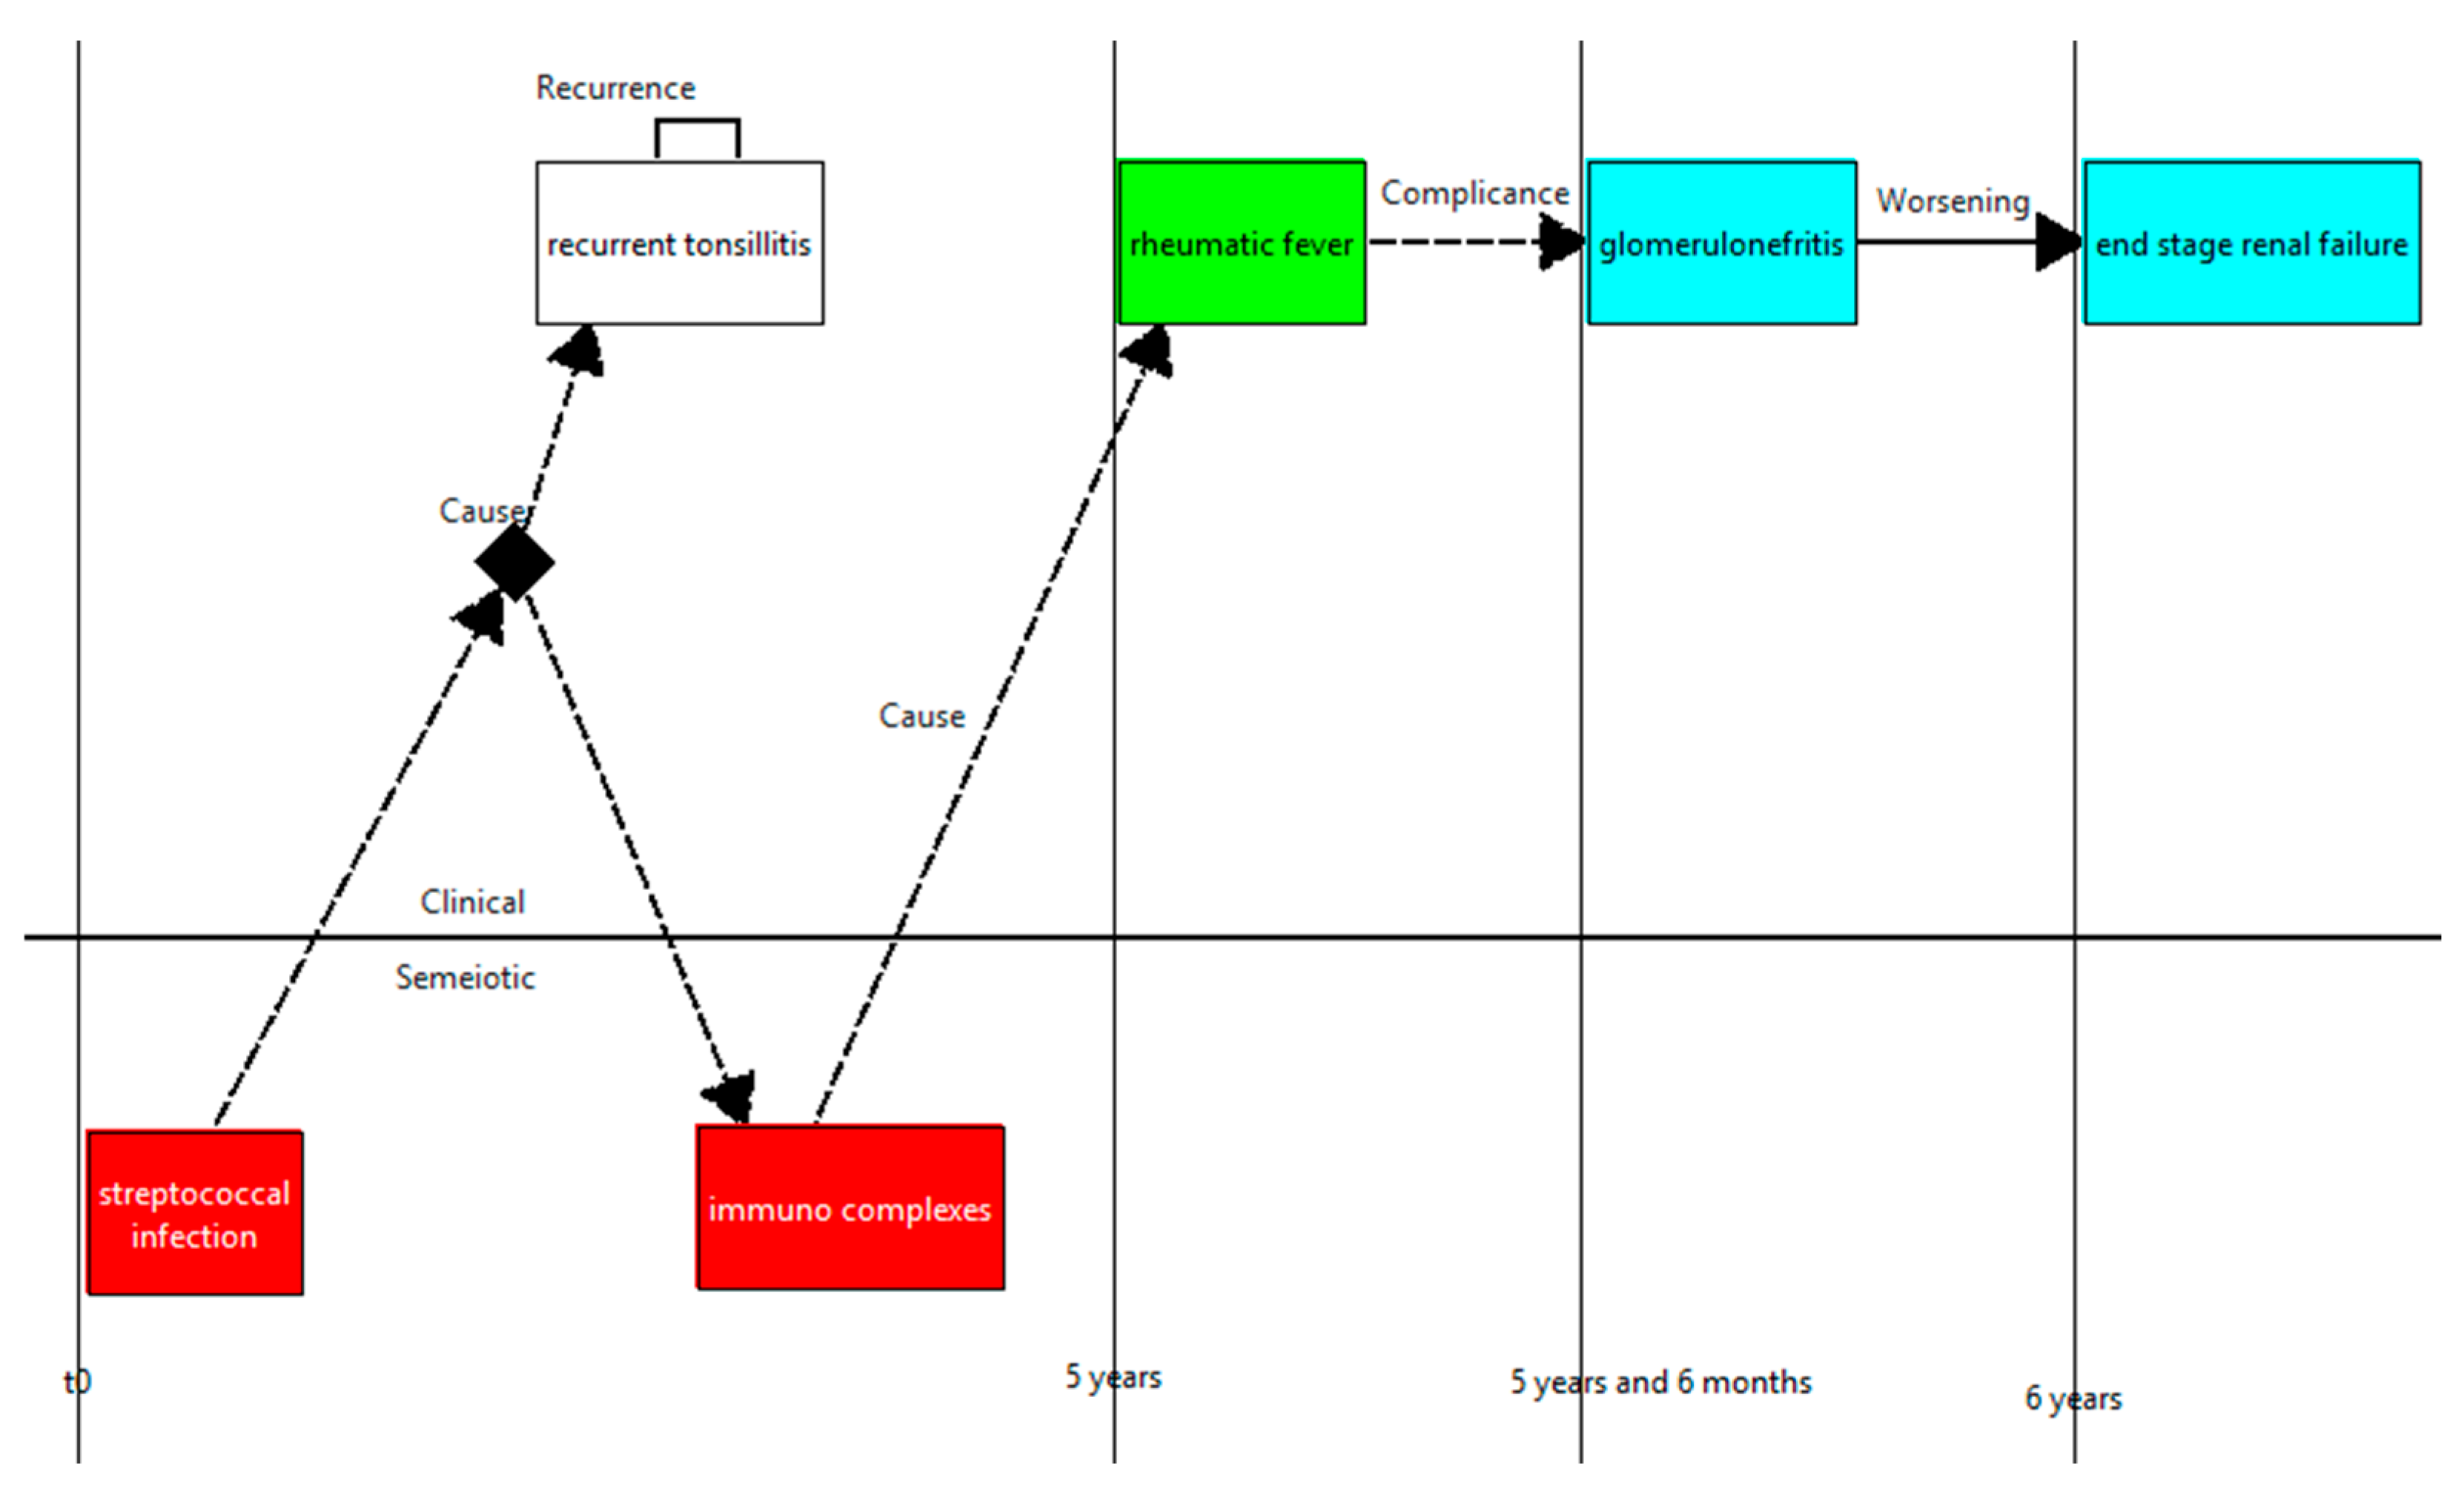
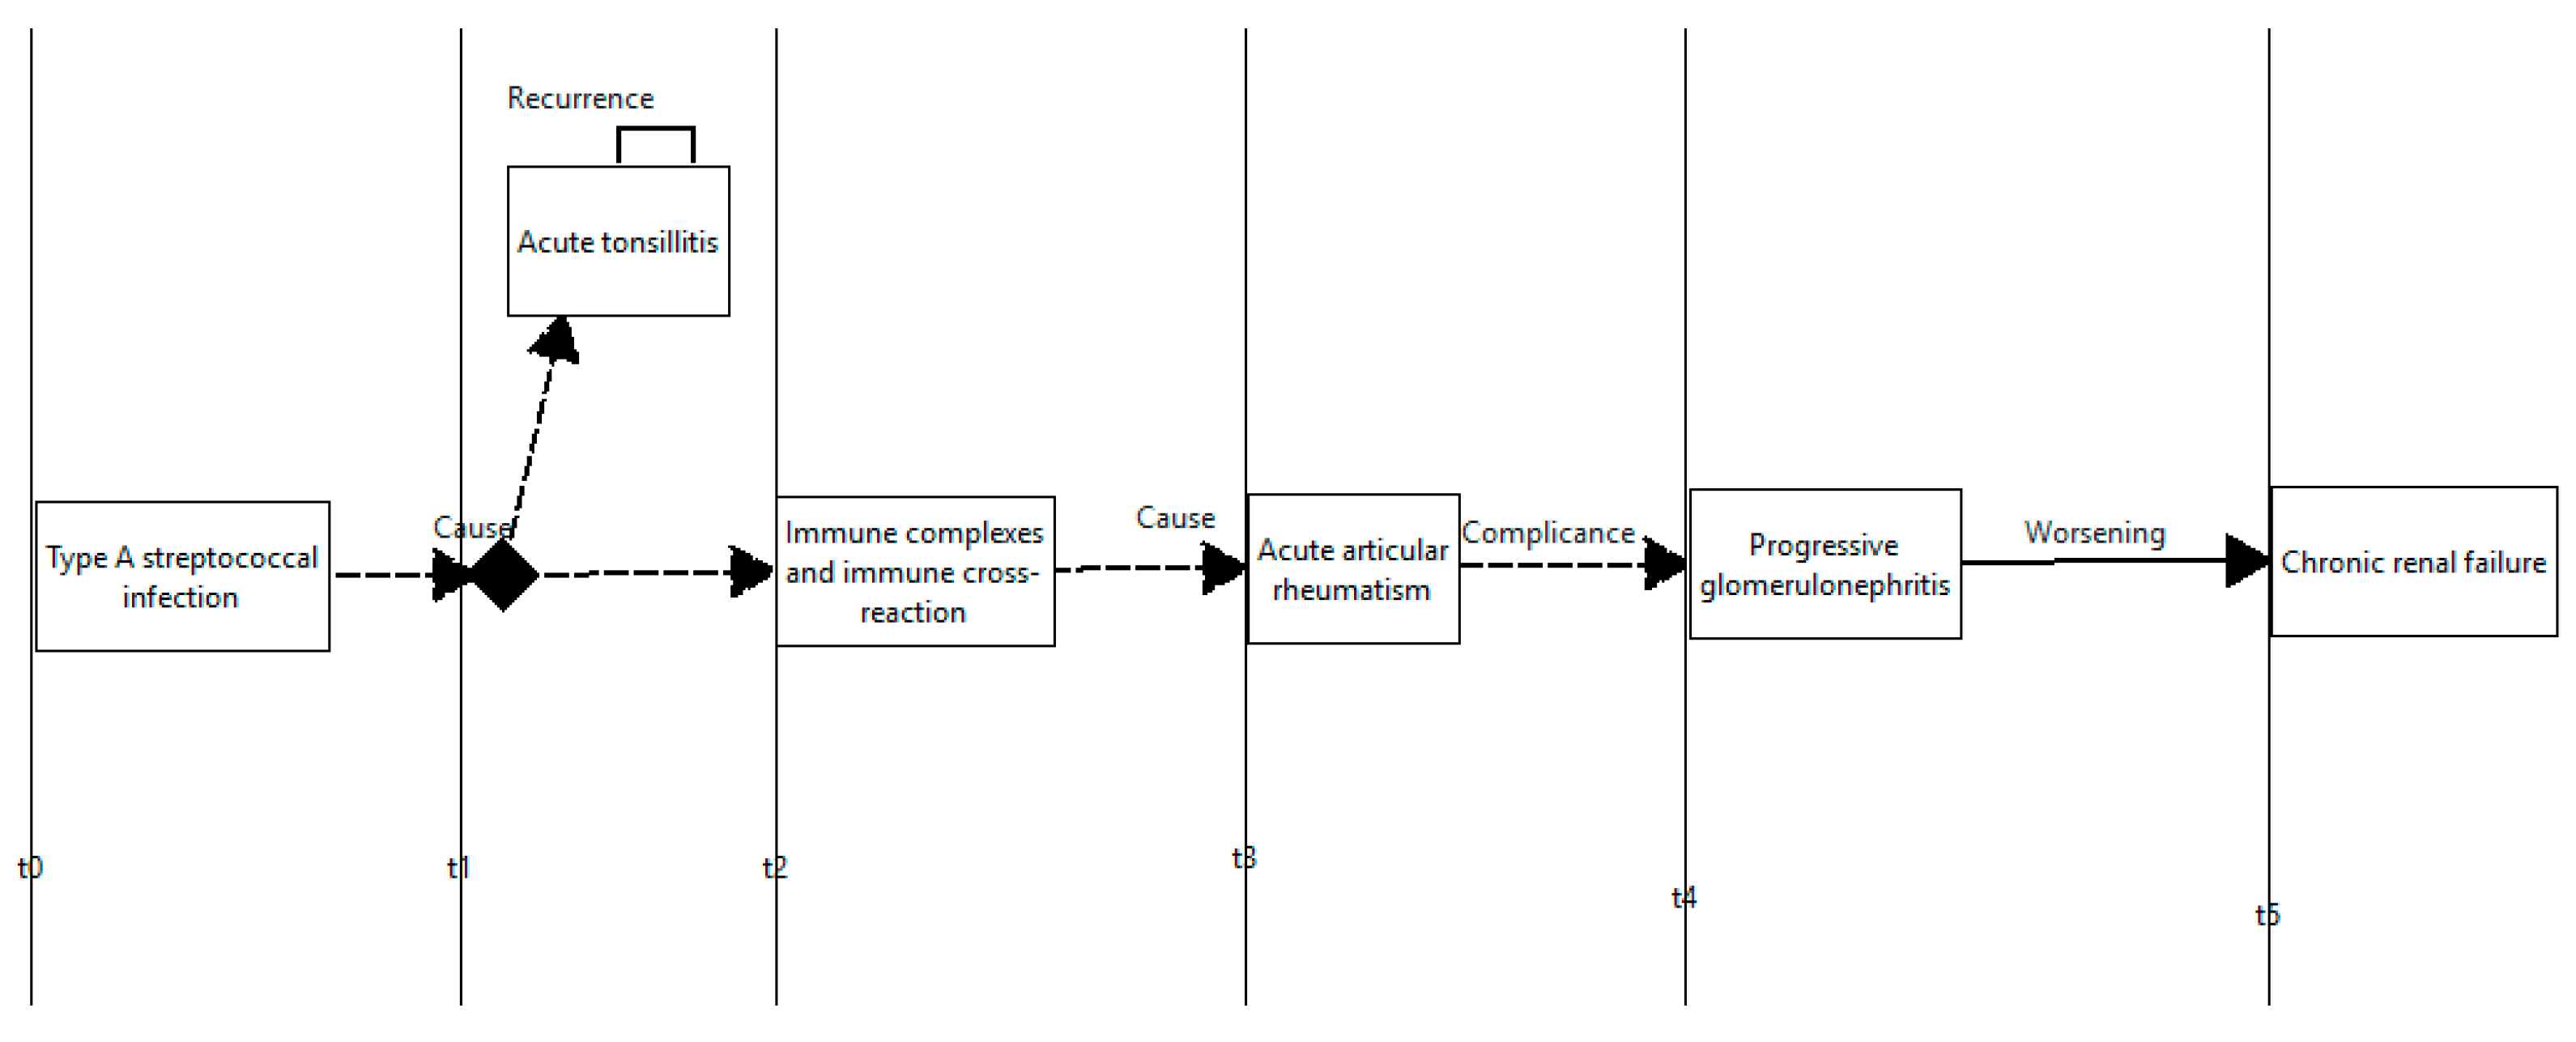
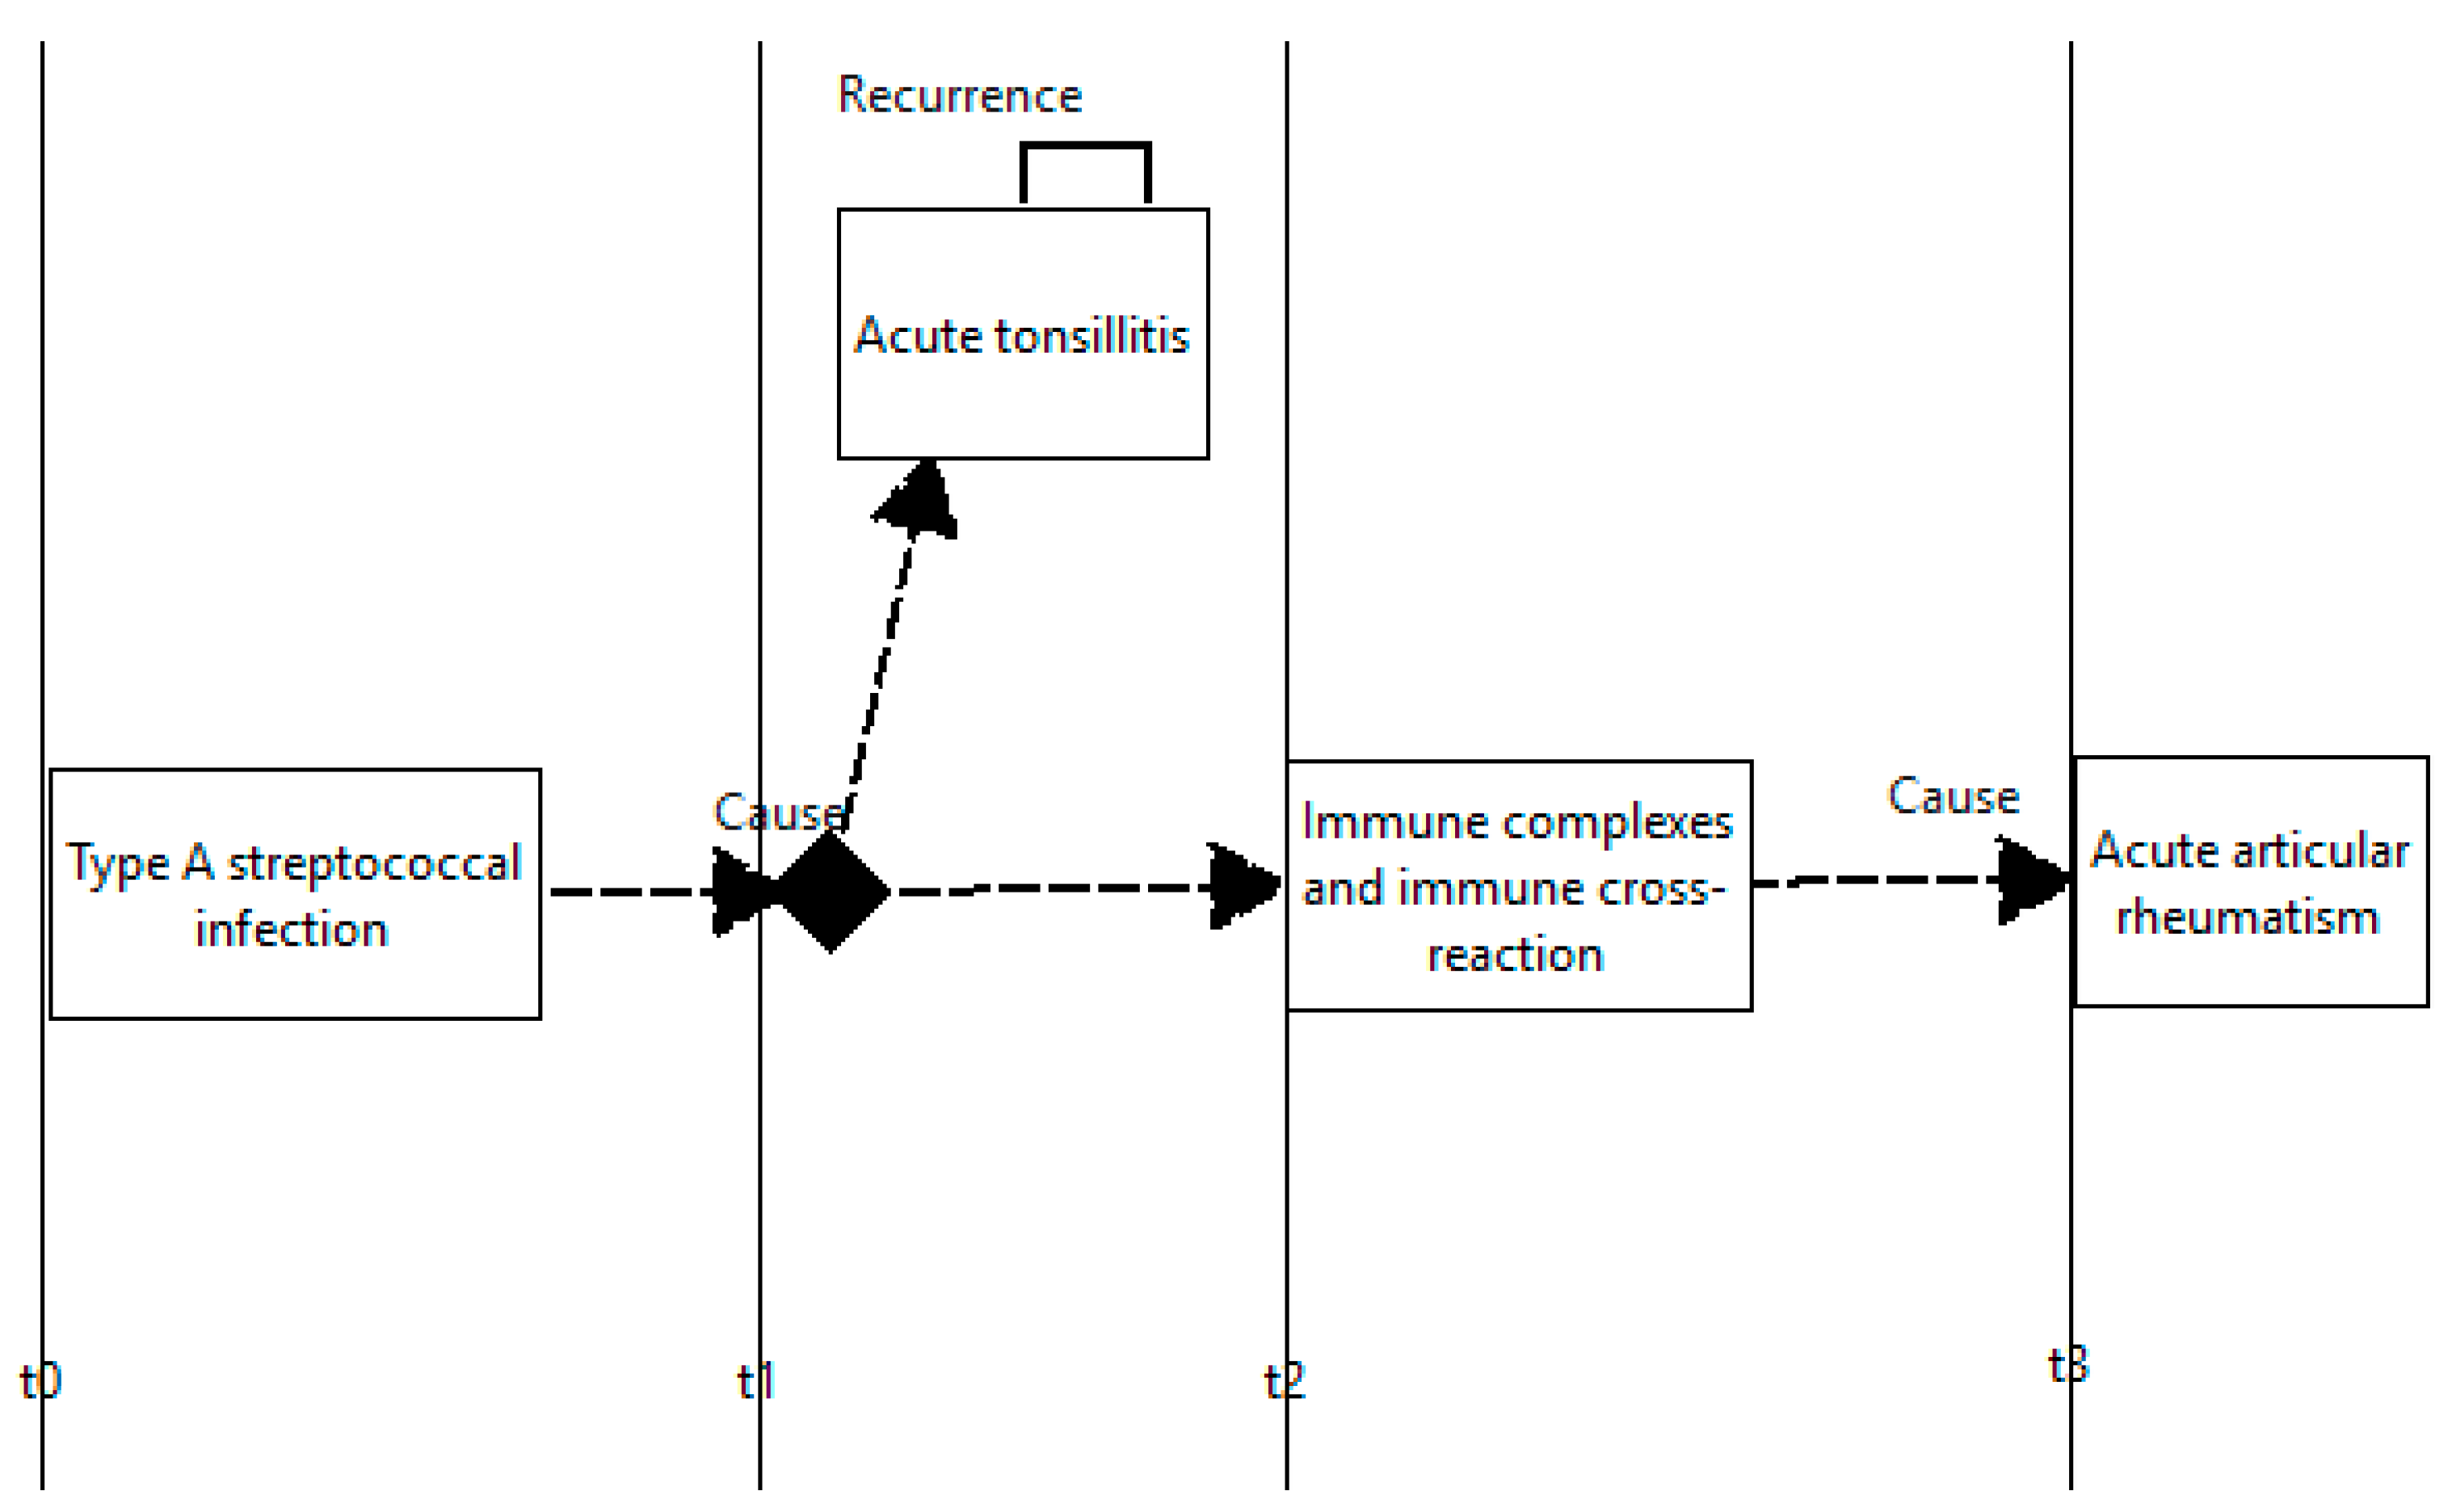
The analytical view represents the evolutionary path of the clinical case over a well-defined period of time, always starting from the moment the clinical case arises. Considering the f-HINe diagram of the reference case presented in
Figure 6, six timestamps can be defined.
The analytical view focused on the [t
0, t
3] time period is presented in
Figure 7.
Also in this case, as in the previous types of view, the network is composed non only of the HIs that occurred within a specific period of time but also including those that are directly connected to them through a direct transition and may directly influence the progression of the conditions. For instance, the progressive glomerulonephritis that occurs after the selected time period as a complication of the acute articular rheumatism is not present in the analytical view. Also in this case, no additional transitions exist between the HIs outside the selected view and for this reason, the model is considered complete.
5. The View Generation
Regardless of the type of view we are applying, its generation (ext) is based on a procedure that accepts the f-HINe diagram from which to extract the comprehensive model as input and produces an output f-HINe diagram representing the view. From a methodological perspective, a view is defined by extracting and removing elements (HI, branching, and evolutions) from the original diagram on the basis not only of a specific goal but also trying to keep the resulting network consistent and descriptive of the case under analysis.
Consider a sequence of HI nodes (path) in the original f-HINe diagram where the initial HI (HIb) and the final HI (HIe) are internal HIs and the rest are external HIs. Removing in the output f-HINE diagram the external HIs breaks the connectivity between internal HIs; to preserve the topological connectedness property (linked to homomorphism characteristic), the evolution (macro-evolution) <hib, hie> (shortcutting) is introduced to replace the path.
The view generation is based on pruning and shortcutting techniques; it is also possible to introduce static branch nodes into the view to maintain the characteristic of a single input to an HI node. All this results in the view being an f-HINe diagram.
To ensure that the dynamics of the evolutionary paths in the output diagram are consistent with the dynamics of the corresponding paths in the original diagram, in the view initial marking the tokens are present in all the source HI nodes. This implies (i) that the final marking of the view is composed only of goal-fulfilling nodes and is contained in the final marking of the original diagram; and (ii) the paths present in the reachability graph of the view are contained in the corresponding paths of the reachability graph of the original diagram. The final marketing characteristic of the view implies that if a goal-fulfilling HI is connected to a non-goal-fulfilling HI via solid edge, the non-goal-fulfilling HI is part of the view even if it does not contribute to the final marketing of the view.
There is the possibility to generate a mixed view as a combination of different view types. Let
be an f-HINe model of a specific reference case, applying the most generic mixed view extraction procedure (composed of all types of views) and then with the chosen swimlanes, levels and timestamps described in the related goal, the extraction result:
where:
, extraction for the descriptive view.
, extraction for the specialist view.
, extraction for the analytical view.
is the finite set of chosen levels.
is the finite set of chosen swimlanes.
is the finite set of chosen timestamps.
The diversity of views also leads to the diversity of their extraction from the original diagram. The procedure that generates the desired view is composed of successive steps series. The most general procedure is explained; by omitting a step, the procedure for each specific view type can be deduced from this procedure.
The most general procedure to define a view consists of the following steps.
The HIs (internal HIs) that correspond to the goal requirements are included in the view. The internal HIs must: (i) belong to the swimlanes of the specialized view; (ii) belong to the levels of the descriptive view; and (iii) be contained within the time range of the analytical view.
Identification of the static branch nodes and evolutions proper to the goal set: the static branch nodes (i.e., aggregators) and evolutions that link internal nodes are included in the view.
Identification of the nodes not proper related to the goal (external HIs): the view defined up to this step is further enriched with a set of external nodes: (i) output nodes, i.e., nodes directly connected as inputs to internal nodes; (ii) the input nodes, i.e., nodes directly connected as outputs to internal nodes but connected via a path to an output node; and (iii) input nodes, i.e., nodes directly connected as outputs to internal nodes via a solid edge.
Definition of macro-evolutions: they are defined and included in the view to replace paths that start and finish at internal nodes and intermediated by external.
Elimination of static branch nodes: once the model has been defined, static branch nodes with only one input HI and one output HI are removed and the two HIs are directly connected by a transition to simplify the f-HINe diagram. The type, label, and data sheet of this new evolution are derived from the two evolutions linked as inputs and outputs to the deleted static branch node.
6. The Macro-Evolution Generation
The concept of a macro-evolution plays a crucial role in the definition of a view to preserve the topological connection property, present in the original diagram. In this way, it is ensured that the dynamics of the evolution paths in the view be consistent with the dynamics of the corresponding paths in the original diagram; macro-evolution is introduced. The original diagram’s topological connectedness property is also maintained in the view by macro-evolution.
Consider the evolution chain <hi1, hea, heb, hec, hi2> of the comprehensive diagram where hi1 is linked with hea that is linked with heb and so on, where hi1 and hi2 are internal nodes of the defined view while hea, heb, hec are external ones. A macro-evolution <hi1, hi2> is defined and included in the model to represent how the input node hi1 elves to the output node hi2.
There are two types of macro-evolutions: “conditioning” indicating that an input health issue contributes to determining an effect, either positively or negatively and leads to the generation of an output health issue. The second one is the “implication” adopted to indicate when an output problem is the consequence of an input problem. The former evolution is represented by a dashed line as, in the HIN language, the token is transferred to the output node while remaining in the input node [
13]. The implication is modeled using a solid line as it does not change the nature of the problem and thus the input health issue evolves into and is replaced by the output problem (i.e., the token is removed from the input node [
13]). Note that, once a specific view is defined, the definition of a macro-evolution is determined by the author of the clinical case, who is also responsible for selecting the labels assigned to evolution. The data sheet associated with the macro-evolution does not exist because its content is not relevant for data analysis of the view.
Some scenarios of using macro-evolutions are presented:
The output and input HI nodes are connected via a path (with all the HIs of the path that are not specific to the goal). These HI nodes are connected by a dedicated evolution (macro-evolution) that replaces the path; the macro-evolution is included in the view (
Figure 8). The macro-evolution, which is part of the view, is a dedicated evolution that goes in place of the path. The view also includes the edges that connect the output and input HI nodes with the corresponding nodes proper to goal.
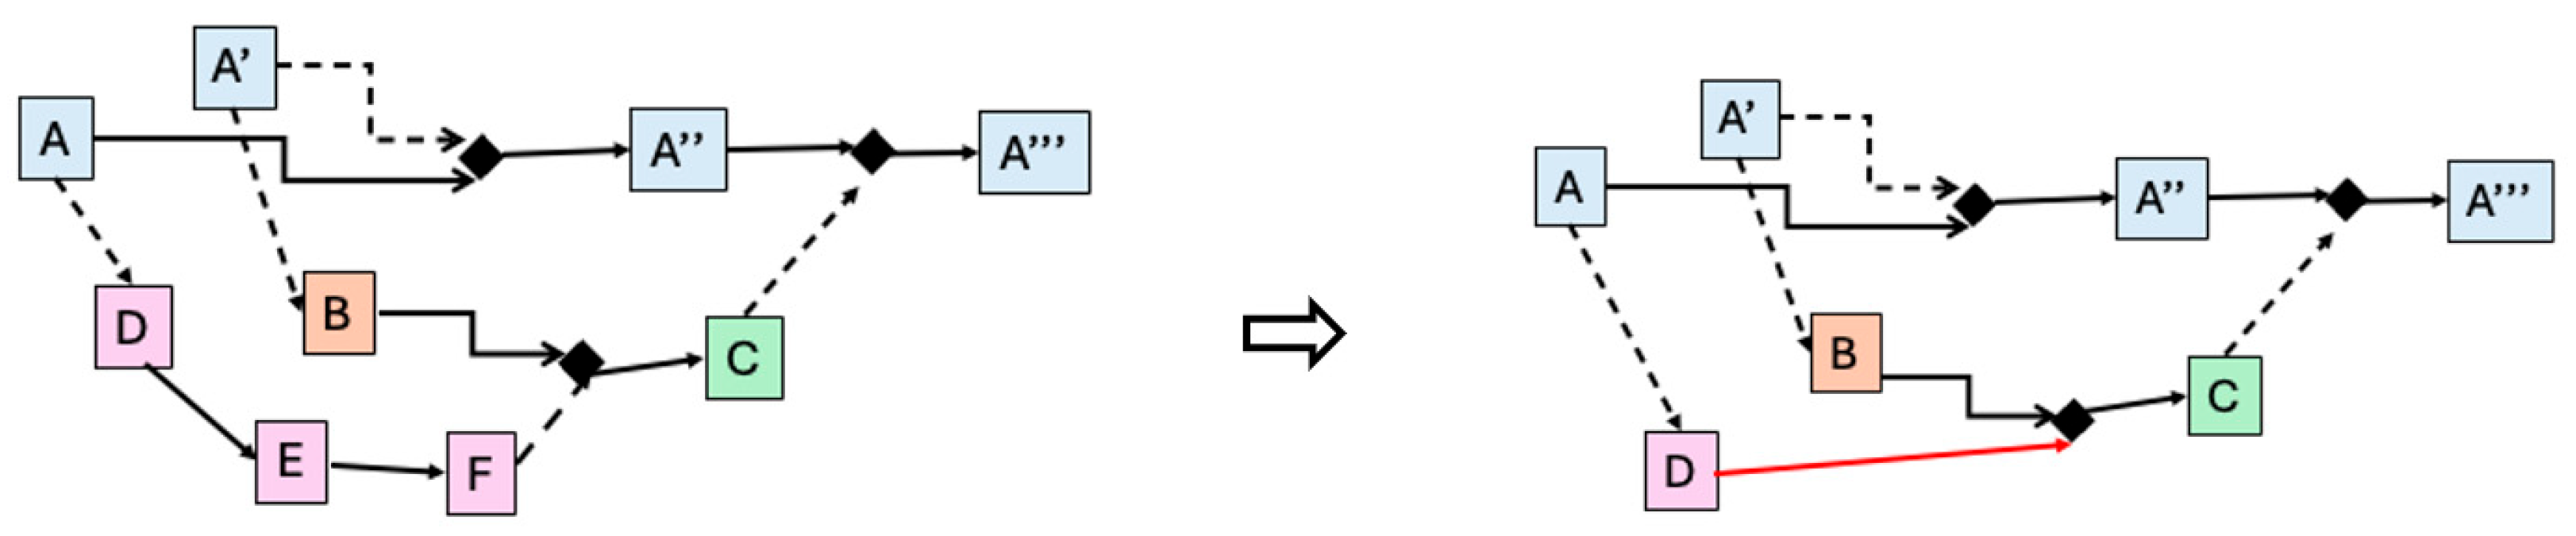
An input HI node is connected to two output HI nodes via two different paths (evolutions), with all the HIs of the paths that are not specific to the goal). Each output HI node is connected to the input Hi node with its own macro-evolution, which is included in the view instead of the path; however, if the output and input HI nodes are directly connected via an evolution, this evolution is included in the view. Two evolution paths arrive at the input HI; due to the characteristics of the f-HINe model, this is not permitted, so the paths arrive at a static branch node that has the input H as its output. This static branch node is included in the view (
Figure 9).
The two paths connect two output HI nodes to the output HI node. We consider that two paths connect a different output HI node to the same input HI node. The two macro-evolutions, which are part of the view, are a dedicated evolution that goes in place of the path. The view also includes the edges that connect the output and input HI nodes with the corresponding nodes proper to goal. The static branch node connecting the output HI nodes and the input HI node is acquired in the view.
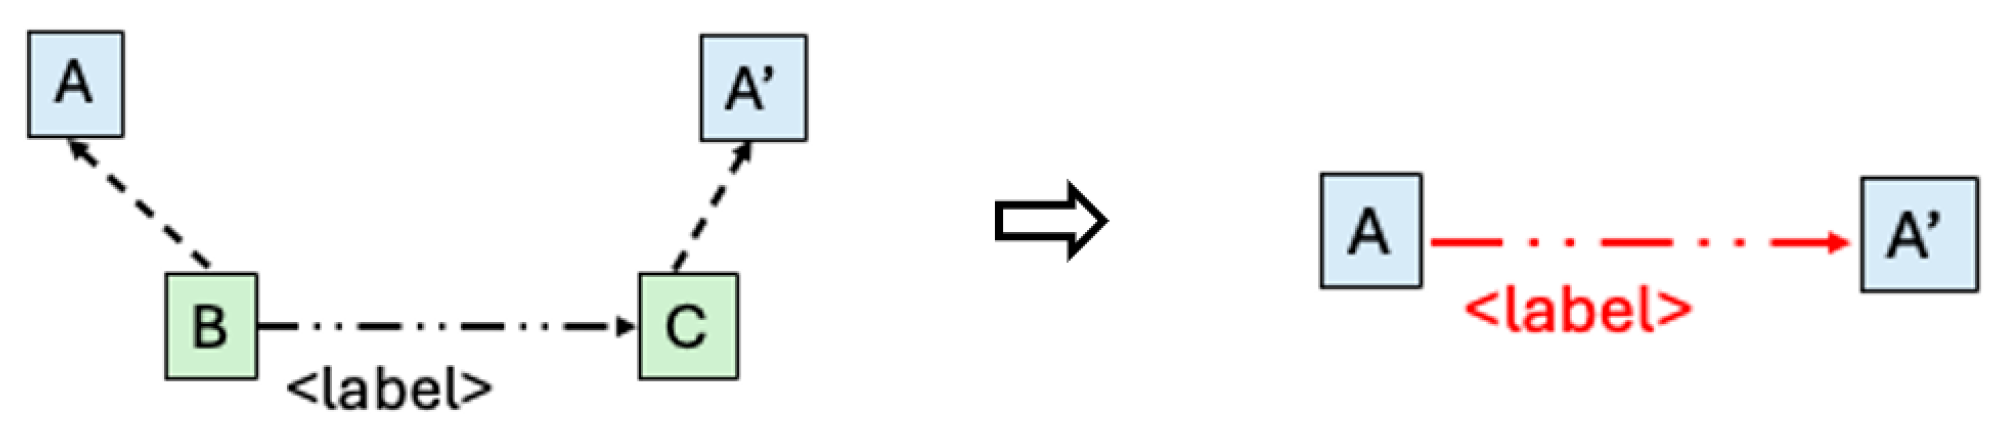
Two HI nodes of the chosen level are indirectly connected via two HI nodes not of the chosen level. Consider the case where (i) two HIs of the level to be eliminated are connected to each other via an appropriate evolution; (ii) each of these HIs has an evolution with an HI of the chosen level; and (iii) the two HIs of the chosen level are not connected to each other with either an evolution or an evolution path (with all the HIs of the path that are not specific to the goal). An evolution is generated between the two HIs of the chosen level with the following characteristics: the direction of the new evolution and its type of evolution/path are those of the evolution of the level to be eliminated: its label and the data sheet are those of the evolution of the level to be eliminated, if it is an evolution to be deleted (
Figure 10). If it is an evolution path to be deleted, the label and the data sheet of the new evolution are generated as if they were a macro-evolution.
An evolution path connects two HIs not belonging to the goal and connects two unconnected HI nodes: this path is not included in the view. Only a new edge is acquired.
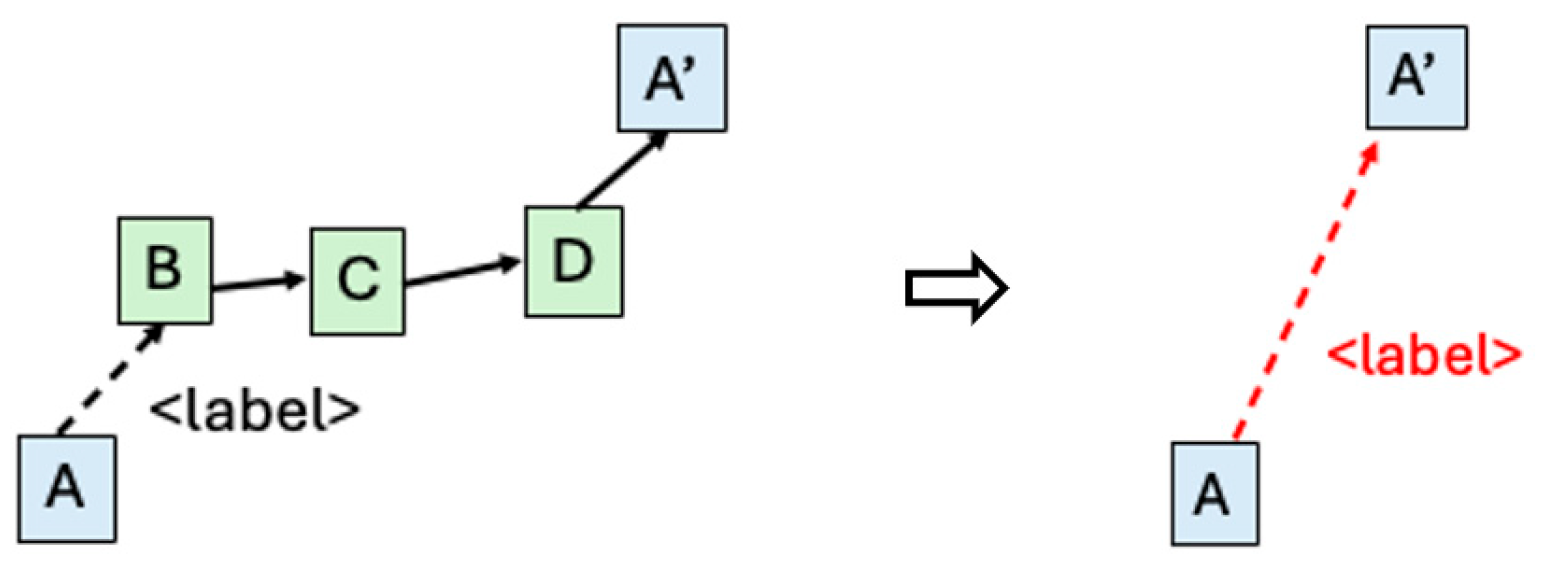
An evolution path, composed of HIs not belonging to the goal, connects two HI nodes belonging to the goal that are not connected to each other. Two HIs of the chosen level are connected via a path of the level to be deleted. A macro-evolution is generated between the two HIs of the chosen level with the following characteristics: the direction of the macro-evolution, its label, and the data sheet are those of the evolution exiting the HI node of the chosen level (
Figure 11). This evolution is not included in the view. Only a new macro-evolution is acquired.
A simple mathematical formalization of the f-HINe model and of the generation of macro-evolutions are illustrated in the
Appendix A.
7. Indicator of Educational Flexibility
The formulas for calculating the number of different view types provide a measure of the flexibility of the f-HINe diagram of a real/realistic clinical case; in other words, they provide the number of different “points of view” from which to analyze the clinical case. Therefore, the formula for the flexibility indicator must take into account the combination of specialized, descriptive, and analytical views.
Consider an f-HINe diagram represented by levels (with ≥ 1), in which there are (with ≥ 1) specialization swimlanes; the clinical case is developed at (with ≥ 2) timestamps. Note that at least one level and one swimlane adding two times points are needed to define an f-HINe diagram; furthermore, the whole f-HINe diagram that models the referring case is considered a view.
7.1. Number of Descriptive Views
Assuming that each level of the f-HINe diagram comprises all the specialization swimlanes, the number of descriptive views is computed as the sum of all possible combinations of the diagram levels:
where
is the number of levels present in the f-HINe diagram.
The presence of the number 1 is due to the fact that the diagram with zero levels is not considered among the combinations.
7.2. Number of Specialized View
Similar to the reasoning for the indicator for levels only, for each grouping of specialization swimlanes, all levels must be considered; the number of such groupings is
where
s the number of swimlanes in the f-HINe diagram.
Also in this case, the presence of the number 1 is due to the fact that the diagram with zero levels is not considered among the combinations.
7.3. Number of Analytical View
For each time interval grouping, all specialization swimlanes and levels must be considered: a temporal interval is defined by a pair of timepoints (t
i, t
j) representing, respectively, the starting and ending timestamps, where t
i < t
j. Therefore, the number of possible intervals corresponds to all the 2-combinations of the timepoints:
where
t is the number of timestamps present in the f-HINe.
7.4. Flexibility Indicator for View
The number of views with the various groupings of specializations with all groupings of levels (the reasoning holds if we interchange the specializations with the levels) is
The presence of the number 1 is due to the fact that the calculation formula does not consider the grouping with zero levels, which leads to the non-existence of the f-HINe diagram. Therefore, the number of all possible mixed views is
Consider the mixed view by selecting levels, swimlanes, and timestamps. Therefore, the number of all possible mixed views is
Starting from Formula (10), it is possible to compute the flexibility indicator (FI) for views expressed on a logarithmic scale (Formula (11)) for easier representation and comparison:
This formula is the general formula for calculating the flexibility indicator; this formula includes all other indicators. If there is only one swimlane, the flexibility indicator is obtained only for the specialized views, and similarly for the case of swimlanes and on.
Note, if we consider all possible mixed views based on swimlanes and levels (with
= 2), the flexibility indicator is
If the exponentials of 2 grow quickly, the formula can be approximated as
Starting from Formula (10),
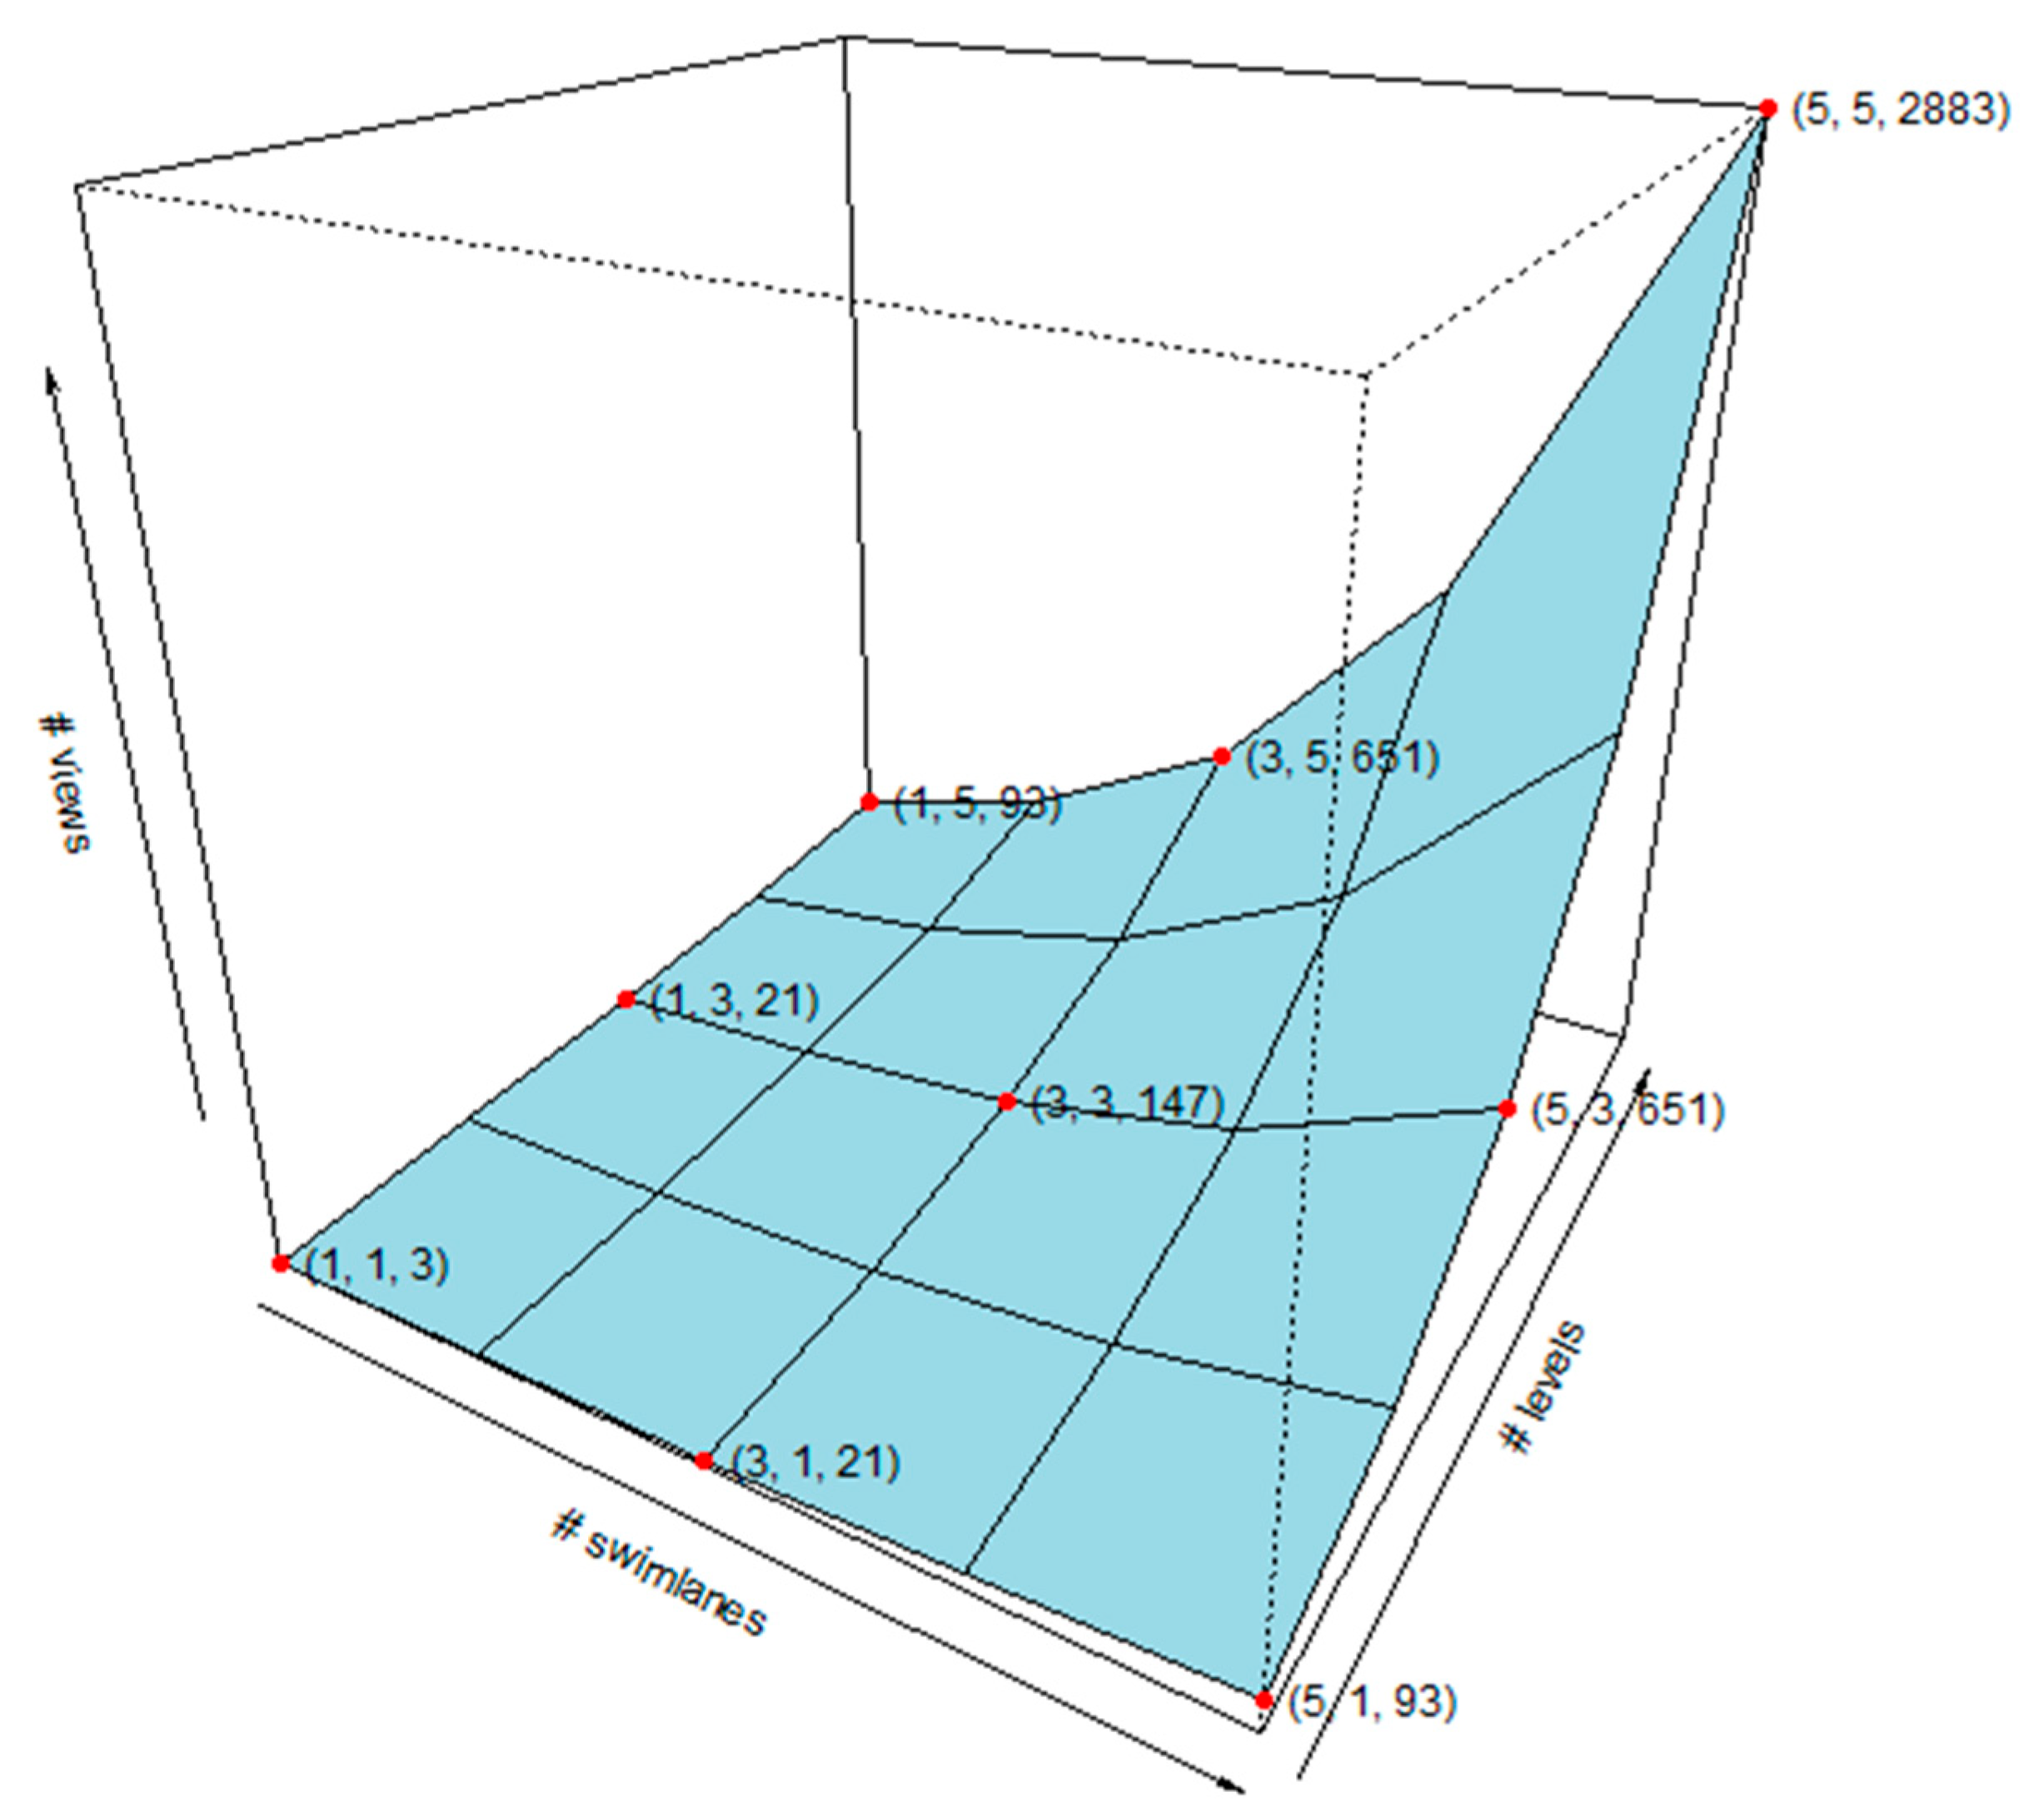
Figure 12 illustrates the qualitative growth of the number of extractable views (
) from an f-HINe reference case as the number of swimlanes and levels increases, highlighting how the combinatorial composition of perspectives expands the view space. The surface emphasizes that richer structural representations of a clinical case enable a broader set of possible educational views. This representation is proposed for a number of timepoints set to 3 (i.e., t = 3), with the total number of extractable views increasing linearly with the number of timepoints considered. As shown, the total number of possible views considering 5 levels, 5 swimlanes, and 3 timepoints is 2883. Note that the index represents the maximum number of views that can be defined starting from a network composed by different levels, swimlanes, and timepoints. It should be noted that not all the possible views that can be defined from a diagram are medically interesting. For example, this may occur when a patient has experienced very different health conditions or interventions, such as hip replacement surgery (orthopaedics), hypertension (cardiology), and myopia (ophthalmology).
Appendix B includes two illustrative examples showing the computation of the maximum number of views.
8. Discussion
This paper analyzes three issues: the views, the view extraction, and the educational flexibility indicator.
8.1. Discussion on View
The three perspectives (descriptive, specialized, analytical) allow clinical expertise to be built at different educational and professional stages.
The descriptive perspective provides a foundation for understanding complex phenomena through the ability to explain interactions, mechanisms, and causal relationships. For teaching, it enables the acquisition of fundamental knowledge to understand and explain processes. For professional development, it is a rethinking tool, allowing one to rethink one’s specialized knowledge within a broader narrative network.
The specialized perspective enables mastery of specific areas, protocols, and guidelines through vertical and case-specific analysis. For teaching, it is essential for specialist residents to achieve specific expertise in their field and acquire expertise in their specific field, but for undergraduate students, it risks fragmentation, creating a disconnected view of the patient. For professional development, it assumes a reflective role, capable of integrating different developmental trajectories of the case, indispensable in the hared management of polychronic patients.
The analytical view provides an integrated and dynamic view of the case and is a metacognitive tool. For teaching, and particularly for doctoral students, it is crucial for the acquisition of advanced clinical reasoning and supports the construction of a common language. For continuing education, it still plays a reflective role, but within a broader vision, transcending the limitations of a single perspective.
The integration of these three perspectives (mixed view) generates the necessary dynamic tension that drives the development of clinical expertise, regardless of the level of training or continuing education.
The f-HINe approach uses three perspectives (descriptive, specialized, analytical), each essential and progressive, and allows clinical expertise to be built at different educational and professional stages.
8.2. Discussion on View Extraction
There are different ways to extract a view: extracting a view means selecting, organizing, and structuring a coherent set of information from the clinical case. In the literature, one does not find terms like view extraction but similar topics such as data extraction and clinical histories extracted from clinical texts [
14,
15,
16]. There are various techniques for extracting concepts from a clinical text; with regards to AI methods [
17]: (i) rule base (for example, [
18]); (ii) machine learning (for example, [
19]); (iii) deep learning (for example, [
20]); and (iv) mixed approaches (for example, [
21]). These systems generally extract atomic clinical concepts (diagnosis, drugs, symptoms); and even if they extract temporal information [
8], they are only fragments and not yet a true “integrated view”. Therefore, they offer a static, non-evolutionary vision linked to the interaction between concepts as in the case of the f-HINe™ model [
5]. Wu et al. [
22] highlights that since 2022, there have been papers that try to model the trend of cases over time but have difficulty in building a coherent story; there are various limitations linked to the difficulty: (i) in representing clinical transitions (e.g., remission, relapse, response to therapy) and even more so evolutions; (ii) linking clinical events over time; and (iii) distinguishing between successive or overlapping evolutionary processes. This results in the difficulty of isolating and coherently describing the evolutions of clinical problems specific to a medical specialty together with the clinical problems of other medical specialties that influence it: they are unable to obtain “complete” specialist views. Precisely because it aims to model the temporal reasoning that guides the evolution of the clinical case, the f-HINe™ model [
5] allows us to overcome these limitations.
8.3. Discussion on Indicators of Educational Flexibility
The CBL pedagogical approach is a teaching tool used in various medical fields that employs realistic/real clinical cases to help connect theory and practice. Its impact can range from simple knowledge acquisition to improved patient care outcomes. The review by [
23] provides an overview of CBL applications globally, highlighting the growing importance of CBL as a pedagogical approach that fosters active learning through the presentation of realistic clinical cases.
Starting from this recognition of the importance of the CBL approach, the current literature offers several tools for evaluating clinical cases, primarily focusing on intrinsic complexity. For example, Braun and colleagues [
24] propose a scoring system based on five categories (history, physical examination, technical findings, psychosocial aspects, secondary diagnoses) and the linearity of the information. The authors themselves acknowledge that there may be other aspects of complexity not yet covered by their model.
A literature review of indicators for evaluating clinical cases in medical education focuses primarily on indicators of general case complexity and cognitive load. The analysis revealed that the intrinsic complexity of the case is measured, not its ability to generate views for different clinical specialized teaching contexts. In fact, there are still no specific measures for what we define as “educational flexibility” based on specialized swimlanes and multiple levels. This methodological gap highlights the opportunity to develop new approaches to quantifying the teaching versatility of complex clinical cases.
In the f-HINe approach, the indicator for measuring educational flexibility allows for the targeted selection of cases as it consists of (i) a targeted selection of cases for specific training objectives based on the students’ skill levels; (ii) balancing the teaching load across different clinical specialties by focusing on areas of specialized interest; (iii) customization based on the student’s profile; (iv) applicability to different training contexts; and (v) maximizing the educational return on investment in case development through the possibility of modular and structured teaching progression.
The proposed indicator calculation method offers multiple advantages: (i) objective quantification of teaching potential; (ii) scalability through logarithmic representation; (iii) mathematical reproducibility of the method; (iv) ease of representation and comparison due to the presence of the logarithmic scale.
This study is based on pedagogical principles supporting the construct of flexibility and has developed a mathematical method to calculate the theoretical number of views that can be extracted from the HIN diagram of a “reference case”. This number has been used as a “flexibility indicator” for complex clinical cases. As discussed above, this indicator is aimed at both teachers and students. For the former, in order to support the choice of a case to develop a series of exercises, the higher the value, the more exercises can be developed. For students, the indicator provides a measure of the richness of a case in terms of specialized, descriptive, and analytical views, enabling more informed and personalized education.
A natural extension of the proposed framework would be the integration of learner performance data into an adaptive educational cycle. In such a scenario, student interactions with the generated clinical views—such as diagnostic reasoning, therapeutic decisions, and error patterns—could be systematically collected and analyzed. These data could be used not only to evaluate learning outcomes but also to iteratively refine the generation of new views and teaching scenarios. Conceptually, this feedback-driven process is related to the paradigm of reinforcement learning from human feedback (RLHF), where human evaluations guide the iterative improvement of model behavior and outputs [
25,
26]. In an educational context, aggregated student feedback could help dynamically adjust parameters of case generation, such as the emphasis on specific specialties, the complexity of analytical levels, or the temporal scope of the extracted view. Implementing such an adaptive learning loop would require a dedicated educational platform capable of collecting and processing learner interaction data. While the development of such infrastructure is beyond the scope of the present work, it represents a promising direction for future research aimed at transforming the proposed framework into a fully adaptive clinical education support system.
This study did not aim to empirically measure the effectiveness of using a flexibility indicator in clinical learning. A further comparative study is currently being designed.
9. Conclusions
The analysis highlights a significant gap in the scientific literature regarding the quantification of the educational flexibility of complex clinical cases. The proposed combinatorial approach, based on the combination of specialty swimlanes and levels of analysis, represents an innovative contribution to the field of medical education.
The mathematical formula presented here offers a rigorous quantitative framework for assessing the teaching versatility of clinical cases, filling a methodological gap identified in the existing literature.
This approach could provide the basis for developing more sophisticated tools for the selection, categorization, and optimal use of clinical cases in specialized medical education, contributing to the improvement of teaching effectiveness in CBL.