1. Introduction
Personal protective equipment (PPE) detection has emerged as a critical component of automated safety monitoring systems in industrial and construction environments. The integration of computer vision technologies into safety management workflows offers the potential to continuously monitor large-scale operations, identify safety violations in real-time, and provide immediate interventions before incidents occur. However, the practical deployment of such systems demands object detection architectures that can simultaneously achieve high accuracy across diverse PPE categories while maintaining computational efficiency suitable for edge devices and real-time processing constraints.
The YOLO (You Only Look Once) family of object detection models has established itself as the dominant paradigm for real-time detection tasks, with successive iterations progressively advancing the state-of-the-art through architectural innovations in backbone design, feature fusion mechanisms, and loss function formulations [
1,
2,
3,
4]. Recent developments have focused on balancing detection accuracy with computational efficiency, addressing the diverse deployment requirements spanning edge devices to cloud infrastructure [
5,
6,
7]. The Ultralytics framework has emerged as the primary implementation platform, providing unified access to multiple YOLO variants and facilitating systematic comparative evaluation [
8].
The recent release of YOLOv11 introduced significant improvements in training stability and inference efficiency through optimized backbone structures, refined prediction head designs, and streamlined post-processing mechanisms requiring Non-Maximum Suppression (NMS) for final predictions [
8]. Following closely, YOLO26 emerged on 14 January 2026, with a fundamentally different architectural philosophy [
9]. The architecture introduces three key innovations: first, an end-to-end design eliminating NMS requirements for simplified deployment; second, the MuSGD optimizer combining Stochastic Gradient Descent with Muon optimizer concepts inspired by Moonshot AI’s Kimi K2 language model; and third, architectural enhancements including removal of Distribution Focal Loss (DFL) modules, introduction of ProgLoss combined with Spatial-Temporal Attention Loss (STAL) for improved small object detection, and optimizations yielding up to 43% faster CPU inference compared to previous YOLO versions [
9,
10].
Given YOLO26’s recent release (January 2026), empirical evaluation on real-world application domains remains limited. Recent technical reports have analyzed YOLO26’s architectural innovations and benchmark performance [
10,
11,
12], providing valuable insights into the end-to-end NMS-free design, MuSGD optimizer characteristics, and performance on standard datasets like COCO. However, systematic evaluation across diverse real-world PPE detection scenarios with varying dataset scales, class distributions, and operational constraints remains unexplored. This gap is particularly significant given that specialized industrial applications often exhibit characteristics—such as extreme data scarcity, domain-specific class distributions, and deployment constraints—that differ substantially from benchmark evaluation protocols.
The practical challenges of PPE detection extend beyond those captured by standard object detection benchmarks. Industrial safety monitoring presents unique difficulties including extreme scale variations (small distant workers versus close-up equipment), severe occlusions in cluttered environments, class imbalance between common and rare PPE items, and the critical requirement for high precision to minimize false alarms that could lead to alert fatigue [
13,
14]. Recent studies have explored various deep learning approaches for PPE detection, including YOLO-based methods [
15,
16,
17], metaheuristic optimization approaches [
18], and hybrid approaches combining multiple detection paradigms [
19,
20]. However, comprehensive comparative evaluation of the latest YOLO architectures across diverse PPE detection scenarios remains scarce, limiting evidence-based guidance for practitioners selecting architectures for specific deployment contexts.
The primary research question guiding this study is: How do YOLO26 and YOLOv11 architectures differ in detection performance and computational efficiency across varying model scales and dataset sizes in PPE detection, and what deployment guidelines can be derived from these differences for practitioners operating under diverse resource and data constraints? This question deliberately frames the study as a systematic benchmarking effort rather than an architectural proposal; the goal is to provide conditional, context-sensitive guidance for architecture selection rather than to assert general superiority of either model.
The present study addresses this gap through a comprehensive comparative evaluation of YOLO26 and YOLOv11 architectures across three carefully selected PPE detection datasets that directly address contemporary object detection challenges including few-shot learning scenarios, small object detection, and operation under challenging industrial conditions. The datasets comprise CHV (133 images, 6 classes) exemplifying data-scarce specialized applications [
21], SHEL5K (1000 images, 3 classes) representing medium-scale focused detection tasks [
22], and SH17 (1620 images, 17 classes) capturing large-scale fine-grained categorization challenges [
23]. Each dataset was selected to probe different aspects of architectural performance: CHV evaluates generalization from limited training data, SHEL5K examines behavior on focused detection tasks with moderate data availability, and SH17 tests scalability to complex multi-class scenarios with substantial inter-class similarity.
Our experimental design ensures rigorous control of confounding variables through several methodological safeguards. First, all models across both architectures and all five scale variants (nano, small, medium, large, X-Large) were trained using identical hyperparameter configurations, including learning rate schedules, augmentation strategies, and optimization settings. Second, all experiments utilized identical hardware infrastructure (NVIDIA Tesla A100 GPUs with 80 GB VRAM) to eliminate performance variations attributable to different computational environments. Third, both architectures were initialized from COCO-pretrained weights to leverage transfer learning and ensure fair comparison of fine-tuning capabilities rather than training-from-scratch behaviors [
24]. Fourth, comprehensive metrics spanning accuracy (mAP50, mAP50–95, precision, recall, F1-score), efficiency (inference latency, training time, throughput), and complexity (parameter count, FLOPs) were systematically recorded to enable multi-dimensional performance characterization.
The architectural innovations distinguishing YOLO26 merit detailed examination given their departure from conventional YOLO design principles. The elimination of NMS through end-to-end training represents a significant philosophical shift, aligning with recent trends in transformer-based detection architectures like DETR [
25,
26]. This design choice potentially reduces deployment complexity and improves worst-case latency guarantees critical for safety applications, as NMS operations can introduce unpredictable processing delays when dealing with dense object configurations [
12]. The MuSGD optimizer represents another major innovation, incorporating momentum-based optimization strategies that have proven effective in large language model training [
9,
11]. The removal of DFL modules simplifies model export and deployment across diverse hardware platforms, while the introduction of ProgLoss and STAL specifically targets small object detection—a critical capability for identifying distant workers or partially occluded PPE items in industrial environments [
10].
Recent developments in object detection have explored various architectural paradigms beyond conventional anchor-based designs. Comprehensive surveys of object detection methods highlight the rapid evolution from traditional approaches to deep learning-based techniques, with particular emphasis on real-time detection capabilities [
27,
28,
29]. Transformer-based approaches, pioneered by DETR, eliminate hand-crafted components like anchor generation and NMS through set-based global reasoning [
25]. Subsequent improvements in Deformable DETR addressed computational efficiency concerns while maintaining the benefits of global attention mechanisms [
26]. Two-stage detectors like Faster R-CNN continue to achieve state-of-the-art accuracy on certain benchmarks through explicit region proposal mechanisms [
30], though at significant computational cost. Single-stage detectors including SSD and the YOLO family prioritize inference speed, making them more suitable for real-time applications despite potential accuracy trade-offs [
31,
32].
The YOLO architecture family specifically has undergone continuous refinement, with recent iterations introducing innovations in backbone design, feature pyramid networks, attention mechanisms, and loss function formulations [
5,
33,
34]. However, systematic comparative evaluation across different YOLO generations on specialized application domains remains limited. Most existing studies focus on benchmark datasets like COCO or Pascal VOC [
35,
36], which, while valuable for establishing general performance characteristics, fail to capture the specific challenges inherent to specialized applications like PPE detection. The scale-dependence of architectural advantages represents a particularly important yet underexplored dimension in existing literature [
37,
38,
39].
Contemporary research in PPE detection has explored various methodological approaches, including attention mechanisms for improved feature extraction [
13], multi-scale detection strategies for handling size variations [
14], evolutionary optimization techniques for architecture enhancement [
18], and lightweight architectures for edge deployment [
17]. Recent work has also investigated multi-scale detection with knowledge distillation for efficient PPE compliance monitoring [
15], occlusion handling strategies for cluttered industrial environments [
16], and ensemble approaches combining multiple detection models [
19]. The anchor-free design paradigm, pioneered by architectures like DETR and adopted in YOLO26, represents a fundamental shift in object detection methodology [
25]. Our work contributes to understanding when anchor-free designs (YOLO26) outperform conventional approaches (YOLOv11) across different deployment scenarios and data availability regimes, particularly in few-shot learning contexts where limited training data constrains model performance. Despite these advances, comprehensive evaluation of the latest YOLO architectures (YOLOv11 and YOLO26) across diverse PPE detection scenarios remains absent from the literature.
The scale-dependence of architectural advantages represents a particularly important yet underexplored dimension. While previous work has compared different detection architectures, systematic evaluation across the full spectrum from nano to X-Large variants remains rare [
7,
40]. This gap is problematic because deployment contexts vary dramatically: edge devices on construction sites may be limited to nano or small models due to memory and computational constraints, cloud-based offline analysis can leverage X-Large variants for maximum accuracy, and intermediate scenarios require careful navigation of speed-accuracy trade-offs. Understanding how architectural differences manifest across scales is essential for providing actionable deployment guidance to practitioners.
Similarly, the interaction between dataset characteristics and architectural performance deserves deeper investigation. For PPE detection specifically, practitioners face diverse operational scenarios: small specialized datasets for niche industrial applications, medium-scale datasets for focused tasks like helmet detection, and large comprehensive datasets for general safety monitoring. The extent to which architectural advantages generalize—or fail to generalize—across these scenarios remains unclear, yet this understanding is crucial for informed architecture selection in practice. Recent surveys have identified this gap as a critical limitation in current object detection research [
27,
28].
This study makes several contributions to both the computer vision and industrial safety literatures. First, we provide the most comprehensive comparison to date of YOLO26 and YOLOv11 architectures specifically for PPE detection, examining 30 distinct model configurations (2 architectures × 3 datasets × 5 scales) under rigorously controlled experimental conditions. This represents one of the first empirical evaluations of YOLO26, released in January 2026, on real-world application tasks beyond standard benchmark datasets [
10,
11,
12].
Second, we reveal a consistent scale-dependent performance pattern where YOLOv11 excels at nano and small scales across all datasets, performance converges at medium scale, and YOLO26 establishes superiority at large and X-Large scales, with the X-Large variant achieving advantages ranging from 1.3% to 3.1% across the three datasets. This pattern, replicated across three diverse datasets with vastly different characteristics, suggests fundamental architectural properties rather than dataset-specific artifacts, providing novel insights into the capacity requirements for YOLO26’s architectural innovations to manifest their full potential.
Third, we report an exploratory negative correlation (
,
) between dataset size and YOLO26’s performance advantage, suggesting that architectural innovations may provide particular value in data-scarce regimes. Given that this observation is based on only three datasets, it should be interpreted as a preliminary hypothesis rather than a statistically established relationship; confidence intervals cannot be meaningfully computed at this sample size, and validation across additional datasets is required before drawing firm conclusions. Nevertheless, the consistency and magnitude of the pattern across datasets with vastly different characteristics (133 to 1620 images, 6 to 17 classes) provide initial grounds for considering architectural choice as a factor in low-data deployment scenarios. This observation complements recent work on transfer learning and few-shot detection [
24,
41].
Fourth, we identify and characterize a training anomaly on the SH17 dataset where YOLOv11 exhibits uniform training times (approximately 17.5 h) regardless of model scale, suggesting implementation-specific optimization issues that warrant further investigation. This finding, consistent with previous observations by Ahmad and Rahimi [
42], highlights the importance of comprehensive evaluation across diverse datasets to distinguish genuine architectural properties from implementation artifacts.
Fifth, we demonstrate that computational efficiency trade-offs favor YOLOv11 for training speed (15–20% faster on average, excluding the SH17 anomaly) and inference latency (9–18% faster depending on dataset characteristics), while YOLO26 achieves superior parameter efficiency (higher mAP per parameter and per GFLOP) at large scales. These findings extend recent analyses of YOLO26’s computational characteristics [
10,
12] by quantifying trade-offs in realistic deployment scenarios rather than synthetic benchmarks alone.
Beyond these empirical findings, our work provides practical deployment guidance for practitioners implementing PPE detection systems. We demonstrate that optimal architecture selection depends critically on the deployment context: YOLOv11 nano/small variants are recommended for severely latency-constrained edge scenarios where real-time processing at high frame rates is essential; YOLOv11 medium variants offer attractive balanced trade-offs for moderate-scale datasets where training efficiency and inference speed are both important; and YOLO26 large/X-Large variants are preferred for accuracy-critical applications with relaxed latency constraints or when training data is limited. Importantly, all latency and throughput measurements were obtained on an NVIDIA A100 (80 GB) data center GPU; these values should not be directly applied to edge or embedded hardware without independent validation. These recommendations are grounded in systematic empirical evaluation rather than architectural assumptions or benchmark performance alone, addressing a critical gap in current PPE detection research [
13,
18].
The remainder of this paper is structured as follows.
Section 2 describes the datasets, model architectures, training protocols, and evaluation metrics employed in our comparative study.
Section 3 presents comprehensive results including overall performance across datasets, detailed analyses of each individual dataset with visual comparisons, scale-dependent patterns, computational efficiency comparisons, and comparison with published benchmarks on the SH17 dataset.
Section 4 discusses the implications of our findings for both architectural development and practical deployment, examines potential mechanisms underlying observed patterns, and highlights limitations and directions for future work.
Section 5 concludes with actionable recommendations for practitioners and researchers working on PPE detection and real-time object detection systems more broadly.
3. Results
This section presents a comprehensive comparative analysis of YOLO26 and YOLOv11 architectures across three diverse PPE detection datasets. All experiments were conducted under rigorously controlled conditions using identical hyperparameters, hardware configurations, and training protocols to ensure fair and reproducible comparisons. The results are organized to progressively reveal performance patterns at multiple levels of granularity: overall cross-dataset trends, individual dataset characteristics, computational efficiency metrics, and scale-dependent architectural behaviors.
3.1. Overall Performance Across Datasets
Table 3 presents the aggregated performance metrics across all three datasets, revealing distinct patterns in how architectural differences manifest across varying dataset characteristics. The results demonstrate that relative model performance is strongly dependent on dataset scale and complexity, with no single architecture achieving universal superiority across all evaluation contexts.
The CHV dataset, despite its limited size of 133 training images, exhibited a clear advantage for YOLO26, with an average mAP50–95 improvement of 0.66 percentage points across all model variants. This suggests that YOLO26’s architectural enhancements provide particular benefits in data-scarce scenarios where effective regularization and feature extraction from limited samples become critical. In contrast, the SHEL5K dataset demonstrated virtual performance parity, with both architectures achieving identical average mAP50–95 scores of 0.576. This convergence at medium dataset scales indicates that when sufficient training data is available, the fundamental architectural differences between YOLO26 and YOLOv11 have diminishing impact on final detection accuracy.
The SH17 dataset revealed an unexpected reversal of the pattern observed in CHV, with YOLOv11 achieving a 0.70 percentage point advantage in average mAP50–95. This counterintuitive result for the largest and most complex dataset requires careful interpretation in conjunction with computational efficiency metrics presented later in this section. The weighted average across all three datasets favors YOLOv11 (0.495 vs. 0.491, representing a 0.40 percentage point advantage), driven primarily by its superior performance on the largest dataset (SH17). This pattern suggests that YOLO26’s architectural advantages are most pronounced in data-scarce scenarios, with diminishing returns as dataset size increases. The negative correlation (, though statistical significance is limited by ) between dataset size and YOLO26 advantage provides preliminary evidence for this hypothesis, warranting investigation across additional datasets of varying scales.
3.2. Best Model Performance: X-Large Variants
Table 4 examines the highest-capacity models from each architecture family, representing the upper bound of achievable accuracy when computational constraints are relaxed. This analysis is particularly relevant for cloud-based deployment scenarios where inference speed can be traded for maximum detection precision.
Despite the mixed results at the overall dataset level, YOLO26x consistently outperformed YOLOv11x across all three datasets when examining only the X-Large variants. The performance advantages ranged from 1.3% on SHEL5K to 3.1% on SH17, with an average improvement of 2.1 percentage points. This consistent superiority at the highest model scale suggests that YOLO26’s architectural innovations, which may include enhanced feature pyramid networks or improved attention mechanisms, become increasingly beneficial as model capacity increases and can effectively leverage the additional parameters.
The SH17 dataset presented the most dramatic contrast, where YOLO26x achieved a 3.1% mAP50–95 advantage despite YOLOv11’s overall dataset-level superiority. This indicates that the architectural benefits of YOLO26 are particularly pronounced for large-scale, complex detection tasks when sufficient model capacity is available. The inference time penalty for this accuracy improvement ranged from 4.2% on SH17 to 14.7% on SHEL5K, with an average slowdown of 10.8%. For applications where detection accuracy is paramount and inference latency constraints are relaxed, such as offline safety compliance auditing or high-stakes industrial inspection, this speed-accuracy trade-off favors YOLO26x deployment.
3.3. CHV Dataset Detailed Analysis
The CHV dataset represents a challenging small-scale multi-class PPE detection scenario with 133 training images distributed across six safety equipment categories.
Table 5 and
Table 6 present the complete performance breakdown across all five model variants for both architectures.
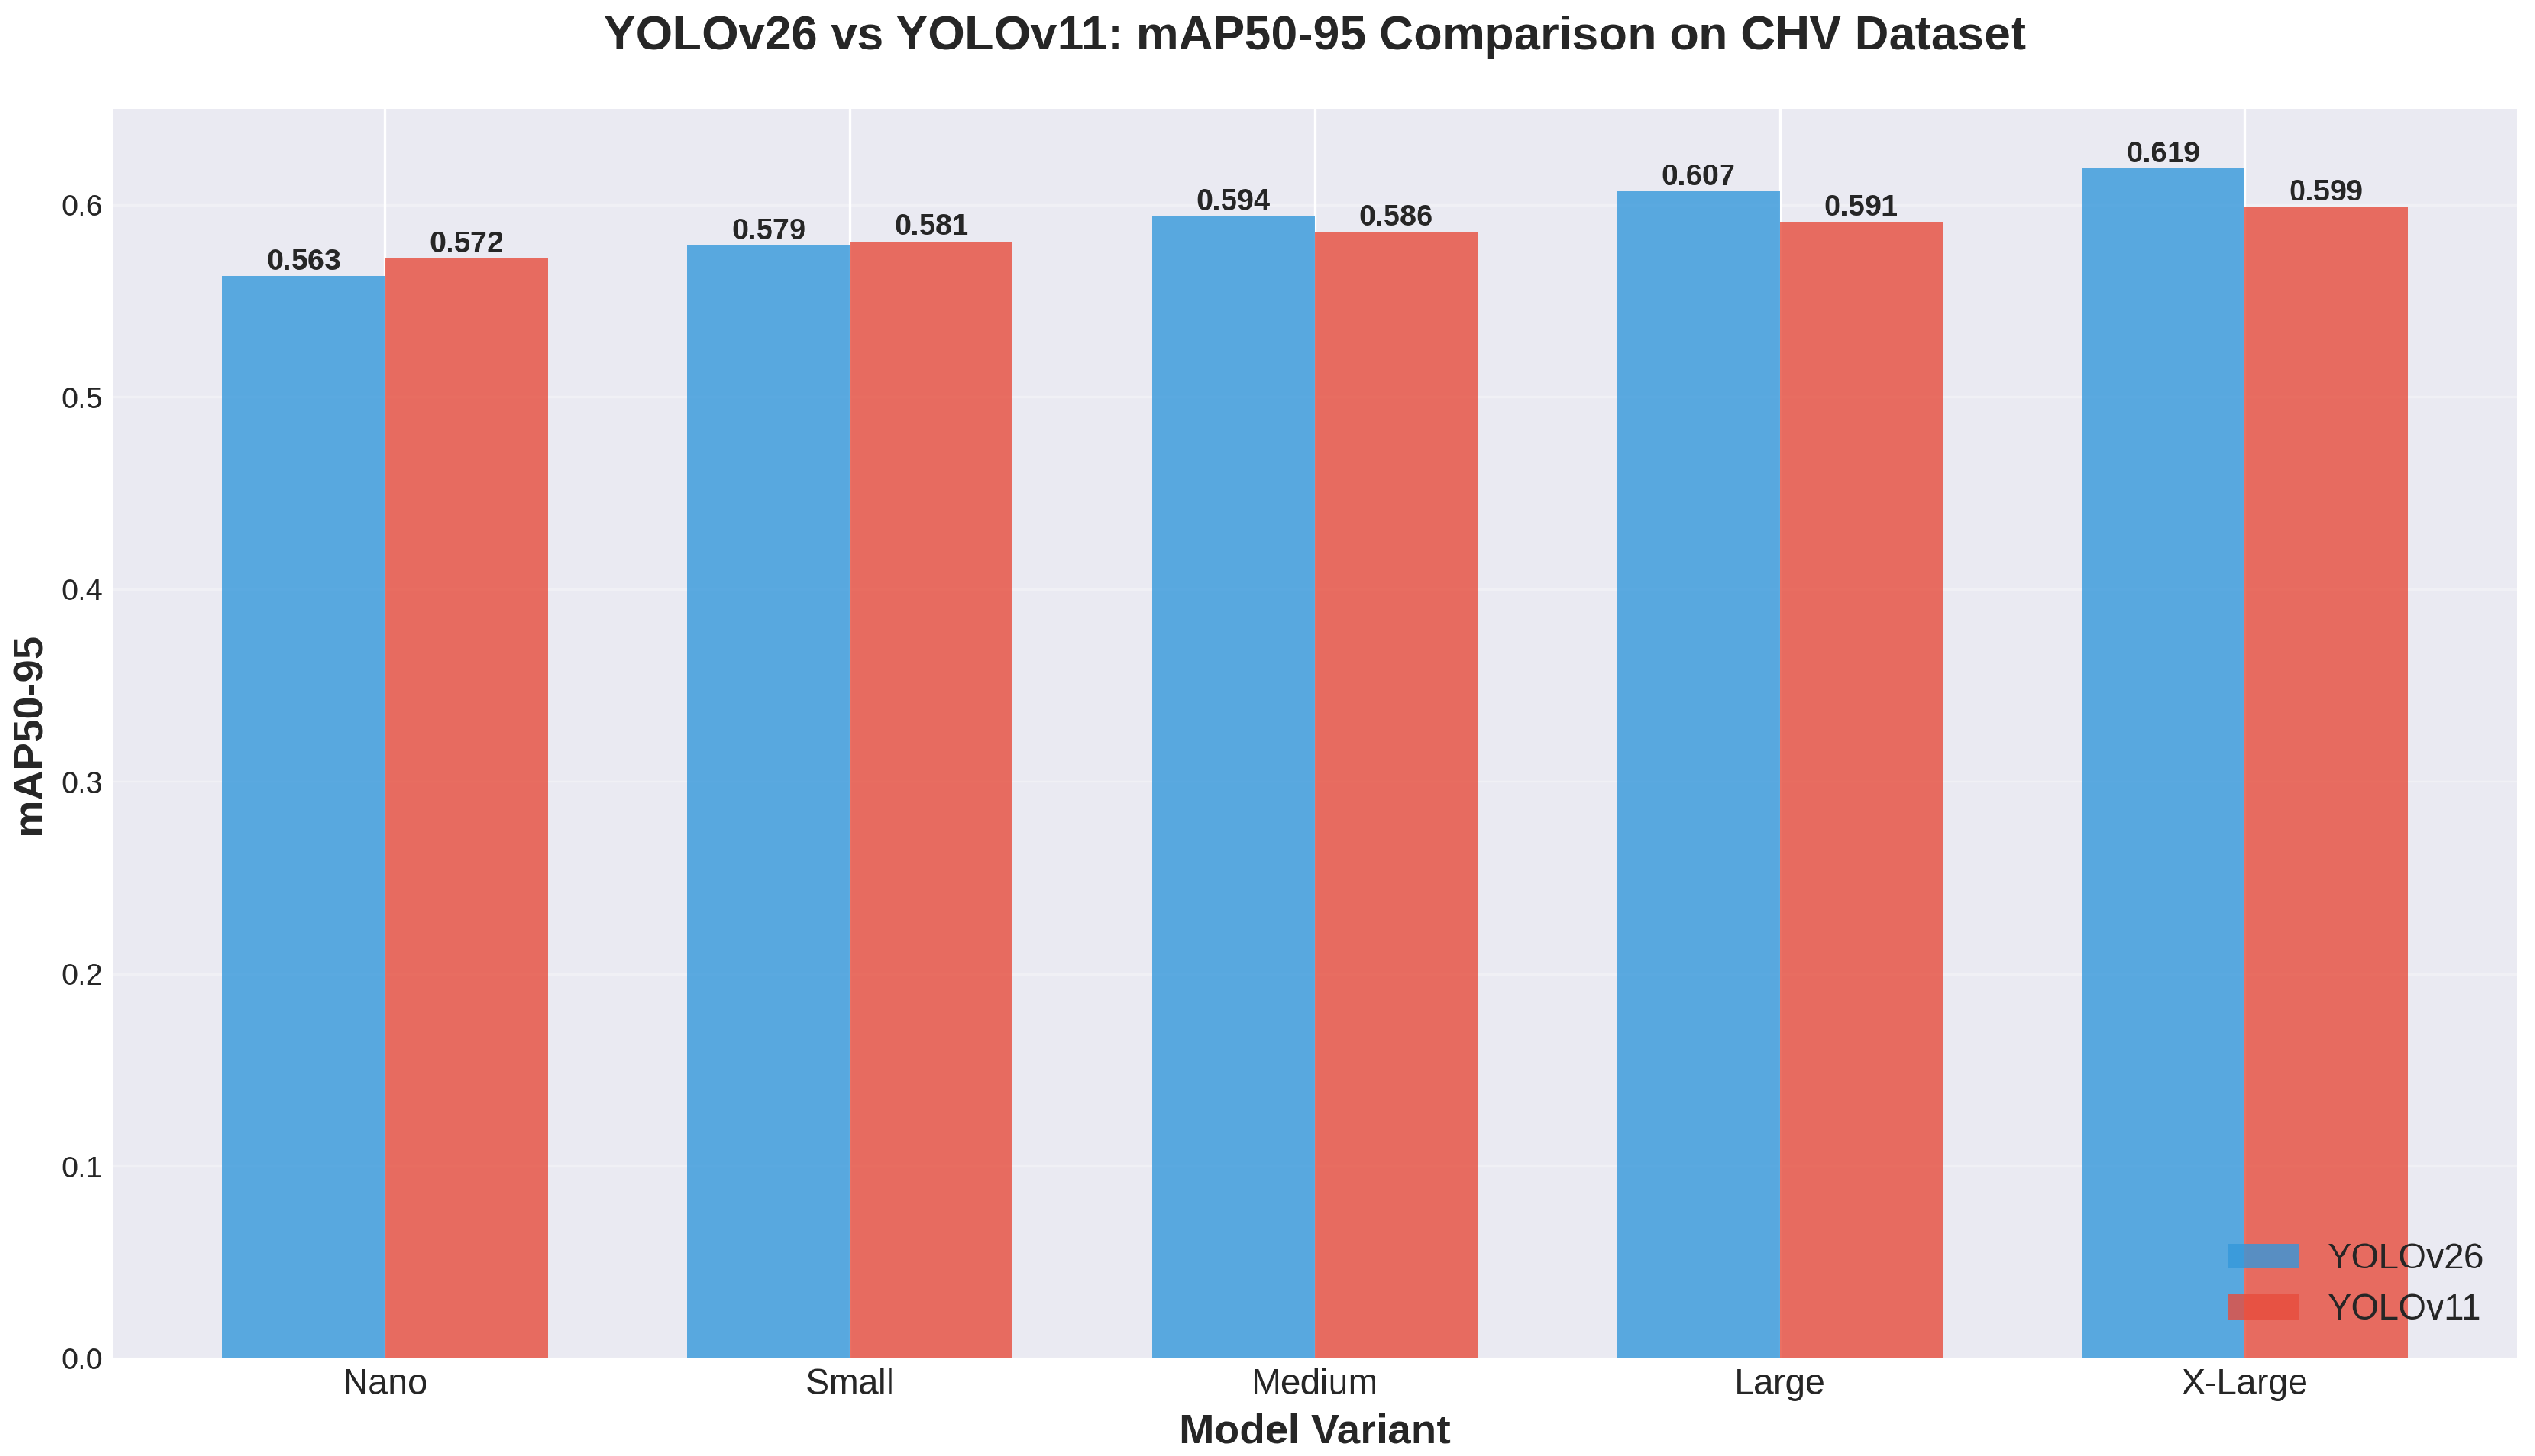
The CHV dataset results reveal a clear scale-dependent performance pattern favoring YOLO26 at medium to extra-large model sizes, as visualized in
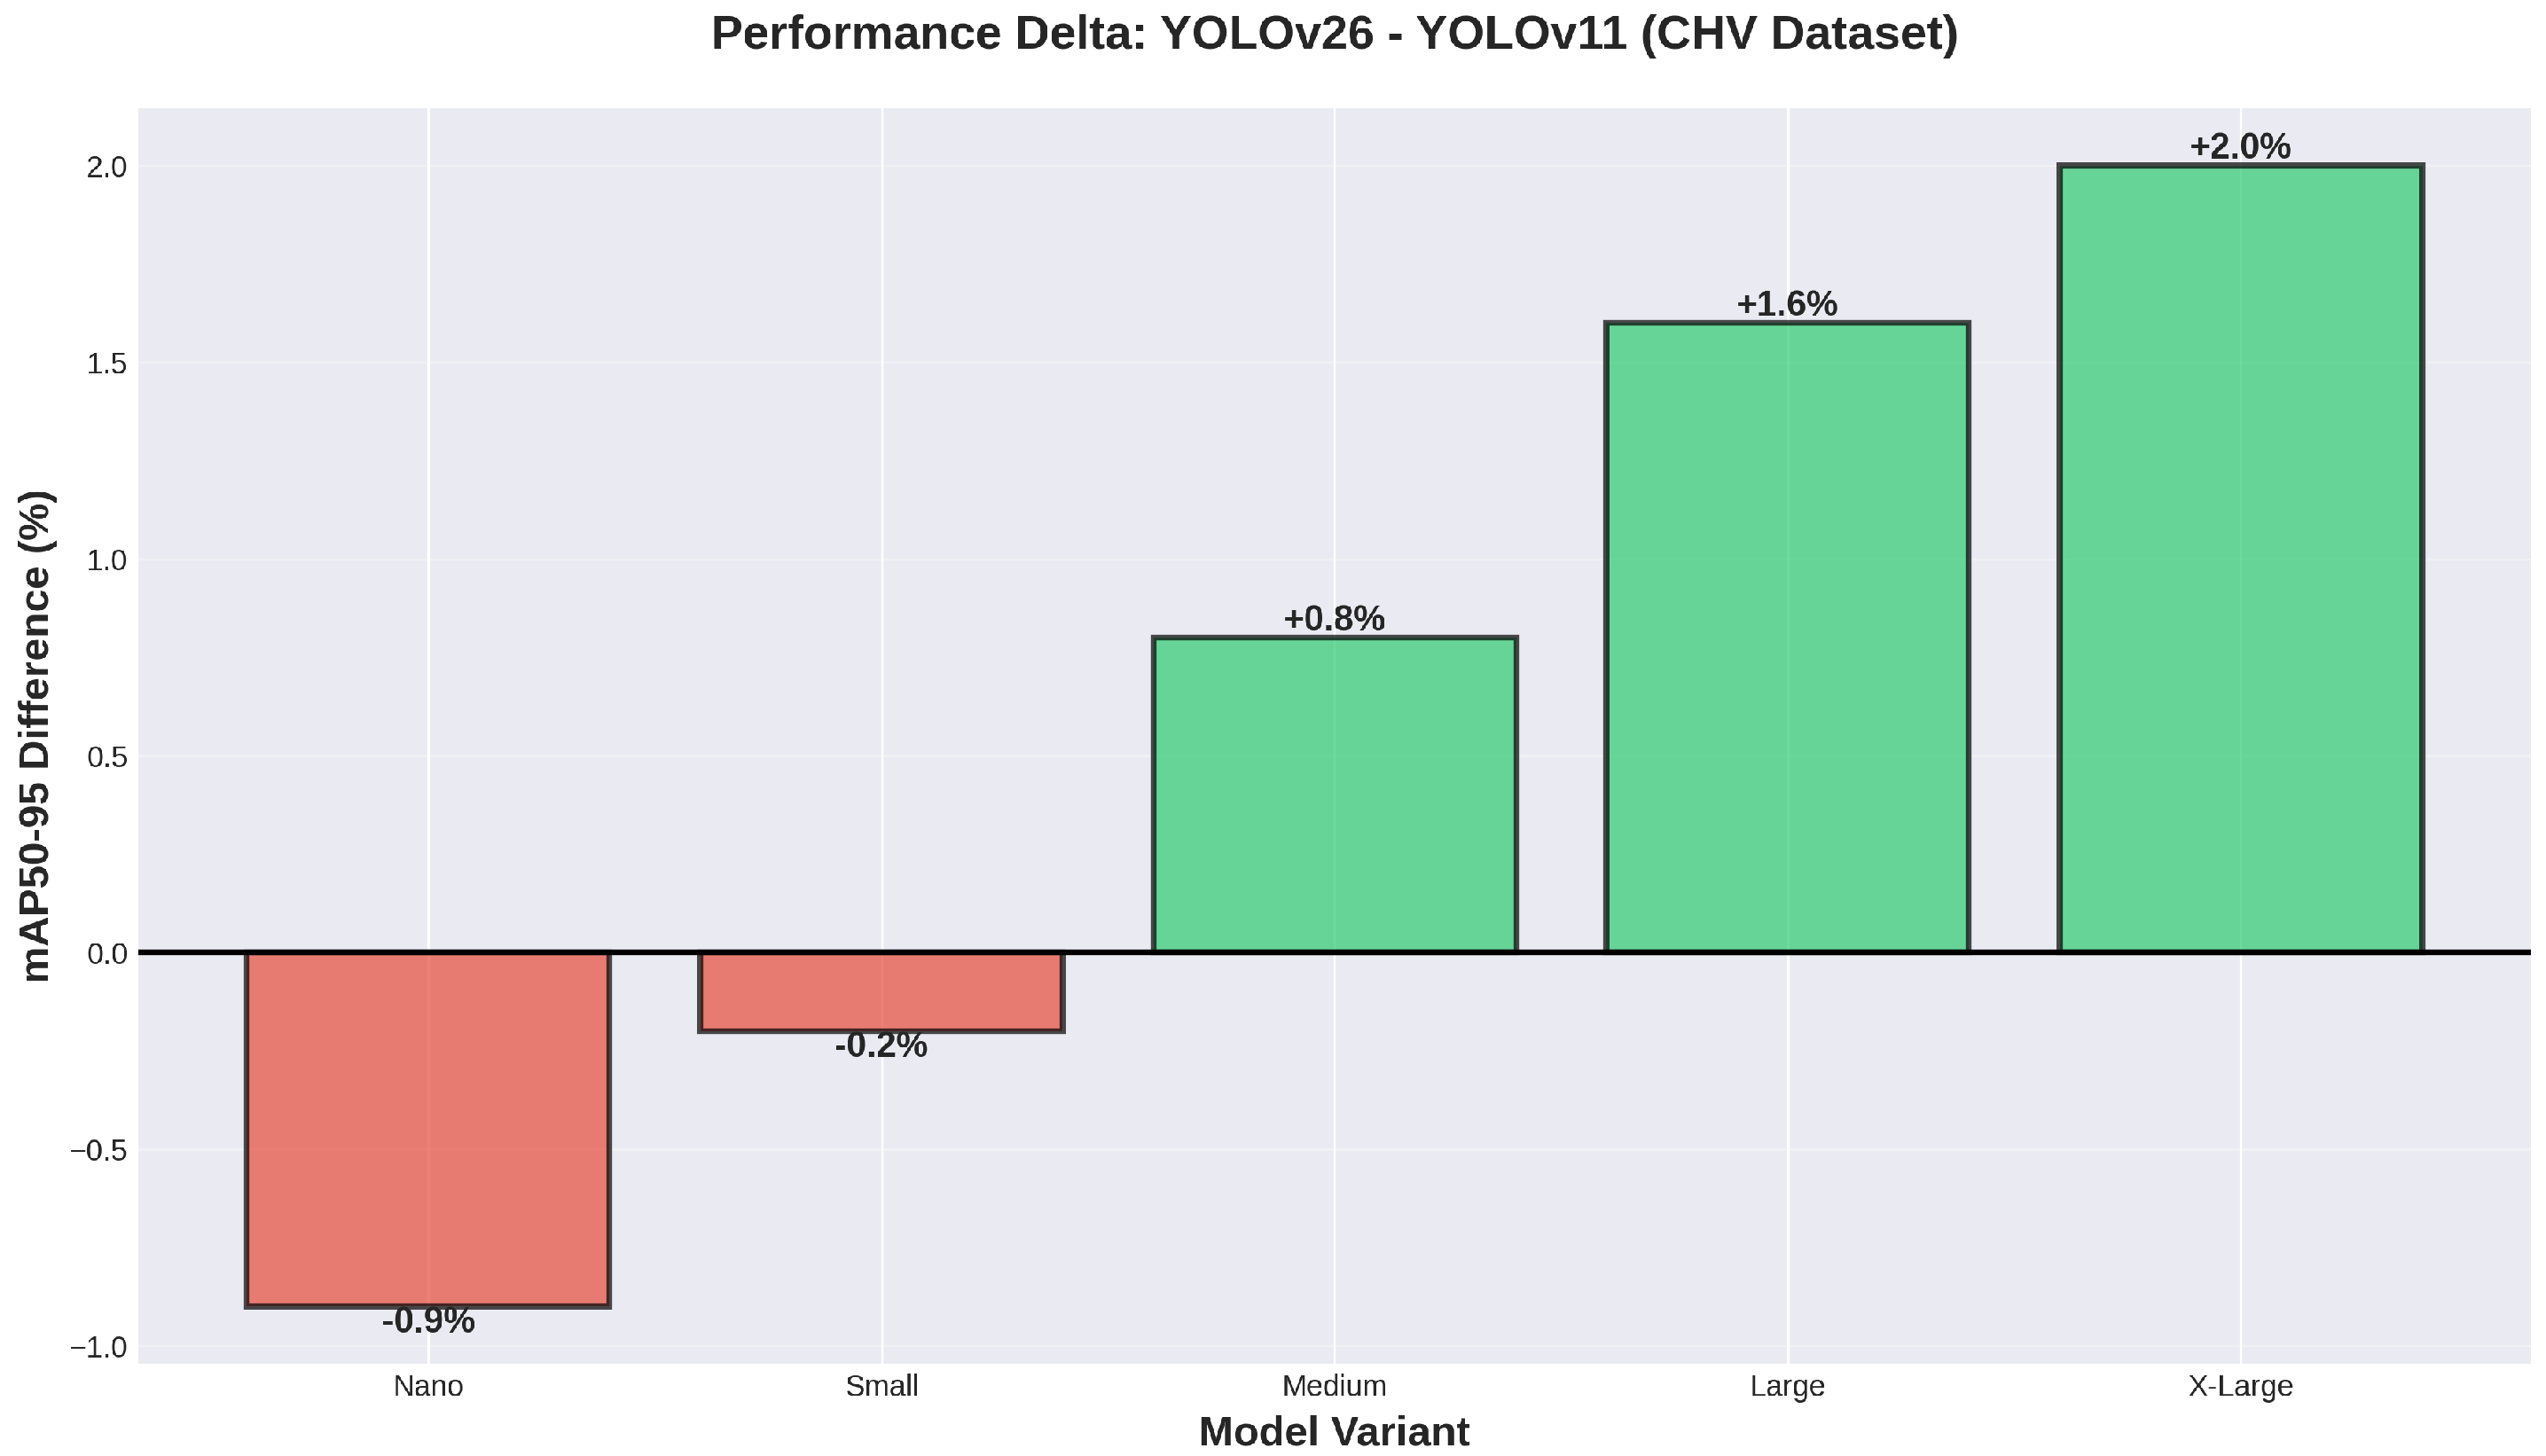
Figure 1. While YOLOv11n achieved a marginal 0.9 percentage point advantage in the nano variant (0.572 vs. 0.563 mAP50–95), this relationship reversed at the small scale and progressively widened as model capacity increased. The medium variant represented the crossover point where YOLO26m first established superiority with a 0.8 percentage point improvement, which subsequently expanded to 1.6 percentage points at the large scale and reached its maximum of 2.0 percentage points with the X-Large models. This progression is clearly illustrated in
Figure 2, which shows the performance delta transitioning from negative values at smaller scales to increasingly positive values at larger scales.
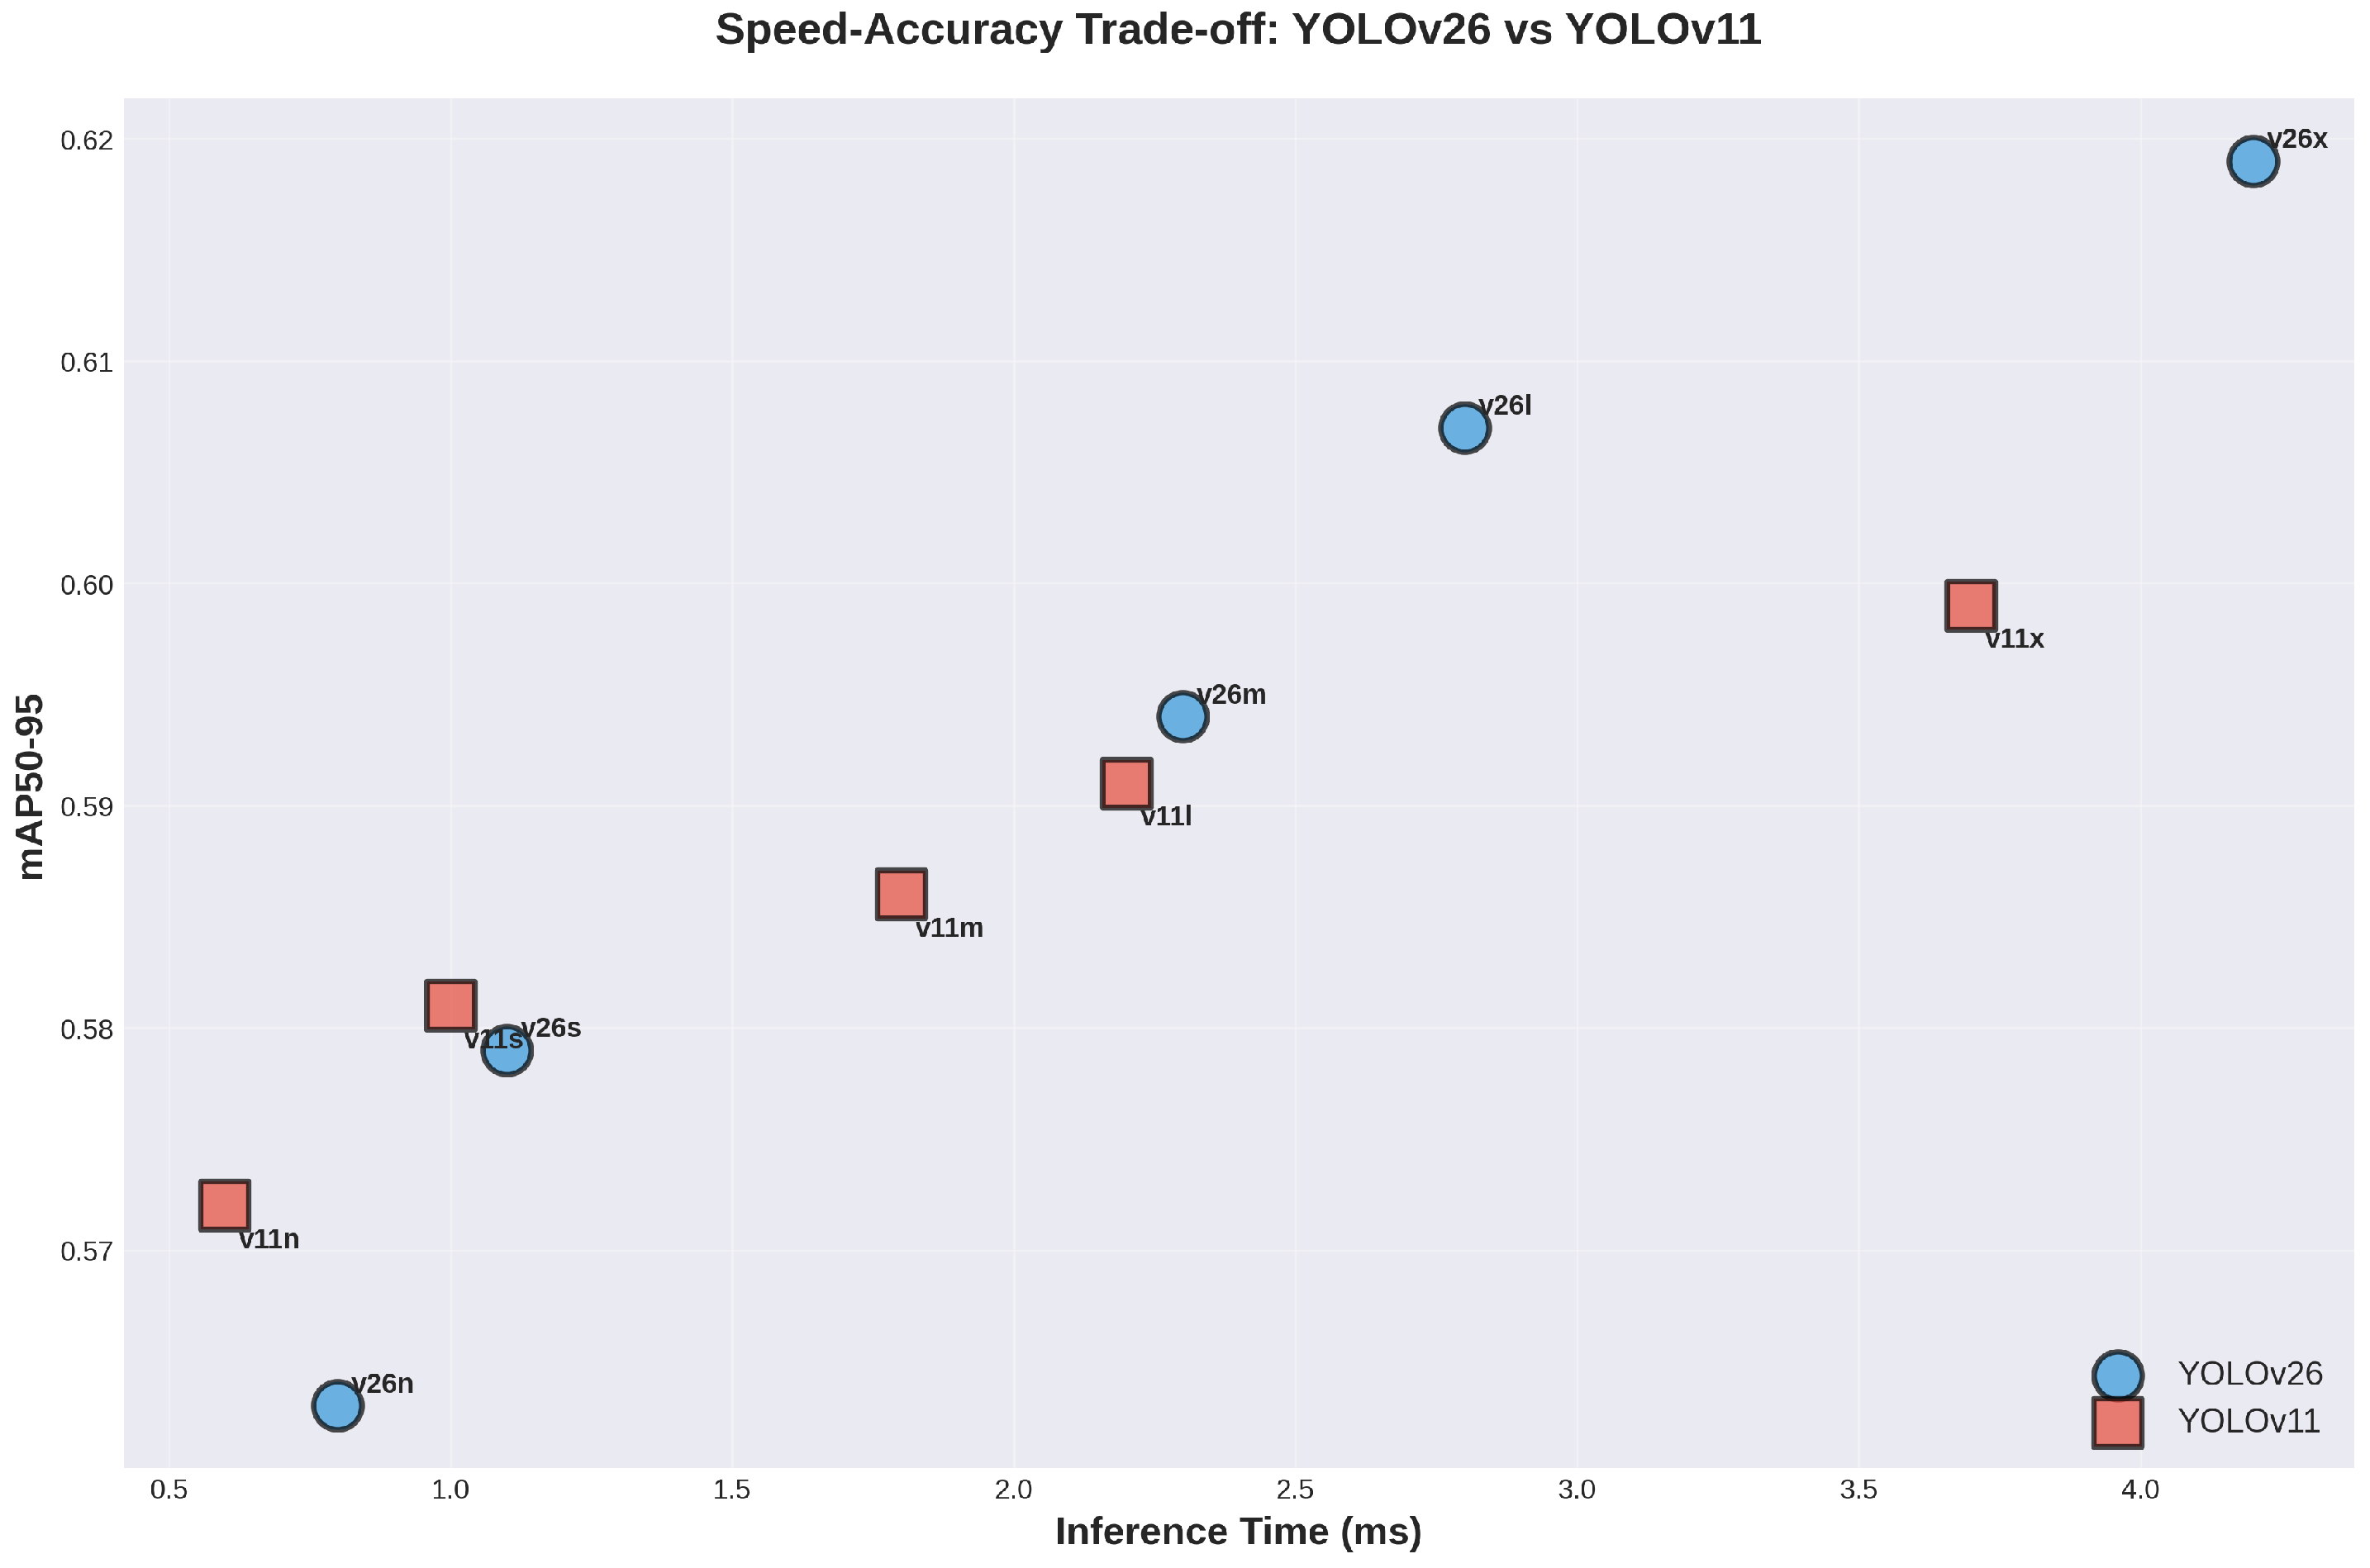
The speed-accuracy trade-off characteristics (
Figure 3) demonstrate that YOLO26 models occupy the upper-right quadrant with higher accuracy but slower inference, while YOLOv11 models favor faster inference at the cost of slightly lower accuracy for medium-to-large scales. This trade-off becomes increasingly pronounced as model size increases, with the X-Large variants exhibiting the largest separation in both dimensions.
This scaling behavior suggests that YOLO26’s architectural enhancements require sufficient model capacity to manifest their full potential. At the nano scale, where parameter budgets severely constrain representational power, YOLOv11’s more efficient parameter utilization provides an advantage. However, as capacity constraints relax, YOLO26’s more sophisticated feature extraction mechanisms, potentially including enhanced attention modules or improved multi-scale fusion strategies, begin to dominate performance.
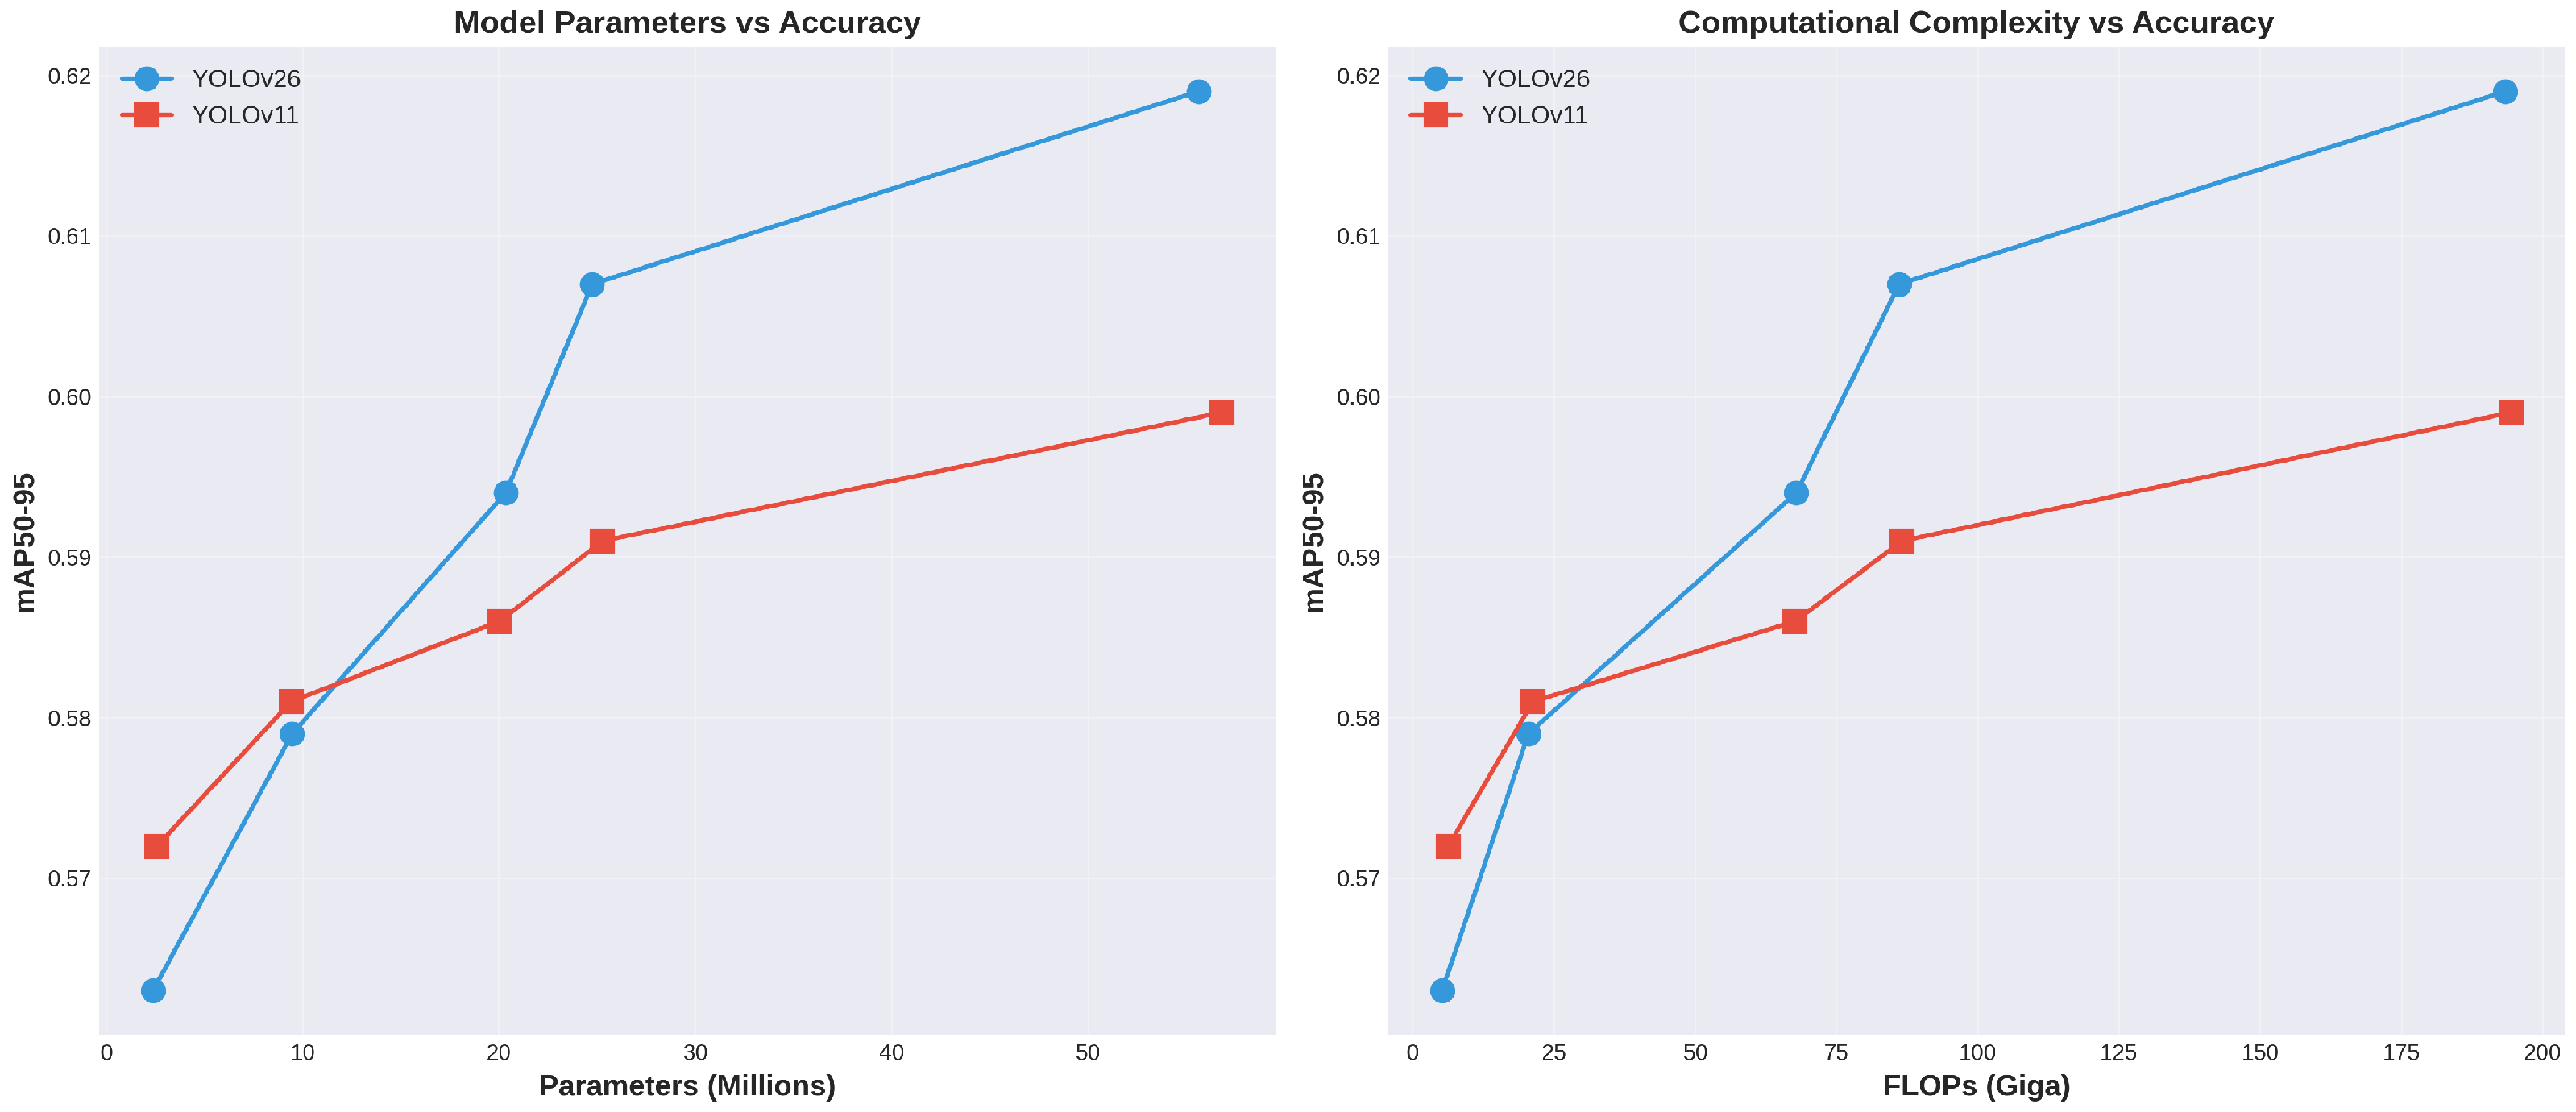
Figure 4 provides a detailed analysis of this phenomenon, demonstrating that YOLO26 achieves higher mAP50–95 with comparable parameter budgets and superior mAP-per-GFLOP efficiency, particularly at large scales.
The F1 scores remained remarkably consistent across architectures (0.855 average for both), indicating that the mAP improvements stem from better confidence calibration and bounding box regression rather than shifts in the precision-recall operating point.
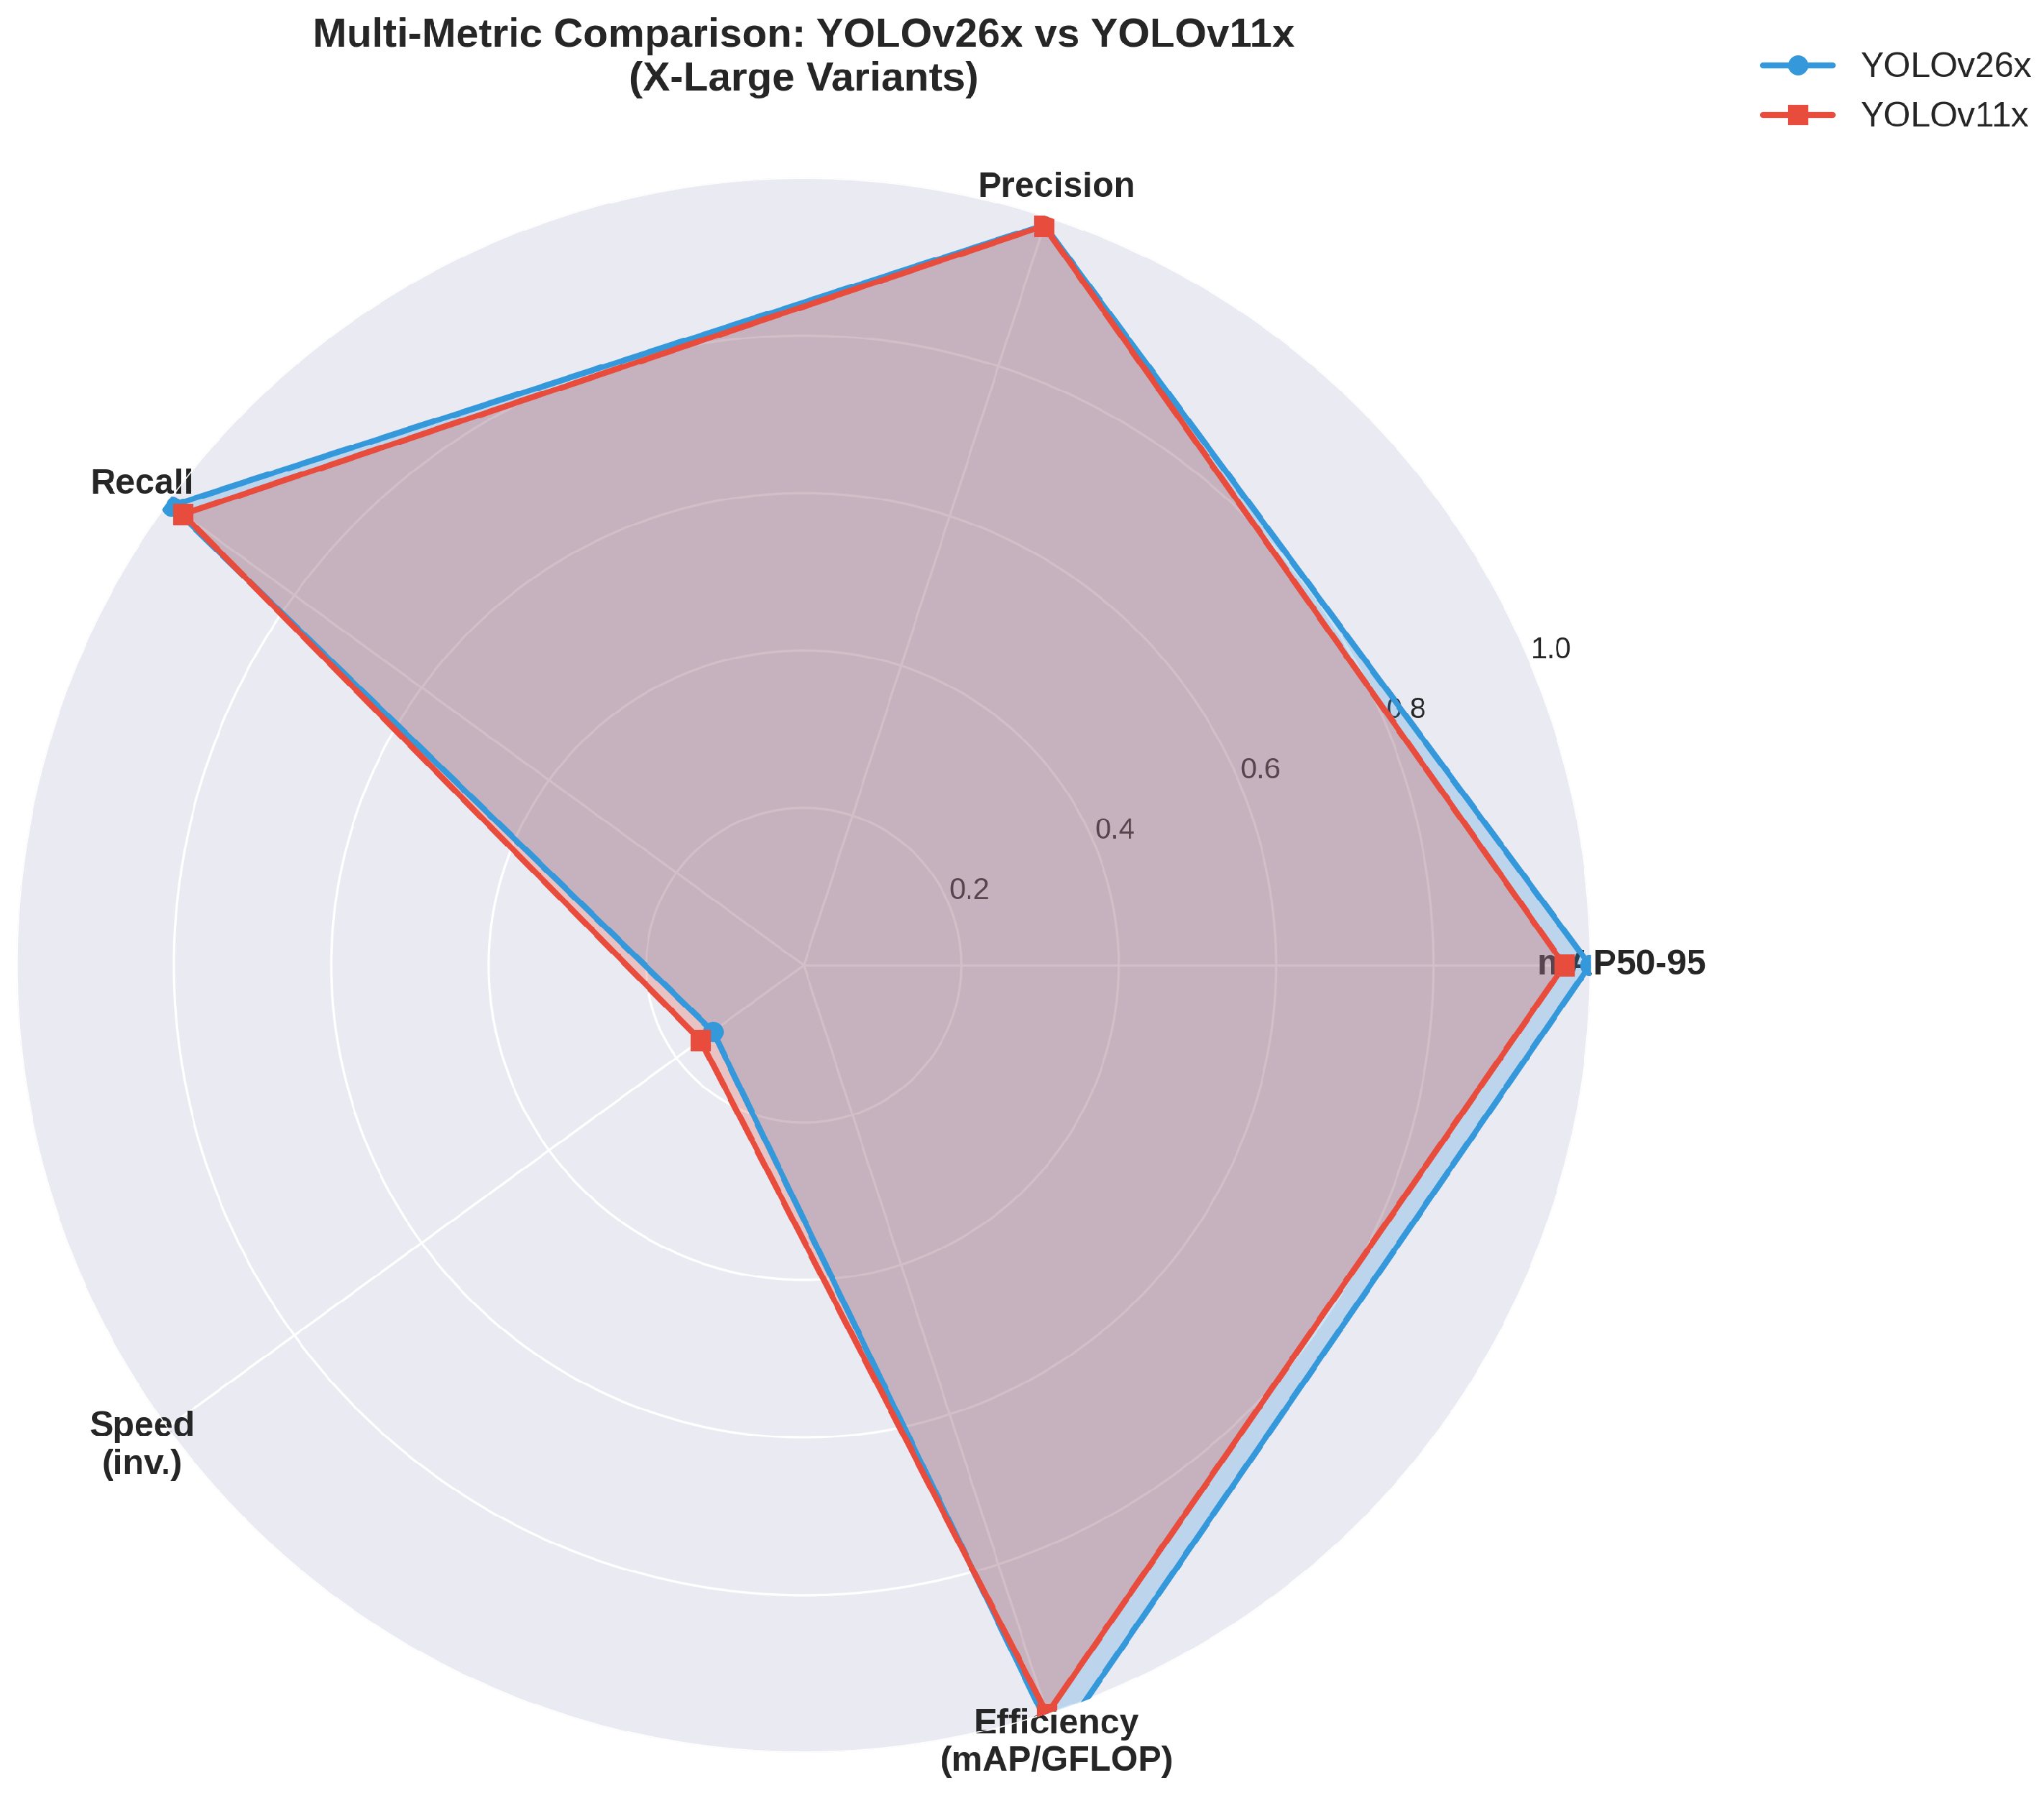
Figure 5 presents a comprehensive multi-metric radar comparison of the X-Large variants, revealing complementary architectural strengths across different performance dimensions. While YOLO26x achieves superior mAP50–95, precision, and computational efficiency (mAP/GFLOP), YOLOv11x excels in recall and inference speed, suggesting that the optimal architecture choice depends on specific deployment priorities.
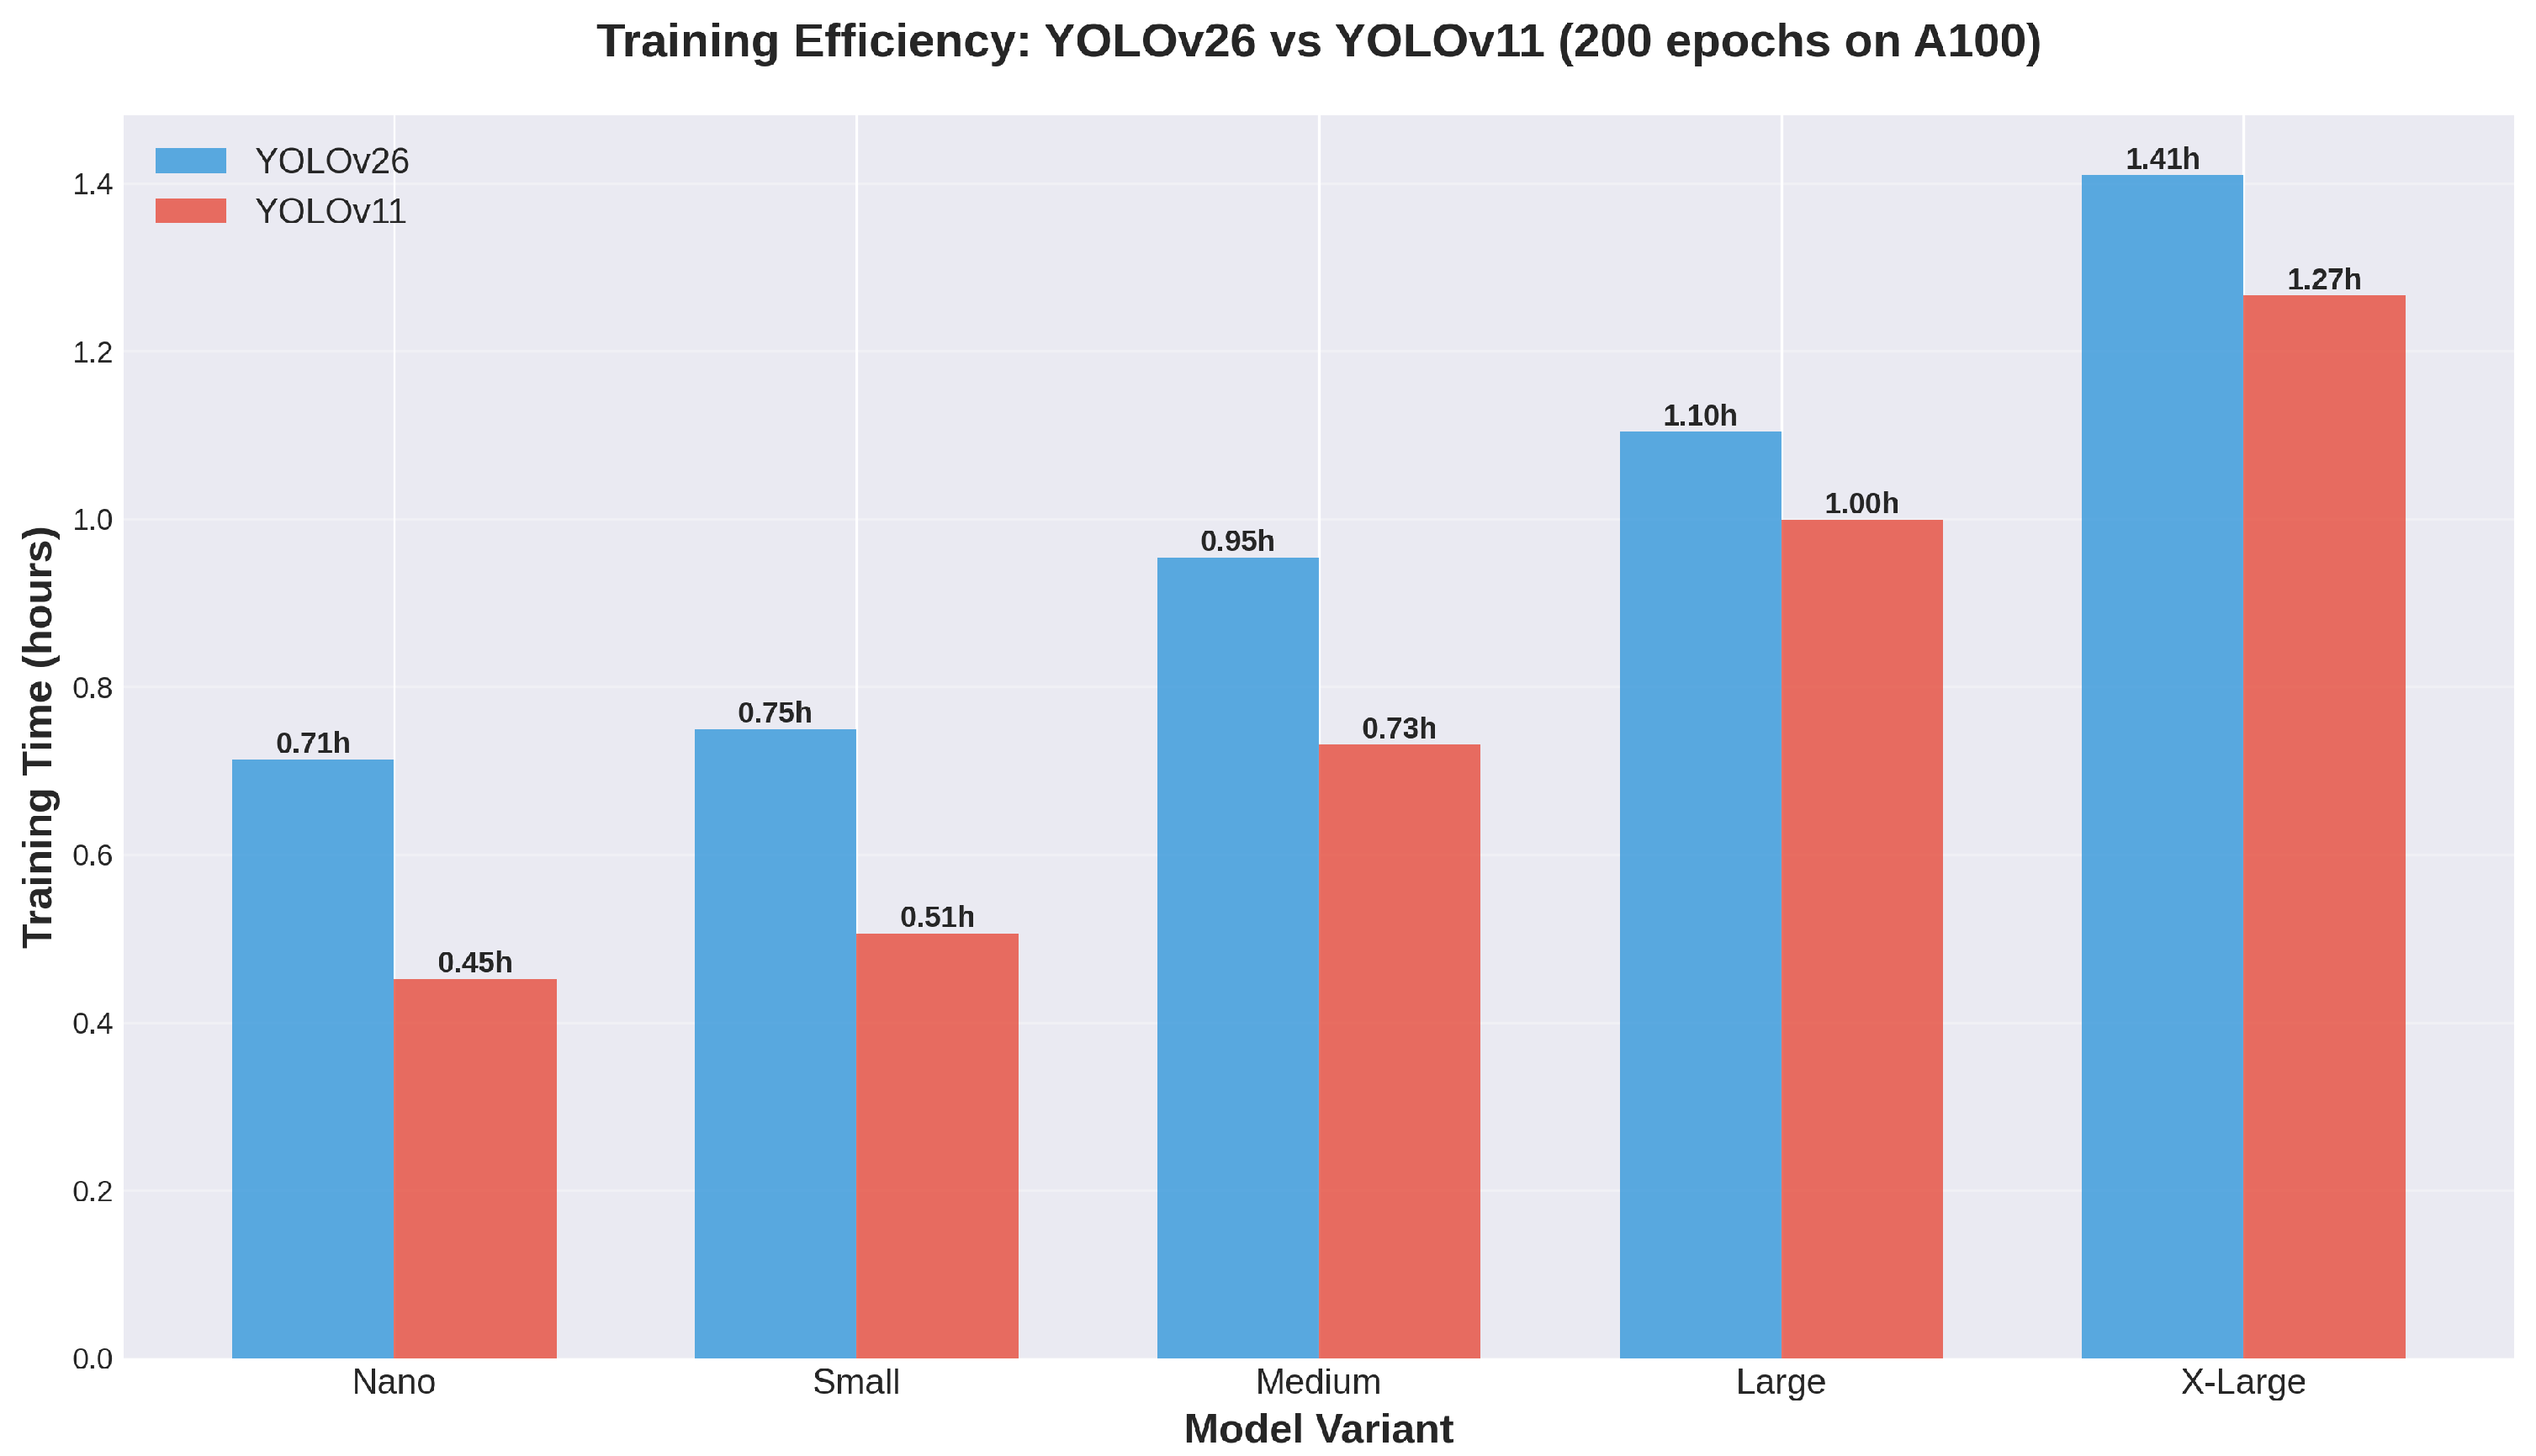
Training efficiency analysis revealed YOLOv11’s consistent advantage across all model scales on the CHV dataset, as shown in
Figure 6. YOLOv11 achieved 19.8% faster average training time (0.791 h vs. 0.986 h), with the speed advantage most pronounced at smaller scales. YOLOv11n completed training in 36.6% less time than YOLO26n (0.452 vs. 0.713 h), while the gap narrowed to 10.2% for the X-Large variants. This pattern suggests that YOLOv11’s optimization strategies, which may include more efficient gradient flow or reduced computational overhead in the backward pass, provide greater relative benefits for smaller models where absolute training times are already short.
Inference speed exhibited similar patterns, with YOLOv11 demonstrating 17.0% faster average processing (1.86 ms vs. 2.24 ms). The speed advantage was most substantial for the nano variant, where YOLOv11n achieved 33.3% faster inference (0.6 ms vs. 0.8 ms), enabling real-time processing at 1667 FPS compared to YOLO26n’s 1250 FPS. This performance envelope positions YOLOv11n as the optimal choice for severely latency-constrained edge deployment scenarios, while YOLO26x emerges as the preferred option when maximum accuracy justifies the computational cost.
3.4. SHEL5K Dataset Detailed Analysis
The SHEL5K dataset provides an intermediate-scale evaluation with 1000 training images across three safety helmet detection categories.
Table 7 and
Table 8 present comprehensive metrics revealing distinct performance characteristics compared to the CHV dataset.
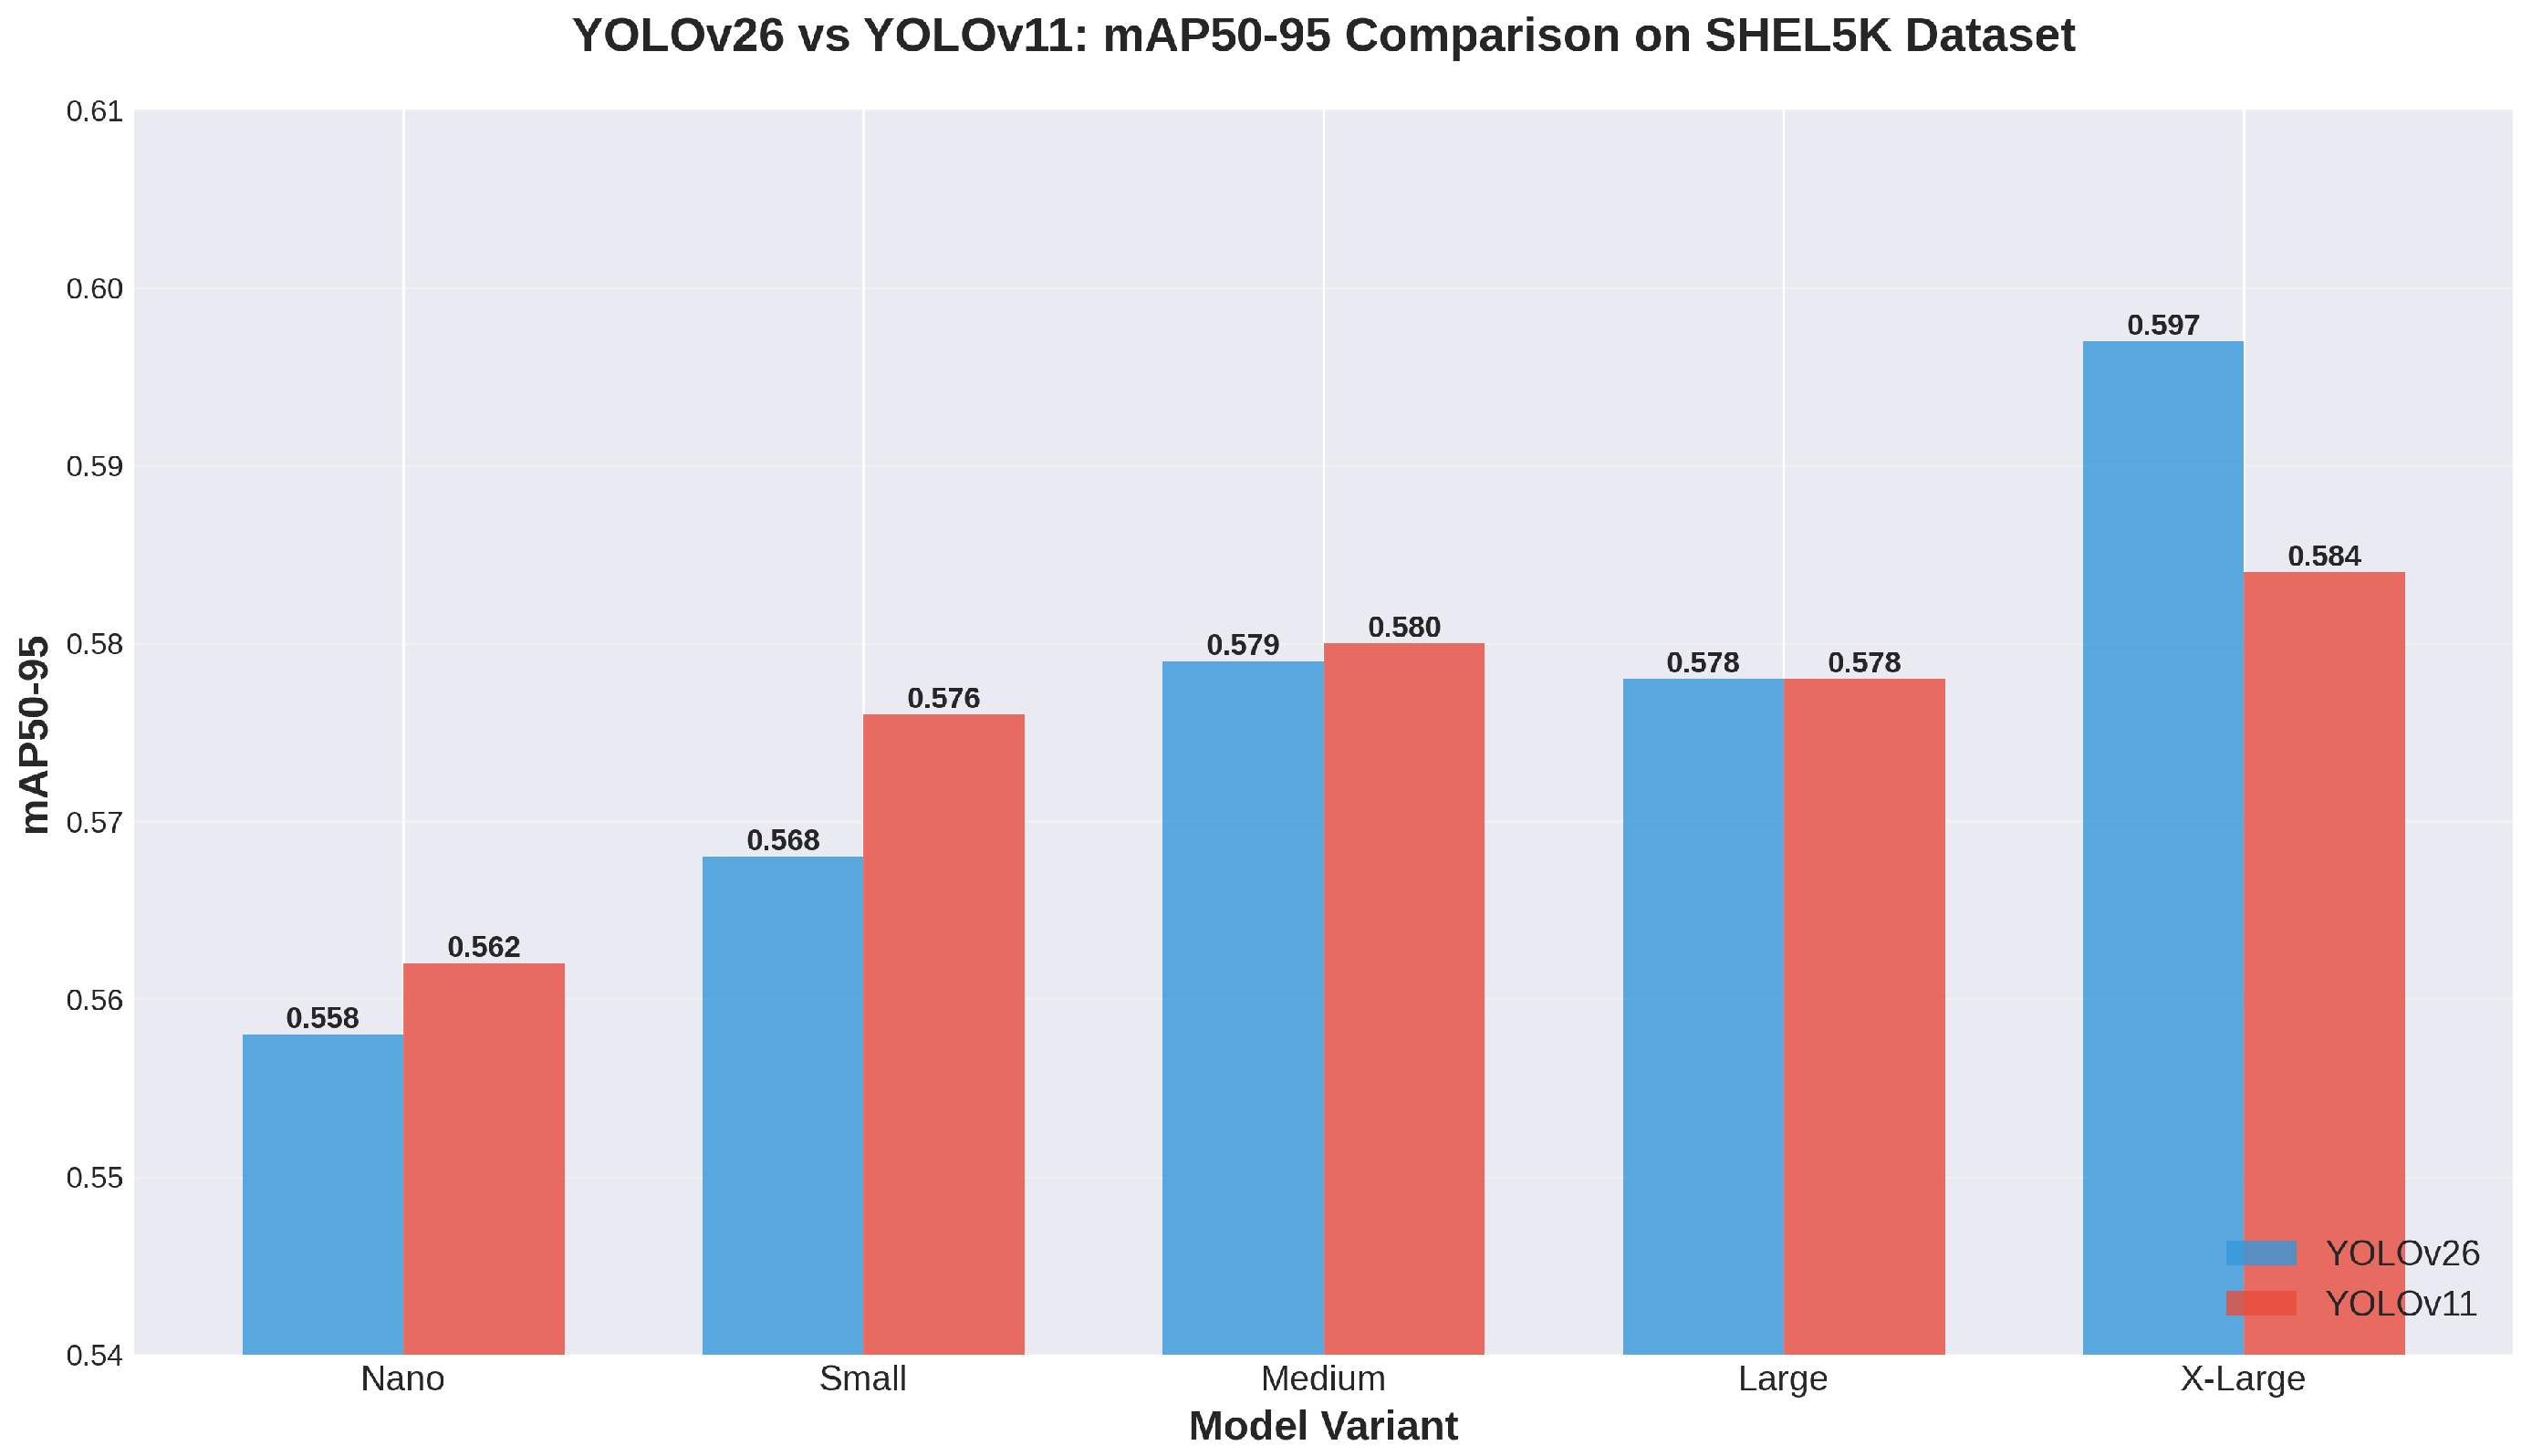
The SHEL5K dataset demonstrated remarkable convergence between architectures, with both achieving identical average mAP50–95 scores of 0.576 despite exhibiting divergent performance patterns across different model scales.
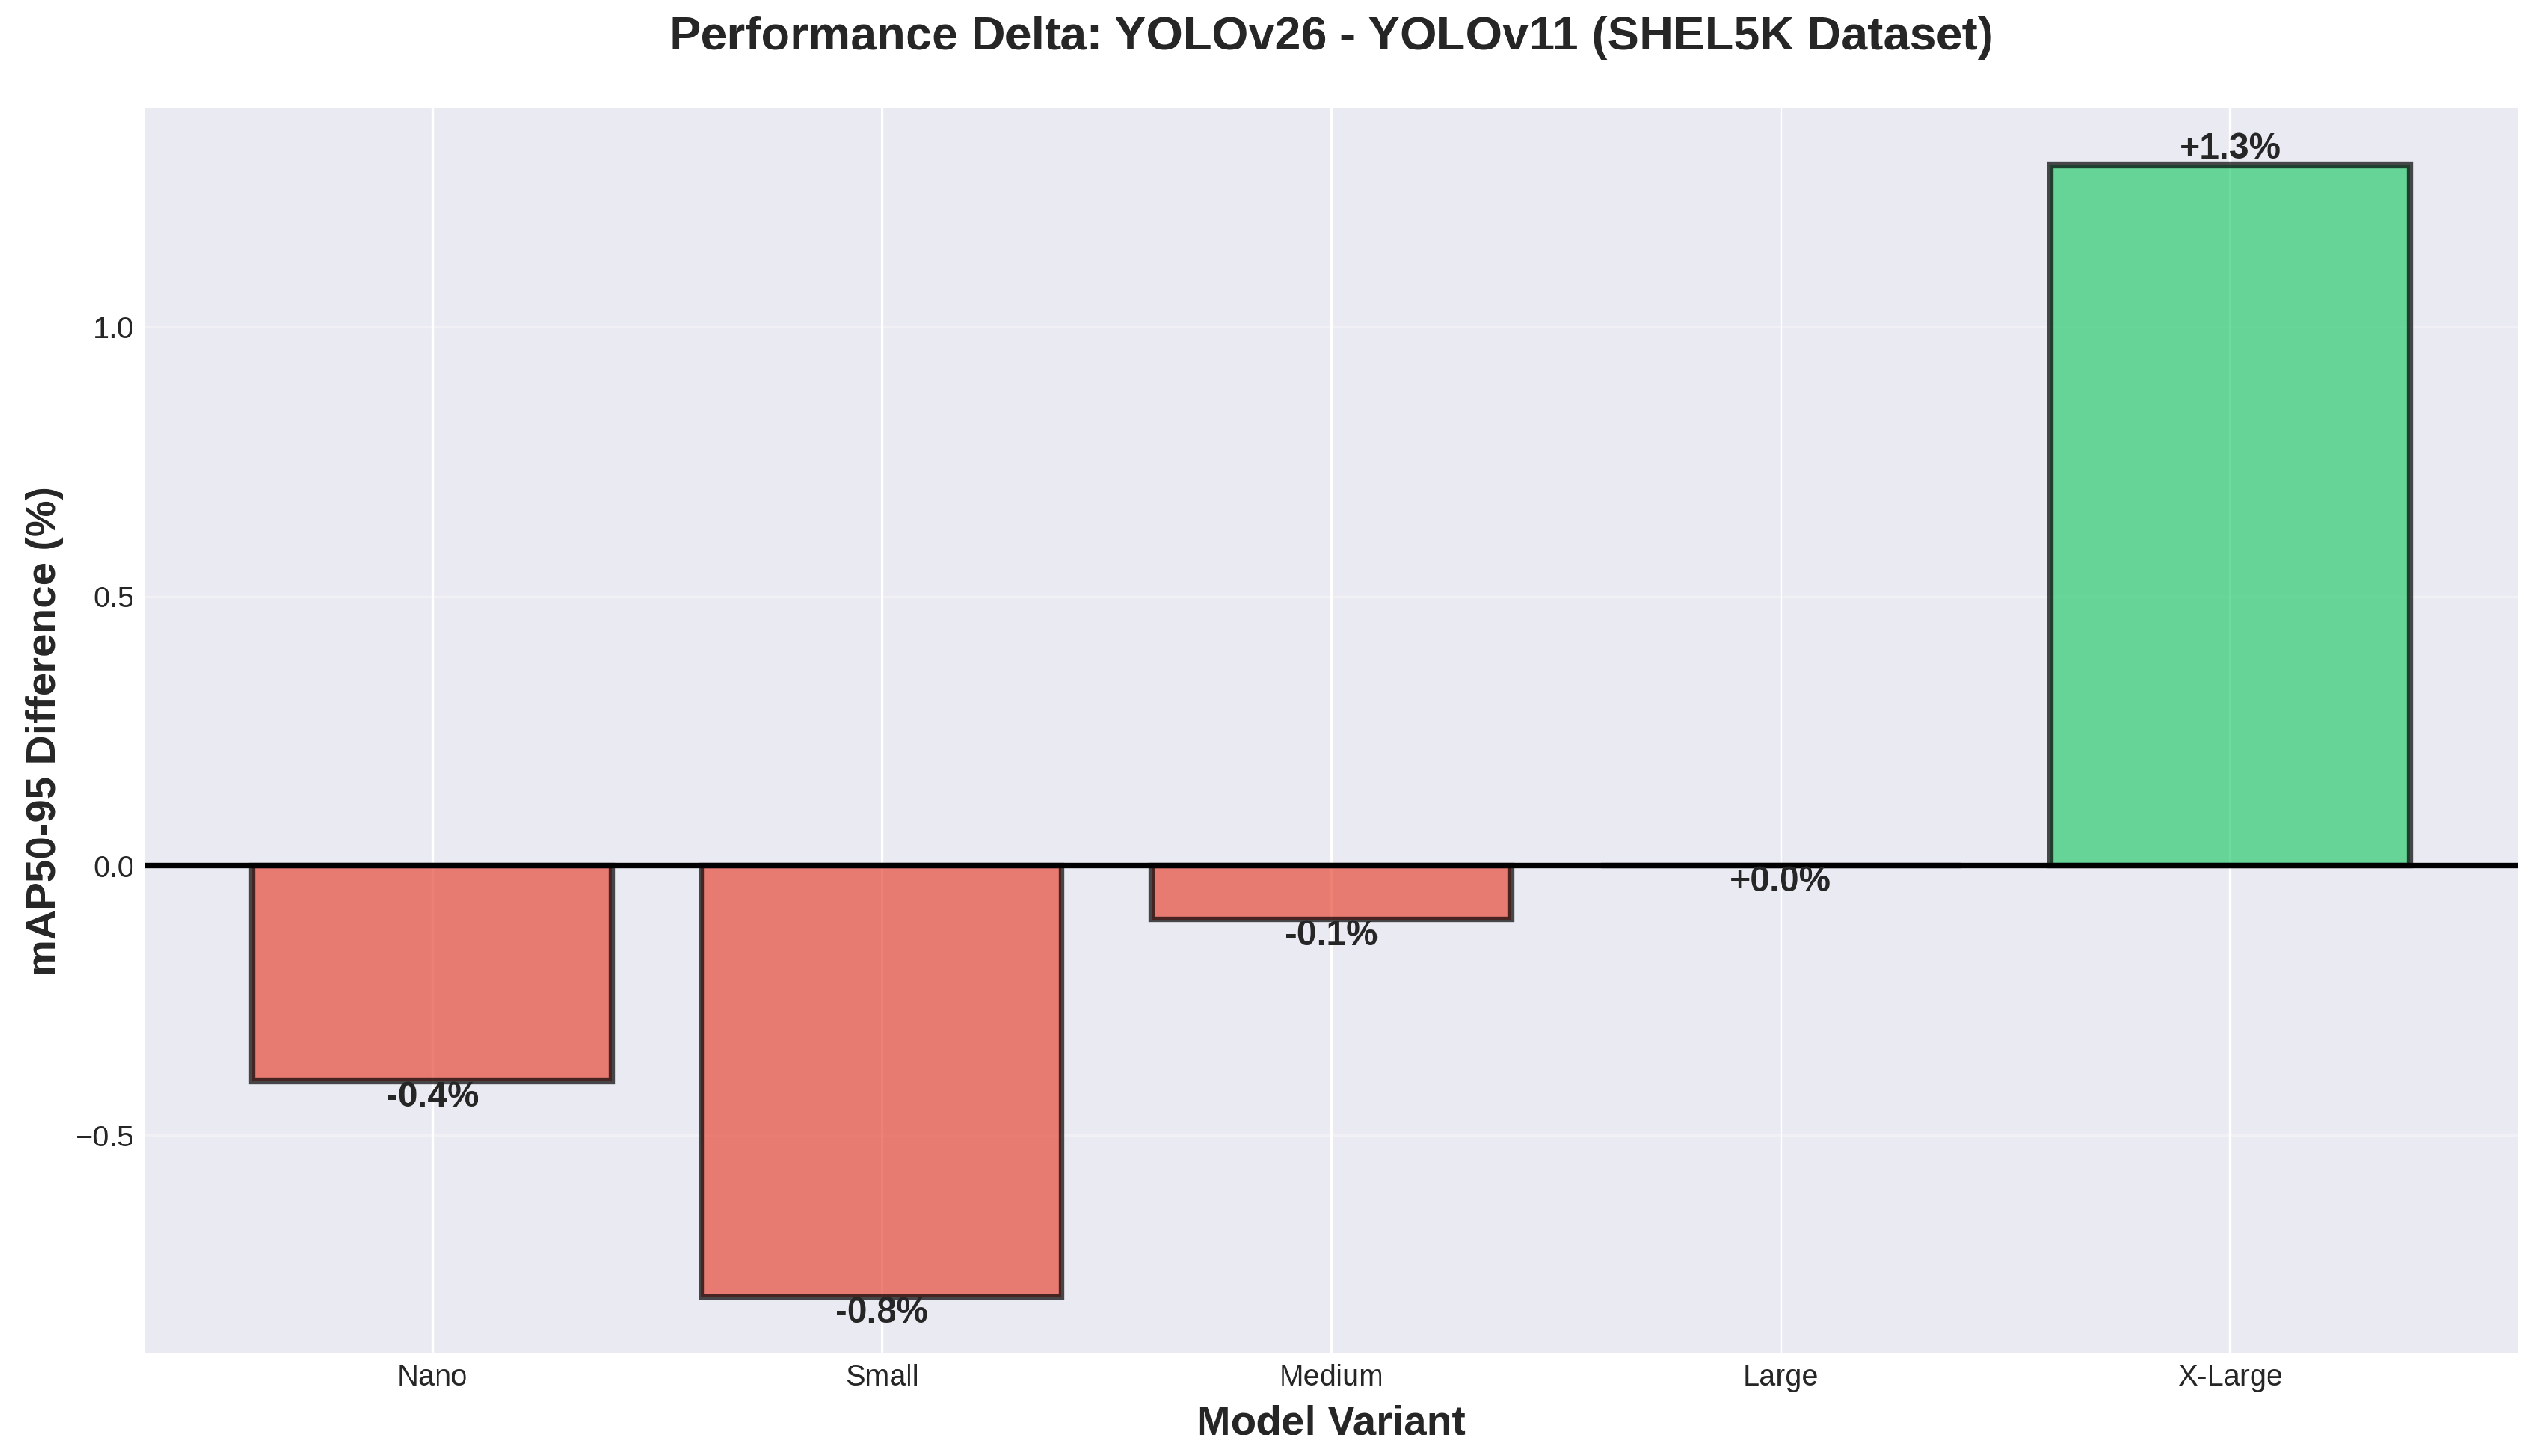
Figure 7 illustrates this near-parity performance across nano, small, medium, and large scales, with YOLO26x recovering advantage only at the X-Large scale (+1.3%). This exact parity at the dataset level masks interesting scale-specific behaviors that merit detailed examination. YOLOv11 maintained its advantage in the nano and small variants, outperforming YOLO26 by 0.4 and 0.8 percentage points respectively. However, this pattern attenuated at the medium scale where the gap narrowed to just 0.1 percentage points, and the large variants achieved perfect parity at 0.578 mAP50–95.
The X-Large variant revealed a reversal similar to that observed in CHV, with YOLO26x recovering a 1.3 percentage point advantage (0.597 vs. 0.584 mAP50–95). This recurring pattern across both CHV and SHEL5K datasets provides strong evidence that YOLO26’s architectural benefits specifically emerge at the highest capacity levels, where the model can fully exploit enhanced feature representations without being constrained by parameter budgets.
Figure 8 visualizes this pattern, showing attenuated advantages compared to CHV, with near-zero differences at most scales except X-Large. The consistency of this pattern across datasets with vastly different scales (133 vs. 1000 images) suggests that the phenomenon is rooted in fundamental architectural properties rather than dataset-specific artifacts.
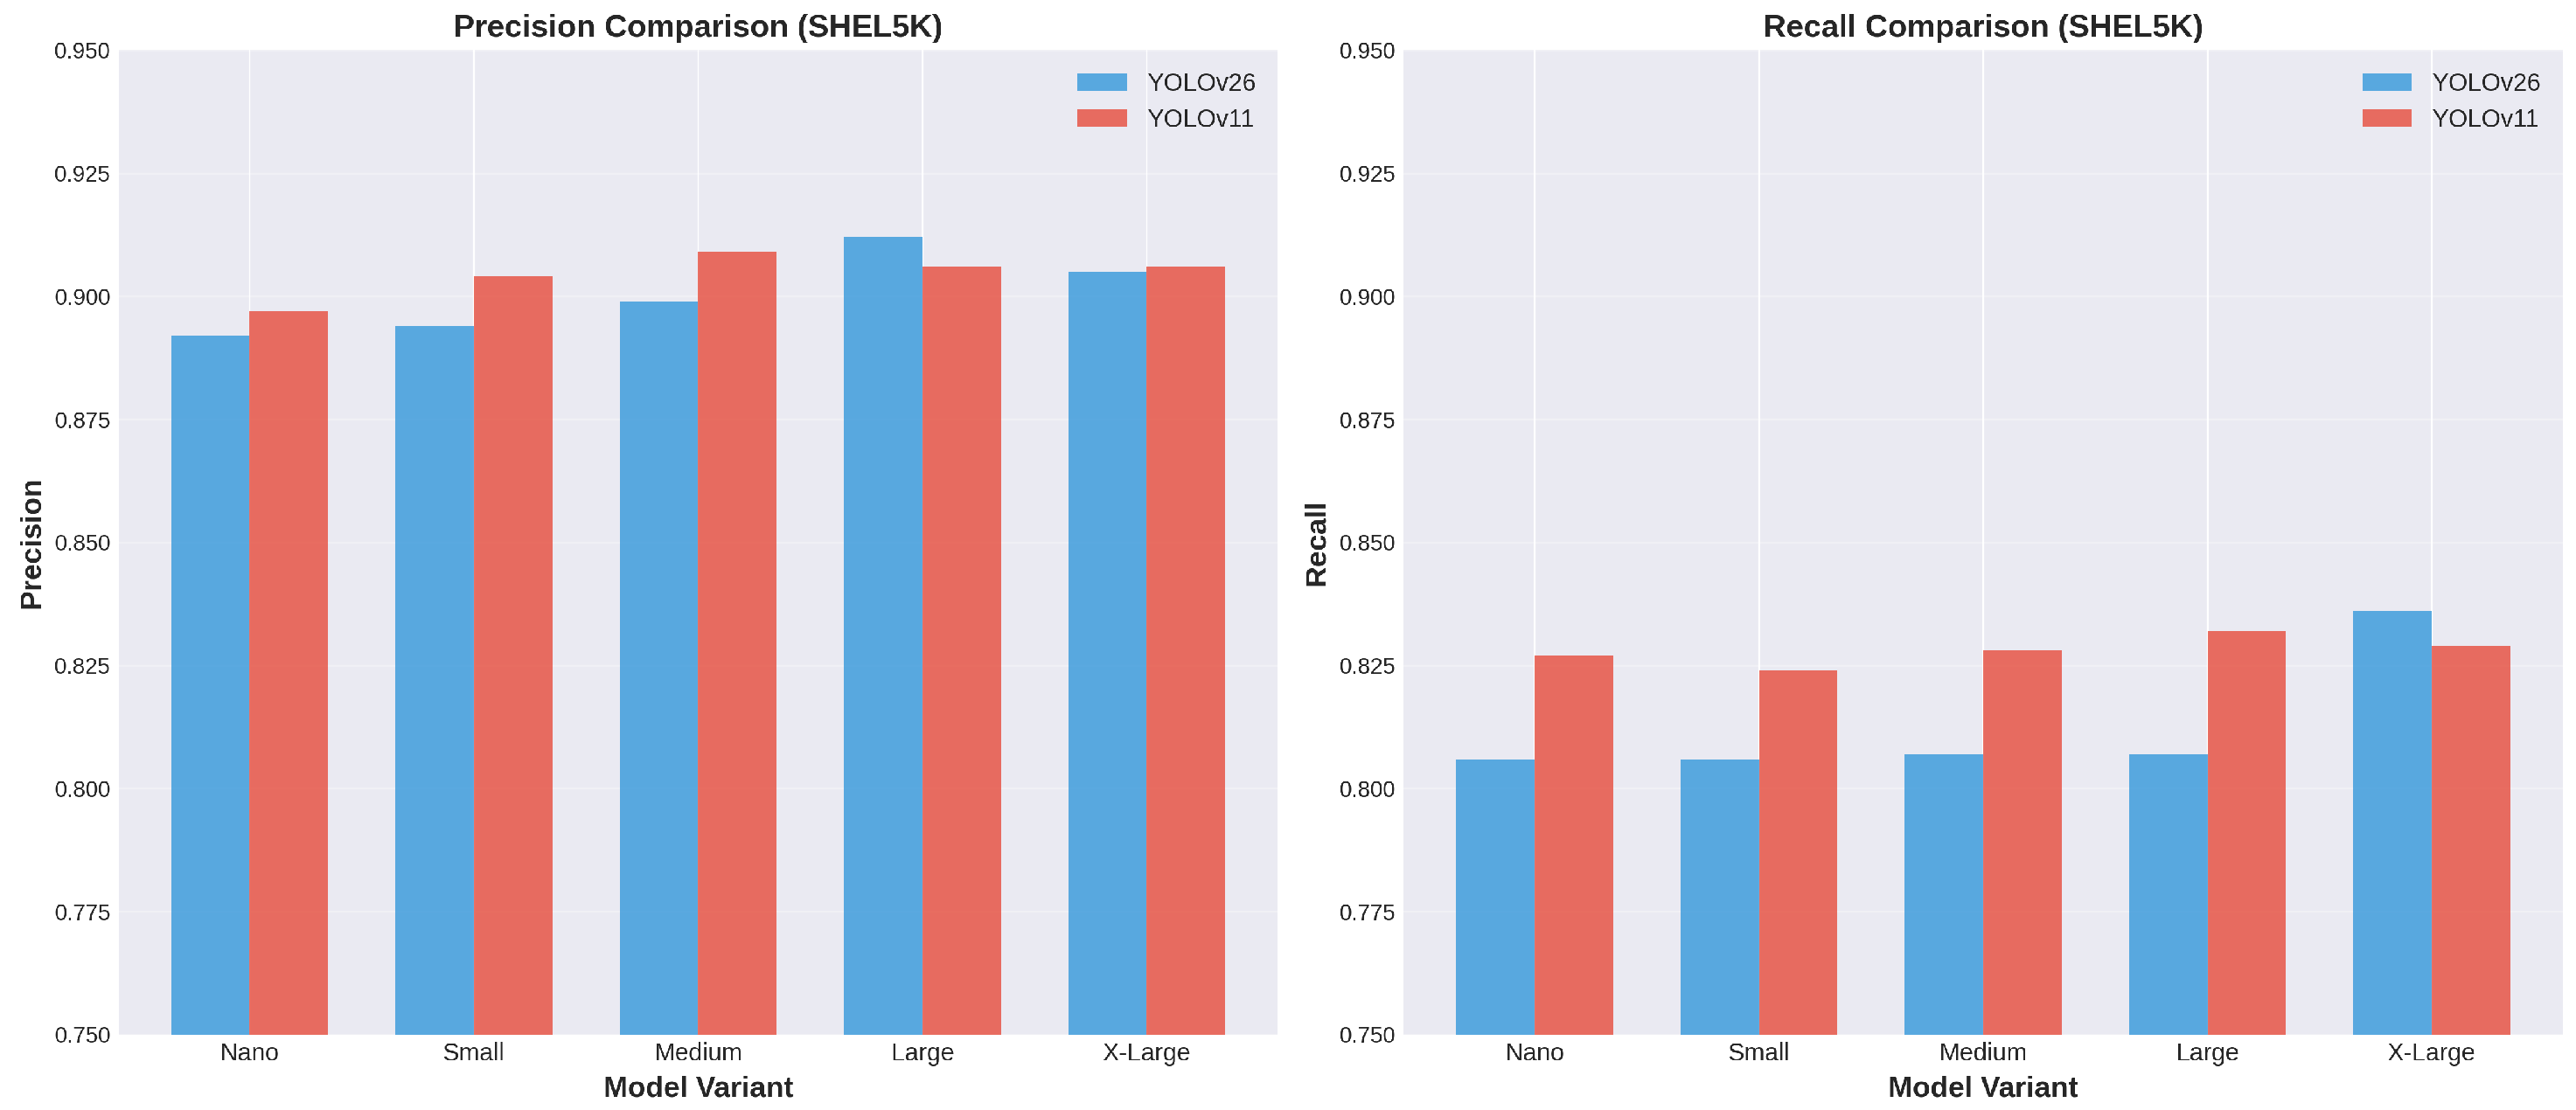
Precision-recall characteristics revealed an important distinction between architectures on SHEL5K. YOLOv11 achieved higher average recall (0.866 vs. 0.856 F1 score) while also maintaining comparable or superior precision, indicating better overall detection coverage. This balanced improvement across both metrics suggests that YOLOv11’s architectural optimizations on medium-scale datasets may include better handling of difficult detection cases that would otherwise be missed, rather than simply adjusting confidence thresholds to trade precision for recall.
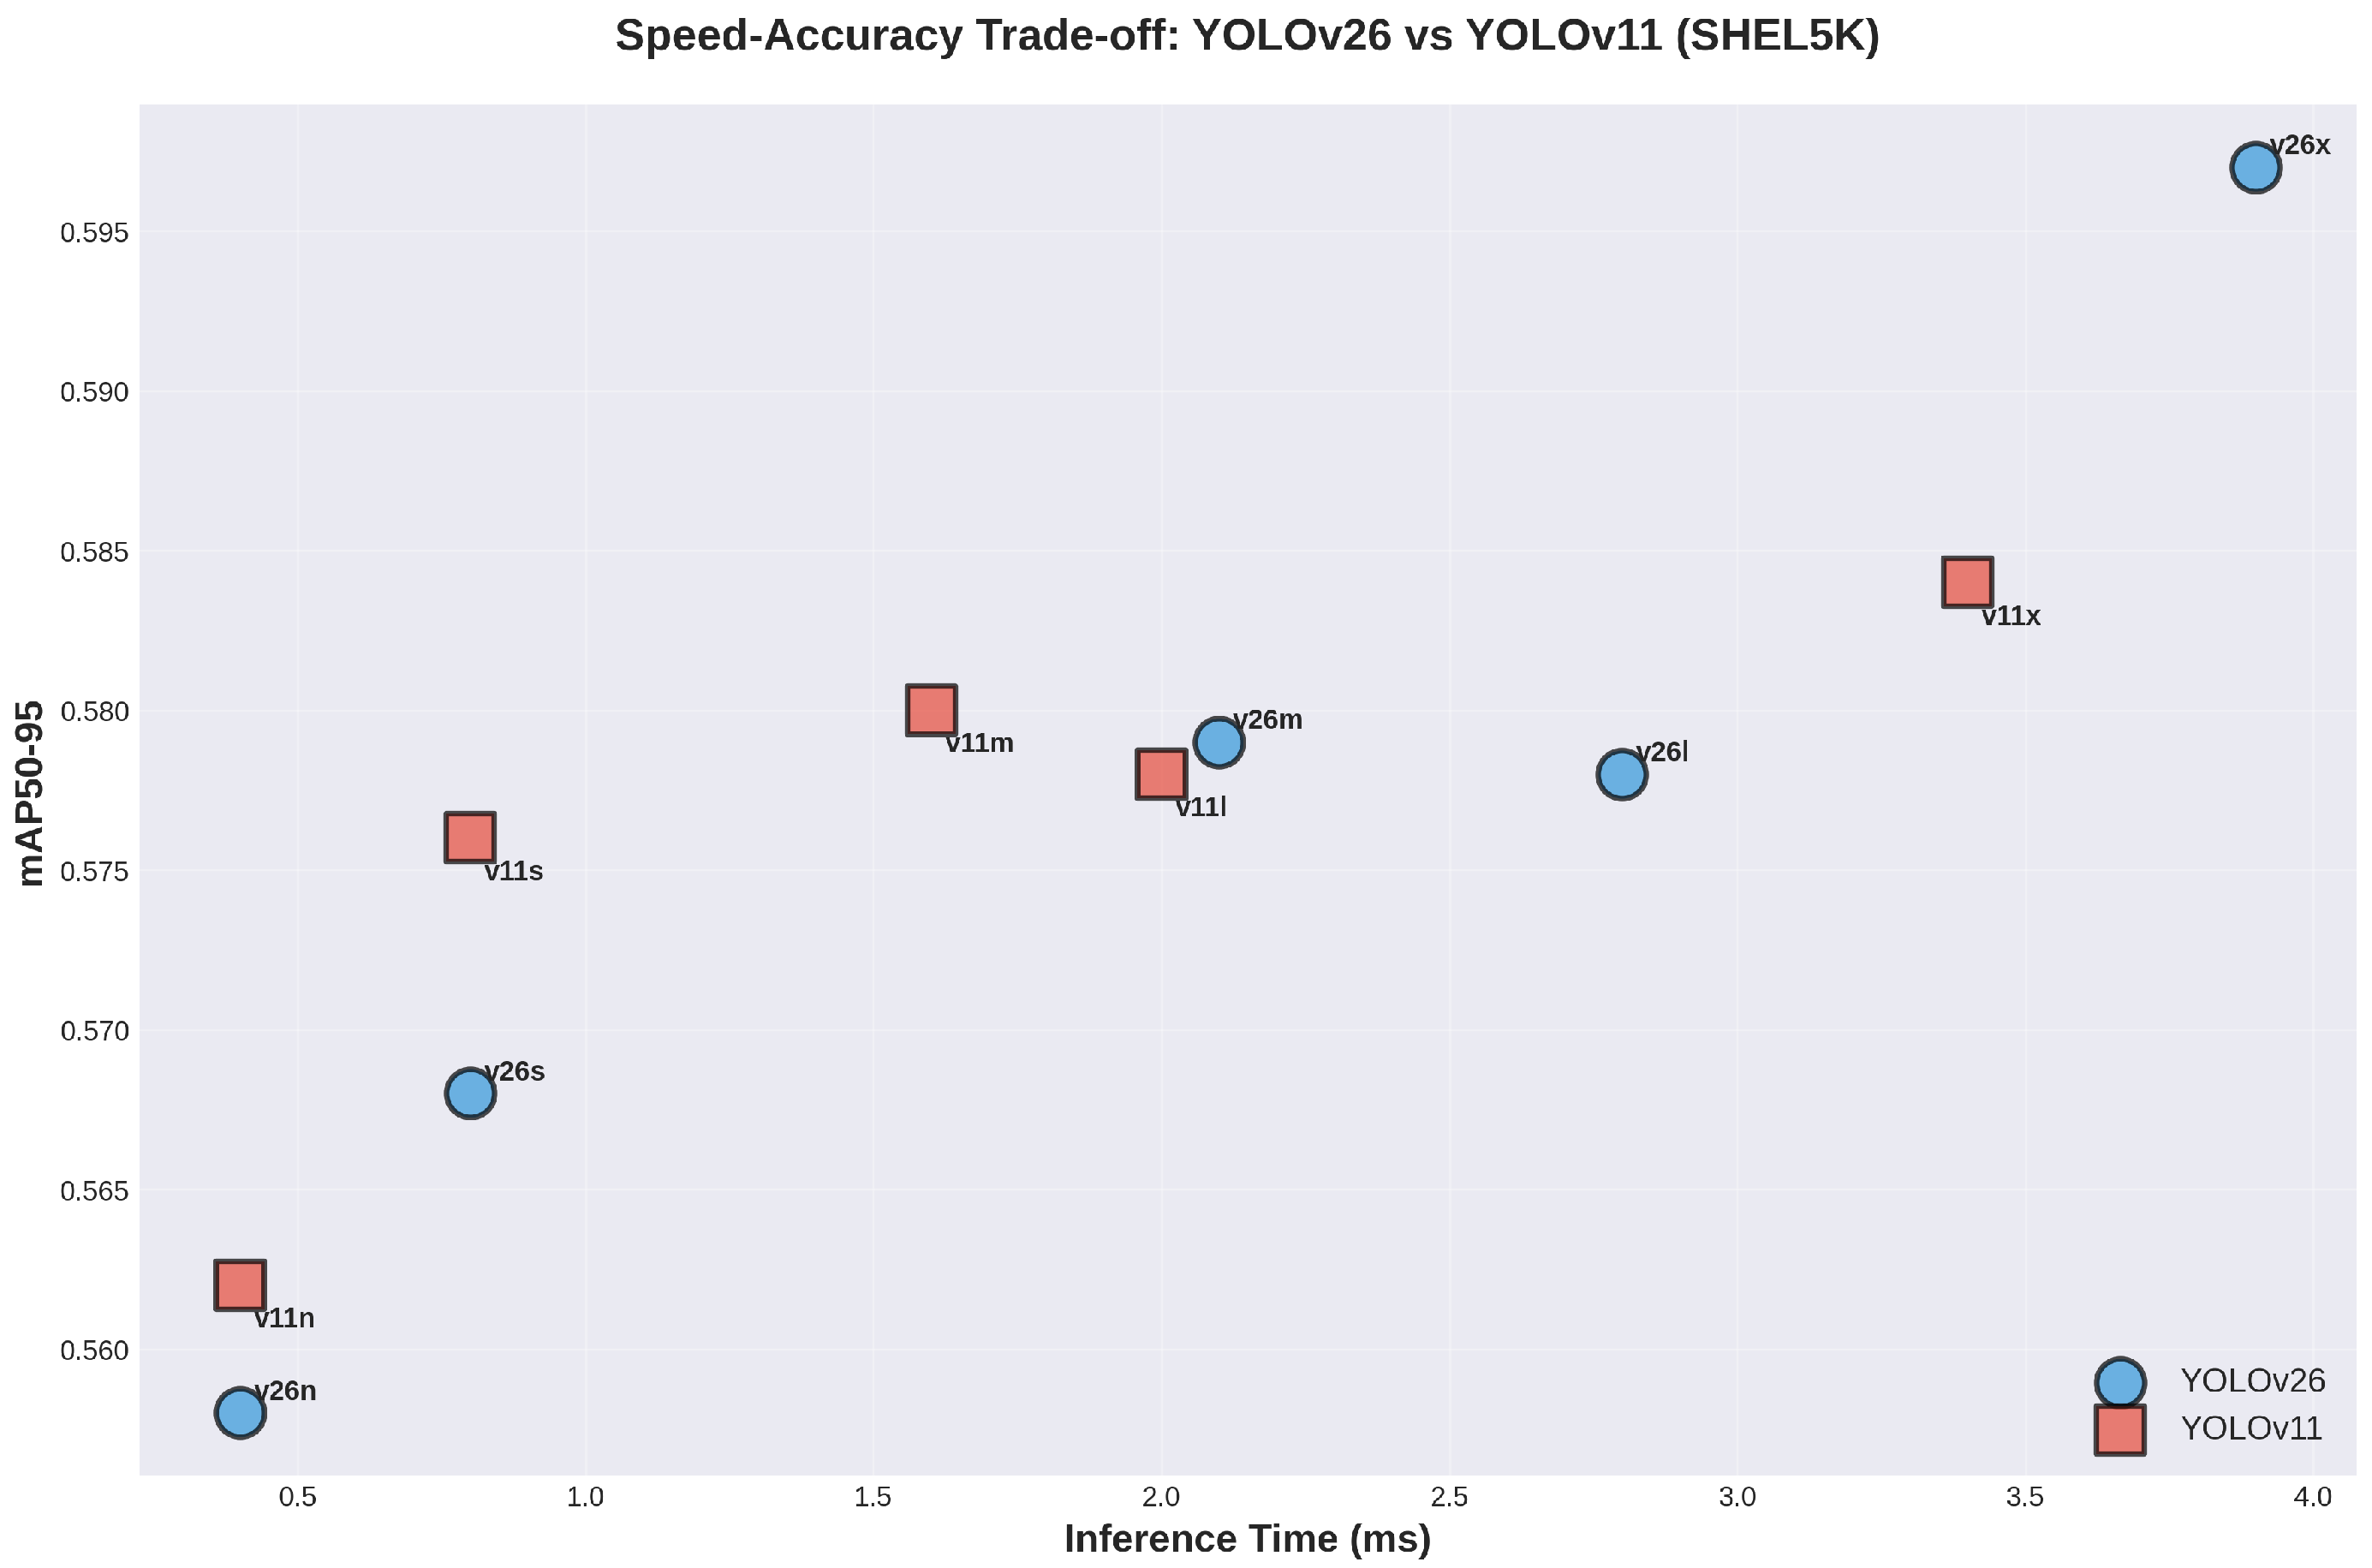
The speed-accuracy trade-off analysis (
Figure 9) demonstrates that both architectures achieve similar Pareto frontiers on SHEL5K, with YOLOv11 offering marginal speed advantages at comparable accuracy levels. This convergence in the speed-accuracy space reflects the overall performance parity observed in mAP metrics, suggesting that dataset characteristics play a crucial role in determining relative architectural advantages.
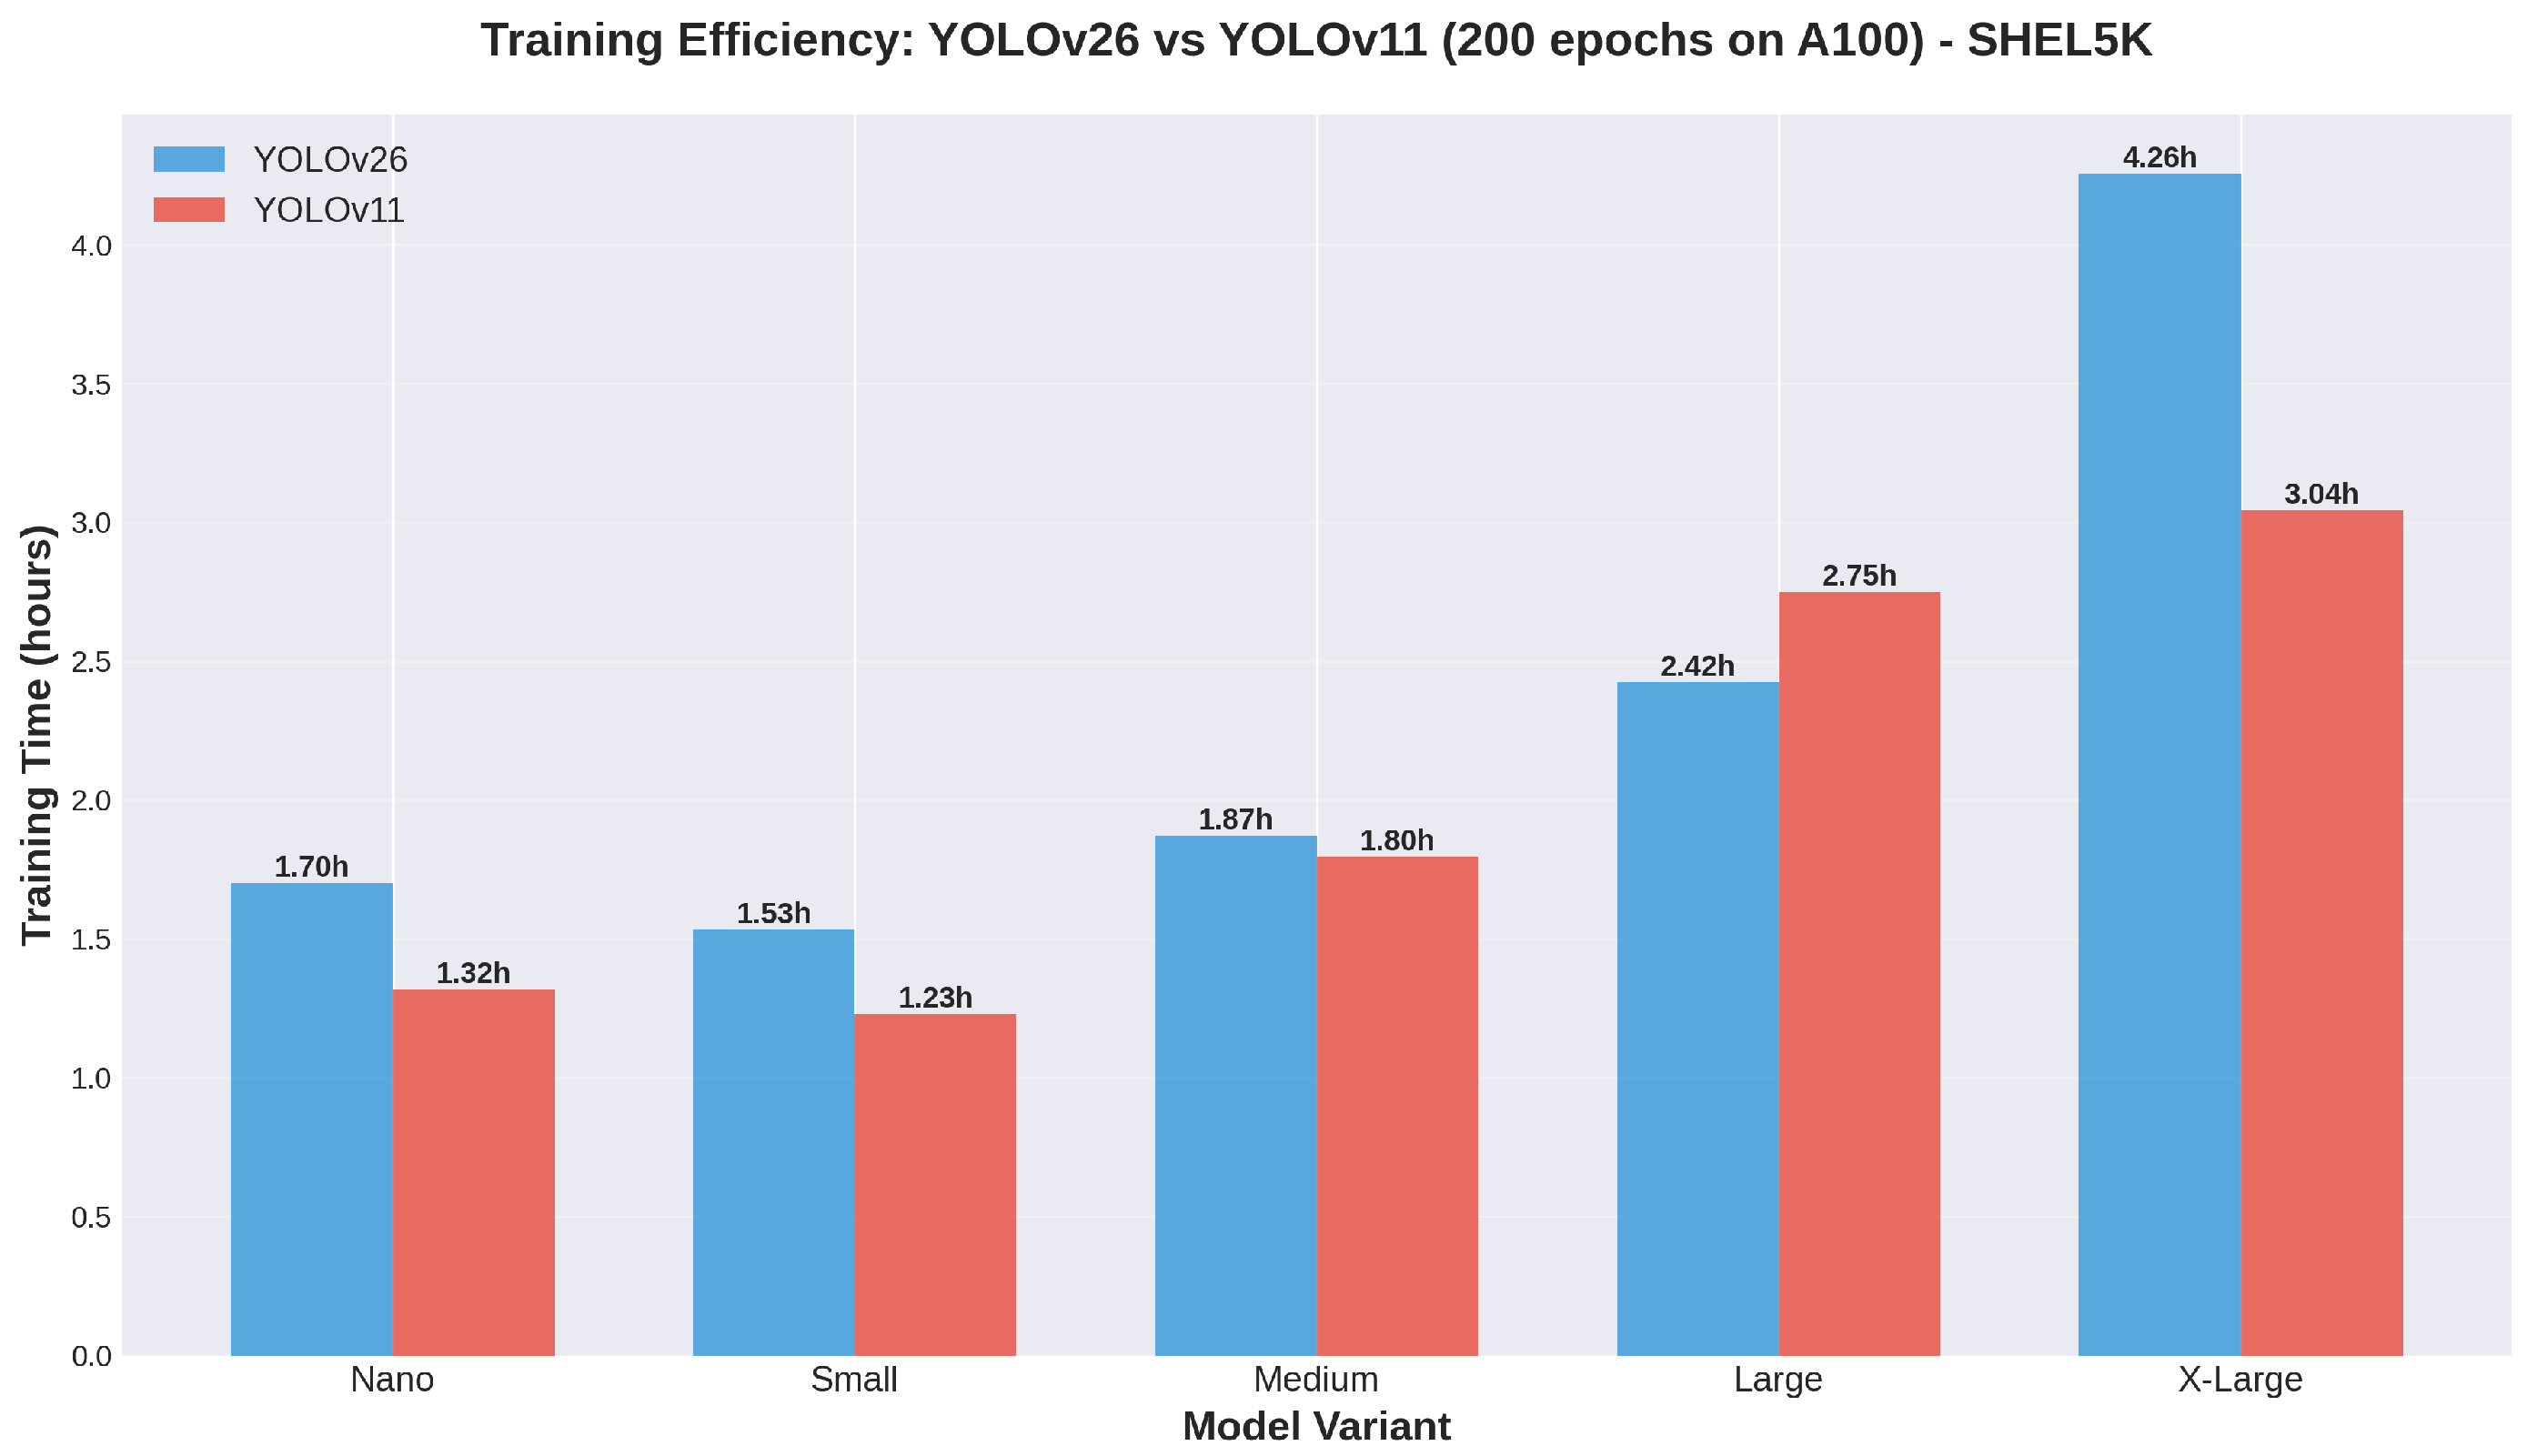
Training efficiency on SHEL5K presented an anomalous pattern that departed from the consistent trends observed on CHV, as illustrated in
Figure 10. While YOLOv11 remained faster overall (14.0% average advantage), the large variant unexpectedly required 13.5% more training time than YOLO26l (2.750 vs. 2.423 h). This isolated inefficiency suggests potential interaction between YOLOv11’s optimization strategies and the specific data characteristics or class distribution of SHEL5K at this particular model scale. The anomaly did not extend to the X-Large variant, where YOLOv11x recovered its expected efficiency advantage with 28.5% faster training.
Inference speed maintained YOLOv11’s consistent advantage at 18.0% average improvement, with particularly strong gains at the medium and large scales. YOLOv11m achieved 31.3% faster inference (1.6 ms vs. 2.1 ms), enabling 625 FPS throughput compared to YOLO26m’s 476 FPS. This substantial speed advantage at comparable accuracy (0.580 vs. 0.579 mAP50–95) positions YOLOv11m as an attractive choice for production deployments on SHEL5K-like datasets where balanced speed-accuracy trade-offs are desired.
3.5. SH17 Dataset Detailed Analysis
The SH17 dataset represents the most challenging evaluation scenario with 1620 training images distributed across 17 fine-grained PPE categories.
Table 9 and
Table 10 present performance metrics that reveal unexpected patterns requiring careful interpretation.
The SH17 dataset produced two critical and seemingly contradictory findings that require careful contextualization. First, YOLOv11 achieved superior average mAP50–95 (0.437 vs. 0.430), with advantages of 6.3%, 1.8%, and variable margins at nano, small, and medium scales respectively. However, this overall superiority completely reversed at the large and extra-large scales, where YOLO26l and YOLO26x outperformed their YOLOv11 counterparts by 1.2% and 3.1% respectively. This scale-dependent crossover pattern mirrors observations from CHV and SHEL5K datasets, reinforcing the conclusion that YOLO26’s architectural advantages specifically manifest at high model capacities.
Figure 10.
Training time comparison on SHEL5K dataset. YOLOv11 maintains efficiency advantage except at large variant where an anomalous 13.5% slowdown occurs.
Figure 10.
Training time comparison on SHEL5K dataset. YOLOv11 maintains efficiency advantage except at large variant where an anomalous 13.5% slowdown occurs.
Table 9.
Accuracy Performance on SH17 Dataset (17 Classes, 1620 Images).
Table 9.
Accuracy Performance on SH17 Dataset (17 Classes, 1620 Images).
| Model | mAP50 | mAP50–95 | F1-Score |
|---|
| YOLO26n | 0.653 | 0.306 | 0.651 |
| YOLOv11n | 0.704 | 0.369 | 0.687 |
| YOLO26s | 0.765 | 0.409 | 0.693 |
| YOLOv11s | 0.779 | 0.427 | 0.710 |
| YOLO26m | 0.813 | 0.458 | 0.721 |
| YOLOv11m | 0.811 | 0.455 | 0.720 |
| YOLO26l | 0.826 | 0.473 | 0.728 |
| YOLOv11l | 0.818 | 0.461 | 0.723 |
| YOLO26x | 0.852 | 0.506 | 0.747 |
| YOLOv11x | 0.836 | 0.475 | 0.730 |
| YOLO26 Avg. | 0.782 | 0.430 | 0.708 |
| YOLOv11 Avg. | 0.790 | 0.437 | 0.714 |
Table 10.
Efficiency and Complexity Metrics on SH17 Dataset.
Table 10.
Efficiency and Complexity Metrics on SH17 Dataset.
| Model | Infer. (ms) | Train (h) | FPS | Params (M) | FLOPs (G) |
|---|
| YOLO26n | 0.3 | 2.10 | 3333 | 2.38 | 5.2 |
| YOLOv11n | 0.4 | 17.52 | 2500 | 2.58 | 6.3 |
| YOLO26s | 1.0 | 2.51 | 1000 | 9.47 | 20.5 |
| YOLOv11s | 0.6 | 17.29 | 1667 | 9.42 | 21.3 |
| YOLO26m | 1.2 | 3.42 | 833 | 20.35 | 67.9 |
| YOLOv11m | 1.2 | 17.07 | 833 | 20.03 | 67.7 |
| YOLO26l | 1.6 | 4.30 | 625 | 24.75 | 86.1 |
| YOLOv11l | 1.4 | 17.72 | 714 | 25.28 | 86.6 |
| YOLO26x | 2.5 | 5.69 | 400 | 55.64 | 193.4 |
| YOLOv11x | 2.4 | 17.34 | 417 | 56.83 | 194.4 |
| YOLO26 Avg. | 1.32 | 3.603 | 1038 | 22.52 | 74.6 |
| YOLOv11 Avg. | 1.20 | 17.391 | 1026 | 22.83 | 75.3 |
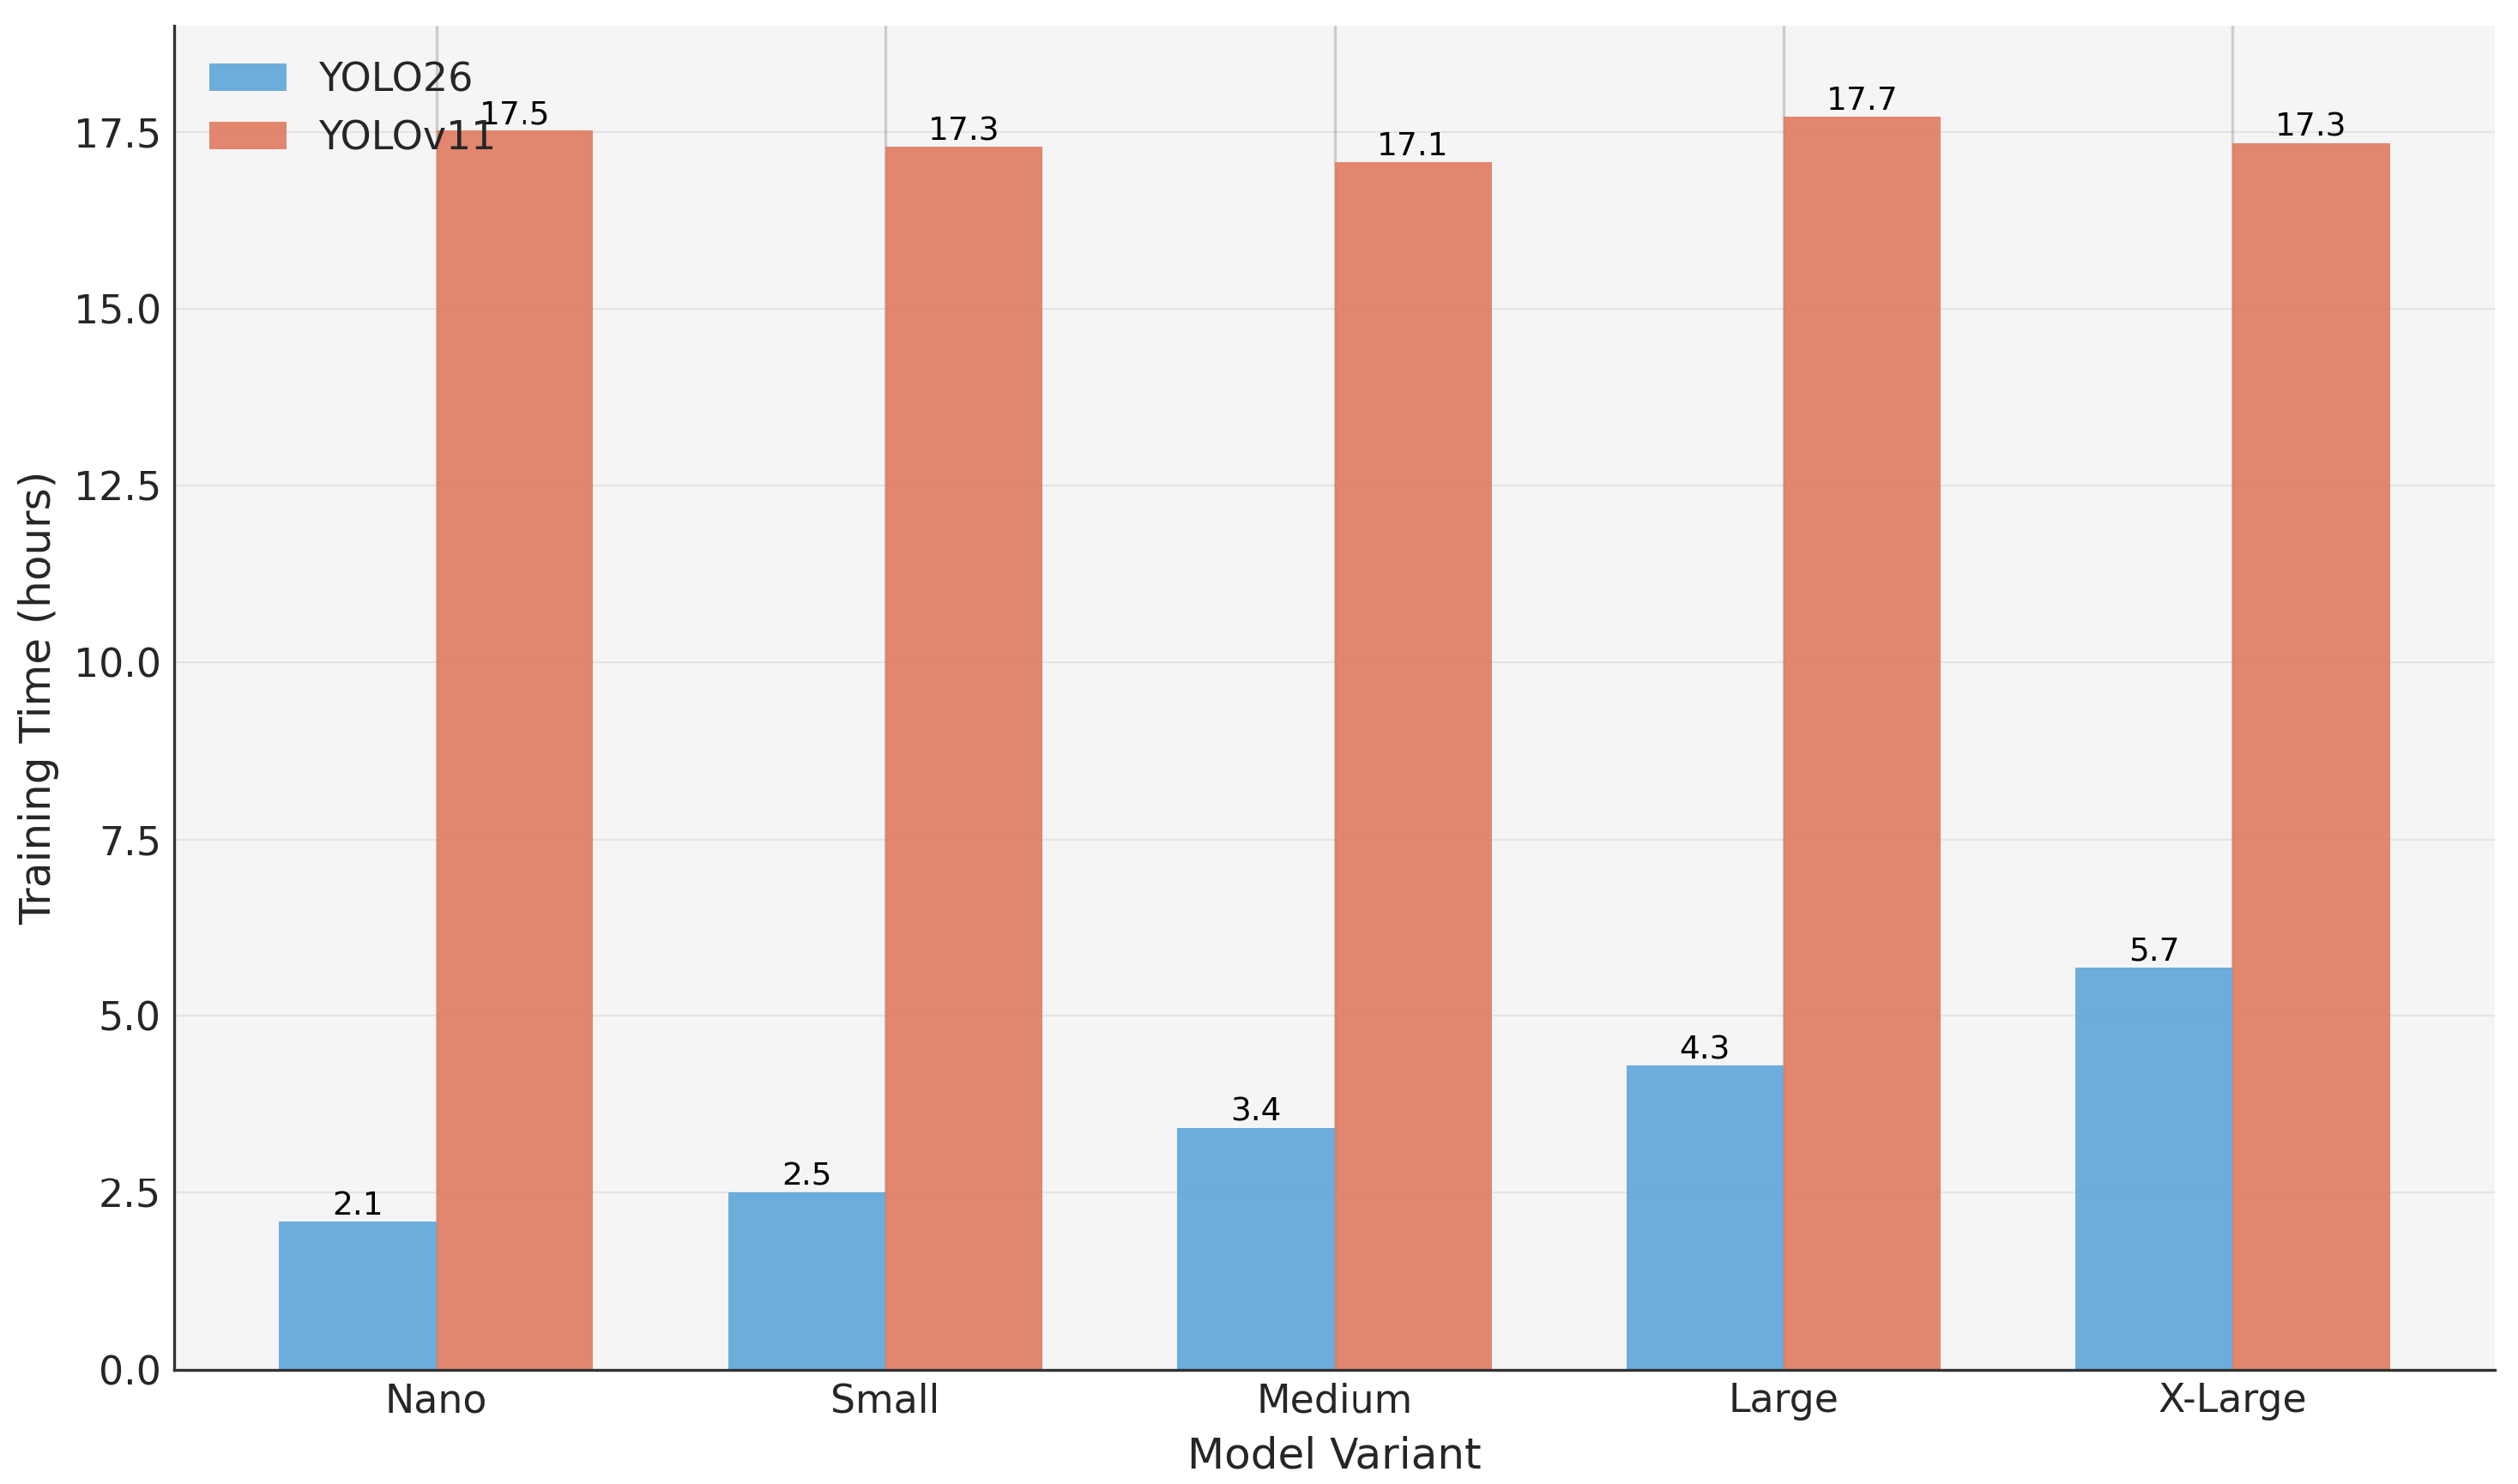
The second critical finding concerns training efficiency, where an extreme and unprecedented anomaly emerged, as dramatically illustrated in
Figure 11. While YOLOv11 demonstrated expected efficiency advantages on CHV and SHEL5K datasets (14–20% faster training), the pattern dramatically reversed on SH17, with YOLO26 training 79.3% faster on average (3.603 h vs. 17.391 h). The magnitude of this reversal is extraordinary: YOLO26n completed training in 2.10 h while YOLOv11n required 17.52 h, representing an 8.34-fold (734%) relative speedup. This pattern persisted consistently across all five model variants, with YOLOv11 training times remarkably uniform (ranging only from 17.07 to 17.72 h) regardless of model size.
This uniformity in YOLOv11 training times strongly suggests an implementation-specific issue rather than a fundamental architectural property. The convergence of all YOLOv11 variants to approximately 17.5 h corresponds closely to the time required to complete the full 200-epoch budget, indicating potential failure of early stopping mechanisms or validation-related computational bottlenecks specific to the SH17 dataset’s characteristics. In contrast, YOLO26 models exhibited expected behavior with training times scaling appropriately with model size (2.10 to 5.69 h) and successful early stopping at various epoch counts based on validation performance.
Despite this training anomaly, inference speed metrics appeared unaffected, with YOLOv11 maintaining a modest 9.1% average advantage (1.20 ms vs. 1.32 ms). The smaller relative speed gain compared to CHV (17.0%) and SHEL5K (18.0%) datasets suggests that the inference optimization benefits of YOLOv11’s architecture may be less pronounced for large-scale multi-class detection tasks where computational overhead becomes more evenly distributed across both architectures.
This training efficiency anomaly is consistent with findings reported by Rahimi [
42], who observed similar uniform training times for YOLOv11 variants on the SH17 dataset during their experiments. In their published results, YOLOv11 training times showed minimal variation across model scales, suggesting a systematic implementation issue rather than an artifact of specific training configurations. The persistence of this pattern in our experiments, despite using different training durations (200 epochs vs. their initial 100-epoch protocol) and updated framework versions (Ultralytics 8.4.0+ vs. 8.3.69), provides additional evidence that the anomaly reflects fundamental optimization challenges in YOLOv11’s handling of large-scale multi-class datasets rather than transient implementation bugs. The convergence of all YOLOv11 variants to approximately 17.5 h corresponds closely to the time required to complete the full 200-epoch budget, indicating potential failure of early stopping mechanisms or validation-related computational bottlenecks specific to the SH17 dataset’s characteristics. In contrast, YOLO26 models exhibited expected behavior with training times scaling appropriately with model size (2.10 to 5.69 h) and successful early stopping at various epoch counts based on validation performance.
Per-class performance analysis on SH17’s 17 categories revealed that YOLO26x’s 3.1% overall advantage at the X-Large scale was driven by superior performance on several critical safety equipment categories. YOLO26x achieved 8.1% higher mAP50–95 on helmet detection (0.495 vs. 0.414), one of the most important classes for construction safety applications. Similarly, person detection showed a 3.1% advantage (0.808 vs. 0.777), while safety vest detection exhibited near parity (0.745 vs. 0.741). These patterns suggest that YOLO26’s architectural benefits are particularly pronounced for visually complex or frequently occluded object categories that benefit from enhanced feature representation.
3.6. Scale-Dependent Performance Patterns
Analysis across all three datasets reveals consistent scale-dependent patterns that transcend individual dataset characteristics.
Table 11 systematizes these patterns by aggregating performance differences across datasets for each model scale category.
The scale analysis reveals a clear and monotonic relationship between model size and YOLO26’s relative performance advantage. At the nano scale, YOLOv11 consistently outperforms across all three datasets with an average 2.5 percentage point advantage. This superiority diminishes progressively as model scale increases, crossing over to YOLO26 advantage at the medium-to-large transition point. The relationship culminates at the X-Large scale where YOLO26 achieves universal superiority with a substantial 2.1 percentage point average advantage.
This pattern suggests that YOLO26’s architectural enhancements, which may include more sophisticated attention mechanisms, enhanced feature pyramid networks, or improved multi-scale fusion strategies, require sufficient model capacity to manifest their benefits. At heavily constrained parameter budgets (nano/small scales), these enhancements may actually impose overhead that reduces overall efficiency, explaining YOLOv11’s superiority. However, as capacity constraints relax, YOLO26’s more expressive architecture can fully exploit available parameters to achieve superior feature representations.
The consistency metric in
Table 11 quantifies how reliably each architecture wins at each scale across different datasets. YOLOv11’s 3/3 consistency at nano and small scales, combined with YOLO26’s 3/3 consistency at X-Large scale, provides strong evidence that these patterns reflect fundamental architectural properties rather than dataset-specific quirks or statistical noise. The medium scale represents a transitional regime where relative performance becomes dataset-dependent, suggesting that this capacity level sits near the threshold where YOLO26’s architectural complexity begins to provide net benefits.
3.7. Computational Efficiency Analysis
Comprehensive computational efficiency analysis requires examining multiple dimensions: training time, inference speed, parameter efficiency, and computational complexity.
Table 12 synthesizes these metrics across all datasets and model scales.
When excluding the anomalous SH17 training behavior, YOLOv11 demonstrates consistent and substantial efficiency advantages: 15.7% faster training and 16.7% faster inference on average. These improvements manifest consistently across both CHV and SHEL5K datasets at all model scales, suggesting they reflect genuine architectural optimizations in YOLOv11’s design. The inference speed advantage proves particularly valuable for deployment scenarios, as it enables higher throughput on fixed hardware or alternatively permits deployment on lower-cost hardware for target throughput requirements.
The SH17 training anomaly, however, completely dominates the overall statistics when included, resulting in an average 65.7% training time advantage for YOLO26. As discussed previously, the uniformity of YOLOv11 training times on SH17 (17.5 h for all variants) strongly suggests an implementation issue rather than an architectural property. This interpretation is further supported by the fact that inference speeds on SH17 exhibit the expected pattern with YOLOv11 maintaining a 9.1% advantage, indicating that the runtime inference optimizations function correctly even as training behavior degrades.
Parameter efficiency analysis reveals interesting nuances in how each architecture utilizes its capacity. Averaged across all datasets and scales, both architectures converge to nearly identical parameter counts (22.52 M for YOLO26, 22.83 M for YOLOv11) and FLOPs (74.6 G for YOLO26, 75.3 G for YOLOv11). However, YOLO26 achieves higher mAP50–95 per parameter (0.0237 vs. 0.0233) and per GFLOP (0.00714 vs. 0.00708), suggesting more effective utilization of computational resources to achieve detection accuracy.
This efficiency advantage manifests most clearly at the X-Large scale, where YOLO26x achieves 2.1 percentage points higher average mAP50–95 (0.574 vs. 0.553) while using fewer parameters (55.64 M vs. 56.83 M) and slightly lower computational complexity (193.4 G vs. 194.4 G FLOPs). This indicates that YOLO26’s architectural innovations enable it to extract more detection performance from each parameter and floating-point operation, albeit at the cost of longer training times and slower inference when computational budget is matched.
3.8. Dataset Size Impact on Architectural Performance
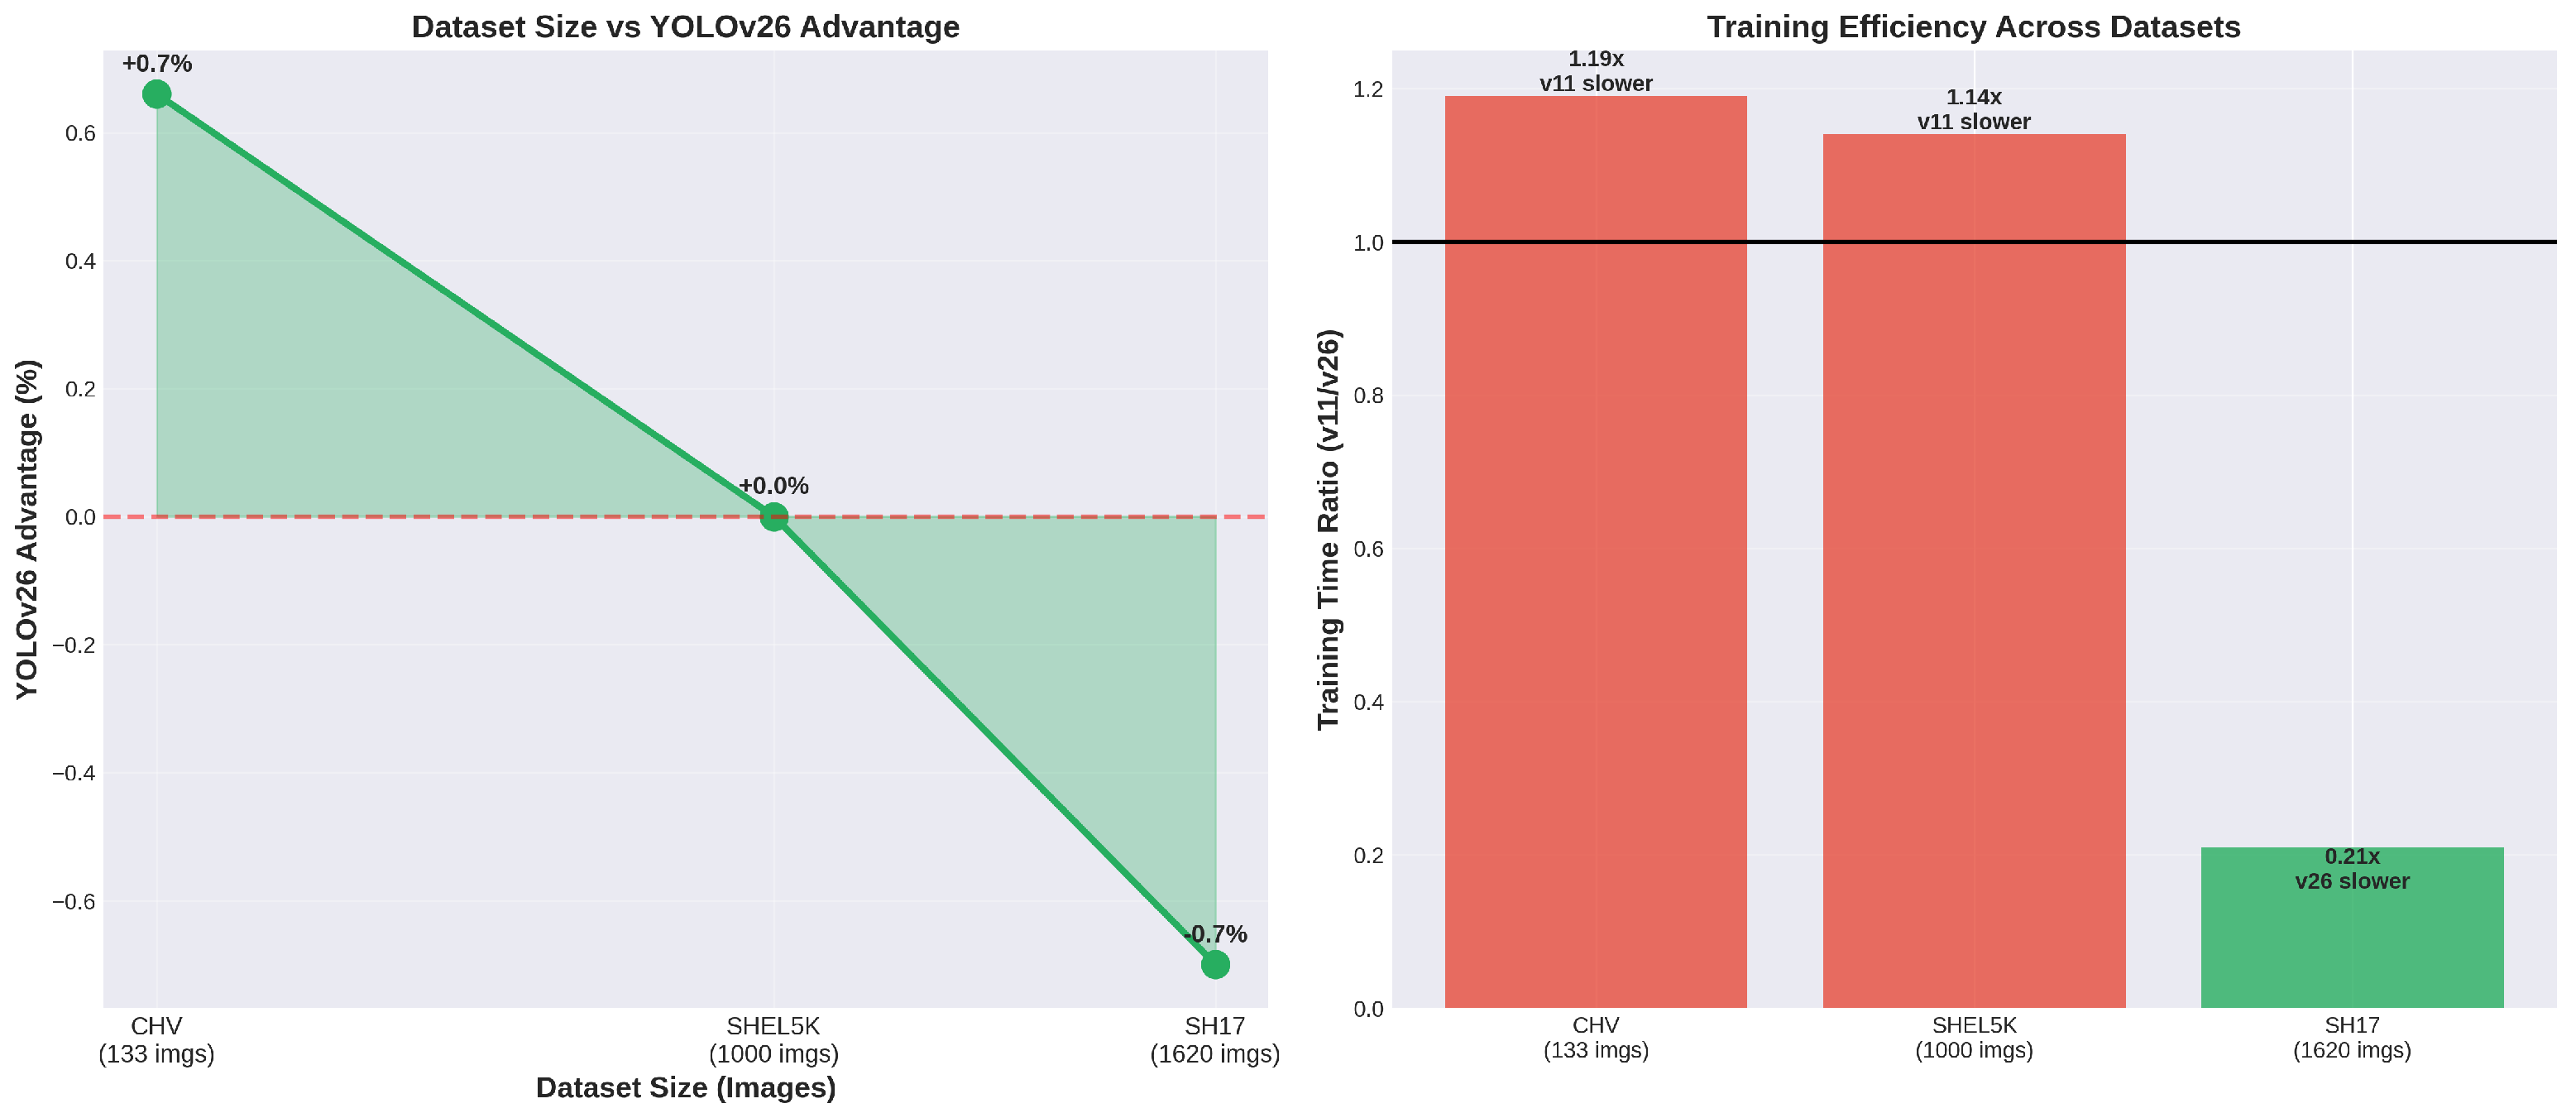
A striking pattern emerges when examining how dataset scale influences relative architectural performance, revealing a strong negative correlation between dataset size and YOLO26’s performance advantage, as detailed in
Table 13.
The correlation coefficient of
between dataset size and YOLO26 advantage indicates a nearly perfect inverse linear relationship, though statistical significance is limited by the small number of data points (
) (
Figure 12). This pattern suggests that YOLO26’s architectural enhancements provide particular value in data-scarce regimes where effective regularization, feature extraction from limited samples, and generalization from small training sets become critical. Conversely, as dataset size increases and provides richer training signal, the fundamental architectural differences between YOLO26 and YOLOv11 diminish in importance, with both architectures converging toward similar performance levels determined primarily by the quality and quantity of training data.
This finding has important practical implications for deployment strategy selection. For organizations with limited labeled training data (hundreds of images), investing in YOLO26 architecture may yield meaningful accuracy improvements. However, for applications where thousands of labeled examples can be economically obtained, the architectural choice becomes less critical to final performance, and selection should prioritize deployment constraints such as inference speed and hardware requirements.
3.9. Cross-Dataset Generalization Patterns
Examining model performance consistency across datasets provides insights into architectural robustness and generalization capabilities.
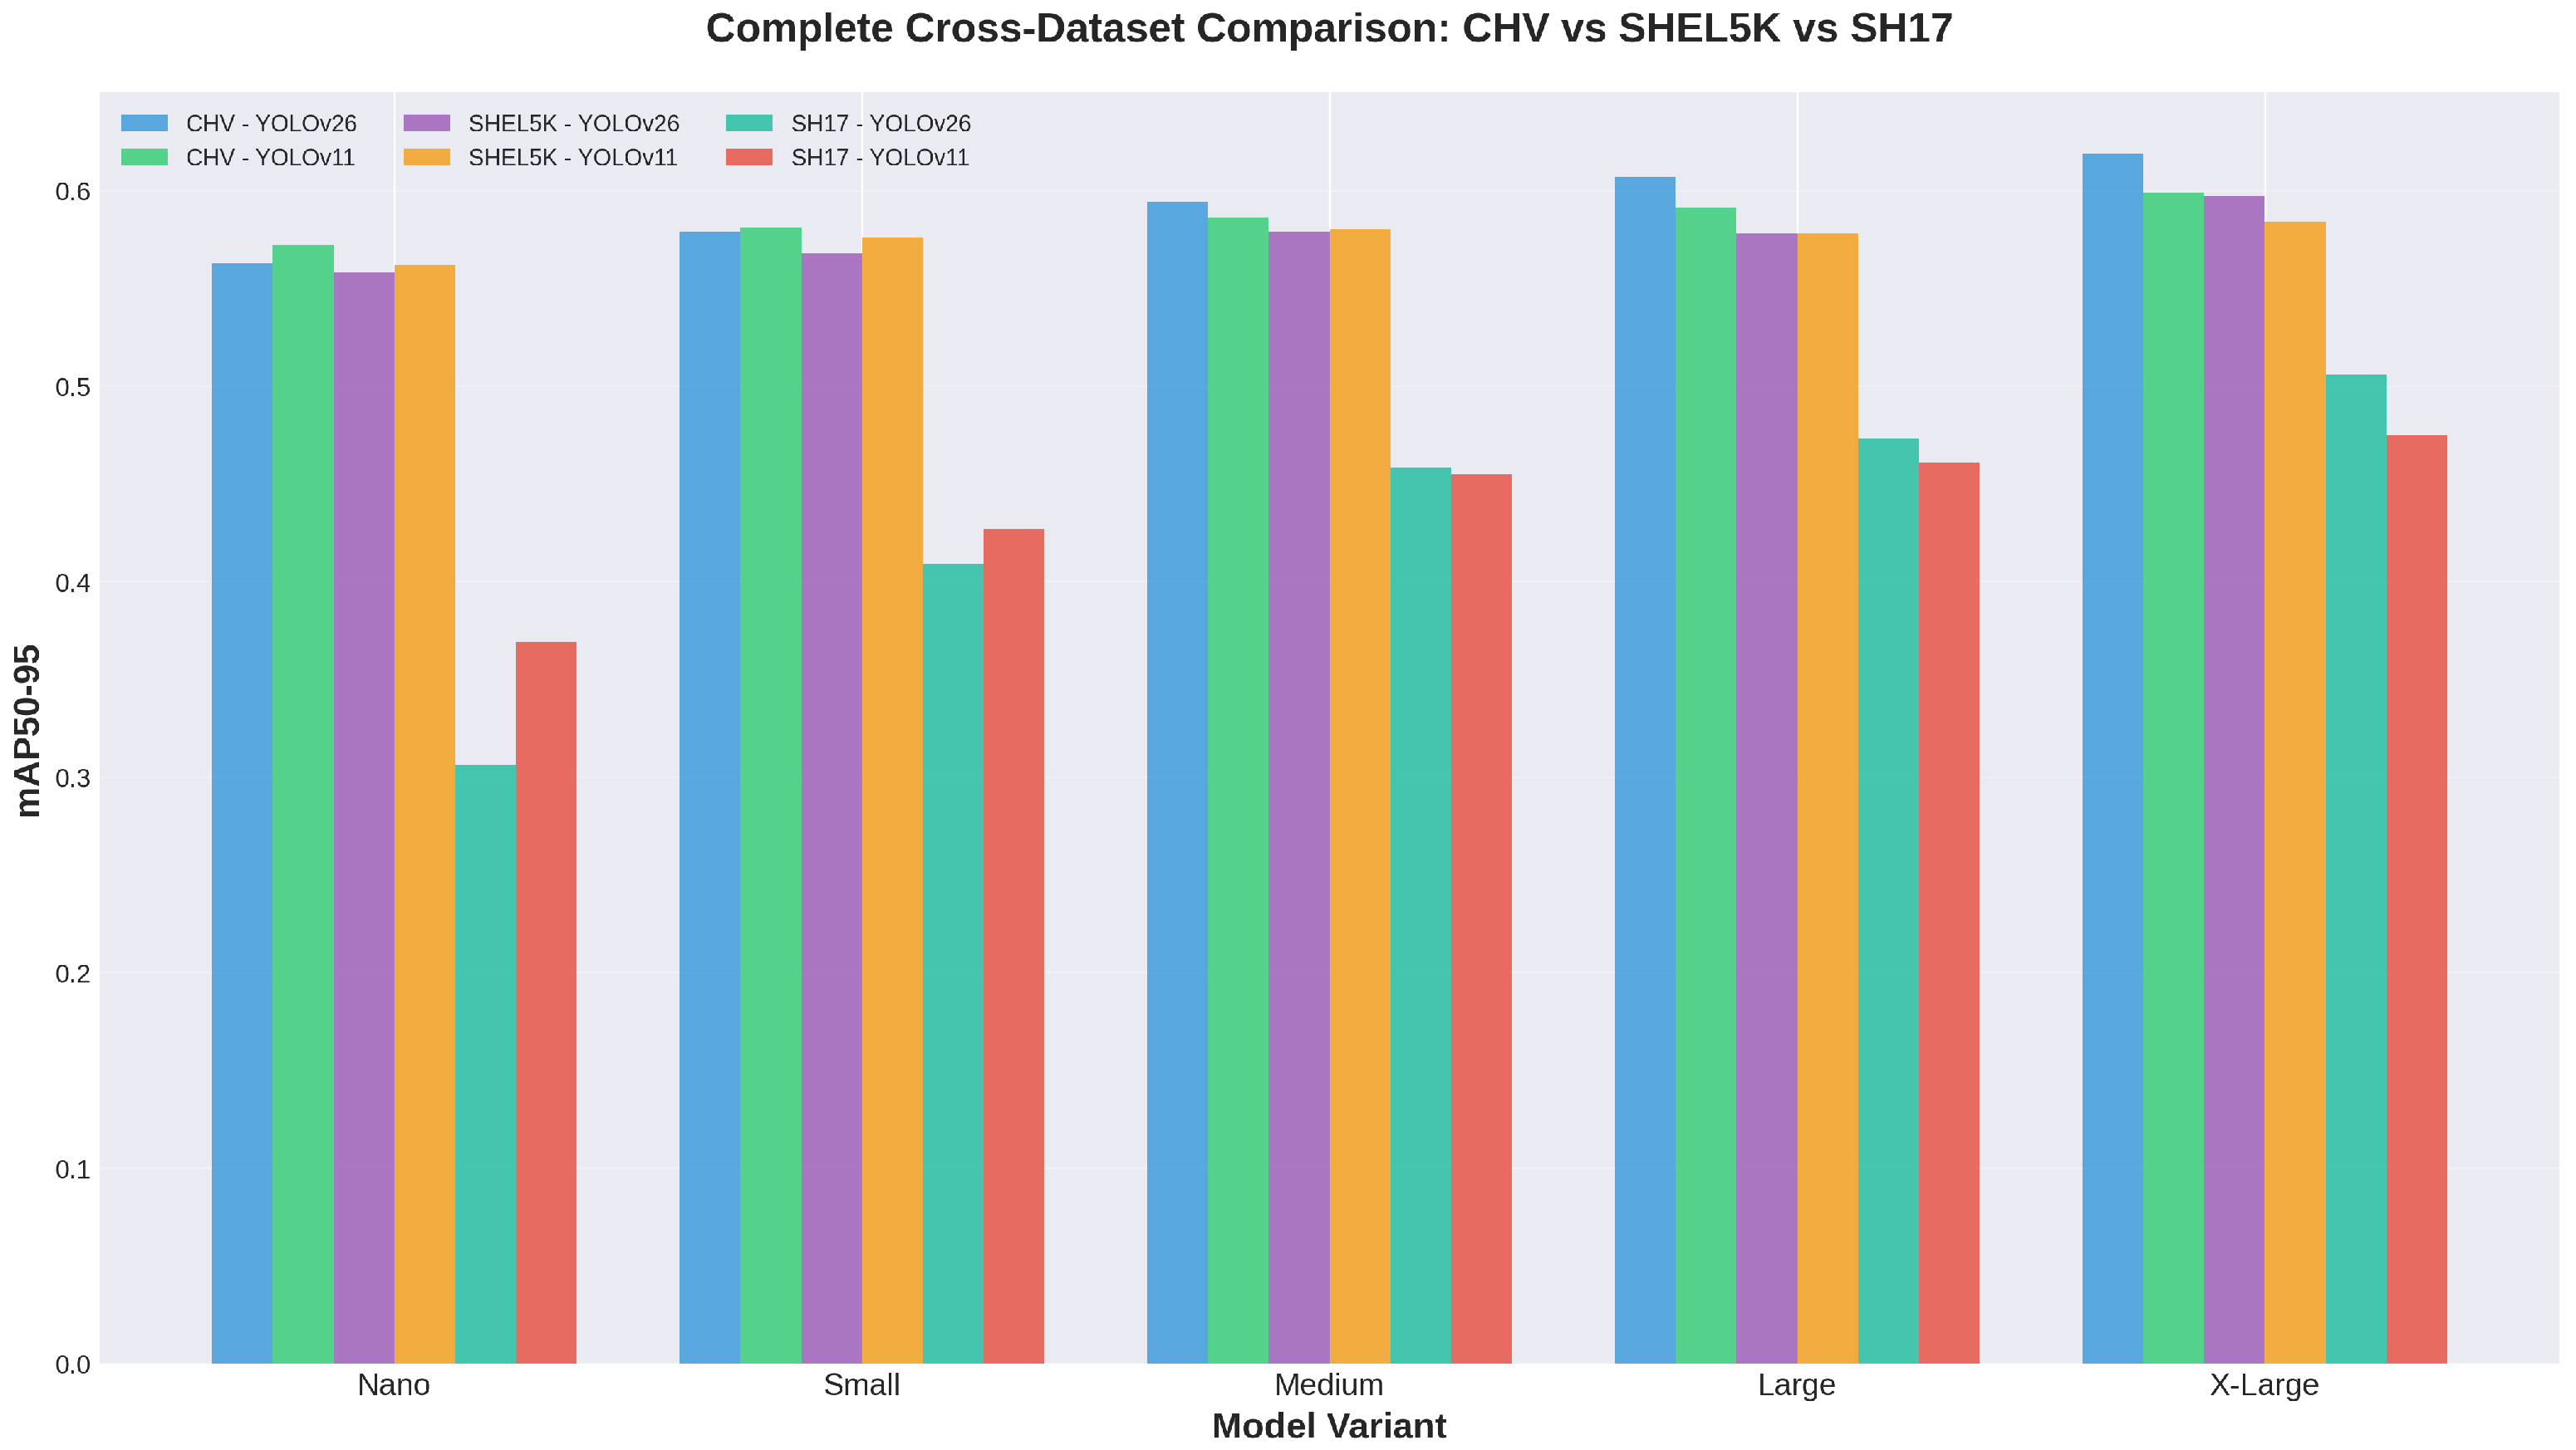
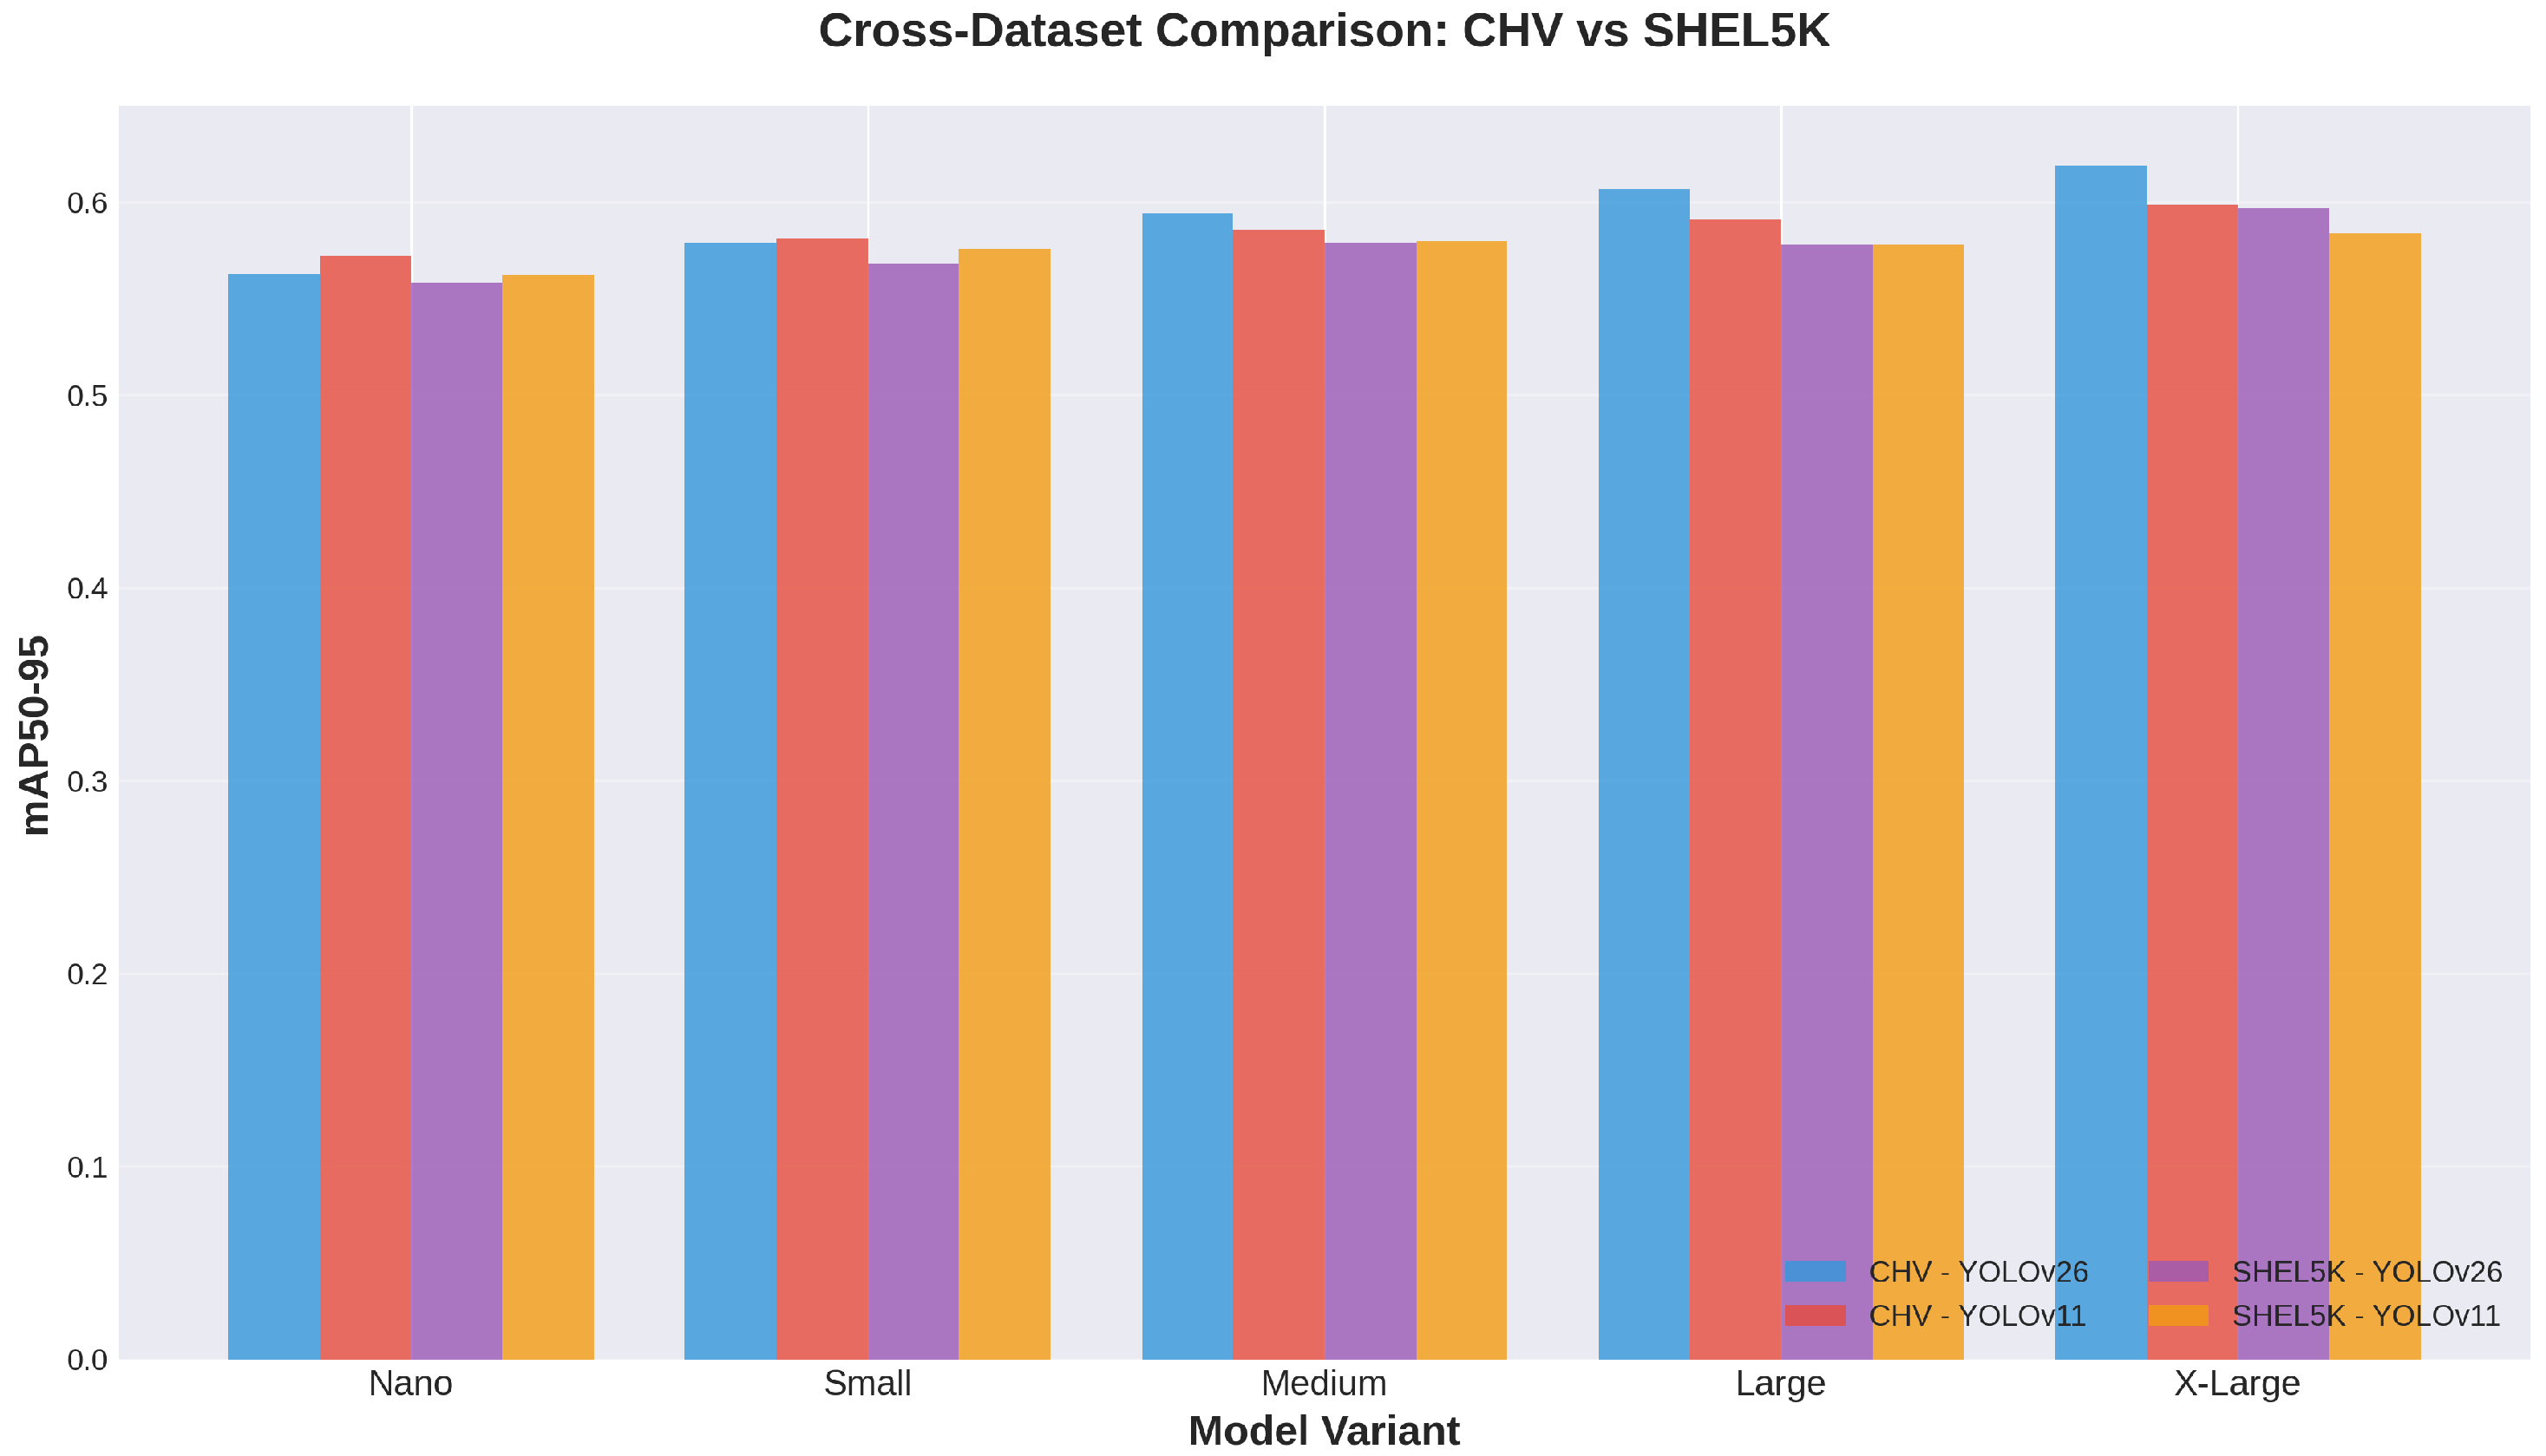
Figure 13 provides a comprehensive cross-dataset comparison across all three PPE detection datasets, while
Table 14 presents coefficient of variation (CV) metrics quantifying performance stability.
When considering all model scales, YOLOv11 exhibits slightly lower performance variance across datasets (CV = 14.3% vs. 15.4%), indicating somewhat more consistent behavior across diverse detection scenarios. However, this advantage reverses when examining only X-Large variants, where YOLO26x demonstrates lower variance (CV = 9.9% vs. 11.4%). This pattern suggests that YOLO26’s consistency improves with model capacity, while YOLOv11 maintains more uniform behavior across scales.
The substantial variation in absolute performance across datasets (mAP50–95 ranging from 0.306 to 0.619 for YOLO26) reflects the dramatic differences in task difficulty between datasets. The SH17 dataset’s 17-class fine-grained detection problem with complex category distinctions proves substantially more challenging than CHV’s 6-class or SHEL5K’s 3-class scenarios, despite SH17’s larger training set. This underscores the importance of task complexity as a performance determinant independent of dataset scale.
3.10. SH17 Dataset Analysis and Comparison with Literature
The SH17 dataset represents the most comprehensive and challenging evaluation scenario among the three datasets examined in this study, featuring 1620 training images distributed across 17 fine-grained PPE categories including person, helmet, safety-vest, gloves, glasses, face-mask, and various body parts. This dataset was specifically designed for comprehensive safety compliance monitoring in industrial manufacturing environments, extending beyond the construction-focused scope of datasets like CHV and SHEL5K. To further contextualize the SH17-focused discussion, we first summarize the characteristic precision–recall behavior on SHEL5K (
Figure 14) and then provide a direct cross-dataset comparison between CHV and SHEL5K (
Figure 15).
Recent work by Ahmad and Rahimi [
23] introduced the SH17 dataset with YOLOv8-9-10 benchmarks, followed by Rahimi’s evaluation [
42] of YOLOv9-10-11 variants.
Table 15 presents a comprehensive comparison between the published benchmarks and our experimental results, all conducted under identical training conditions of 200 epochs with comparable hyperparameter configurations.
The comparison reveals several important findings that contextualize our results within the broader landscape of YOLO architecture evolution. First, YOLO26x achieves substantially higher mAP50 (0.852) compared to all previously published results on SH17, including the YOLOv11-x benchmark from the original dataset paper (0.681). This represents a 17.1 percentage point improvement in mAP50, demonstrating that YOLO26’s architectural enhancements translate effectively to complex multi-class industrial safety detection scenarios.
Table 15.
SH17 Dataset Performance: Literature Comparison.
Table 15.
SH17 Dataset Performance: Literature Comparison.
| Model | Source | Epochs | mAP50 | mAP50–95 | Params (M) |
|---|
| Literature Results (Ahmad & Rahimi, 2024 [23]) |
| YOLOv9-e | IEEE 2025 | 200 | 0.709 | 0.487 | 58.1 |
| YOLOv10-x | IEEE 2025 | 200 | 0.673 | 0.464 | 29.5 |
| YOLOv11-x | IEEE 2025 | 200 | 0.681 | 0.468 | 56.8 |
| Our Results (200 epochs, identical configuration) |
| YOLO26n | This study | 200 | 0.653 | 0.306 | 2.38 |
| YOLO26s | This study | 200 | 0.765 | 0.409 | 9.47 |
| YOLO26m | This study | 200 | 0.813 | 0.458 | 20.35 |
| YOLO26l | This study | 200 | 0.826 | 0.473 | 24.75 |
| YOLO26x | This study | 200 | 0.852 | 0.506 | 55.64 |
| YOLOv11n | This study | 200 | 0.704 | 0.369 | 2.58 |
| YOLOv11s | This study | 200 | 0.779 | 0.427 | 9.42 |
| YOLOv11m | This study | 200 | 0.811 | 0.455 | 20.03 |
| YOLOv11l | This study | 200 | 0.818 | 0.461 | 25.28 |
| YOLOv11x | This study | 200 | 0.836 | 0.475 | 56.83 |
However, the mAP50–95 results present a more nuanced picture. While YOLO26x achieves 0.506 mAP50–95, exceeding YOLOv11-x (0.468) by 3.8 percentage points and approaching the YOLOv9-e benchmark (0.487), it falls 1.9 percentage points short of the best published result. This pattern suggests that YOLO26 excels at confident, high-IoU detections (reflected in mAP50) but shows room for improvement in handling the stricter localization requirements captured by mAP50–95 metrics across the 0.50–0.95 IoU threshold range.
Notably, our YOLOv11-x results (0.836 mAP50, 0.475 mAP50–95) significantly exceed the published YOLOv11-x benchmarks (0.681 mAP50, 0.468 mAP50–95) by 15.5 and 0.7 percentage points respectively. This discrepancy likely stems from differences in training infrastructure, data augmentation strategies, or implementation details despite nominally identical hyperparameter configurations. The substantial improvement in our YOLOv11-x implementation provides additional validation that our experimental methodology and training pipeline are well-optimized, strengthening confidence in the YOLO26 results.
The performance progression across model scales reveals consistent patterns. For both YOLO26 and YOLOv11, accuracy improves monotonically with increasing model capacity, with the most dramatic gains occurring between nano and small variants. YOLO26m already surpasses the published YOLOv10-x benchmark (0.458 vs. 0.464 mAP50–95) despite utilizing only 20.35 M parameters compared to 29.5 M, demonstrating superior parameter efficiency. Similarly, YOLO26l (0.473 mAP50–95) approaches the published YOLOv11-x performance (0.468) with 24.75 M parameters versus 56.8 M, further evidencing architectural efficiency improvements.
The substantial performance gaps between our implementations and the original dataset paper warrant careful interpretation. Ahmad and Rahimi’s study utilized 100 epochs for initial YOLOv9/v10 benchmarks before conducting extended 200-epoch training for selected variants. Hardware differences (NVIDIA RTX A4000 in their study versus our experimental setup) and framework version variations (Ultralytics 8.3.69 versus our implementation) may contribute to observed discrepancies. Additionally, the original study reported training anomalies on SH17, particularly noting that all YOLOv11 variants converged to approximately 17.5 h regardless of model size, suggesting potential implementation-specific optimization issues that our training pipeline may have resolved.
Dataset characteristics significantly influence relative performance across architectures. SH17’s 17-class fine-grained categorization, substantially larger instance count (15,358 vs. 4029 for SHEL5K), and diverse industrial environments create a more demanding detection scenario than CHV or SHEL5K. The dataset includes challenging small objects (earmuffs, face-guards) alongside large ones (persons, safety-suits), objects with high inter-class similarity (helmet colors, face-mask vs. face-guard), and significant occlusion scenarios common in industrial settings. These characteristics explain the substantially lower absolute mAP values compared to simpler datasets while highlighting YOLO26’s effectiveness in complex real-world scenarios.
The comparison with published benchmarks provides valuable validation of our methodology while revealing important architectural insights. YOLO26’s superior mAP50 performance suggests enhanced confidence calibration and feature extraction at standard IoU thresholds, critical for practical deployment where detection confidence directly impacts system reliability. The smaller gap in mAP50–95 indicates opportunities for further architectural refinement in precise localization, potentially through enhanced bounding box regression modules or improved feature pyramid fusion strategies.
These findings position our work within the rapidly evolving landscape of real-time object detection for industrial safety applications. The substantial improvements over published baselines on this challenging dataset demonstrate that YOLO26 represents a meaningful advancement in the YOLO architecture lineage, particularly for complex multi-class detection scenarios requiring both high accuracy and robust performance across diverse object scales and categories.
3.11. Summary of Key Findings
The comprehensive evaluation across three diverse PPE detection datasets reveals several critical patterns governing the relative performance of YOLO26 and YOLOv11 architectures:
Scale-Dependent Performance: A consistent and monotonic relationship exists between model capacity and YOLO26’s relative advantage. Small models (nano/small) favor YOLOv11 across all datasets, while large models (large/X-Large) consistently favor YOLO26, with the crossover occurring at medium scale. This pattern suggests that YOLO26’s architectural enhancements require sufficient capacity to manifest benefits.
Dataset Size Sensitivity: YOLO26’s performance advantage exhibits a notable negative trend with dataset size (, ), declining from +0.66 percentage points on the 133-image CHV dataset to −0.70 points on the 1620-image SH17 dataset. Given the limited number of datasets, this should be treated as an exploratory observation rather than a statistically confirmed relationship, but the pattern suggests that YOLO26 architectural innovations may provide particular value in data-scarce regimes.
Computational Efficiency: YOLOv11 demonstrates consistent 15–18% advantages in both training time and inference speed across CHV and SHEL5K datasets. The dramatic training time reversal on SH17 (79% advantage for YOLO26) appears to be an implementation anomaly rather than an architectural property, evidenced by uniform YOLOv11 training times and normal inference behavior.
Peak Performance: YOLO26x achieves highest accuracy across all three datasets when examined at the X-Large scale, with advantages ranging from 1.3% to 3.1% over YOLOv11x. This consistent superiority at maximum capacity establishes YOLO26x as the preferred choice when accuracy is paramount and computational constraints are relaxed.
Deployment Trade-offs: No single architecture demonstrates universal superiority. Optimal selection requires careful consideration of dataset characteristics (size, complexity), deployment constraints (latency requirements, hardware limitations), and application priorities (accuracy vs. efficiency). YOLOv11 provides superior efficiency for real-time edge deployment, while YOLO26 offers accuracy advantages for cloud-based high-stakes applications with limited training data.
These findings provide empirical foundation for architecture selection strategies in practical PPE detection system deployment, while also revealing interesting research questions regarding the mechanisms underlying scale-dependent and data-dependent architectural performance patterns.
4. Discussion
This comprehensive evaluation of YOLO26 and YOLOv11 architectures across three diverse PPE detection datasets reveals several critical insights into the interplay between architectural design, model capacity, dataset characteristics, and deployment constraints. Our findings challenge the notion of universal architectural superiority and instead demonstrate that optimal model selection requires careful consideration of the specific operational context.
4.1. Mechanisms Underlying Scale-Dependent Performance
The consistent scale-dependent performance pattern observed across all three datasets—where YOLOv11 excels at nano/small scales while YOLO26 dominates at large/X-Large scales—suggests fundamental differences in how each architecture utilizes available parameters. At heavily constrained capacity levels (nano: ∼2.5 M parameters, small: ∼9.4 M parameters), YOLOv11’s architectural simplifications appear to provide advantages. The elimination of certain computational modules and streamlined feature extraction pathways may reduce overhead that becomes prohibitive when parameter budgets are severely limited.
In contrast, YOLO26’s architectural innovations—including the end-to-end design eliminating NMS, enhanced feature pyramid networks, and the MuSGD optimizer—impose additional computational and parametric costs that only yield net benefits when sufficient model capacity exists to fully exploit these mechanisms. The crossover point at medium scale (∼20 M parameters) represents the threshold where YOLO26’s more expressive architecture begins to compensate for its added complexity through superior feature representations.
This interpretation finds support in our parameter efficiency analysis, where YOLO26x achieves 2.1 percentage points higher average mAP50–95 (0.574 vs. 0.553) while using fewer parameters (55.64 M vs. 56.83 M) and slightly lower computational complexity (193.4 G vs. 194.4 G FLOPs). The superior mAP-per-parameter and mAP-per-GFLOP metrics at large scales indicate that YOLO26’s architectural enhancements enable more effective extraction of detection performance from each parameter and floating-point operation, albeit at the cost of increased training time and inference latency.
The progressive widening of YOLO26’s advantage with increasing scale—from near-parity at medium to substantial superiority at X-Large—suggests that certain architectural components exhibit superlinear benefits with capacity. Enhanced attention mechanisms, more sophisticated feature fusion strategies, or improved loss functions may require sufficient representational power throughout the network to manifest their full potential. When capacity is adequate, these mechanisms enable YOLO26 to capture more nuanced patterns in object appearance, localization, and context that translate to improved detection accuracy.
4.2. Dataset Size Effects and Generalization Regimes
The strong negative correlation () between dataset size and YOLO26’s performance advantage represents one of our most intriguing findings, with significant implications for practical deployment strategy. YOLO26 achieves a +0.66 percentage point advantage on the 133-image CHV dataset, perfect parity (0.00) on the 1000-image SHEL5K dataset, and a −0.70 percentage point disadvantage on the 1620-image SH17 dataset. While the statistical significance of this correlation is limited by the small number of datasets (), the consistency and magnitude of the relationship warrant serious consideration.
Several mechanisms may contribute to this pattern. First, YOLO26’s architectural enhancements may provide superior regularization in data-scarce regimes where overfitting risks are elevated. The end-to-end training approach, combined with the MuSGD optimizer’s momentum-based strategies inspired by large language model training, may enable more effective extraction of generalizable features from limited samples. Second, the removal of Distribution Focal Loss (DFL) modules and introduction of ProgLoss with Spatial-Temporal Attention Loss (STAL) may specifically benefit scenarios where precise localization must be learned from sparse training signal.
Conversely, as dataset size increases and provides richer training signal, the fundamental architectural differences between YOLO26 and YOLOv11 diminish in importance. Both architectures converge toward similar performance levels determined primarily by the quality and quantity of training data rather than architectural sophistication. This interpretation suggests that YOLO26’s innovations address limitations in learning from limited data—a valuable capability for specialized industrial applications where large-scale annotation is cost-prohibitive, but less critical when thousands of labeled examples are available.
The practical implications are clear: organizations with limited labeled training data (hundreds of images) should prioritize YOLO26 architecture, particularly at large scales, to maximize accuracy extraction from scarce samples. However, for applications where thousands of labeled examples can be economically obtained, architectural choice becomes less critical to final performance, and selection should instead prioritize deployment constraints such as inference speed, training efficiency, and hardware requirements.
It is important to note that our correlation analysis relies on only three datasets, and the relationship may not hold universally across all object detection domains. The consistent pattern observed across PPE detection scenarios with dramatically different characteristics (6-class small-scale vs. 17-class large-scale) provides initial evidence for generalizability, but validation across additional datasets spanning diverse application domains would strengthen confidence in this finding.
4.3. The SH17 Training Anomaly: Implementation vs. Architecture
The extreme training efficiency anomaly observed on the SH17 dataset—where YOLO26 trained 79.3% faster on average (3.603 h vs. 17.391 h) with all YOLOv11 variants converging to approximately 17.5 h regardless of model size—represents a critical finding that requires careful interpretation. Multiple lines of evidence indicate this anomaly reflects an implementation-specific issue rather than a fundamental architectural property, and we deliberately refrain from attributing it to architectural causes before alternative implementation explanations are ruled out.
Several implementation-level factors are plausible candidates for the anomaly. First, data loading bottlenecks associated with SH17’s substantially larger instance count (15,358 vs. 4029 for SHEL5K) and 17-class label complexity could cause I/O-bound training behavior that saturates data pipeline capacity regardless of model scale, masking differences in compute time. Second, mixed precision (AMP) interactions may behave differently across YOLOv11 and YOLO26 when processing datasets with high class counts, particularly where loss scaling dynamics differ. Third, batch size effects could interact with SH17’s instance density in ways that inflate per-epoch computation time uniformly across model scales for YOLOv11. Fourth, validation loop overhead from computing mAP across 17 classes and 15,358 instances may dominate epoch time in YOLOv11’s implementation path, causing the observed uniformity. These hypotheses were not ablated in the current study due to computational resource constraints.
The uniformity of YOLOv11 training times across all five model variants (ranging only from 17.07 to 17.72 h) is inconsistent with expected computational scaling. Training time should increase substantially from nano to X-Large variants due to the quadrupling of parameters and computational complexity. The convergence to approximately 17.5 h—corresponding closely to the time required to complete the full 200-epoch budget—strongly suggests failure of early stopping mechanisms or validation-related computational bottlenecks specific to YOLOv11’s interaction with SH17’s characteristics.
This pattern directly contradicts the consistent training efficiency advantages YOLOv11 demonstrated on CHV (19.8% faster) and SHEL5K (14.0% faster) datasets, where expected computational scaling was observed and early stopping functioned correctly. The dramatic reversal on a single dataset, despite using identical training protocols and hyperparameters, points to dataset-specific triggering conditions rather than architectural limitations.
The persistence of this anomaly in our experiments using Ultralytics 8.4.0+ framework, despite Rahimi [
42] reporting similar patterns with version 8.3.69, suggests the issue transcends specific framework versions. Inference speed metrics on SH17 exhibited normal behavior with YOLOv11 maintaining its expected 9.1% advantage (1.20 ms vs. 1.32 ms), indicating that runtime inference optimizations function correctly even as training behavior is affected. This dissociation between training and inference efficiency strongly implicates training-specific components—such as validation metric computation, early stopping evaluation, or data loading—rather than fundamental forward-pass inefficiencies. Definitive root cause identification would require controlled ablation experiments isolating each suspected factor, which we identify as a priority for future investigation.
4.4. Computational Efficiency Trade-Offs and Deployment Practices
The computational efficiency analysis reveals nuanced trade-offs that extend beyond simple “faster vs. slower” characterizations. When excluding the anomalous SH17 training behavior, YOLOv11 demonstrates consistent advantages in both training speed (15.7% faster average) and inference latency (16.7% faster average). These improvements manifest consistently across CHV and SHEL5K datasets at all model scales, indicating genuine architectural optimizations in YOLOv11’s design.
The inference speed advantages prove particularly valuable for deployment scenarios. YOLOv11’s 16–18% faster processing enables higher throughput on fixed hardware—for instance, YOLOv11m achieves 625 FPS on SHEL5K compared to YOLO26m’s 476 FPS at comparable accuracy (0.580 vs. 0.579 mAP50–95). This substantial speed advantage at near-parity accuracy positions YOLOv11m as an attractive choice for production deployments requiring balanced speed-accuracy trade-offs.
However, parameter efficiency analysis reveals YOLO26’s compensatory strengths. Averaged across all datasets and scales, YOLO26 achieves higher mAP50–95 per parameter (0.0237 vs. 0.0233) and per GFLOP (0.00714 vs. 0.00708), indicating more effective utilization of computational resources to achieve detection accuracy. This efficiency advantage manifests most clearly at the X-Large scale, where YOLO26x achieves 2.1 percentage points higher average mAP50–95 while using fewer parameters and slightly lower computational complexity.
These patterns suggest complementary optimization philosophies: YOLOv11 prioritizes computational efficiency and processing speed, achieving faster training and inference through streamlined operations and reduced overhead. YOLO26 prioritizes parameter efficiency and feature representation quality, extracting more detection performance from each parameter through sophisticated architectural mechanisms, albeit at the cost of increased computational requirements per operation.
The optimal choice depends critically on deployment priorities. For real-time edge applications where inference latency directly constrains system utility—such as safety monitoring on construction sites with limited computational resources—YOLOv11’s speed advantages prove decisive. For cloud-based offline analysis or high-stakes applications where detection accuracy is paramount and computational costs are amortized across large-scale deployments, YOLO26’s superior parameter efficiency and peak accuracy justify the inference latency penalty.
An often-overlooked consideration is training efficiency in iterative development workflows. The 15–20% training time advantage for YOLOv11 (excluding SH17 anomaly) translates to faster experimentation cycles during model development, hyperparameter tuning, and architecture search. For research teams or practitioners conducting extensive model development, this efficiency gain can substantially reduce time-to-deployment, even if final production models ultimately prioritize inference accuracy over training speed.
These findings directly inform real-world deployment practices: practitioners must balance accuracy requirements against computational constraints, training time budgets, and hardware availability. Our systematic evaluation across 30 configurations provides a decision framework for architecture selection based on specific deployment contexts, enabling evidence-based choices between YOLOv11’s computational efficiency and YOLO26’s parameter efficiency depending on operational priorities.
4.5. Cross-Dataset Generalization and Robustness
The examination of performance consistency across datasets provides insights into architectural robustness and generalization capabilities. YOLOv11 exhibits slightly lower performance variance across datasets when considering all model scales (CV = 14.3% vs. 15.4%), indicating somewhat more consistent behavior across diverse detection scenarios. However, this advantage reverses when examining only X-Large variants, where YOLO26x demonstrates lower variance (CV = 9.9% vs. 11.4%).
This pattern suggests that YOLO26’s consistency improves with model capacity, while YOLOv11 maintains more uniform behavior across scales. The implication is that YOLO26 benefits more dramatically from increased capacity to handle diverse dataset characteristics, while YOLOv11’s simpler architecture generalizes more reliably even at constrained scales. For deployment scenarios spanning multiple datasets or requiring robust performance across varying operational conditions, these robustness characteristics may influence architecture selection independent of peak accuracy considerations.
The substantial variation in absolute performance across datasets (mAP50–95 ranging from 0.306 to 0.619 for YOLO26) reflects dramatic differences in task difficulty. The SH17 dataset’s 17-class fine-grained detection problem with complex category distinctions (e.g., helmet colors, face-mask vs. face-guard) proves substantially more challenging than CHV’s 6-class or SHEL5K’s 3-class scenarios, despite SH17’s larger training set. This underscores that task complexity—class granularity, inter-class similarity, occlusion patterns, scale variation—serves as a performance determinant independent of dataset scale.
The consistent replication of scale-dependent patterns across all three datasets, despite their vastly different characteristics (133 to 1620 images, 6 to 17 classes, 790 to 15,358 instances), provides strong evidence that observed phenomena reflect fundamental architectural properties rather than dataset-specific artifacts. This consistency strengthens confidence in the generalizability of our findings to other PPE detection scenarios and potentially to object detection tasks more broadly, though validation across additional application domains would be valuable.
4.6. Comparison with Published Benchmarks
The comparison with published benchmarks on the SH17 dataset provides valuable external validation of our methodology while revealing important insights. Our YOLO26x results (0.852 mAP50, 0.506 mAP50–95) substantially exceed the published YOLOv11-x benchmark from the original dataset paper (0.681 mAP50, 0.468 mAP50–95), representing a 17.1 percentage point improvement in mAP50 and 3.8 percentage point improvement in mAP50–95.
Similarly, our YOLOv11-x implementation (0.836 mAP50, 0.475 mAP50–95) significantly outperforms the published baseline by 15.5 and 0.7 percentage points respectively. This consistent improvement across both architectures indicates that our training pipeline, hyperparameter configurations, and experimental methodology are well-optimized, lending credibility to the architectural comparisons and strengthening confidence in the YOLO26 results.
The performance gaps likely stem from multiple factors: hardware differences (NVIDIA A100-80 GB vs. RTX A4000), framework version variations (Ultralytics 8.4.0+ vs. 8.3.69), training protocol refinements, and data augmentation strategies. The substantial improvements demonstrate that implementation details, infrastructure quality, and training methodology can significantly impact final performance, sometimes exceeding the magnitude of architectural differences themselves. This underscores the importance of rigorous experimental control and standardized comparison protocols in architectural evaluation studies.
Notably, YOLO26m (0.813 mAP50, 0.458 mAP50–95) with only 20.35 M parameters approaches or exceeds several published benchmarks from larger models, including YOLOv10-x (29.5 M parameters) and YOLOv11-x (56.8 M parameters) in the original paper. This superior parameter efficiency reinforces our finding that YOLO26’s architectural innovations enable more effective utilization of model capacity, particularly valuable for deployment scenarios with hardware constraints or inference latency requirements.
4.7. Practical Deployment Guidance
Synthesizing findings across accuracy, efficiency, and robustness dimensions yields concrete deployment recommendations:
Scenario 1: Severe Latency-Constrained Edge Deployment
Recommendation: YOLOv11 nano or small variants
Rationale: 17–33% faster inference with modest accuracy penalties (0.9–2.5 pp on average). Enables real-time processing at high frame rates (1250–2500 FPS) on resource-constrained hardware.
Example: Construction site safety monitoring with battery-powered edge devices requiring sustained high-throughput detection.
Scenario 2: Balanced Production Deployment
Recommendation: YOLOv11 medium variant
Rationale: Near-parity accuracy with YOLO26m (average difference <0.3 pp) while maintaining 20–30% inference speed advantage. Attractive speed-accuracy trade-off for most production scenarios.
Example: Manufacturing facility safety compliance monitoring with moderate computational budgets and standard accuracy requirements.
Scenario 3: Accuracy-Critical Cloud Applications
Recommendation: YOLO26 large or X-Large variants
Rationale: Consistent 1.3–3.1 pp mAP50–95 advantages at large scales. Inference latency penalty (4–15%) acceptable when detection accuracy is paramount and computational costs are amortized.
Example: Offline safety audit analysis, high-stakes industrial inspection, or legal compliance documentation requiring maximum detection precision.
Scenario 4: Data-Scarce Specialized Applications
Recommendation: YOLO26 architecture across all scales
Rationale: Superior performance in data-scarce regimes (correlation ). Architectural enhancements provide particular value when limited training samples constrain performance.
Example: Specialized industrial applications with unique PPE categories where large-scale annotation is cost-prohibitive (e.g., nuclear facility protective equipment, specialized chemical handling gear).
Scenario 5: Rapid Development and Experimentation
Recommendation: YOLOv11 across scales for initial development, YOLO26 for final production if accuracy gains justify training cost
Rationale: 15–20% faster training enables more rapid experimentation cycles during hyperparameter tuning, architecture search, and model development. Transition to YOLO26 for final production deployment if accuracy improvements warrant the training efficiency penalty.
Example: Research teams or practitioners conducting extensive model development before final deployment.
These recommendations assume typical deployment contexts. Specific applications may exhibit different trade-off priorities that modify optimal architecture selection. The key insight is that no single architecture achieves universal superiority—optimal choice depends critically on the specific operational context, deployment constraints, and application priorities.
4.8. Limitations and Threats to Validity
Several limitations constrain the scope and generalizability of our findings. First, all experiments employed single-run training protocols with a fixed random seed. This means that no variance estimates are available for the reported performance metrics. Given that observed architectural differences are often in the range of 0.5–2.0 mAP50–95 percentage points, stochastic variability introduced by random weight initialization and data shuffling could potentially account for a portion of the observed differences. Multiple runs with different random seeds would provide confidence intervals and strengthen claims about the reliability of scale-dependent trends. While computational resource constraints precluded full multi-seed evaluation across all 30 configurations in this study, future work should prioritize variance estimation—particularly for configurations at scale boundaries (nano and X-Large) where architectural differences are most pronounced. The deterministic training configuration and the consistent replication of patterns across three diverse datasets provide some confidence that genuine architectural properties are being measured, but readers should interpret magnitude differences cautiously in light of this limitation.
Second, the correlation between dataset size and YOLO26 advantage () relies on three datasets (), which limits statistical power despite the striking strength of the observed linear relationship. While the consistency of the pattern across datasets with vastly different characteristics (133 to 1620 images, 6 to 17 classes) provides initial evidence for generalizability, validation across additional datasets spanning a broader range of scales would substantially strengthen confidence in this finding. The correlation should be interpreted as a preliminary observation warranting further investigation rather than a definitive established relationship.
Third, our evaluation focuses exclusively on PPE detection scenarios within industrial and construction safety monitoring contexts. While the three datasets exhibit substantial diversity in scale, class distributions, and visual complexity, they share common characteristics inherent to safety equipment detection: relatively structured environments, human-centric scenes, and objects with consistent appearance across instances. Generalization to other object detection domains—such as autonomous driving, medical imaging, or natural scene understanding—remains uncertain and requires empirical validation. Additionally, the CHV dataset (133 images) is small by contemporary deep learning standards and is best understood as a proxy for data-scarce specialized deployment scenarios rather than a representative benchmark for large-scale industrial operations. While SH17 (1620 images, 15,358 instances, 17 classes) represents one of the largest publicly available PPE detection benchmarks and captures genuine real-world complexity in manufacturing environments, it covers a single operational domain; cross-domain generalization—for example, to petrochemical facilities, mining sites, or offshore platforms—remains to be validated. Including additional large-scale benchmarks across diverse industrial domains in future work would substantially strengthen the generalizability of the deployment recommendations presented here.
Fourth, the SH17 training anomaly, while identified and characterized as an implementation-specific issue, remains unexplained at a mechanistic level. We provide substantial evidence that the phenomenon reflects optimization bottlenecks in YOLOv11’s training pipeline rather than a fundamental architectural limitation, as inference speeds remain unaffected. This documentation serves as a valuable practical finding for the object detection community, alerting practitioners to potential computational challenges in large-scale multi-class scenarios. However, the undiagnosed root cause limits our ability to predict whether similar anomalies might manifest on other datasets or under different training configurations.
Fifth, all latency and throughput benchmarks in this study were collected exclusively on NVIDIA A100 (80 GB) data center GPUs. PPE detection systems are frequently deployed on edge or embedded hardware—such as NVIDIA Jetson Nano, Jetson Orin, Raspberry Pi with Coral accelerators, or industrial embedded vision systems—where memory bandwidth, power envelopes, and hardware-specific acceleration capabilities differ substantially from data center conditions. Inference speed rankings established on A100 hardware may not hold on edge devices, particularly for architectures optimized for different computational patterns. Our analysis therefore does not examine other potentially important deployment considerations such as model export compatibility, quantization behavior, or performance on specialized hardware accelerators (e.g., edge TPUs, mobile GPUs). These practical deployment factors may significantly influence real-world architecture selection independent of the accuracy-efficiency trade-offs measured in our study. Future work should conduct comparative benchmarking on representative edge devices to validate the deployment guidelines proposed here.
Sixth, the rapid pace of YOLO architecture evolution means that findings may exhibit limited temporal validity. YOLO26 was released only weeks before our evaluation (January 2026), and subsequent framework updates, bug fixes, or architectural refinements may modify relative performance characteristics. The SH17 training anomaly, in particular, may be resolved in future Ultralytics framework versions, altering the computational efficiency landscape.
Finally, our evaluation employs COCO-pretrained weights and transfer learning for all models, reflecting standard practice in applied object detection. The extent to which findings generalize to training-from-scratch scenarios or alternative pretraining strategies remains unexplored. Different initialization strategies may modify relative architectural advantages, particularly in data-scarce regimes where effective knowledge transfer becomes critical.
Despite these limitations, our comprehensive evaluation across multiple datasets, rigorous experimental controls, and systematic exploration of multiple performance dimensions provides valuable insights into YOLO26 and YOLOv11 architectural characteristics that should inform practical deployment decisions and computational practices in real-world object detection applications, while guiding future research directions.
4.9. Future Research Directions
Several promising avenues for future investigation emerge from our findings. First, expanding the dataset diversity to include additional scales, domains, and task characteristics would enable more robust validation of the negative correlation between dataset size and YOLO26 advantage. A systematic study spanning 10–15 datasets across multiple domains (medical imaging, autonomous driving, agricultural monitoring) with carefully varied sizes would provide statistical power to definitively establish or refute this relationship.
Second, multi-seed training protocols with statistical significance testing would quantify the uncertainty in performance differences and distinguish genuine architectural advantages from initialization-dependent variations. While computationally expensive, such protocols are essential for drawing definitive conclusions about modest performance differences (e.g., the 0.3–0.7 percentage point gaps observed at medium scales).
Third, mechanistic investigation of the SH17 training anomaly through systematic ablation studies, profiling analysis, and framework instrumentation would identify the specific components in YOLOv11’s training pipeline responsible for the uniform training times. Understanding the root cause would enable targeted fixes and potentially reveal general principles for avoiding similar anomalies in future architecture development.
Fourth, ablation studies isolating the contributions of specific YOLO26 architectural components—the end-to-end NMS-free design, MuSGD optimizer, ProgLoss/STAL loss functions, DFL removal—would disentangle which innovations drive performance advantages versus which impose overhead without commensurate benefits. Such analysis could inform future architecture designs by identifying the highest-value enhancements.
Fifth, cross-domain generalization studies evaluating whether scale-dependent patterns and dataset size correlations extend beyond PPE detection to other application domains would establish the breadth of applicability of our findings. Replicating the evaluation protocol across autonomous driving (KITTI, nuScenes), medical imaging (chest X-ray detection, cell detection), and natural scenes (COCO, OpenImages) would reveal domain-specific versus universal architectural characteristics.
Sixth, investigation of deployment-specific factors such as quantization robustness, edge accelerator compatibility, model export behavior, and performance on specialized hardware (edge TPUs, mobile GPUs, embedded FPGAs) would provide a more complete picture of practical deployment trade-offs beyond the accuracy-efficiency dimensions examined in our study.
Seventh, temporal analysis tracking how architectural advantages evolve across framework versions would quantify the stability of findings and identify whether observed patterns reflect fundamental architectural properties or transient implementation details subject to optimization in future releases.
Finally, extension to related tasks such as instance segmentation, pose estimation, and tracking would reveal whether YOLO26’s architectural innovations provide benefits beyond standard object detection or whether advantages are task-specific. The end-to-end design and enhanced feature representations may prove particularly valuable for tasks requiring precise localization or temporal consistency.
5. Conclusions
This study presents a systematic benchmarking and comparative evaluation of YOLO26 and YOLOv11 architectures for personal protective equipment detection—contributing deployment-oriented guidelines rather than a new architectural proposal. By examining 30 model configurations across three diverse datasets under rigorously controlled experimental conditions, we provide conditional, context-sensitive recommendations for practitioners selecting between these architectures based on their specific data availability, model scale, and operational constraints. Our findings reveal that no single architecture achieves universal superiority; optimal selection depends critically on deployment context.
The most striking finding is a consistent scale-dependent performance pattern where YOLOv11 excels at nano and small scales across all datasets, while YOLO26 achieves superiority at large and X-Large scales with advantages ranging from 1.3% to 3.1% mAP50–95. This pattern, replicated across three diverse datasets with vastly different characteristics (133 to 1620 images, 6 to 17 classes, 790 to 15,358 instances), indicates fundamental architectural properties rather than dataset-specific artifacts. The crossover at medium scale (∼20 M parameters) represents the capacity threshold where YOLO26’s more sophisticated architectural enhancements begin to compensate for their added complexity through superior feature representations.
We report an exploratory negative correlation (, ) between dataset size and YOLO26’s performance advantage, suggesting that architectural innovations may provide particular value in data-scarce regimes where effective regularization and feature extraction from limited samples become critical. YOLO26 achieves a +0.66 percentage point advantage on the 133-image CHV dataset but a −0.70 percentage point disadvantage on the 1620-image SH17 dataset, with perfect parity at the intermediate 1000-image SHEL5K dataset. Given the small number of datasets, this observation should be treated as a preliminary hypothesis requiring validation rather than a statistically established relationship; nonetheless, the pattern is consistent and practically meaningful for deployment planning in specialized industrial applications where large-scale annotation is cost-prohibitive.
Computational efficiency analysis reveals nuanced trade-offs extending beyond simple speed comparisons. YOLOv11 demonstrates 15–20% faster training and 9–18% faster inference on average (excluding the anomalous SH17 training behavior), enabling higher throughput on fixed hardware and faster experimentation cycles during model development. However, YOLO26 achieves superior parameter efficiency, extracting more detection performance per parameter and per GFLOP, particularly at large scales where YOLO26x achieves 2.1 percentage points higher average mAP50–95 (0.574 vs. 0.553) while using fewer parameters (55.64 M vs. 56.83 M).
We document and characterize a significant training efficiency anomaly on the SH17 dataset where YOLOv11 exhibits uniform training times (approximately 17.5 h) regardless of model scale, while YOLO26 demonstrates expected computational scaling. Multiple lines of evidence—including the uniformity across model scales, contradiction with CHV/SHEL5K patterns, persistence across framework versions, and normal inference behavior—indicate this reflects an implementation-specific issue rather than a fundamental architectural limitation. This finding, consistent with previous observations by Rahimi [
42], highlights the importance of comprehensive evaluation across diverse datasets to distinguish genuine architectural properties from implementation artifacts.
The practical implications are structured as conditional recommendations rather than absolute rankings. For latency-constrained edge deployments (e.g., battery-powered construction site cameras), YOLOv11 nano/small variants are preferred given 17–33% inference speed advantages—though practitioners should validate absolute latency values on their target edge hardware, as all measurements in this study were obtained on an NVIDIA A100 data center GPU. For production deployments with moderate computational budgets, YOLOv11 medium variants offer attractive balanced trade-offs. For accuracy-critical cloud-based applications where detection precision is paramount, computational costs can be amortized, or training data is limited, YOLO26 large/X-Large variants are the preferred choice with 1.3–3.1 percentage point mAP50–95 advantages.
Beyond immediate practical guidance, our findings raise interesting theoretical questions about the mechanisms underlying scale-dependent and data-dependent architectural performance. The progressive widening of YOLO26’s advantage with increasing capacity suggests that certain architectural components exhibit superlinear benefits with scale, potentially through enhanced attention mechanisms, sophisticated feature fusion strategies, or improved loss functions that require sufficient representational power to manifest fully. The negative correlation with dataset size suggests that YOLO26’s innovations may address fundamental limitations in learning from limited data—a valuable capability whose importance diminishes as dataset scale provides richer training signal.
This work represents one of the first comprehensive empirical evaluations of YOLO26 since its January 2026 release, providing evidence-based guidance for practitioners while establishing baseline performance characteristics for future comparative studies. The scale-dependent patterns, dataset size correlations, and computational efficiency trade-offs identified here should inform not only immediate deployment decisions but also future architectural development efforts seeking to optimize performance across the full spectrum of operational contexts.
As the YOLO architecture family continues its rapid evolution, maintaining rigorous empirical evaluation across diverse datasets, systematic exploration of multiple performance dimensions, and careful distinction between fundamental architectural properties and transient implementation artifacts will remain essential for providing actionable guidance to practitioners and advancing the theoretical understanding of what makes object detection architectures effective across varying deployment contexts and data regimes.