Article

Design of an Intelligent Inspection System for Power Equipment Based on Multi-Technology Integration


1
School of Electronic Information and Electrical Engineering, Chengdu University, Chengdu 610106, China
2
China Coal Technology & Engineering Group Chongqing Research Institute Co., Ltd., Chongqing 401332, China
3
School of Information and Software Engineering, University of Electronic Science and Technology of China, Chengdu 610056, China
*
Authors to whom correspondence should be addressed.
Electronics 2026, 15(4), 827; https://doi.org/10.3390/electronics15040827
Submission received: 9 January 2026 / Revised: 9 February 2026 / Accepted: 10 February 2026 / Published: 14 February 2026

Abstract

With the continuous advancement of the “dual-carbon” strategy, the penetration of renewable energy sources such as wind and photovoltaic (PV) power has steadily increased, imposing more stringent requirements on the safe and stable operation of modern power systems. As the core components of these systems, critical electrical devices operate under harsh conditions characterized by high voltage, strong electromagnetic interference (EMI), and confined high-temperature environments. Their operating status directly affects the reliability of the power supply, and any fault may trigger cascading failures, resulting in significant economic losses. To address the issues of low inspection efficiency, limited fault-identification accuracy, and unstable data transmission in strong-EMI environments, this study proposes an intelligent inspection system for power equipment based on multi-technology integration. The system incorporates a redundant dual-mode wireless transmission architecture combining Wireless Fidelity (Wi-Fi) and Fourth Generation (4G) cellular communication, ensuring reliable data transfer through adaptive link switching and anti-interference optimization. A You Only Look Once version 8 (YOLOv8) object-detection algorithm integrated with Open Source Computer Vision (OpenCV) techniques enables precise visual fault identification. Furthermore, a multi-source data-fusion strategy enhances diagnostic accuracy, while a dedicated monitoring scheme is developed for the water-cooling subsystem to simultaneously assess cooling performance and fault conditions. Experimental validation demonstrates that the proposed system achieves a fault-diagnosis accuracy exceeding 95.5%, effectively meeting the requirements of intelligent inspection in modern power systems and providing robust technical support for the operation and maintenance of critical electrical equipment.

1. Introduction

With the continuous advancement of the “dual-carbon” strategy, the proportion of renewable energy sources such as wind and photovoltaic power in the power grid has been steadily increasing, gradually reshaping the traditional energy structure dominated by synchronous generators [1]. Although this transition effectively reduces total carbon emissions, it also results in a significant decline in system inertia. Consequently, the amplitude of frequency and voltage fluctuations increases, imposing unprecedented challenges on the safe and stable operation of modern power systems [2].
Key electrical equipment—such as transformers, reactors, high-voltage switches, and cooling systems—serves as the fundamental support of next-generation power grids. These devices are responsible for the critical functions of energy conversion, transmission, and regulation. Their operational stability forms the foundation for ensuring a reliable power supply in systems with a high penetration of renewable energy [3].
However, such equipment typically operates under demanding conditions, including high voltage, strong EMI, and high temperature within enclosed environments. Components are continuously subjected to intense transient current and voltage shocks as well as repeated electro-thermal stress cycles, making them prone to frequent faults [4]. Common failure modes include local overheating caused by loose electrical connections or insufficient heat dissipation, which may lead to thermal runaway or even device burnout; mechanical vibration–induced loosening of bolts leading to friction or discharge noise; and water-cooling system leakage due to pipeline blockage or seal degradation, which can trigger short circuits or reduce insulation performance [5]. Once such critical equipment fails, it not only causes considerable economic losses but may also compromise grid stability by inducing power deficits or voltage collapse, thereby posing severe risks to regional power-system security [6].
Traditional inspection in power systems is mainly performed manually. Operation and maintenance personnel are required to periodically enter high-EMI environments, which involves high labor intensity, low inspection efficiency, and heavy dependence on the operator’s expertise and field visibility, making early hidden faults difficult to detect [7]. Although fixed-point monitoring systems can provide real-time surveillance in specific areas, they often suffer from complex wiring, poor scalability, and detection blind zones, limiting their ability to achieve full-coverage and dynamic inspection of critical equipment [8]. As the construction of smart grids accelerates, there is a growing demand for high-precision, high-efficiency, and high-reliability inspection solutions. Developing intelligent inspection systems capable of adapting to the complex operational conditions of power systems has therefore become an urgent requirement to ensure their safe and stable operation [9].

2. Related Research

Power grid inspection has become a central topic in ensuring the safe and stable operation of modern power systems. In recent years, it has drawn extensive research attention worldwide, with scholars achieving meaningful progress in intelligent inspection equipment, system architecture design, wireless communication enhancement, and visual recognition algorithm optimization [10]. These advances have laid a solid foundation for the evolution of intelligent inspection technologies. As digital transformation continues to advance, research in this field is shifting toward deep integration and refined optimization, where improvements in detection models and the intelligent convergence of wireless communication technologies are driving a new stage of automation and precision in grid inspection.
In terms of system design and intelligent inspection equipment, diverse intelligent inspection platforms have been developed by integrating big data analysis and artificial intelligence (AI), significantly improving the automation and efficiency of inspection tasks. Leveraging technological maturity, equipment such as unmanned aerial vehicles (UAVs) and rail-mounted inspection robots has been widely deployed in power grids, enabling automatic fault detection and diagnosis for transmission lines and outdoor substations [11]. For example, several industrial UAV systems integrate high-precision sensing modules with advanced computer vision algorithms, allowing large-scale inspection of transmission corridors and outdoor substations with high efficiency [12]. However, these systems are primarily optimized for outdoor use, and their engineering feasibility decreases sharply in indoor high-voltage converter halls where electromagnetic interference is strong. As demonstrated by Al-Jarrah et al. [13], UAV-based localization heavily depends on the Global Navigation Satellite System (GNSS), the signals of which are easily blocked indoors. Moreover, metallic housings and narrow spaces induce severe multipath effects, while power equipment often emits interference within specific frequency bands. These factors necessitate complex visual-inertial fusion positioning schemes, substantially increasing deployment complexity and operational cost.
To improve the comprehensiveness and coordination of power grid inspection, various integrated inspection frameworks have been proposed. Yao Lei introduced a “three-dimensional inspection + centralized monitoring” model that enhances the overall coverage of transmission line maintenance [14], while Tan Bin developed an integrated inspection system for both transmission and distribution networks, improving system scalability and cooperative operation [15]. These frameworks have provided foundational methodologies for establishing coordinated and adaptable inspection systems suited to diverse electrical environments.
Research in wireless transmission technology has also progressed rapidly, evolving from traditional wireless solutions toward smart 5G-enabled communication systems, with the goal of achieving stable, high-efficiency data transmission in complex electromagnetic environments. Wireless Sensor Networks (WSNs) have matured in industrial monitoring applications [16], allowing wireless acquisition and transmission of multi-type sensing data. Nonetheless, WSN adaptability studies targeting high-EMI, confined, and thermally stressful power system environments remain limited, restricting their effectiveness in critical indoor monitoring applications. Researchers have accordingly explored tailored solutions: Xu Xiangyang et al. developed a ZigBee-based temperature monitoring system for distribution networks, which enables low-power, highly reliable data transfer for key nodes [17]; Liu Pengfei et al. designed an operation fault maintenance system for substations by integrating Wireless Fidelity (Wi-Fi) and wireless Mesh networks, successfully enhancing communication stability under strong electromagnetic conditions [18].
Driven by the rise in Fifth Generation (5G) mobile communication, power grid inspection has entered a new phase of intelligent connectivity and real-time data analytics. Gan et al. applied 5G technology in a 750 kV substation, constructing a remote intelligent inspection system that significantly expanded monitoring coverage and detection efficiency [19]. Zhao et al. further proposed a 5G-based digital-twin substation framework, utilizing the low latency and high bandwidth of 5G networks to achieve real-time mapping of equipment status, which markedly enhanced operational visibility and maintenance responsiveness [20]. These technological innovations collectively demonstrate the industry’s transition toward data-driven, resilient, and adaptive inspection systems, laying the groundwork for the intelligent transformation of modern power grids.
In the field of image recognition and detection model optimization, ongoing research has focused on improving algorithms to meet the specific requirements of fault detection in power system inspection. From the scene-specific adaptation of the classical You Only Look Once (YOLO) series to the specialized refinement of Transformer-based architectures, both algorithmic paradigms have achieved remarkable progress and demonstrated distinct advantages in practical applications.
For the YOLO-based models, numerous studies have tailored the architecture to the unique visual characteristics of power equipment. Cai Dahe developed an improved YOLOv8n model capable of high-precision detection of foreign objects on transmission lines [21]. Sun Yetong, addressing the challenge of thermal fault detection in substation electrical equipment, optimized the feature extraction module of the YOLOv8s model, significantly enhancing the recognition accuracy of heat-related fault regions [22]. These results confirm the effectiveness and adaptability of the YOLO framework for power grid inspection scenarios, especially in detecting small-scale and visually subtle faults.
At the same time, Transformer-based detection models have become another research hotspot. Studies in this area have introduced targeted architectural enhancements to overcome the limitations of conventional convolutional approaches. Cheng et al. proposed the AdIn-DETR model [23], which integrates Gaussian-saliency-guided adapters and a refractive decoder adapter for feature modulation. This model achieved an Average Precision at IoU 50 (AP50) of 96.1% and an inference speed of 71 frames per second (FPS) in insulator defect detection, demonstrating exceptional performance. Wang et al. designed an IF-DETR model [24] featuring a multi-scale backbone and fused-attention module to strengthen the extraction of fine defect features, achieving a 2.3% improvement in AP compared with existing methods. Furthermore, Xie et al. developed Power-DETR [25], introducing contrastive denoising training and a hybrid label assignment strategy to address challenges such as small-sized and occluded targets in power line defect detection. Their model achieved a 15.7% improvement in mean Average Precision at IoU 50 (mAP50) over the baseline.
Although existing studies have provided valuable technical insights for intelligent inspection, several critical challenges remain unresolved for power systems operating under harsh electromagnetic and environmental conditions.
(1)
Limited adaptability of wireless transmission: Most current wireless transmission schemes rely on a single communication technology, which is highly susceptible to signal interruption and packet loss in strong electromagnetic interference environments. This limitation makes it difficult to ensure stable transmission of large-volume inspection data such as high-resolution images and videos [26]. Additionally, many systems fail to adequately consider the impact of indoor electromagnetic complexity, lacking redundant backup links and targeted anti-interference mechanisms. As highlighted by Adday et al. [27], traditional Wireless Sensor Networks (WSNs) exhibit three major deficiencies under stringent power system conditions: (i) existing fault-tolerance mechanisms are not designed to address the coupled effects of hard and soft node failures caused by electromagnetic interference, leading to low detection and recovery accuracy; (ii) network structures often lack deployment and self-healing algorithms optimized for confined and enclosed spaces, resulting in poor topological stability; and (iii) performance optimization has rarely been tailored to the specific operating conditions of electrical substations, making it difficult to guarantee the long-term reliability of inspection systems.
(2)
Insufficient task-specific optimization in image recognition: The existing You Only Look Once (YOLO) series of object detection algorithms have been primarily optimized for overhead transmission lines and outdoor substation equipment. Their detection accuracy for small-scale or subtle defects—such as minor pipeline leaks or loose screws—remains inadequate. Moreover, few models have been explicitly enhanced to handle the image noise and degradation caused by strong electromagnetic interference in indoor power system environments.
(3)
Inadequate multi-source data fusion: Many current inspection systems depend on a single type of sensor data for fault diagnosis, leading to perceptual blind spots and a higher probability of false alarms or missed detections. Some existing data fusion algorithms do not fully account for the spatial-temporal inconsistencies and data conflicts among heterogeneous sensor streams, thereby limiting diagnostic accuracy and overall system reliability [3].
In view of these limitations and technical bottlenecks, the present study aims to develop an intelligent inspection framework for power systems capable of full-scenario perception and high reliability. The core innovations of the proposed work are threefold:
(1)
A Wi-Fi/Fourth Generation (4G) dual-mode redundant wireless transmission architecture, enabling adaptive link switching and multi-layer anti-interference mechanisms to ensure reliable communication in high electromagnetic interference environments such as converter halls.
(2)
A vision-based inspection system utilizing YOLOv8 and Open Source Computer Vision (OpenCV), coupled with an image denoising and enhancement preprocessing pipeline, to achieve accurate detection of both visible and fine-grained faults in electrical equipment.
(3)
A hierarchical weighted multi-source data fusion algorithm, integrating heterogeneous sensing modalities—including visible light, infrared thermal imaging, and acoustic emission (acoustic signature) data—to resolve inter-sensor conflicts and enhance the precision of fault diagnosis.

3. System Architecture Design

3.1. Architecture Overview

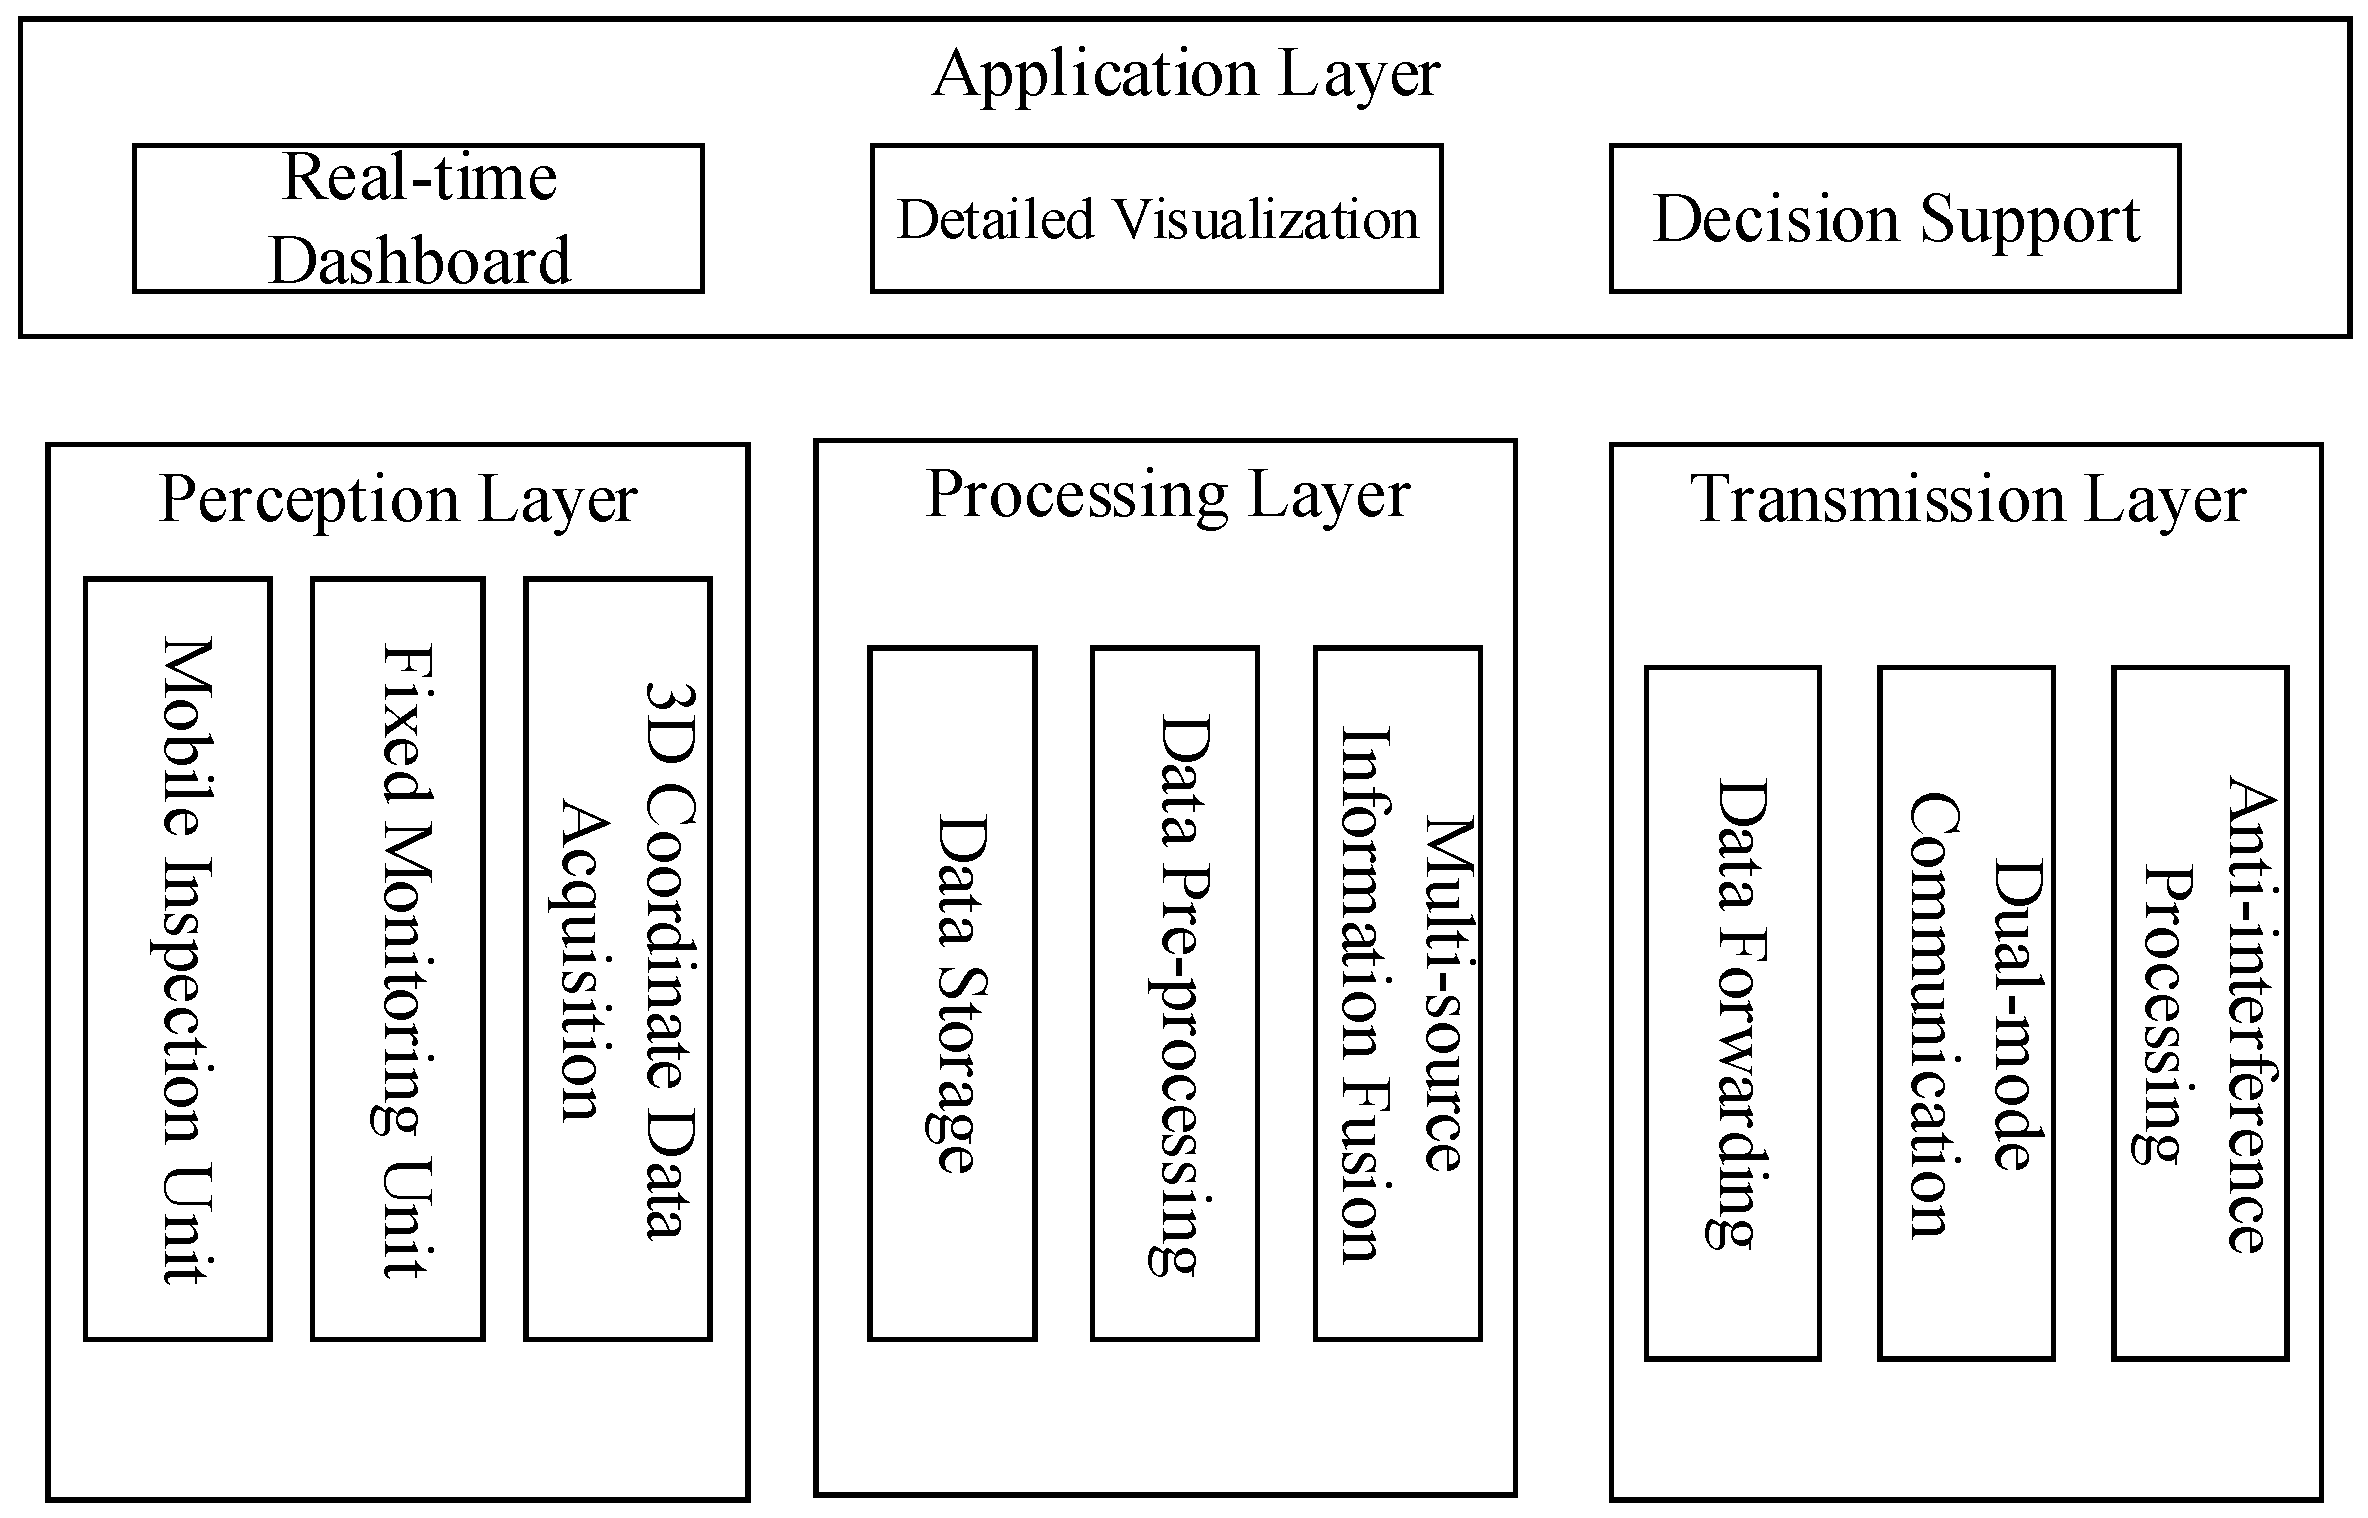
The proposed system adopts a four-layer architecture consisting of the perception layer, transmission layer, processing layer, and application layer. It integrates fixed-point monitoring and mobile inspection in a collaborative mode, following the core design principle of “lightweight edge processing and cloud-based intelligent decision-making.” The four layers work together seamlessly to enable comprehensive processes of data acquisition, transmission, analysis, and application, as illustrated in Figure 1.
(1)
Perception Layer:
This layer includes two functional units: the mobile inspection unit and the fixed monitoring unit.
The mobile inspection unit consists of an inspection vehicle equipped with an OV5640 industrial camera(Manufatured in Guangdong Tianqian Embedded Technology Co., Ltd., Guangzhou, China) and an MG996 servo gimbal(Manufactured in Guangdong Desheng Intelligent Technology Co., Ltd., Guangzhou, China) to capture high-resolution visual data of power equipment along predefined inspection routes.
The fixed monitoring unit is deployed in key areas of the power system and integrates infrared thermal imagers and acoustic sensors to continuously collect temperature profiles, visual images, and sound patterns of critical components.
All sensing devices are equipped with three-dimensional coordinate modules to record spatial positioning data in real time, ensuring precise spatial alignment among multi-source observations.
(2)
Transmission Layer:
This layer employs a dual-mode wireless communication architecture, using Wi-Fi as the primary channel and 4G mobile communication as backup. It supports data forwarding, encryption, and anti-interference processing to ensure stable and reliable transmission of heterogeneous inspection data under strong EMI conditions.
(3)
Processing Layer:
Serving as the intelligent core of the system, this layer implements a collaborative edge—cloud computing framework to balance processing efficiency and analytical performance.
Edge computing nodes are deployed on-site to perform lightweight preprocessing and secure communication tasks. Their functions include real-time encapsulation, compression, encryption, and preliminary filtering of multi-source sensor data, as well as adaptive management of dual-mode network switching (Wi-Fi/4G) and fault-tolerant data transmission.
Cloud servers receive the processed data from edge nodes and carry out computation-intensive analytics, including training and inference of the YOLOv8 visual defect detection model and the deep fusion of multi-source data (infrared, visual, and acoustic) for advanced fault diagnosis.
(4)
Application Layer:
At the top of the architecture, the application layer provides an integrated supervisory and decision-support platform for operation and maintenance personnel. This platform enables real-time data visualization, automated fault alarms, analytical report generation, and maintenance task scheduling, thereby forming a closed-loop intelligent inspection and management system.

3.2. Hardware Selection and Deployment

3.2.1. Visual Monitoring Subsystem

The visual monitoring subsystem is designed around the concept of “high-definition imaging combined with precise angular adjustment.” It consists primarily of an OV5640 industrial-grade camera and an MG996 servo-driven gimbal, which together provide wide-coverage visual sensing of critical equipment and the surrounding environment in power-system facilities. This subsystem supplies high-resolution, spatially referenced image data for equipment-surface defect identification and environmental anomaly detection.
(1)
Core Hardware Configuration
Camera: The OV5640 industrial-grade high-definition camera, with a 5-megapixel resolution, supports 1080p (1920 × 1080) video capture at 30 frames per second (fps). It features automatic exposure and white-balance adjustment, enabling stable imaging under the complex lighting conditions of the valve hall. This setup allows clear detection of fine-grained defects such as loose screws, cracks, corrosion, or dust accumulation. A fixed-focus 3.4 mm lens (f/2.8, 70° field of view) is adopted to balance image detail and observation distance, ensuring clear feature recognition within a range of 5–8 m. To mitigate EMI, the lens is enclosed in a 0.8 mm-thick brass shielding housing, with grounding resistance maintained below 4 Ω.
Servo Gimbal: The MG996 high-precision servo gimbal, controlled by an STM32F407 microcontroller(Manufactured by STMicroelectronics in Plan-les-Ouates, Switzerland), allows angular rotation from 0° to 270°. It supports both automatic scanning along predefined trajectories and precise positioning commands from the host computer. With a response time below 100 ms, the gimbal works in coordination with the mobile inspection vehicle to achieve full visual coverage of valve-hall equipment without blind zones. The gimbal is further mounted on an anti-vibration bracket to reduce image instability caused by operational vibrations.
(2)
Auxiliary Modules
An industrial-grade infrared thermal imager is installed to operate synchronously with the visible-light camera. The instrument covers a temperature range of −20 °C to 300 °C with a ±2 °C accuracy. It is mounted via an EMI-shielded metallic bracket positioned 0.5–1 m in front of critical heat-emitting components, minimizing interference from electromagnetic radiation or mechanical shock. This configuration enables acquisition of surface-temperature distributions and hotspot locations, supporting precise thermal-fault analysis.

3.2.2. Deployment Strategy

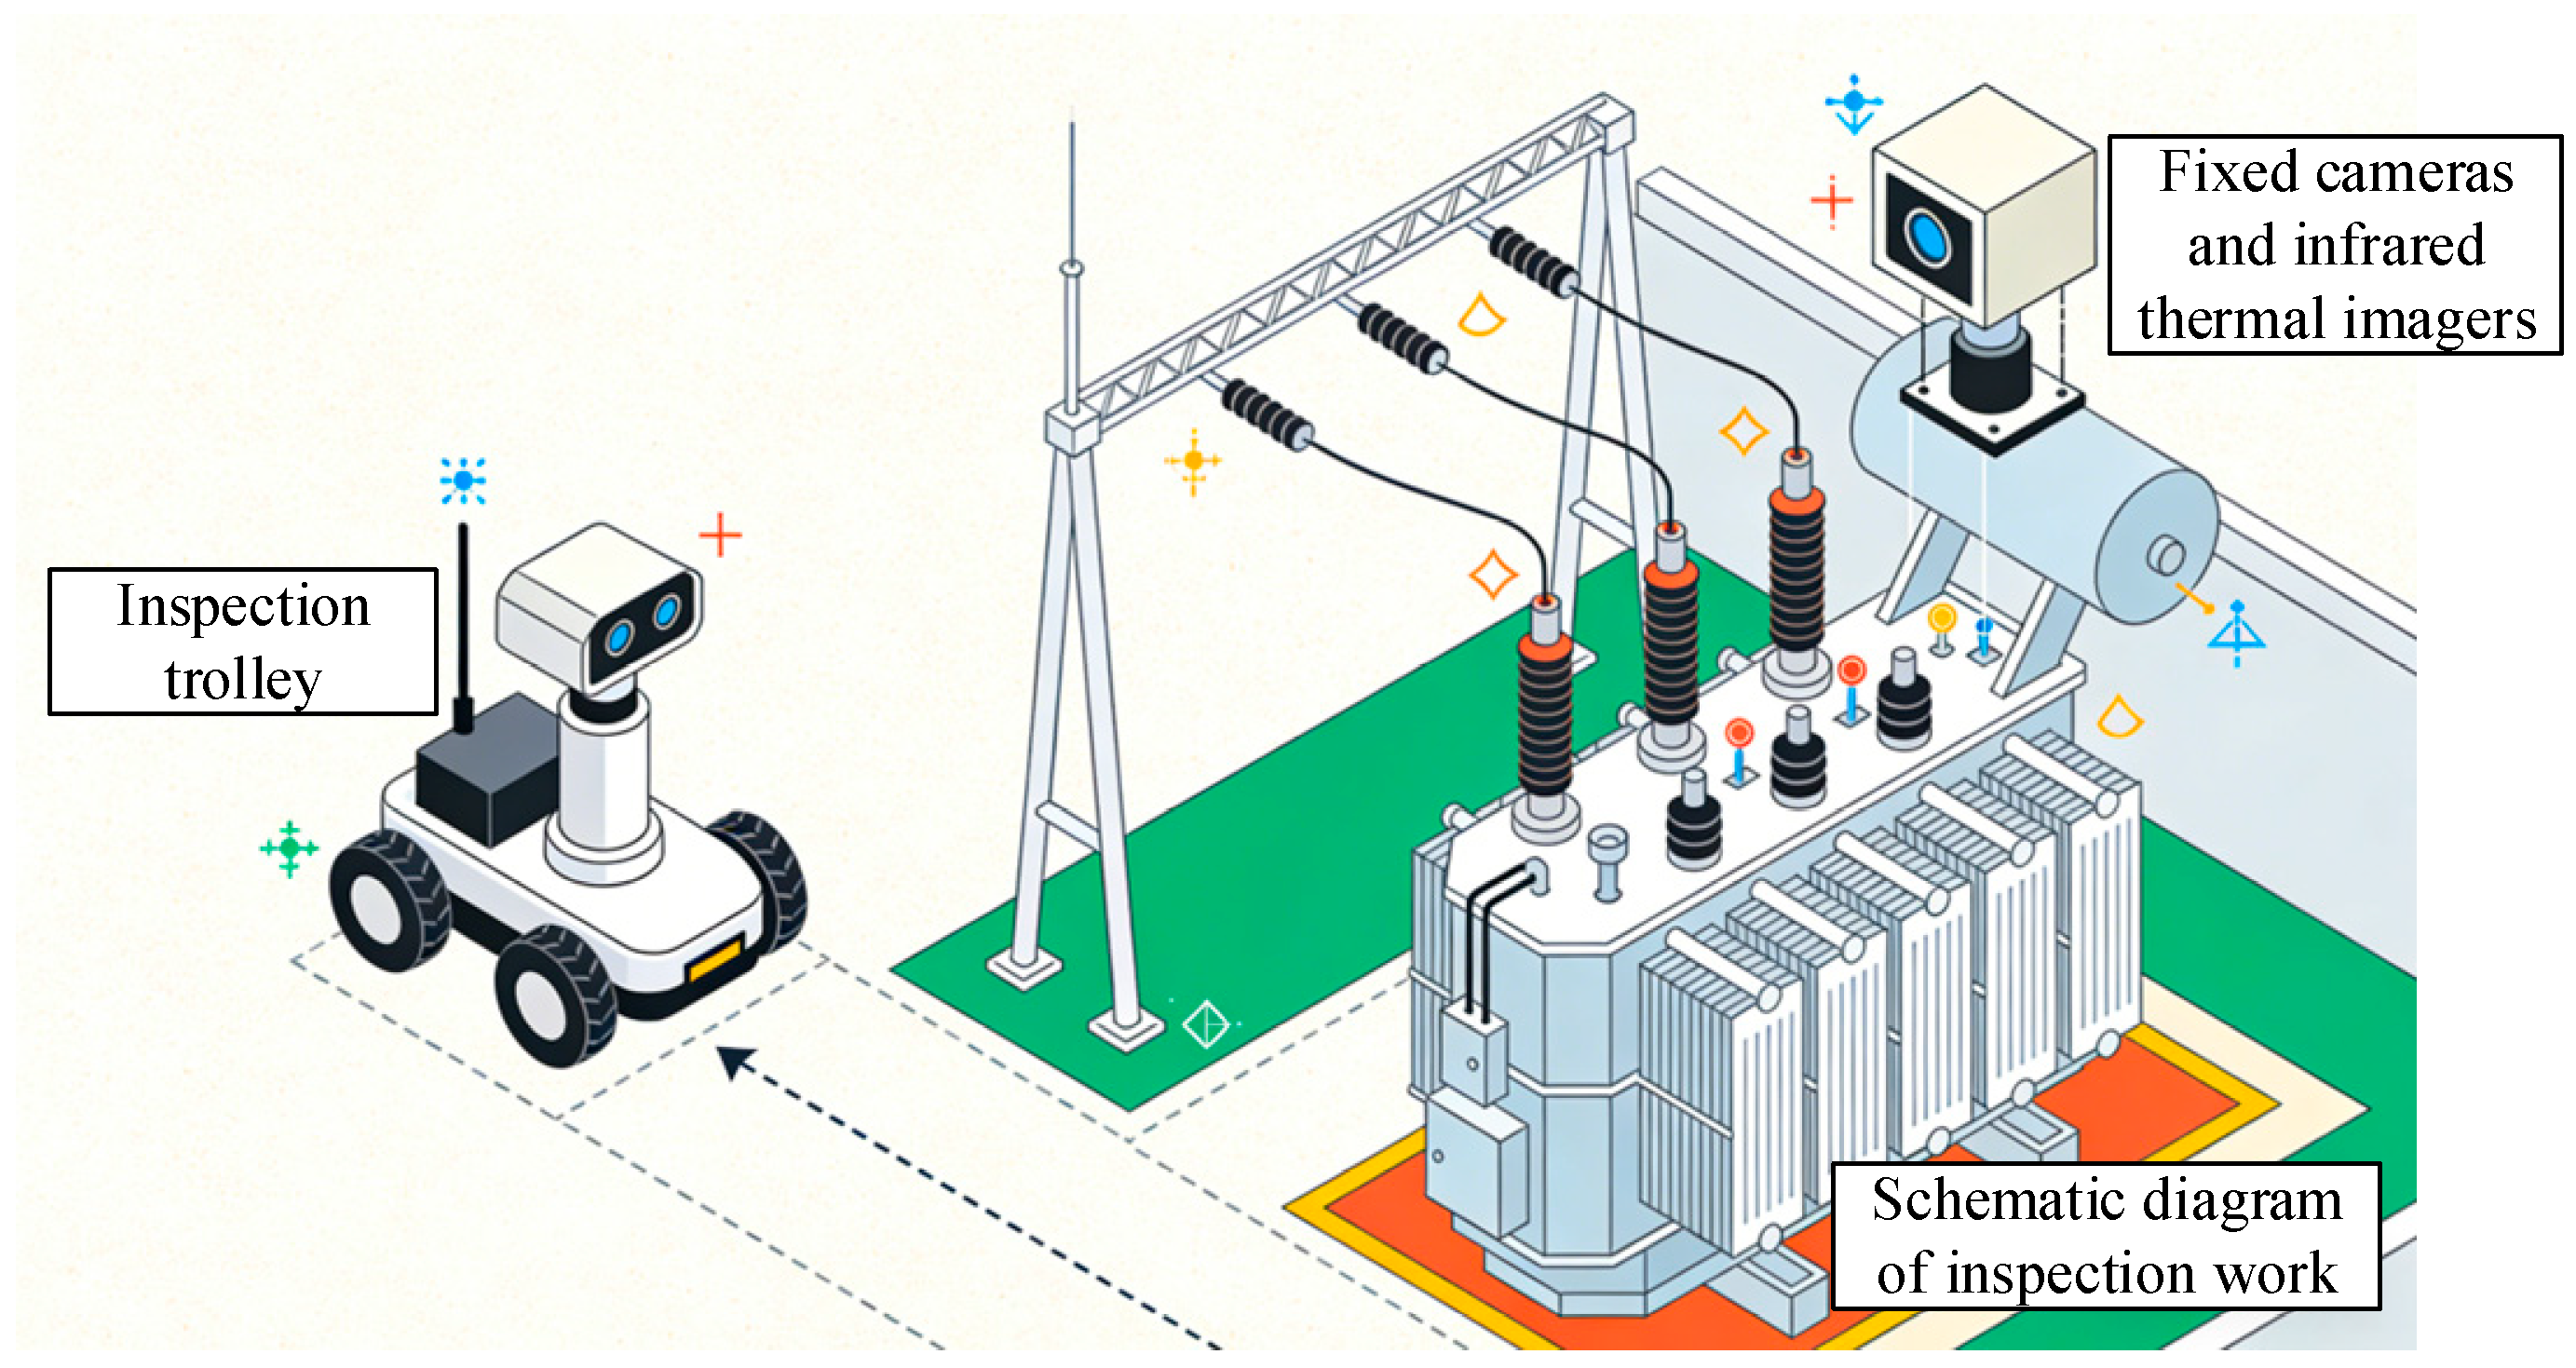
To establish a comprehensive and highly reliable visual perception network, the system adopts a hybrid deployment strategy that integrates mobile scanning with fixed-point monitoring. The overall working mechanism of the intelligent inspection system is illustrated in Figure 2.
(1)
Mobile Inspection Unit:
A mobile inspection vehicle is equipped with an OV5640 industrial-grade camera and an MG996 servo gimbal. This configuration enables the vehicle to move autonomously along predefined routes, capturing detailed images of equipment surfaces from multiple angles and close ranges. The approach effectively covers major inspection corridors and areas accessible to the inspection robot, ensuring flexible and detailed visual data acquisition.
(2)
Fixed Monitoring Unit:
To compensate for potential blind spots in the mobile inspection’s visual coverage and to establish a continuous observation baseline, fixed cameras and infrared thermal imagers are strategically installed at critical locations—such as structural beams at the top of converter halls and safe zones above key equipment. These stationary sensors operate collaboratively with the mobile units, forming a complementary network that enhances the spatial continuity and reliability of inspection data.
All fixed devices are installed following rigorous engineering and safety standards.
Safety considerations: Deployment locations are determined through clearance and safety distance evaluations to ensure accessibility only under de-energized and maintenance conditions. Insulated mounting brackets are used to eliminate high-voltage safety hazards.
Maintainability: Each unit adopts a modular design, allowing rapid disassembly, replacement, and maintenance during scheduled outages, thereby reducing on-site maintenance complexity and operational risk.
(3)
Spatial Registration and Data Fusion:
Each visual sensing device—whether mobile or fixed—is assigned a unique three-dimensional coordinate identifier during deployment. This identifier is embedded in real time with the collected data, enabling automatic registration and fusion of multi-source visual information within a unified spatial coordinate system. This spatial alignment provides essential contextual information for accurate fault localization and comprehensive equipment condition analysis.

4. Multi-Source Inspection Data Acquisition and Application

Building on the dual-mode collaborative inspection framework introduced earlier—comprising fixed-point monitoring and mobile inspection—this study focuses on the challenges associated with complex operating environments in core areas of power systems. These environments are characterized by high voltage levels, strong electromagnetic interference, and confined spatial conditions. In such settings, early fault signatures are often subtle and easily overlooked when relying on a single sensing modality.
To address these issues, three complementary types of sensors—visible-light, infrared, and acoustic—are integrated to establish a multi-source inspection data acquisition system. Each sensor type targets a distinct dimension of equipment condition monitoring. visible-light imaging for appearance and structural assessment, infrared detection for temperature distribution and thermal anomalies, and acoustic sensing for operational sound pattern analysis.
Together, these sensing modalities enable comprehensive, multi-layered data collection encompassing visual, thermal, and acoustic perspectives. This integrated system forms a high-quality data foundation for subsequent fault detection, feature extraction, and multi-source information fusion, thereby enhancing diagnostic precision and operational reliability. Detailed acquisition schemes and application scenarios for each sensing type are described in the following sections.

4.1. Visible-Light Image Acquisition and Application

Core equipment areas within a power system—such as power converter modules, reactors, and water-cooling pipelines—serve as critical sites for energy conversion and transmission. These components operate long-term under high voltage and strong electromagnetic confinement, where the integrity of mechanical structures and the reliability of electrical connections directly determine the stability of system operation. Subtle surface anomalies on equipment often represent early indicators of internal faults, while environmental issues such as water accumulation or foreign-object deposits on the floor can pose serious safety hazards to equipment and maintenance personnel. Consequently, visual monitoring becomes an indispensable component of the inspection process.
The proposed system employs industrial-grade, EMI-resistant visible-light cameras equipped with metal shielding housings to suppress strong electromagnetic radiation. These cameras perform full-coverage image acquisition of core power-system areas, including power modules, cooling pumps, and inspection aisles, ensuring wide-angle observation without blind spots.
During inspection, the captured image data are processed using the YOLOv8 object-detection model in combination with OpenCV image-processing algorithms. This integration supports multi-dimensional fault detection, enabling precise identification of surface defects on equipment as well as environmental anomalies. The system can rapidly detect and locate potential hazards such as surface water accumulation or foreign-object buildup, preventing short circuits and reducing delays in fault diagnosis and maintenance response.

4.2. Infrared Thermal Data Acquisition and Application

During power-system operation, core components such as power modules and reactors generate considerable energy losses that are released in the form of heat. In enclosed compartments and under strong electromagnetic conditions, heat tends to accumulate, concealing local thermal anomalies that often indicate early-stage faults. Without timely detection, such conditions can lead to insulation aging or thermal breakdown, resulting in severe equipment failures. Traditional point-type temperature sensors provide only limited area coverage and cannot accurately reflect the overall thermal distribution of equipment surfaces. Therefore, infrared thermography has become a critical approach to overcoming this limitation.
In this system, industrial-grade infrared thermal imagers are employed and mounted near critical heat-emitting areas using electromagnetically shielded metal brackets, effectively minimizing the influence of EMI and mechanical vibration. These imagers continuously capture the surface temperature distribution of equipment in real time. Within inspection applications, thermal data visually represent the temperature profile of the entire device. By correlating the thermal imagery with equipment structural parameters, adaptive temperature thresholds can be established to enable precise and early fault warning.

4.3. Acoustic (Sound-Pattern) Data Acquisition and Application

During the operation of power-system equipment, components such as high-frequency switching modules, reactors, and water-cooling pumps generate a stable baseline acoustic environment. Subtle deviations from this “normal sound pattern” often serve as early indicators of hidden faults. For instance, mechanical friction caused by loose reactor bolts or arcing discharge due to insulation aging in power modules may produce minor acoustic changes before any visual or thermal anomalies appear. Such incipient faults are typically difficult to detect through conventional inspection methods and may progressively worsen, resulting in significant equipment damage.
To address this challenge, the system deploys industrial-grade, EMI-resistant acoustic sensors at critical equipment locations. These sensors focus on capturing sound signals within the 63–8000 Hz frequency range, which effectively covers the characteristic spectrum of common electrical and mechanical phenomena. During inspection, real-time acoustic signals are compared with the established baseline sound profile of normal operation. Deviations or abnormal patterns are then analyzed to identify early fault features and pinpoint potential defect locations. This acoustic-sensing mechanism complements visual and thermal monitoring, enhancing the system’s ability to detect latent faults that lack obvious external or thermal manifestations.

5. Core Technology Design

5.1. Wireless Transmission System Design

Considering the characteristics of power systems—such as strong electromagnetic interference (EMI), high data throughput requirements, and the need for stable transmission—the proposed system establishes a wireless communication architecture that integrates link redundancy, protocol-level reliability, and intelligent fault tolerance. This design ensures real-time transmission of large-capacity inspection data while maintaining robust communication performance under complex electromagnetic conditions.

5.1.1. Dual-Mode Transmission Architecture

To mitigate the potential failure risk of a single wireless link in high-EMI environments, the system employs a heterogeneous dual-mode transmission architecture in which Wireless Fidelity (Wi-Fi) serves as the primary channel and Fourth Generation (4G) cellular communication acts as a hot backup. The core intelligence of this architecture lies in dynamic link sensing and seamless switching, ensuring continuous and reliable connectivity.
(1)
Primary Link (High-Bandwidth Mode):
When inspection devices operate within the effective coverage area of the facility’s Wi-Fi network and the signal quality is satisfactory, the system automatically prioritizes the Wi-Fi channel. Owing to its high bandwidth, this mode supports real-time transmission of large data volumes, including images and video streams, ensuring low-latency monitoring and timely data analysis.
(2)
Backup Link (Connectivity Assurance Mode):
The system backend continuously monitors Wi-Fi signal strength—measured by the Received Signal Strength Indicator (RSSI)—and bit error rate (BER). If electromagnetic interference degrades the Wi-Fi link quality or causes a disconnection, the transmission control module automatically performs a seamless handover to the 4G network. The cellular link, with its wide-area coverage, maintains an uninterrupted data channel and prevents data loss resulting from single-link failures.
(3)
Reliable Transmission Protocol:
At the transport layer, the system utilizes the Message Queuing Telemetry Transport (MQTT) protocol configured with Quality of Service (QoS) Level 1. This configuration establishes a publish–acknowledge–retransmit handshake mechanism, guaranteeing message delivery even under unstable channel conditions. If the sender does not receive an acknowledgment from the broker within the specified timeout period, an automatic retransmission is triggered—up to a maximum of three attempts—to ensure reliable delivery of inspection data in strong electromagnetic environments.

5.1.2. Anti-Interference Optimization

Considering both implementation cost and system adaptability, the proposed design adopts a “software-driven optimization with hardware-level protection” strategy. Hardware components provide the fundamental defensive infrastructure, while multi-layer software mechanisms are employed to actively suppress and compensate for electromagnetic interference (EMI), ensuring robust operation of the wireless transmission system.
(1)
Hardware-Level Protection:
All on-site sensors and wireless communication modules are selected from industrial-grade, EMI-resistant models. The transmission gateway is enclosed in a sealed aluminum alloy shielding case to minimize direct electromagnetic radiation intrusion. In addition, a low-impedance grounding loop is established to provide a stable discharge path, reducing the effects of electromagnetic coupling and improving the electromagnetic compatibility (EMC) of the system.
(2)
Software-Level Optimization:
The software-based interference mitigation framework forms the core of system robustness. It employs a bottom-up, cooperative strategy across data transmission, processing, and application layers to build a hierarchical anti-interference mechanism.
i.
Link-Layer Reliability:
All inspection data are encapsulated in a structured JavaScript Object Notation (JSON) format and embedded with Cyclic Redundancy Check (CRC-32) codes for error detection. At the receiver side, bit-level data integrity verification is performed. Any data packet that fails verification is discarded and automatically retransmitted under the defined communication protocol, ensuring reliable and loss-free data delivery.
ii.
Data-Layer Adaptive Cleaning:
To eliminate residual noise that may persist after transmission, an adaptive noise-suppression module is integrated into the data stream processing pipeline. For image data in particular, this module leverages Open Source Computer Vision (OpenCV)-based preprocessing techniques—such as denoising and contrast enhancement (details in Section 5.2.2)—to improve signal quality and provide high-fidelity input for subsequent intelligent analysis.
iii.
Application-Layer Semantic Fault Tolerance and Traceability:
Each data packet is encoded with metadata including high-precision timestamps, unique device identifiers (IDs), and three-dimensional coordinates, forming a complete contextual signature. In the event of anomalous data, this metadata enables accurate fault traceability and contextual reconstruction. Such semantic fault tolerance provides essential support for the multi-source data fusion algorithm described later, allowing dynamic reweighting of sensor credibility and the systematic isolation of unreliable data sources.

5.2. Visual Detection Model Design for Power Equipment Inspection

To address the challenges of detecting small-scale equipment faults, complex background conditions, and image degradation caused by strong electromagnetic interference, a high-precision, robust, and deployment-ready visual detection system was developed. Based on a comprehensive evaluation of detection performance, computational efficiency, and engineering feasibility, the proposed system adopts the YOLOv8 model as the core detection framework. A complete technical scheme is constructed, incorporating scene-adaptive image preprocessing and model-level optimization tailored to power system applications.

5.2.1. Model Selection: Adaptability Analysis of YOLOv8

The selection of YOLOv8 is primarily driven by three key advantages that align closely with the requirements of power equipment inspection:
(1)
Real-Time Performance and Computational Efficiency:
Although model training is performed on a server, the system must retain the potential for future edge deployment with real-time inference capability. Transformer-based architectures such as the Vision Transformer (ViT) demonstrate high accuracy but impose greater computational loads, making low-latency inference difficult on resource-constrained embedded devices. Empirical studies have shown that, at comparable accuracy levels, YOLOv8 achieves significantly higher inference speed and architecture efficiency compared with Transformer-based models [28]. Its lightweight versions provide a practical pathway for achieving high-frame-rate, low-latency fault diagnostics in embedded edge devices.
(2)
Detection Accuracy for Small Targets:
Faults in power equipment—such as loose screws or fine surface cracks—are typically small in scale and weak in contrast. YOLOv8 features an enhanced Path Aggregation Network (PAN) and efficient multi-scale feature fusion mechanisms, improving its ability to capture and utilize shallow detail features. While Transformer architectures excel at modeling global context, they generally underperform convolutional neural networks (CNNs) in fine-grained feature extraction. Consequently, YOLOv8 is particularly suited for detecting localized subtle faults in complex electrical environments [29].
(3)
Compatibility with Embedded Deployment:
YOLOv8 offers a scalable family of model sizes, facilitating a seamless transition from server training to embedded hardware deployment through model pruning and optimization. Its CNN-based architecture benefits from well-established deployment toolchains—such as TensorRT and OpenVINO—which significantly reduce optimization and integration complexity [30]. Therefore, adopting YOLOv8 represents a stable and forward-looking choice for long-term practical implementation.

5.2.2. Preprocessing Pipeline for Power System Image Adaptation

To mitigate the adverse visual effects caused by strong electromagnetic interference, such as salt-and-pepper noise, Gaussian noise, uneven illumination, and complex backgrounds, an Open Source Computer Vision (OpenCV)-based image preprocessing pipeline was designed. This process ensures high-quality input to the YOLOv8 model and consists of three main stages:
(1)
Noise Suppression and Image Enhancement:
A hybrid denoising approach combining Gaussian filtering (to suppress high-frequency noise) and median filtering (to remove salt-and-pepper noise) is applied. Furthermore, Contrast-Limited Adaptive Histogram Equalization (CLAHE) is used to improve illumination uniformity and enhance faint defect features such as surface cracks or loose fasteners, preventing overexposure and loss of critical detail.
(2)
Feature Enhancement Through Morphological Processing:
The Otsu adaptive thresholding method is utilized to separate equipment foregrounds from complex backgrounds. Morphological opening operations (erosion followed by dilation) remove small artifacts such as dust or glare spots, while closing operations (dilation followed by erosion) fill micro-holes on the equipment surface to preserve contour continuity. Subsequently, Canny edge detection (threshold range: 100–200) extracts clear structural edges, providing YOLOv8 with additional spatial constraints that improve fault localization accuracy.
(3)
Precise Region-of-Interest (ROI) Localization:
Contour detection algorithms are applied to extract the outer boundary of equipment components. Combined with three-dimensional coordinate information and predefined size thresholds, irrelevant background areas—such as walls and service corridors—are filtered out. The resulting ROI mask is applied pixel by pixel to preserve only the equipment regions, forming the final input to YOLOv8. This focused processing minimizes unnecessary computation, eliminates background interference, and enhances the detection precision for core fault regions.

5.2.3. YOLOv8 Optimization for Power System Inspection

To further enhance the performance of the YOLOv8 model in power system inspection scenarios, a set of targeted optimizations was applied, integrating the earlier image preprocessing pipeline. The improvements cover three main aspects: network architecture, loss function design, and inference pipeline refinement.
(1)
Network Architecture Optimization:
  • Lightweight Backbone:
To achieve real-time processing capability without sacrificing feature extraction quality, the traditional C2 module was replaced with an improved C2f module. This modification introduces richer cross-layer connections, reducing computational complexity while preserving feature representation, thus ensuring efficient inference for real-time inspection tasks.
ii.
Enhanced Multi-Scale Feature Fusion:
A Spatial Pyramid Pooling—Fast (SPPF) module was added to extract multi-scale features through four different pooling resolutions, improving recognition of small-scale defects such as fine pipeline cracks or minor leakage points. Combined with a Path Aggregation Network (PAN), this structure enables efficient fusion of high-level semantic and low-level spatial features, strengthening robustness across objects of varying sizes.
iii.
Decoupled Head and Dynamic Sample Assignment:
The detection head was restructured using a decoupled prediction design, where classification and regression are handled independently through separate convolutional branches. This separation reduces feature interference between the two tasks. In addition, a dynamic positive sample assignment strategy was introduced to improve learning efficiency for hard or small-sample targets that are common in real power equipment fault scenarios.
(2)
Loss Function Optimization
Given the high precision requirements of fault localization and classification in electrical equipment inspection, a hybrid loss function was designed as:
L t o t a l = L C I o U + λ × L c l s .
In Equation (1), λ is a balancing coefficient empirically determined according to the dataset, L c l s denotes the classification loss, and L C I o U represents the localization loss.
The CIoU term considers the intersection-over-union ratio, center distance, and aspect ratio consistency, thereby improving localization accuracy for small-scale targets. It is mathematically defined as:
L C I o U   =   1     I o U   +   ρ 2 b ,   b g t c 2   +   α   v   .
In Equation (2),   I o U is the intersection-over-union between the predicted and ground-truth bounding boxes, ρ b ,   b g t is the Euclidean distance between their centers, c is the diagonal length of the smallest enclosing box, and α   v penalizes aspect ratio inconsistency. This penalty mechanism enhances the model’s sensitivity and precision for subtle anomalies (e.g., micro-leakage), providing a theoretical foundation for high-accuracy fault localization.
(3)
Inference Pipeline Optimization
The optimized inference pipeline integrates the preprocessing strategy and refines the entire detection workflow as follows:
i.
Input Processing:
The preprocessed visible-light images generated via Open Source Computer Vision (OpenCV) are normalized to a uniform resolution of 640 × 640 pixels, converted from RGB to BGR color space, and scaled using adaptive pixel normalization to mitigate illumination and device variability.
ii.
Feature Extraction:
The enhanced YOLOv8 backbone extracts both shallow texture details and deep semantic features. Through the incorporation of the SPPF and PAN modules, multi-scale feature maps are produced, enabling accurate detection of faults across varying object sizes and resolutions.
iii.
Post-Processing:
Candidate bounding boxes are filtered using a 0.5 confidence threshold, and Non-Maximum Suppression (NMS) with an IoU threshold of 0.45 is applied to remove redundant detections. The final output consists of fault type, confidence score, and image coordinates, delivering accurate visual detection results for subsequent multi-source data fusion and system-level fault diagnosis.

5.3. Multi-Source Information Fusion Algorithm Design

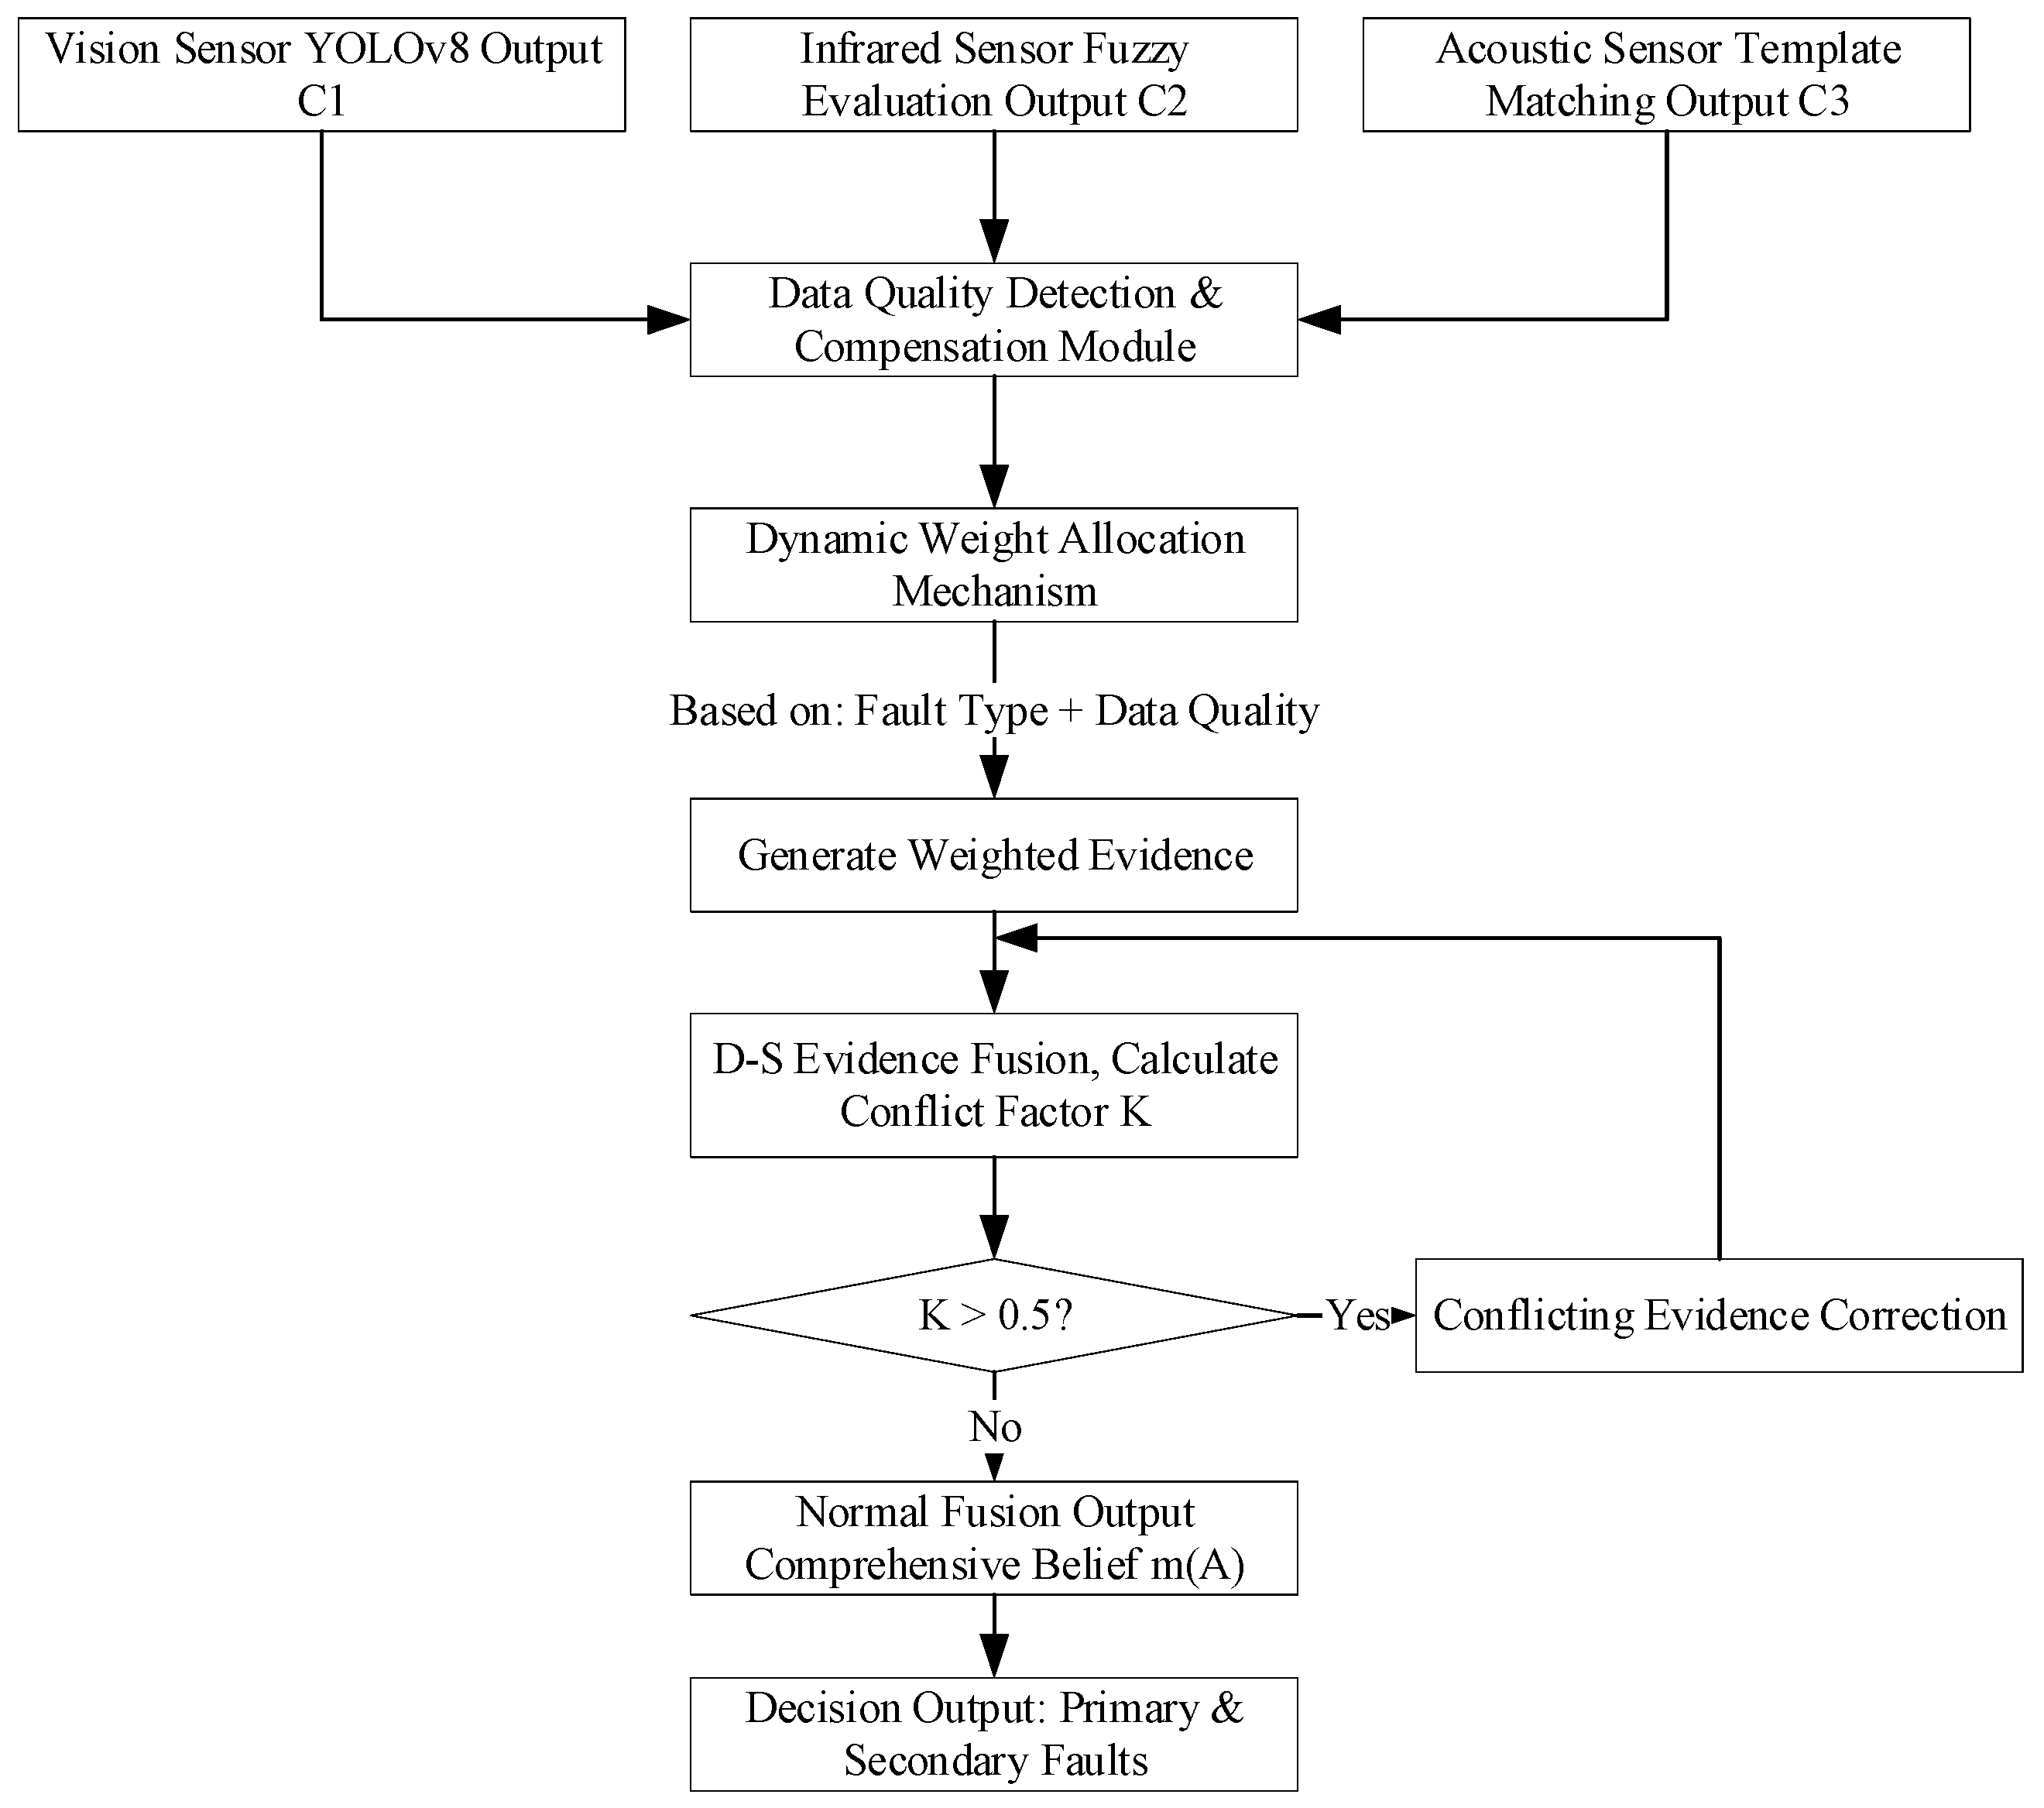
To address the multi-dimensional characterization and diagnosis challenges of complex faults in power equipment—such as local overheating and electrical discharge—a three-sensor cooperative fusion framework is developed, integrating visual, infrared, and acoustic sensing modalities. The fusion strategy adopts a hierarchical integration scheme, using the You Only Look Once version 8 (YOLOv8) visual detection results as the primary reference, while jointly validating and complementing them with infrared thermal features and acoustic frequency-domain characteristics. This approach ensures comprehensive fault coverage and mitigates blind spots inherent to single-sensor systems. The structure of the multi-source information fusion algorithm is shown in Figure 3.
To balance diagnostic accuracy and real-time performance, the algorithm follows a progressive three-stage structure:
(1)
Single-Sensor Preliminary Assessment: Each sensing modality performs independent preprocessing, feature extraction, and confidence calculation.
(2)
Dynamic Weighted Fusion: Sensor weights are adaptively adjusted based on the detected fault type, reinforcing the contribution of the most relevant modality.
(3)
Decision-Level Evidence Synthesis: An improved Dempster–Shafer (D–S) evidence theory model integrates multi-source observations, resolves cross-modal data conflicts, and outputs the final diagnostic decision.
The framework also accounts for interdependencies among sensors. In cases of data loss or strong interference, adaptive weight adjustment and conflict-enhanced evidence handling mechanisms provide effective compensation to maintain robust diagnostic performance.

5.3.1. Single-Sensor Feature Extraction and Preliminary Decision Model

Each sensor operates independently and generates a normalized fault confidence score C i   ϵ   [ 0 ,   1 ] through modality-specific feature extraction procedures, described as follows:
(1)
Visual Sensor:
The preliminary fault confidence C 1 is directly derived from the class confidence output of the YOLOv8 model. A confidence threshold of 0.8 is applied if C 1 0.8 and the result is considered valid; otherwise, it is treated as invalid evidence and triggers a data completion mechanism to preserve visual evidence reliability.
(2)
Infrared Sensor:
To characterize the thermal behavior of power equipment faults, three key parameters are extracted: T a v g ( ° C )   —the average temperature of the monitored region, representing the overall operating temperature; T   ( ° C ) —the temperature difference between the core component and its cooling structure, indicating the degree of local overheating; S r —the normalized hot-spot area ratio [0, 1], representing the spatial extent of the thermal anomaly.
These are used to construct a fuzzy evaluation matrix R   =   r 11 r 12 r 13 r 14 r 21 r 22 r 23 r 24 r 31 r 32 r 33 r 34 , where each element r i j   ϵ   [ 0 ,   1 ] represents the membership degree of the i -th thermal parameter to the j -th fault class. The relative importance of the three thermal features is determined through the Analytic Hierarchy Process (AHP), resulting in a weight vector W = [ 0.4 ,   0.35 ,   0.25 ] , corresponding to: T a v g ,   T ,   a n d   S r . The preliminary infrared confidence C 2   is then computed using a weighted fuzzy comprehensive evaluation model:
C 2 = W × R × 1 ,   1 ,   1 ,   1 T ,
where C 2   ϵ   [ 0 ,   1 ] is the infrared fault confidence; W is a three-dimensional row vector; R is a 3 × 4 fuzzy evaluation matrix; and 1 ,   1 ,   1 ,   1 T is a normalization vector used for aggregation.
(3)
Acoustic Sensor:
The raw sound signal is transformed using a 512-point Fast Fourier Transform (FFT), and a 128-dimensional Mel-Frequency Cepstral Coefficient (MFCC) vector is extracted as the core feature representation. These features are compared with a reference acoustic template library containing five categories (four fault conditions and one normal state). The cosine similarity between real-time and reference features determines the acoustic confidence C 3 ; the highest similarity value is selected as the preliminary confidence score.
All confidence values C i are then normalized to a uniform scale and passed as standardized inputs to the subsequent fusion algorithm. This preprocessing ensures data comparability across heterogeneous sensors, establishing a unified basis for the multi-source decision-making process.

5.3.2. Dynamic Weight Allocation Mechanism

The dynamic weighting mechanism follows the principle of “fault-type dominance with quality-based adjustment.”
Given the varying sensitivity of each sensor to different fault characteristics, the algorithm dynamically adjusts sensor weights according to the fault type and real-time data quality. This is achieved through the combination of a predefined weight reference table and an online quality evaluation module.
(1)
Baseline Weight Assignment Based on Fault Type
According to prior knowledge and historical data analysis, baseline weights are predefined for different fault categories, as shown in Table 1.
(2)
Online Weight Adjustment Based on Data Quality
To compensate for data loss, noise interference, and communication instability, a data-quality factor q i   ϵ   [ 0 ,   1 ]   is introduced for each sensor ( i   = 1 , 2 , 3 referring to visual, infrared, and acoustic, respectively). A higher q i value indicates higher data reliability and greater contribution to the fusion result.
Quality Factor Calculation:
i.
Visual Sensor:
The visual sensor quality factor q 1 is determined by the validity of the YOLOv8 detection confidence, calculated as:
q 1 =   1 , 0.1 ,   i f   d a t a   v a l i d   a n d   C 1 0.8 i f   d a t a   m i s s i n g   o r   c o n f i d e n c e   b e l o w   t h r e s h o l d .
Here, q 1 = 1 indicates that the visual input is reliable and fully participates in fusion, while q 1 = 0.1 suppresses its weight when the data are missing or unreliable.
ii.
Infrared/Acoustic Sensors:
For infrared and acoustic sensors, their quality factors are computed based on real-time data loss rates during wireless transmission:
q i = 1 d a t a   l o s s   r a t e ,
where data loss rate   ϵ   [ 0 ,   1 ] represents the packet loss ratio. If no packet loss occurs, q i = 1 ; in the case of complete data loss, q i = 0 .
The final normalized fusion weights are computed as:
w i =   w i × q i j = 1 3 w j × q j ,
where w i   ϵ   [ 0 ,   1 ] denotes the updated weight of the   i -th sensor; w i is its baseline weight, and q i is its data-quality factor. The normalization term ensures that i   =   1 3 w i = 1 .
This mechanism enables the system to automatically down-weight unreliable sensors and adaptively compensate for missing data. If any sensor experiences total data loss ( q i 0 ), its contribution becomes negligible, while the remaining sensors dynamically assume greater influence in the final diagnostic decision.

5.3.3. Core Fusion Formulas and Conflict Resolution

To enhance the robustness of the fusion algorithm under strong electromagnetic interference (EMI) conditions, a weighted Dempster–Shafer (D–S) evidence theory–based fusion model is developed. This model introduces a visual evidence reliability coefficient and an EMI compensation parameter to optimize the basic probability assignment (BPA) of each sensor and implements a conflict-management mechanism to handle contradictions between heterogeneous sensor data. The goal is to improve overall diagnostic accuracy and stability under complex operational conditions.
The proposed fusion process consists of three major steps: (1) computation of basic probability assignments, (2) quantification of conflict factor K, and (3) generation of aggregated confidence. The derivation, core equations, and parameter definitions are detailed below.
(1)
Basic Probability Assignment (BPA) Calculation
In D–S evidence theory, the BPA represents the degree of belief that each sensor assigns to a given fault hypothesis. The calculation is adjusted using sensor-specific weights w i (computed from Equation (6)), preliminary confidence values C i   , and environmental correction factors to maintain reliability under EMI conditions
For the visual sensor, the BPA is defined as follows:
m 1 A 1 = w 1 × C 1 × α ,
where m 1 A 1   ϵ   [ 0 ,   1 ] denotes the visual evidence assigned to the fault hypothesis A 1 ; w 1 is the weight assigned to the visual sensor, and C 1   is the preliminary confidence obtained from the YOLOv8 detection output; and α = 0.98 is the visual reliability coefficient, used to compensate for EMI-induced degradation in visual performance.
For the infrared ( i   =   2 ) and acoustic ( i   =   3 ) sensors, EMI can cause mild signal distortion and random noise. To mitigate these effects, an EMI compensation factor of 0.95—determined empirically through calibration experiments under high-EMI conditions—is applied. Their BPAs are calculated using the unified expression:
m i A i = w i × C i × 0.95 ,
where m i A i   ϵ   [ 0 ,   1 ] denotes the evidence assignment for the fault hypothesis A i ; w i   is the final sensor weight; and C i   represents the preliminary fault confidence (calculated using Equation (3) for the infrared sensor and via spectral matching for the acoustic sensor).
(2)
Conflict Factor Quantification
To quantify inconsistencies among sensor evidence, a conflict coefficient ( K ) is defined. It measures the degree of contradiction when the fault hypotheses supported by different sensors have no intersection (i.e., conflicting evidence). The conflict factor is expressed as:
K = i = 1 3 A i = Ø i = 1 3 m i A i ,
where K   ϵ   [ 0 ,   1 ] represents the overall evidence conflict intensity. The term i = 1 3 A i = Ø indicates that the three sensors yield mutually exclusive fault hypotheses, while i = 1 3 m i A i denotes the product of their corresponding BPAs.
When K 1 , the evidence sets are highly contradictory, requiring correction before fusion; when K 0 , the evidences are consistent and can be directly fused.
(3)
Multi-Source Evidence Aggregation
Following the synthesis rule of D–S theory, the composite belief (confidence) for fault hypothesis A is obtained by aggregating all consistent evidence sets. The normalized confidence is expressed as:
m A = i = 1 3 A i = A i = 1 3 m i A i 1 K ,
where m A   ϵ   [ 0 ,   1 ] represents the final fused confidence associated with the fault hypothesis A .
Here, i = 1 3 A i = A denotes evidence agreement supporting the same fault hypothesis. The numerator accumulates the joint BPAs of all supporting sensors, while the denominator 1 K serves as a normalization factor that suppresses the negative influence of conflicts, ensuring that the final confidence remains within the range [ 0 ,   1 ] .
Conflict-Handling Strategy: When the conflict coefficient K > 0.5 (a threshold determined experimentally to balance conflict identification and fusion efficiency), the evidence set is considered highly inconsistent. In this case, clearly distorted sensor evidence is excluded, and the remaining valid evidence is reweighted before recalculating confidence using Equations (9) and (10).
If K 0.5 , the conflict level is deemed acceptable, and Equation (10) is directly applied for fusion.

5.3.4. Decision Output

Based on the fused confidence value m A , the final diagnostic decisions are derived as follows:
(1)
Fault Determination:
If m A   > 0.5 , the corresponding fault is considered to have occurred.
(2)
Fault Prioritization:
When multiple fault types exceed the confidence threshold, the results are ranked in descending order of m A . The top-ranked class is identified as the primary fault, while others are labeled as secondary faults. This prioritization helps maintenance personnel determine the order and urgency of corrective actions.
(3)
Normal Operation:
If all m ( A ) 0.5 , the system determines that the equipment is operating under normal conditions.

6. Experimental Validation and Result Analysis

6.1. Experimental Setup and Dataset Construction

6.1.1. Experimental Environment

To verify the overall performance of the proposed system, experiments were conducted in a real-world environment at a 220 kV substation, specifically within the main transformer room and high-voltage switchgear room. These locations represent typical strong electromagnetic interference environments. The indoor temperature ranged from 10 °C to 20 °C, and the field contained essential power system equipment, including transformers, reactors, high-voltage switches, and water-cooling pipelines—closely reproducing the actual operational conditions characterized by high voltage, intense EMI, and semi-enclosed space constraints.
The experiments covered five representative operating conditions, including four fault scenarios and one normal condition. The fault scenarios included ground leakage/pipeline water leakage, simulated by deliberately causing seal failure in the water-cooling pipelines; equipment overheating, realized by adjusting the cooling system to create controllable local temperatures in the range of 35–110 °C; pump bearing wear, reproduced mechanically to simulate rotor wear conditions; and partial discharge, generated using a needle-plate electrode structure to produce stable discharge signals.
The test setup deployed four industrial-grade wireless gateways and five groups of hybrid sensor nodes. The key sensing components comprised visible-light cameras, infrared thermal imagers, and acoustic sensors:
(1)
The visible-light cameras and infrared imagers were deployed in a hybrid configuration combining mobile inspection and fixed monitoring. The mobile inspection vehicle was equipped with an OV5640 camera and an MG996 servo gimbal for dynamic visual coverage, while stationary cameras and infrared sensors were mounted at critical equipment positions for continuous monitoring.
(2)
Acoustic sensors were precisely installed near key mechanical components to capture sound signals in the 63–8000 Hz frequency range, enabling analysis of equipment vibration and discharge patterns.
A 10-day full-cycle stability test was carried out to evaluate the reliability of sensing, transmission, and processing performance under continuous operation.
The hardware environment consisted of an Intel Core i7-14700KF processor (Manufatured by Intel Corporation, Santa Clara, CA, USA) and an NVIDIA RTX 4070 Super GPU (Manufactured by NVIDIA RTX 4070 Super GPU: NVIDIA Corporation, Santa Clara, CA, USA), providing sufficient computational resources for edge-computing tasks and deep-learning inference. The software environment was implemented in Python 3.9 (Manufactured by Python Software Foundation, Wilmington, DE, USA), incorporating the PyTorch 2.0 (Manufactured by Meta Platforms, Inc. (formerly Facebook, Inc.), Menlo Park, CA, USA) deep-learning framework and the OpenCV 4.8.0 (Manufactured by OpenCV Foundation, Bradenton, FL, USA), forming a complete system for algorithm development, model training, and data processing.

6.1.2. Dataset Construction

To train the system’s core visual detection model (You Only Look Once version 8, YOLOv8), a dedicated visible-light image dataset for substation scenarios was constructed. The dataset contains 2000 images (augmented effective samples), generated by applying data augmentation techniques such as random horizontal/vertical flipping, random scaling and translation, and brightness/contrast adjustment. Each image was manually annotated, with labels specifying both fault type and bounding-box coordinates.
The dataset was divided using stratified sampling into training, validation, and test sets in a 7:2:1 ratio, comprising 1400 training images, 400 validation images, and 200 test images. This ensured a balanced distribution of all fault categories.
It should be noted that this study focuses specifically on five operational states (four fault types and one normal state). Although the dataset scales are moderate—as data were collected under targeted, structured acquisition conditions—the annotation accuracy and class balance ensure that the dataset fully captures the core visual characteristics of each operational condition.
To mitigate potential evaluation bias from the relatively small dataset size, a five-fold cross-validation strategy was employed to objectively assess the model’s generalization performance and stability. The full dataset of 2000 images was partitioned into five mutually exclusive subsets (each containing 400 samples). In each iteration, one subset was used as the validation set, and the remaining four subsets (after augmentation) were combined for training. This procedure was repeated five times independently, and the mean value of the five validation results was taken as the final evaluation metric for the YOLOv8 model, effectively reducing randomness introduced by a single data split.

6.2. Image-Recognition Performance Evaluation

6.2.1. Single-Set Validation Results

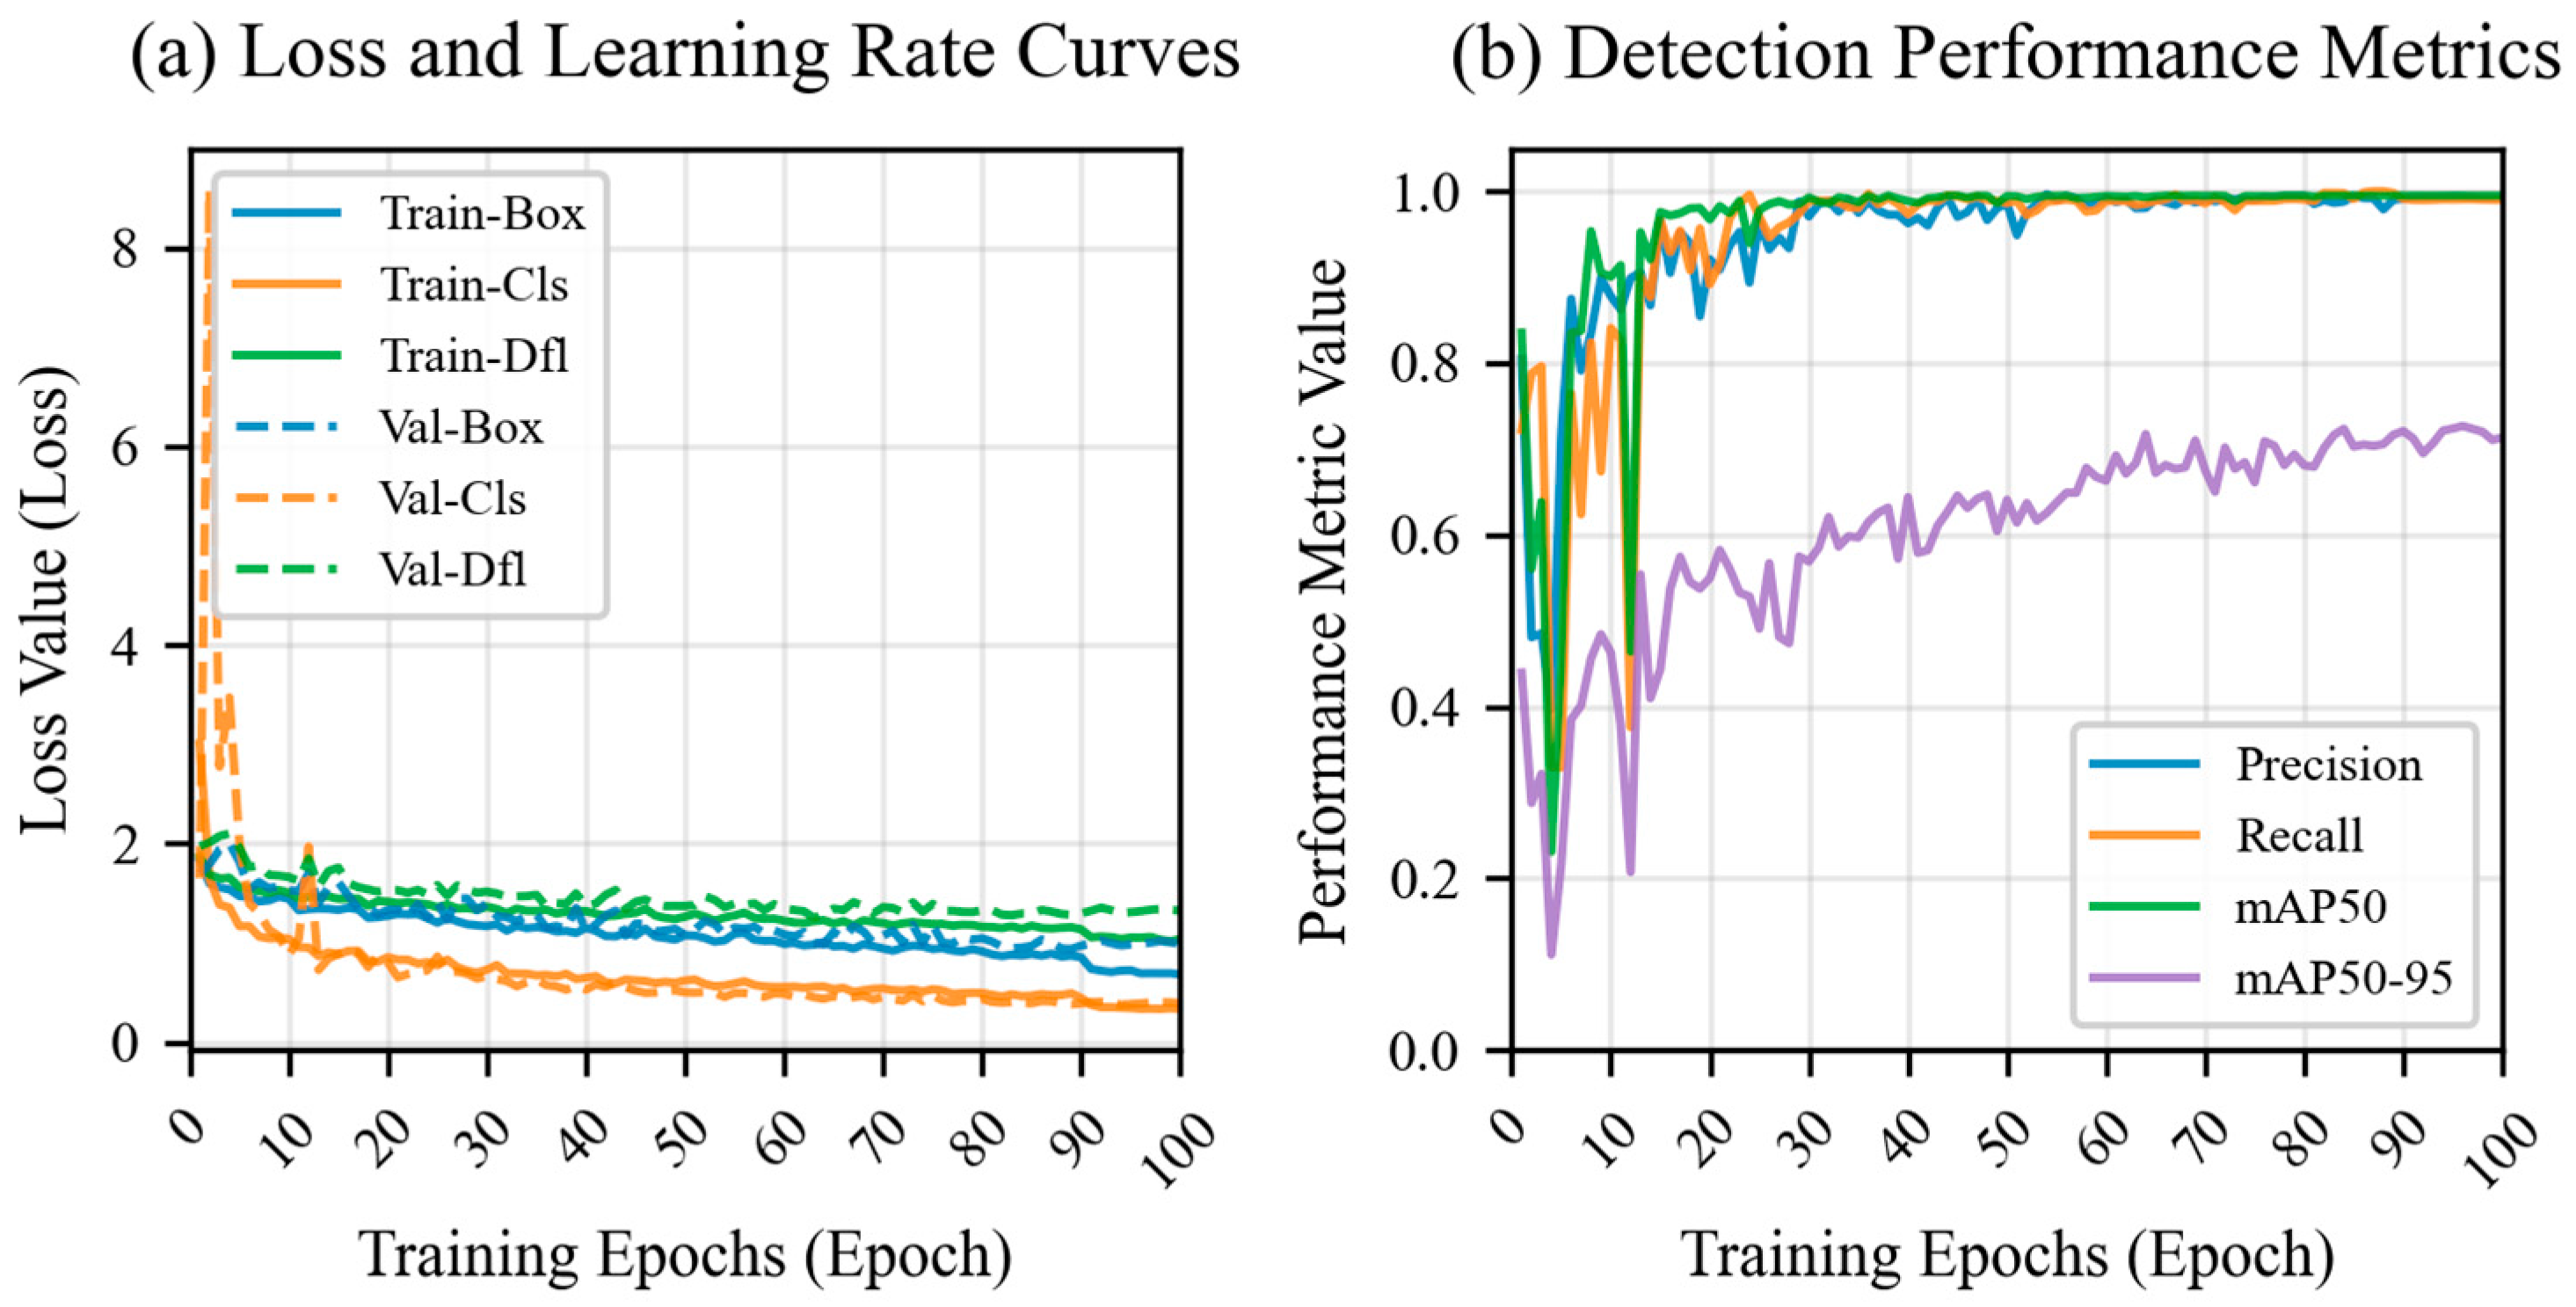
Figure 4 presents two subplots: (a) the loss and learning-rate curves during training, and (b) the key performance metrics of the YOLOv8 model. These results intuitively demonstrate both the training dynamics and the final detection performance.
(a)
Loss and Learning-Rate Curves:
The curves show the evolution of training and validation losses (horizontal axis: training epoch; vertical axis: loss value). As training progresses, both training- and validation-set losses decrease rapidly and eventually converge, indicating effective model fitting in terms of localization precision and classification accuracy. No sign of overfitting or underfitting was observed.
(b)
Detection-Metric Curves:
This subplot illustrates the variation in core performance indicators throughout the training process (horizontal axis: epoch; vertical axis: metric value). After approximately 20 epochs, all metrics stabilize. On a test set of 200 images, the trained model achieved a precision of 0.973, a recall of 0.971, and an mAP@50 of 0.976, confirming its strong fault-detection capability. When combined with OpenCV-based image preprocessing, the system exhibited improved robustness and noise tolerance under complex electromagnetic interference conditions, effectively supporting reliable visual inspection in real-world power-system environments.

6.2.2. Five-Fold Cross-Validation and Model Stability Analysis

To further assess generalization and stability, the YOLOv8 model was evaluated using five-fold cross-validation. The results are summarized in Table 2, showing that the model maintains highly consistent performance across different data partitions, with mean precision = 0.971, mean recall = 0.969, and mean mAP50 = 0.975. The standard deviations of all metrics are below 0.002, indicating minimal fluctuation and excellent training stability.
These results demonstrate that, although the dataset size is limited to 2000 images due to scenario constraints, the OpenCV-based targeted data augmentation strategy effectively expanded the feature space and enhanced model learning diversity. Coupled with the use of five-fold cross-validation for objective performance assessment, the YOLOv8 model exhibited strong generalization ability and training stability, fully meeting the engineering requirements for typical fault detection in substation environments.

6.3. Multi-Source Fusion and Transmission Performance Evaluation

The diagnostic performance of the proposed multi-source information fusion system across different fault categories is summarized in Table 3. Two key quantitative metrics are used for evaluation: Fault Detection Rate (FDR) and Diagnostic Accuracy Rate (DAR).
The test results demonstrate that integrating the YOLOv8-based visual detection model into a multi-sensor fusion architecture enables excellent fault-recognition and diagnostic performance for both abnormal and normal operation conditions in core regions of the power system.
Specifically, all four fault types were detected with high accuracy. The system achieved the highest recognition rate of 99.2% for surface water or leakage scenarios. This is attributed to the YOLOv8 model’s strong ability to capture subtle grayscale variations and geometric features of water accumulation or leakage paths, while the infrared sensor verifies the fault by identifying localized temperature differences. The combination produces a stable and clearly distinguishable fault signature, enabling near-perfect identification.
For partial-discharge events, the diagnostic accuracy was comparatively lower at 95.5%, primarily due to the inherently weak initial discharge signals, which can be affected by background acoustic noise generated by operating electrical equipment. This interference complicates feature extraction and slightly reduces detection confidence.
Overall, the evaluation results confirm that the system delivers excellent recognition accuracy under all operating conditions. In particular, the normal-operation classification accuracy reached 99.3%, indicating that the model effectively distinguishes between fault and non-fault states, thereby minimizing false alarms. Furthermore, the fusion framework provides precise fault localization and classification, offering maintenance personnel accurate information regarding fault type and position. This facilitates early fault detection and timely decision-making to ensure stable and reliable operation of critical power-system equipment.

7. Conclusions

To address the key challenges of low inspection efficiency, limited fault-recognition accuracy, and unstable data transmission under strong EMI conditions in modern power systems with high renewable-energy penetration, this study designed and validated an intelligent inspection system based on multi-technology integration.
The study develops an intelligent inspection system based on a four-layer architecture—comprising the perception, transmission, processing, and application layers. Through a hybrid deployment strategy that integrates mobile inspection and fixed-point monitoring, the system enables comprehensive multi-dimensional data acquisition of equipment operating states. A collaborative detection framework combining YOLOv8 and the OpenCV library is implemented to enhance the perception of small-scale faults. Structural optimizations of the detection model strengthen its sensitivity to subtle anomalies, while image preprocessing improves recognition robustness under complex environmental conditions. Building upon this foundation, a weighted D–S evidence theory-based fusion algorithm is proposed to integrate and cross-validate data from visual, infrared, and acoustic sensors. This multi-source fusion approach achieves a fault diagnosis accuracy of 95.5%, significantly reducing the false-alarm and missed-detection rates commonly associated with single-sensor inspection systems.
Future research will primarily aim to enhance system performance and broaden its application scope by integrating several emerging technologies. First, federated learning will be introduced to establish a distributed–centralized hybrid training framework, enabling collaborative model development across multiple substations without compromising data privacy. This approach is expected to significantly improve diagnostic precision for complex and small-scale faults while overcoming the generalization limitations caused by restricted datasets at individual sites. In addition, digital-twin technology will be incorporated to create a virtual, full-lifecycle model of power equipment based on the multi-source sensing data collected by the proposed system. By embedding operational parameters, historical fault data, and environmental factors, the digital twin will facilitate predictive analysis of equipment aging and potential fault evolution, transforming the inspection process from post-fault response to predictive maintenance.
Meanwhile, lightweight model optimization techniques, such as network pruning and quantization, will be applied to reduce computational cost and model size, ensuring efficient deployment on edge devices—including inspection robots and embedded computing platforms—while maintaining high inference speed and real-time performance in field operations. Furthermore, the system will be extended to renewable energy applications, such as wind and photovoltaic power stations. Optimized hardware shielding designs and algorithmic anti-interference mechanisms will further enhance adaptability under diverse environmental and electromagnetic conditions, enabling full-scenario coverage.
Overall, the proposed system provides a comprehensive and practical solution for achieving safe, reliable, and intelligent operation in next-generation power systems, supporting their transition toward a more resilient and adaptive energy infrastructure.

Author Contributions

Conceptualization, J.L. and J.G.; methodology, J.G.; software, Z.Y. and G.Z.; validation, Y.S.; formal analysis, J.L. and G.L.; investigation, Y.S.; resources, J.G.; data curation, Z.Y.; writing—original draft preparation, Z.Y.; writing—review and editing, G.L.; visualization, G.Z. and Y.S.; supervision, G.L.; project administration, J.L.; funding acquisition, J.G. and G.Z. All authors have read and agreed to the published version of the manuscript.

Funding

This research received no external funding.

Data Availability Statement

The data presented in this study are not publicly available due to ethical and confidentiality restrictions. Requests to access the datasets can be directed to the corresponding author, provided that valid ethical approval and a data use agreement (signed by the requesting party and the authors’ affiliated institution) are obtained to ensure com-pliance with data privacy and security guidelines.

Conflicts of Interest

Author Jiangtao Guo, Guangxu Zhao and Yan Shao were employed by the company China Coal Technology & Engineering Group Chongqing Research Institute Co., Ltd. The remaining authors declare that the research was conducted in the absence of any commercial or financial relationships that could be construed as a potential conflict of interest.

References

  1. Sun, Z. From “Manual Inspection” to “Cloud Diagnosis”: Intelligent Inspection Leading the Digital Transformation of Power Operation and Maintenance. Rural. Power Manag. 2025, 33, 18–19. [Google Scholar]
  2. Li, Y.; Mo, Y.; Wang, L.; Chen, H.; Zhang, Z.; Tang, W. Review on Intelligent Inspection and Disaster Loss Assessment Applications for Resilience Enhancement. Guangdong Electr. Power 2025, 38, 68–79. [Google Scholar]
  3. Chen, W.; Tang, W. Temperature Monitoring and Early Warning Technology for Hydro-turbine Units Based on Multi-source Information Fusion. Hydropower New Energy 2024, 38, 21–24. [Google Scholar]
  4. Zhong, C.; Chen, Q.; Liao, Z.; Li, M.; Li, L.; Wang, T.; Wang, L.; Qiu, S. Multi-dimensional Intelligent Inspection Management Mechanism for High-voltage Power Supply Lines. State-Own. Enterp. Manag. 2025, 12, 107–113. [Google Scholar]
  5. Ren, L.; Tang, T.; Guo, Q.; Zeng, H. Study on Fault Diagnosis Technology of Reciprocating Water-injection Pumps Based on Vibration Signals. Equip. Manag. Maint. 2024, 177–179. [Google Scholar] [CrossRef]
  6. Liu, Y. Wireless Sensor Network Applications in Smart Grid: Recent Trends and Challenges. Int. J. Distrib. Sens. Netw. 2012, 8, 492819. [Google Scholar] [CrossRef]
  7. Yang, B.; Song, G. Technical Application and Management of Intelligent Inspection System Operation and Maintenance in Smart-grid Substations. Jilin Province Electrical Engineering Society. In Proceedings of the 2025 Annual Conference of Jilin Province Electrical Engineering Society; State Grid Baishan Power Supply Company: Baishan, China, 2025; pp. 397–400. [Google Scholar]
  8. Fischer, G.K.J.; Bergau, M.; Gómez-Rosal, D.A.; Andreas, W.; Johannes, G.; Matthias, O. Evaluation of a smart mobile robotic system for industrial plant inspection and supervision. IEEE Sens. J. 2024, 24, 19684–19697. [Google Scholar] [CrossRef]
  9. Lin, T.; Ren, Z.; Zhu, L.; Zhu, Y.; Feng, K.; Ding, W.; Yan, K.; Beer, M. A Systematic Review of Multi-sensor Information Fusion for Equipment Fault Diagnosis. IEEE Trans. Instrum. Meas. 2025, 74, 1. [Google Scholar]
  10. Han, J.; Ma, J.; Li, X.; Li, W.; Zhang, X. Study on Substation Alarm Data Analysis and Inspection Strategy Based on Data Mining. Electr. Power Big Data 2019, 22, 20–26. [Google Scholar]
  11. Zhang, Q.; Sun, Y.; Yang, T.; Cui, Z. Application of Wireless Sensor Networks in Smart Grids. Electr. Power 2010, 43, 31–36. [Google Scholar]
  12. Dong, X. Application of Intelligent Inspection Robots in Substations. China Sci. Technol. Inf. 2025, 37, 47–49. [Google Scholar]
  13. Al-Jarrah, O.Y.; Shatnawi, A.S.; Shurman, M.M.; Ramadan, O.A.; Muhaidat, S. Exploring deep learning-based visual localization techniques for uavs in gps-denied environments. IEEE Access 2024, 12, 113049–113071. [Google Scholar] [CrossRef]
  14. Yao, L.; Ma, L.; Du, J.; Jiao, G.; Mang, X.; Sun, Z. Application and Practice of “Three-Dimensional Inspection + Centralized Monitoring” in Transmission Line Operation and Maintenance. Rural. Electrif. 2025, 1–7. [Google Scholar] [CrossRef]
  15. Tan, B.; Hai, B.; Liu, Q. Construction and Application of an Integrated Smart Inspection System for Primary and Distribution Networks. China Electr. Power Enterp. Manag. 2025, 43, 58–60. [Google Scholar]
  16. Zhao, J. Research on Remote Monitoring of Gear Reducer External Oil-Cooling Device Integrated with Multi-sensor Data. Mech. Ind. Stand. Qual. 2025, 50, 33–36. [Google Scholar]
  17. Xu, X.; Zhu, Y.; Yang, B. Design of Distribution Network Temperature Measurement System Based on ZigBee Technology. Telecom World 2015, 32, 214. [Google Scholar]
  18. Liu, P.; Liu, R.; Sheng, H. Design of a Substation Operation Fault Maintenance System Based on Wireless Communication Technology. Electr. Technol. Econ. 2025, 357–359+368. [Google Scholar]
  19. Gan, X.; Geng, X.; Xiong, Z.; Wu, Z.; Du, S.; Gao, Y.; Guo, Y. Application of 5G communication technology on intelligent inspection in 750 kV substation. In Journal of Physics: Conference Series; IOP Publishing: Bristol, UK, 2021; Volume 1983, p. 012089. [Google Scholar]
  20. Zhao, S.; Yin, Y.; Fan, Y. Enhancing Efficiency and Reliability with 5G Digital Twin Technology in Power Substations. In International Conference on Information Processing and Network Provisioning; Springer: Singapore, 2024; pp. 302–313. [Google Scholar]
  21. Cai, D. Research and Implementation of Transmission Line Foreign-Object Inspection System Based on Improved YOLOv8n. Master’s Thesis, Northeast Agricultural University, Harbin, China, 2025. [Google Scholar] [CrossRef]
  22. Sun, Y. Research and Design of Substation Electrical Equipment Thermal Fault Inspection System Based on Improved YOLOv8s. Master’s Thesis, Northeast Agricultural University, Harbin, China, 2025. [Google Scholar] [CrossRef]
  23. Cheng, Y.; Liu, D. AdIn-DETR: Adapting detection transformer for end-to-end real-time power line insulator defect detection. IEEE Trans. Instrum. Meas. 2024, 73, 3528511. [Google Scholar] [CrossRef]
  24. Wang, X.; Yang, T.; Zou, Y. Enhancing grid reliability through advanced insulator defect identification. PLoS ONE 2024, 19, e0307684. [Google Scholar] [CrossRef]
  25. Xie, Z.; Dong, C.; Zhang, K.; Wang, J.; Xiao, Y.; Guo, X.; Zhao, Z.; Shi, C.; Zhao, W. Power-DETR: End-to-end power line defect components detection based on contrastive denoising and hybrid label assignment. IET Gener. Transm. Distrib. 2024, 18, 3264–3277. [Google Scholar] [CrossRef]
  26. Wei, Y.; Zhang, J. Application and Practice of a Beidou-Based Positioning Inspection Management System for Substation Equipment. Rural. Power Manag. 2025, 44–46. [Google Scholar]
  27. Adday, G.H.; Subramaniam, S.K.; Zukarnain, Z.A.; Samian, N. Fault tolerance structures in wireless sensor networks (WSNs): Survey, classification, and future directions. Sensors 2022, 22, 6041. [Google Scholar] [CrossRef]
  28. Jun, E.L.T.; Tham, M.L.; Kwan, B.H. A Comparative Analysis of RT-DETR and YOLOv8 for Urban Zone Aerial Object Detection. In Proceedings of the 2024 IEEE International Conference on Automatic Control and Intelligent Systems (I2CACIS); IEEE: New York, NY, USA, 2024; pp. 340–345. [Google Scholar]
  29. Marri, M.S.; Monica, P. Hybrid CNN-Transformer and YOLOv8-Based Robust Real-Time Object Detection for Autonomous Vehicles. In Proceedings of the 2025 Innovations in Power and Advanced Computing Technologies (i-PACT); IEEE: New York, NY, USA, 2025; pp. 1–7. [Google Scholar]
  30. Nimma, D.; Al-Omari, O.; Pradhan, R.; Ulmas, Z.; Krishna, R.V.V.; El-Ebiary, T.Y.A.B.; Rao, V.S. Object detection in real-time video surveillance using attention based transformer-YOLOv8 model. Alex. Eng. J. 2025, 118, 482–495. [Google Scholar] [CrossRef]
Figure 1. Four-Layer Architecture of the Intelligent Inspection System.
Electronics 15 00827 g001
Figure 2. Schematic of the intelligent inspection operation in the power system.
Electronics 15 00827 g002
Figure 3. Architecture of the Multi-Source Information Fusion Algorithm.
Electronics 15 00827 g003
Figure 4. YOLOv8 model testing results.
Electronics 15 00827 g004
Table 1. Baseline Sensor Weight Assignment for Different Fault Types.
Fault TypeVisual WeightInfrared WeightAcoustic WeightDominant Feature Source
Surface water/Leakage0.70.20.1Visual Features
Overheating of key equipment0.20.70.1Infrared Features
Pump-bearing wear0.60.10.3Visual Features
Partial discharge0.30.10.6Acoustic Features
Table 2. YOLOv8 Model Performance under Five-Fold Cross-Validation.
FoldPrecisionRecallmAP50
10.9730.9710.976
20.9700.9690.974
30.9720.9680.975
40.9690.9700.976
50.9700.9670.973
Mean0.9710.9690.975
Std. Dev.0.00160.00160.0013
Table 3. Performance evaluation results of the intelligent inspection system.
Fault TypeFDR (%)DAR (%)
Surface water/Leakage99.298.5
Overheating of key equipment98.397.8
Pump-bearing wear97.997.4
Partial discharge96.695.5
Normal operation99.799.3
Disclaimer/Publisher’s Note: The statements, opinions and data contained in all publications are solely those of the individual author(s) and contributor(s) and not of MDPI and/or the editor(s). MDPI and/or the editor(s) disclaim responsibility for any injury to people or property resulting from any ideas, methods, instructions or products referred to in the content.