Article

A Wideband Oscillation Classification Method Based on Multimodal Feature Fusion

College of Electrical Engineering, Sichuan University, Chengdu 610065, China
*
Author to whom correspondence should be addressed.
Electronics 2026, 15(3), 682; https://doi.org/10.3390/electronics15030682
Submission received: 19 January 2026 / Revised: 30 January 2026 / Accepted: 31 January 2026 / Published: 4 February 2026

Abstract

With the increasing penetration of renewable energy sources and power-electronic devices, modern power systems exhibit pronounced wideband oscillation characteristics with large frequency spans, strong modal coupling, and significant time-varying behaviors. Accurate identification and classification of wideband oscillation patterns have therefore become critical challenges for ensuring the secure and stable operation of “dual-high” power systems. Existing methods based on signal processing or single-modality deep-learning models often fail to fully exploit the complementary information embedded in heterogeneous data representations, resulting in limited performance when dealing with complex oscillation patterns.To address these challenges, this paper proposes a multimodal attention-based fusion network for wideband oscillation classification. A dual-branch deep-learning architecture is developed to process Gramian Angular Difference Field images and raw time-series signals in parallel, enabling collaborative extraction of global structural features and local temporal dynamics. An improved Inception module is employed in the image branch to enhance multi-scale spatial feature representation, while a gated recurrent unit network is utilized in the time-series branch to model dynamic evolution characteristics. Furthermore, an attention-based fusion mechanism is introduced to adaptively learn the relative importance of different modalities and perform dynamic feature aggregation. Extensive experiments are conducted using a dataset constructed from mathematical models and engineering-oriented simulations. Comparative studies and ablation studies demonstrate that the proposed method significantly outperforms conventional signal-processing-based approaches and single-modality deep-learning models in terms of classification accuracy, robustness, and generalization capability. The results confirm the effectiveness of multimodal feature fusion and attention mechanisms for accurate wideband oscillation classification, providing a promising solution for advanced power system monitoring and analysis.

1. Introduction

With the rapid development of “dual-high” power systems, characterized by a high penetration of renewable energy sources and power electronic devices, the dynamic characteristics of traditional power systems are undergoing significant changes [1,2]. The large-scale integration of renewable energy and the widespread deployment of power electronic equipment have introduced new oscillatory behaviors in power systems. These behaviors exhibit multiple time scales, strong nonlinearity, and wideband frequency distributions. Traditional power systems, which were once dominated by synchronous generators, are now being reshaped by power electronic devices with fast response times but low inertia. As a result, wideband oscillations have become more prominent, posing a critical challenge to the secure and stable operation of modern power systems [3,4].
Wideband oscillations typically span a broad frequency range, encompassing low-frequency, subsynchronous, and supersynchronous bands, as well as medium- and high-frequency regions. They often exhibit complex behaviors such as multimodal coupling and time-varying propagation. These characteristics significantly increase the difficulty of accurately identifying and classifying oscillations in real-time [5,6].
Conventional methods for wideband oscillation analysis primarily rely on signal processing techniques and shallow machine-learning models [7,8,9]. Typical approaches include extracting frequency-domain or time–frequency features using methods such as the Fast Fourier Transform (FFT), Wavelet Transform (WT), and Matrix Pencil (MP). These features are then used for pattern recognition with classifiers like Random Forest (RF), Support Vector Machine (SVM), and k-Nearest Neighbor (kNN) [10,11]. Although these methods improve analysis efficiency to some extent, they have notable limitations. First, handcrafted feature design based on prior knowledge struggles to fully capture the nonlinear and non-stationary nature of wideband oscillation signals. Second, shallow models have limited representation capabilities, making them insufficient for modeling the complex oscillation patterns with strong coupling and multimodal characteristics. As a result, these methods often lead to suboptimal classification accuracy and generalization performance. Moreover, most existing techniques are designed for specific oscillation scenarios or frequency bands, limiting their adaptability to the rapidly evolving and uncertain oscillation patterns in dual-high power systems [12,13].
In recent years, deep learning has shown great potential in power system oscillation analysis due to its ability to automatically learn features and create hierarchical representations [14,15]. End-to-end oscillation detection and classification methods based on convolutional neural networks (CNNs), recurrent neural networks (RNNs), and their variants have offered new insights into wideband oscillation identification [16,17]. However, most existing studies focus on single-modality data analysis, such as modeling one-dimensional time-series signals or recognizing two-dimensional images generated from Gramian Angular Fields (GAF) [18,19]. These approaches fail to fully leverage the complementary information from heterogeneous data modalities, limiting their ability to distinguish complex oscillation patterns. Specifically, one-dimensional CNN-based models struggle to capture correlations across multiple time scales, while two-dimensional CNN-based models, although able to leverage global structural information, may overlook fine-grained temporal dynamics inherent in the original signals [20,21]. Therefore, effectively integrating time-series and image features has become a critical issue in improving wideband oscillation classification performance.
To address these challenges, this paper proposes a wideband oscillation classification method based on multimodal feature fusion and attention mechanisms. We construct a dual-channel deep-learning architecture to extract deep features from both image and time-series modalities in parallel. On one hand, inspired by the idea of mapping one-dimensional oscillation signals into two-dimensional images, we use the Gramian Angular Difference Field (GADF) to encode oscillation time series. This approach preserves temporal dependencies while enhancing the discriminability between oscillation modes. On the other hand, a gated recurrent unit (GRU) network is used to model raw time-series signals, capturing dynamic evolution patterns and local temporal characteristics. Additionally, an attention-based fusion module is introduced to adaptively learn the importance weights of different modality features. This enables complementary enhancement and redundancy suppression across modalities, significantly improving the recognition capability and classification accuracy for complex wideband oscillation patterns.
The main contributions of this paper are summarized as follows:
  • To address the wide frequency span, strong modal coupling, and pronounced time-varying characteristics of wideband oscillations in “dual-high” power systems, a dual-modality feature-fusion classification framework is proposed. This framework systematically integrates time-series signals and image representations for wideband oscillation classification, enabling unified modeling of multi-frequency and multi-pattern oscillatory features.
  • A parallel dual-branch deep-learning network is developed to process GADF images and raw time-series signals simultaneously. By exploiting the complementary strengths of the image modality in capturing global structures and frequency-distribution patterns and the time-series modality in characterizing local dynamics and temporal evolution, the proposed network achieves collaborative extraction of multi-dimensional and multi-scale features of wideband oscillations.
  • In the image branch, a structurally optimized Inception module is introduced, in which multi-scale convolutional kernels (1 × 1, 3 × 3, 5 × 5, and a 7 × 7 receptive field) are employed to enhance the modeling of multi-scale spatial patterns and long-term trend information. Moreover, an attention-driven fusion mechanism is designed to adaptively adjust the modality-wise feature weights for different oscillation patterns, thereby improving the representation capability for complex oscillation forms and enhancing the interpretability of model decisions.
The remainder of this paper is organized as follows. Section 2 introduces the mathematical modeling of wideband oscillations and the GADF-based signal-to-image representation. Section 3 details the proposed multimodal attention-based fusion network, including the overall architecture, the image feature extraction module, the time-series feature extraction module, and the attention-based fusion mechanism. Section 4 presents the experimental settings and comprehensive comparative results, including ablation studies and validation using measured data. Finally, Section 5 concludes the paper and discusses future research directions.

2. Mathematical Modeling and Image Representation of Wideband Oscillation Signals

2.1. Mathematical Model of Wideband Oscillations

Single-mode oscillations in power systems usually refer to quasi-periodic signal components that appear in an electrical state variable (such as voltage, current, or power) and vary over time at a specific frequency (deviating from the system fundamental frequency). Their dynamic characteristics mainly depend on system damping: when the damping is positive, the oscillation amplitude exhibits a divergent trend; when the damping is negative, the oscillation amplitude exhibits a decaying trend. Therefore, the corresponding time-domain signal can be represented as:
x ( t ) = A e σ t cos 2 π f t + φ
where A, σ , f, and φ denote the amplitude, damping coefficient, frequency, and initial phase of the wideband oscillation signal, respectively.
With the rapid development of “dual-high” power systems—characterized by a high penetration of renewable energy and a high proportion of power-electronic devices—the system dynamic response exhibits pronounced multi-time-scale behavior. When disturbances occur, devices and control loops with different time constants may excite oscillatory modes across different frequency ranges. These modes do not exist independently; rather, nonlinear interactions among them may induce new oscillation patterns, leading to the coexistence of oscillatory components with multiple frequencies and diverse characteristics in the grid. Consequently, wideband oscillations are essentially complex dynamic processes featuring multi-frequency and multi-modal coupling, whose spectral contents may span a broad range, covering low-frequency oscillations (0.2–2.5 Hz), subsynchronous oscillations (2.5–49.5 Hz), supersynchronous oscillations (50.5–100 Hz), and extending to medium- and high-frequency oscillations (100–2500 Hz).
To accurately characterize these complexities, the mathematical model of wideband oscillations should be able to represent the superposition of multiple oscillatory components. An effective approach is to linearly combine several coexisting single-mode oscillatory components with different frequencies, thereby constructing a general mathematical model for wideband oscillation signals, which can be expressed as follows:
x ( t ) = ∑ k = 1 N A k e σ k t cos 2 π f k t + φ k
The multi-frequency nature of wideband oscillation signals makes them complex in both the time and frequency domains. In power systems, oscillatory signals may contain multiple frequency components, especially under the influence of high-penetration renewable energy and power electronic devices. Therefore, deep-learning models need to capture both the time-domain and frequency-domain features of the signals simultaneously, enabling effective extraction of the multi-frequency information within these signals.

2.2. Signal Image Representation via Gramian Angular Field

The Gramian Angular Field (GAF) is a technique that transforms one-dimensional time-series data into two-dimensional images. Its primary goal is to preserve, as much as possible, both the temporal dependencies and the numerical characteristics of the original sequence in the generated image. Specifically, temporal dependencies are encoded by the relative spatial arrangement of pixels, whereas numerical information is represented by pixel intensity (or color). The GAF construction typically involves three key steps: time-series normalization, polar-coordinate encoding, and Gramian matrix generation.
Given a discrete time series of length n, X = { x 1 , x 2 , … , x n } , the amplitudes are first normalized to [ 0 , 1 ] to satisfy the domain requirements of subsequent inverse trigonometric mappings. In this work, min–max normalization is employed:
x ˜ i = x i − min ( X ) max ( X ) − min ( X )
where, x ˜ i denotes the normalized value. This normalization step mitigates absolute amplitude variations, enabling signals with different scales to be transformed under a unified reference while retaining the relative waveform shape information.
Subsequently, the normalized sequence X ˜ = { x ˜ 1 , x ˜ 2 , … , x ˜ n } is mapped into a polar coordinate system, where numerical values and temporal ordering are encoded as the angle and radius, respectively.
Angular encoding (numerical information): The normalized value x ˜ i is mapped to a polar angle ϕ i via the inverse cosine function:
ϕ i = arccos ( x ˜ i ) , x ˜ i ∈ [ 0 , 1 ] , ϕ i ∈ 0 , π 2
This transformation is strictly monotonic, establishing a one-to-one correspondence between signal amplitude and angular representation, where larger amplitudes correspond to smaller angles.
Radial encoding (temporal information): To preserve temporal ordering, the time index i is linearly normalized and assigned as the radius:
r i = i n
In practical GAF implementations, the radial component is often fixed to a constant value to simplify computation and emphasize the numerical structure encoded by angular relationships. Accordingly, each point ( i , x i ) in the original sequence is mapped into the polar coordinate space as ( r i , ϕ i ) .
Based on the set of polar-coordinate points { ( r i , ϕ i ) } i = 1 n , a Gramian matrix of size n × n is constructed by computing trigonometric summations or differences between all point pairs, resulting in the final two-dimensional GAF image. The ( i , j ) -th element characterizes the numerical relationship between time instants t i and t j .
The Gramian Angular Summation Field (GASF) is defined as:
G A S F i j = cos ( ϕ i + ϕ j )
By applying trigonometric identities, the GASF can be equivalently expressed as:
G A S F i j = x ˜ i x ˜ j − 1 − x ˜ i 2 1 − x ˜ j 2
This expression can be interpreted as an inner product in an expanded feature space, which combines the multiplicative interaction term of the normalized values and a modulation term derived from second-order statistics, thereby emphasizing the global correlation characteristics and energy distribution of the signal.
The Gramian Angular Difference Field (GADF) encodes the sine of the angular difference between two points as
G A D F i j = sin ( ϕ i − ϕ j )
Accordingly, an equivalent expression can be derived as
G A D F i j = 1 − x ˜ i 2 x ˜ j − x ˜ i 1 − x ˜ j 2
Compared to the summation and cosine forms, the angular difference form emphasizes the relative variations between sample points and the phase difference information reflected by them. The resulting GASF or GADF matrix can be viewed as a single-channel grayscale image, where the row and column indices correspond to the original time axis, and the pixel values encode the numerical relationship between the corresponding time points. This method of fusing the global structure and local dynamics of the time series into a single image effectively captures the temporal characteristics of the signal. Although both GASF and GADF use angular information to encode time-series data, they differ significantly in their sensitivity to phase changes. GASF emphasizes the global correlation and energy distribution of the signal by computing the cosine of the sum of the angles, making it more suitable for capturing overall trends and smoothness. In contrast, GADF focuses on the relative variations between samples and phase change information by computing the sine of the angular difference, making it more sensitive to rapid transitions, waveform edges, and phase changes. GADF images not only retain the time-series information of the signal but also encode the frequency characteristics of the signal through phase differences. Specifically, by calculating the phase difference between each pair of time points, GADF images reveal the frequency components and periodic variations of the signal, allowing deep-learning models to effectively extract multi-frequency features from GADF images.
In contrast, Markov Transition Field (MTF) and Recurrence Plot (RP), while offering some form of time-series signal representation, present certain limitations when processing wideband oscillation signals. MTF captures system dynamics by analyzing state transition probabilities, revealing long-term behavior and transition patterns of the system. However, when applied to complex wideband oscillations characterized by multi-frequency components, strong nonlinearity, and time-varying characteristics, MTF may fail to capture subtle phase variations and frequency components, ultimately affecting pattern recognition accuracy. On the other hand, RP analyzes periodic features by revealing the recurrence of time-series signals. While it is effective at capturing periodic and quasi-periodic characteristics, RP produces complex images that are challenging to interpret directly for classification tasks, especially when dealing with multi-frequency coupling and rapid changes in nonlinear signals. This complexity makes feature extraction and classification more difficult.
Therefore, GADF images not only preserve the time-series information of the signal but also reveal frequency components through phase differences, making them more effective at capturing the multi-frequency characteristics and local dynamics of wideband oscillations. Given that the features for oscillation mode classification are closely related to phase differences and waveform morphology, GADF was selected as the image representation method for subsequent analysis, significantly improving classification accuracy and robustness.

3. Multimodal Attention-Based Fusion Network

3.1. Overall Architecture

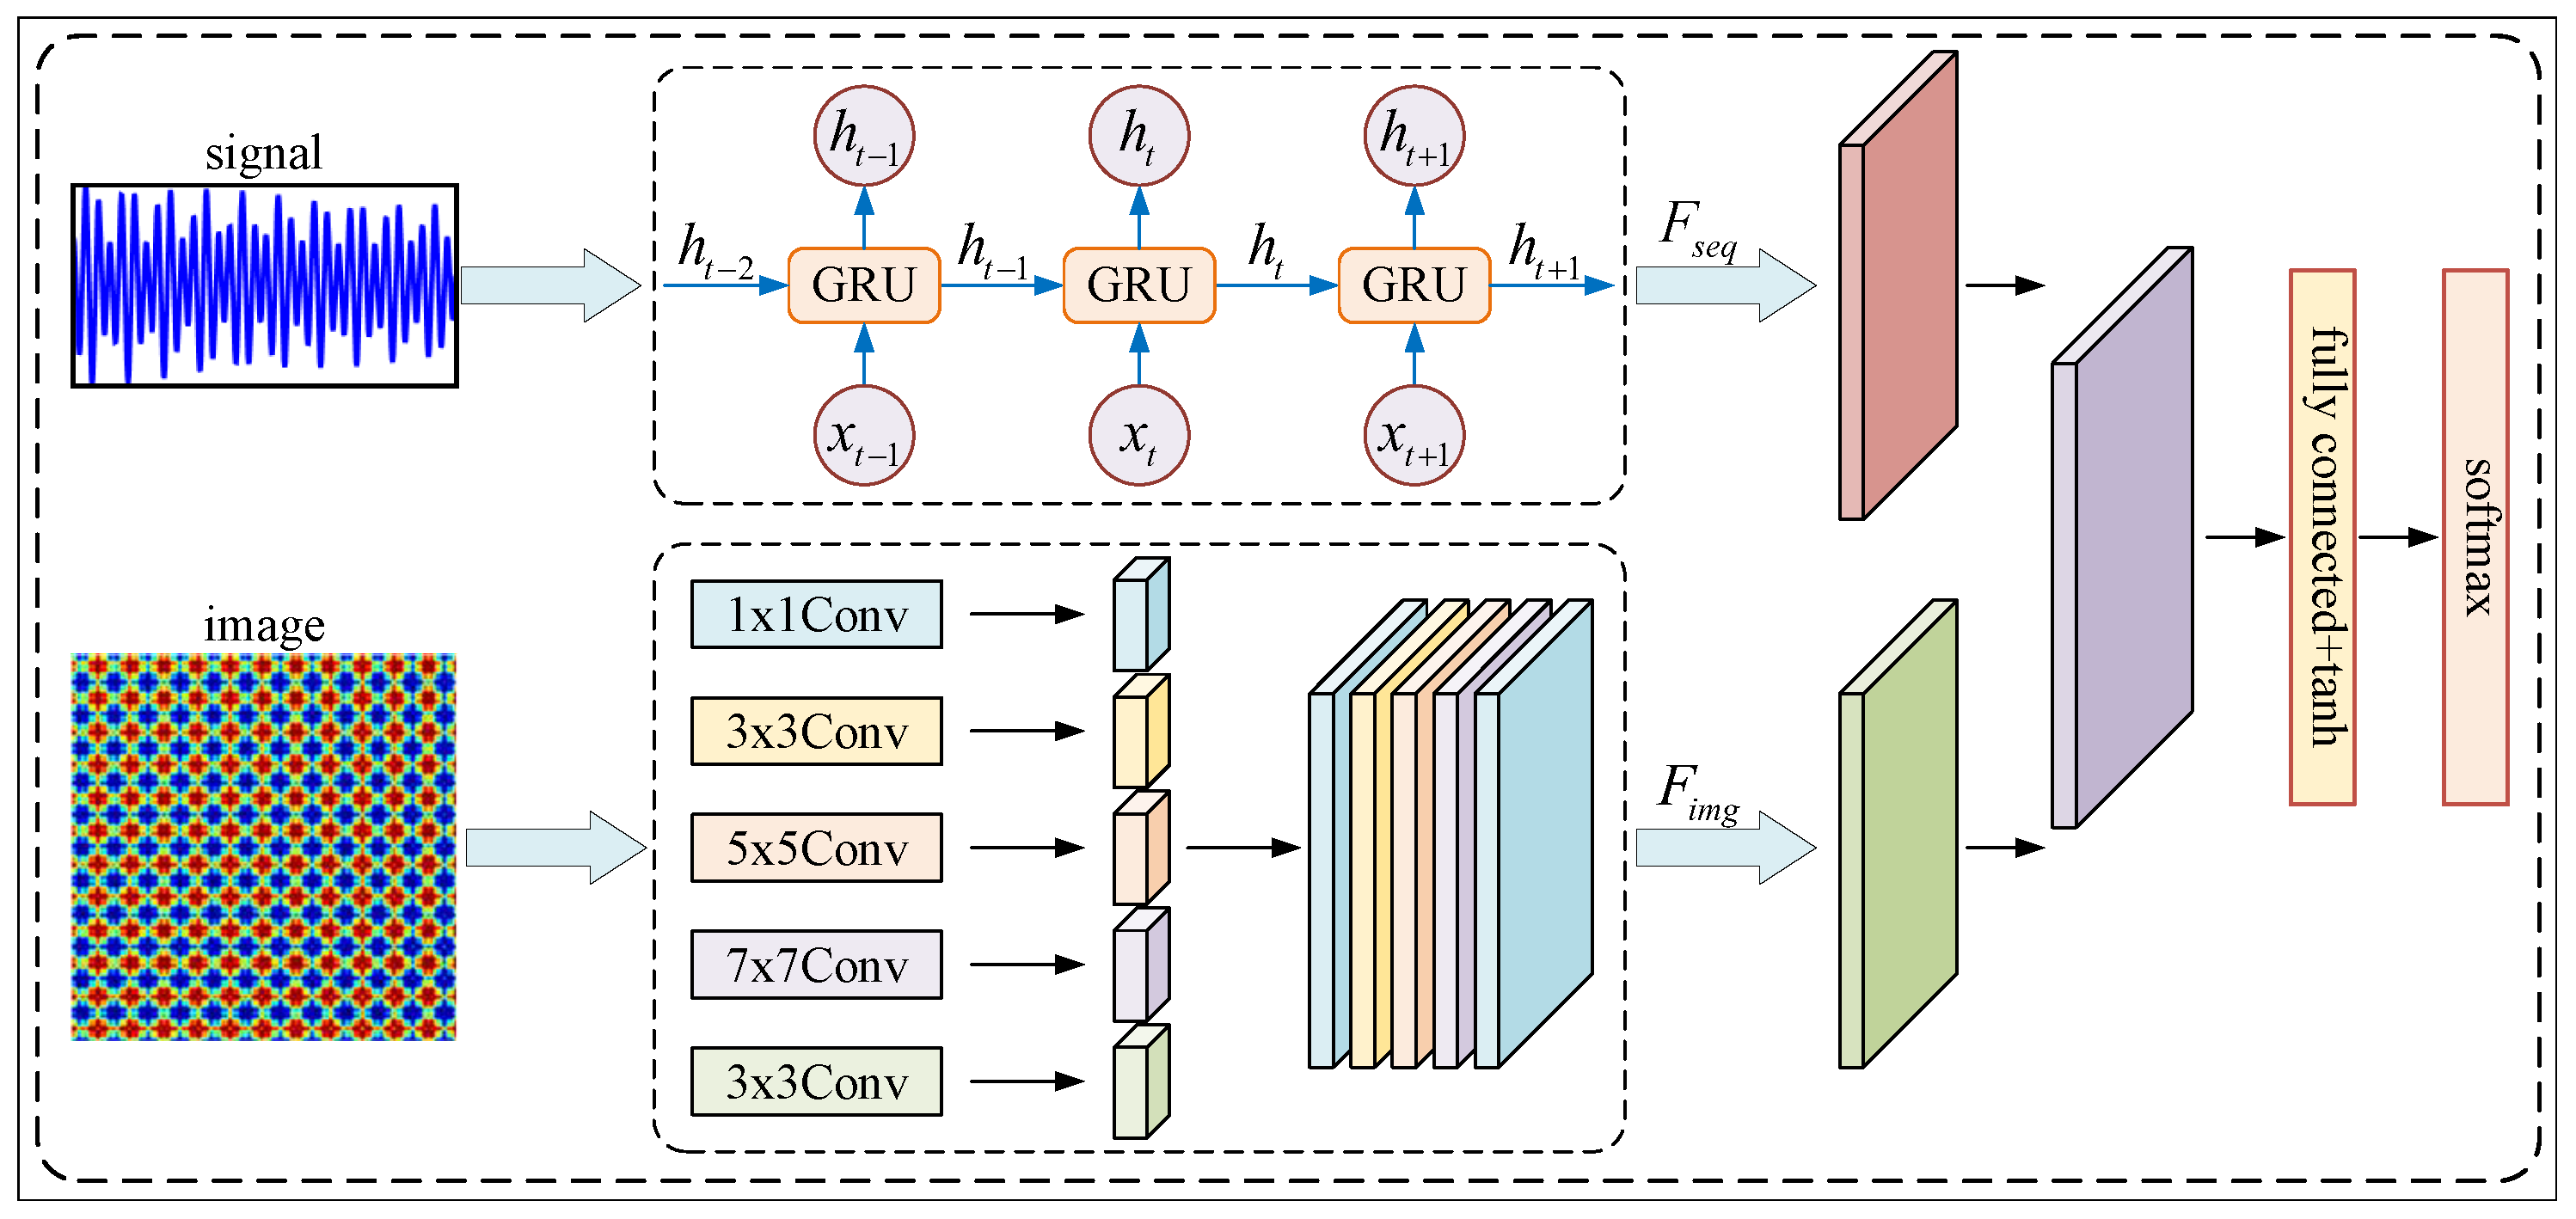
To address the multi-scale, non-stationary characteristics of wideband oscillation signals and the complex spatiotemporal coupling in power system operational data, this paper proposes a multimodal attention-based fusion network for wideband oscillation classification that is capable of adapting to the multi-frequency nature of the signals. The model adopts a dual-branch parallel architecture, where the GADF images generated by the Gramian Angular Difference Field (GADF) transformation and the raw time-series signals are processed independently for feature extraction. This architecture allows the model to capture both the time-domain and frequency-domain characteristics of the signals, enabling effective extraction of multi-frequency information. The features are then dynamically and adaptively aggregated through an attention-based fusion mechanism to enhance the model’s ability to represent complex oscillatory patterns. The overall structure is illustrated in Figure 1, with detailed parameters presented in Table 1.
The model primarily consists of the following three core modules:
  • Image Feature Extraction Module: Built on an improved Inception network, this module processes GADF images. By using parallel multi-scale convolutional kernels, it extracts texture, structure, and spatial distribution features from the images, effectively capturing the different frequency components of the oscillation signals in the 2D representation.
  • Time-Series Feature Extraction Module: Using a Gated Recurrent Unit (GRU) network, this module performs progressive sequential modeling of the raw one-dimensional oscillation signals, effectively capturing the local dynamics (such as high-frequency oscillations) and long-range dependencies (such as low-frequency oscillations) of the signals, thereby characterizing the time-domain evolution of the oscillation signals.
  • Attention Fusion Module: A dynamic feature fusion strategy based on attention mechanisms is designed, where learnable importance weights are assigned to features from different modalities. This strengthens the complementary information across modalities while suppressing redundant features, thereby significantly enhancing the model’s ability to represent and classify complex oscillation patterns.

3.2. Image Feature Extraction

The Inception architecture, originally proposed by Google [22], is designed to enhance the multi-scale feature extraction capability of deep convolutional neural networks. Unlike conventional CNNs, Inception employs parallel convolutional kernels of different sizes to simultaneously capture features at multiple spatial scales.
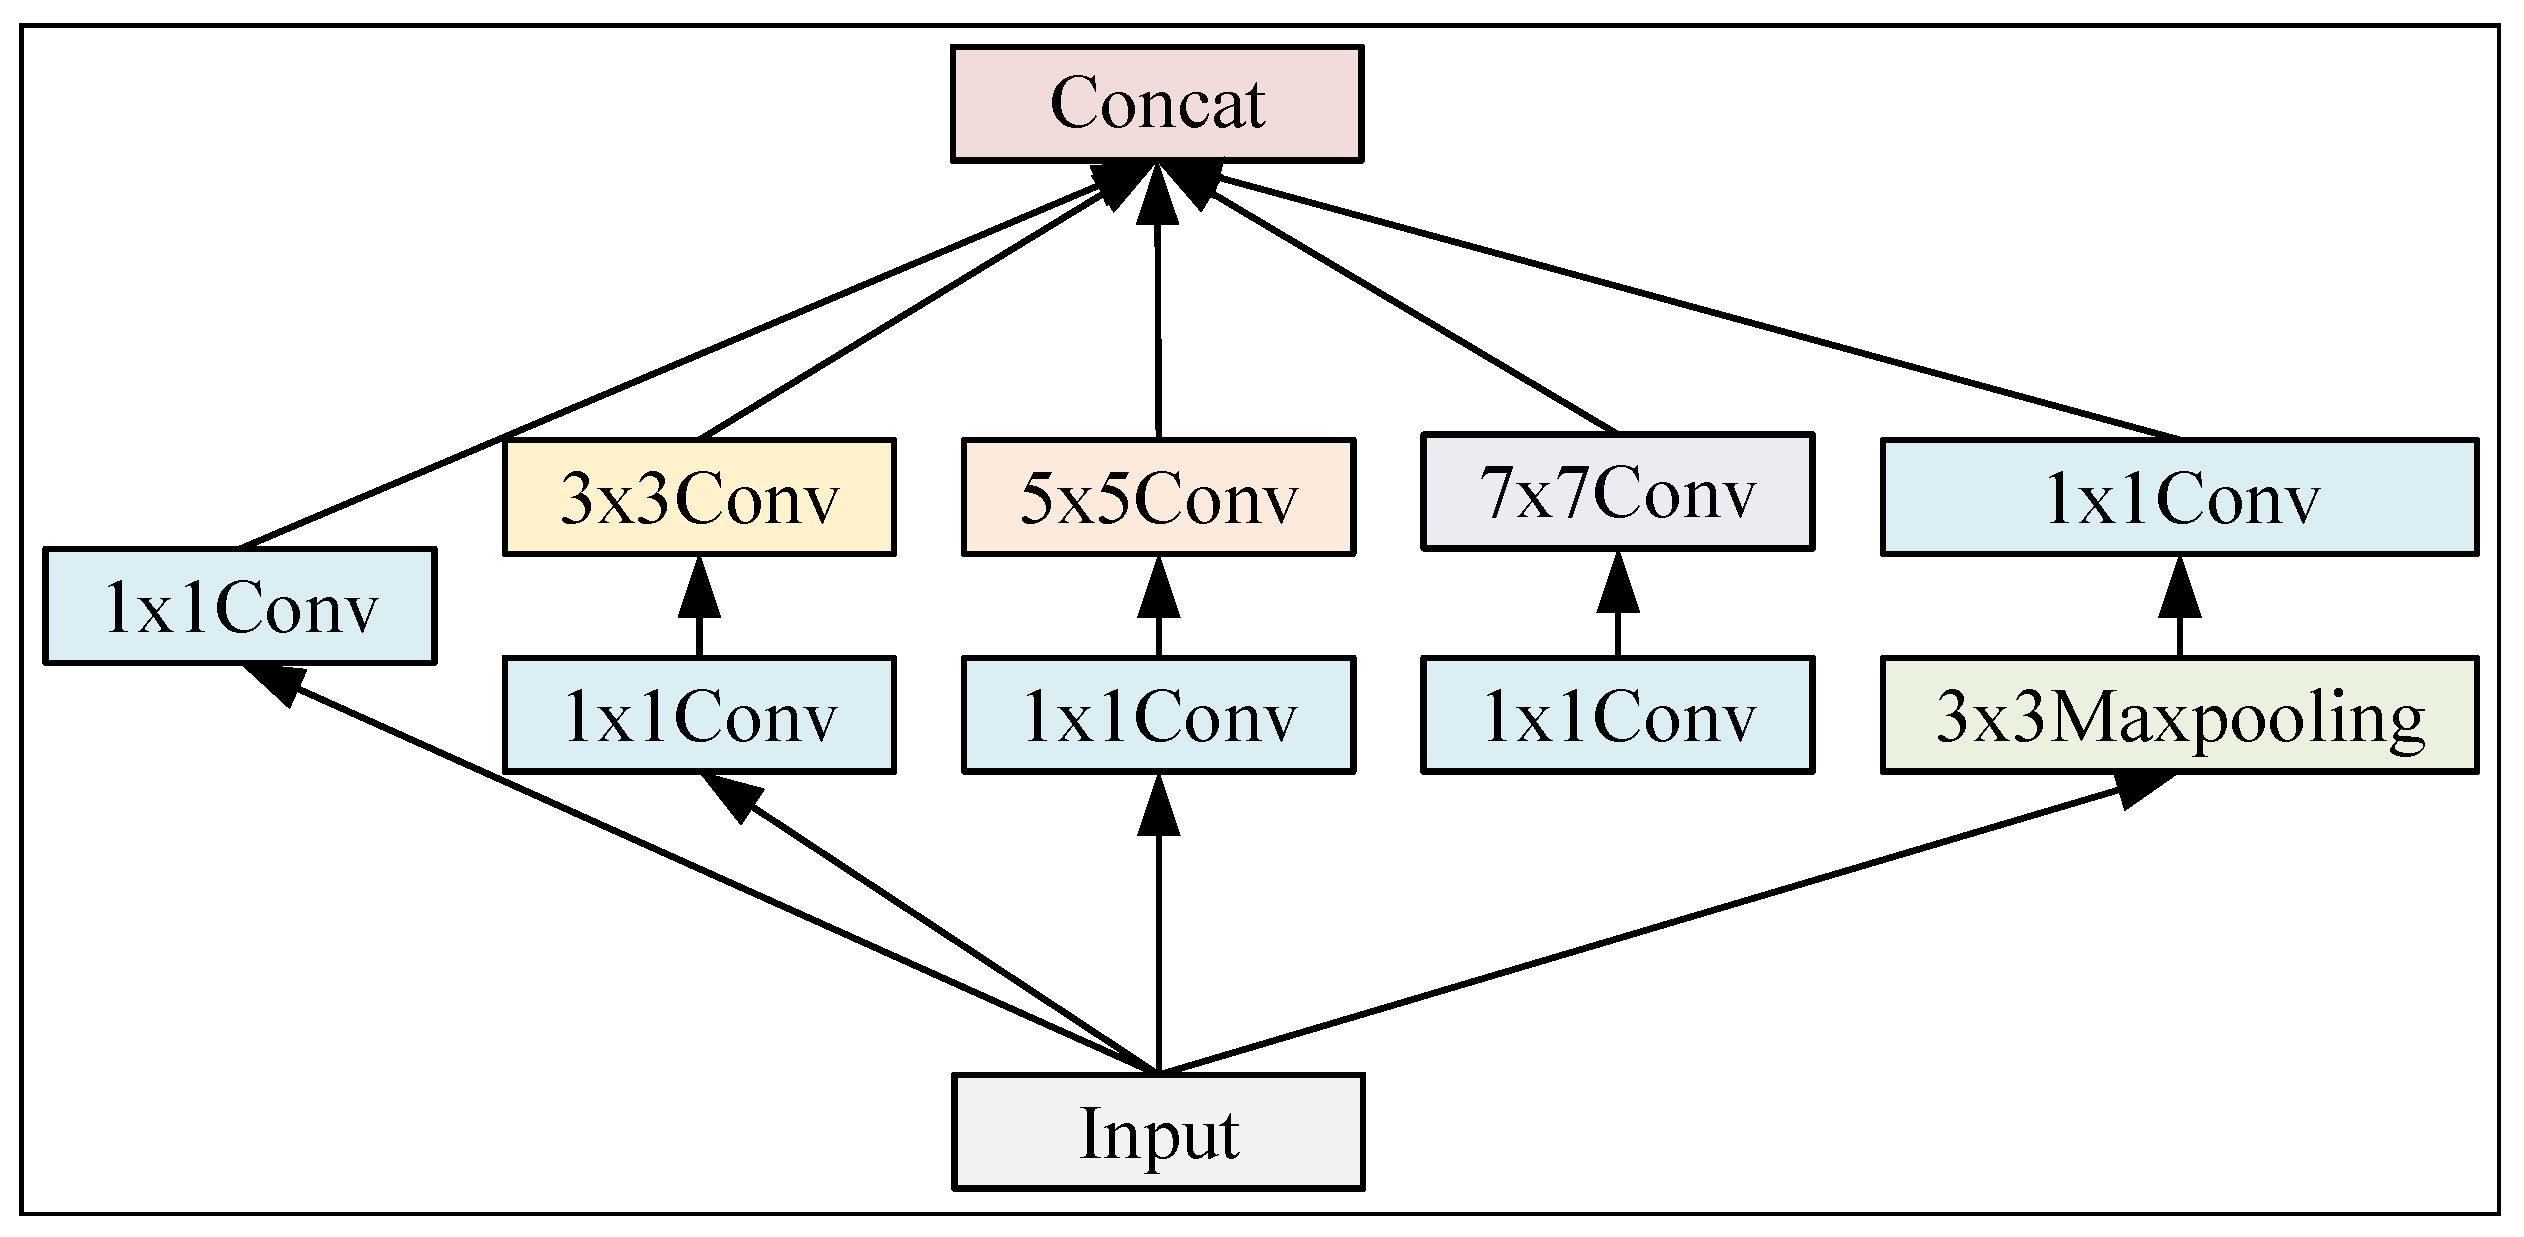
In the proposed framework, the image branch adopts the Inception architecture to process GADF image representations. Specifically, 1 × 1 convolutions are used for local texture extraction and channel dimensionality reduction, 3 × 3 convolutions capture medium-scale spatial patterns, and 5 × 5 convolutions extract broader global texture features. This multi-scale parallel design enables comprehensive characterization of oscillation patterns encoded in GADF images.
Given the multi-scale, nonlinear, and complex texture characteristics of GADF-transformed wideband oscillation images, further structural optimization is introduced. A 7 × 7 convolutional kernel is incorporated into the Inception architecture to expand the spatial receptive field, thereby enhancing the model’s ability to capture low-frequency oscillation modes and long-term trend features, as illustrated in Figure 2.

3.3. Time-Series Feature Extraction

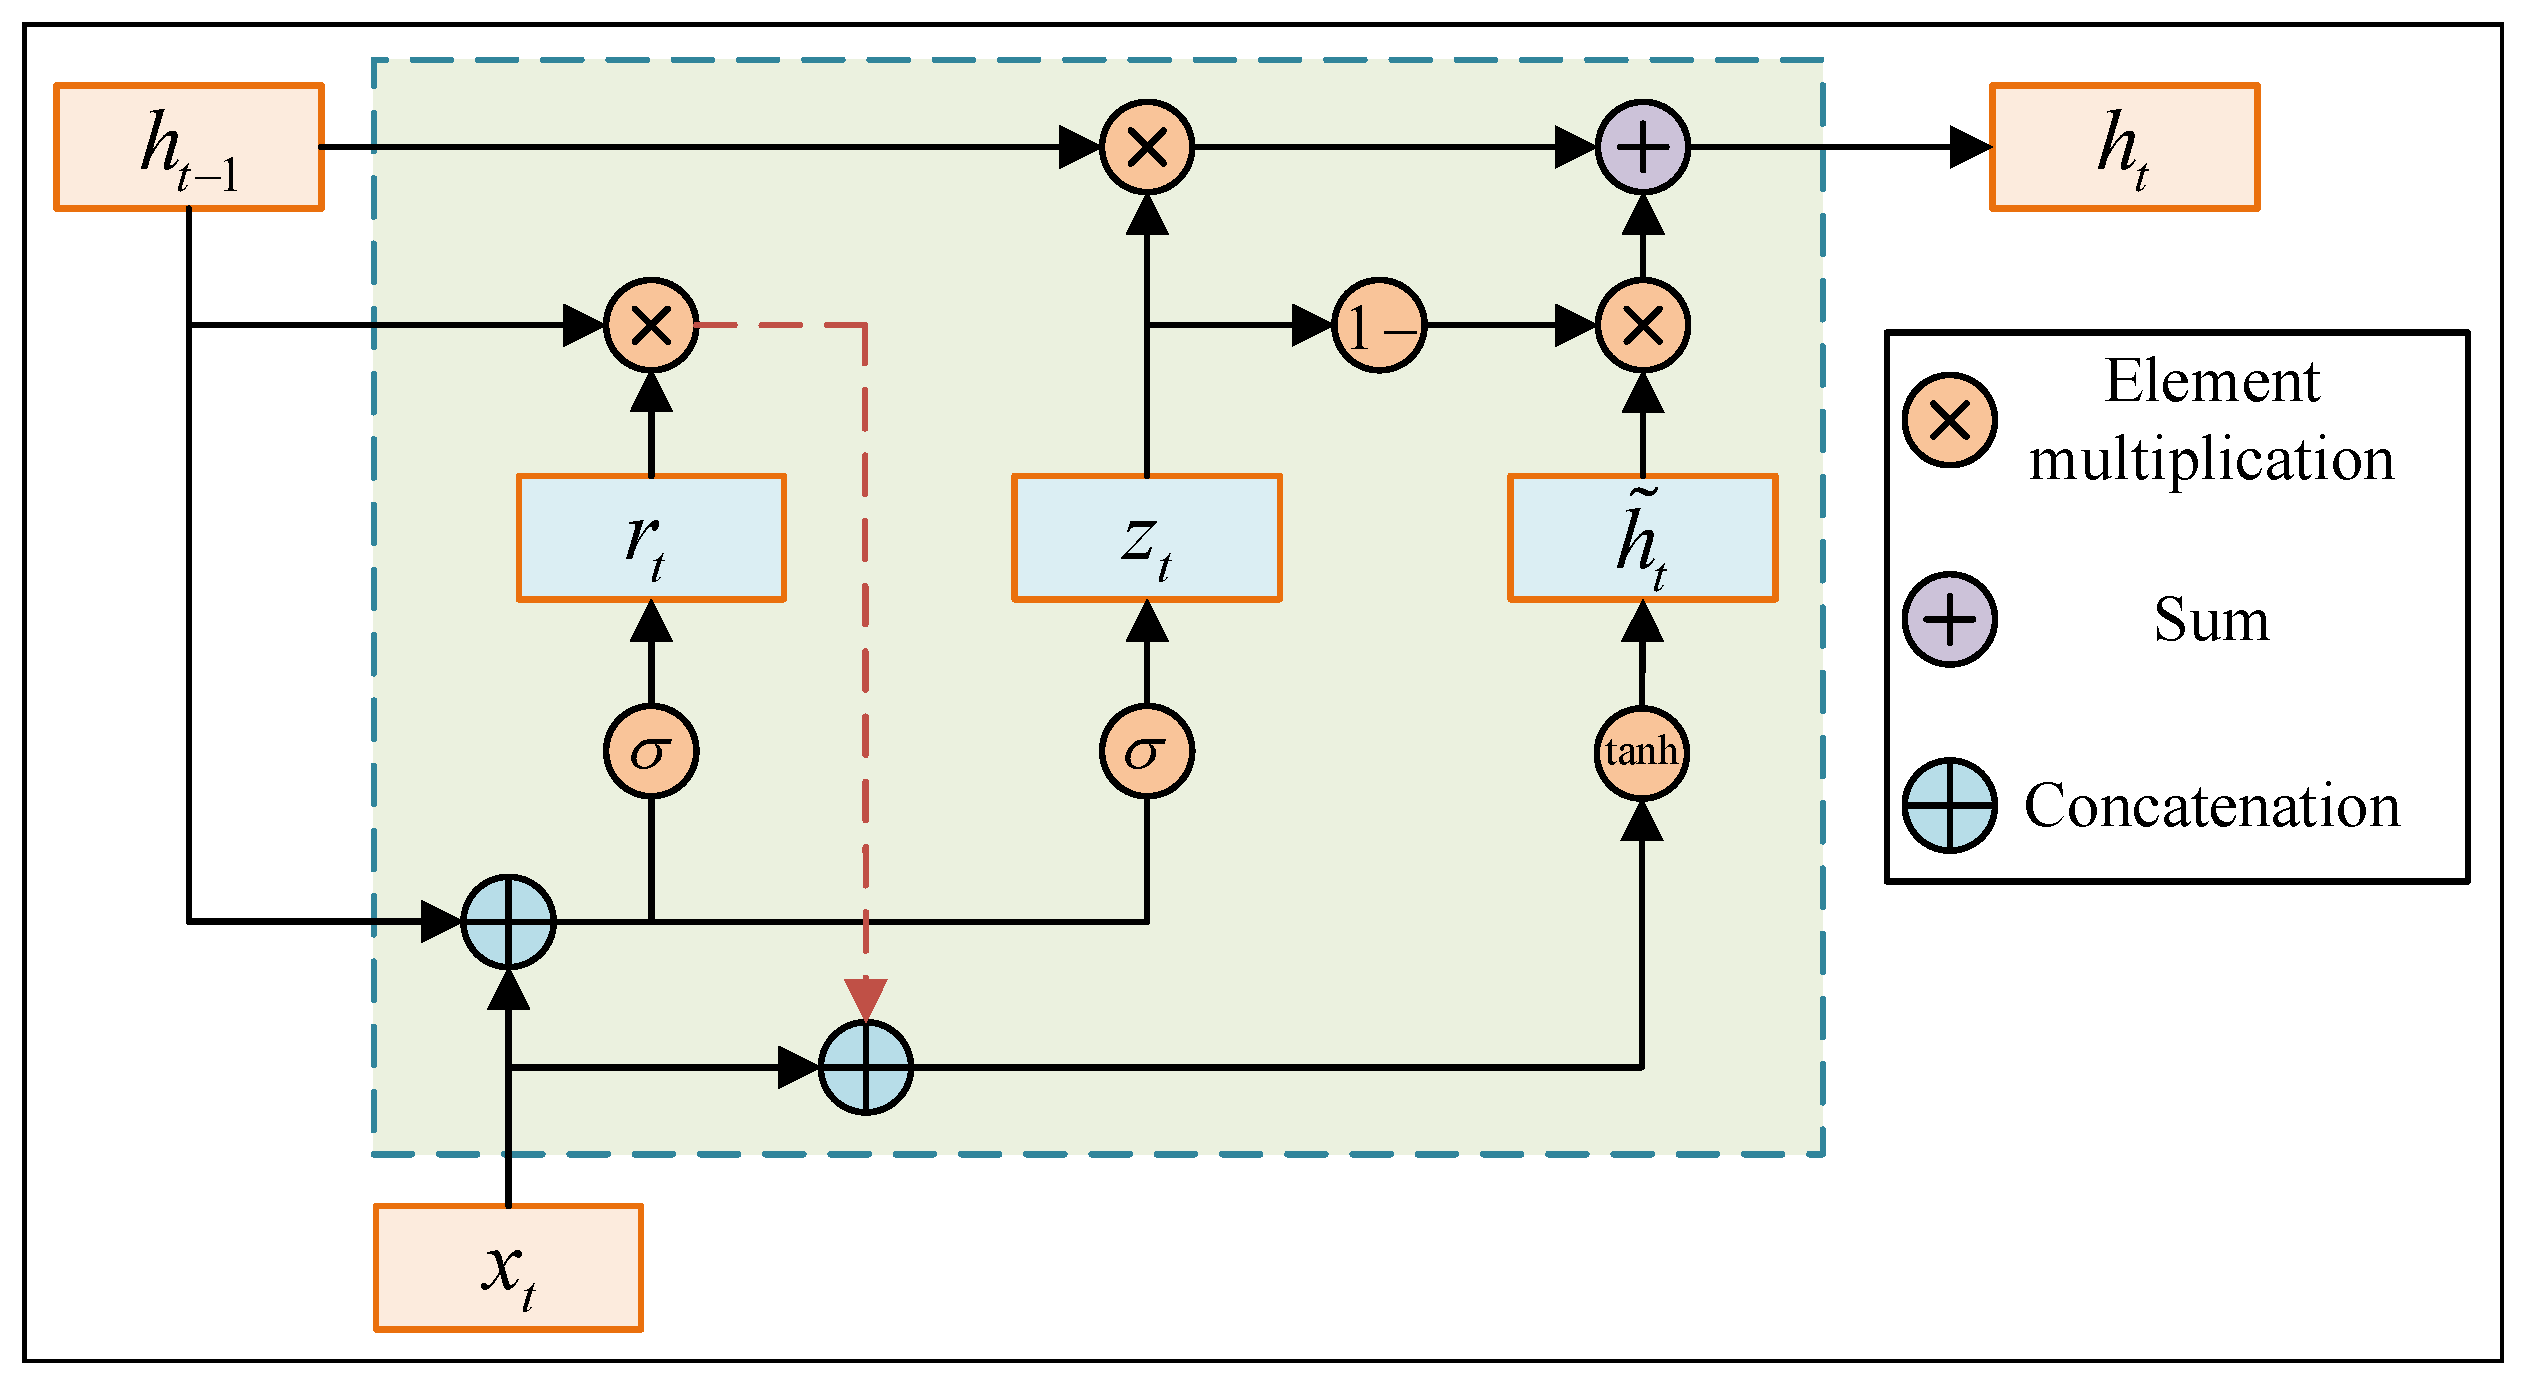
The Gated Recurrent Unit (GRU) is a recurrent neural network architecture designed for modeling sequential data [23]. Introduced by Cho et al., the GRU can be seen as a simplified variant of Long Short-Term Memory (LSTM) networks, aimed at reducing computational complexity while maintaining the ability to capture long-term dependencies. Compared to LSTM, GRU has fewer parameters, which makes it more efficient in terms of both memory and computation. This allows it to be a favorable choice when computational efficiency is a priority, without compromising performance. As shown in Figure 3, the GRU architecture is used in our model to efficiently handle sequential data while retaining the key advantages of recurrent architectures.
GRU employs gating mechanisms to regulate information flow and alleviate vanishing-gradient issues. Specifically, it consists of an update gate and a reset gate. Given the input x t and the previous hidden state h t − 1 , the two gates are defined as
z t = σ ( W z x t + U z h t − 1 + b z ) ,
r t = σ ( W r x t + U r h t − 1 + b r ) ,
where z t and r t denote the update and reset gates, respectively; W z , U z , b z and W r , U r , b r are trainable parameters; and σ ( · ) is the sigmoid activation function.
The reset gate modulates the contribution of historical information when forming the candidate hidden state:
h ˜ t = tanh W h x t + U h r t ⊙ h t − 1 + b h ,
where h ˜ t denotes the candidate hidden state, tanh ( · ) is the hyperbolic tangent function, and ⊙ represents element-wise multiplication.
Finally, the hidden state is updated via an adaptive interpolation controlled by the update gate:
h t = ( 1 − z t ) ⊙ h t − 1 + z t ⊙ h ˜ t .
A larger z t assigns more weight to the newly computed state h ˜ t , whereas a smaller z t preserves more information from h t − 1 .

3.4. Attention-Based Fusion Module

The attention-based fusion module is designed to dynamically assess the relative contributions of image features F i m g and time-series features F s e q to the classification task through a learnable attention mechanism. To facilitate effective cross-modality interaction, both modality-specific features are first projected into a shared latent space via linear transformations:
F i m g ′ = W i m g F i m g + b i m g , F s e q ′ = W s e q F s e q + b s e q .
Here, W i m g and W s e q denote the projection matrices, while b i m g and b s e q are the corresponding bias vectors.
The aligned features are subsequently concatenated and fed into a nonlinear mapping to compute intermediate attention activations:
A = tanh W a F i m g ′ , F s e q ′ + b a .
The final attention weights are obtained via softmax normalization:
α = softmax ( W α A + b α ) = [ α i m g , α s e q ] T .
Finally, the fused feature representation is computed as a weighted combination of the projected features:
F f u s e d = α i m g F i m g ′ + α s e q F s e q ′ .

4. Experimental Design and Results

4.1. Dataset Construction

To evaluate the performance of the proposed multimodal fusion-based classification method, all experimental datasets were generated on a unified high-performance computing platform. The platform is equipped with a 12th-generation Intel Core i7-12700K processor and an NVIDIA GeForce RTX 3090 GPU, which was utilized for GPU acceleration during model training, significantly reducing computation time. The total training time for the model was 1121.02 s (approximately 18.7 min), demonstrating the efficiency of the training process and its suitability for practical deployment. The software environment includes Python 3.10, MATLAB/Simulink 2022b, and the TensorFlow 2.9 deep-learning framework, ensuring the stability and efficiency of the experiments.
A wideband oscillation dataset comprising 3000 samples was constructed in this study. Each sample consists of a one-dimensional time-domain signal and its corresponding two-dimensional image obtained via Gramian Angular Difference Field (GADF) transformation, which provides a solid data foundation for subsequent bimodal feature extraction and fusion. The dataset is composed of two subsets:
  • Model-based simulation data (1800 samples): Based on the wideband oscillation mathematical model established in Section 2.1, simulation data were generated in batch mode using Python. The sampling frequency was set to 1000 Hz with a signal duration of 0.5 s, resulting in 500 sampling points per sample. By randomly varying the oscillation amplitude, damping coefficient, frequency, and initial phase, six representative oscillation modes were synthesized, with 600 samples generated for each class, thereby ensuring sufficient diversity and coverage of oscillation characteristics.
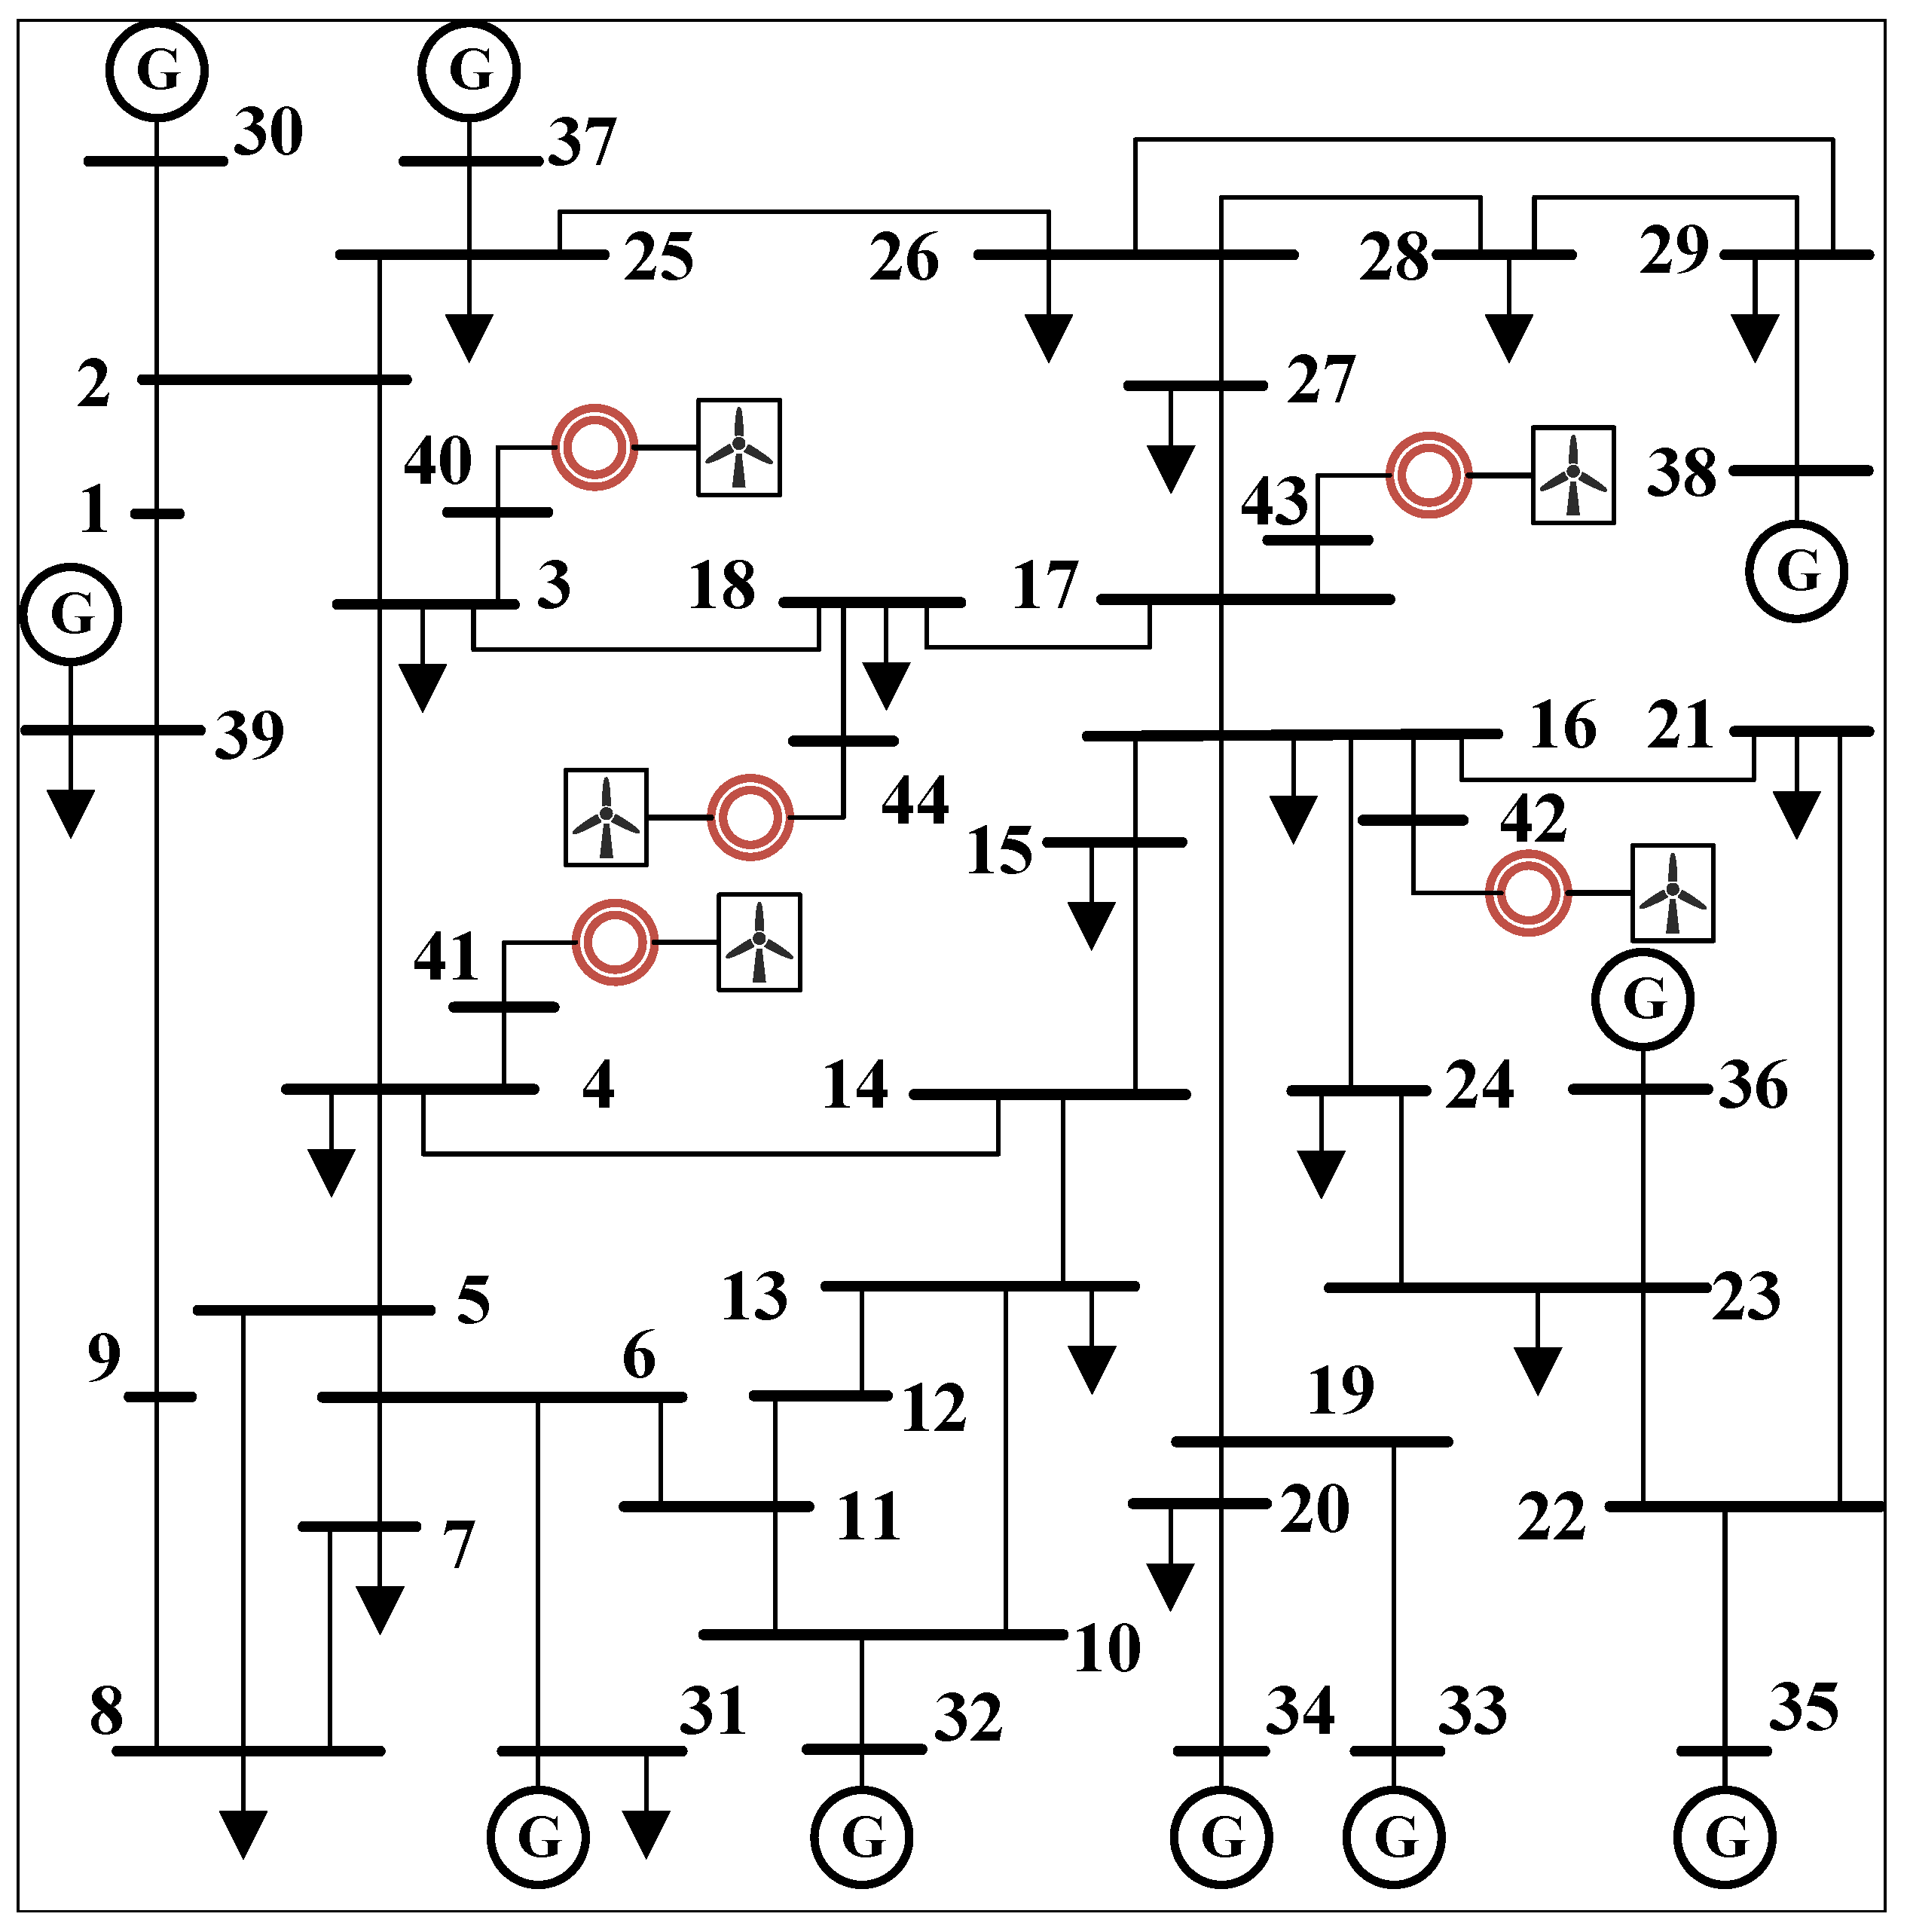
  • Engineering-oriented simulation data (1200 samples): The engineering simulation data used in this study were generated from an improved IEEE 39-bus system model built in MATLAB/Simulink. The schematic diagram of the system is shown in Figure 4. Based on the standard system, wind farms composed of multiple doubly fed induction generators (DFIGs) are connected at buses 3, 4, 16, 17, and 18, respectively. By adjusting the control parameters of the wind turbine converters or introducing external disturbances, various oscillation scenarios encountered in practical power systems are reproduced. This subset provides wideband oscillation signals that more closely reflect real-world operating conditions.
All 3000 wideband oscillation samples were labeled according to their corresponding oscillation categories to form the final dataset. Each oscillation category contains an equal number of samples, ensuring balance across the categories in the dataset. The definitions of labels for different oscillation types are summarized in Table 2.

4.2. Experimental Settings

To enhance the stability of the model training process, the original time-series signals are preprocessed using the Min-Max normalization method, scaling the data to a range between 0 and 1. The standardized signals are directly input into the time-series feature extraction channel, while also being converted into GADF images, which are then input into the image feature extraction channel. In the GADF image generation process, the time-series length is 500, and the generated image size is 500 × 500 pixels. No overlapping window processing is applied in the experiment, with each signal directly generating its corresponding GADF image.
Regarding dataset partitioning, the sample set A was divided into training, validation, and test subsets with a ratio of 7:1:2, yielding 2100, 300, and 600 samples, respectively, which correspond to 70%, 10%, and 20% of the total dataset. Importantly, the class distribution is consistent across the training, validation, and test subsets. Each category contains 350 samples in the training set, 50 samples in the validation set, and 100 samples in the test set, ensuring a balanced distribution across the categories. To ensure the reproducibility of experimental results, all data splits were generated using a fixed random seed.
To comprehensively evaluate the classification performance of different oscillation-source localization models on the test set, four commonly used evaluation metrics were adopted, including Accuracy (Acc), Precision (Pre), Recall (Rec), and F1-score (F1). These metrics enable a multi-dimensional assessment of model performance in terms of overall correctness, positive-class identification capability, and the balance between precision and recall. Formally, the four metrics are defined as follows:
Acc = T P + T N T P + T N + F P + F N
Pre = T P T P + F P
Rec = T P T P + F N
F 1 = 2 × Pre × Rec Pre + Rec
where T P and T N denote the numbers of true positive and true negative samples, respectively; F P denotes the number of negative samples incorrectly classified as positive; and F N denotes the number of positive samples incorrectly classified as negative.

4.3. Results and Analysis

4.3.1. Performance Evaluation of the Proposed Method

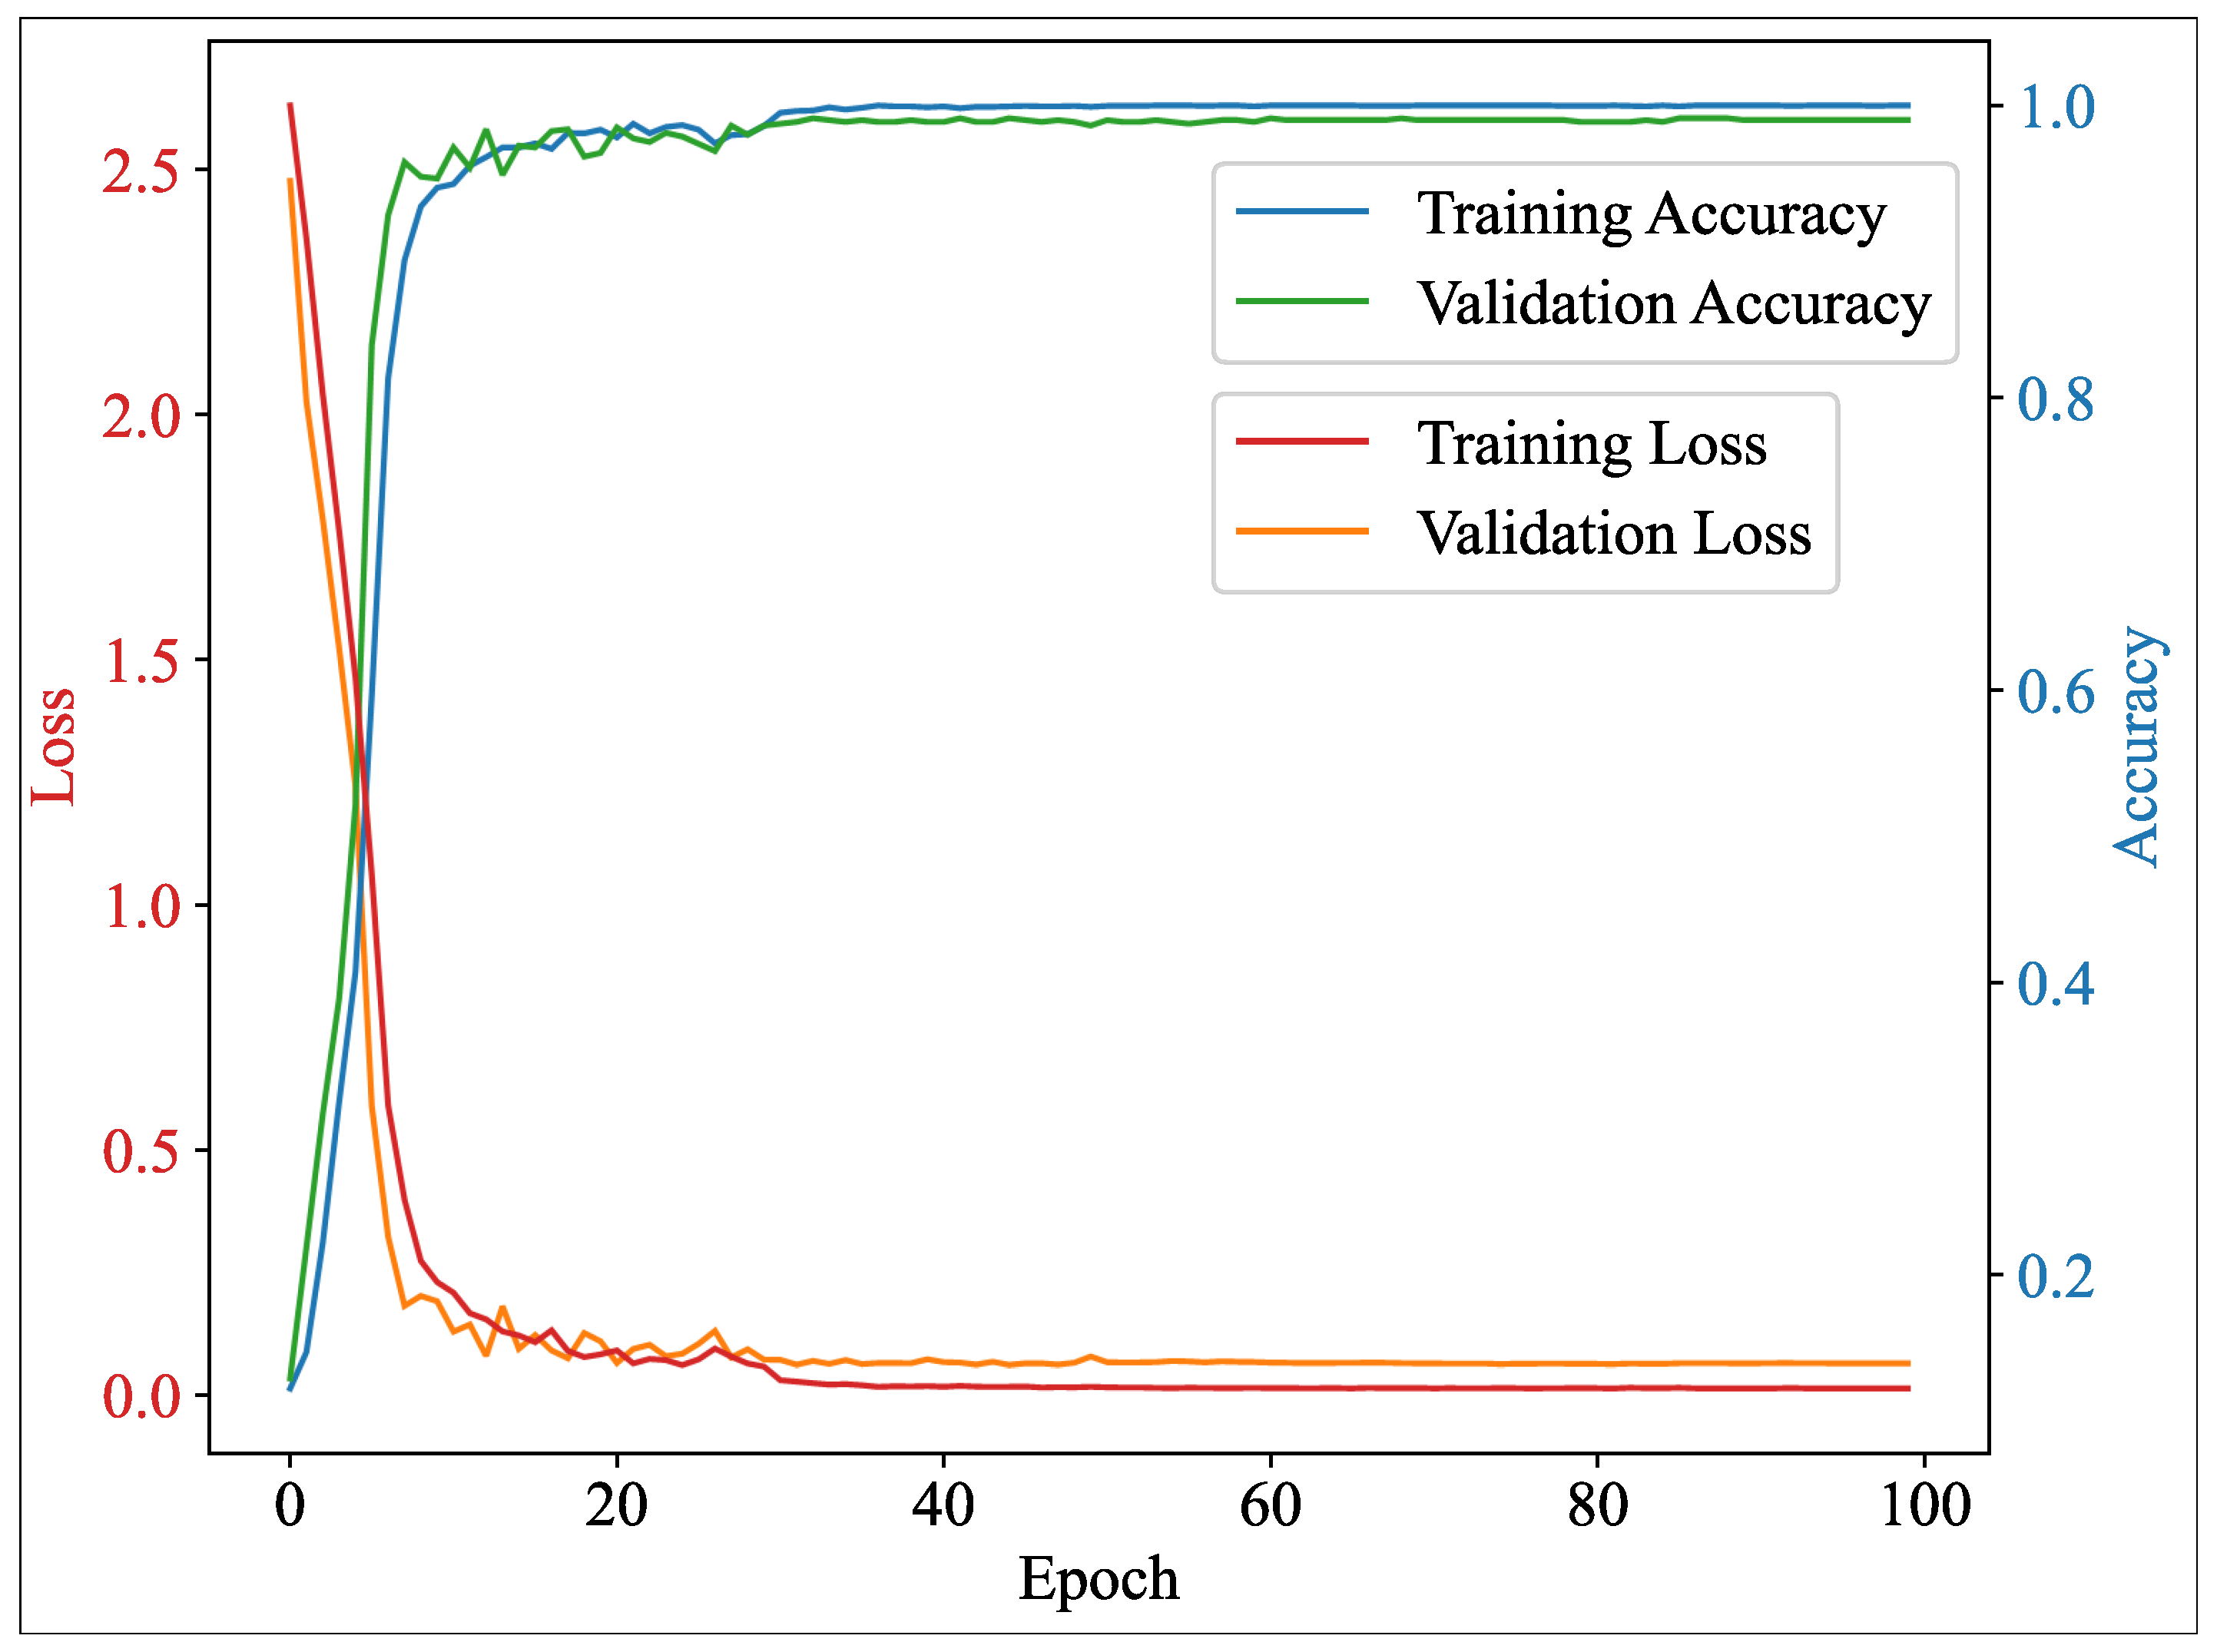
In this study, the training set was used to train the proposed multimodal attention-based fusion network model. The optimization algorithm selected was the Adaptive Moment Estimation (Adam), with a maximum number of training epochs set to 100, a batch size of 64, and an initial learning rate of 0.001. During training, early stopping with a patience of 10 was applied to monitor the validation loss, along with a learning rate decay mechanism (ReduceLROnPlateau). Specifically, when the validation loss does not improve for 5 consecutive epochs, the learning rate is halved. The loss function used was sparse categorical cross-entropy, with ReLU activation functions employed for the convolutional and fully connected layers, while the final output layer used the Softmax function to generate normalized classification probabilities. After sufficient training, the accuracy and loss convergence curves on the training and validation sets are shown in Figure 5.
Figure 5 illustrates the loss function and classification accuracy curves as the training epochs progress. From the loss function curve, it is evident that both the training loss and validation loss decrease rapidly with the increase in training epochs, stabilizing after approximately 25 epochs. This indicates that the proposed model exhibits a fast convergence rate and good training stability. Meanwhile, both the training accuracy and validation accuracy rise synchronously, ultimately stabilizing at approximately 99.87% and 99.33%, respectively. The small difference between the two suggests that the model does not suffer from significant overfitting and demonstrates good generalization ability. Moreover, the validation accuracy remains stable in the later stages of training, further confirming the effectiveness and stability of the training process.
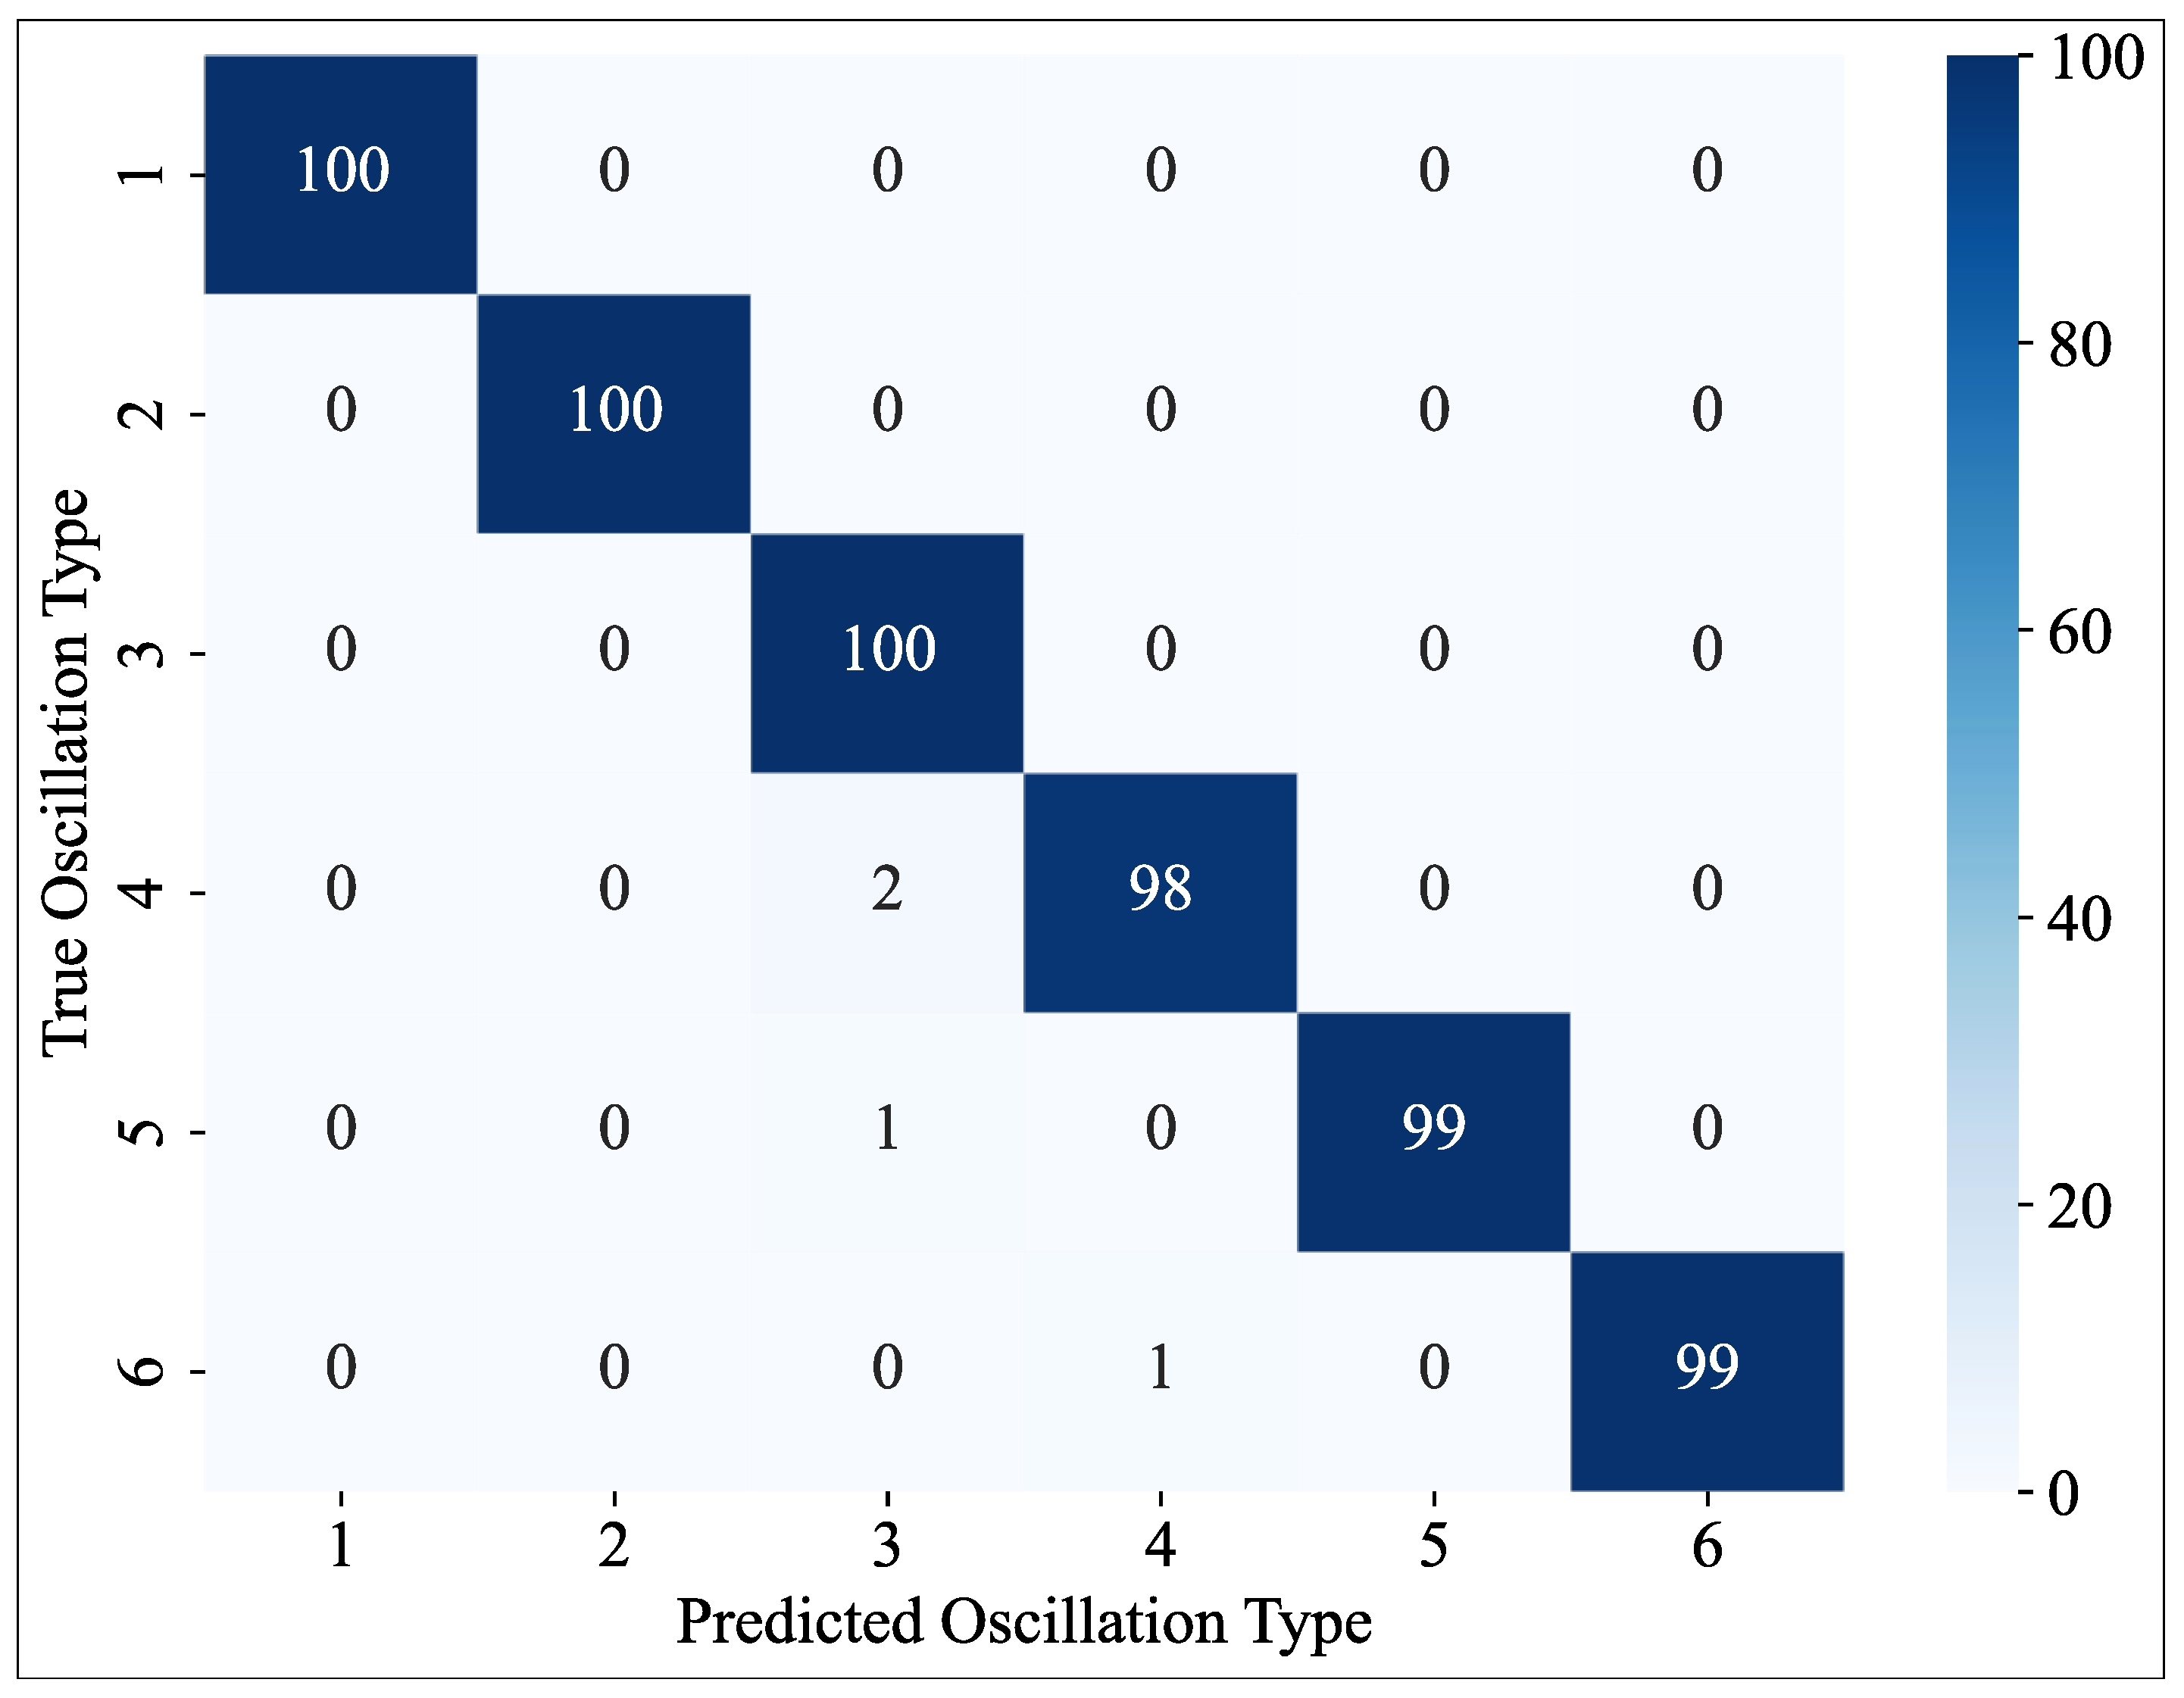
After sufficient training, the model’s classification performance and discriminative ability were further evaluated on the test set using a confusion matrix. The confusion matrix provides an intuitive view of the model’s correct and incorrect classifications across various oscillation categories, effectively revealing the confusion patterns between different categories and the model’s decision boundaries. In addition to the confusion matrix, precision, recall, and F1 score metrics were calculated for each class. These metrics offer a more detailed reflection of the model’s classification performance across the categories. The corresponding values are presented in Table 3, providing a comprehensive evaluation of the model’s performance across all oscillation categories.
Figure 6 shows the confusion matrix of the proposed model on the test set. The results indicate that the overall classification accuracy of the model reaches 99.33%, demonstrating the excellent oscillation pattern recognition capability of the proposed method. The diagonal elements of the confusion matrix are generally high, while the off-diagonal elements are relatively low, suggesting that the model can effectively distinguish between different oscillation types. Specifically, all categories maintain high classification accuracy, with the classification accuracy for single-mode oscillations, such as low-frequency oscillations, subsynchronous oscillations, and supersynchronous oscillations, being 100%. The classification accuracy for mixed-mode oscillations, such as subsynchronous–supersynchronous mixed oscillations, is also maintained at over 98.5%. Only a few samples were misclassified, mainly occurring between oscillation modes with close frequency bands, such as slight confusion between subsynchronous oscillations and subsynchronous–supersynchronous mixed oscillations. This phenomenon is consistent with the physical characteristics of wideband oscillations, providing indirect evidence for the rationality of the model’s classification decisions.
Based on the experimental results presented in Figure 5 and Figure 6, the proposed multimodal attention-based fusion network demonstrates the following advantages in the wideband oscillation classification task: First, through the dual-modality feature fusion mechanism, the model effectively leverages both the global structural features of the GADF images and the local dynamic features of the raw time-series signals, achieving a high classification accuracy of 99.33%. Second, the attention fusion module enables the model to adaptively adjust the weights of features from different modalities, enhancing its ability to represent complex oscillation patterns. Lastly, the training curves indicate the model’s excellent convergence and generalization performance, providing a reliable foundation for practical engineering applications.

4.3.2. Comparative Experiment Analysis

To further evaluate the advancement of the proposed multimodal attention-based fusion network, comparative experiments were conducted against four mainstream deep-learning methods based on single-modality inputs. The selected baseline models cover both time-series and image data processing paradigms and represent classical as well as state-of-the-art architectures in their respective domains.
Specifically, four representative single-modality methods were considered for comparison, including three time-series processing networks—1D Convolutional Neural Network (1D-CNN), Long Short-Term Memory network (LSTM), and Transformer—as well as one image-based processing network, ResNet-50.
As shown in Table 4, the best classification accuracy achieved by all single-modality models does not exceed 95.5%, indicating that a single form of data representation is insufficient to fully capture the physical characteristics of wideband oscillations. Although time-series models such as 1D-CNN, LSTM, and Transformer are effective in modeling the temporal evolution of signals, they exhibit limited sensitivity to the global frequency structures. In contrast, image-based models can clearly represent frequency distributions and structural patterns but tend to overlook transient details in the time domain. By incorporating an attention-based fusion mechanism, the proposed method is able to adaptively integrate and enhance the complementary information from both modalities, thereby enabling more accurate and robust representations of complex oscillation patterns.

4.3.3. Ablation Study

To verify the effectiveness of the key components in the proposed multimodal attention-based fusion network, four ablation settings were designed to compare the performance of different feature extraction and fusion strategies. The quantitative results of the ablation study are summarized in Table 5. The compared variants are summarized as follows:
  • Model A: GADF-Inception, which uses only GADF images as input.
  • Model B: Signal-GRU, which uses only raw time-series oscillation signals as input.
  • Model C: a dual-modality baseline that performs multimodal fusion via simple feature concatenation.
  • Model D: the proposed multimodal attention-based fusion network.
As shown in Table 5, Model A and Model B achieve accuracies of 94.67% and 93.25%, respectively, indicating that although a single modality can capture certain oscillation characteristics, it is insufficient to comprehensively represent the multi-dimensional nature of wideband oscillations. GADF images encode the global structural information of oscillation signals but are less sensitive to instantaneous dynamical variations; in contrast, raw time-series signals can precisely characterize temporal evolution but lack a macroscopic view of overall patterns.
Compared with the single-modality baselines, the dual-modality model based on simple feature concatenation (Model C) achieves a notable performance improvement, with an accuracy of 96.83%, demonstrating the effectiveness of multimodal information fusion. However, this fixed fusion strategy does not explicitly account for the varying importance of different modalities across samples, which limits its capability in handling complex oscillation patterns. By contrast, the proposed multimodal attention-based fusion network (Model D) achieves an accuracy of 99.33%, significantly outperforming all other comparison models. The attention mechanism enables the model to dynamically adjust the fusion weights of image and time-series features according to the characteristics of different oscillation patterns, thereby realizing adaptive feature selection and enhancement.

5. Conclusions

This paper investigates wideband oscillation classification in modern power systems with a high penetration of renewable energy and power-electronic devices. By leveraging complementary representations from GADF images and raw time-series signals, the proposed approach enables more informative characterization of wideband oscillation patterns that exhibit wide frequency spans, modal coupling, and time-varying behaviors.
Experimental results on datasets constructed from mathematical models and engineering-oriented simulations demonstrate that the proposed approach achieves consistently superior performance compared with traditional signal-processing-based methods and representative single-modality deep-learning baselines. Comparative and ablation studies further verify that multimodal fusion contributes substantially to the performance gains, and that the attention mechanism improves robustness when dealing with complex mixed-mode oscillation scenarios.
Future work will focus on validating the proposed method using real-world measured data and deploying it into real-time monitoring pipelines for application in actual power grid environments. Specifically, in large-scale power system applications, we will further explore the method’s computational efficiency, scalability, and reliability to ensure that it can effectively handle large data streams from various grid locations while maintaining high efficiency and accuracy in real-time applications. Moreover, given the complexity and vastness of real-time data in modern power systems, future research will also investigate how to enhance the model’s real-time processing capabilities in large-scale datasets through distributed computing and parallel processing mechanisms, in order to meet the demands of practical power system applications.

Author Contributions

Conceptualization, Y.Z. and Z.Z.; methodology, Y.Z.; software, Y.Z. and Y.L.; validation, Y.Z., Y.L. and S.G.; formal analysis, Y.Z.; investigation, Y.Z. and Y.L.; resources, Z.Z.; data curation, Y.L.; writing—original draft preparation, Y.Z.; writing—review and editing, Z.Z. and S.G.; visualization, Y.Z.; supervision, Z.Z.; project administration, Z.Z.; funding acquisition, Z.Z. All authors have read and agreed to the published version of the manuscript.

Funding

This research was funded by the Science and Technology Project of State Grid Corporation of China (SGCC), Contract No. 52199723002V.

Institutional Review Board Statement

Not applicable.

Informed Consent Statement

Not applicable.

Data Availability Statement

The data supporting the findings of this study were generated from mathematical models and simulation platforms. The data are available from the corresponding author upon reasonable request.

Conflicts of Interest

The authors declare no conflicts of interest.

References

  1. Zhuo, Z.; Du, E.; Zhang, N.; Kang, C.; Xia, Q.; Wang, Z. Incorporating massive scenarios in transmission expansion planning with high renewable energy penetration. IEEE Trans. Power Syst. 2019, 35, 1061–1074. [Google Scholar] [CrossRef] [Scilit]
  2. Rahman, M.M.; Dadon, S.H.; He, M.; Giesselmann, M.; Hasan, M.M. An Overview of Power System Flexibility: High Renewable Energy Penetration Scenarios. Energies 2024, 17, 6393. [Google Scholar] [CrossRef] [Scilit]
  3. Hatziargyriou, N.; Milanovic, J.; Rahmann, C.; Ajjarapu, V.; Canizares, C.; Erlich, I.; Hill, D.; Hiskens, I.; Kamwa, I.; Pal, B.; et al. Definition and classification of power system stability–revisited & extended. IEEE Trans. Power Syst. 2020, 36, 3271–3281. [Google Scholar]
  4. Wang, Y.; Wang, X.; Liao, J.; Su, M.; Liu, Y. Probabilistic Small-Signal Stability Assessment and Cooperative Control for Interconnected Microgrids via Back-to-Back Converters. J. Mod. Power Syst. Clean Energy 2024, 13, 552–563. [Google Scholar] [CrossRef] [Scilit]
  5. Chen, L.; Xie, X.; He, J.; Xu, T.; Xu, D.; Ma, N. Wideband oscillation monitoring in power systems with high-penetration of renewable energy sources and power electronics: A review. Renew. Sustain. Energy Rev. 2023, 175, 113148. [Google Scholar] [CrossRef] [Scilit]
  6. Li, C.; Yang, Y.; Dragicevic, T.; Blaabjerg, F. A new perspective for relating virtual inertia with wideband oscillation of voltage in low-inertia DC microgrid. IEEE Trans. Ind. Electron. 2021, 69, 7029–7039. [Google Scholar] [CrossRef] [Scilit]
  7. Cheng, Y.; Fu, L.; Dai, S.; Collu, M.; Cui, L.; Yuan, Z.; Incecik, A. Experimental and numerical analysis of a hybrid WEC-breakwater system combining an oscillating water column and an oscillating buoy. Renew. Sustain. Energy Rev. 2022, 169, 112909. [Google Scholar] [CrossRef] [Scilit]
  8. Li, C.; Yang, Y.; Blaabjerg, F. Mechanism analysis for oscillation transferring in grid-forming virtual synchronous generator connected to power network. IEEE Trans. Ind. Electron. 2025, 72, 8715–8720. [Google Scholar] [CrossRef] [Scilit]
  9. Wang, Y.; Wang, H.; Song, Y.; Liao, J.; Guo, C.; Zheng, Z. Parameter identification of Sub-synchronous/Super-synchronous oscillations based on synchrophasor rotation and spectral shift. Int. J. Electr. Power Energy Syst. 2023, 149, 109044. [Google Scholar] [CrossRef] [Scilit]
  10. Zhang, L.; Li, Q.; Song, M.; Cao, M.; Sun, B.; Li, D.; Chen, X. An Approach for Identification of Broadband Oscillation in Power System Based on Hanning Window Double-spectrum-line Interpolation FFT. In Proceedings of the 2022 Power System and Green Energy Conference (PSGEC), Shanghai, China, 25–27 August 2022; IEEE: New York, NY, USA, 2022; pp. 819–823. [Google Scholar]
  11. Jiang, T.; Liu, B.; Liu, G.; Wang, B.; Li, X.; Zhang, J. Forced oscillation source location of bulk power systems using synchrosqueezing wavelet transform. IEEE Trans. Power Syst. 2024, 39, 6689–6701. [Google Scholar] [CrossRef] [Scilit]
  12. Weng, H.; Chen, L.; Wu, L. Overview of Data-Driven Methods for Wideband Oscillation Identification and Early-Warning in Power Systems. In Proceedings of the 2024 4th International Conference on Intelligent Power and Systems (ICIPS), Yichang, China, 6–8 December 2024; IEEE: New York, NY, USA, 2024; pp. 764–767. [Google Scholar]
  13. Li, G.; Hou, Y.; Yang, H. A novel method for frequency feature extraction of ship radiated noise based on variational mode decomposition, double coupled Duffing chaotic oscillator and multivariate multiscale dispersion entropy. Alex. Eng. J. 2022, 61, 6329–6347. [Google Scholar] [CrossRef] [Scilit]
  14. El Rhatrif, A.; Bouihi, B.; Mestari, M. Challenges and limitations of artificial intelligence implementation in modern power grid. Procedia Comput. Sci. 2024, 236, 83–92. [Google Scholar] [CrossRef] [Scilit]
  15. Zhang, Y.; Shi, X.; Zhang, H.; Cao, Y.; Terzija, V. Review on deep learning applications in frequency analysis and control of modern power system. Int. J. Electr. Power Energy Syst. 2022, 136, 107744. [Google Scholar] [CrossRef] [Scilit]
  16. Hossain, M.S.; Shafiullah, M.; Shahriar, M.S.; Alam, M.S.; Pathan, M.; Rana, M.J.; Hamanah, W.M. Improvement of low-frequency oscillation damping in power systems using a deep learning technique. Eng. Appl. Artif. Intell. 2024, 137, 109176. [Google Scholar] [CrossRef] [Scilit]
  17. Feng, S.; Chen, J.; Ye, Y.; Wu, X.; Cui, H.; Tang, Y.; Lei, J. A two-stage deep transfer learning for localisation of forced oscillations disturbance source. Int. J. Electr. Power Energy Syst. 2022, 135, 107577. [Google Scholar] [CrossRef] [Scilit]
  18. Meng, L.; Xie, J.; Zhou, Z.; Chen, Y. A Fault Diagnosis Method for Power Electronic Circuits Based on GADF Coding and Channel Split Residual Network. In Proceedings of the 2024 IEEE International Conference on Sensing, Diagnostics, Prognostics, and Control (SDPC), Shijiazhuang, China, 26–28 July 2024; IEEE: New York, NY, USA, 2024; pp. 360–368. [Google Scholar]
  19. Zhang, Y.; Chung, H.; Ngo, J.P.; Monsoor, T.; Hussain, S.A.; Matsumoto, J.H.; Walshaw, P.D.; Fallah, A.; Sim, M.S.; Asano, E.; et al. Characterizing physiological high-frequency oscillations using deep learning. J. Neural Eng. 2022, 19, 066027. [Google Scholar] [CrossRef] [Scilit] [PubMed]
  20. Teng, Y.; Sun, S.; Zhang, H.; Xing, S.; Yue, Y.; Zhang, M.; Zhu, S. Identification of intensive oscillation parameters of power system based on CS-CNN-GRU network. Electr. Power Components Syst. 2024, 1–11. [Google Scholar] [CrossRef] [Scilit]
  21. Cen, S.; Kim, D.O.; Lim, C.G. A fused CNN-LSTM model using FFT with application to real-time power quality disturbances recognition. Energy Sci. Eng. 2023, 11, 2267–2280. [Google Scholar] [CrossRef] [Scilit]
  22. Yu, W.; Zhou, P.; Yan, S.; Wang, X. Inceptionnext: When inception meets convnext. In Proceedings of the IEEE/CVF Conference on Computer Vision and Pattern Recognition, Seattle, WA, USA, 16–22 June 2024; pp. 5672–5683. [Google Scholar]
  23. Shiri, F.M.; Perumal, T.; Mustapha, N.; Mohamed, R. A comprehensive overview and comparative analysis on deep learning models: CNN, RNN, LSTM, GRU. arXiv 2023, arXiv:2305.17473. [Google Scholar] [CrossRef] [Scilit]
Figure 1. Structure of the multimodal attention-based fusion network for wideband oscillation classification.
Electronics 15 00682 g001
Figure 2. Structure of the improved Inception module.
Electronics 15 00682 g002
Figure 3. Structure of the GRU-based time-series feature extraction module.
Electronics 15 00682 g003
Figure 4. Schematic diagram of the modified IEEE 39-bus system with wind farm connections.
Electronics 15 00682 g004
Figure 5. Loss and accuracy curves of the proposed model during the training process.
Electronics 15 00682 g005
Figure 6. Confusion matrix of the proposed multimodal attention-based fusion network on the test set.
Electronics 15 00682 g006
Table 1. Detailed Architecture of the Multimodal Attention-Based Fusion Network.
ModuleLayerOutput Dimensions
Image PathwayInception Block 1500 × 500 × 128
Pooling Layer 1250 × 250 × 128
Inception Block 2250 × 250 × 256
Pooling Layer 2125 × 125 × 256
Inception Block 3125 × 125 × 512
Global Pooling512
Fully Connected512
Signal PathwayGRU 1128
GRU 2256
GRU 3512
Fully Connected512
Fusion ModuleAttention Fusion512
Feature Enhancement512
Fully Connected256
Classification HeadFully Connected128
Output Layer6
Table 2. Label Definitions of Different Oscillation Types.
Wideband Oscillation TypeLabel
Low-frequency1
Subsynchronous2
Supersynchronous3
Subsynchronous–Supersynchronous4
Medium- and high-frequency5
Subsynchronous–Supersynchronous–Medium- and high-frequency6
Table 3. Performance of Each Class in Terms of Precision, Recall, and F1 Score.
MetricClass 1Class 2Class 3Class 4Class 5Class 6
Pre (%)1001009799100100
Rec (%)100100100989999
F1 (%)10010099989999
Table 4. Performance Comparison of Different Methods on the Wideband Oscillation Classification Task.
MethodInput ModalityAcc (%)Pre (%)Rec (%)F1 (%)
1D-CNNTime series92.8592.7092.5592.62
LSTMTime series93.2093.0592.8892.96
TransformerTime series94.5094.3894.2594.31
ResNet-50GADF image95.4295.3195.1895.24
MAFN (Proposed)Time series + GADF99.3399.2799.2199.24
Table 5. Performance Comparison Results of the Ablation Study.
ModelAcc (%)Pre (%)Rec (%)F1 (%)
Model A94.6794.5294.4194.45
Model B93.2593.1192.8792.98
Model C96.8396.7596.6296.68
Model D (Proposed)99.3399.2799.2199.24
Disclaimer/Publisher’s Note: The statements, opinions and data contained in all publications are solely those of the individual author(s) and contributor(s) and not of MDPI and/or the editor(s). MDPI and/or the editor(s) disclaim responsibility for any injury to people or property resulting from any ideas, methods, instructions or products referred to in the content.