1. Introduction
Real-time automatic analysis of pediatric wrist radiographs on resource-constrained edge platforms requires both reliable detection accuracy and efficient inference. Pediatric wrist fractures can be difficult to localize when subtle fracture lines overlap with normal anatomical structures, motivating computer-assisted detection methods [
1,
2,
3]. The GRAZPEDWRI-DX dataset provides expert-annotated pediatric wrist radiographs and has become a reproducible benchmark for fracture localization [
4].
Recent work on this dataset has primarily focused on detection accuracy through data augmentation, alternative YOLO variants, attention mechanisms, and multi-scale feature fusion [
5,
6,
7,
8,
9,
10]. However, translating an accurate detector to an edge platform based on a field-programmable gate array (FPGA) introduces a different challenge: the compiled operator graph can determine whether computation remains on the accelerator or is fragmented across accelerator and host execution.
Deployment efficiency is not determined by parameter count or floating-point operations alone. Measured latency can depend strongly on operator structure, memory access, and compiler lowering [
11]. Deep learning compilers therefore optimize both graphs and operators, including fusion, layout selection, loop structure, and mapping to hardware primitives [
12,
13]. Similar optimization considerations have also appeared in other artificial intelligence applications. For example, hyperspectral remote sensing image classification has investigated spatial–spectral feature extraction and representation strategies to improve classification performance under complex imaging conditions [
14]. Likewise, flight arrival time prediction has explored modular deep learning frameworks and structured prediction pipelines to improve predictive modeling performance [
15]. These studies illustrate the broader importance of model structure, feature representation, and processing-pipeline design in practical AI systems. The present work focuses on a different deployment-oriented issue: how compiler-visible graph structure affects execution efficiency on an FPGA-based DPU platform.
Unsupported operators can divide a network across accelerator and central processing unit (CPU) execution domains, introducing tensor transfers and numerical-format conversions at their boundaries. FPGA deployments must therefore be evaluated with compiler partitioning and board measurements, not only with theoretical complexity [
16,
17,
18,
19,
20,
21].
This study examines the channel split in the YOLOv8 Cross-Stage Partial block with two convolutions (C2f) [
22]. In the Vitis AI 2.5 compilation path used here, the split was lowered to CPU-side
strided_slice operations. Eight C2f blocks in the retained deploy-s-512 model produced sixteen such operations and divided the compiled network into nine deep learning processing unit (DPU) subgraphs and nineteen CPU subgraphs.
C2fDeploy removes this runtime split by partitioning the already trained projection filters and batch-normalization state along the output-channel dimension. It follows the general idea of simplifying an inference graph after training [
23,
24,
25], but it does not introduce a richer training-time block and later fuse it. Both deployment branches are obtained directly from the trained parameters, so no new weights, approximation, or retraining are required. This distinguishes C2fDeploy from architecture-level substitution or approximation of unsupported operators [
26].
The central claim of this study is not that C2fDeploy reduces model size or improves fracture-detection accuracy. Instead, it presents the same learned 32-bit floating-point (FP32) function to the deployment compiler in a different operator form. The evaluation therefore follows a causal chain: exact parameter mapping, preservation of detector behavior, removal of CPU-side split subgraphs, and the resulting changes in board-level throughput, energy efficiency, and end-to-end deployment behavior.
We evaluate the method in four stages: FP32 function preservation, 8-bit integer (INT8) quantization behavior, operator-level XModel partitioning, and direct board performance. In addition, an end-to-end pipeline analysis is performed to distinguish accelerator-level acceleration from practical application throughput. The main contributions are as follows:
C2fDeploy, a training-free rewrite that replaces the runtime C2f split with an offline partition of the trained convolution and batch-normalization parameters.
An exact-arithmetic derivation and a same-checkpoint FP32/INT8 evaluation of function preservation and quantization behavior, including tensor-level error verification at all eight C2f outputs.
Xilinx Intermediate Representation (XIR)-based analysis of operator assignments and subgraph partitioning, together with same-checkpoint KV260 measurements of accelerator throughput, energy efficiency,
DPU/CPU utilization, APM-observed external-memory activity, and complete deployment latency.
2. Materials and Methods
The experiments distinguish detector behavior, compiler partitioning, and board performance. Original C2f and C2fDeploy are compared with the same deploy-s-512 checkpoint. Comparisons between deploy-s-512 and deploy-n-512 describe final operating points and are not treated as an ablation of the rewrite.
2.1. Dataset, Image Processing, and Model Configuration
Experiments used the public GRAZPEDWRI-DX pediatric wrist trauma dataset [
4]. The 20,327 images were partitioned at the patient level into 14,204 training images, 4094 validation images, and 2029 test images. Images from the same patient were assigned to only one split, preventing patient-level overlap among the training, validation, and test sets. The resulting patient-level partition is summarized in
Table 1. Fracture annotations were mapped to one detection class, denoted as fracture. No new patient data were collected. The radiographs were treated as grayscale intensity images. To match the three-channel input expected by the YOLOv8 implementation and the compiled DPU model, each single-channel image was replicated across three identical channels without pseudo-color conversion. The same image decoding, channel conversion, resizing, and normalization procedure was used for training, validation, test evaluation, post-training quantization (PTQ) calibration, and board inference.
Two model scales were retained. The higher-capacity deploy-s-512 configuration used the depth and width settings of the YOLOv8-s configuration, whereas the lower-capacity deploy-n-512 model used the corresponding YOLOv8-n settings defined in the Ultralytics implementation [
22]. The final detector configurations used ReLU in place of the default SiLU activation to match the deployment configuration used in this study. This activation choice was fixed before the controlled Original C2f versus C2fDeploy comparison and was retained throughout training, FP32 evaluation, PTQ, compilation, and board execution. It was therefore part of the common model configuration rather than part of the C2fDeploy transformation. Both models used one fracture class, and no attention module was present in the evaluated FP32, INT8, or compiled models.
The retained DPU-ready training run used inputs, a maximum of 100 epochs, a batch size of 16, and an early-stopping patience of 15 epochs. The model was initialized from the previously trained best_cloud.pt checkpoint. Optimizer selection was explicitly configured as AdamW rather than being delegated to the Ultralytics automatic optimizer mode. The initial learning rate was 0.001, the final learning-rate fraction was 0.01, and the weight decay was . Cosine learning-rate scheduling was enabled.
The recorded training configuration further specified a momentum argument of 0.937, a three-epoch warm-up, a warm-up momentum of 0.8, and a warm-up bias learning rate of 0.1. The detector loss gains were 7.5 for box regression, 0.5 for classification, and 1.5 for distribution focal loss. The random seed was fixed to 0, deterministic execution was enabled, and automatic mixed precision was disabled.
The recorded augmentation configuration used HSV gains of 0.015, 0.7, and 0.4 for hue, saturation, and value, respectively; translation of 0.1; scaling of 0.5; horizontal flipping with a probability of 0.5; and mosaic augmentation with a probability of 0.2. Rotation, shear, perspective transformation, and vertical flipping were disabled. Mosaic augmentation was disabled during the final 10 epochs, while mixup, cutmix, and copy-paste augmentation were also disabled. The validation split was used for training-time monitoring and checkpoint selection.
Export, PTQ, test evaluation, compilation, and board experiments used fixed inputs with batch size 1 during deployment.
The controlled transformation experiment used the same deploy-s-512 checkpoint for both graph variants. Checkpoint and calibration-list digests are included in the archived reproducibility materials. Because the checkpoint, activation function, image-processing pipeline, evaluation set, and deployment input were held fixed, differences between Original C2f and C2fDeploy can be attributed to the graph rewrite rather than to training or preprocessing variation.
The training, FP32 validation, Vitis AI PTQ/compilation, and KV260 board runtime stages used separate software environments. In particular, the Python 3.13.5/Ultralytics environment used for model training and FP32 validation was not used as the Vitis AI compilation or embedded board-runtime environment. PTQ and XModel compilation were performed using the Vitis AI 2.5 toolchain, whereas board execution used the Vitis AI 2.5.0 runtime/library stack with XRT 2.13.479 and Python 3.10.12. Separating these stage-specific software stacks avoids implying compatibility requirements among packages that were never co-installed or executed in the same environment.
The exact PyTorch build of the original GPU training host was not retained in the archived records and is therefore not assigned an unverified version in
Table 2. The separately retained FP32 validation log identifies Python 3.13.5, PyTorch 2.9.0+cpu, and Ultralytics 8.3.240 for that evaluation stage.
2.2. C2fDeploy Rewrite
Vitis AI converts a quantized model into the Xilinx Intermediate Representation (XIR) and partitions the graph according to whether each operation can be executed by the selected DPU [
27]. Let
be the input to a C2f block. Its first
projection produces
output channels:
followed by batch normalization (BN) and a point-wise activation,
The activation is divided along the channel dimension:
Let
denote the
j-th bottleneck. Starting from
,
and
In the evaluated compilation path, Equation (
4) was lowered to CPU-side
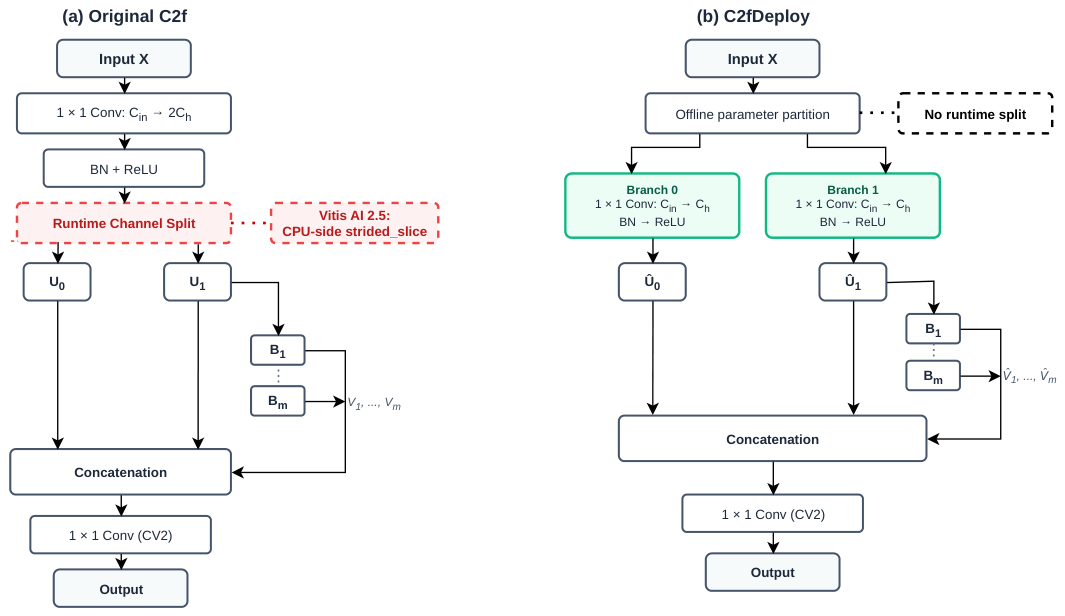
strided_slice. C2fDeploy moves the split from the runtime activation graph to an offline partition of the trained parameters, as illustrated in
Figure 1.
2.3. Parameter Mapping and Function Preservation
The original projection weight and optional bias are partitioned along the output-channel dimension:
where
For inference-mode BN,
where
and
are learned parameters and
and
are stored running statistics. These channel-wise vectors are partitioned using the same output-channel indices:
The transformed projection branches are
Starting from
, the original bottleneck sequence and final projection are retained:
Proposition 1. If the convolution parameters, channel-wise BN parameters, and stored BN statistics are partitioned according to Equations (
7)
and (
10)
, both branches retain the source BN epsilon and inference configuration, and σ acts independently on each tensor element, thenin exact arithmetic. Proof. Let
,
, select the corresponding
output channels. Convolution output channels are determined by independent output filters, so
Inference-mode BN acts independently on each channel, and
acts independently on each tensor element. Therefore,
Thus
and
. Since each
and
is unchanged, induction gives
for all
j, and Equation (
14) follows. □
C2fDeploy does not change the projection parameter count or its theoretical multiply–accumulate count. Ignoring an optional convolution bias,
and, for a feature map of size
,
Any compiler-level difference therefore arises from graph representation rather than pruning or reduced convolutional arithmetic.
2.4. Quantization and XModel Compilation
Each trained C2f module was replaced by a C2fDeploy module with the same input and output channels, hidden width, bottleneck count, shortcut setting, group setting, and expansion ratio. The first filters of the trained projection were assigned to branch 0, and the remaining filters were assigned to branch 1. Convolution biases, when present, and the channel-wise BN weight, bias, running mean, and running variance were partitioned using the same output-channel indices. Both branches retained the source BN epsilon and inference configuration. Because num_batches_tracked is a scalar buffer rather than a channel-wise quantity, it was copied to both branches. The bottleneck sequence and final C2f projection were transferred without modification. All eight C2f modules in deploy-s-512 were converted, and no parameter was estimated, optimized, or fine-tuned during the transformation.
FP32 evaluation used the complete held-out test split and the same image decoding, resizing, normalization, confidence threshold, non-maximum suppression (NMS), bounding-box conversion, and metric implementation for both graph variants.
To verify function preservation below the detection-metric level, an additional FP32 tensor comparison was performed using the same checkpoint, input size, and deterministic image preprocessing. Forward hooks recorded the outputs of each of the eight corresponding C2f and C2fDeploy blocks. For every paired tensor, the maximum absolute error, mean absolute error (MAE), root-mean-square error (RMSE), and relative error were accumulated over the 2029-image held-out test set. The final raw network output before non-maximum suppression was compared using the same error measures.
PTQ and XModel compilation were performed in a software environment separate from the Python/Ultralytics environment used for model training and FP32 validation. This separation reflects the stage-specific requirements of the Vitis AI 2.5 deployment toolchain and avoids implying that all reported software components were required to coexist in one Python environment.
PTQ was performed with Vitis AI 2.5 [
27]. Both graphs used a
input and the same ordered set of 200 training images for calibration. No validation or test image was used for calibration. The quantized models were evaluated on the complete test split. The shared checkpoint and calibration set isolate the graph rewrite, but do not imply bit-level INT8 equivalence [
28,
29,
30].
The quantized models were compiled for the B4096 DPU target. XModel metadata were inspected with xdputil, and an XIR Python script recorded the top-level subgraphs and the operation types assigned to each CPU subgraph. To avoid ambiguity in XIR terminology, throughout this paper we use subgraph to denote an XIR structural unit counted by the inspection script. Each reported top-level subgraph is classified according to its device assignment as USER, DPU, or CPU; therefore, the reported total number of top-level subgraphs is the sum of these three categories. The Original C2f XModel contains 29 top-level subgraphs, comprising 1 USER subgraph, 9 DPU subgraphs, and 19 CPU subgraphs, whereas C2fDeploy contains 5 top-level subgraphs, comprising 1 USER subgraph, 1 DPU subgraph, and 3 CPU subgraphs.
A CPU subgraph and a CPU-assigned operation refer to different levels of the XIR structure. A CPU subgraph is a structural unit assigned to CPU execution, whereas a CPU-assigned operation is an individual operation contained within such a subgraph. Consequently, the number of CPU-assigned operations can exceed the number of CPU subgraphs. In the Original C2f XModel, nineteen CPU subgraphs contain 51 CPU-assigned operations, whereas the three CPU subgraphs in C2fDeploy contain three CPU-assigned operations. Throughout the remainder of the manuscript, subgraph is used when referring to a counted XIR structural unit, whereas execution domain is reserved for generic descriptions of accelerator-side and host-side execution. The term region is therefore avoided for XIR structural counts.
Full commands, model digests, and compiler logs are retained with the archived materials.
2.5. Board Measurement Protocols
A direct board comparison was performed with Original C2f and C2fDeploy XModels generated from the same deploy-s-512 checkpoint and calibration list. Both models were executed on the same KV260 and B4096 target [
31]. Whole-XModel throughput was measured with
xdputil benchmark using complete-graph execution and one worker thread. One smoke run per model was excluded, followed by five formal runs of approximately 60 s in alternating order.
2.6. Runtime Utilization and External-Memory Profiling Protocol
To directly characterize accelerator utilization, host-side CPU activity, and external-memory behavior, two additional profiling experiments were performed using the same Original C2f and C2fDeploy XModels, KV260 board, B4096 DPU configuration, batch size, and single-worker whole-XModel execution protocol used in the formal throughput experiment. Five formal runs were collected for each graph in alternating order. Reported uncertainties correspond to the sample standard deviation across the five independent formal runs rather than temporal variation among samples within a single run.
DPU utilization was measured as the time-weighted busy fraction of the XRT-exposed DPU compute unit. The ZOCL/XRT-reported compute-unit control state was sampled through the sysfs interface at a target interval of 1 ms. Under the XRT-managed kernel control convention, bit 2 of the control/status register corresponds to
ap_idle; therefore, samples with
ap_idle=0 were classified as non-idle compute-unit states [
32]. Let
denote whether sample
i reports a non-idle compute unit and let
. The time-weighted DPU compute-unit busy-time utilization was calculated as
Only samples collected between the xdputil benchmark 0% and 100% execution markers were included. The achieved mean sampling interval was approximately 1 ms. This metric represents compute-unit busy time and should not be interpreted as internal processing-element or MAC-lane occupancy.
CPU utilization and external-memory activity were collected in a separate synchronized profiling experiment. Per-core CPU utilization was obtained from successive Linux
/proc/stat samples at approximately 1 Hz for the four Arm Cortex-A53 cores. The system-wide CPU utilization at each sampling instant was defined as the arithmetic mean of the four per-core utilization values,
and the run-level CPU utilization was the temporal mean over the retained steady-state samples.
External-memory activity was sampled through the AXI Performance Monitor (APM) interface used by the Vitis AI profiling infrastructure [
27]. Read and write counters from the five monitored APM ports were sampled at 0.1 s intervals and converted to bandwidth values in MB/s using the same APM profiling interface employed by the Vitis AI tracing infrastructure. Aggregate APM-observed bandwidth was calculated as
For the CPU/APM experiment, the formal benchmark interval was identified from the same 0% and 100% execution markers, and 1 s was removed from each end of the interval to exclude startup and shutdown transients. The remaining samples were averaged to obtain one CPU-utilization value and one read, write, and aggregate APM-bandwidth value for each formal run.
Because sustained bandwidth depends on the number of graph executions completed per unit time, an additional normalized traffic metric was calculated as
where
is the mean aggregate APM-observed bandwidth in MB/s and
is the simultaneously measured whole-XModel throughput in graph executions/s. The resulting unit is MB/execution. This quantity is reported as normalized APM-observed external-memory traffic and is not interpreted as a complete accounting of all system-level DDR traffic.
This benchmark includes CPU fallback operations and format conversions inside the XModel, but excludes image-file input/output, application resizing, detection decoding, NMS, and visualization. It is therefore reported as graph executions per second rather than application frames per second. Reciprocal latency was calculated as and is an aggregate equivalent, not a measured p50 or p95 latency.
During each run, the Linux
hwmon interface associated with the onboard INA260 power monitor (Texas Instruments, Dallas, TX, USA) was sampled. On the KV260, this telemetry path measures the 5 V
rail supplying the K26 system-on-module (SOM) [
33,
34]. For each run,
where
is whole-XModel throughput. Uncertainty is reported as the sample standard deviation across the five formal runs. The reported run-to-run variability does not include systematic uncertainty associated with the onboard INA260 monitor or the telemetry interface. Potential sources include sensor gain and offset error, finite telemetry resolution, temperature dependence, and asynchronous
hwmon sampling. Furthermore, because the monitor measures the 5 V
rail, the reported power represents the complete K26 SOM rather than isolated DPU power.
As an independent external cross-check of the onboard power measurements, an additional input-side measurement was performed at the 12 V supply boundary of the KV260 starter kit. A DC20 inline DC voltage/current/power display (specified measurement ranges: 6–200 V DC and 0–20 A) was inserted in the external power path supplying the board. This supplementary measurement has a different boundary from the onboard INA260: the INA260 measures the 5 V rail supplying the K26 SOM, whereas the external instrument measures power at the starter-kit 12 V input. The absolute power values from the two measurement paths are therefore not expected to be equal.
The Original C2f and C2fDeploy XModels were evaluated using the same single-worker whole-XModel benchmark protocol. Five valid runs were retained for each graph. The runs were performed in alternating order, and each benchmark lasted approximately 60 s. External input power was recorded at approximately 10, 20, 30, 40, and 50 s during each run. The five readings within each run were averaged to obtain one external input-power value for that run. One interrupted Original C2f benchmark, which did not complete the 60 s execution interval, was excluded and replaced by a complete repeat.
For each valid run, external input energy per graph execution was calculated as
where
is the mean externally observed 12-V input power for run
r and
is the corresponding whole-XModel throughput. Reported uncertainties are the sample standard deviation across the five valid runs. Because no manufacturer accuracy specification was available for the external display beyond its stated voltage and current ranges, this measurement is treated as an independent power-trend and energy-efficiency cross-check rather than as a calibrated replacement for the onboard INA260 measurement.
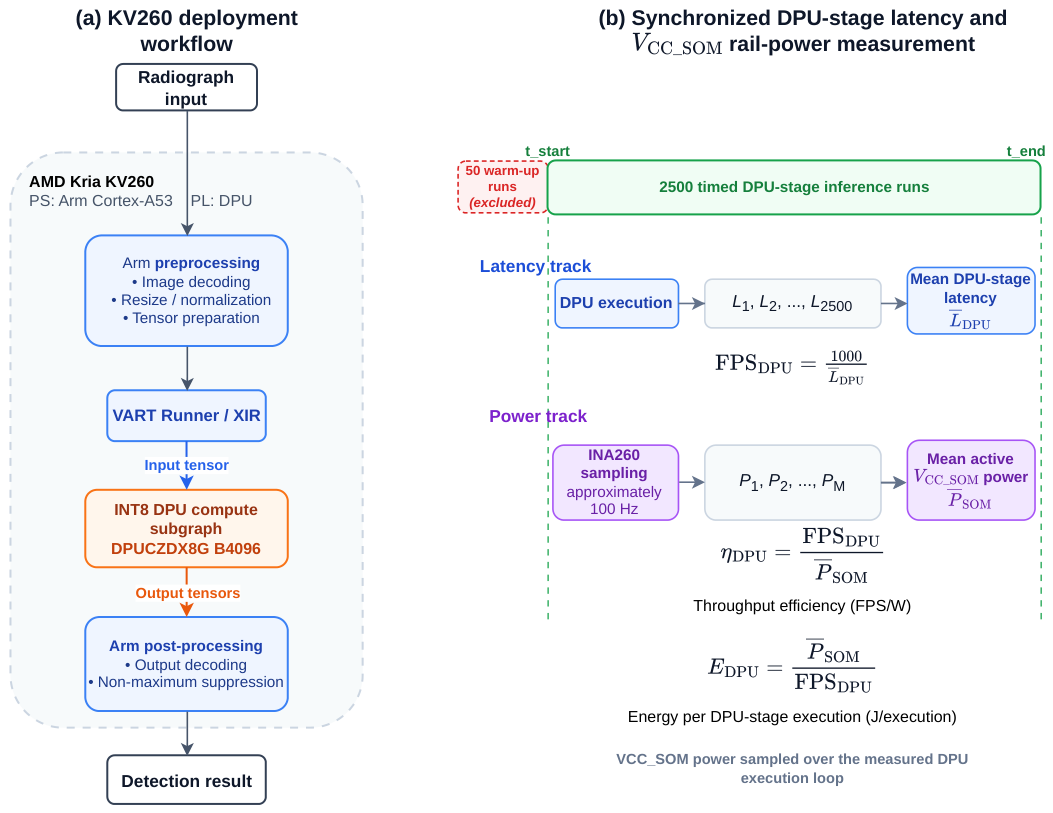
The final deploy-s-512 and deploy-n-512 models were also measured with a custom Vitis AI Runtime (VART)/XIR application.
Figure 2 summarizes the measurement boundary.
For timed DPU-stage execution, let
denote the latency of execution
i. Mean latency and throughput were calculated as
where latency is expressed in milliseconds. During the same timed loop, the INA260 interface was sampled at approximately 100 Hz. This sampling rate characterizes average active power over the timed interval but may not capture short-duration power transients. Let
denote power sample
j. Mean active SOM-rail power was
where
M is the number of power samples collected during the active interval. The derived throughput-efficiency and energy metrics were
To evaluate complete application-level performance, a separate matched end-to-end comparison was performed between the Original C2f and C2fDeploy deploy-s-512 XModels generated from the same checkpoint. Both XModels were executed on the same Kria KV260 with a fixed input size, batch size 1, the same radiograph, and the same GraphRunner-based application pipeline.
For each XModel, five complete-pipeline warm-up executions were excluded, followed by 50 timed repetitions. Each timed repetition included image loading, host preprocessing, input tensor handoff, complete XModel execution, output dequantization/copy, YOLO decoding, and non-maximum suppression. Visualization and result-file writing were excluded from the timed interval. Stage latencies were recorded separately, while total end-to-end latency was measured directly over the complete included pipeline.
Because the same radiograph was repeatedly accessed during this controlled comparison, the image-loading measurements may be influenced by the Linux page cache and should not be interpreted as a storage-device bandwidth benchmark. The purpose of this experiment was to compare Original C2f and C2fDeploy under identical application-level conditions rather than to characterize storage system performance.
2.7. Reproducibility and Reporting Boundaries
Archived materials include the training configuration, conversion script, model and calibration digests, quantization and compiler settings, XModels, XIR reports, benchmark logs, application-profile records, synchronized power measurements, per-run CPU-utilization records, raw APM samples, DPU compute-unit state samples, external input-power observations, corresponding whole-XModel benchmark logs, and the associated five-run profiling summaries. These materials are available from the corresponding author on reasonable request during peer review and will be publicly archived before publication.
Compiler reports establish subgraph partitioning and CPU-assigned operation counts but do not themselves measure runtime utilization or external-memory traffic. Accordingly, CPU utilization, DPU compute-unit busy time, and APM-observed external-memory activity were measured separately using runtime telemetry. DPU utilization denotes the time-weighted fraction for which the XRT-exposed DPU compute unit reported ap_idle=0; it does not represent internal PE- or MAC-lane occupancy. Similarly, APM bandwidth characterizes traffic observed on the monitored accelerator memory interfaces and is not interpreted as a complete measurement of all DDR traffic generated by the processing system.
The xdputil whole-XModel benchmark, custom VART DPU-stage measurements, GraphRunner complete end-to-end measurements, CPU/APM profiling experiment, and DPU-state profiling experiment use different measurement boundaries and are therefore reported separately. Results obtained under one timing boundary are not combined with measurements from another boundary to construct synthetic latency values. The utilization and memory measurements are used to explain runtime behavior, whereas the primary throughput and energy values remain those obtained from the independent formal whole-XModel benchmark.
3. Results
3.1. FP32 Preservation and INT8 Quantization
Table 3 compares Original C2f and C2fDeploy on the complete test set using the same deploy-s-512 checkpoint. The FP32 graphs produced identical precision, recall, mAP50, and mAP50–95. After PTQ, the small differences were mixed in direction and did not indicate an accuracy gain or a meaningful loss.
The tensor-level comparison confirmed that the implemented rewrite remained numerically equivalent within FP32 finite-precision effects. Across the 2029-image held-out test set and all eight C2f outputs, the maximum absolute difference was
, with an aggregate MAE of
, RMSE of
, and relative
error of
. At the final raw network output, the maximum absolute difference was
, while the MAE, RMSE, and relative
error were
,
, and
, respectively. The larger maximum raw-output difference reflects downstream accumulation of very small floating-point differences, whereas the relative error remained negligible. The block-wise and aggregate tensor-level comparison results are summarized in
Table 4.
The identical FP32 values across all four aggregate metrics are consistent with the exact-arithmetic derivation and indicate that the implemented parameter transfer preserved detector behavior at the reported evaluation level. These values were obtained from independent evaluations of the two graph variants; their equality was observed rather than imposed. After PTQ, C2fDeploy differed from Original C2f by in precision, in recall, in mAP50, and in mAP50–95. The changes are small and mixed in direction; they are therefore interpreted as quantization variation rather than an accuracy improvement. Relative to the common FP32 mAP50–95 value, the decreases were 0.005551 for Original C2f and 0.004922 for C2fDeploy.
3.2. Compiled-Graph Partitioning
The Original C2f XModel contained twenty-nine top-level subgraphs, comprising one USER subgraph, nine DPU subgraphs, and nineteen CPU subgraphs. The nineteen CPU subgraphs contained sixteen
strided_slice, sixteen
float2fix, and nineteen
fix2float operations.
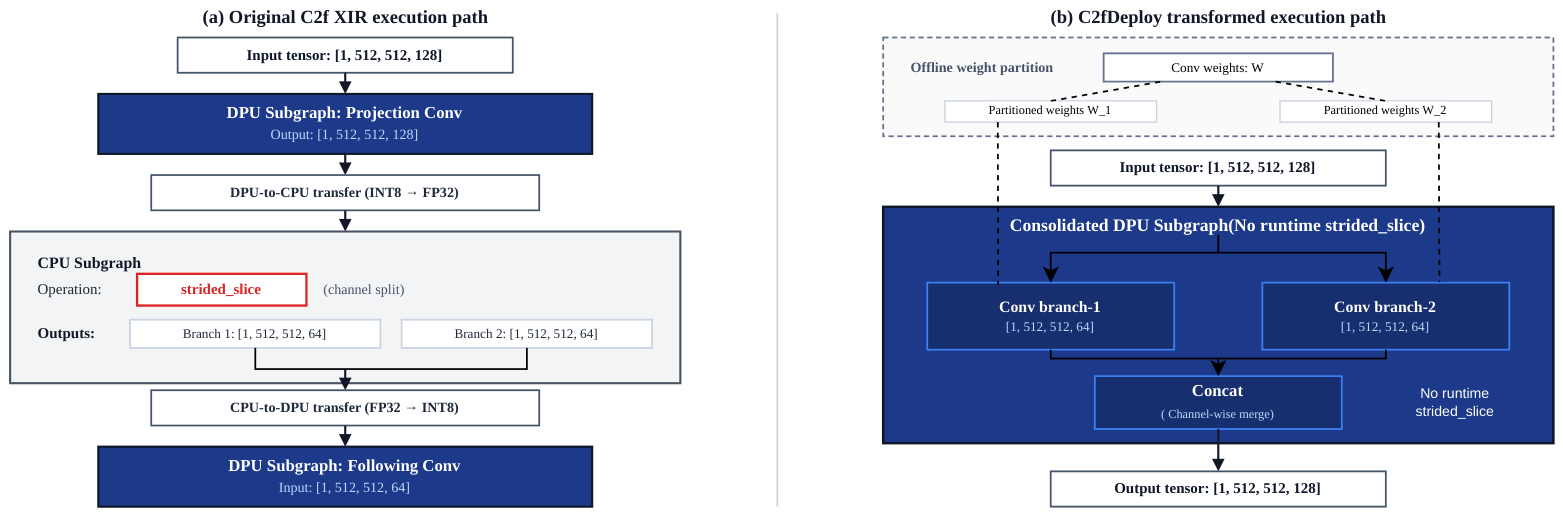
Figure 3 illustrates the change, and
Table 5 reports the corresponding XIR counts.
Example of C2f Block Partition Behavior
To further clarify how runtime channel splitting causes graph fragmentation, we provide a representative dataflow walk-through of a single C2f block. As illustrated in
Figure 3, the original C2f block first performs a projection convolution on the DPU and generates an intermediate activation tensor. Using the tensor dimension order reported by XIR, the intermediate activation before channel separation is represented in NHWC layout as
. Since runtime channel splitting is not directly supported by the DPU execution path in the adopted Vitis AI compilation flow, the compiler maps this operation to a CPU-side
strided_slice operation.
Consequently, the activation tensor must cross the DPU–CPU boundary. The execution sequence can be summarized as
where the channel split is executed in the CPU execution domain rather than as part of a continuous DPU execution path. The intermediate branches then return to the DPU for subsequent convolutional processing. When multiple C2f blocks are stacked in YOLOv8, these repeated domain transitions accumulate and produce a fragmented XIR structure containing multiple DPU and CPU subgraphs.
In contrast, C2fDeploy moves the channel partition from runtime activation processing to offline parameter transformation. The two projection branches are generated directly from the partitioned convolution parameters and remain inside the accelerator-supported execution path:
Here, denotes the intermediate branch tensors that replace the runtime channel split; it does not denote the output of the complete C2fDeploy block. The downstream bottleneck sequence and final projection remain unchanged, as defined in Equation (13). Therefore, C2fDeploy removes the need for runtime strided_slice and the associated tensor-format conversions between the DPU and CPU execution domains. This split-replacement mechanism explains why the fragmented XIR subgraph structure observed in the Original C2f model is consolidated after deployment.
C2fDeploy removed all sixteen C2f-related slicing operations and all sixteen associated float2fix boundaries. The number of top-level subgraphs decreased from 29 to 5, the DPU subgraphs were consolidated from 9 to 1, and CPU-assigned operations decreased from 51 to 3. The three remaining CPU subgraphs each contain one output-side fix2float operation and are unrelated to the original C2f split. Because model parameters and theoretical convolutional arithmetic were unchanged, the difference is attributable to operator representation and compiler partitioning rather than pruning or reduced model arithmetic.
3.3. Same-Checkpoint Whole-XModel Performance
Table 6 reports the direct Original-versus-Deploy board comparison. C2fDeploy increased whole-XModel throughput by 95.2-fold and reduced the reciprocal latency equivalent by 98.95%. Active SOM-rail power was higher, but energy per graph execution was 98.20% lower because execution completed much sooner.
C2fDeploy increased whole-XModel throughput from to graph executions/s, corresponding to a improvement. The reciprocal latency equivalent decreased from to ms/execution. Because both XModels were generated from the same checkpoint and evaluated with the same board, DPU target, thread count, and benchmark mode, the observed difference isolates the effect of the compiled-graph rewrite. This result is consistent with the XIR analysis, which showed the removal of repeated CPU-side slicing, numerical-format conversions, and accelerator–host transitions.
Mean active
power increased from
to
W. This increase is consistent with the direct runtime-utilization measurements reported in
Section 3.4, where DPU compute-unit busy-time utilization increased from
for Original C2f to
for C2fDeploy. Despite the higher active power, the shorter execution time reduced SOM-rail energy per graph execution from
to
J, a 98.2% reduction. These values characterize energy delivered through the 5 V
rail during the whole-XModel benchmark; they do not represent isolated DPU dynamic energy or total 12 V starter-kit input energy.
To independently cross-check the direction and energy-efficiency implication of the onboard INA260 measurements, power was also observed at the external 12 V starter-kit input during a separate five-run whole-XModel experiment.
Table 7 summarizes the results. Because this measurement includes the complete starter-kit input boundary rather than only the 5 V
rail, its absolute power values are higher and should not be directly equated with the INA260 values.
The independent input-side measurement reproduced the same qualitative power behavior observed with the onboard INA260. C2fDeploy increased external starter-kit input power from to W as accelerator execution became substantially more continuous. However, the corresponding approximately throughput increase reduced external-input energy per graph execution from to J, corresponding to a 98.48% reduction.
The external measurement and the INA260 measurement have different electrical boundaries and are therefore not expected to yield identical absolute power values. Nevertheless, both independently show higher active power for C2fDeploy together with a large reduction in energy per completed graph execution. The external result therefore provides a supplementary system-input-level cross-check of the power and energy trends obtained from the onboard SOM-rail telemetry.
3.4. Runtime Utilization and External-Memory Profiling
Direct runtime profiling revealed a substantial redistribution of execution activity between the DPU and host CPU after the graph rewrite.
Table 8 summarizes the DPU compute-unit busy-time utilization, system-wide CPU utilization, and APM-observed external-memory behavior. Values are reported as the mean ± sample standard deviation across five independent formal runs.
The Original C2f graph exhibited a DPU compute-unit busy-time utilization of only . In contrast, C2fDeploy increased the measured busy-time utilization to , corresponding to an absolute increase of 90.3903 percentage points. During the DPU-state profiling experiment, the throughput remained at approximately 0.5160 graph executions/s for Original C2f and graph executions/s for C2fDeploy, closely matching the independent formal throughput measurements. Thus, the 1 ms status sampling did not materially perturb the execution behavior.
The CPU measurements showed the complementary effect. System-wide CPU utilization decreased from for Original C2f to for C2fDeploy, an 89.53% reduction. Because the reported system-wide value is normalized across the four Arm Cortex-A53 cores, the Original C2f utilization corresponds to approximately one core-equivalent of aggregate CPU capacity. Per-core traces typically showed the workload concentrated on one core, with occasional migration across cores. This behavior is consistent with the CPU-assigned strided_slice and numerical-format-conversion operations identified by the XIR analysis. After the rewrite, these CPU-side operations were largely removed and only low host-side activity remained during accelerator execution.
The external-memory results show a different but complementary trend. Aggregate APM-observed bandwidth increased from MB/s for Original C2f to MB/s for C2fDeploy. The increase does not indicate a larger memory cost per completed graph execution. Instead, the Original graph spends most wall-clock time in fragmented CPU-side execution and DPU–CPU transitions, leaving the accelerator memory path intermittently active. C2fDeploy keeps the DPU-supported path active substantially more continuously, thereby increasing sustained memory-interface activity per unit time.
After normalization by simultaneously measured whole-XModel throughput, aggregate APM-observed traffic decreased from MB/execution to MB/execution, corresponding to a 14.80% reduction. Therefore, C2fDeploy simultaneously increases sustained accelerator-side memory activity while reducing the APM-observed external-memory traffic associated with each completed graph execution.
Taken together, the utilization and bandwidth measurements provide direct runtime evidence for the execution mechanism inferred from the XIR structure. The Original graph combines very low sustained DPU activity with substantial host CPU involvement, whereas C2fDeploy shifts execution toward sustained DPU operation, substantially reduces CPU utilization, and decreases normalized external-memory traffic per completed graph execution.
3.5. Final Operating Points and Application Profile
The final C2fDeploy models provide two operating points (
Table 9). Deploy-s-512 retains the higher detection accuracy, whereas deploy-n-512 provides a lower-latency deployment configuration. Both models benefit from the same graph rewriting strategy and therefore maintain the compiler-friendly execution structure introduced by C2fDeploy.
Deploy-s-512 achieved 46.542 FPS under the DPU-stage measurement boundary, while deploy-n-512 further reduced the execution latency to 7.857 ms and increased throughput to 127.280 FPS. These values characterize the timed accelerator-stage execution loop and therefore exclude image-file access, complete host-side preprocessing, detection decoding, NMS, and visualization. They represent accelerator capability after removing compiler-induced graph fragmentation rather than complete application throughput.
To provide a controlled application-level comparison, a matched complete end-to-end GraphRunner profile was performed for Original C2f and C2fDeploy using the same deploy-s-512 checkpoint, KV260 platform, input radiograph, input size, batch size 1, preprocessing pipeline, and post-processing implementation. The timed interval included image loading, host preprocessing, input tensor handoff, complete XModel execution, output dequantization/copy, YOLO decoding, and NMS.
Table 10 summarizes the mean stage-wise latency across 50 timed complete-pipeline repetitions after five excluded warm-up executions. The Original C2f pipeline required 2045.923 ms per image, corresponding to 0.489 FPS, whereas C2fDeploy required 86.410 ms, corresponding to 11.573 FPS. The resulting complete end-to-end speedup was approximately
.
Within the same GraphRunner experiment, whole-XModel execution decreased from 1970.381 ms for Original C2f to 20.636 ms for C2fDeploy, corresponding to a XModel-stage speedup. This independently corroborates the whole-XModel throughput improvement obtained from the separate five-run xdputil benchmark, while using a different runtime measurement path.
The reported total end-to-end latency was measured directly over the complete included pipeline. Because the individual stage means in
Table 10 are rounded independently, their displayed sum may differ from the directly measured total by 0.001 ms.
Post-processing, defined as YOLO decoding plus NMS, required 4.628 ms for Original C2f and 3.899 ms for C2fDeploy. These values are derived from the corresponding decoding and NMS rows and are therefore not added separately to the total end-to-end latency.
Across the 50 timed complete-pipeline repetitions, total end-to-end latency for Original C2f had a standard deviation of 10.627 ms, a median of 2049.017 ms, and a 95th percentile (p95) of 2057.323 ms. The corresponding C2fDeploy values were 0.739 ms, 86.181 ms, and 87.786 ms, respectively.
The matched comparison shows that the complete application-level speedup is smaller than the graph-execution speedup because image loading, preprocessing, tensor handoff, output conversion, detection decoding, and NMS remain outside the C2fDeploy graph rewrite. Nevertheless, after these preprocessing and post-processing stages are included, C2fDeploy retains a substantial end-to-end speedup over Original C2f.
4. Discussion
4.1. Effect of Operator Representation on Compilation
C2fDeploy neither prunes the network nor reduces its theoretical convolutional arithmetic. Under the same checkpoint, calibration set, compiler, and DPU target, the controlled change is the representation of the first C2f projection and split. Replacing the runtime split with two parameter-derived projection branches removed the repeated CPU subgraphs associated with slicing and format conversion and consolidated DPU-supported computation into one DPU subgraph.
The direct runtime measurements provide additional evidence for the mechanism suggested by the XIR structure. Original C2f achieved a DPU compute-unit busy-time utilization of only , while its system-wide CPU utilization was . C2fDeploy reversed this execution distribution: DPU busy-time utilization increased to , while CPU utilization decreased to . These complementary measurements indicate that the performance difference is not merely associated with a different number of compiled subgraphs; it corresponds to a fundamental change from fragmented host-assisted execution to sustained accelerator execution.
The external-memory measurements are consistent with the same interpretation. C2fDeploy increased aggregate APM-observed bandwidth from to MB/s because the DPU and its memory path remained active for a much larger fraction of wall-clock time. However, normalized APM-observed traffic decreased from to MB/execution. Thus, the higher sustained bandwidth reflects greater accelerator activity rather than an increase in external-memory traffic per completed graph execution.
This result illustrates why parameter count and floating-point operation count are incomplete deployment indicators. Two graphs can represent the same FP32 function and require the same theoretical convolutional arithmetic, yet they produce different compiler partitions, host workloads, accelerator busy times, memory-interface behavior, and board-level performance.
4.2. Comparison with Source-Level C2f Replacement and Alternative Deployment Strategies
Although C2fDeploy achieves substantial acceleration by removing compiler-induced graph fragmentation, similar deployment problems can also be addressed through alternative strategies. These approaches differ from C2fDeploy in terms of modification scope, engineering effort, and preservation of the original model function.
A straightforward alternative is to modify the original YOLOv8 C2f implementation at the source-code level by replacing the runtime channel split with two independent convolutional branches. If these branches are initialized using the same exact partition of the trained convolution and batch-normalization parameters, such a source-level implementation can also preserve the original function without retraining. By contrast, an independently initialized source-level redesign would require training and re-validation. The practical distinction of C2fDeploy is that it performs this exact transformation systematically after training, starting from a standard trained C2f checkpoint, without requiring modification of the training-time model definition or training workflow. This allows the original training pipeline and checkpoint format to be retained while generating a compiler-friendly deployment graph.
Another possible solution is to implement unsupported operations using hardware-specific extensions, such as Vitis AI custom layers or fused-layer mechanisms. These methods provide maximum flexibility because dedicated kernels or compiler extensions can explicitly define the execution behavior of new operators. However, they usually require additional hardware–software co-design effort, including custom kernel development, compiler integration, runtime maintenance, and platform-specific optimization. C2fDeploy avoids these requirements by rewriting the graph using existing compiler-supported convolutional operators while preserving the original computation.
C2fDeploy is also different from approximation-based optimization methods, such as the DPU-aware attention approximation approach proposed by Karki et al. [
26]. These methods improve accelerator efficiency by reducing the computational cost of attention-related operations through approximation. Although such strategies can provide significant hardware benefits, they may introduce accuracy–efficiency trade-offs because the original computation is modified. In contrast, C2fDeploy focuses on deployment-oriented graph rewriting and preserves the original learned function through mathematically equivalent parameter partitioning.
Table 11 summarizes the differences among these strategies. Compared with source-level modification and custom hardware extensions, C2fDeploy requires lower engineering effort while maintaining exact functional equivalence. Compared with approximation-based optimization, C2fDeploy achieves acceleration without modifying the learned representation or introducing an approximation error.
4.3. Generalizability and Applicability Boundaries of C2fDeploy
Although C2fDeploy was validated using the Vitis AI 2.5 compilation flow and the DPUCZDX8G architecture on the Kria KV260 platform, the underlying principle is not limited to a single FPGA device. The key requirement of C2fDeploy is that the compiler generates inefficient host-side execution for channel splitting operations while the subsequent branch computations remain independent and can be represented by separated parameterized paths. Therefore, the effectiveness of C2fDeploy depends on the interaction between compiler behavior, target accelerator architecture, and graph representation rather than on the YOLOv8 model alone.
For newer Vitis AI versions or different DPU configurations, such as B512, B1024, or B4096-based platforms, the deployment benefit may vary. If future compiler versions provide optimized hardware implementations for channel splitting operators, the performance improvement obtained from C2fDeploy may be reduced. However, the proposed parameter transformation remains applicable as a graph-level deployment optimization because it does not depend on a specific DPU instruction set or hardware primitive.
Beyond YOLOv8 C2f blocks, the partition-copy strategy can potentially be extended to other split-based architectures, including CSP-style networks, other YOLO variants, and residual bottleneck structures containing channel partition operations. Such migration requires that the split branches are functionally independent and that the original parameters can be equivalently mapped to separated computational paths. Architectures with strong cross-branch interactions, dynamic routing, or data-dependent partitioning may require additional modifications and cannot be directly transformed.
Therefore, C2fDeploy should be considered a deployment-oriented graph rewriting principle rather than a model-specific optimization. Its applicability is determined by three conditions: (1) the existence of compiler-unfriendly split operations, (2) the availability of mathematically equivalent branch decomposition, and (3) the preservation of model semantics after offline parameter transformation.
4.4. Hardware and Application-Level Implications
Although C2fDeploy achieves a improvement in the whole-XModel xdputil benchmark, this improvement should be interpreted within the corresponding measurement boundary. The whole-XModel benchmark evaluates compiled graph execution, including DPU computation, CPU-assigned graph operations, and the associated tensor-format conversions, but it excludes application-level operations such as image-file access, radiograph decoding, preprocessing, detection decoding, NMS, and visualization. Therefore, the measured acceleration reflects the removal of compiler-induced execution fragmentation rather than an equivalent acceleration of every stage of the complete medical imaging workflow.
The direct utilization measurements provide a hardware-level explanation for this graph-execution speedup. During formal profiling, Original C2f kept the DPU compute unit non-idle for only of the benchmark interval while system-wide CPU utilization reached . C2fDeploy increased DPU compute-unit busy-time utilization to and reduced CPU utilization to . The graph rewrite therefore changes not only the number of XIR subgraphs but also the measured runtime balance between host and accelerator execution.
The matched GraphRunner comparison in
Table 10 provides a direct measure of how this graph-level acceleration propagates to the complete application pipeline. Under the same deploy-s-512 checkpoint, KV260 platform, input radiograph, and pre/post-processing implementation, total end-to-end latency decreased from 2045.923 ms for Original C2f to 86.410 ms for C2fDeploy. This corresponds to an approximately
complete end-to-end speedup.
Within the same GraphRunner experiment, whole-XModel execution decreased from 1970.381 ms to 20.636 ms, corresponding to a XModel-stage speedup. This independently corroborates the improvement observed in the formal five-run xdputil benchmark. Agreement between these two independent runtime measurements supports the conclusion that the dominant acceleration originates from removal of compiler-induced graph fragmentation.
The matched profile also demonstrates the resulting bottleneck shift. In the Original C2f pipeline, whole-XModel execution accounted for approximately 96.3% of the measured total end-to-end latency. After the rewrite, XModel execution accounted for approximately 23.9% of the C2fDeploy end-to-end latency, while approximately 76.1% occurred outside XModel execution. Consequently, the benefit of the approximately XModel-stage speedup is diluted to approximately at the complete application level because the surrounding host-side stages are not accelerated by the graph rewrite.
The remaining host-side latency arises from several stages of the practical medical imaging pipeline. Radiographs must be loaded from storage, decoded and preprocessed into the tensor representation required by the detector, transferred to the runtime input buffer, and subsequently processed through output conversion, YOLO decoding, and NMS. In the controlled GraphRunner experiment, the same radiograph was repeatedly accessed; therefore, image-loading latency may be influenced by the Linux page cache and should not be interpreted as a storage-device bandwidth measurement.
Several system-level optimizations could reduce this remaining bottleneck. First, asynchronous pipeline execution can overlap image acquisition or loading, CPU preprocessing, and accelerator inference by using multiple or double-buffered input buffers. Second, prefetching or preloading can reduce repeated storage-access latency when a sequence of radiographs is processed. Third, persistent buffer allocation and buffer reuse can reduce repeated host-side memory allocation and copy overhead. Finally, where supported by the runtime and memory architecture, zero-copy or reduced-copy data paths could decrease unnecessary movement between host-side preprocessing buffers and accelerator-accessible memory. These optimizations are complementary to C2fDeploy because they target the surrounding application pipeline rather than the neural-network graph itself.
From a practical PACS perspective, C2fDeploy therefore remains valuable even though the complete application does not inherit the full – graph-execution acceleration. The directly measured complete-pipeline improvement was approximately . C2fDeploy removes the dominant compiler-induced accelerator bottleneck, after which image access, preprocessing, output conversion, and post-processing become a substantially larger fraction of the remaining latency. C2fDeploy should therefore be viewed as an accelerator-side foundation for efficient medical edge inference rather than as a standalone solution to every source of end-to-end latency.
4.5. Function Preservation and Quantization
The function-preservation claim is supported jointly by the exact parameter mapping, the identical FP32 detection metrics, and the tensor-level comparison at all eight rewritten C2f outputs. The aggregate C2f-output MAE was and the relative error was , while the final raw network output retained a relative error of only . These small nonzero differences are consistent with finite-precision FP32 execution rather than a change in the represented function. Selecting channel groups after the original projection is equivalent, in exact arithmetic, to applying the corresponding partitioned projection and BN state before the split. The downstream bottleneck sequence and final projection are unchanged.
The INT8 results are not bit-identical because the two branches can receive different activation scales and finite-precision kernels. The small, mixed-direction metric differences therefore do not indicate an accuracy gain, but they show that the rewrite did not introduce a meaningful loss under the shared calibration protocol.
4.6. Relation to Existing Re-Parameterization and DPU-Aware Rewrites
C2fDeploy is related to structural re-parameterization methods such as RepVGG, Diverse Branch Block, and OREPA, but its objective and transformation stage are different. These methods generally introduce richer structures during training and convert them into simpler inference-time forms. C2fDeploy instead starts from an already trained C2f block and partitions its existing projection and BN state to remove a compiler-visible runtime split. No additional training-time branch is introduced, and no branch is learned specifically for deployment.
The method also differs from DPU-aware architecture substitution and operator approximation. Both C2fDeploy branches are obtained directly from the trained parameters; no unsupported operator is approximated, and no newly initialized projection is trained. The contribution is therefore not a new detector architecture, but an exact change in how the learned detector is represented to the deployment compiler. Linking this same-checkpoint rewrite to operator-level XIR evidence and direct board measurements distinguishes the present study from comparisons based only on different model variants or theoretical complexity.
4.7. Limitations
Several limitations should be considered when interpreting the reported results.
First, this study evaluates C2fDeploy using the Vitis AI 2.5 compilation flow, the DPUCZDX8G architecture, and the Kria KV260 platform. Although the proposed rewrite principle is not fundamentally restricted to this environment, the measured acceleration depends on how a specific compiler version maps channel partition operations and unsupported operators. Therefore, future evaluation with newer Vitis AI releases and different DPU configurations is required to fully characterize the portability of the method.
Second, the reported DPU utilization represents compute-unit busy time rather than internal arithmetic occupancy. Specifically, utilization was calculated from the time-weighted fraction for which the XRT-exposed DPU compute unit reported ap_idle=0. This directly measures whether the DPU compute unit is idle or non-idle over the benchmark interval, but it does not resolve the instantaneous occupancy of individual processing elements, MAC lanes, or internal execution pipelines. Consequently, the reported C2fDeploy value should be interpreted as DPU compute-unit busy-time utilization rather than PE- or MAC-level utilization.
Third, the reported memory-bandwidth values characterize the accelerator-side interfaces observed by the platform AXI Performance Monitor. They therefore quantify APM-observed external-memory activity rather than all traffic on the complete system DDR subsystem. The normalized MB/execution quantity is derived from mean APM-observed bandwidth divided by simultaneously measured graph throughput and should likewise be interpreted as normalized monitored traffic, not as a complete byte-accurate accounting of every system memory transaction.
Fourth, CPU utilization was reported as a system-wide value normalized across the four Arm Cortex-A53 cores. This definition facilitates comparison between the two graph variants, but it can obscure the distribution of work among individual cores. Per-core records showed that the Original C2f workload typically consumed approximately one core-equivalent of aggregate CPU capacity, although the active workload could migrate between cores.
Fifth, the external 12 V input-power measurement was introduced as an independent cross-check rather than as a traceable calibration of the onboard INA260. The external DC display provided voltage, current, and power readings and had specified operating ranges of 6–200 V DC and 0–20 A, but a manufacturer accuracy specification was not available. In addition, the external readings were sampled manually at five steady-state time points per run rather than recorded continuously. Consequently, the external results are used to verify the direction and approximate magnitude of the observed power and energy-efficiency changes, while the onboard INA260 remains the primary high-rate power measurement used for the main SOM-rail results. The two measurement paths also have different electrical boundaries: the external instrument measures the 12 V starter-kit input, whereas the onboard INA260 measures the 5 V rail. Their absolute power values should therefore not be interpreted as directly interchangeable.
Sixth, the current evaluation focuses on YOLOv8 C2f structures. Although the partition-copy principle can potentially be extended to other split-based architectures, successful migration requires that the split branches remain functionally independent and that the trained parameters can be equivalently decomposed. Networks containing dynamic routing or strong cross-branch dependencies may require additional modifications.
Finally, C2fDeploy targets deployment optimization after model training. Therefore, it complements rather than replaces broader system-level optimization approaches, including data-pipeline acceleration, memory optimization, and runtime scheduling strategies required for complete medical AI deployment.
5. Conclusions
C2fDeploy removes the YOLOv8 C2f runtime split by partitioning the trained projection and batch-normalization parameters, preserving the detector’s FP32 function without retraining or introducing additional parameters. On the Kria KV260 platform using the Vitis AI 2.5 compilation flow, the proposed rewrite eliminated the C2f-related CPU slicing operations, consolidated DPU computation into one subgraph, and increased same-checkpoint whole-XModel throughput by in the formal xdputil benchmark while reducing SOM-rail energy per execution by 98.2%.
An independent 12 V starter-kit input-power cross-check reproduced the same energy-efficiency trend, yielding an approximately 98.5% reduction in external-input energy per graph execution.
Direct runtime profiling further showed that the graph rewrite substantially changed hardware utilization. DPU compute-unit busy-time utilization increased from for Original C2f to for C2fDeploy, while system-wide CPU utilization decreased from to . Aggregate APM-observed external-memory bandwidth increased from to MB/s as accelerator execution became substantially more continuous. After normalization by whole-XModel throughput, however, APM-observed traffic decreased from to MB/execution, indicating that the higher sustained bandwidth was accompanied by lower monitored memory traffic per completed graph execution.
An independent matched GraphRunner comparison produced a XModel-stage speedup, closely corroborating the formal whole-XModel benchmark. When image loading, host preprocessing, tensor handoff, complete XModel execution, output dequantization/copy, YOLO decoding, and NMS were all included, complete end-to-end latency decreased from 2045.923 ms for Original C2f to 86.410 ms for C2fDeploy, corresponding to an approximately application-level speedup. The resulting difference between graph-level and end-to-end acceleration demonstrates that, once compiler-induced graph fragmentation is removed, surrounding host-side stages constitute a substantially larger fraction of practical deployment latency.
Although validated on YOLOv8 and the KV260 platform, C2fDeploy represents a general deployment-oriented graph rewriting principle for split-based neural architectures. Its applicability depends on whether compiler-unfriendly partition operations can be transformed into equivalent parameterized execution paths while preserving model semantics. Therefore, C2fDeploy complements rather than replaces model architecture optimization and system-level pipeline optimization, and it provides a practical approach for improving accelerator-friendly representations in FPGA-based edge AI deployment.