Article

AC Fault Ride-Through Strategy for Offshore Wind Power via Diode Rectifier Unit-Based Transmission System


State Grid Jiangsu Electric Power Co., Ltd., Research Institute, Nanjing 211103, China
*
Author to whom correspondence should be addressed.
Electronics 2026, 15(18), 4201; https://doi.org/10.3390/electronics15184201
Submission received: 11 August 2026 / Revised: 9 September 2026 / Accepted: 13 September 2026 / Published: 16 September 2026

Abstract

The offshore wind power transmission system based on a diode rectifier unit (DRU) high-voltage direct current (HVDC) faces DRU blocking under sending-end AC faults and DC overvoltage under receiving-end AC faults. To address these two types of AC fault scenarios, corresponding fault ride-through strategies are proposed. For sending-end AC faults, a fault ride-through strategy based on active voltage reduction of the receiving-end converter station is proposed. An active voltage reduction control loop based on DC current deviation is added before the original DC voltage control loop of the receiving-end converter station, so that the DC voltage can be adaptively reduced with the decrease in DC current during sending-end faults. Thus, the conduction condition of the DRU is satisfied, and wind power transmission is maintained. For receiving-end AC faults, a fault ride-through strategy based on source-side active power reduction is proposed. According to the coupling relationship between the DC voltage and the wind turbine outlet voltage, an active power reduction control loop based on the outlet voltage deviation is added before the active power control loop of the wind turbine grid-side converter. During receiving-end faults, each wind turbine actively reduces its active power output, thereby suppressing the DC-side power surplus from the source side. The effectiveness of the proposed strategies was further evaluated through comparative simulations. Taking the 50% voltage-sag cases as examples, the proposed strategy maintains the DC current and transmitted power at approximately 0.84 p.u. and 0.42 p.u., respectively, during the sending-end fault, whereas both decrease to zero under the traditional strategy. During the receiving-end fault, the proposed strategy limits the DC voltage to within 1.05 p.u. and stabilizes the sending-end and receiving-end transmitted powers at approximately 0.49 p.u., while avoiding sustained voltage and current oscillations.

1. Introduction

As offshore wind power develops toward deep, far-sea sites and larger capacities, the economy, reliability, and lightweight design of offshore wind power transmission systems have attracted wide attention [1,2,3,4]. The high-voltage direct current based on modular multilevel converter (MMC-HVDC) transmission system has good controllability, but the large size, heavy weight, and high cost of offshore converter platform limit its application in deep-sea wind power development [5,6,7]. In contrast, a high-voltage direct transmission system based on a diode rectifier unit (DRU-HVDC) adopts DRU as the offshore converter platform, eliminating the need for a fully controlled offshore converter and its complex control system. Owing to its simple structure, low cost, and high reliability, this approach has become one of the important technical solutions for large-scale offshore wind power transmission [8,9,10].
In offshore wind power transmission systems via DRU-HVDC, the DRU cannot actively establish the sending-end AC voltage, nor can it independently regulate active and reactive power. Therefore, wind turbines must not only perform power control but also support the voltage and frequency of the sending-end AC system. Existing studies generally adopt grid-forming control strategies so that wind turbines can autonomously establish the offshore AC voltage while providing commutation conditions for the diode rectifier. In [11], a phase-locked-loop-based grid-forming control was proposed. When the wind turbine is connected to the grid, the phase of the AC grid is tracked by the phase-locked loop, so that the synchronous grid connection is realized without switching the control mode. In [12], the strong correlations between active power and sending-end voltage and between reactive power and sending-end frequency in a DRU-HVDC system are proved by sensitivity analysis. On this basis, the power outer-loop controllers of P/V and Q/f are constructed. In [13], a Q/f synchronization control method was proposed, and a first-order inertial controller was added to the Q/f control loop to improve the dynamic response characteristics of the control system.
For sending-end AC faults in DRU-HVDC systems, existing studies mainly focus on wind turbine protection and fault current control. In [14], the DC chopper is used to absorb the redundant power during the sending-end AC fault, so as to reduce the power imbalance between the AC and DC sides of the grid-side converter and maintain the stability of the DC capacitor voltage. In [15], a control method that adaptively regulates the fault current based on the voltage deviation was proposed, so that the wind turbine can quickly provide controlled fault current during the fault period, and cooperate with overcurrent protection to realize fault detection and isolation. In [16], a grid-forming control and an adaptive virtual-impedance low-voltage ride-through strategy for the wind turbine grid-side converter were proposed. The fault current is suppressed by dynamically adjusting the equivalent output impedance of the converter, and the voltage and power recovery performance after fault clearance is improved. The above methods can limit wind turbine overcurrent to a certain extent. However, the AC-side voltage of the DRU still drops during sending-end faults. The receiving-end converter station still operates under constant DC voltage control, so the DC-side voltage of the DRU remains at a relatively high level. As a result, all of these methods still suffer from DRU blocking and interrupted power transmission.
For receiving-end AC faults in DRU-HVDC systems, most of the existing studies have followed the method of installing DC choppers in the MMC-transmission system. The DC chopper is used to consume the surplus power during the fault to suppress the overvoltage of the HVDC transmission line. In [11], an active voltage-boosting control strategy for the receiving-end converter station was proposed. During the AC fault at the receiving-end, by rapidly increasing the DC voltage, the positive voltage difference on both sides of the DRU is reduced, and the active power transmitted by the DRU to the DC system is reduced to alleviate the DC line overvoltage caused by the power imbalance between the sending and receiving ends. In [17], while the DC voltage is raised, the port voltage of the wind turbine grid-side converter is also reduced. This further weakens the active power transmission capability of the DRU. The above methods can improve the receiving-end AC fault ride-through capability of DRU-HVDC systems to a certain extent. However, they rely on raising the DC-side voltage or adding energy-dissipation devices, which increases the voltage stress and hardware cost of the system. Neither of them considers the influence of the wind turbines’ active power output on the overvoltage.
In summary, existing research on sending-end and receiving-end AC faults in offshore wind power transmission via DRU-HVDC systems still has the following shortcomings:
(1)
For sending-end AC faults, existing studies mostly focus on wind turbine protection. During the fault, the receiving-end converter station still maintains a high DC voltage, resulting in the DRU blocking due to the decrease in DC output capacity, which tends to trip the wind turbines and disconnect them from the grid.
(2)
For receiving-end AC faults, existing studies mostly rely on a DC chopper to consume the surplus power, or on reducing the power transmission capability of the DRU. They do not actively regulate the active power output of the wind farm, and it is difficult to suppress the power surplus during the fault at the receiving end from the source.
To address the above shortcomings, this paper studies the transient mechanisms and fault ride-through control of DRU-HVDC systems under sending-end and receiving-end AC faults. The main contents are as follows:
(1)
For sending-end AC faults, the mechanism of DRU blocking under the traditional wind-turbine current-limiting strategy is analyzed. The active power characteristics of the DC system during the fault are clarified. A fault ride-through control strategy based on active voltage reduction of the receiving-end converter station is proposed. During the fault, the DC voltage of the receiving-end converter station is reduced to maintain the DRU conduction, which can reduce the risk of system shutdown and grid disconnection.
(2)
For receiving-end AC faults, the transient mechanism of DC system overvoltage during the fault is analyzed. The coupling relationship between the system DC voltage and the wind turbine outlet voltage is derived. A fault ride-through control strategy based on source-side active power reduction is proposed. During the fault, the active power injected by the wind farm into the DC system is reduced, alleviating the DC system overvoltage problem.

2. Topology and Basic Control of Offshore Wind Power Transmission via Diode Rectifier Units

2.1. System Topology

The topology of the offshore wind power transmission system via diode rectifier units is shown in Figure 1. The offshore wind farm is collected via the collector cable system to the point of common coupling (PCC), which is then connected to the sending-end DRU. The DRU rectifies the AC power output from the wind farm into DC power, which is transmitted through the DC submarine cable to the onshore receiving-end converter station; the receiving-end converter station adopts a hybrid MMC. Since the DRU cannot actively build up voltage, the wind turbines must establish and maintain the offshore AC voltage and frequency through grid-forming control, while the receiving-end converter station is mainly responsible for DC voltage control.

2.2. Wind Turbine Control Strategy

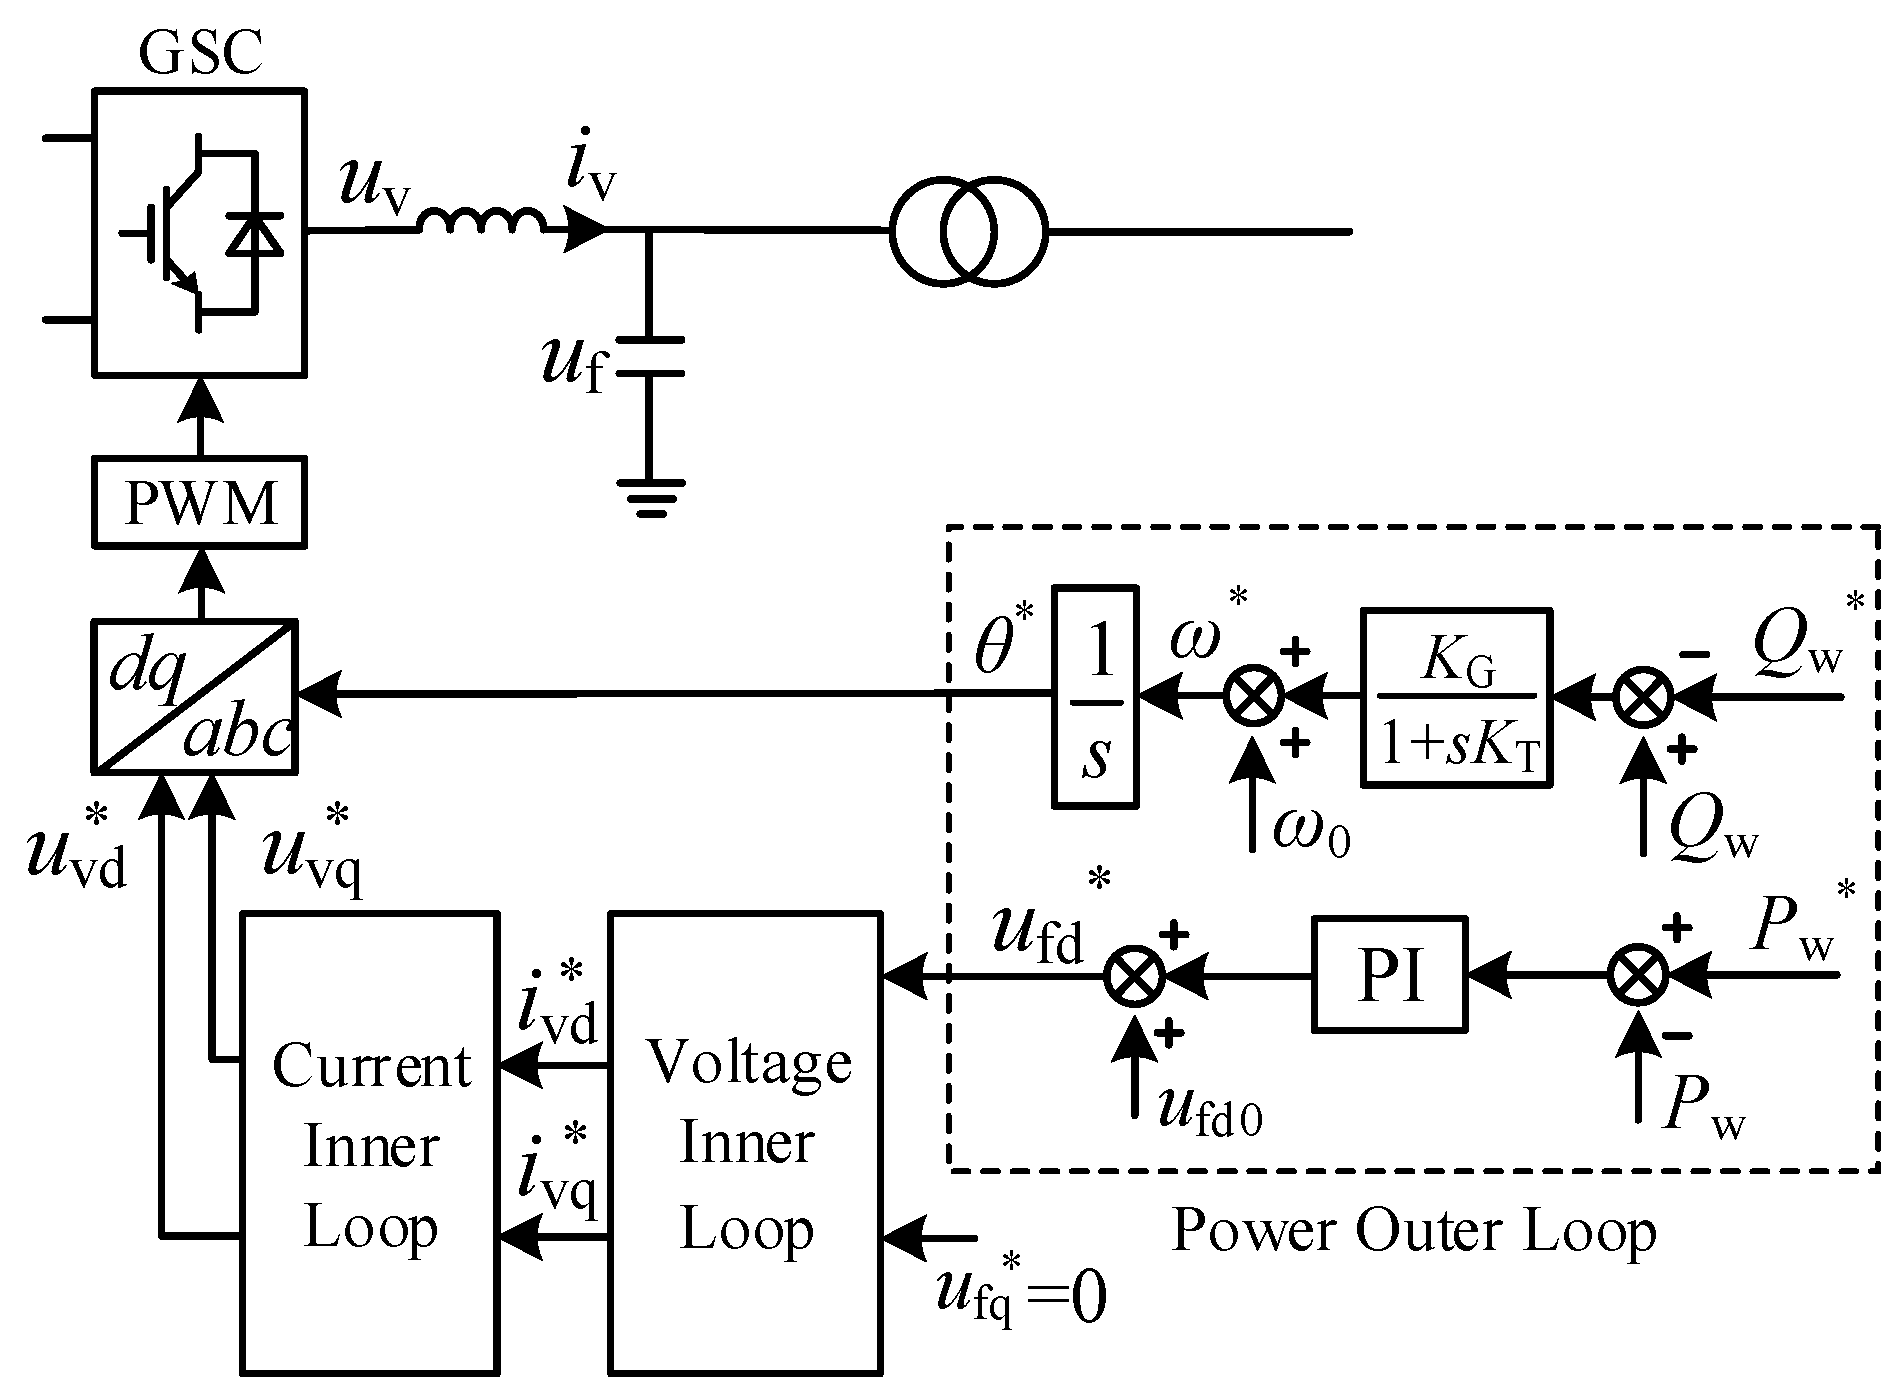
The wind farm adopts direct-drive permanent magnet synchronous wind turbines, mainly composed of a machine-side converter and a grid-side converter. The machine-side converter maintains the wind turbine’s DC bus voltage, while the grid-side converter controls the offshore AC voltage and frequency. Because the active power output of the wind turbine is strongly correlated with the sending-end AC voltage magnitude, and the reactive power output with the sending-end AC frequency [18], P/V and Q/f outer loops are adopted in the grid-side converter control, with voltage and current inner loops providing fast current regulation and voltage source characteristics. The complete control structure is shown in Figure 2.

2.3. Receiving-End Converter Station Control Strategy

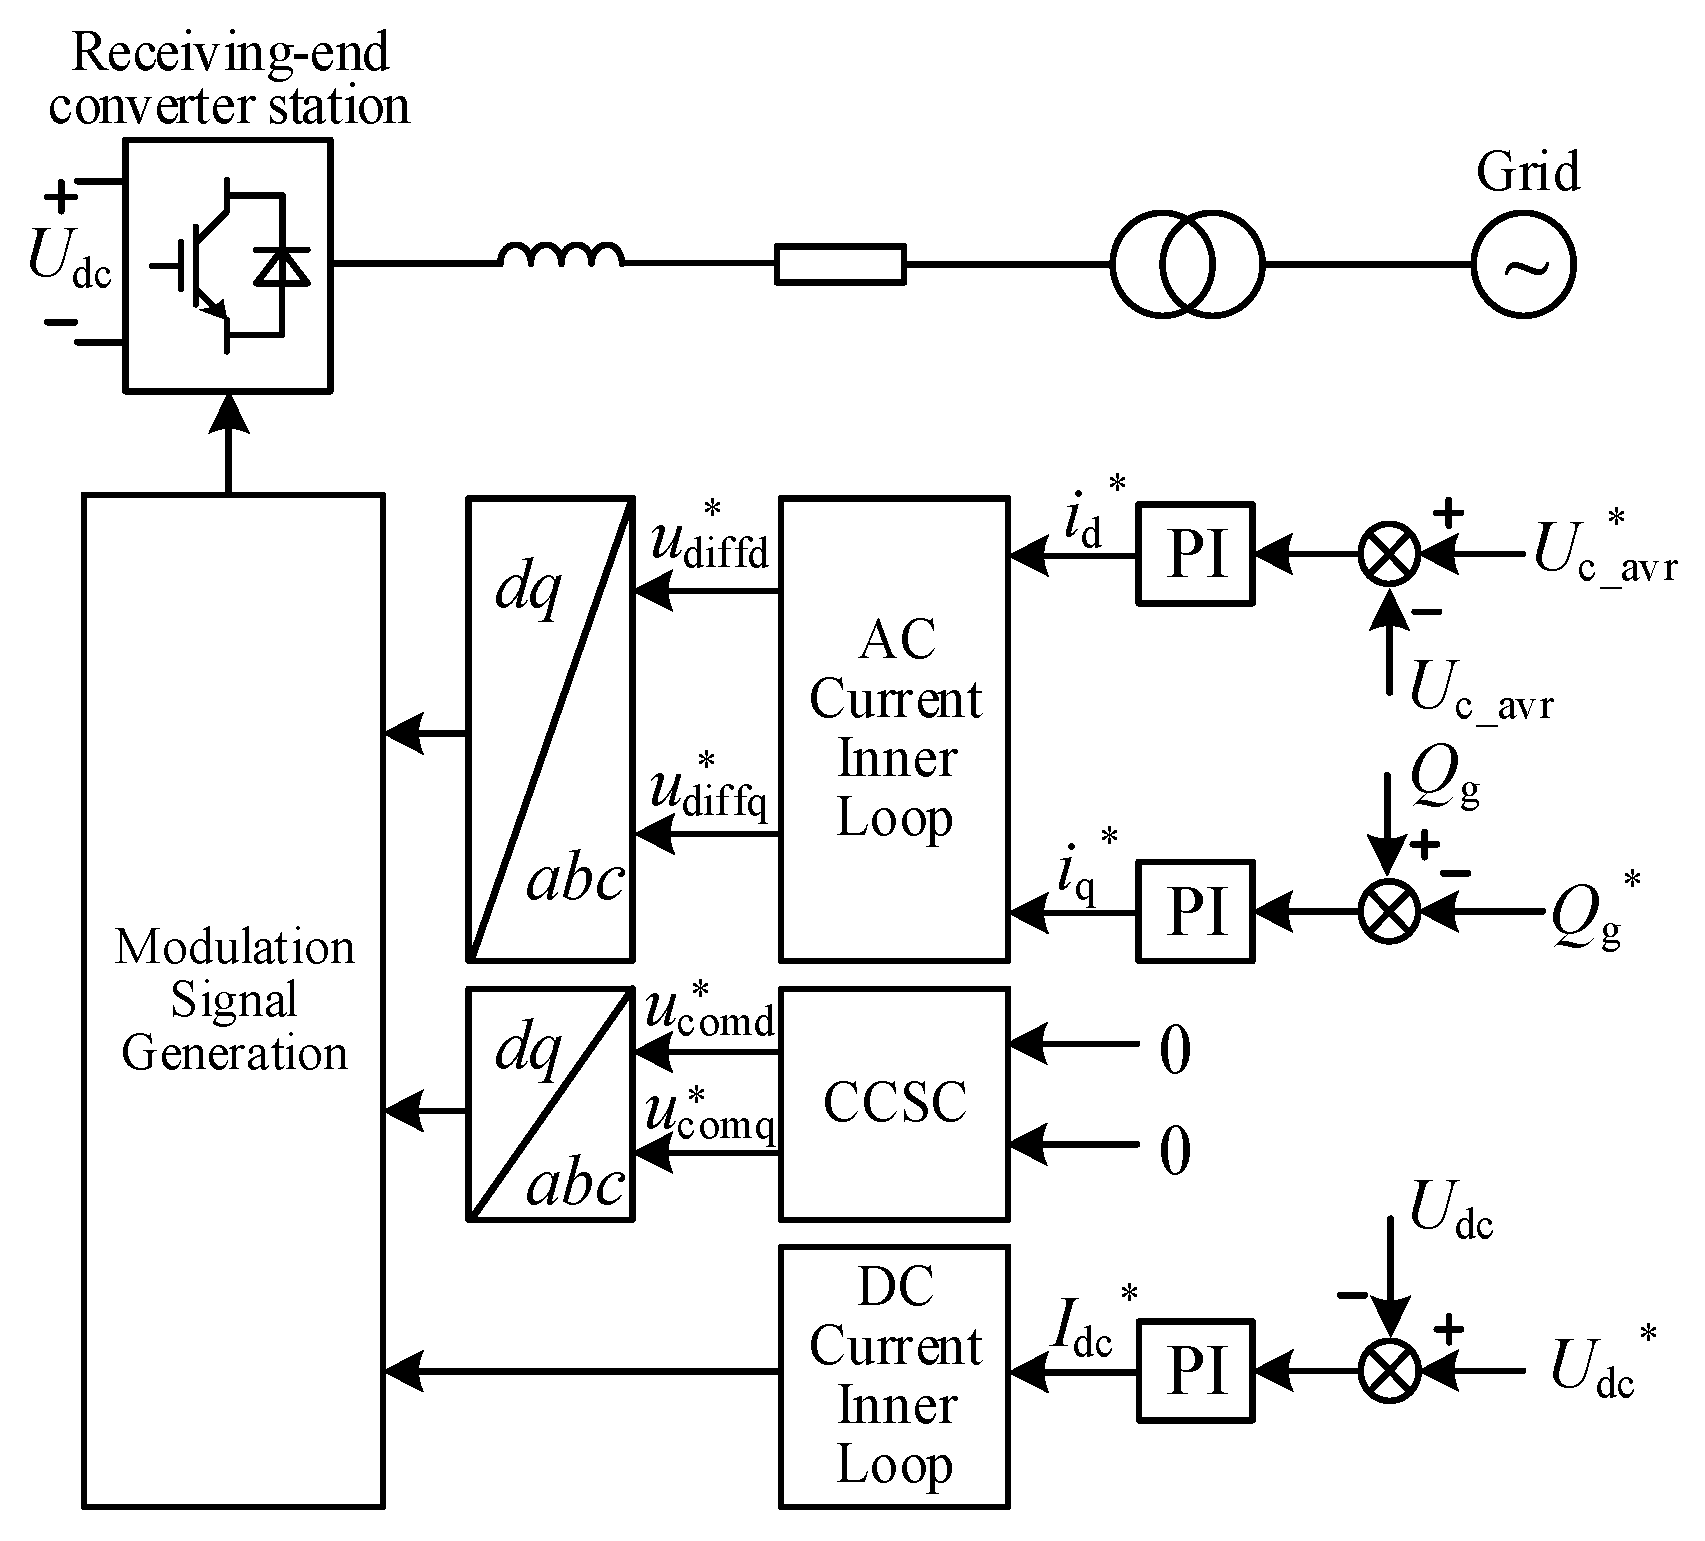
The receiving-end converter station maintains the voltage stability of the DC transmission line, and inverts the wind power transmitted via the DC line before feeding it into the receiving-end AC grid. A hybrid MMC is adopted for its larger DC voltage regulation range and its capability of DC fault current blocking and voltage step-down operation, which improves the fault ride-through capability under complex conditions [19,20]. As shown in Figure 3, the control strategy includes submodule capacitor voltage control, reactive power control, and DC voltage control, which generate the d-axis current reference, the q-axis current reference, and the DC current inner loop reference, respectively.

3. Sending-End AC Fault Characteristic Analysis and Fault Ride-Through Strategy

3.1. Transient Characteristics Under the Traditional Wind-Turbine Current-Limiting Fault Ride-Through Strategy

According to the technical requirements for wind farm grid integration, once the voltage at the wind farm’s point of common coupling Upcc drops to 0.8 p.u., the grid-side converter of each wind turbine switches from its normal steady-state control to a low-voltage ride-through control mode, in which the outer power control is replaced by direct current-loop regulation and the wind turbine is required to inject reactive current into the grid. The corresponding d-axis and q-axis current references are given by
i vq * = K × ( 0.9 U pcc ) × I wN i vd * = I wmax 2 i vq 2 ( 0 U pcc 0.9 )
where K is the proportional coefficient of the dynamic reactive current, Iwmax is the maximum output current of the wind turbine, and IwN is the rated current of the wind turbine.
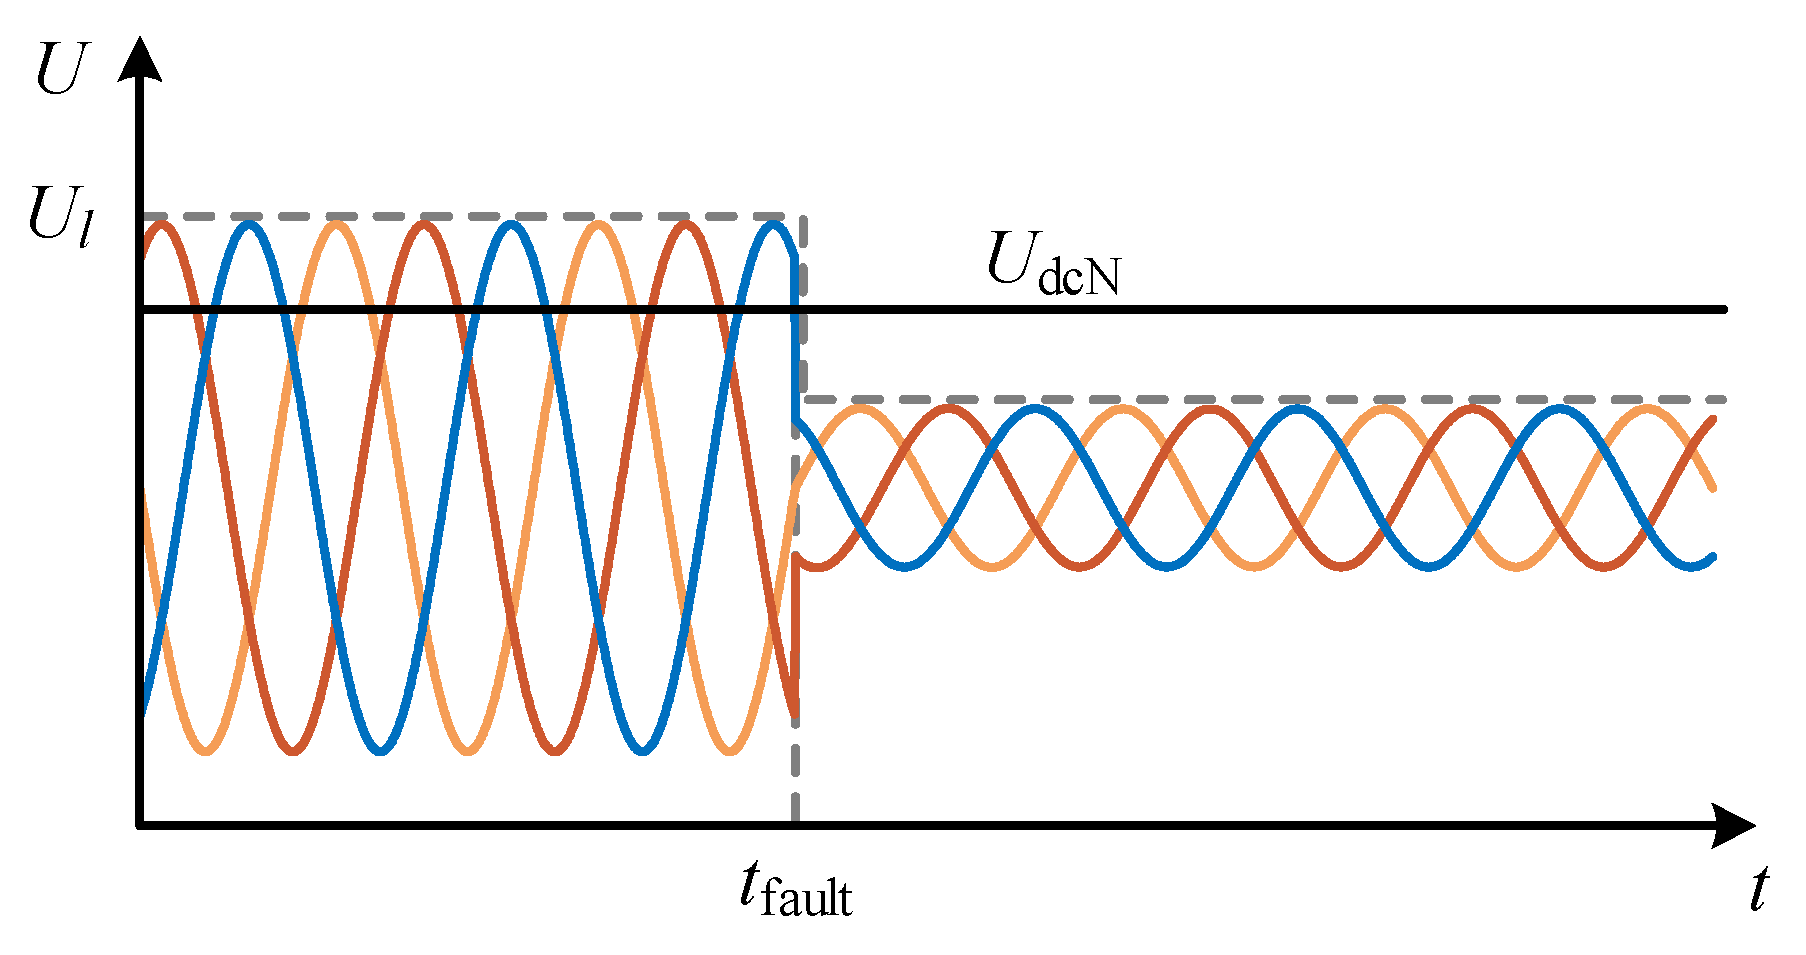
In the traditional fault ride-through strategy based on wind-turbine current limiting, the receiving-end converter station maintains the DC voltage at its rated value during the fault, and the transient process is shown in Figure 4. The DRU output DC voltage Udc,DRU is jointly determined by Upcc and the DC current Idc, and can be expressed as:
U dc , DRU = K d U pcc X d I dc
where Kd = 6√2KT/π, Xd = 6XT/π and KT and XT are the transformation ratio and leakage reactance of the converter transformer, respectively. When the voltage drop fault occurs in the sending-end AC system, the AC line-voltage magnitude Ul drops rapidly. According to Equation (2), the drop in AC voltage at the sending end will directly lead to a decrease in DRU output DC voltage. The direct current expression is:
I dc = U dc , DRU U dc R dc
where Rdc is the resistance of the DC line. When the DRU output DC voltage Udc,DRU is less than or equal to the receiving-end DC voltage Udc, the DC current rapidly drops to zero, causing the DRU to block. At this point, the DRU can no longer rectify normally; the active power of the wind farm can no longer be transmitted outward, and, in severe cases, the wind turbine or converter-station protection may trip, causing the system to shut down and disconnect from the grid. Therefore, relying solely on the traditional wind-turbine current-limiting fault ride-through strategy is inadequate for sending-end AC voltage drop faults, and a fault ride-through strategy more suitable for sending-end AC faults in DRU-HVDC systems needs to be designed.

3.2. Analysis of DC System Active Power Characteristics

Combining Equations (2) and (3), the relationship between the receiving-end DC voltage Udc and the sending-end AC voltage Upcc and the DC current Idc can be obtained as:
U dc = K d U pcc ( X d + R dc ) I dc
Furthermore, the functional relationship between the DC system’s transmitted active power Pdc and Idc can be obtained:
P dc = U dc I dc = K d U pcc I dc ( X d + R dc ) I dc 2
After a sending-end AC fault occurs, Upcc drops to Upcc,f. In order to keep the DRU conducting, Udc cannot remain at a fixed value and must be reduced accordingly. Assuming the DRU remains conducting during the fault, Pdc and Idc still satisfy the relationship in Equation (5), and for any operating point, a Udc value satisfying the DRU conduction condition can be determined. Equation (5) expresses Pdc as a function of Idc, which is a downward-opening parabola with zeros at Idc = 0 and Idc = KdUpcc,f/(Xd + Rdc). Therefore, without considering other constraints, the range of Idc corresponding to Pdc ≥ 0 is:
0 I dc K d U pcc , f X d + R dc
and at the symmetry axis
I dc , sym = K d U pcc , f 2 ( X d + R dc )
Pdc reaches its theoretical maximum value:
P dc , max 0 = ( K d U pcc , f ) 2 4 ( X d + R dc )
In addition, during the fault, the DC current is also limited by the allowable current of the DRU, the converter transformer, the DC line, and the receiving-end converter station. Defining Idc,max as the maximum current allowed by the DC system, and considering the DC current limit, the range of Idc corresponding to Pdc ≥ 0 becomes:
0 I dc I dc , lim
where
I dc , lim = min I dc , max , K d U pcc , f X d + R dc

3.3. Sending-End Fault Ride-Through Strategy Based on Active Voltage Reduction of the Receiving-End Converter Station

To solve the problem of DRU blocking caused by an AC fault at the sending end under the traditional fault ride-through strategy, a fault ride-through strategy based on active voltage reduction of the receiving-end converter station is proposed in this paper.
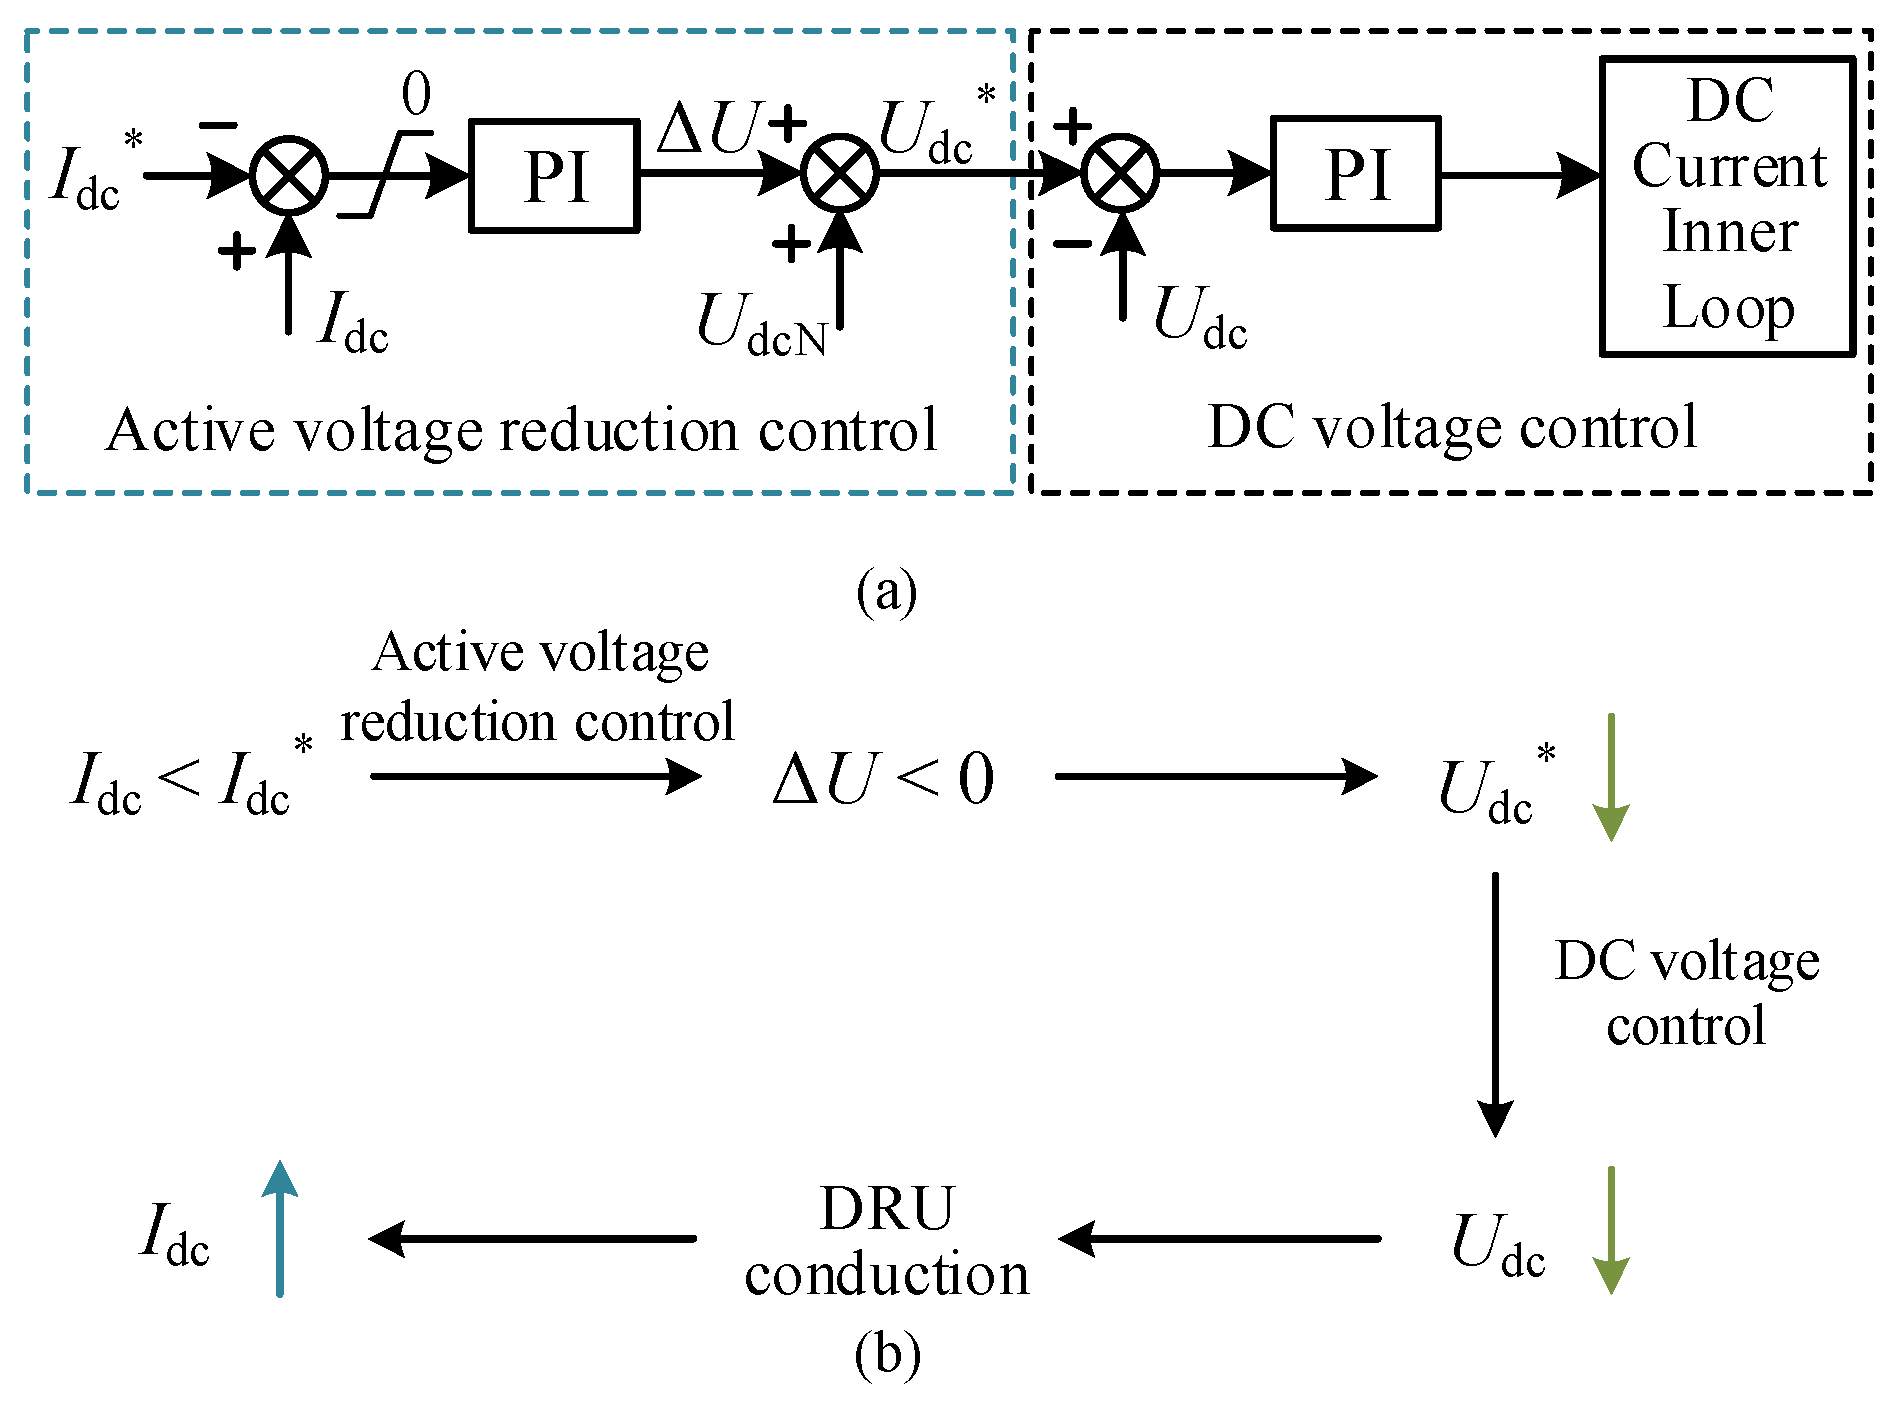
Based on the analysis results in Section 3.2, an active voltage reduction control loop based on the DC current deviation is added to the original DC voltage control loop of the receiving-end converter station, as shown in Figure 5a. It enables Udc to changes from a fixed value to a variable that adaptively adjusts with the fault severity during a sending-end fault, so that the operating point of the DC system is maintained within the feasible region. The control loop takes the deviation between the active voltage reduction threshold I dc * and the actual DC current Idc as its input, generates the DC voltage correction ΔU through the PI controller, and superimposes it on the rated DC voltage UdcN to form the DC voltage reference value U dc * during the fault. Its control law is:
Δ U = ( k ip + k ii s ) ( I dc I dc * ) U dc * = Δ U + U dcN
The setting of I dc * is considered for two cases: an online value calculated during the fault, and a preset value used under steady-state operation. During the fault, Idc must not exceed the upper limit given by Equation (10). It requires Upcc to be measured and transmitted to the receiving-end converter station, where Idc,lim is calculated online to determine the specific value of Idc. However, the measurement and communication of Upcc involve time delays. Therefore, an I dc * is preset in the steady state, so that the active voltage reduction control loop can respond quickly at the onset of a fault, thus preventing the DRU from blocking.

3.3.1. Online Calculation Value During the Fault

After the measured value of Upcc converges and stabilizes, the controller calculates the corresponding Idc,lim from Equation (10). To transmit as much active power as possible, a margin coefficient km ∈ (0, 1] is introduced. When Idc,max > Idc,sym, I dc * is set as:
I dc * = k m I dc , sym
The Idc,sym already lies within the maximum current allowed by the system. So km can be set to 1 to make Pdc as large as possible.
When Idc,maxIdc,sym, I dc * is set as:
I dc * = k m I dc , max
The theoretical optimal operating point exceeds the system’s allowable maximum current Idc,max; km must be set to a value less than 1, mainly to leave a margin between the actual value of I dc * and Idc,max, preventing Idc from exceeding Idc,max and thereby improving the safety of the control. In practice, the value of km can be chosen empirically, set as close to 1 as safety allows, so as to transmit as much active power as possible.

3.3.2. Steady-State Preset Value

In order to enable the active voltage reduction control loop to respond quickly during the period from the occurrence of a fault to obtaining the online calculation value, a steady-state threshold Idc0 is preset under normal operating conditions. The threshold serves as the steady-state reference value I dc * .
Considering a relatively severe fault condition, with Upcc,f = 0.1 p.u. taken as the preset fault severity. Based on the specific system parameters, the relationship between Idc,max and Idc,sym is determined, and the corresponding equation, Equation (12) or Equation (13), is used to compute the steady-state threshold offline in advance.
The output of the DC current comparator in the active voltage reduction control loop is limited to an upper bound of zero. Under normal operating conditions, the limiter blocks the threshold from taking effect, so the original constant DC voltage control of the receiving-end converter station is not affected:
Δ U < 0 ,   I dc < I dc * Δ U = 0 ,   I dc I dc *
The combination of the preset threshold and the limiter prevents the active voltage reduction control from being triggered by mistake during normal operation. At the same time, it allows the control to engage automatically when the DC current drops due to a fault at the sending end, without requiring additional fault detection.
The operating mechanism of the active voltage reduction fault ride-through strategy is shown in Figure 5b. After the fault occurs, the DC current Idc falls below the threshold I dc * , and the active voltage reduction control loop is activated. Based on the DC current deviation, the loop generates a negative voltage correction ΔU. The correction is added to the rated DC voltage reference, reducing the DC voltage reference value U dc * of the receiving-end converter station. The DC voltage control loop then drives the actual DC voltage Udc to follow this lower reference. As the DC voltage decreases, the DRU again satisfies its conduction condition. The DC current Idc recovers, and the active power Pdc increases accordingly.
The proposed active voltage reduction strategy also has a theoretical operating limit. In the extreme case of a metallic three-phase fault at the sending end, where Upcc collapses completely to zero, the DRU output DC voltage Udc,DRU likewise falls to zero. If the active voltage reduction control loop continued to command a nonzero DC current under this condition, the resulting DC voltage reference Udc would be driven negative, which is not physically meaningful and could cause the submodule capacitors of the receiving-end converter station to charge rapidly, potentially resulting in a loss of control. To address the limiting condition, a lower bound of zero is imposed on the DC voltage reference Udc in the receiving-end converter station’s control loop, preventing U dc * from becoming negative.

4. Receiving-End AC Fault Characteristic Analysis and Fault Ride-Through Strategy

4.1. Transient Characteristics Under the Traditional DC Energy Dissipation Fault Ride-Through Strategy

When a fault occurs in the receiving-end AC grid, the voltage at the fault point drops instantaneously, and the active power output of the receiving-end converter station is hindered. DRU does not have power regulation capability, and the output active power of the wind farm continues to be injected into the DC system. This leads to a large amount of active power surplus in the DC system, forcing the sub-module capacitor of the receiving-end converter station to charge quickly. Due to the lack of effective energy dissipation channels in the DC system, the DC bus voltage will soon exceed the relay protection action limit. In severe cases, it will trigger the blocking of the converter station, which will cause the system to stop running and seriously threaten the safe and stable operation of the system.
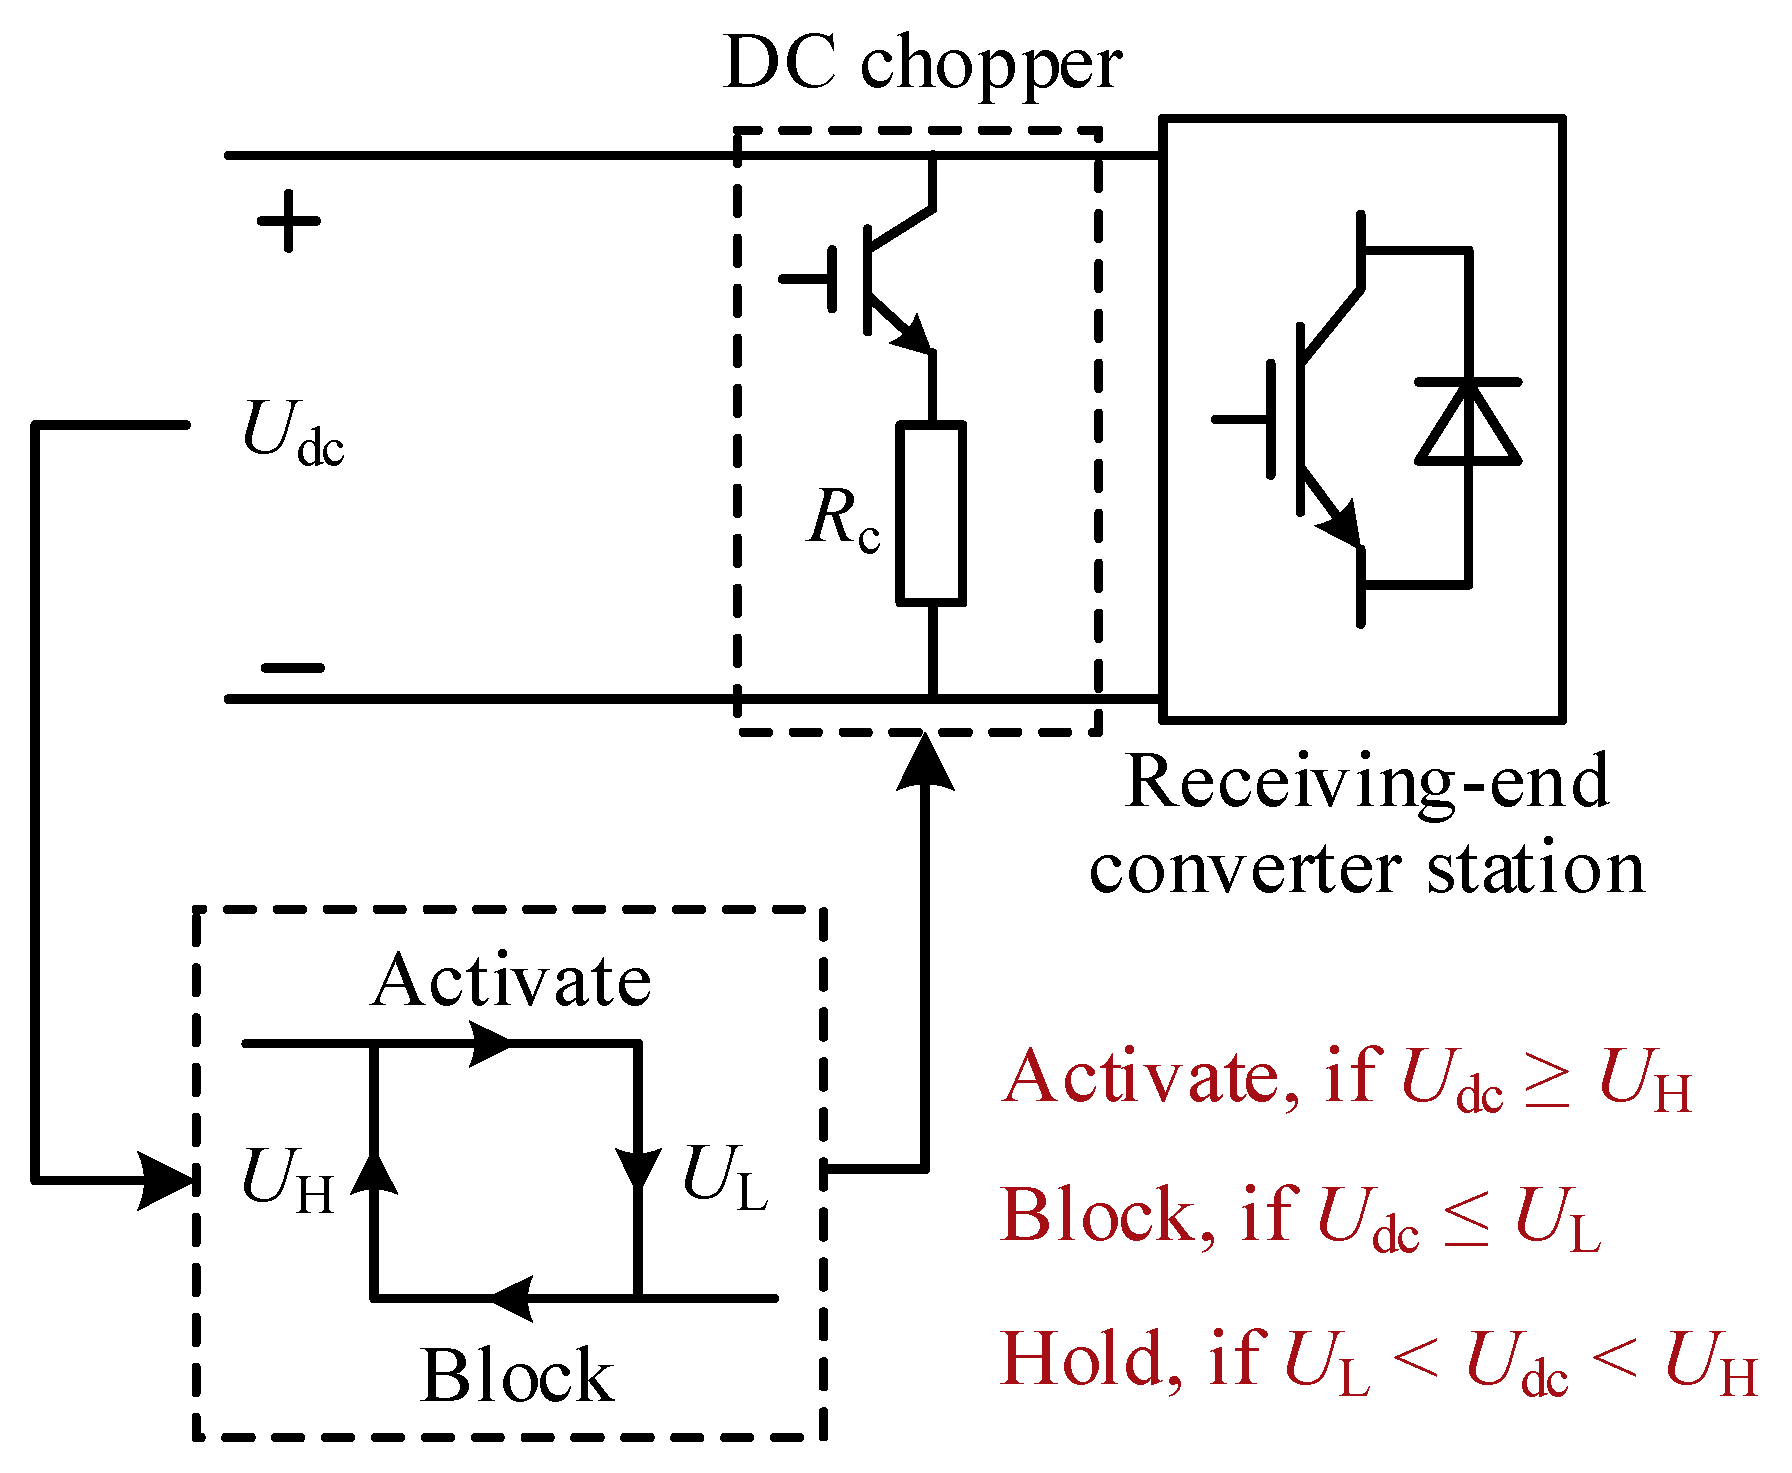
To address this problem, existing studies mostly adopt a DC chopper connected in parallel on the DC side of the receiving-end converter station to achieve fault ride-through, as shown in Figure 6. The DC chopper is composed of a power switch, such as an IGBT, and a crowbar resistor, which are connected in series and then connected to the DC bus. During normal operation, the device remains blocked and does not participate in operation; when the DC voltage exceeds the upper threshold UH, the switching device conducts, converting the surplus energy into heat to suppress the DC overvoltage; when the voltage falls back to the lower threshold UL, the switch turns off and the energy-dissipation branch is withdrawn.
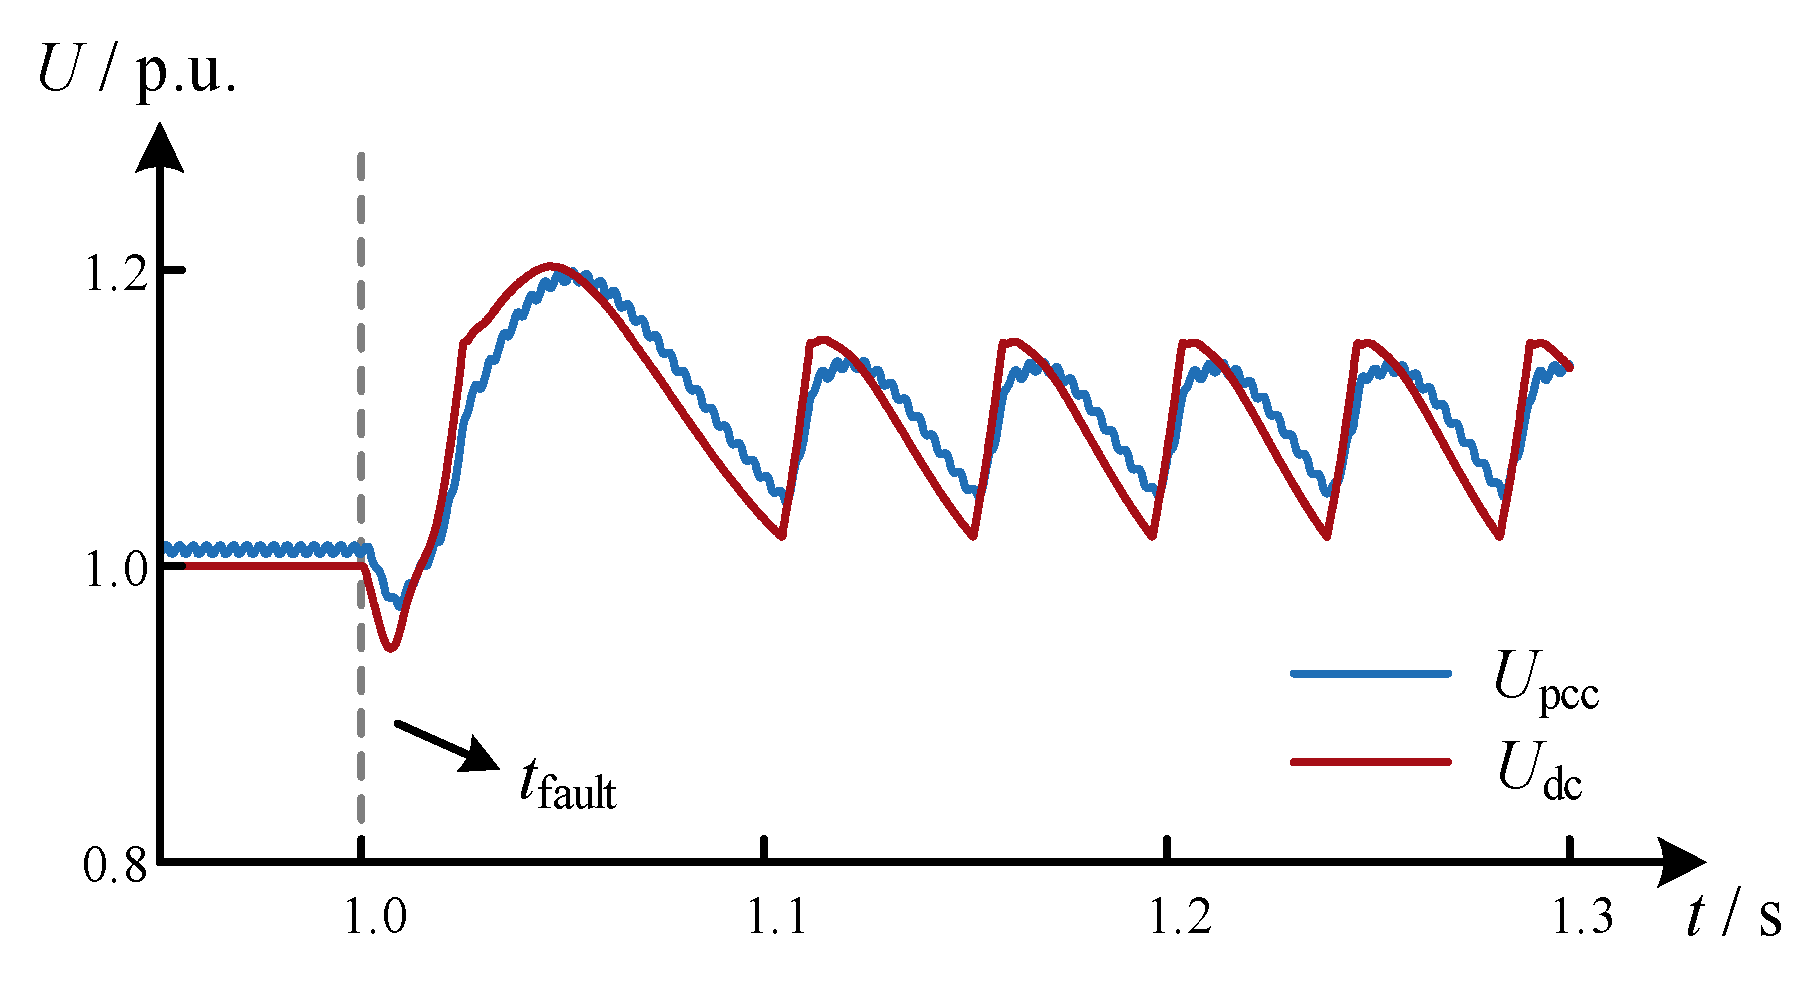
Under the traditional DC energy dissipation strategy, the sending-end AC voltage Upcc exhibits pronounced periodic oscillation during the fault. The reason is that the repeated switching of the chopper causes the DC voltage Udc to oscillate periodically between UH and UL. In the MMC-HVDC system, if the DC chopper is likewise adopted at the receiving end, this periodic fluctuation of Udc generally remains confined to the DC side. Because the sending-end converter station is itself a fully controllable MMC that actively establishes the sending-end AC voltage through its own grid-forming control, consisting of a V/f outer loop and voltage and current double inner loops. Therefore, the AC-side voltage is generated independently of the instantaneous DC bus voltage. The DRU cannot isolate the DC-side voltage oscillation, which is further transmitted to the AC bus at the sending end, causing the AC voltage to fluctuate repeatedly. As shown in Figure 7, the waveforms of Upcc and Udc are nearly identical in shape and oscillation frequency, which directly reflects this transmission mechanism.
The oscillation has several adverse effects. First, the repeated voltage impacts increase the voltage stress on the DC line and the converter, accelerating component fatigue. Second, the sustained AC voltage disturbance interferes with the normal operation of the wind turbine control system, creating a risk of turbine disconnection. Third, the resistive dissipation process is limited by the switching response speed and the energy dissipation rate, making it difficult to promptly consume the surplus power that accumulates rapidly at the onset of the fault. As a result, the suppression of the initial DC overvoltage peak is limited. These issues motivate the design of a receiving-end AC fault ride-through strategy that better matches the topology and operating characteristics of the DRU-HVDC system.

4.2. Analysis of the Coupling Relationship Between Wind Turbine Outlet Voltage and DC Voltage

During a receiving-end AC fault, the DC bus voltage keeps rising mainly because the active power generated by the wind farm and delivered to the DC system exceeds the active power that the MMC can transmit to the receiving-end grid. However, the wind farm is located offshore. Without a communication link, the wind farm cannot directly obtain the real-time value of Udc. This section therefore establishes the relationship between the wind turbine outlet voltage Uf and the DC voltage Udc, which provides a circuit-level basis for the fault ride-through strategy proposed later.
The derivation in this section is based on two approximations. First, in offshore wind power transmission systems, the resistances of AC collector cables and DC transmission lines are typically on the order of a few hundredths of an ohm per kilometer. For representative line lengths and rated power levels, the resulting active-power losses and voltage drops are relatively small. Therefore, the active-power losses and voltage drops caused by the resistances of the AC collector cables and DC transmission line are neglected in the simplified derivation. Second, the transformation ratios of the wind turbine step-up transformers and the offshore substation transformers are assumed to remain constant.
From Equation (4):
U pcc = 1 K d [ U dc + ( R dc + X d ) I dc ]
According to the approximate conditions, the active power of the wind farm can be considered approximately equal to the active power delivered to the receiving end:
j = 1 n P w j P dc = U dc I dc
where n is the number of wind farms, j is the wind farm index, Pwj is the active power output by wind field j.
Combining Equations (15) and (16) to eliminate Idc gives:
U pcc = 1 K d U dc + ( R dc + X d ) j = 1 n P w j U dc
A wind turbine step-up transformer and an offshore substation transformer separate the wind turbine grid-side converter from the offshore PCC. As a result, Uf and Upcc differ in magnitude, but their ratio is constant. Let Kw = UpccN/UfN denote this combined transformation ratio, then Upcc can be expressed as UpccKwUf. Substituting the relation into Equation (17) gives the relationship between Uf and Udc:
U f = 1 K w K d U dc + ( R dc + X d ) j = 1 n P w j U dc
Differentiating Equation (18) with respect to Udc gives:
U f U dc = 1 K w K d 1 ( R dc + X d ) j = 1 n P w j U dc 2
This derivative is zero at:
U dc , sym = ( R dc + X d ) j = 1 n P w j
which corresponds to the minimum point of the curve described by Equation (18). Assuming the wind turbine maintains its rated active power output, ΣPwjUdcNIdcN in Equation (20), giving:
U dc , sym = ( R dc + X d ) U dcN I dcN = α U dcN
where
α = ( R dc + X d ) I dcN U dcN
The numerator of α represents the voltage drop produced by the equivalent impedance of the converter transformer and the DC line at rated current. This value is much smaller than the denominator, UdcN. Therefore, 0 < α < 1, and Equation (21) shows that Udc,sym < UdcN.
Consequently, within the operating range Udc > UdcN, the derivative in Equation (19) is always positive, and Uf increases monotonically with Udc. In other words, when a receiving-end AC fault causes Udc to rise, this rise is reflected as a corresponding monotonic increase in the wind turbine outlet voltage Uf. Furthermore, based on Equation (18), the wind turbine can indirectly sense the degree to which the receiving-end DC bus voltage exceeds its limit by monitoring this local quantity.

4.3. Receiving-End Fault Ride-Through Strategy Based on Source-Side Active Power Reduction

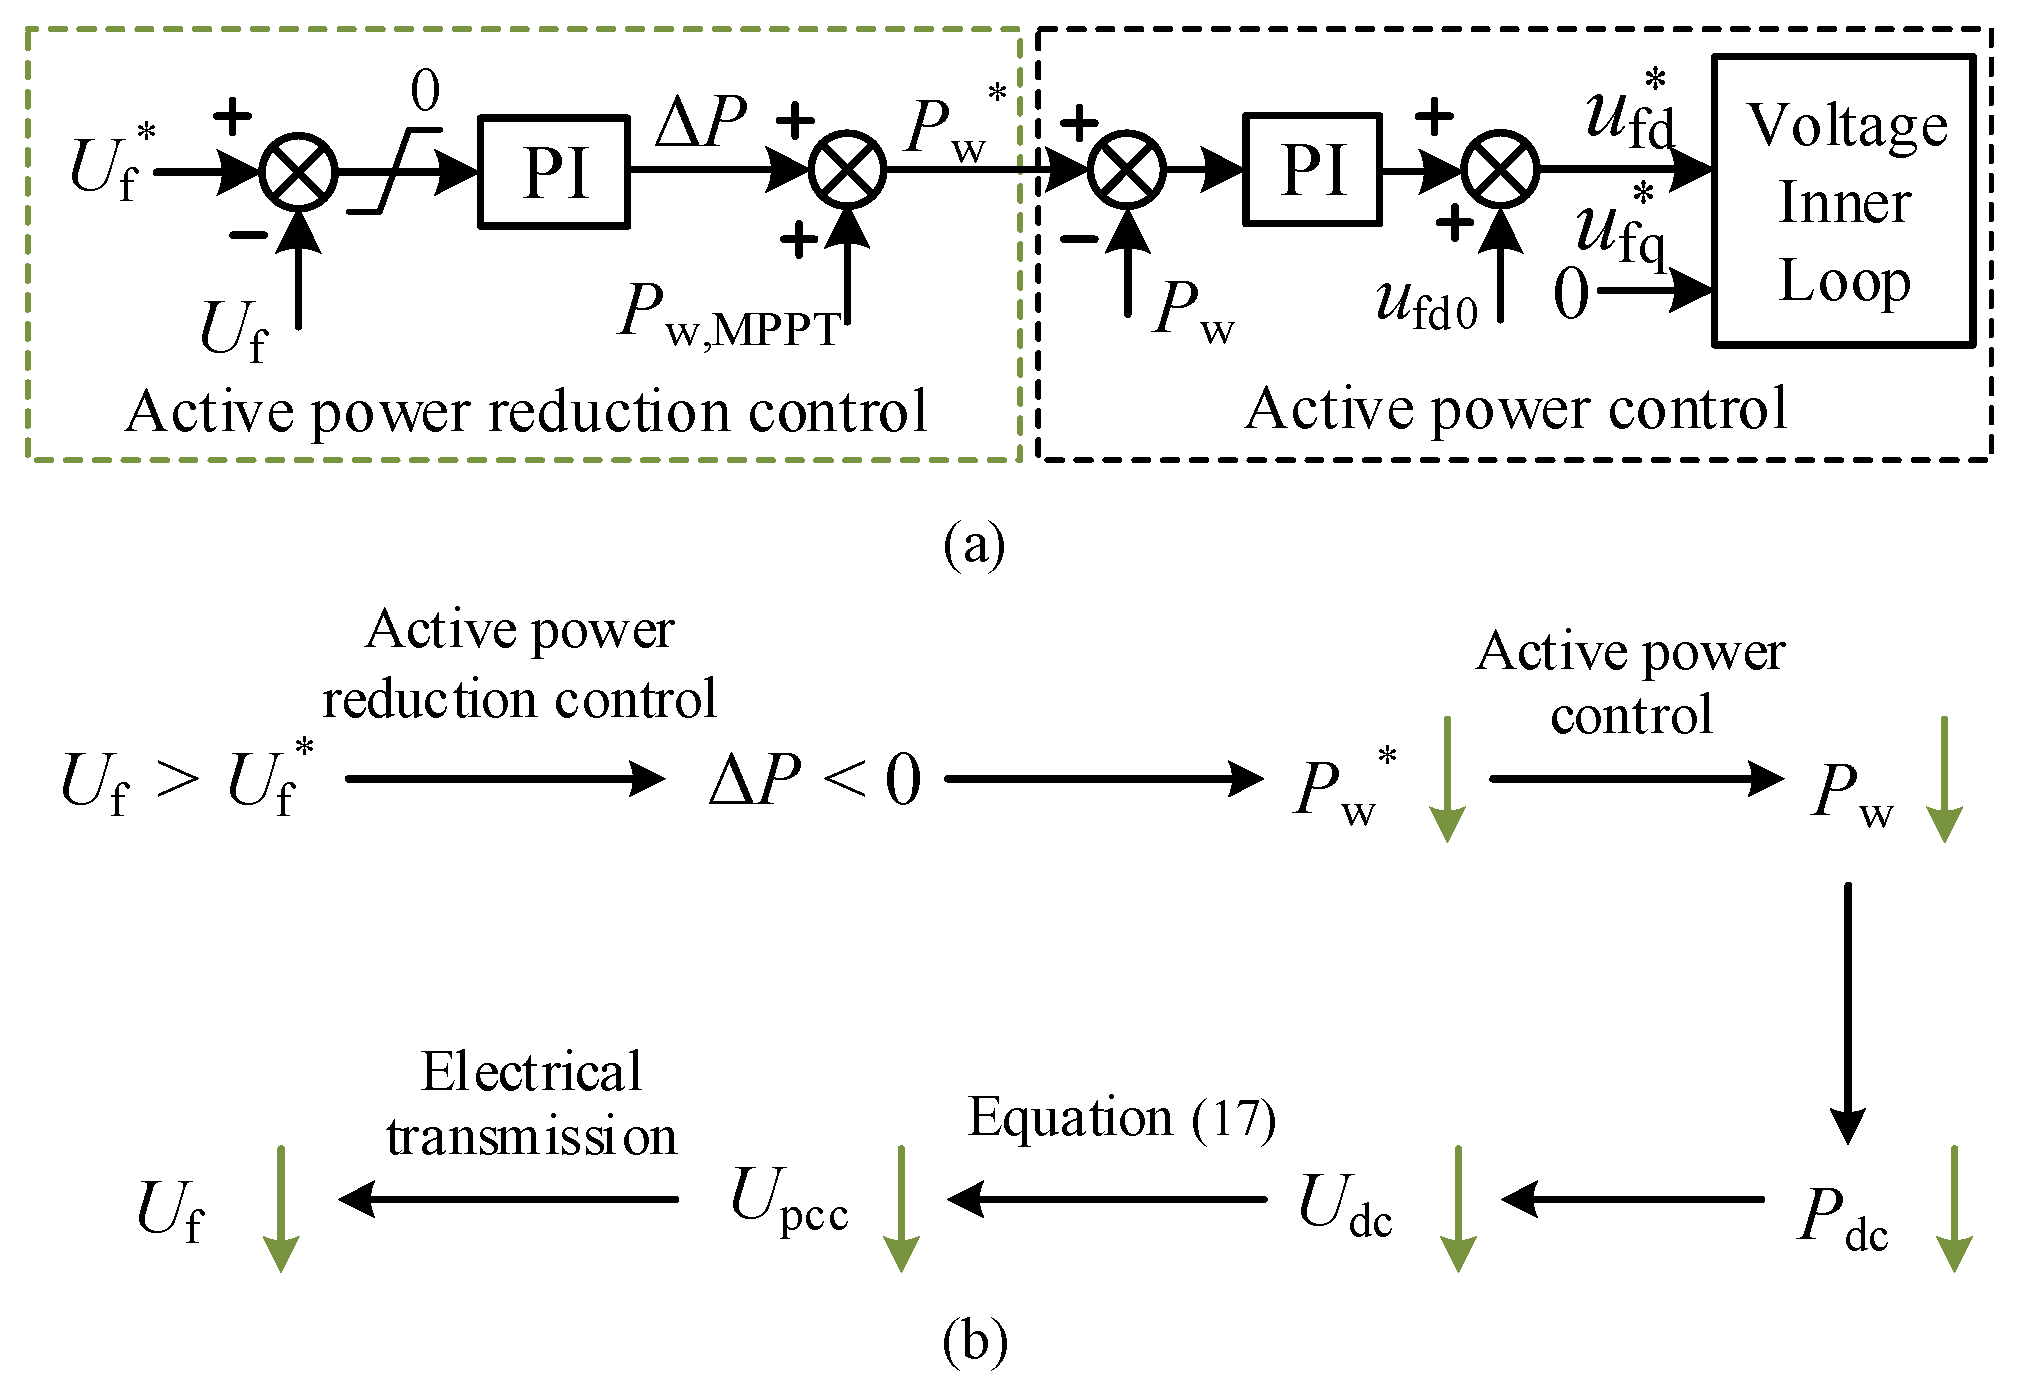
To solve the DC overvoltage problem during a receiving-end AC fault, a receiving-end fault ride-through strategy based on source-side active power reduction is proposed in this paper, shown in Figure 8a. This strategy makes use of the monotonic relationship between Uf and Udc established in Section 4.2.
An active power reduction control loop is added before the active power outer loop of the grid-forming control at the grid-side converter. The loop uses Uf to represent the degree of power imbalance in the DC system. In this way, information about the receiving-end fault is mapped to the wind turbine control layer.
The input to this control loop is the deviation between the grid-side converter outlet voltage threshold U f * and the actual value Uf. A PI controller converts this deviation into an active power correction ΔP, which is added to the wind turbine MPPT command Pw,MPPT to form the active power reference value P w * during the fault:
Δ P = ( k up + k ui s ) ( U f * U f ) P w * = Δ P + P w , MPPT
In the DC system, the upper limit of the DC voltage and the submodule capacitor voltage is generally set to 1.3 p.u. [21]. From Equation (18), when Udc reaches this upper limit of 1.3 p.u., the corresponding outlet voltage level is:
U f , lim = 1 K w K d 1.3 U dcN + ( R dc + X d ) j = 1 n P w j 1.3 U dcN
Introducing a margin coefficient kn ∈ (0, 1) gives the voltage threshold adopted by the active power reduction control loop:
U f * = U fN + k n ( U f , lim U fN )
During normal operation, Uf remains close to UfN, while Uf,lim is higher than UfN. The kn is used to quantify the gap between UfN and Uf,lim. The value of kn must balance two considerations. First, kn cannot be set to 1. If kn = 1, then U f * = Uf,lim, which would mean the active power reduction control loop only acts after Uf has already exceeded its limit. It is unsuitable. In addition, according to Reference [22] in the manuscript, Uf generally does not exceed 1.05 p.u. during normal operation. Therefore, kn should be chosen such that U f * is not lower than 1.05 p.u. Therefore, the value of kn should be determined based on the specific system and the desired DC voltage level during a receiving-end fault.
It should be noted that Uf,lim in Equation (24), and the threshold U f * obtained from Equation (25), depend on the aggregate active power of all the wind farms, as well as the system-level parameters (Kw, Kd, Rdc, Xd, UdcN) that are identical throughout the system. Consequently, every wind turbine computes the same value of Uf,lim and U f * using the same formula and the same inputs.
The output of the voltage comparator in the active power reduction control loop is limited to an upper bound of zero. This ensures that the control loop acts only when the outlet voltage Uf exceeds the threshold, and it does not alter the original power command under normal operation:
Δ P < 0 , U f > U f * Δ P = 0 , U f U f *
The operating mechanism of the source-side active power reduction fault ride-through strategy is shown in Figure 8b. After a receiving-end AC fault occurs, the RMS value of the wind turbine outlet voltage Uf rises. The active power reduction control loop detects that U f * < Uf and outputs a negative active power correction ΔP. The active power reference value P w * of the wind turbine is then actively reduced. The wind turbine correspondingly reduces its active power output, so the active power injected into the DC system decreases. It suppresses the DC-side power surplus, restrains the rising trend of Udc, and gradually stabilizes the system, forming a complete regulation loop.
The proposed source-side active power reduction strategy has a corresponding theoretical operating limit. In the extreme case where the receiving-end AC voltage collapses completely to zero, the active power that the receiving-end converter station can deliver to the grid is likewise forced to zero. To maintain the active-power balance between the input and output of the receiving-end converter station, the active power injected by the wind farm would also need to be reduced to zero, causing a significant disturbance to the wind farm’s own operation. It represents a theoretical operating limit of the proposed strategy. In practical systems, however, the receiving-end AC network is generally a regional grid, and a complete collapse of its voltage to zero is not a realistic operating condition.

5. Simulation Verification

To verify the effectiveness of the proposed fault ride-through strategies, a simulation model of the DRU-HVDC transmission system shown in Figure 1 was built in PSCAD/EMTDC. In the model, each wind farm is represented by a single equivalent generator wind turbine, and its rated capacity is equal to the total installed capacity of the corresponding wind farm, which is 300 MW, 400 MW, and 400 MW, respectively. The equivalent generator is obtained by aggregating the individual wind turbines within the wind farm using the classical method of Reference [23]. The receiving-end inverter station adopts a hybrid MMC. The receiving-end AC system is represented by a 500 kV voltage source. The main system parameters are listed in Table 1. The PI parameters and their setting methods are shown in Appendix A.
Based on this simulation model, sending-end and receiving-end AC fault scenarios were set up separately. The transient responses of the system under the traditional fault ride-through strategy and under the proposed strategy are compared and analyzed. Specifically, the wind-turbine current-limiting strategy described in Section 3.1 is adopted as the traditional method for sending-end AC faults, and the DC chopper-based DC energy dissipation strategy described in Section 4.1 is adopted as the traditional method for receiving-end AC faults, each compared against the corresponding strategy proposed in this paper.

5.1. Sending-End AC Fault Simulation Results

5.1.1. Sending-End Three-Phase AC Voltage Drop Fault

(1)
Fault duration 300 ms, voltage drop 50%
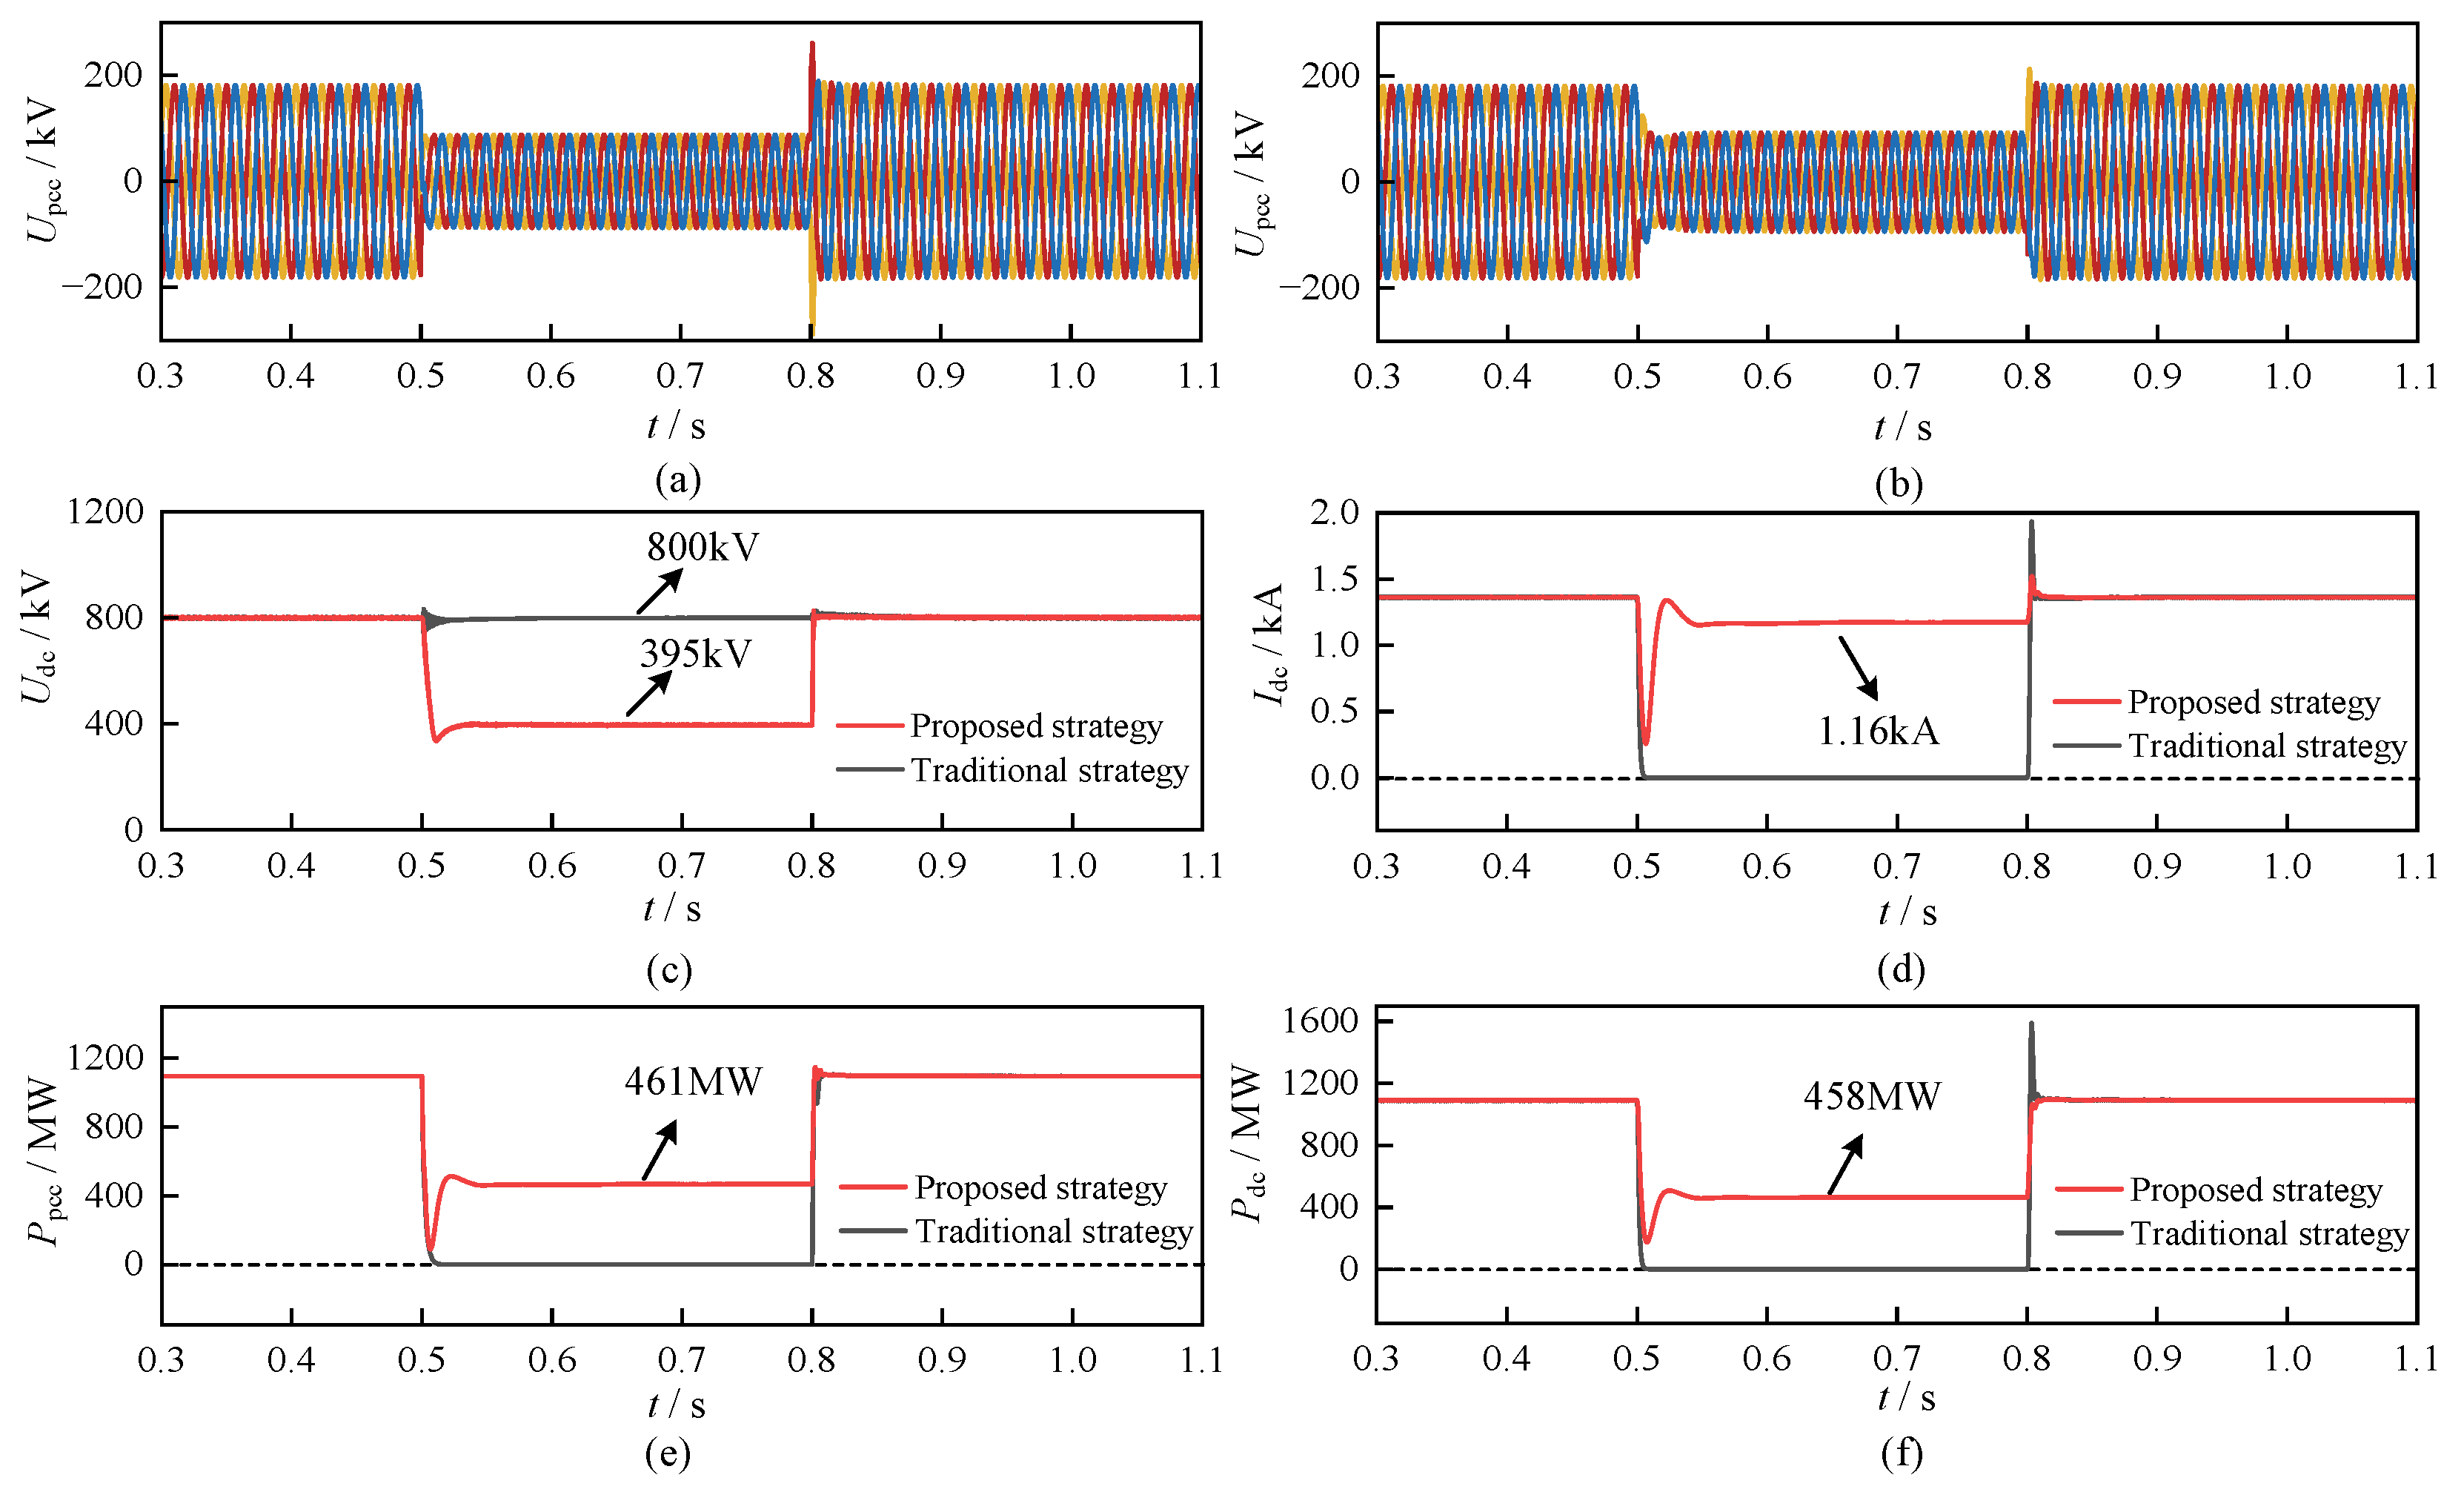
At simulation time t = 0.5 s, a symmetrical three-phase voltage sag was applied at the sending end, lasting 300 ms before being cleared. During the fault, Upcc dropped by 50%. In the proposed active voltage reduction fault ride-through strategy, Idc,max was set to the rated DC current of the receiving-end converter station, 1.375 kA. Calculations showed that Idc,sym exceeds Idc,max under this fault condition. Therefore, I dc * was calculated using Equation (13), with a margin coefficient km = 0.85, giving I dc * ≈ 1.16 kA. The steady-state preset threshold Idc0 of the active voltage reduction control loop was also calculated to be 1.16 kA. The response waveforms of the system under the proposed strategy and under the traditional current-limiting strategy are compared in Figure 9.
Figure 9 shows that, under the traditional strategy, the receiving-end converter station keeps the DC voltage at its rated value of 800 kV throughout the fault. After the sending-end AC fault occurs, the RMS sending-end AC voltage drops rapidly, while the DC-side voltage remains at a relatively high level. This causes the DRU to lose its conduction condition and enter the blocking state. As a result, the DC current drops rapidly to zero during the fault, both the sending-end and receiving-end active power are interrupted, and the wind farm output can no longer be delivered through the DC line. Although the system restores power transmission after the fault is cleared, the DC power path is completely blocked while the fault is present.
In contrast, under the proposed active voltage reduction strategy, the drop in sending-end voltage causes the DC current to fall, which automatically activates the active voltage reduction control loop. The loop lowers the DC voltage reference value, reducing the DC voltage from about 800 kV to about 395 kV. With the lower DC voltage, the DRU again satisfies its conduction condition. During the fault, the DC current is maintained at about 1.16 kA, and the receiving-end active power stabilizes at about 458 MW. These results show that the proposed strategy maintains active power transmission during a sending-end AC voltage drop, avoiding the power interruption caused by DRU blocking under the traditional strategy.
After the fault is cleared, the sending-end AC voltage Upcc recovers to its rated value in a step change. According to Equation (2), the DRU output DC voltage Udc,DRU rises accordingly. According to Equation (3), the DC current Idc rises rapidly as well. Once Idc recovers above the threshold I dc * , the comparator output is clamped to zero by the limiter logic, so the voltage correction ΔU converges continuously to zero and the DC voltage reference U dc * smoothly returns to its rated value UdcN, at which point the active voltage reduction control loop is deactivated. The control law itself involves no discrete jump, and therefore there is no risk of the control loop being repeatedly re-triggered.
Table 2 further summarizes the comparison using measurable indicators, including the maximum DC-voltage deviation, the minimum DC current, the transmitted active power during the fault, the recovery time and overshoot after fault clearance, and the maximum power loss relative to the rated capacity.
(2)
Fault duration 200 ms, voltage drop 80%
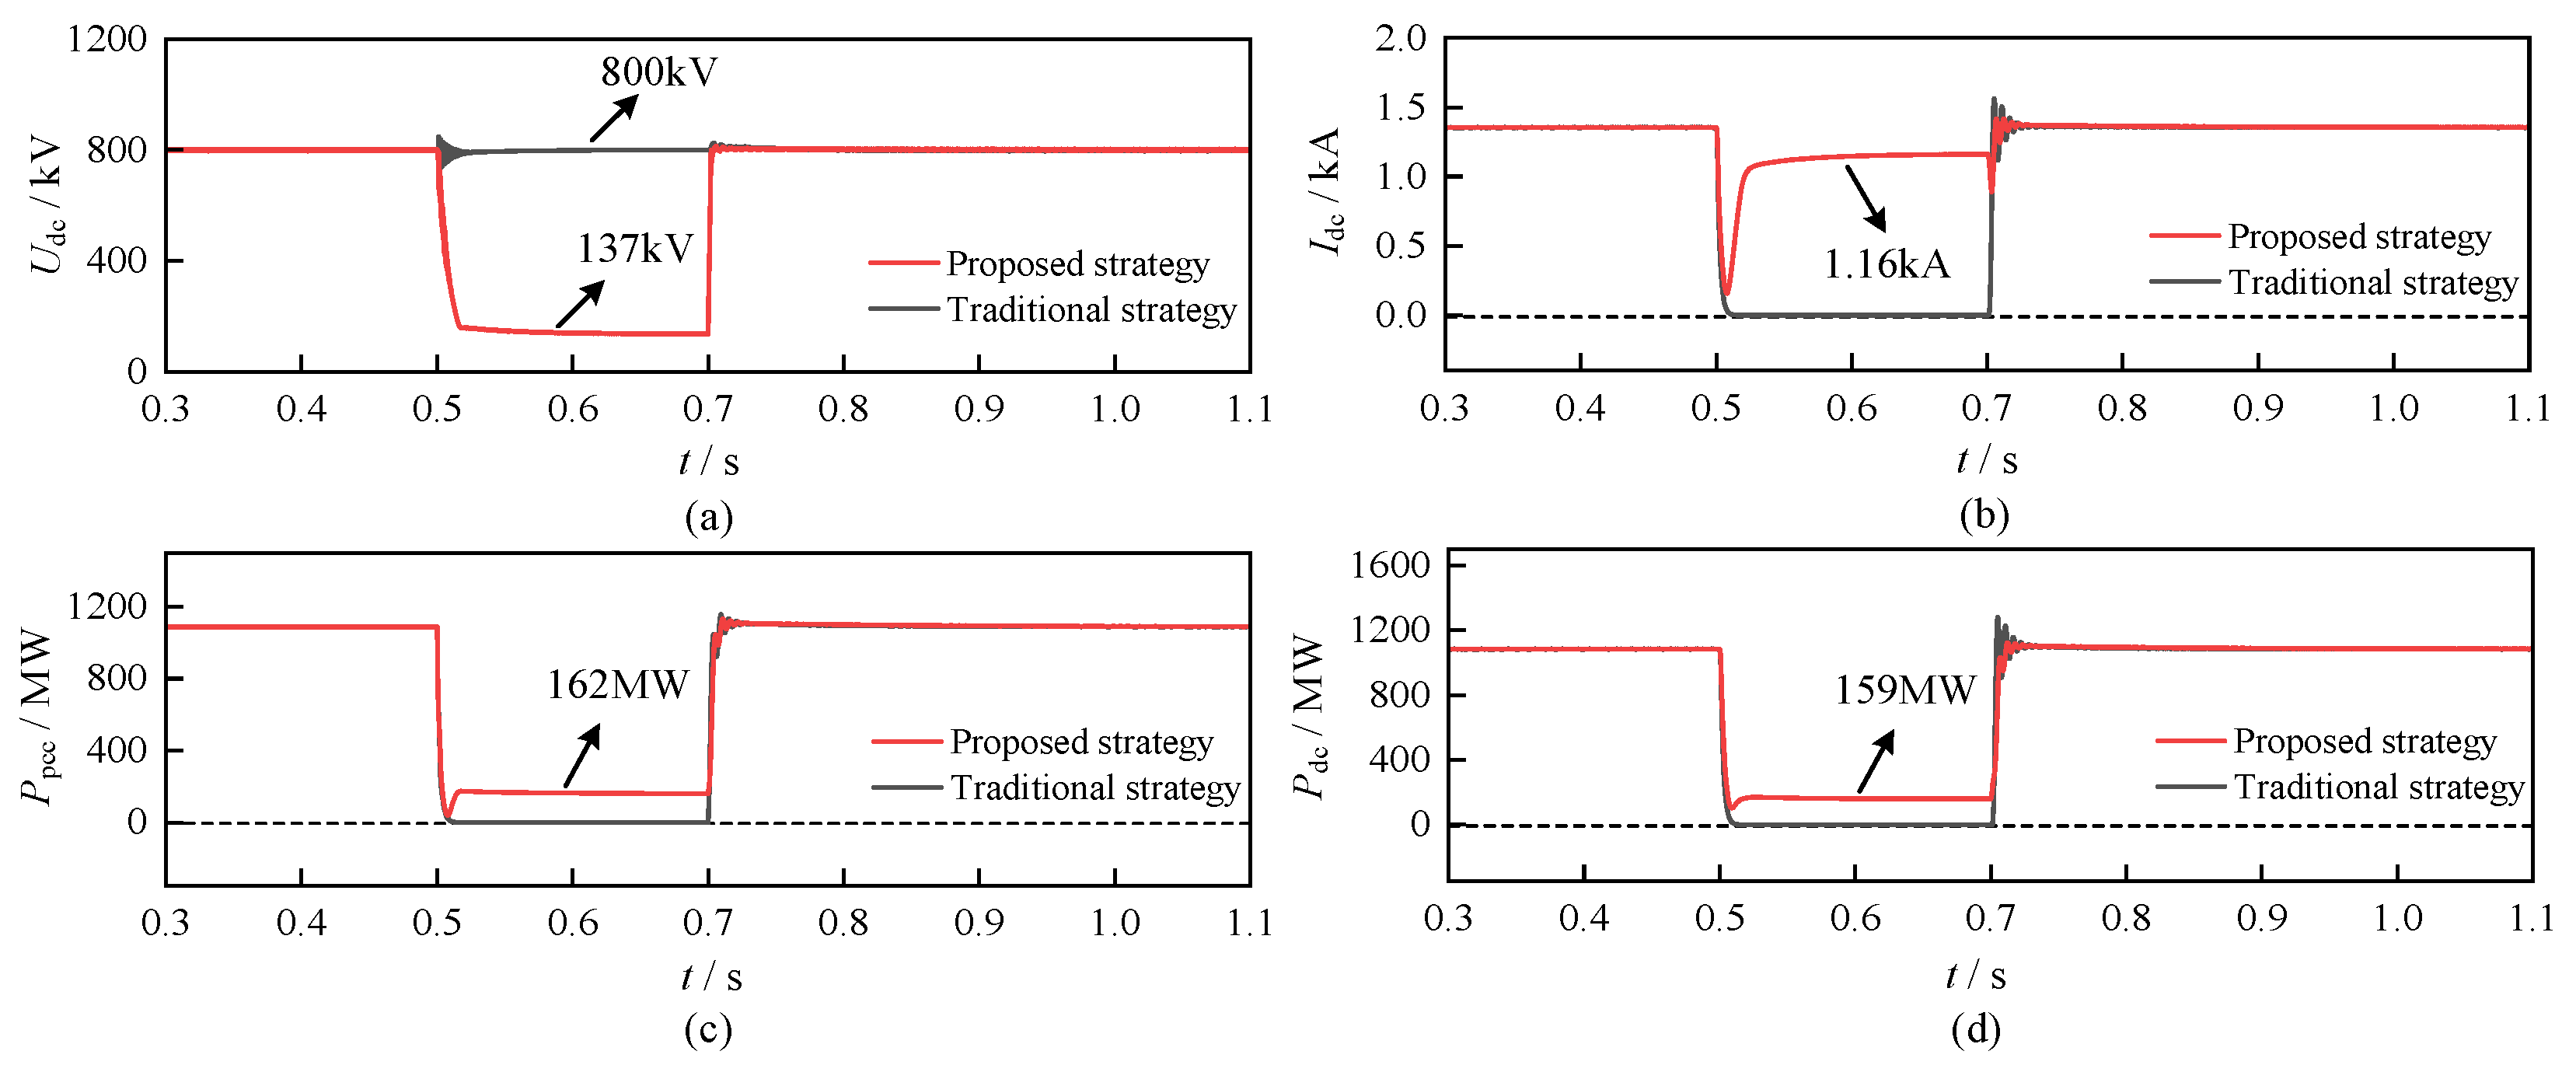
At simulation time t = 0.5 s, a symmetrical three-phase voltage sag was applied at the sending end, lasting 200 ms before being cleared. During the fault, Upcc dropped by 80%. Calculations showed that Idc,sym exceeds Idc,max under this fault condition. With the margin coefficient km set to 0.85, the calculated I dc * is 1.16 kA. The steady-state preset threshold Idc0 was also calculated to be 1.16 kA. The response waveforms of the system under the proposed strategy and under the traditional current-limiting strategy are compared in Figure 10.
Under the more severe condition, the traditional strategy still keeps the receiving-end DC voltage fixed at its rated value of 800 kV. Because the sending-end voltage collapse is now considerably deeper, the DRU loses its forward-conduction condition almost immediately, and the DC current and active power fall to zero throughout the fault, completely interrupting power transmission until the fault is cleared.
Under the proposed strategy, the receiving-end DC voltage reference is again adaptively reduced according to the fault severity; because this fault is more severe, the reduction is also larger, with Udc falling to about 137 kV, markedly lower than the reduction to about 395 kV observed under the 50%-sag case in Section 5.1.1(1). Despite this larger adjustment, the DC current is still maintained at about 1.16 kA, and the sending-end and receiving-end active power stabilize at about 162 MW and 159 MW, respectively. Although these power levels are lower than under the 50% fault, reflecting the reduced power-transfer capability available under a deeper sag, the DRU remains continuously conducting and power transmission is never interrupted. These results confirm that the proposed active voltage reduction strategy remains effective across different fault severities, consistently avoiding DRU blocking and maintaining continuous power transmission.

5.1.2. Sending-End Single-Line-to-Ground Fault

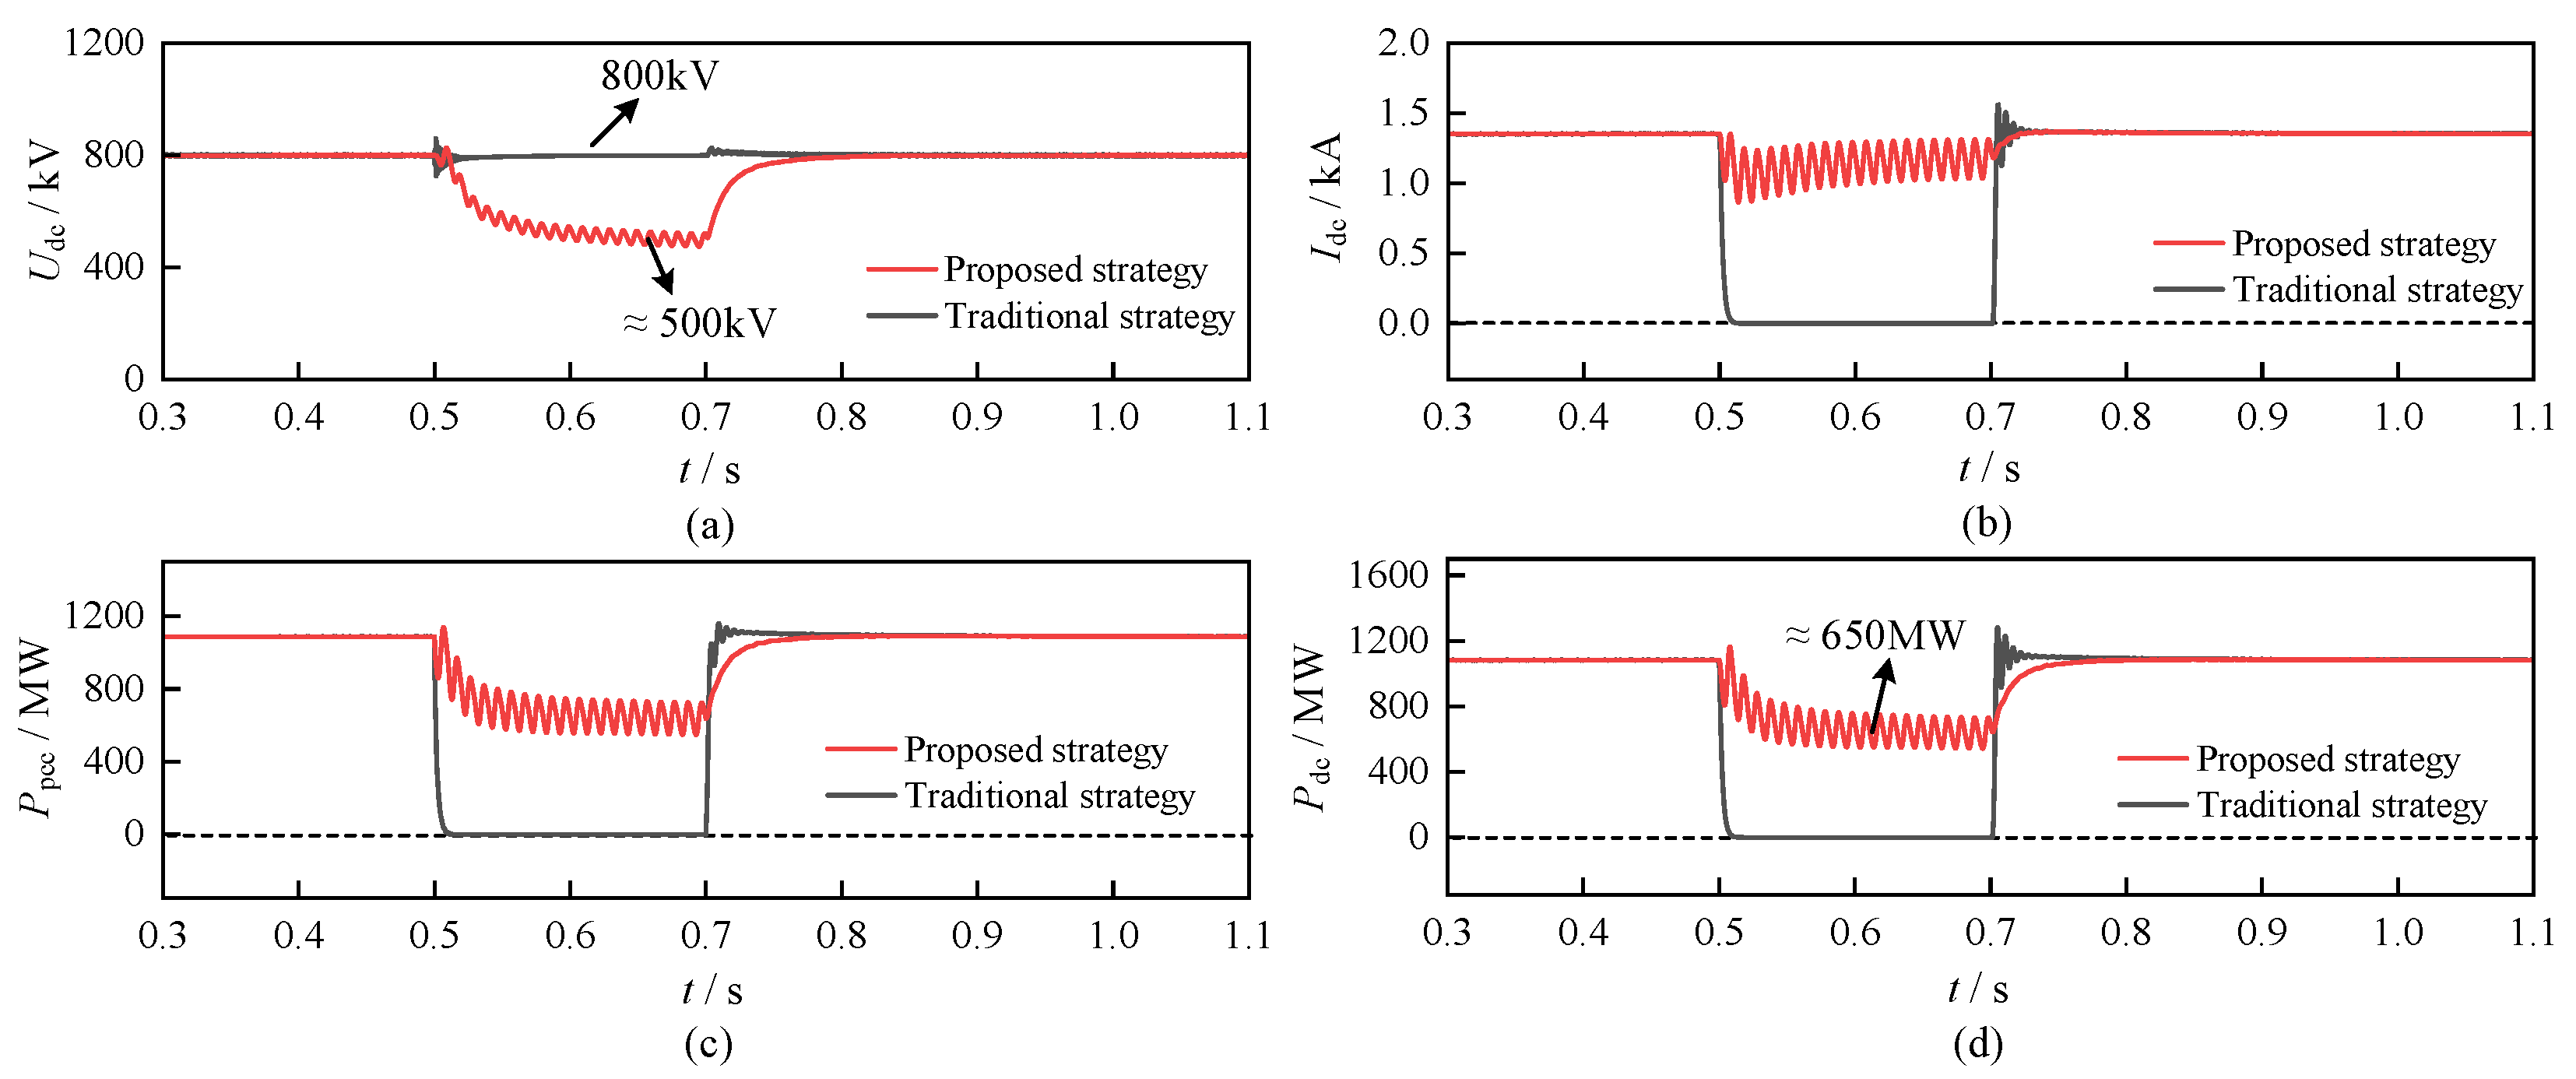
At simulation time t = 0.5 s, a single-line-to-ground fault was applied at the sending end, lasting 200 ms before being cleared. The response waveforms of the system under the two strategies are compared in Figure 11.
Under the traditional strategy, because the receiving-end converter station keeps the DC voltage fixed at its rated value of 800 kV, the sending-end fault still causes the DRU to block and power transmission to be interrupted, consistent with the behavior observed under symmetrical faults. Under the proposed strategy, the receiving-end DC voltage is actively reduced and the DRU remains conducting. However, because the fault is asymmetrical, both the DC voltage and the DC current exhibit a pronounced second-harmonic ripple throughout the fault. It reveals a limitation of the proposed strategy: although the active voltage reduction control can keep the DRU conducting during an asymmetrical sending-end fault, the DRU itself has no controllable capability and therefore cannot isolate the double-frequency oscillation caused by the unbalanced fault, which is directly transmitted into the DC-side voltage and current.

5.1.3. Influence of System Parameter Variations on Sending-End Fault Ride-Through Strategy

According to Equations (7) and (8), the DC-line resistance Rdc and transformer leakage reactance Xd affect the theoretical maximum-power-point current Idc,sym and maximum transferable power P dc , max 0 through the total equivalent impedance Xd + Rdc. When Idc,max > Idc,sym, Equation (12) applies, and the current reference I dc * = kmIdc,sym varies directly with Rdc and Xd. When Idc,maxIdc,sym, Equation (13) applies and I dc * = kmIdc,max; in this regime, Rdc and Xd do not change the current reference as long as the inequality remains satisfied. Thus, parameter variations may change not only the theoretical maximum-power point but also the operating regime used to determine I dc * .
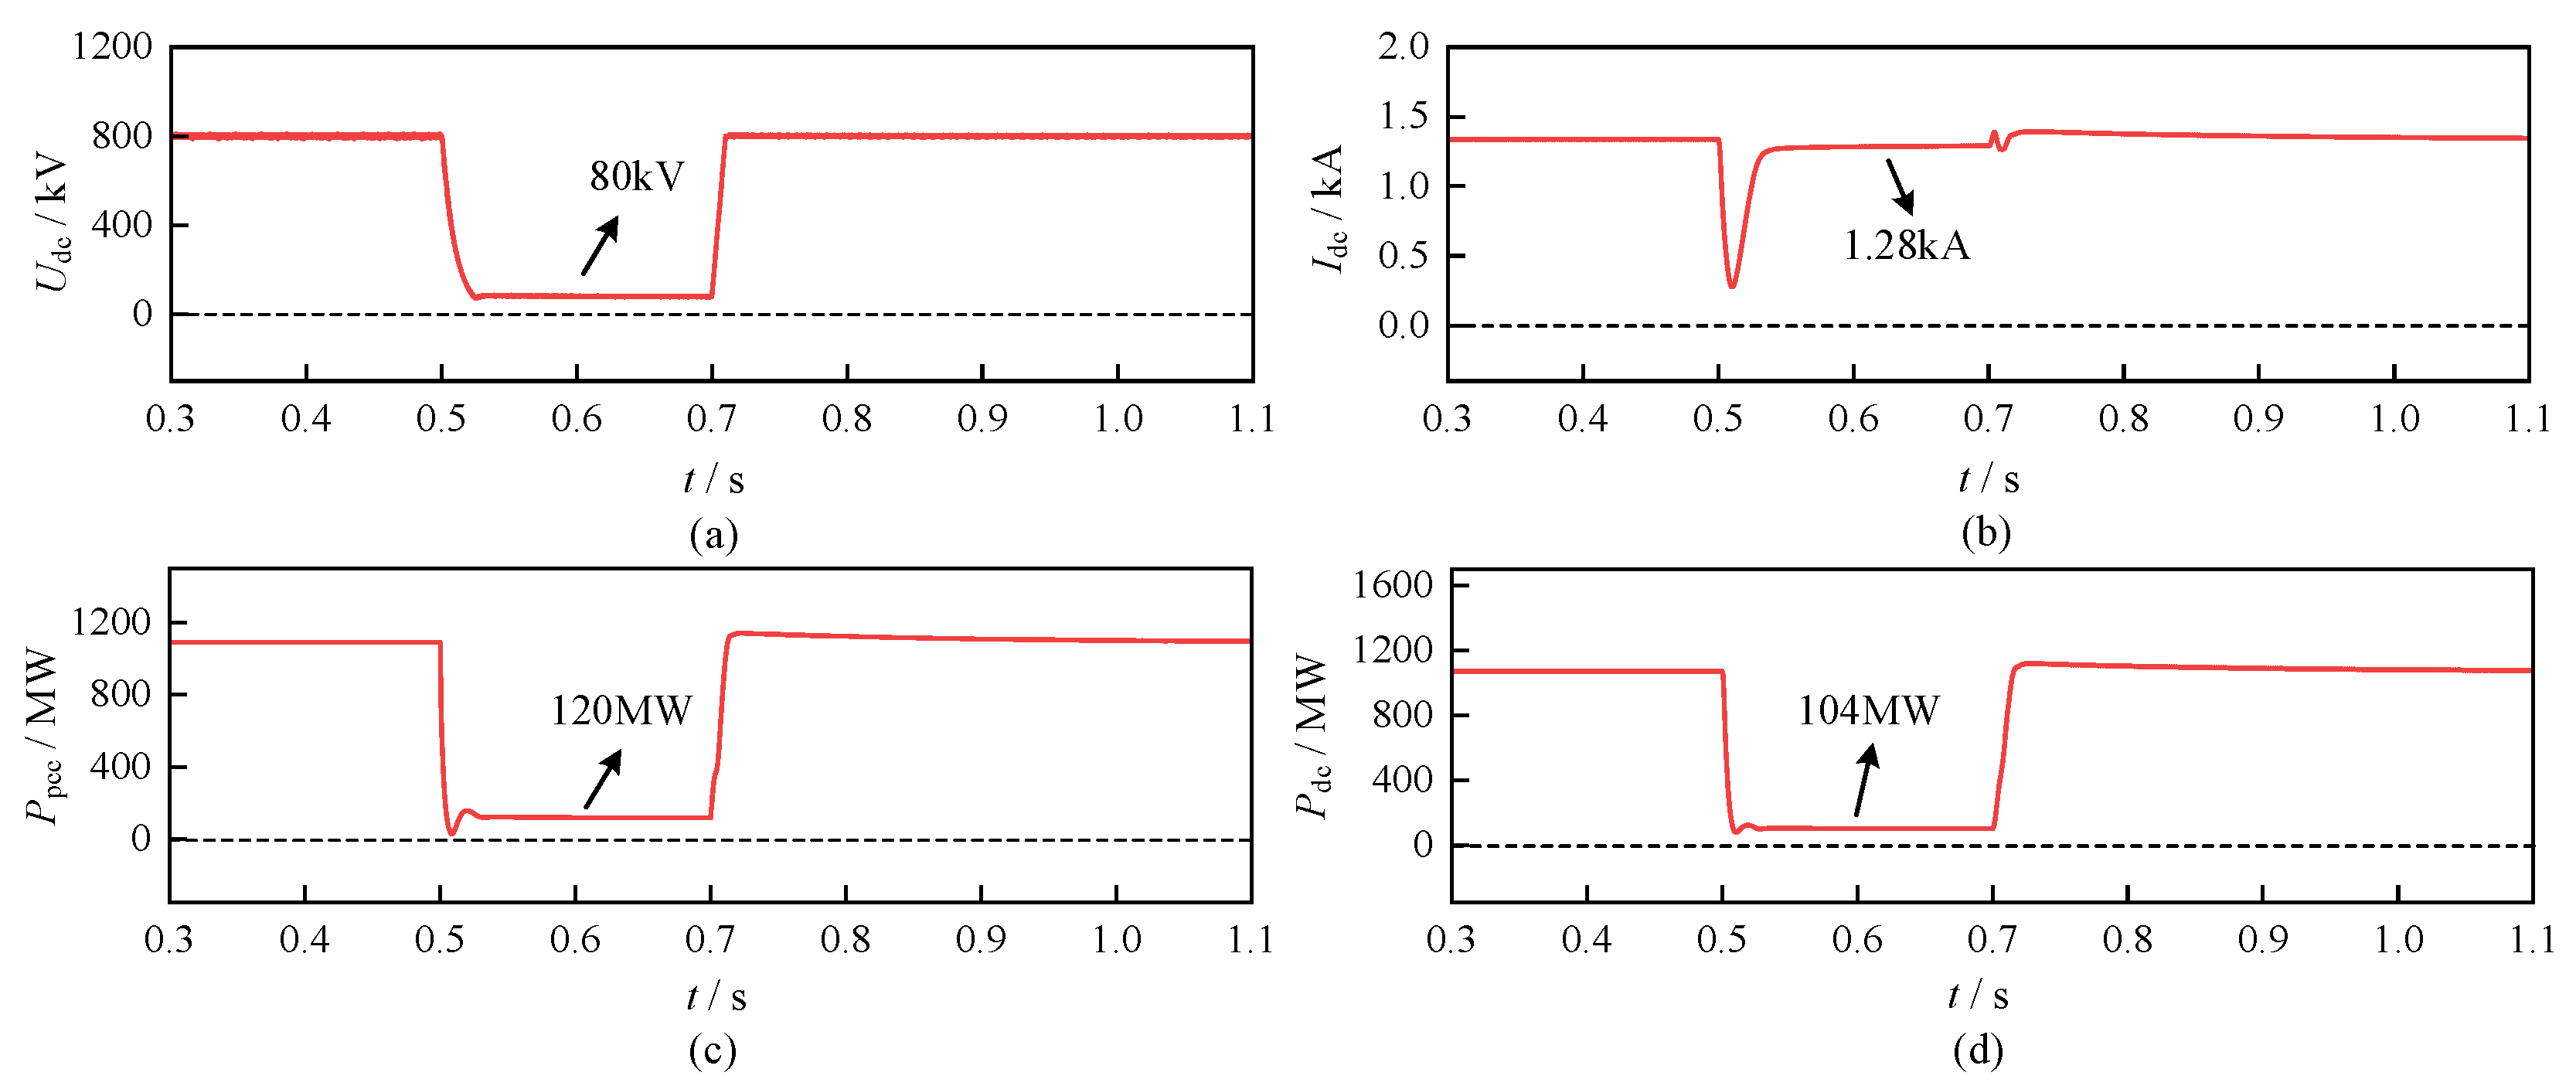
To evaluate this influence, an additional case is constructed based on the sending-end fault case in Section 5.1.1(2). The fault duration and voltage-sag depth are retained at 200 ms and 80%, respectively. Relative to the parameters in Table 1, Rdc is increased from 1 Ω to 9 Ω, and Xd is increased from 12 Ω to 54 Ω. Substitution into Equation (7) gives Idc,sym ≈ 1.286 kA, which is lower than Idc,max = 1.375 kA. Therefore, Equation (12) applies. With km = 1, the calculated current reference is I dc * ≈ 1.286 kA, and the corresponding DC voltage and transferred DC power are approximately 81.0 kV and 104.2 MW, respectively. The simulation results are shown in Figure 12.
As shown in Figure 12, after a brief transient at the fault onset, the DC voltage and DC current stabilize at approximately 80 kV and 1.28 kA, respectively, while the receiving-end DC power stabilizes at approximately 104 MW. These simulation results agree closely with the theoretical values of 81 kV, 1.286 kA, and 104.2 MW calculated above. The sending-end active power is approximately 120 MW, slightly higher than the receiving-end DC power because of the power losses associated with the increased equivalent impedance. The close agreement between the theoretical and simulated results verifies the parameter-dependent calculation of I dc * and confirms that the proposed strategy can maintain DRU conduction and continuous power transmission after substantial variations in Rdc and Xd.

5.2. Receiving-End AC Fault Simulation Results

5.2.1. Receiving-End Three-Phase AC Voltage Drop Fault

(1)
Fault duration 300 ms, voltage drop 50%
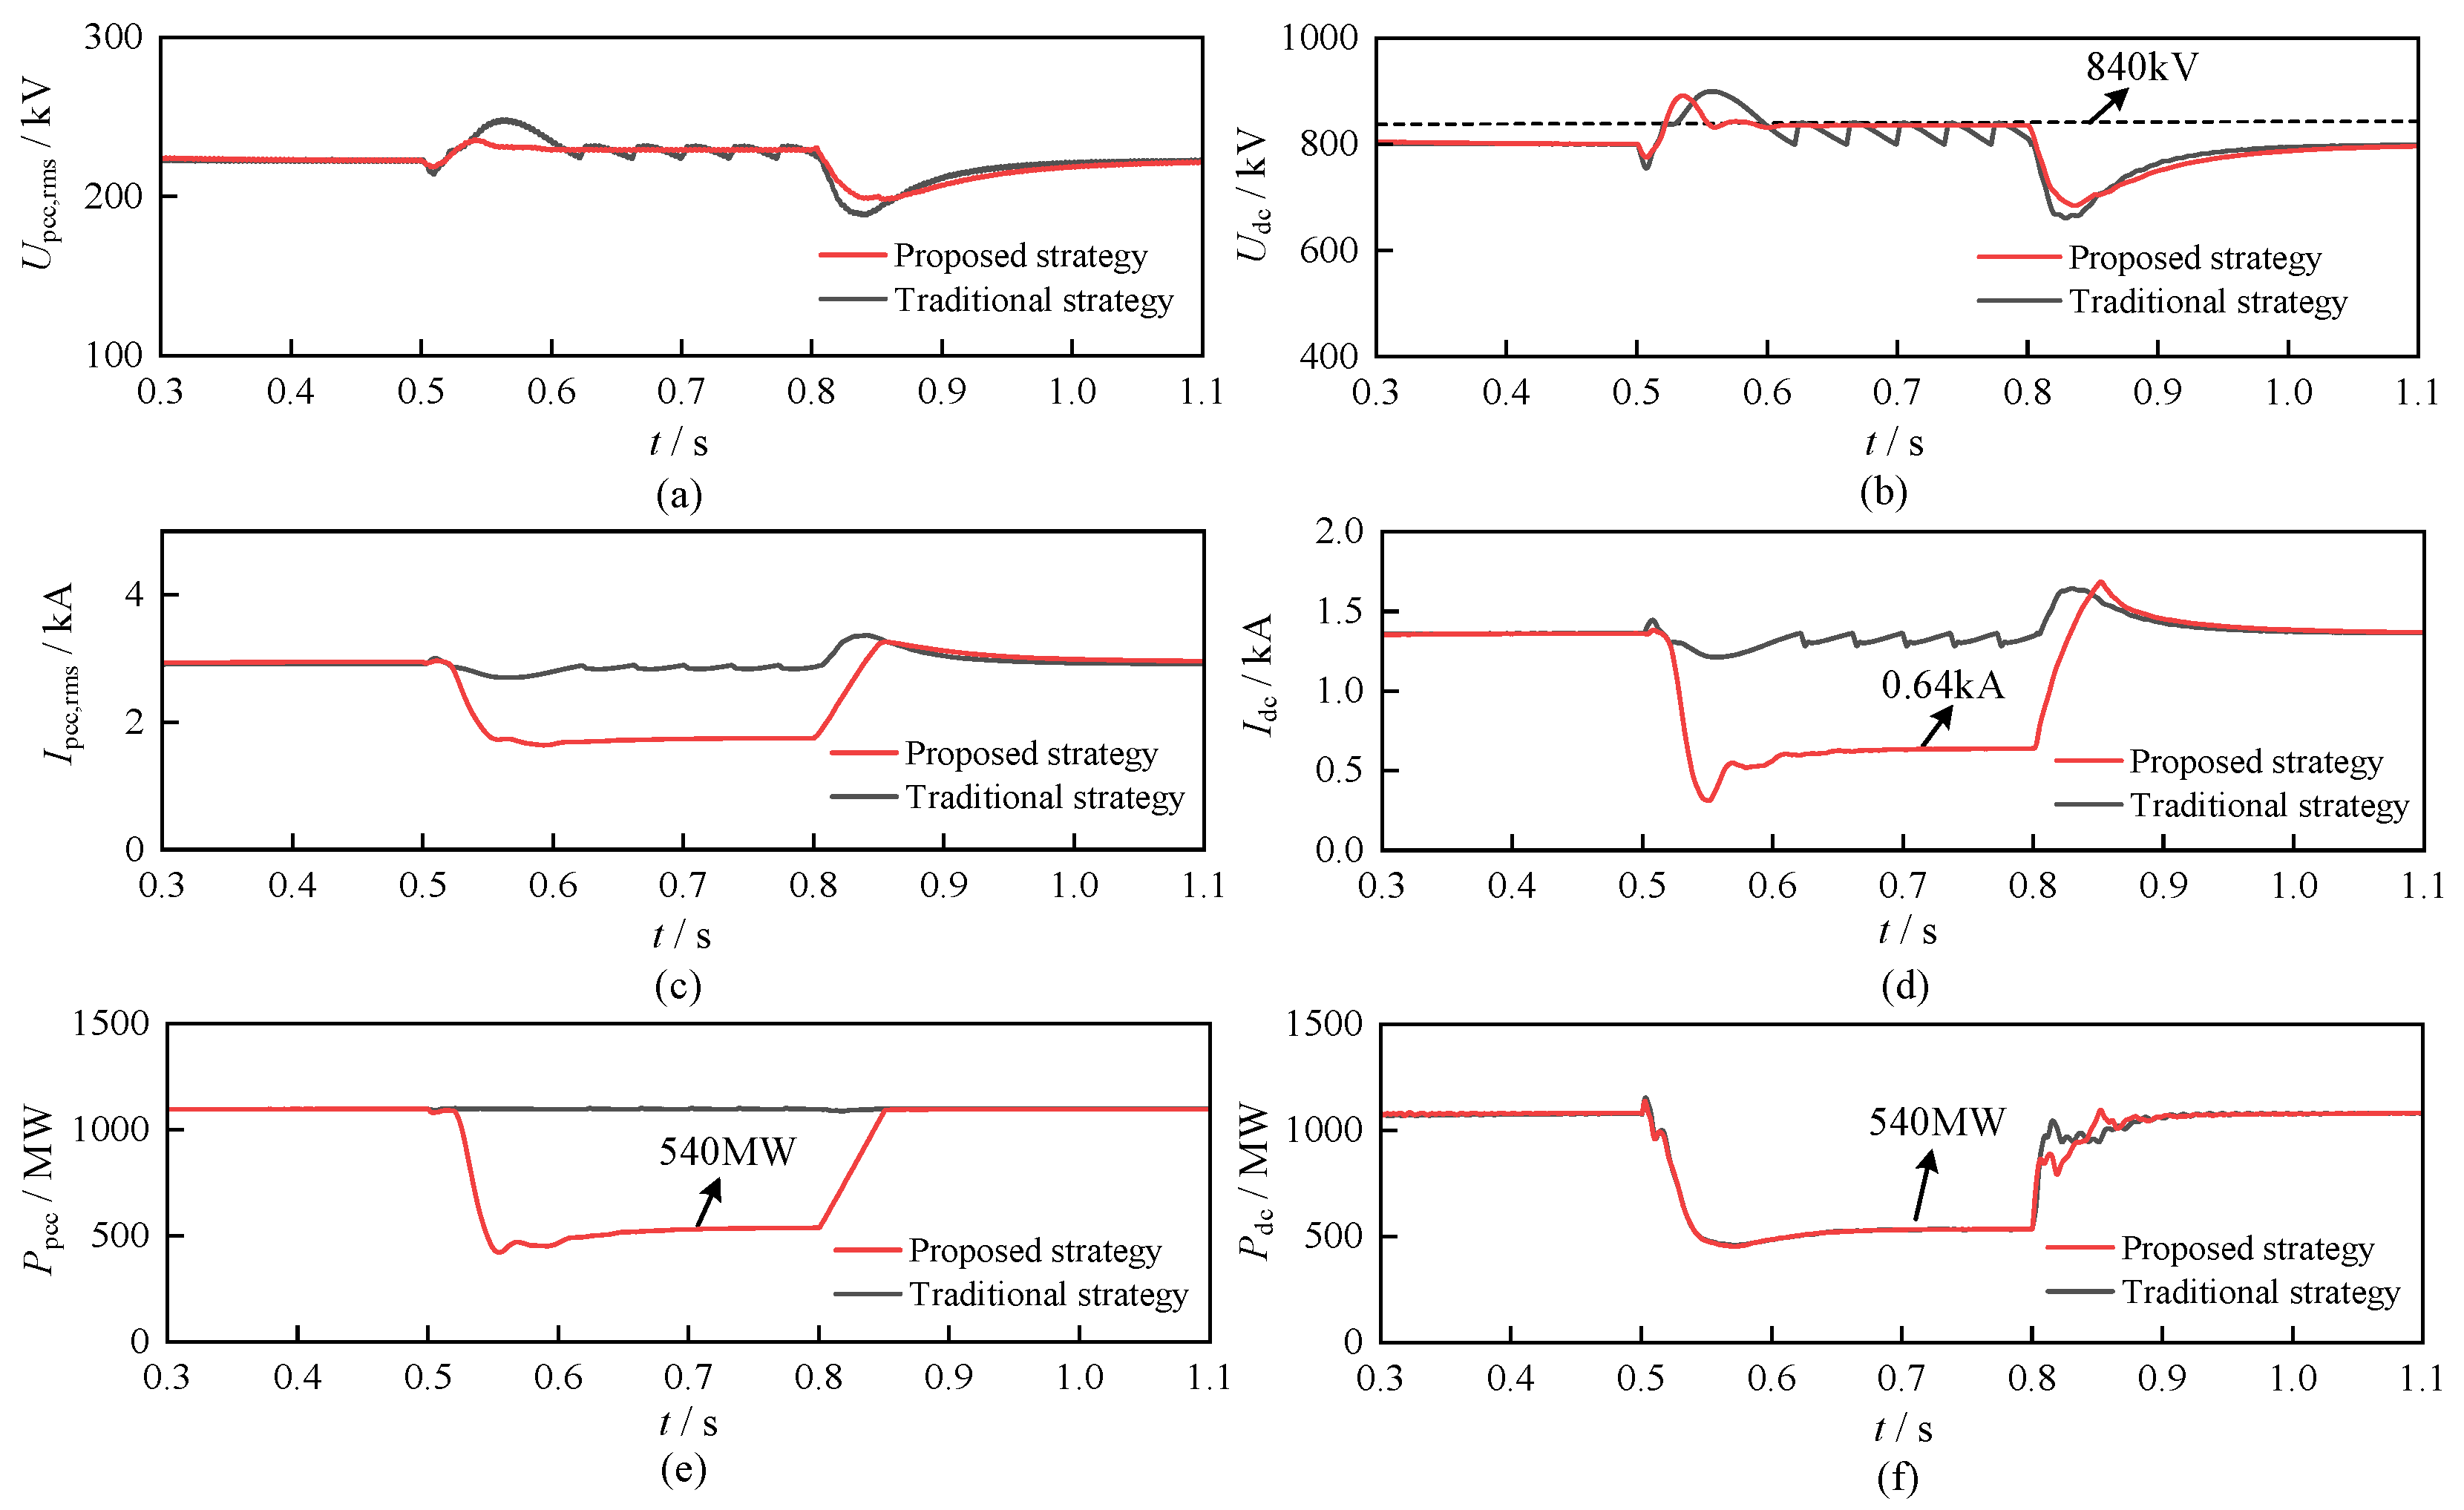
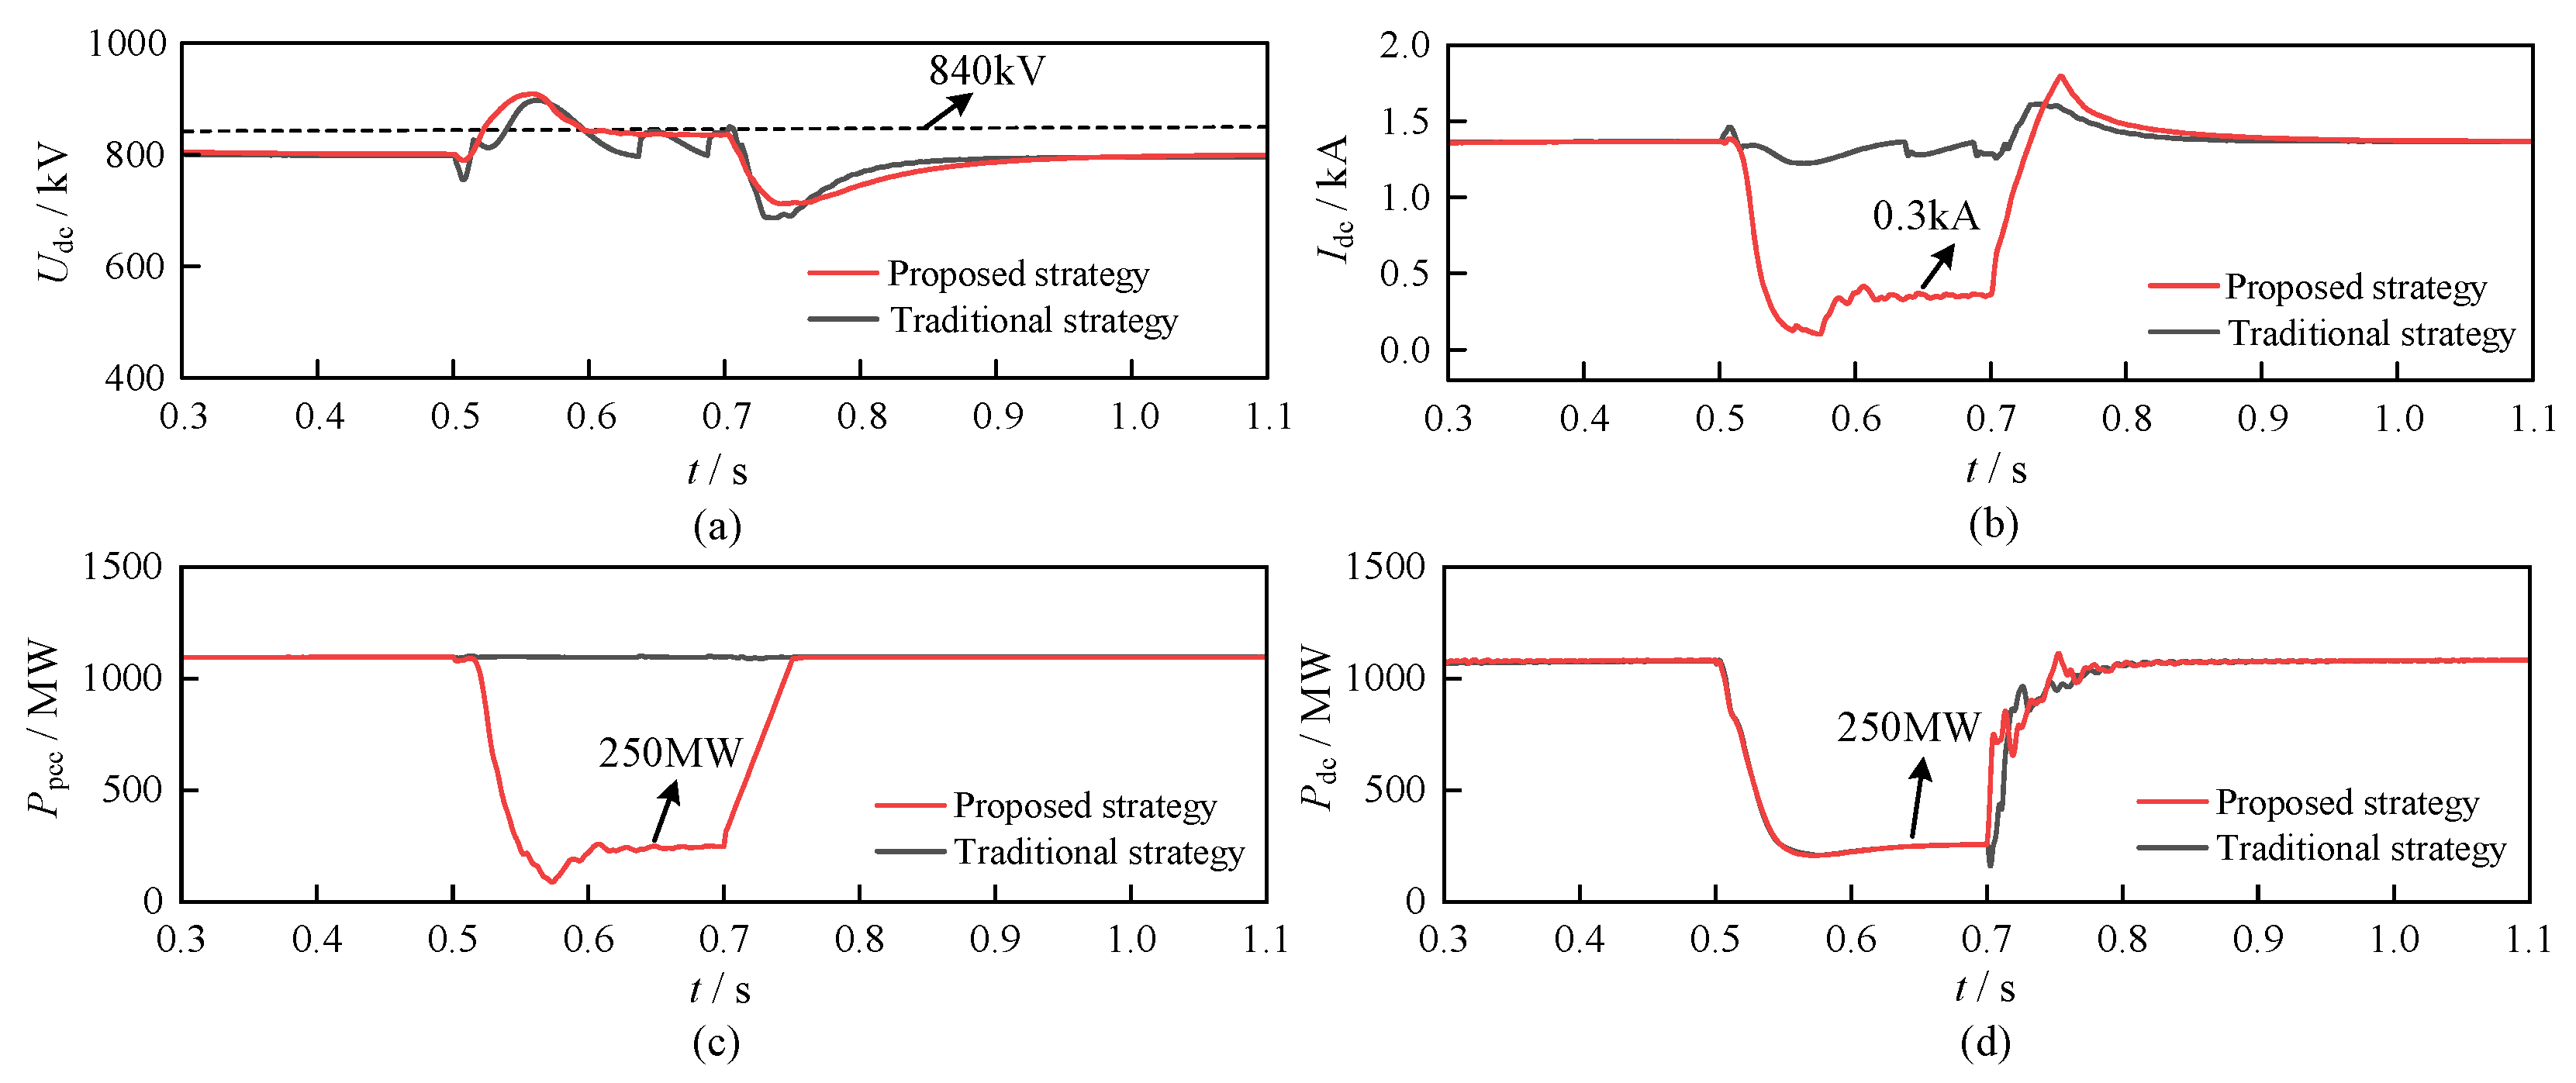
At simulation time t = 0.5 s, a symmetrical three-phase voltage drop was applied at the receiving end, lasting 300 ms before being cleared. During the fault, the receiving-end AC voltage dropped by 50%. In the proposed source-side active power reduction strategy, the upper limit of the DC voltage was set to 1.3 p.u. Substituting this value into Equation (24) gives Uf,lim ≈ 0.897 kV (about 1.3 p.u.). The voltage threshold U f * was set to 1.05 p.u. (about 0.72 kV, corresponding to a margin coefficient kn = 0.167). In the traditional DC energy dissipation strategy, the upper voltage threshold of the DC chopper was set to 1.05 p.u., which is 840 kV, and the lower threshold was set to 1 p.u. The response waveforms of the system under the two strategies during the fault are compared in Figure 13.
After the three-phase voltage drop occurs at the receiving end, the ability of the receiving-end converter station to deliver active power to the grid decreases markedly. Under the traditional strategy, the wind farm continues to output power close to its rated value, so a substantial imbalance arises between the power injected at the sending end and the power delivered at the receiving end during the fault. This surplus power is consumed mainly by the DC chopper. As a result, the DC voltage rises rapidly at the onset of the fault and repeatedly approaches the 840 kV threshold, causing the chopper to switch frequently. This produces noticeable oscillations in the DC voltage, the sending-end AC voltage, and the DC current. Although the traditional strategy limits the further rise of the DC overvoltage, it is essentially a passive, post-fault dissipation control approach. It does not reduce the power surplus at the source during the fault, so the transient impact on the system remains relatively large.
In contrast, once the proposed strategy detects the rise in the wind turbine outlet voltage, the active power reduction control loop is automatically activated. It quickly reduces the active power output of the wind farm, lowering the active power delivered by the DRU to the DC line to about 540 MW. This value matches the active power that can be delivered to the receiving-end grid during the fault, effectively relieving the power surplus in the DC system. Throughout the fault, the DC voltage is kept below 840 kV, and the DC current is reduced to about 0.64 kA, substantially easing the voltage and current stress during the transient. Because the proposed strategy does not rely on repeatedly triggering the DC chopper through the voltage threshold, the DC voltage does not exhibit the periodic oscillation caused by chopper switching under the traditional strategy, and the transient oscillation of the sending-end AC voltage and the DC current is also markedly reduced.
After the fault is cleared, the receiving-end converter station resumes normal DC voltage control, and the DC voltage Udc gradually falls back and stabilizes at its rated value. According to the monotonic coupling relationship between Uf and Udc given in Equation (18), the wind turbine outlet voltage Uf decreases accordingly. Once Uf falls below the threshold U f * , the active power correction ΔP converges continuously to zero under the limiter logic, and the active power reduction control loop is deactivated. Since the active power reference P w * is formed by adding this correction on top of the MPPT command, once ΔP reaches zero, P w * automatically and continuously returns to Pw,MPPT, restoring normal MPPT operation. These results show that, compared with the traditional DC-chopper strategy, the proposed strategy provides better overvoltage suppression and improved transient stability.
Table 3 further summarizes the comparison using measurable indicators, including the DC-voltage range during the fault, the DC current during the fault, the transmitted active power during the fault, the voltage/current oscillation behavior, the maximum active-power curtailment relative to the rated capacity, and the recovery time after fault clearance.
(2)
Fault duration 200 ms, voltage drop 80%
At simulation time t = 0.5 s, a symmetrical three-phase voltage drop was applied at the receiving end, lasting 200 ms before being cleared. During the fault, the receiving-end AC voltage dropped by 80%. The voltage threshold U f * was set to 1.05 p.u., corresponding to a margin coefficient kn = 0.167. The response waveforms of the system under the two strategies during the fault are compared in Figure 14.
Under the more severe receiving-end fault, the traditional DC-chopper strategy experiences a larger power imbalance: the wind farm continues to inject active power close to its rated value. So, the DC voltage repeatedly approaches and oscillates around the 840 kV chopper threshold over an extended period, with correspondingly larger swings in the DC current and in the sending-end and receiving-end active power than under the 50%-sag case in Section 5.2.1(1).
Under the proposed strategy, the rise in the wind turbine outlet voltage again activates the active power reduction control loop, which curtails the wind farm’s active power output considerably further than under the 50%-sag case, down to about 250 MW, in order to match the more severely reduced power that the receiving-end grid can accept during this deeper fault. As a result, the DC current is reduced to about 0.3 kA; although a brief transient occurs near the onset of the fault as the control loop responds, the DC voltage does not settle into the sustained periodic oscillation observed under the traditional strategy, and the system reaches a stable operating condition well before the fault is cleared. These results indicate that, across different fault severities, the proposed strategy consistently allows the wind farm to actively curtail its own power output to match the receiving-end grid’s reduced delivery capability, alleviating the DC-side overvoltage at its source rather than relying on passive dissipation.

5.2.2. Receiving-End Single-Line-to-Ground Fault

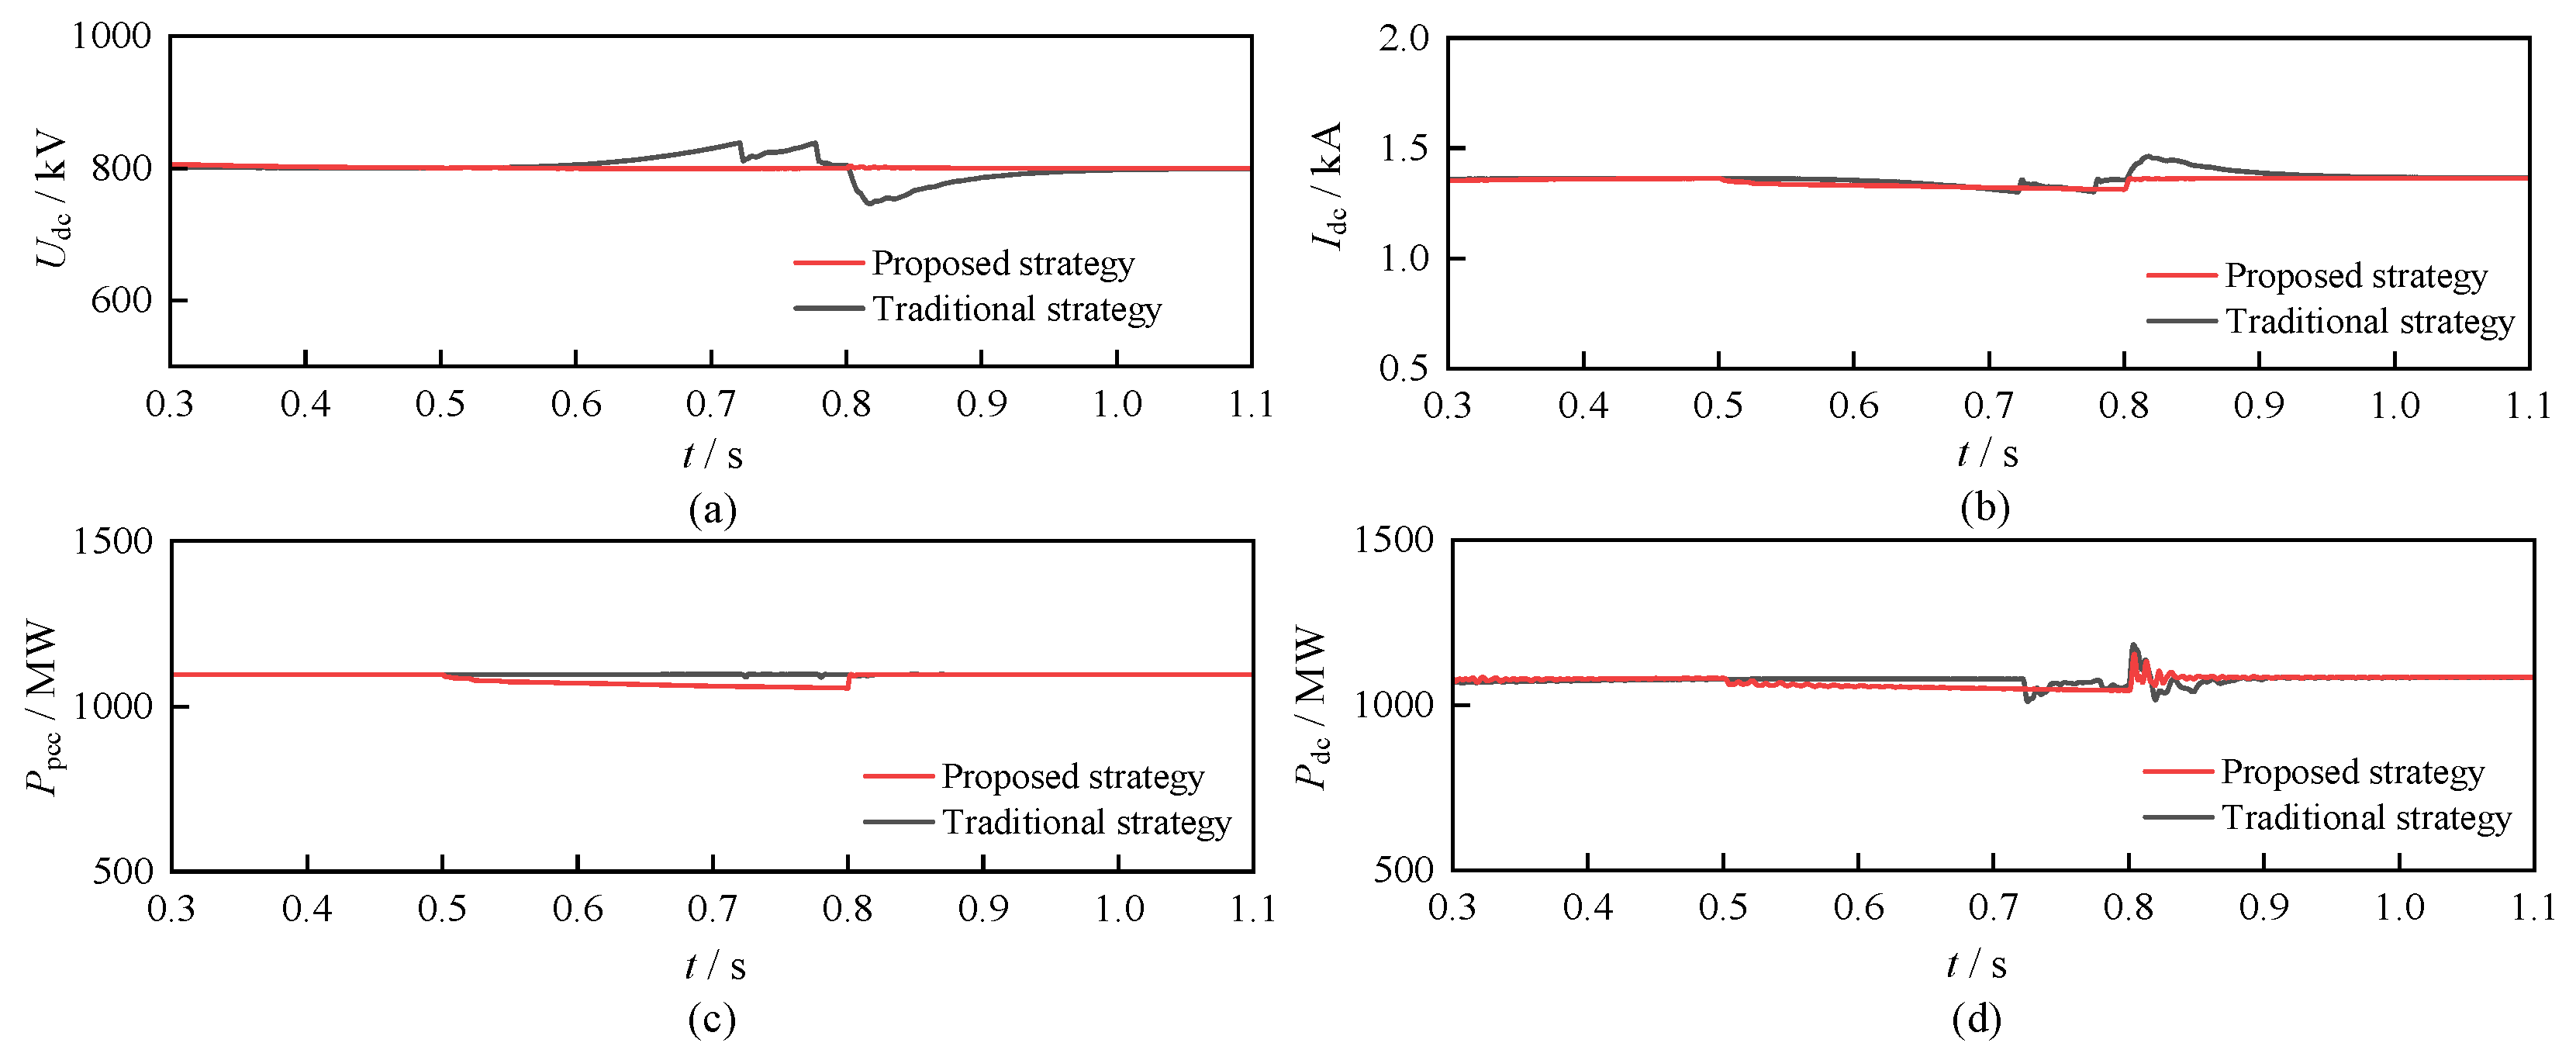
At simulation time t = 0.5 s, a single-line-to-ground fault was applied at the receiving end, lasting 200 ms before being cleared. The response waveforms of the system under the two strategies are compared in Figure 15.
When a single-line-to-ground fault occurs at the receiving end, the negative-sequence current suppression control already present in the receiving-end converter station effectively isolates the double-frequency ripple caused by the unbalanced fault, so that it does not noticeably affect the DC voltage or DC current. Under the traditional strategy, the fault still creates a power surplus in the DC system, causing Udc to rise. The DC chopper switches frequently to dissipate this surplus power, continuing to produce periodic oscillations in the DC voltage and DC current, similar to the behavior observed under symmetrical receiving-end faults. Under the proposed strategy, each wind farm actively reduces its active power output (Figure 15c), thereby reducing the active power injected into the DC transmission system to match the power that can be delivered to the receiving-end grid, effectively relieving the power surplus in the DC system. Throughout the fault, Udc and Idc remain stable, with no noticeable disturbance.

5.2.3. Influence of System Parameter Variations on Receiving-End Fault Ride-Through Strategy

According to Equation (24), the wind-turbine terminal-voltage limit Uf,lim depends on the DC-line resistance Rdc, transformer leakage reactance Xd, and current wind-farm operating power ΣPwj. Equation (25) further shows that the terminal-voltage reference U f * varies in the same direction as Uf,lim. The receiving-end voltage-sag depth is not a direct input to these two equations, because the proposed strategy uses closed-loop measurements and detects the resulting power surplus through the measured Uf. The grid-fault condition instead affects the transient trajectories and duration of the control response.
The parameter analysis is performed in two steps. First, ΣPwj is reduced from 1100 MW to 800 MW while Rdc = 2 Ω and Xd = 12 Ω remain unchanged. Equations (24) and (25) give Uf,lim ≈ 0.895 kV (1.297 p.u.) and U f * ≈ 0.724 kV (1.05 p.u.), respectively. Thus, within the range considered, changing ΣPw alone causes only a modest change in the calculated limits. Second, with ΣPwj = 800 MW, Rdc and Xd are further increased from 1 Ω and 12 Ω to 9 Ω and 54 Ω, respectively. The recalculated values are Uf,lim ≈ 0.927 kV (1.343 p.u.) and U f * ≈ 0.73 kV (1.057 p.u.), indicating a more pronounced influence of the equivalent line and transformer impedances.
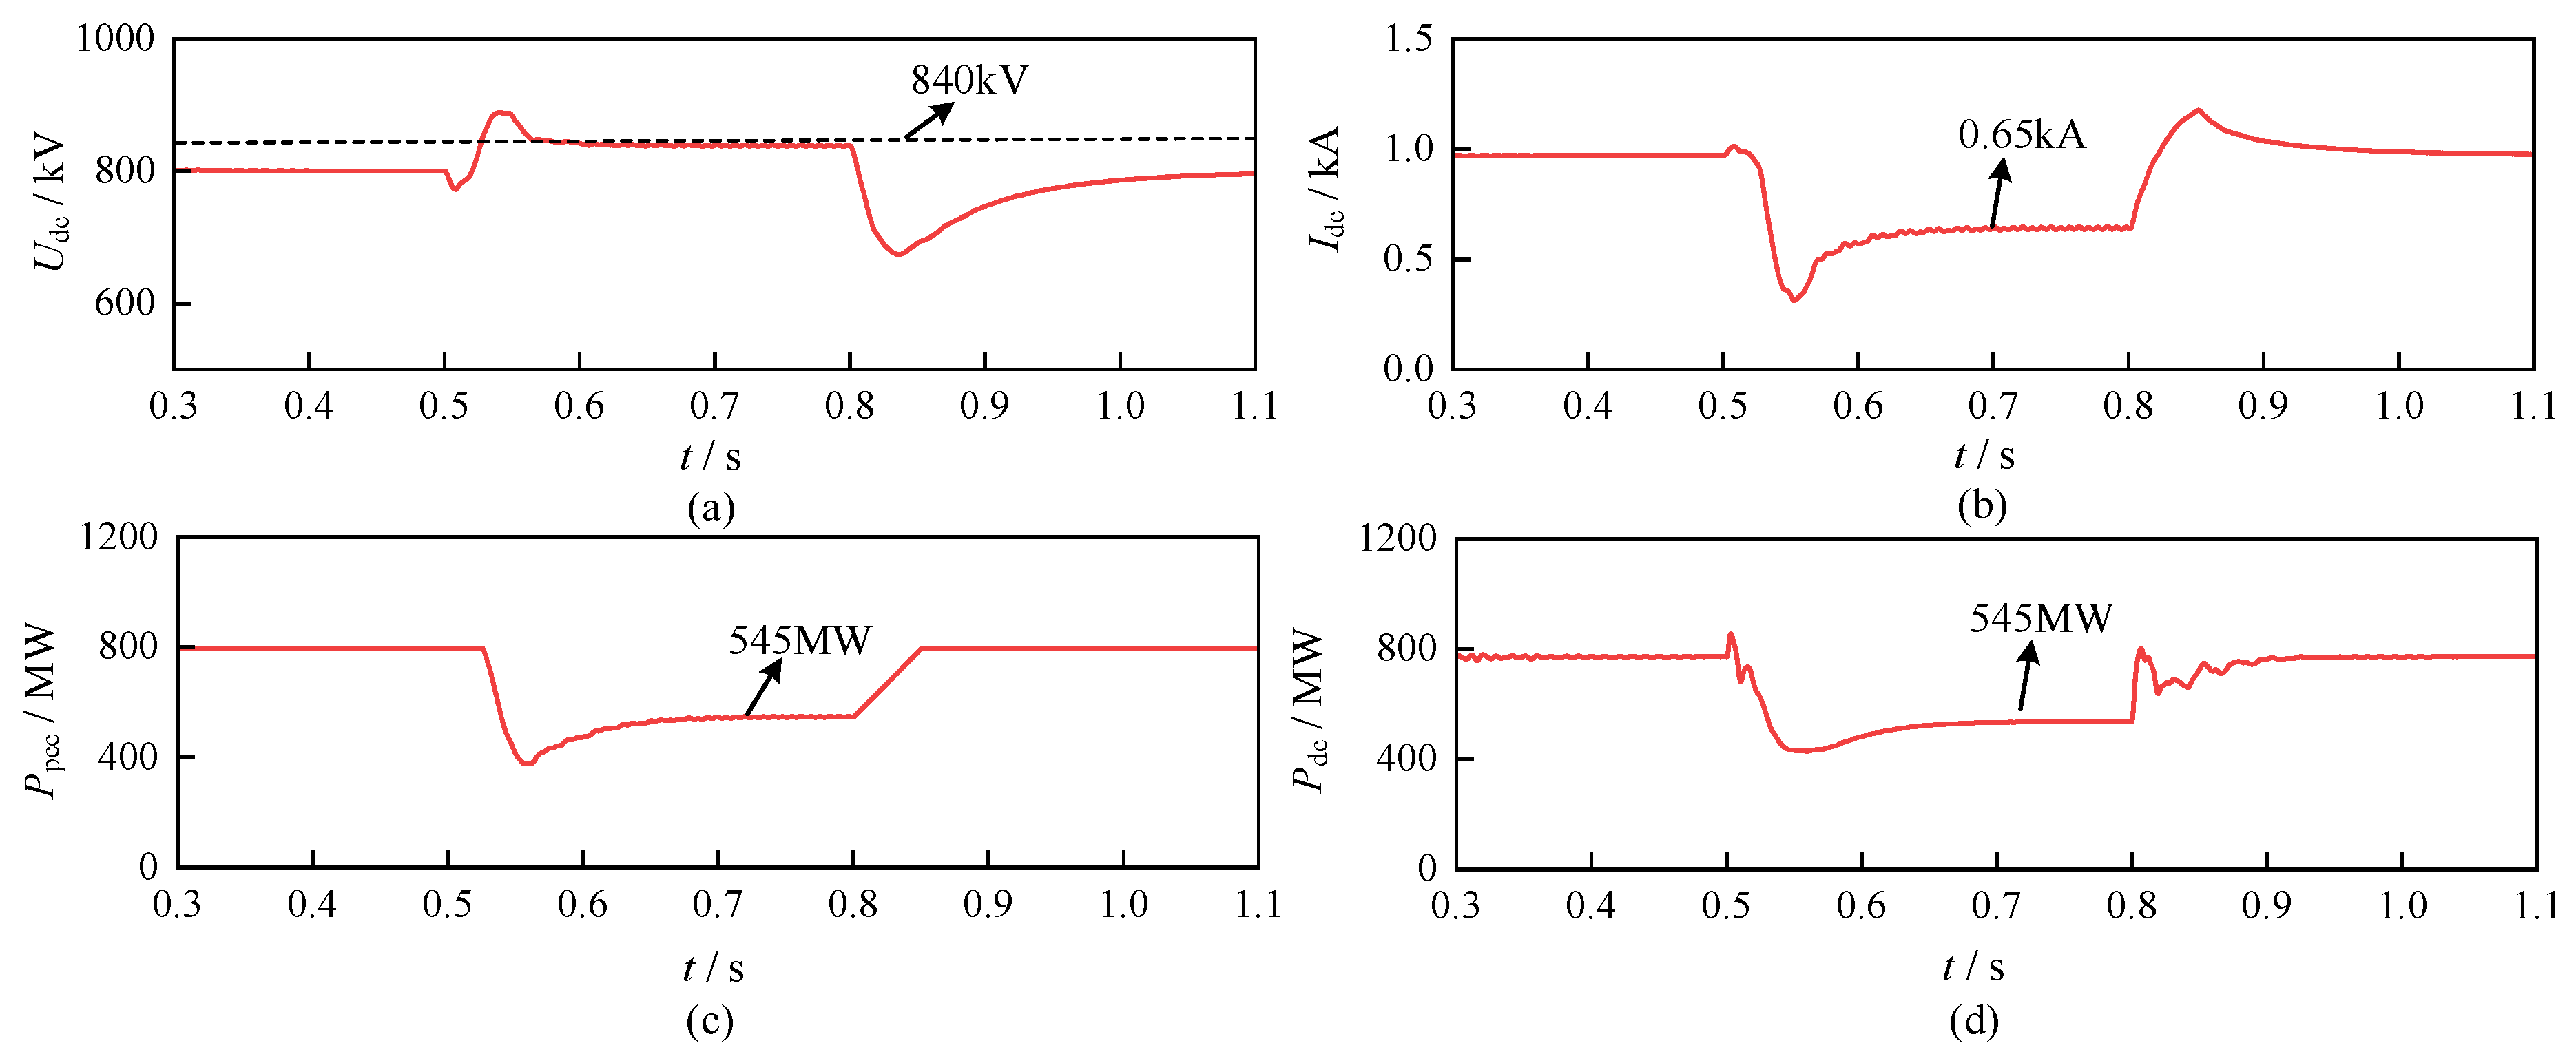
An additional simulation is conducted based on the receiving-end fault case in Section 5.2.1(1). The receiving-end voltage-sag depth and fault duration are retained at 50% and 300 ms, respectively. The modified parameters are ΣPwj = 800 MW, Rdc = 9 Ω, and Xd = 54 Ω. The simulation results are shown in Figure 16.
As shown in Figure 16, after a brief transient at the fault onset, the DC voltage stabilizes at approximately 840 kV and the DC current settles at approximately 0.65 kA. Accordingly, the sending-end and receiving-end active powers both stabilize at approximately 545 MW, indicating that the source-side power input is effectively matched to the power that can be delivered by the receiving-end converter station during the fault. Therefore, with U f * recalculated as approximately 0.73 kV, the proposed strategy remains effective under the simultaneous variations in wind-farm operating power, DC-line resistance, and transformer leakage reactance.

6. Conclusions

This paper addresses the fault ride-through problem of an offshore wind power transmission system via diode rectifier units under sending-end and receiving-end AC faults. The transient mechanisms of DRU blocking under sending-end faults and DC overvoltage under receiving-end faults were analyzed, and corresponding fault ride-through strategies were proposed. The main conclusions are as follows:
(1) For sending-end AC faults, the relationship between the DC current and the transmitted DC power was established. The proposed active voltage reduction strategy at the receiving-end converter station adaptively lowers the DC voltage reference according to the degree of the DC current drop. It allows the DRU to regain its conduction condition, maintain active power transmission during the fault, and prevent wind turbines from tripping and disconnecting from the grid. Table 4 further compares the proposed strategy with representative existing methods for sending-end faults in terms of control architecture, required measurements, communication needs, hardware requirements, and fault ride-through performance.
(2) For receiving-end AC faults, the relationship between the DC voltage and the wind turbine outlet voltage was established. The proposed source-side active power reduction strategy uses the change in the wind turbine outlet voltage to represent the power imbalance and actively reduces the wind farm’s power output. It matches the power injected at the sending end to the power that can be delivered at the receiving end during the fault, suppressing the DC overvoltage from the source side. Table 5 further compares the proposed strategy with representative existing methods for receiving-end faults.
(3) Simulation results show that the proposed active voltage reduction strategy avoids DRU blocking and interruption of the power path during sending-end faults, while the active power reduction strategy effectively limits the DC voltage and reduces transient oscillation during receiving-end faults. Both strategies achieve power coordination and voltage stability under different types of AC faults, and both feature a simple control structure with good engineering applicability.

Author Contributions

Conceptualization, J.L.; methodology, J.L.; software, W.L. (Wenxuan Lyu); validation, S.X. and W.L. (Wenxuan Lyu); formal analysis, J.L.; investigation, S.X.; resources, W.L. (Wei Li); writing—original draft preparation, J.L.; writing—review and editing, S.X., W.L. (Wenxuan Lyu) and W.L. (Wei Li); visualization, W.L. (Wenxuan Lyu); supervision, W.L. (Wei Li); project administration, W.L. (Wei Li); funding acquisition, S.X. All authors have read and agreed to the published version of the manuscript.

Funding

This research was funded by the Science and Technology Project of State Grid Jiangsu Electric Power Co., Ltd., grant number J2025001.

Data Availability Statement

The original contributions presented in the study are included in the article. Further inquiries can be directed to the corresponding author.

Acknowledgments

The authors would like to thank the State Grid Jiangsu Electric Power Co., Ltd. Research Institute for its support of this work.

Conflicts of Interest

All authors were employed by the company State Grid Jiangsu Electric Power Co., Ltd. They declare that the research was conducted in the absence of any commercial or financial relationships that could be construed as a potential conflict of interest. The authors declare that this study received funding from State Grid Jiangsu Electric Power Co., Ltd. The funder was not involved in the study design, collection, analysis, interpretation of data, the writing of this article or the decision to submit it for publication

Appendix A

The PI gains of the two proposed outer loops are selected following standard practice for cascaded power-converter control. Their response speed is coordinated with the response speed of the existing inner and outer loops of the wind turbine converter and the receiving-end converter station.
Specifically, the gains kip and kii of the active voltage reduction control loop are selected so that the response time of U dc * matches the time scale of the receiving-end converter station’s existing outer loop. The adjustment speed of U dc * should match the time-scale range. The range is roughly 10–20 times the current inner-loop time scale, which is a few milliseconds. The resulting time scale for U dc * is therefore on the order of tens of milliseconds [24].
Similarly, the gains kup and kui of the active power reduction control loop are selected so that the response time of P w * matches the time scale of the wind turbine’s existing power outer loop. The response speed of P w * should match the outer-loop time scale, which is roughly 10 times the wind turbine’s current inner-loop time scale of about 10 ms. The resulting time scale for P w * is therefore on the order of hundreds of milliseconds [25].
Table A1 lists the PI parameters used in the simulation of this paper. In addition to the two newly proposed outer loops, the table includes the current inner loop, the voltage inner loop, and the power outer loop of the wind turbine grid-side converter. It also includes the DC current inner loop and the DC voltage outer loop of the receiving-end converter station.
Table A1. PI control parameters used in this simulation.
ConverterControl LoopKpKi
Wind turbine
grid-side converter
Current inner loop5.5200
Voltage inner loop0.610
Active power outer loop720
Active power reduction control loop20500
Receiving-end converter stationDC current inner loop0.5333.33
DC voltage outer loop20200
Active voltage reduction control loop1650

References

  1. Tang, C.; Li, Y.; Li, H.; Liu, R.; Liu, Z.; Pan, X.; Yang, Q.; Xiao, H. Coordinated Inertia Support Strategy for Offshore Wind Power-Integrated MMC-HVDC System. Electronics 2026, 15, 1063. [Google Scholar] [CrossRef] [Scilit]
  2. Deng, J.; Cheng, F.; Yao, L.; Xu, J.; Mao, B.; Li, X.; Chen, R. A review of system topologies, key operation and control technologies for offshore wind power transmission based on HVDC. IET Gener. Transm. Distrib. 2023, 17, 3345–3363. [Google Scholar] [CrossRef] [Scilit]
  3. Jin, Y.; Zhang, Z.; Huang, Y.; Xu, Z.; Xu, F. Harmonic filtering and fault ride-through of diode rectifier unit and modular multilevel converter based offshore wind power integration. IET Renew. Power Gener. 2023, 17, 3554–3567. [Google Scholar] [CrossRef] [Scilit]
  4. Yang, Z.; Wang, X.; Zou, K.; Jiang, C. Mid-frequency oscillation suppression methodology for offshore wind power VSC-HVDC system and its engineering validation. Electr. Power Eng. Technol. 2025, 44, 109–116. [Google Scholar]
  5. Guo, G.; Wang, H.; Song, Q.; Zhang, J.; Wang, T.; Ren, B.; Wang, Z. HB and FB MMC Based Onshore Converter in Series-Connected Offshore Wind Farm. IEEE Trans. Power Electron. 2020, 35, 2646–2658. [Google Scholar] [CrossRef] [Scilit]
  6. Chen, H.; Li, Z.; Du, W.; Wang, H. Reduced-order method and oscillation risk assessment for renewable energy with VSC-HVDC system. Electr. Power Eng. Technol. 2026, 45, 26–38. [Google Scholar]
  7. Lu, Y.; You, J.; Li, Z.; Qiu, F.; Ye, W.; Zhang, Z.; Xu, Z. Heterogeneous DC Transmission System for Offshore Wind Power Based on the Parallel Operation of MMC-HVDC and DRU-HVDC. Electronics 2026, 15, 2991. [Google Scholar] [CrossRef] [Scilit]
  8. Bernal-Perez, S.; Ano-Villalba, S.; Blasco-Gimenez, R.; Rodriguez-D’Derlee, J. Efficiency and Fault Ride-Through Performance of a Diode-Rectifier- and VSC-Inverter-Based HVDC Link for Offshore Wind Farms. IEEE Trans. Ind. Electron. 2013, 60, 2401–2409. [Google Scholar] [CrossRef] [Scilit]
  9. Liang, P.; Pei, X.; Zhou, Y.; Wu, H.; Xu, Y.; Zhang, Z.; Xu, Z.; Qiu, F. Harmonic Analysis and Elimination of Transmission Scheme Based on DRU for Medium-Frequency Offshore Wind Farms. Electronics 2025, 14, 3669. [Google Scholar] [CrossRef] [Scilit]
  10. Bidadfar, A.; Saborio-Romano, O.; Cutululis, N.A.; Sorensen, P.E. Control of Offshore Wind Turbines Connected to Diode Rectifier-Based HVdc Systems. IEEE Trans. Sustain. Energy 2021, 12, 514–523. [Google Scholar] [CrossRef] [Scilit]
  11. Yu, L.; Li, R.; Xu, L. Distributed PLL-based control of offshore wind turbines connected with diode-rectifier-based HVDC systems. IEEE Trans. Power Deliv. 2018, 33, 1328–1336. [Google Scholar] [CrossRef] [Scilit]
  12. Zhang, Z.; Jin, Y.; Xu, Z. Two offshore wind farm integration schemes based on grid forming wind turbines and diode rectifier unit. High Volt. Eng. 2022, 48, 2098–2107. [Google Scholar]
  13. Xiao, H.; Huang, X.; Huang, Y.; Liu, Y. Self-Synchronizing Control and Frequency Response of Offshore Wind Farms Connected to Diode Rectifier Based HVDC System. IEEE Trans. Sustain. Energy 2022, 13, 1681–1692. [Google Scholar] [CrossRef] [Scilit]
  14. Yu, H.; Cai, X.; Yang, R.; Yang, M.; Tang, G. Analysis of Electrical Regulation Characteristics and Group Grid-Forming Control Strategy of DRU-HVDC Integrated Offshore Wind Farm. Proc. CSEE 2025, 45, 2318–2334. [Google Scholar]
  15. Li, R.; Yu, L.; Xu, L. Offshore AC fault protection of diode rectifier unit-based HVdc system for wind energy transmission. IEEE Trans. Ind. Electron. 2019, 66, 5289–5299. [Google Scholar] [CrossRef] [Scilit]
  16. Zhang, Y.; Zhu, W.; Tang, C.; Liu, N.; Li, S.; Wang, H. Start-Up and Fault-Ride-Through Strategy for Offshore Wind Power via DRU-HVDC Transmission System. Energies 2024, 17, 4968. [Google Scholar] [CrossRef] [Scilit]
  17. Yang, M.; Cai, X.; Wusiman, A.; Zhang, J.; Lyu, J. Distributed-Diode-Rectifiers-Based Offshore Wind Power MVDC Direct-Transmission System. IEEE Trans. Energy Convers. 2022, 37, 643–653. [Google Scholar] [CrossRef] [Scilit]
  18. Xiao, H.; Huang, X.; Li, Y.; Huang, W.; Cai, D.; Peng, F. Reactive Power-Synchronization Control for Offshore Wind Turbines Connected to Diode Rectifier. High Volt. Eng. 2022, 48, 3820–3828. [Google Scholar]
  19. Zhang, Z.; Xu, Z. Design and DC fault clearance of modified hybrid MMC with low proportion of full-bridge submodules. IET Gener. Transm. Distrib. 2021, 15, 2203–2214. [Google Scholar] [CrossRef] [Scilit]
  20. Guo, M.; Hao, Q.; Ding, L. Improved AAVM and Small-Signal Model of Hybrid MMC Considering Dynamic Differences Between Full-Bridge and Half-Bridge Submodules. IEEE Trans. Power Electron. 2024, 39, 8215–8228. [Google Scholar] [CrossRef] [Scilit]
  21. Du, C.; Zhang, Q.; Cao, S. A Smart Fault-Tackling Strategy Based on PFTE for AC Three-Phase-to-Ground Faults in the Multi-Terminal HVDC Wind Power Integration System: Further Foundings. Energies 2022, 15, 768. [Google Scholar] [CrossRef] [Scilit]
  22. Yu, L.; Fu, Z.; Zhu, J.; Li, R.; Peng, G.; Zhao, C. Review on Grid-forming Control and Start-up Method of Diode-rectifier-unit Based HVDC Transmission System for Remote Offshore Wind Farm. Autom. Electr. Power Syst. 2023, 47, 63–79. [Google Scholar]
  23. Brochu, J.; Larose, C.; Gagnon, R. Generic Equivalent Collector System Parameters for Large Wind Power Plants. IEEE Trans. Energy Convers. 2011, 26, 542–549. [Google Scholar] [CrossRef] [Scilit]
  24. Lu, X.; Chen, W.; Li, K.; Zhang, G.; Yu, H. Evaluation of Power Carrying Capacity Limits and Parameter Stability Regions at the PCC of MMC-HVDC System. Power Syst. Technol. 2026, 50, 2783–2793. [Google Scholar]
  25. Huang, M.; Shu, S.; Li, X.; Fu, X.; Zha, X. A Review of Synchronization-Stability-Oriented Analysis and Control of Power Electronic Grid-Connected Converters. Trans. China Electrotech. Soc. 2024, 39, 5978–5994. [Google Scholar]
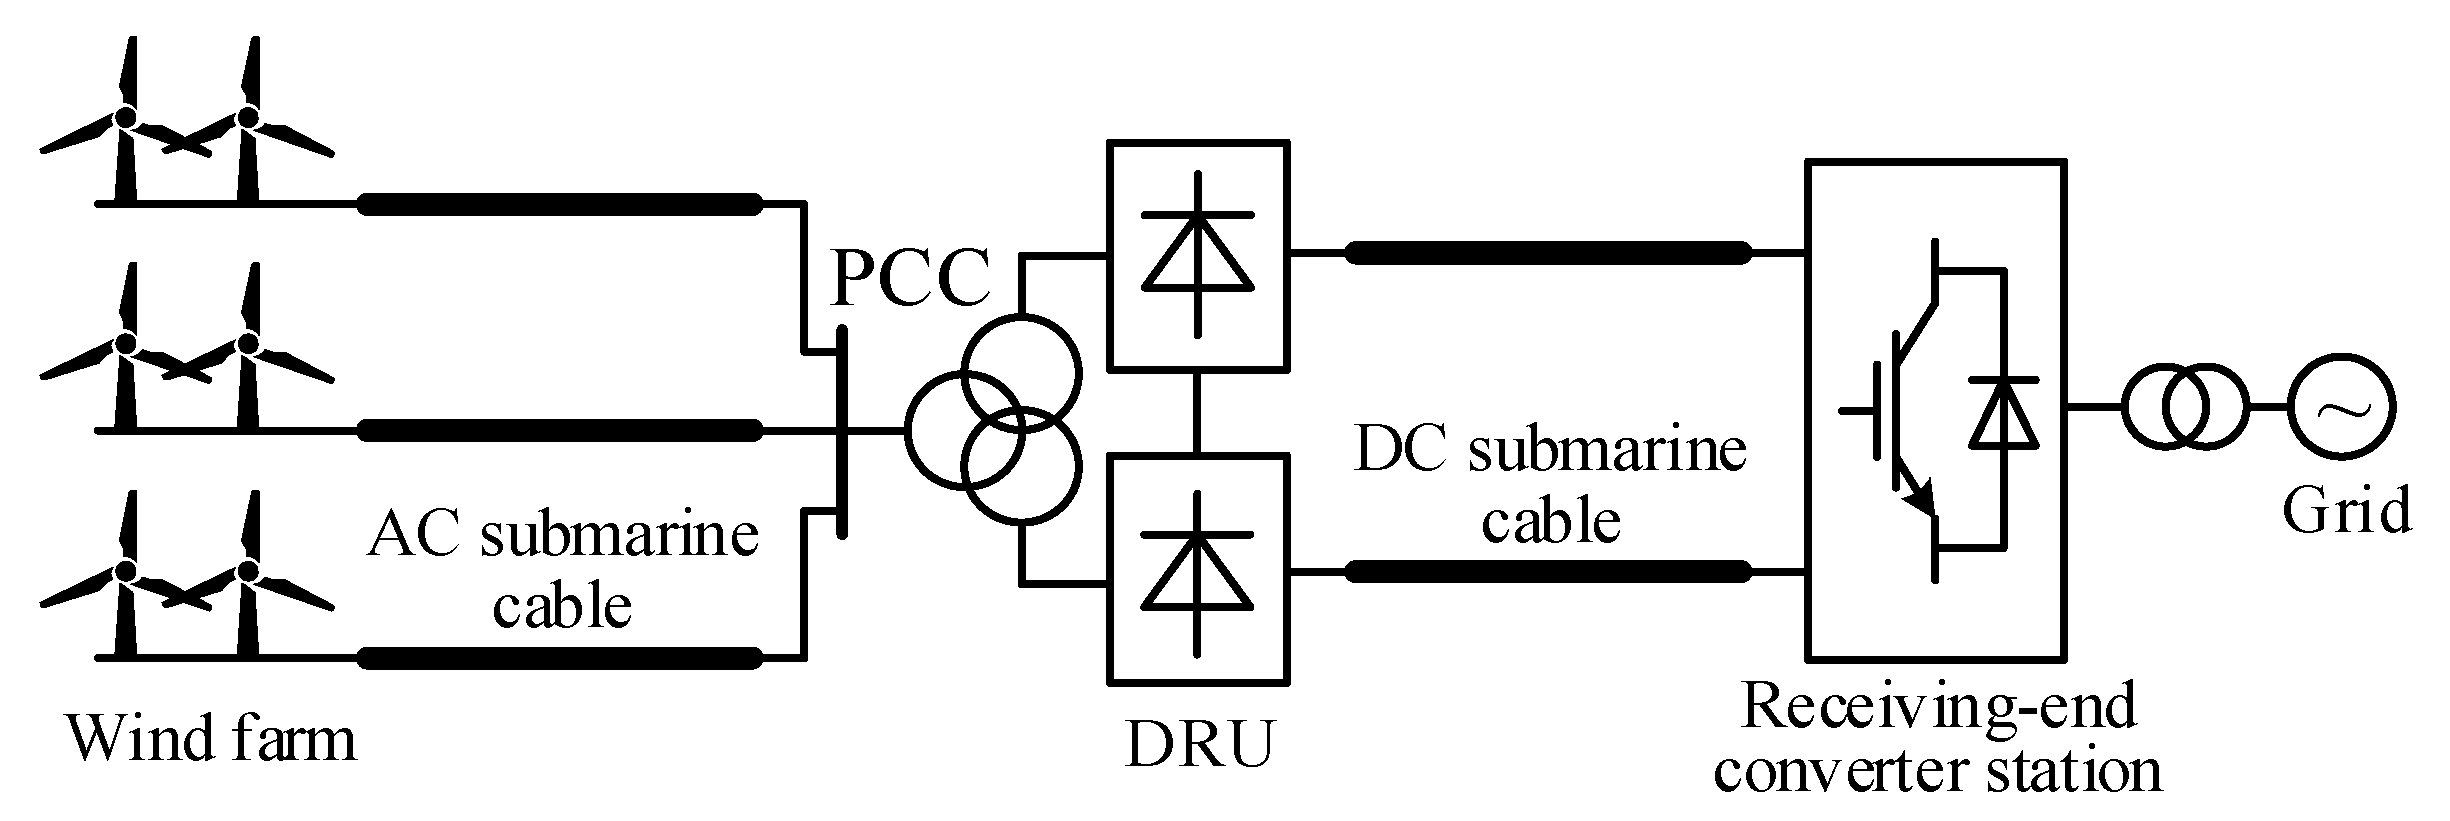
Figure 1. Topology of offshore wind power transmission via diode rectifier units.
Electronics 15 04201 g001
Figure 2. Control strategy of the wind turbine grid-side converter.
Electronics 15 04201 g002
Figure 3. Control strategy of the receiving-end converter station.
Electronics 15 04201 g003
Figure 4. Transient process of AC fault at the sending end under traditional fault ride-through strategy.
Electronics 15 04201 g004
Figure 5. Active voltage reduction fault ride-through strategy of the receiving-end converter station and its mechanism: (a) active voltage reduction fault ride-through strategy; (b) operating mechanism during the fault.
Electronics 15 04201 g005
Figure 6. Traditional DC energy dissipation fault ride-through strategy.
Electronics 15 04201 g006
Figure 7. Schematic diagram of voltage fluctuation under the traditional DC energy dissipation strategy.
Electronics 15 04201 g007
Figure 8. Source-side active power reduction fault ride-through strategy and its mechanism: (a) source-side active power reduction fault ride-through strategy; (b) operating mechanism during the fault.
Electronics 15 04201 g008
Figure 9. Simulation results of sending-end AC fault: fault duration 300 ms, voltage drop 50%: (a) sending-end AC voltage Upcc under the traditional strategy; (b) sending-end AC voltage Upcc under the proposed strategy; (c) DC voltage Udc; (d) DC current Idc; (e) sending-end active power Ppcc; (f) receiving-end active power Pdc.
Electronics 15 04201 g009
Figure 10. Simulation results of sending-end AC fault: fault duration 200 ms, voltage drop 80%: (a) DC voltage Udc; (b) DC current Idc; (c) sending-end active power Ppcc; (d) receiving-end active power Pdc.
Electronics 15 04201 g010
Figure 11. Simulation results of a sending-end single-line-to-ground fault: (a) DC voltage Udc; (b) DC current Idc; (c) sending-end active power Ppcc; (d) receiving-end active power Pdc.
Electronics 15 04201 g011
Figure 12. Simulation results under variations in Rdc and Xd during a sending-end AC fault: (a) DC voltage Udc; (b) DC current Idc; (c) sending-end active power Ppcc; (d) receiving-end active power Pdc.
Electronics 15 04201 g012
Figure 13. Simulation results of receiving-end AC fault: fault duration 300 ms, voltage drop 50%: (a) RMS sending-end AC voltage Upcc,rms; (b) DC voltage Udc; (c) RMS sending-end AC current Ipcc,rms; (d) DC current Idc; (e) sending-end active power Ppcc; (f) receiving-end active power Pdc.
Electronics 15 04201 g013
Figure 14. Simulation results of receiving-end AC fault: fault duration 200 ms, voltage drop 80%: (a) DC voltage Udc; (b) DC current Idc; (c) sending-end active power Ppcc; (d) receiving-end active power Pdc.
Electronics 15 04201 g014
Figure 15. Simulation results of a receiving-end single-line-to-ground fault: (a) DC voltage Udc; (b) DC current Idc; (c) sending-end active power Ppcc; (d) receiving-end active power Pdc.
Electronics 15 04201 g015
Figure 16. Simulation results under variations in ΣPwj, Rdc, and Xd during a receiving-end AC fault: (a) DC voltage Udc; (b) DC current Idc; (c) sending-end active power Ppcc; (d) receiving-end active power Pdc.
Electronics 15 04201 g016
Table 1. Main parameters of the simulation system.
EquipmentParameterValue
Wind farmsRated power/MW300(#1), 400(#2), 400(#3)
Frequency/Hz50
Transformer ratio0.69 kV/35 kV
Offshore substationRated capacity/MV·A300(#1), 400(#2), 400(#3)
Transformer ratio35 kV/220 kV
DRURated capacity/MV·A1100
Transformer ratio220 kV/300 kV
Transformer leakage inductance/mH20
DC lineLength/km100
Resistance per unit length/(Ω·km−1)0.01
Inductance per unit length/(mH·km−1)0.90
Capacitance per unit length/(uF·km−1)0.013
Receiving-end
converter station
Rated capacity/MV·A1100
Transformer ratio500 kV/416.41 kV
Rated DC voltage/kV800
Number of submodules per arm400
Rated submodule voltage/kV2
Submodule capacitance/uF9000
Arm reactor/mH133
Table 2. Comparison of sending-end AC fault ride-through performance.
IndicatorProposed StrategyTraditional Strategy
Maximum Udc deviation during the fault405 kV0 kV
Minimum Idc during the fault1.16 kA0 kA (DRU blocked)
Pdc during the fault458 MW0 MW
Maximum power loss
(relative to rated capacity)
58%100%
Recovery of UdcOvershoot ≈ 7.5% (≈60 kV);
recovery time ≈ 15 ms
Recovery of PdcOvershoot ≈ 6.5% (≈70 MW);
recovery time ≈ 25 ms
Table 3. Comparison of receiving-end AC fault ride-through performance.
IndicatorProposed StrategyTraditional Strategy
Udc range during the faultAbout 840 kVOscillates repeatedly between 800 kV and 840 kV
Idc during the fault0.64 kAClose to 1.37 kA (IdcN);
periodic oscillation
Ppcc during the fault540 MW1100 MW
Pdc during the fault540 MWClose to 1100 MW;
periodic oscillation
Maximum active-power curtailment
(relative to rated capacity)
51%0%
Voltage/current oscillation
during the fault
NonePeriodic oscillation
Recovery of PpccNo noticeable overshoot;
recovery time 90 ms
Table 4. Comparison of sending-end AC fault ride-through methods.
MethodControl ArchitectureRequired MeasurementsCommunication RequirementsHardware
Requirements
Fault Performance
Reference [14]Crowbar resistor absorbs surplus powerWind turbine DC bus
voltage
Not requiredExtra resistor requiredCapacitor voltage stable, DRU may still block
Reference [15]Adaptive current limiting with overcurrent protectionOutlet voltage and currentNot requiredNot requiredOvercurrent limited,
DRU may still block
Reference [16]Grid-forming control with virtual impedanceOutlet voltage and currentNot requiredNot requiredRecovery improved,
DRU may still block
ProposedDC current-based active voltage reduction at receiving endReceiving-end DC current;
sending-end voltage Upcc
RequiredNot requiredDRU stays conducting; power uninterrupted
Table 5. Comparison of receiving-end AC fault ride-through methods.
MethodControl ArchitectureRequired MeasurementsCommunication RequirementsHardware
Requirements
Fault Performance
Reference [9]Dissipation resistor absorbs surplus powerDC voltageNot requiredDissipation device requiredOvervoltage limited, repeated oscillation
Reference [11]Active DC voltage boostingDC voltageNot requiredNot requiredOvervoltage eased, power not reduced
Reference [17]Voltage boosting plus reduced turbine port voltageDC voltage, turbine outlet voltageRequiredNot requiredTransmission weakened, power not reduced at source
ProposedTurbine voltage-based active power reductionTurbine outlet voltage,
aggregate active power of wind farms
RequiredNot requiredOvervoltage suppressed at source, no oscillation
Disclaimer/Publisher’s Note: The statements, opinions and data contained in all publications are solely those of the individual author(s) and contributor(s) and not of MDPI and/or the editor(s). MDPI and/or the editor(s) disclaim responsibility for any injury to people or property resulting from any ideas, methods, instructions or products referred to in the content.