Article

Robot-Based Hazard Detection for Wastewater Treatment Plants

1
School of Software Engineering, Beijing Jiaotong University, Beijing 100044, China
2
School of Cyberspace Science and Technology, Beijing Jiaotong University, Beijing 100044, China
3
National College of Excellent Engineers, Beijing Jiaotong University, Beijing 100044, China
*
Author to whom correspondence should be addressed.
Electronics 2026, 15(17), 3801; https://doi.org/10.3390/electronics15173801
Submission received: 6 July 2026 / Revised: 15 August 2026 / Accepted: 18 August 2026 / Published: 24 August 2026
(This article belongs to the Special Issue AI for Industry)

Abstract

Wastewater treatment plants (WWTPs) are essential infrastructure for urban water management. Their stable operation is critical to effluent quality and public safety. However, wastewater treatment involves complex biochemical processes and extensive electromechanical equipment. Hazards such as sludge flotation in secondary clarifiers, fire, electric shock, and toxic gas poisoning may occur. These hazards can threaten worker safety and reduce treatment efficiency. Traditional inspection mainly relies on manual patrols, fixed-camera monitoring, and experience-based judgment. These methods often have low efficiency, limited coverage, and delayed responses. To address these limitations, this paper investigates robot-based hazard detection for WWTPs. A multisource hazard detection dataset is constructed for secondary clarifiers and confined spaces, including images collected by an inspection robot. Object detection models are then applied to identify typical hazards. Comparative experiments are conducted using Faster R-CNN and several YOLO-series models. YOLOv12 achieves mAP@0.5 values of 0.917 and 0.819 for sludge flotation detection and confined space hazard detection, respectively. It also provides a good balance between detection performance and inference efficiency. The results demonstrate that robot vision combined with object detection can support intelligent inspection in WWTPs.

1. Introduction

Wastewater treatment plants (WWTPs) are key infrastructure for urban water management [1]. The operation of WWTPs involves long process chains, complex biochemical reactions, and extensive electrical equipment, which may cause safety and operational risks [2]. Hazards such as sludge flotation, flammable or toxic gas accumulation, standing water, and electrical insulation aging may lead to effluent quality fluctuations, equipment damage, explosions, poisoning, and electric shock [3]. Therefore, timely detection of sludge flotation, smoke, fire, standing water, and abnormal personal protection is essential for safe and stable operation of WWTPs.
Current hazard detection in WWTPs mainly relies on manual patrols, fixed-camera monitoring, online instruments, and operator experience. Manual inspection is affected by inspection frequency, staff experience, and site conditions, leading to low efficiency and missed or false detections [4]. Fixed cameras and online instruments can monitor local areas or process parameters, but their coverage and detectable targets are limited. Inspection robots offer flexible navigation, variable viewpoints, close-range sensing, and the ability to replace workers in hazardous areas. Combined with deep learning, they provide a promising approach to intelligent inspection in WWTPs [5].
Existing methods mainly focus on process parameter anomaly detection and image analysis of specific facilities [6]. PCA-based methods, LSTM networks, and Transformer models have been used for time-series anomaly detection based on water quality, flow rate, and liquid level data [7,8], while CNN and YOLOv5 models have been applied to microscopic image analysis of activated sludge [9,10]. However, hazards observed from the mobile viewpoint of inspection robots, such as sludge flotation, smoke, fire, standing water, and abnormal personal protection, remain less studied. These hazards have clear visual features and identifiable image regions, making object detection suitable for hazard classification and localization.
Therefore, this paper investigates robot-based hazard detection for WWTPs using object detection. Images of secondary clarifiers and confined spaces are collected by an inspection robot. Two tasks are constructed: sludge flotation detection and confined space hazard detection. Faster R-CNN, YOLOv8, YOLOv11, and YOLOv12 are compared to evaluate their applicability in typical inspection scenarios. The main contributions are as follows:
(1)
A robot-based hazard detection framework is proposed for WWTPs by integrating mobile robots with object detection to identify typical hazards.
(2)
A hazard detection dataset is built from WWTP inspection images and public web images, covering sludge flotation, smoke, fire, standing water, and personnel protection status.
(3)
Faster R-CNN, YOLOv8, YOLOv11, and YOLOv12 are systematically compared in terms of detection performance, computational complexity, and inference efficiency to support model selection for robot-based inspection in WWTPs.

2. Related Work

2.1. Hazard Detection Methods in WWTPs

Artificial intelligence has been applied to hazard detection in WWTPs, mainly through data-driven and image-based methods [6]. Data-driven methods use sensor data, such as water quality, flow rate, liquid level, dissolved oxygen, and equipment status, for anomaly detection and fault diagnosis. Autoencoders detect anomalies based on reconstruction errors [11], while LSTM and Transformer models capture temporal dependencies in operation parameters [7,8]. Image-based methods use fixed cameras, UAV images, or microscopic images to analyze facility and sludge status. Faster R-CNN, YOLOv5, and CNN models have been used for microbial object analysis and activated sludge analysis [9,10]. Object detection models, such as EfficientDet, have been applied to sewer pipe defect detection [12].
Overall, existing studies mainly focus on process parameters, sensor signals, microscopic sludge status, or specific facility anomalies. Hazards observed from the mobile viewpoint of inspection robots, such as sludge flotation, smoke, fire, standing water, and abnormal personal protection, remain less studied. These hazards have clear visual and spatial features, making them suitable for object detection.

2.2. Intelligent Inspection Robots

Inspection robots are increasingly used for high-risk and repetitive tasks in complex industrial sites, such as pipelines, underground cable trenches, and chemical plants. Jia et al. developed an adaptive 2D-SLAM-based robot for underground cable trench inspection [13]. Fischer et al. proposed an autonomous mobile robot integrating LiDAR, cameras, an electronic nose, and a microphone array for object detection, methane leak detection, and acoustic anomaly detection [14]. Gómez-Rosal et al. developed a smart robotic system for industrial plant supervision, supporting gas anomaly detection, oil film recognition, sound source localization, and obstacle avoidance [15]. Shen et al. proposed Sewer-YOLOACT, an RGB-D fusion method for real-time defect detection and size estimation using pipeline robots [16].
These studies demonstrate that inspection robots integrating visual perception and deep learning can improve automated inspection in complex industrial environments. However, existing robotic applications mainly focus on navigation, environmental perception, and equipment defect detection. Systematic research on detecting multiple types of safety hazards in complex WWTP environments remains limited.

2.3. Object Detection Methods

Object detection aims to identify object categories and locate their spatial positions in images or videos. Existing methods are commonly divided into two-stage and one-stage detectors. Two-stage detectors, such as R-CNN [17], Fast R-CNN [18], and Faster R-CNN [19], first generate candidate regions and then perform classification and bounding-box regression. They usually achieve high accuracy but have relatively low inference efficiency. One-stage detectors, such as RetinaNet [20] and the YOLO series [21,22], directly predict object categories and locations on feature maps, enabling faster inference. Considering the accuracy, real-time, and deployment requirements of WWTP inspection robots, this paper selects YOLO-series models and Faster R-CNN for comparative analysis.

3. Materials and Methods

3.1. Inspection Robot

The inspection robot serves as a mobile platform for visual data acquisition. It is equipped with stereo optical cameras (Intel Corporation, Santa Clara, CA, USA), an Ouster OS128 LiDAR (Ouster, Inc., San Francisco, CA, USA), and an integrated IMU (Unitree Robotics Co., Ltd., Hangzhou, China), which support image collection, localization, and mapping. Robot Operating System (ROS) is used to manage robot status, sensor data, and task workflows. This paper focuses on image-based hazard detection, while other sensor data are reserved for future multimodal hazard detection. During inspection, images or video frames are collected at preset points and transmitted to a remote server through a wireless network. After preprocessing, they are fed into the object detection model for hazard detection. The model outputs hazard categories, bounding boxes, and confidence scores. Figure 1 shows the workflow of robot-based hazard detection.

3.2. Inspection Scenarios and Detection Objects

According to the safety requirements of WWTPs, secondary clarifiers and confined spaces are selected as typical inspection scenarios. Typical hazards in these scenarios are defined as detection objects.

3.2.1. Secondary Clarifier Scenario

The secondary clarifier is a key solid–liquid separation unit in the activated sludge process, and its operating condition directly affects effluent quality. Under normal operation, the water surface is relatively stable, and sludge settles effectively. However, sludge flotation may occur due to sludge bulking, abnormal sludge loading, or improper return sludge control. This phenomenon can increase effluent turbidity, and may affect subsequent treatment units. Therefore, sludge flotation is selected as the main detection object in this scenario.

3.2.2. Confined Space Scenario

Confined spaces in WWTPs, such as screen rooms, pump rooms, pipe galleries, valve wells, sludge pits, and equipment rooms, are usually narrow, humid, poorly ventilated, and densely equipped. These conditions may lead to slipping, drowning, electric shock, fire, explosion, poisoning, and occupational exposure. Therefore, no mask, mask, fire, smoke, and standing water are selected as detection objects to represent personal protection status, fire-related hazards, and standing water hazards.

3.3. Hazard Detection Dataset for WWTPs

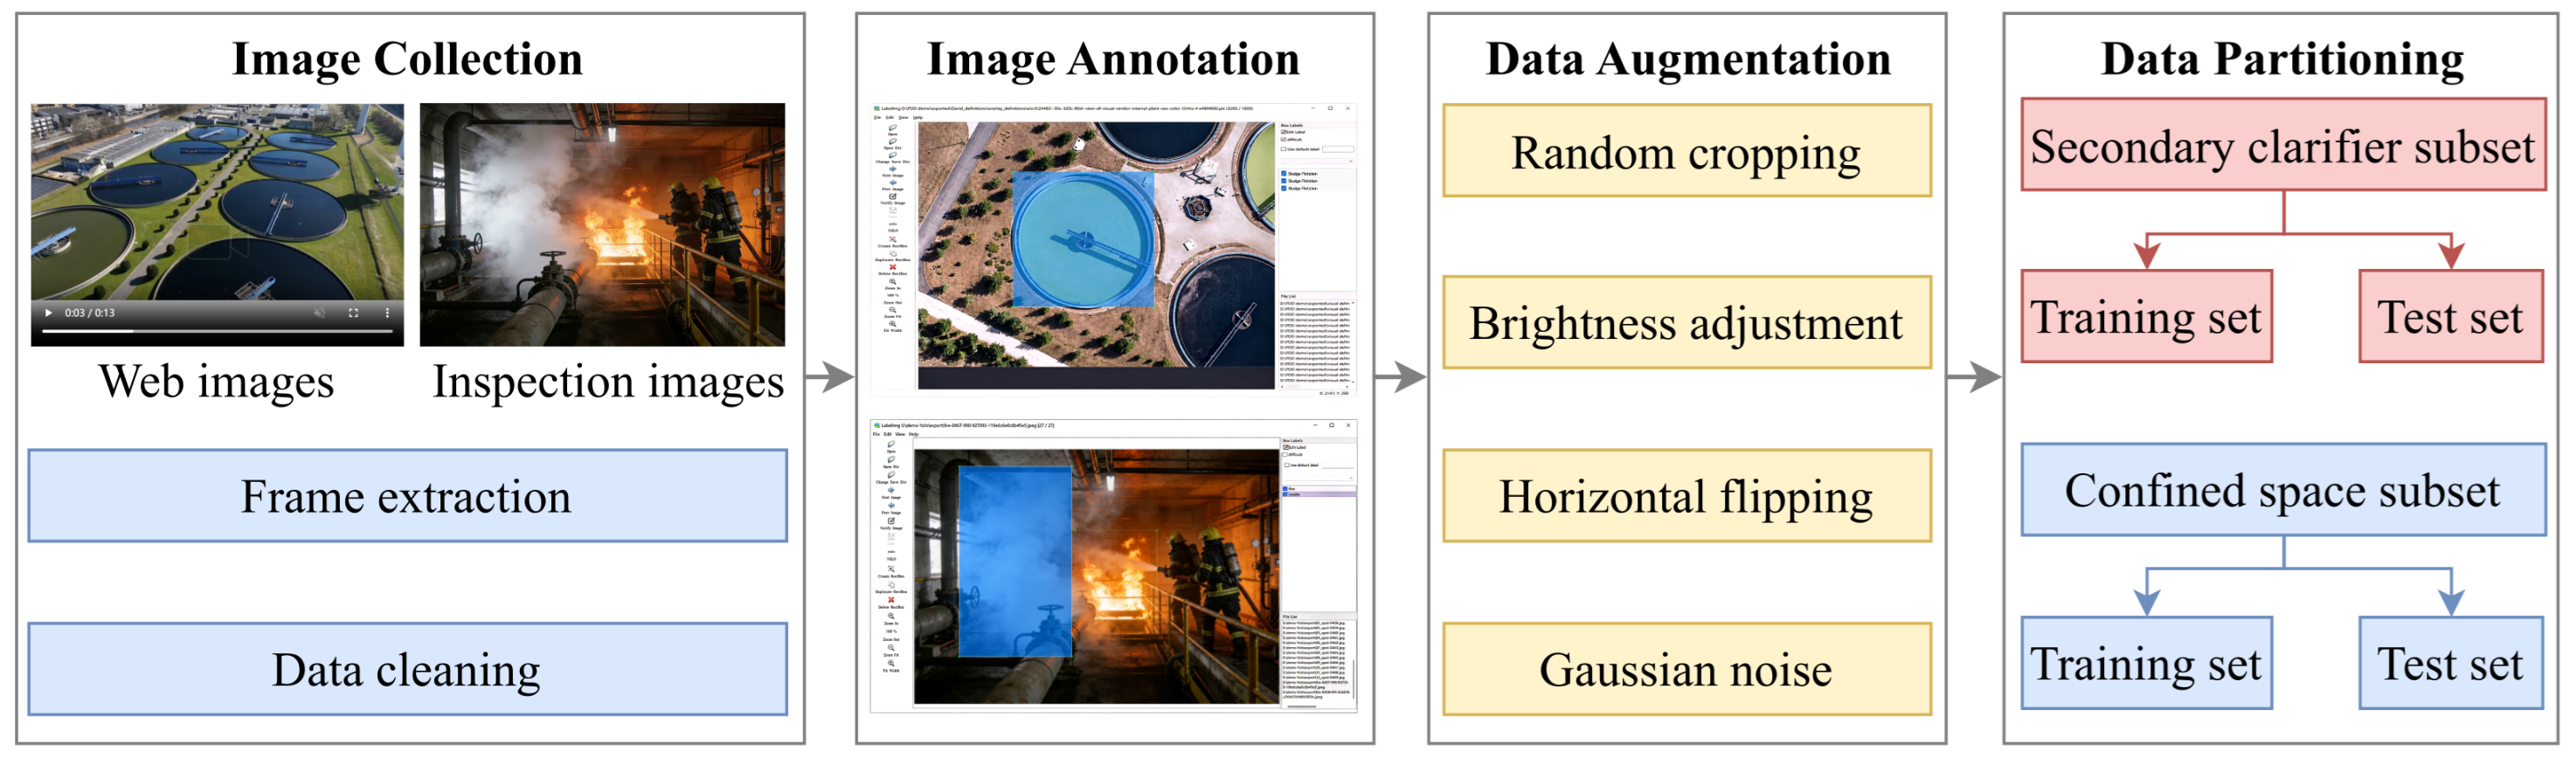
A hazard detection dataset is constructed for WWTP inspection robots. It includes a secondary clarifier subset and a confined space subset. The construction process is shown in Figure 2.
Images are collected from inspection robots, fixed-camera videos, and public sources. These sources account for 43.8%, 18.8%, and 37.5% of the secondary clarifier subset, respectively. The corresponding proportions in the confined space subset are 28.6%, 34.3%, and 37.1%. The data cover a range of devices, viewpoints, and environmental conditions, improving model robustness in real-world settings. Because abnormal cases are scarce, public images are used to supplement samples of sludge flotation, smoke, fire, and standing water. Video frames are extracted at 2 s intervals. Low-quality and duplicate frames are then removed.
LabelImg (version 1.8.6) is used to generate YOLO-format annotations, including class IDs and normalized bounding-box coordinates. Sludge flotation regions are annotated in the secondary clarifier subset. Smoke, fire, standing water, and personal protection status are annotated in the confined space subset. Images showing normal secondary clarifier operation are retained as negative samples, and multiple objects can be annotated in a single image. All annotations are manually reviewed for class accuracy, bounding-box placement, missing annotations, and incorrect annotations. Other annotators then independently check the results. Disputed samples are discussed and corrected to reduce annotation errors.
Data augmentation includes random cropping, brightness adjustment, horizontal flipping, and Gaussian noise. These operations improve model robustness to illumination changes, viewpoint variations, and sensor noise. The dataset is divided into training and test sets at a ratio of 8:2 using grouped stratified sampling. Class proportions remain approximately consistent and frames from the same video are kept within the same split. The secondary clarifier and confined space subsets contain 1600 and 3500 images, respectively. In the secondary clarifier subset, normal and sludge flotation images are approximately balanced (1:1). In the confined space subset, No Mask, Mask, Fire, Smoke, and Standing Water account for 8.04%, 30.68%, 17.97%, 15.91%, and 27.40% of all annotated instances, respectively. Although all categories are represented, some class imbalance remains because of practical data collection constraints. Dataset statistics are summarized in Table 1. Representative samples of each hazard category are shown in Figure 3.

3.4. Object Detection Model Selection

The hazard detection task in images collected by the inspection robot is formulated as an object detection problem. Given an input image I, the detection model outputs a set of detected objects:  
Y = { ( c i , b i , p i ) } i = 1 N ,
where c i denotes the category of the i-th object, b i = ( x i , y i , w i , h i ) denotes the bounding box, p i denotes the confidence score, and N denotes the number of detected objects.
To evaluate the applicability of different models in WWTP inspection scenarios, Faster R-CNN [19], YOLOv8, YOLOv11, and YOLOv12 [22] are selected for comparison. Faster R-CNN is a classical two-stage detector. It first generates candidate regions and then performs object classification and bounding-box regression. This design provides strong localization ability but leads to relatively low inference efficiency. In contrast, YOLO-series models are one-stage detectors that directly predict object categories and locations on feature maps. YOLOv8 provides a good balance between speed and accuracy and is suitable for real-time inspection tasks. YOLOv11 further improves feature fusion and small-object representation, which helps improve robustness in complex backgrounds. YOLOv12 enhances feature extraction and attention modeling, improving the interaction between global context and local object features. These properties make YOLO-series models suitable for hazard detection in complex WWTP inspection images.

3.5. Implementation Details

The YOLO-series models are initialized with publicly available pretrained weights: yolov8n.pt, yolov11n.pt, and yolov12n.pt. The input resolution is set to 640 × 640 , with a batch size of 32 and a maximum of 300 epochs. The optimizer is selected automatically, while the initial learning rate and weight decay are set to 0.01 and 5 × 10 4 , respectively. The training framework determines the final optimizer and related parameters. Faster R-CNN uses ResNet-50 as the backbone and an FPN to fuse multiscale features from layer1–layer4. The number of FPN output channels is set to 256, and LastLevelMaxPool is used. The backbone and detector are initialized with resnet50.pth and fasterrcnn_resnet50_fpn_coco.pth, respectively. The model is trained for 30 epochs using SGD. The initial learning rate, momentum, and weight decay are set to 0.01, 0.9, and  1 × 10 4 , respectively. The shorter side of each input image is resized to 640 pixels.
During inference, the confidence and NMS IoU thresholds are set to 0.25 and 0.5, respectively. All other settings follow the official defaults of the corresponding frameworks. Experiments are implemented in PyTorch v2.6.0 and conducted on an NVIDIA GeForce RTX 2080 Ti GPU with 11 GB of memory (NVIDIA Corporation, Santa Clara, CA, USA). The trained models are subsequently deployed on an Ascend 910B2 server for real-time inference on images collected by the inspection robot.
Detection performance is evaluated using Precision, Recall, F1-score, AP, mAP@0.5, and mAP@0.5:0.95. Precision measures the proportion of correct detections among all predictions, while Recall measures the proportion of ground-truth objects that are correctly detected. F1-score provides a balanced evaluation of Precision and Recall. AP is computed for each category at a given IoU threshold using a COCO-style 101-point interpolation protocol. For each category, predicted boxes are first matched with ground-truth boxes according to the specified IoU threshold. The detections are then ranked by confidence score, and Precision and Recall are calculated at different confidence levels to construct the Precision–Recall curve. To reduce the influence of local fluctuations in the curve, the precision envelope is used for interpolation, where the precision at each recall level is replaced by the maximum precision obtained at any recall level greater than or equal to it. AP is then calculated by averaging the interpolated precision values at 101 uniformly sampled recall levels from 0 to 1. mAP@0.5 denotes the mean AP at an IoU threshold of 0.5, while mAP@0.5:0.95 denotes the mean AP averaged over IoU thresholds from 0.5 to 0.95 with a step size of 0.05.

4. Results

4.1. Quantitative Results in the Secondary Clarifier Scenario

Table 2 presents the results of different models for sludge flotation detection in secondary clarifiers. Overall, the YOLO models outperform Faster R-CNN. YOLOv12 achieves the highest mAP@0.5 and mAP@0.5:0.95, reaching 0.917 and 0.802, respectively. Although the performance differences among YOLOv8, YOLOv11, and YOLOv12 are small, Faster R-CNN achieves the highest recall, while YOLOv11 performs best in precision and F1-score. Nevertheless, YOLOv12 provides the best overall detection performance.

4.2. Quantitative Results in the Confined Space Scenario

Table 3 presents the detection results of different models for confined space hazard detection. Overall, the YOLO models outperform Faster R-CNN. Although YOLOv11 achieves slightly higher recall and F1-score than YOLOv12, YOLOv12 obtains the highest mAP@0.5 and mAP@0.5:0.95, reaching 0.819 and 0.501, respectively. These results indicate that YOLOv12 provides the best overall performance in terms of mAP.

4.3. Precision–Recall Curve and Confusion Matrix Analysis

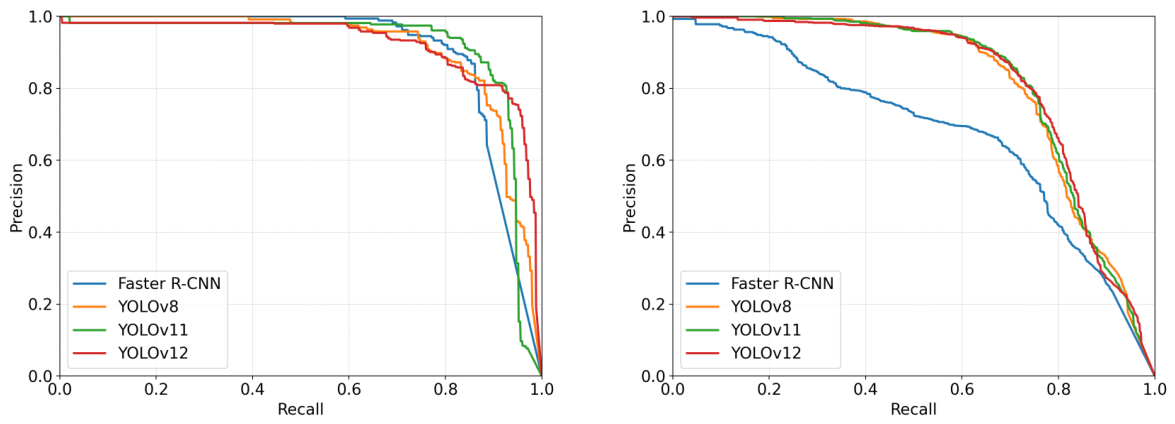
Figure 4 shows the overall Precision–Recall curves of all compared models on the two test subsets. In the secondary clarifier subset, all models maintain high Precision over a wide range of Recall, indicating that sludge flotation can be effectively detected. YOLOv12 shows a slightly larger area under the curve, which is consistent with its highest mAP@0.5. In the confined space subset, the YOLO-series models generally outperform Faster R-CNN. YOLOv8, YOLOv11, and YOLOv12 show close PR curves, indicating small performance differences among them. YOLOv12 shows a slightly larger area under the curve, consistent with its highest overall mAP@0.5 in Table 3.
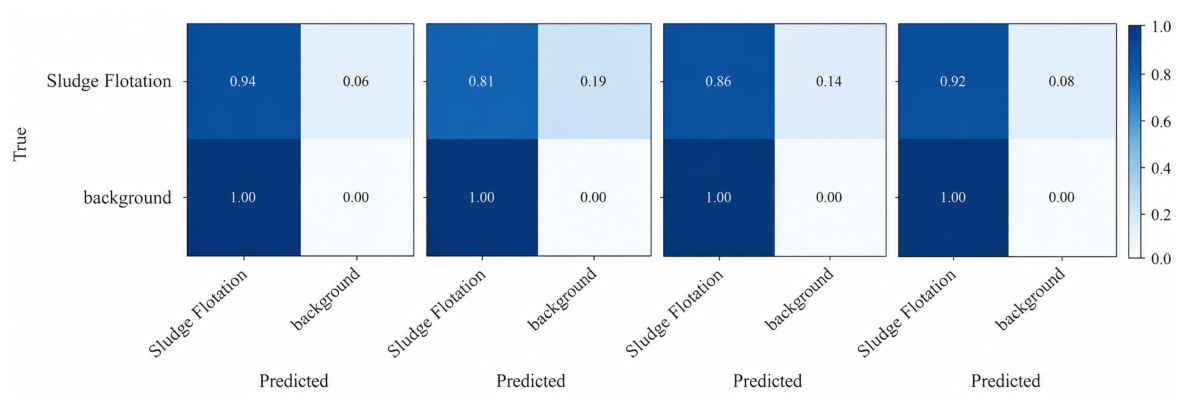
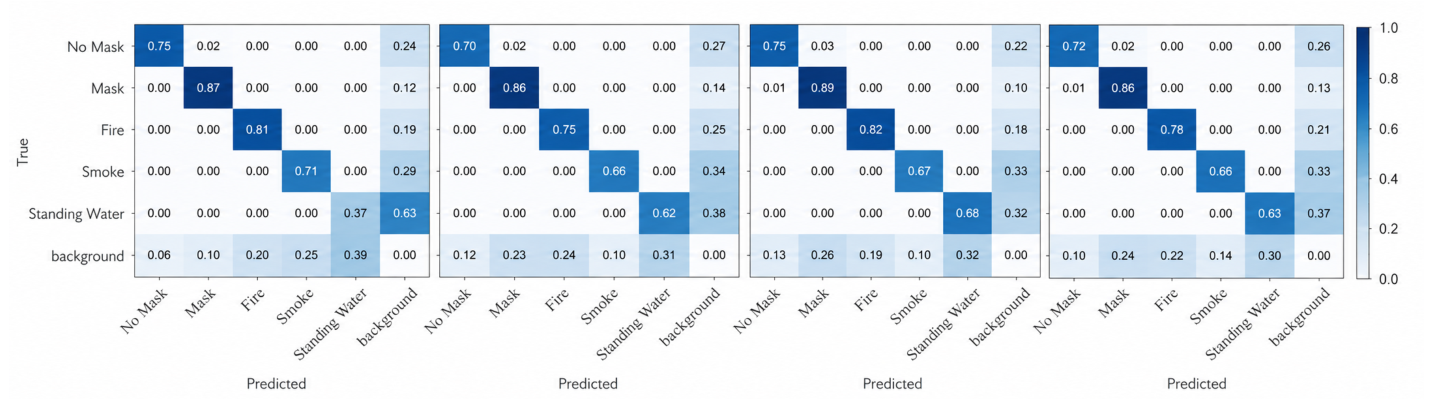
Figure 5 and Figure 6 show the normalized confusion matrices of all compared models. In the secondary clarifier subset, Faster R-CNN achieves the highest Recall for sludge flotation, but it has the lowest Precision, indicating more false positives. YOLOv12 shows a lower missed detection rate for sludge flotation than YOLOv8 and YOLOv11, and achieves the highest mAP@0.5 and mAP@0.5:0.95. This indicates better overall detection performance. In the confined space subset, Faster R-CNN shows relatively weak performance for Standing Water, indicating more missed detections in this category. In comparison, the YOLO-series models provide more balanced class-wise detection performance. No Mask, Mask, and Fire achieve relatively high correct detection ratios, while Smoke and Standing Water remain challenging due to weak textures, blurred boundaries, reflections, and illumination changes. Overall, YOLOv12 achieves the highest mAP and shows good comprehensive detection performance.

4.4. Evaluation of YOLOv12 Under Different Image Sources

To investigate the influence of image sources, the test sets are divided into robot-collected images, fixed-camera images, and public web images. Each image source covers all hazard categories defined in the corresponding test subset. Table 4 reports the performance of YOLOv12 across different source domains.
YOLOv12 maintains good performance on robot-collected inspection images. In the secondary clarifier subset, robot-collected images achieve a recall of 0.930 and an mAP@0.5 of 0.919, demonstrating the effectiveness of robot-based visual inspection for sludge flotation detection. The performance across different image sources is relatively consistent in the secondary clarifier subset. In contrast, the confined space subset shows larger variations among different source domains. Robot-collected and fixed-camera images achieve comparable performance, while public web images obtain higher precision but lower recall and mAP values, indicating more missed detections. Overall, YOLOv12 demonstrates promising applicability for robot-based inspection scenarios.

4.5. Grouped Stratified Split Evaluation

To further evaluate the generalization capability of the models, a grouped stratified split is conducted with a training/validation/test ratio of 8:1:1. Images from the same video segment are assigned to the same subset to reduce the risk of frame-level data leakage, while maintaining consistent distributions of hazard categories and image sources across the three subsets. All comparison models are retrained under this split. The validation set is used for model selection, and the test set is reserved for final evaluation. The results are presented in Table 5.
In the secondary clarifier subset, YOLOv12 achieves the highest mAP@0.5 and mAP@0.5:0.95 values. Similarly, YOLOv12 obtains the highest mAP@0.5 and mAP@0.5:0.95 values in the confined space subset. Although YOLOv11 achieves higher Precision, Recall or F1-score in some cases, YOLOv12 provides better AP-based performance under this split. Overall, these results indicate that YOLOv12 maintains stable detection performance under different dataset partition strategies.

4.6. Qualitative Results

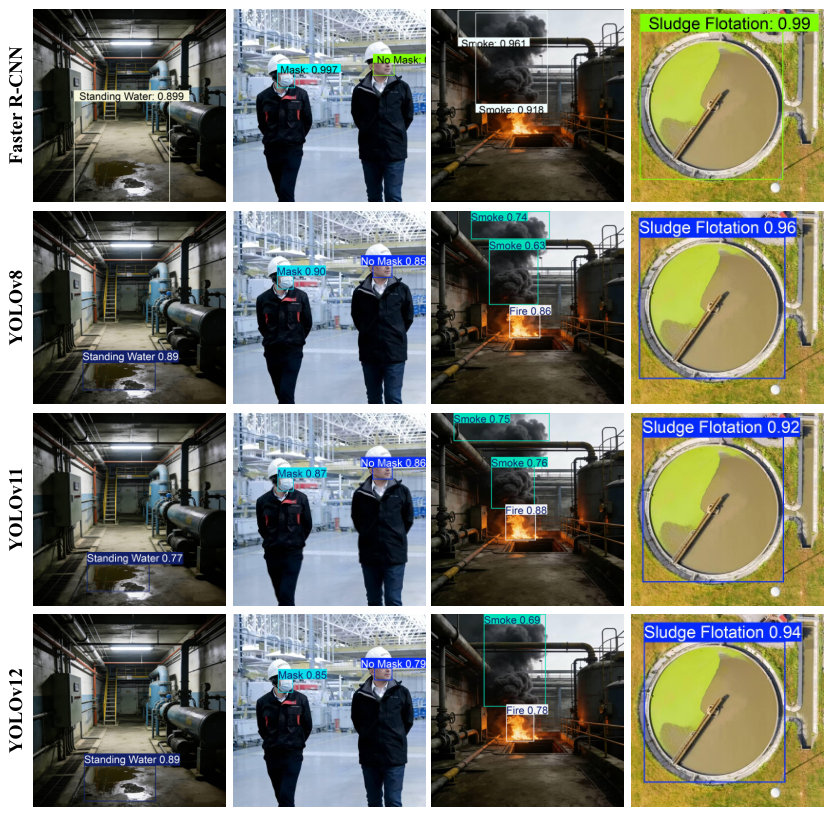
Figure 7 presents the qualitative results of different models on the hazard detection dataset. YOLOv8 and YOLOv11 show inaccurate localization of standing water. Faster R-CNN misses fire and produces localization errors in scenes containing both smoke and fire. In comparison, YOLOv12 provides more accurate object localization. Combined with the quantitative results, these findings indicate that YOLOv12 is the most suitable among the compared models for robot-based hazard detection in WWTPs.
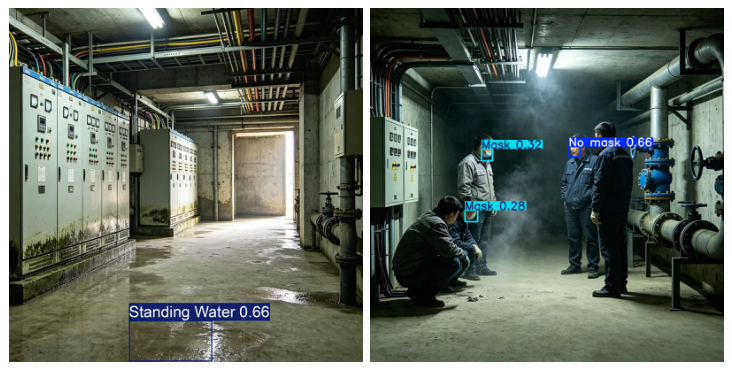
Despite its strong detection performance, YOLOv12 remains uncertain in some complex scenes. As shown in Figure 8, the predicted bounding boxes cover only part of the standing-water regions. Variations in texture and brightness may cause the model to focus only on locally salient regions. Faint smoke is also easily missed because of its weak texture and blurred boundaries. Detection of personal protection status is affected by small object size, pose variation, and occlusion. These factors reduce the visible facial cues and increase the risk of missed detections. These cases indicate that weak visual features, occlusion, and environmental variations remain major challenges for robot-based hazard detection in WWTPs.

4.7. Complexity Analysis

To evaluate the computational complexity and inference efficiency of different models, the parameter counts, GFLOPs, and average inference time per image are compared, as shown in Table 6. Faster R-CNN has substantially more parameters and higher computational complexity than the YOLO-series models. YOLOv12 has relatively low parameter and computational costs while maintaining strong detection performance. On the RTX 2080 Ti platform, the average inference times of YOLOv12 on the two subsets are 12.99 ms and 17.56 ms per image, respectively. Although these values are slightly higher than those of YOLOv8, YOLOv12 still maintains low inference latency. Considering both overall detection performance and computational cost, YOLOv12 provides a good balance between accuracy and efficiency and is therefore selected for subsequent deployment experiments. On the Ascend 910B2 platform, its inference times are further reduced to 9.21 ms and 12.45 ms, respectively.

5. Discussion

This paper demonstrates that inspection robots combined with object detection can support hazard detection in wastewater treatment plants. Compared with fixed cameras, mobile robots can collect images from different locations and viewpoints, thereby extending inspection coverage. YOLOv12 achieves a good balance between detection performance and inference efficiency, showing its potential for robot-based visual inspection. However, smoke and standing water remain challenging because of illumination changes, weak visual features, and background interference.
This study mainly relies on RGB images and does not fully integrate data from LiDAR, IMU, and other environmental sensors carried by the inspection robot. In practical applications, illumination changes, motion blur, occlusion, camera contamination, environmental variations, and data distribution shifts may affect model performance. Although multisource data collection and data augmentation improve model adaptability under different acquisition conditions, systematic validation during long-term field operation has not yet been conducted. Future work will investigate multimodal perception, continual learning, and online model updates to improve the adaptability of intelligent inspection systems in complex industrial environments.

Author Contributions

Writing—original draft preparation, H.L.; data curation, W.Z., Z.Z., W.K., G.N. and B.L.; software, H.L., W.Z., H.F. and B.L.; writing—review and editing, Z.J.; supervision, Z.J. All authors have read and agreed to the published version of the manuscript.

Funding

This research is funded by the Joint Funds of the National Natural Science Foundation of China, grant number U2568218, and the National Natural Science Foundation of China, grant number 52175493.

Data Availability Statement

The data presented in this study are available from the first author upon reasonable request. The data are not publicly available due to privacy restrictions.

Conflicts of Interest

The authors declare no conflicts of interest.

References

  1. Qu, J.; Wang, H.; Wang, K.; Yu, G.; Ke, B.; Yu, H.Q.; Ren, H.; Zheng, X.; Li, J.; Li, W.W.; et al. Municipal wastewater treatment in China: Development history and future perspectives. Front. Environ. Sci. Eng. 2019, 13, 88. [Google Scholar] [CrossRef] [Scilit]
  2. Chen, Q.; Fan, J.; Chen, W.; Zhang, A.; Pan, G. A dimensionality-reducible operational optimal control for wastewater treatment process. IEEE Trans. Neural Netw. Learn. Syst. 2022, 34, 5418–5426. [Google Scholar] [CrossRef] [Scilit]
  3. Chen, A.; Wu, M. Causal mechanisms of 100 accidents in sewage system facilities. Water Pract. Technol. 2025, 20, 1–14. [Google Scholar] [CrossRef] [Scilit]
  4. Sancho Martínez, J.; Fernández, Y.B.; Leinster, P.; Casado, M.R. Combining unmanned aircraft systems and image processing for wastewater treatment plant asset inspection. Remote Sens. 2020, 12, 1461. [Google Scholar] [CrossRef] [Scilit]
  5. Kumar, P.; Chang, T.H.; Zhong, Z.G.; Yao, C.K.; Chang, C.Y.; Chen, C.S.; Su, C.Y.; Peng, P.C. Enhanced Activity Detection in Mechanical Robot Dog Using Dynamic Strain-Based FBG Sensors and YOLO-v7. IEEE Sens. J. 2025, 25, 31572–31582. [Google Scholar] [CrossRef] [Scilit]
  6. Yang, S.; Behzadian, K.; Coleman, C.; Holloway, T.G.; Campos, L.C. Application of AI-based techniques for anomaly management in wastewater treatment plants: A review. J. Environ. Manag. 2025, 392, 126886. [Google Scholar] [CrossRef] [Scilit]
  7. Chang, P.; Meng, F.C. Fault detection of urban wastewater treatment process based on combination of deep information and transformer network. IEEE Trans. Neural Netw. Learn. Syst. 2022, 35, 8124–8133. [Google Scholar] [CrossRef] [Scilit]
  8. Peng, S.; Guo, Y.; Wang, J.; Wang, Y.; Zhang, W.; Zhou, X.; Jiang, L.; Lai, B. The coagulation-precipitation turbidity prediction model for precision drug delivery system based on deep learning and machine vision. J. Environ. Chem. Eng. 2024, 12, 112211. [Google Scholar] [CrossRef] [Scilit]
  9. Borzooei, S.; Scabini, L.; Miranda, G.; Daneshgar, S.; Deblieck, L.; Bruno, O.; De Langhe, P.; De Baets, B.; Nopens, I.; Torfs, E. Evaluation of activated sludge settling characteristics from microscopy images with deep convolutional neural networks and transfer learning. J. Water Process Eng. 2024, 64, 105692. [Google Scholar] [CrossRef] [Scilit]
  10. Offir, I.; Moni, S.; Jacob, G.; Ido, C.; Ofir, M.; Dror, A. Analyzing the secondary wastewater-treatment process using Faster R-CNN and YOLOv5 object detection algorithms. J. Clean. Prod. 2023, 416, 137913. [Google Scholar] [CrossRef] [Scilit]
  11. Chang, P.; Wang, K.; Zheng, K.; Meng, F.C. Monitoring of wastewater treatment process based on multi-stage variational autoencoder. Expert Syst. Appl. 2022, 207, 117919. [Google Scholar] [CrossRef] [Scilit]
  12. Ha, B.; Schalter, B.; White, L.; Köhler, J. Automatic defect detection in sewer network using deep learning based object detector. arXiv 2024, arXiv:2404.06219. [Google Scholar]
  13. Jia, Z.; Liu, H.; Zheng, H.; Fan, S.; Liu, Z. An intelligent inspection robot for underground cable trenches based on adaptive 2d-slam. Machines 2022, 10, 1011. [Google Scholar] [CrossRef] [Scilit]
  14. Fischer, G.K.; Bergau, M.; Gómez-Rosal, D.A.; Wachaja, A.; Graeter, J.; Odenweller, M.; Piechottka, U.; Höflinger, F.; Gosala, N.; Wetzel, N.; et al. Evaluation of a smart mobile robotic system for industrial plant inspection and supervision. IEEE Sens. J. 2024, 24, 19684–19697. [Google Scholar] [CrossRef] [Scilit]
  15. Gómez-Rosal, D.A.; Bergau, M.; Fischer, G.K.; Wachaja, A.; Grater, J.; Odenweller, M.; Piechottka, U.; Hoeflinger, F.; Gosala, N.; Wetzel, N.; et al. A smart robotic system for industrial plant supervision. In Proceedings of the 2023 IEEE SENSORS; IEEE: Piscataway, NJ, USA, 2023; pp. 1–4. [Google Scholar]
  16. Shen, W.; Zhang, J.; Jin, W.; Song, A. An RGBD fused real time defect detection and size estimation method for sewer robots. Measurement 2025, 259, 119694. [Google Scholar] [CrossRef] [Scilit]
  17. Girshick, R.; Donahue, J.; Darrell, T.; Malik, J. Rich feature hierarchies for accurate object detection and semantic segmentation. In Proceedings of the IEEE Conference on Computer Vision and Pattern Recognition, Columbus, OH, USA, 23–28 June 2014; pp. 580–587. [Google Scholar]
  18. Girshick, R. Fast r-cnn. In Proceedings of the IEEE International Conference on Computer Vision, Santiago, Chile, 7–16 December 2015; pp. 1440–1448. [Google Scholar]
  19. Ren, S.; He, K.; Girshick, R.; Sun, J. Faster r-cnn: Towards real-time object detection with region proposal networks. Adv. Neural Inf. Process. Syst. 2015, 28, 91–99. [Google Scholar]
  20. Lin, T.Y.; Goyal, P.; Girshick, R.; He, K.; Dollár, P. Focal loss for dense object detection. In Proceedings of the IEEE International Conference on Computer Vision, Venice, Italy, 22–29 October 2017; pp. 2980–2988. [Google Scholar]
  21. Redmon, J.; Divvala, S.; Girshick, R.; Farhadi, A. You only look once: Unified, real-time object detection. In Proceedings of the IEEE Conference on Computer Vision and Pattern Recognition, Las Vegas, NV, USA, 27–30 June 2016; pp. 779–788. [Google Scholar]
  22. Tian, Y.; Ye, Q.; Doermann, D. Yolov12: Attention-centric real-time object detectors. Adv. Neural Inf. Process. Syst. 2026, 38, 78433–78457. [Google Scholar]
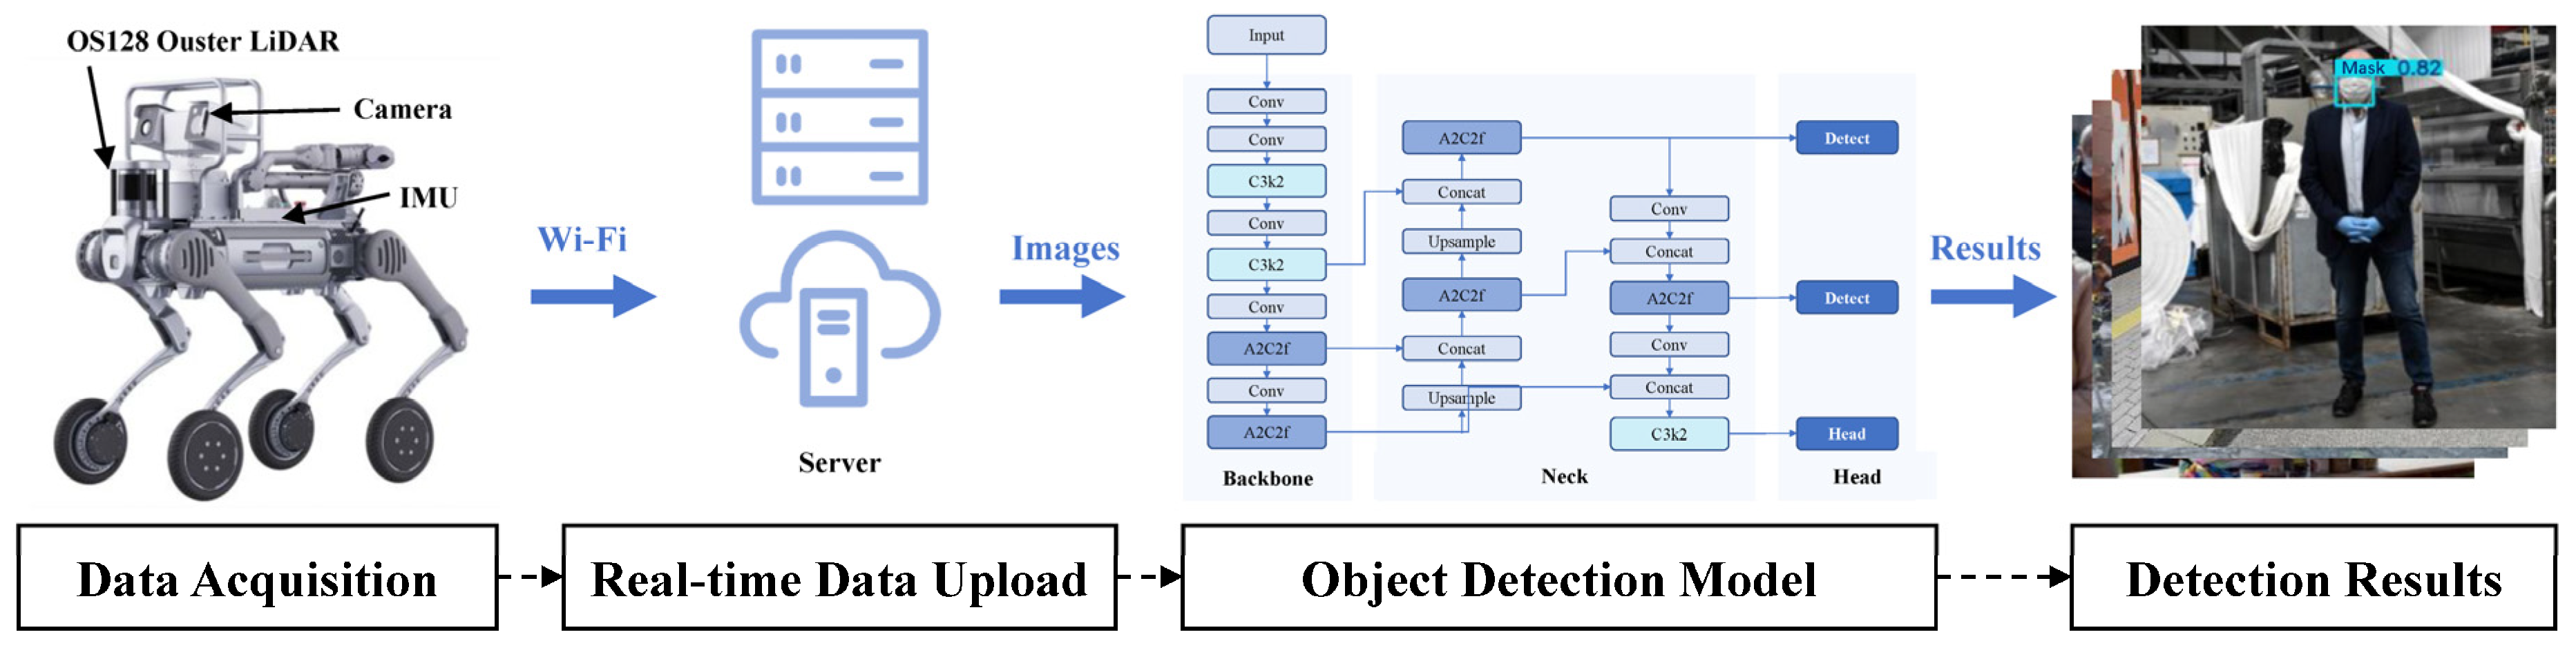
Figure 1. Workflow of robot-based hazard detection using object detection.
Electronics 15 03801 g001
Figure 2. Construction process of the hazard detection dataset.
Electronics 15 03801 g002
Figure 3. Representative samples of different hazard categories.
Electronics 15 03801 g003
Figure 4. Overall Precision–Recall curves of all compared models on the two test subsets at IoU = 0.5. (left) secondary clarifier subset; (right) confined space subset.
Electronics 15 03801 g004
Figure 5. Normalized confusion matrices on the secondary clarifier test set at IoU = 0.5. From left to right: Faster R-CNN, YOLOv8, YOLOv11, and YOLOv12.
Electronics 15 03801 g005
Figure 6. Normalized confusion matrices on the confined space test set at IoU = 0.5. From left to right: Faster R-CNN, YOLOv8, YOLOv11, and YOLOv12.
Electronics 15 03801 g006
Figure 7. Qualitative results on the hazard detection dataset. Bounding boxes indicate detected hazards, and label values indicate confidence scores.
Electronics 15 03801 g007
Figure 8. Challenging cases of YOLOv12 in hazard detection.
Electronics 15 03801 g008
Table 1. Key statistics of the hazard detection dataset.
SubsetCategory
(Class ID)
Class
Images
Annotated
Instances
Common
Resolutions
Common
Aspect Ratios
Total
Images
Train/Test
Secondary
Clarifier
Sludge Flotation (0)8061386 1920 × 1080 (33%)
3264 × 2448 (9.81%)
16:9 (38.88%)
4:3 (12.25%)
16001280/320
Confined SpaceNo Mask (0)
Mask (1)
Fire (2)
Smoke (3)
Standing Water (4)
347
845
887
929
1000
610
2327
1363
1207
2078
256 × 256
(17.6%)
1280 × 1280
(9.86%)
1:1 (30.46%)
4:3 (5.26%)
35002797/703
Table 2. Detection performance comparison on the secondary clarifier subset. Bold values indicate the best results.
CategoryMetricsFaster R-CNNYOLOv8YOLOv11YOLOv12
Sludge
Flotation
Precision0.7840.8690.9000.804
Recall0.9350.8080.8610.910
F1-score0.8530.8370.8800.854
mAP@0.50.9060.9130.9140.917
mAP@0.5:0.950.7540.7850.7880.802
Table 3. Detection performance comparison on the confined space subset. Bold values indicate the best results.
CategoryMetricsFaster R-CNNYOLOv8YOLOv11YOLOv12
No MaskPrecision0.6930.8090.7940.841
Recall0.7540.6980.7460.722
F1-score0.7220.7490.7690.777
mAP@0.50.6880.7410.7780.783
mAP@0.5:0.950.2710.2650.2830.371
MaskPrecision0.8570.9280.9190.929
Recall0.8750.8510.8760.854
F1-score0.8660.8880.8970.890
mAP@0.50.8590.9280.9270.940
mAP@0.5:0.950.3780.4280.4140.532
FirePrecision0.6090.8810.8880.877
Recall0.8080.7750.8080.778
F1-score0.6950.8250.8460.825
mAP@0.50.7570.8620.8680.843
mAP@0.5:0.950.3850.5790.5810.552
SmokePrecision0.4820.8950.8720.873
Recall0.7080.6330.6420.661
F1-score0.5740.7420.7400.752
mAP@0.50.6130.7840.7500.787
mAP@0.5:0.950.2930.5740.5710.585
Standing
Water
Precision0.3470.8710.8280.860
Recall0.3660.6170.6620.620
F1-score0.3560.7220.7360.721
mAP@0.50.3350.7560.7510.742
mAP@0.5:0.950.1620.4310.4340.465
AllPrecision0.6030.8770.8600.876
Recall0.6970.7150.7470.727
F1-score0.6470.7880.8000.795
mAP@0.50.6500.8140.8150.819
mAP@0.5:0.950.2980.4550.4570.501
Table 4. Source-domain performance of YOLOv12 on different test subsets.
DatasetSourceImagesPrecisionRecallF1-ScoremAP@0.5mAP@0.5:0.95
Secondary
Clarifier
Robot1410.8170.9300.8700.9190.781
Fixed-camera570.8020.9190.8570.9020.820
Public Web1220.8800.8540.8670.9330.826
Confined
Space
Robot2000.8800.7800.8270.8370.531
Fixed-camera2390.8510.7620.8040.8440.514
Public Web2640.8910.6850.7750.7820.474
Table 5. Detection performance comparison under an 8:1:1 train/validation/test split. Bold values indicate the best results.
DatasetMetricsFaster R-CNNYOLOv8YOLOv11YOLOv12
Secondary
Clarifier
Precision0.7620.7990.8910.799
Recall0.9020.8890.8730.856
F1-score0.8260.8420.8810.827
mAP@0.50.8800.8770.8650.883
mAP@0.5:0.950.6890.7590.7490.776
Confined
Space
Precision0.5890.8550.8540.828
Recall0.6960.6830.7390.709
F1-score0.6380.7600.7920.764
mAP@0.50.6660.7840.7230.801
mAP@0.5:0.950.3080.4500.4420.457
Table 6. Computational complexity and inference time of different models. Bold values indicate the best results.
SubsetModelParams (M)GFLOPsRTX 2080 Ti
Inference Time (ms)
Ascend 910B2
Inference Time (ms)
Secondary
Clarifier
Faster R-CNN41.30133.9242.06
YOLOv83.018.1910.61
YOLOv112.596.4513.38
YOLOv122.556.4412.999.21
Confined
Space
Faster R-CNN41.32133.9442.65
YOLOv83.018.2017.12
YOLOv112.596.4518.63
YOLOv122.556.4417.5612.45
Disclaimer/Publisher’s Note: The statements, opinions and data contained in all publications are solely those of the individual author(s) and contributor(s) and not of MDPI and/or the editor(s). MDPI and/or the editor(s) disclaim responsibility for any injury to people or property resulting from any ideas, methods, instructions or products referred to in the content.