Article

Optimization of Nanofillers Distribution to Inhibit Electrical Tree Growth in Composites
1
Hubei Technology Innovation Center for Smart Hydropower, Wuhan 430000, China
2
Shandong Engineering Research Center of Power Electronic Technology in Power Systems, China University of Petroleum (East China), Qingdao 266580, China
*
Author to whom correspondence should be addressed.
Electronics 2026, 15(16), 3674; https://doi.org/10.3390/electronics15163674
Submission received: 15 July 2026 / Revised: 13 August 2026 / Accepted: 13 August 2026 / Published: 17 August 2026
(This article belongs to the Section Electronic Materials, Devices and Applications)

Abstract

Inorganic nanofillers have been incorporated to enhance the electrical treeing resistance of polymers. However, the influence of nanofiller shape and distribution remains not fully understood, thereby limiting the advancement of new insulation design strategies. This work presents a phase-field model to simulate the propagation of electrical tree in nanocomposites and quantitatively compare the effectiveness of different filling schemes. The damage status of insulation is described with a spatially and time dependent continuous variable, and the evolution of damage phase is modeled with the kinetic equation. The results indicate that nanofillers act as physical barriers to electrical-tree growth. Due to the competition between the hindrance effect and electric-field enhancement of nanofillers, the nanocomposite containing 8 vol% Al2O3 nanoparticles exhibits the optimal electrical-treeing resistance, with the breakdown time increasing from 767.5 s for neat PE to 827.1 s, corresponding to an improvement of 7.77%. The electrical-tree resistance is closely related to the shape and orientation of the nanofillers. Compared with neat PE, randomly distributed and parallel nanosheets increase the breakdown time by 12.04% and 27.00%, respectively, and exhibit stronger inhibition of electrical-tree growth than nanoparticles and nanofibers. High-throughput computations are further performed to analyze the effects of nanofiller shape and orientation on electrical-tree characteristics. When the electrical-tree propagation direction is perpendicular to the nanosheets, increasing the aspect ratio from 2 to 12 raises the normalized breakdown time from 1.07 to 1.36.

1. Introduction

Polymer-based dielectrics have drawn wide application in electrical and electronic equipment such as power transmission cables, supercapacitors and soft robots [1,2]. However, polymers are prone to degradation under long-term stress effects such as electrical, thermal and mechanical, in which electrical treeing is the main cause of insulation failure [3,4,5,6]. Especially, numerous accidents in power cables have been found to be caused by electrical tree. Electrical tree is the damaged area in insulation materials which generally initiate from locations of high divergent electrical stress, and is primitively caused by the injection of charges. Then, dendritic paths progressively grow from high stress regions under the long-term effect of partial discharge (PD), and the development of electrical trees finally leads to the irreversible insulation failure. As a result, electrical treeing resistance is another important electrical property except the breakdown field, and exploring polymer-based composites with superior electrical treeing resistance is crucial for extending the lifetime of power equipment.
One common approach is to add inorganic nanofillers with crystal structure into a polymer matrix, and different kinds of fillers including SiO2, Al2O3, MgO and layered silicate [7,8,9]. Both the initiation and breakdown times of composites are found to be prolonged by filling nanofillers [10,11,12]. Moreover, the tree shapes are changed due to the barrier effect of nanofillers. Tree growth patterns of neat polymer are generally of branch type, whereas the tree shapes of nanocomposites resemble the bush-branch or bush type pattern and more branches are produced [13,14,15,16]. The improvement in electrical treeing resistance for nanocomposites can be attribute to the physical barrier effect and deep charge traps introduced by the nanofillers. Recent experiments combining electrical-tree observations with spectroscopic and microscopic characterization and partial-discharge analysis have further clarified the barrier and discharge-suppression effects of nanofillers in epoxy nanocomposites [17,18]. Quantitative studies on printed-circuit-board and gel-substrate insulation systems have also shown that discharge activity, voltage frequency, and interface structure strongly influence tree initiation, morphology, and propagation [19,20]. In recent years, some promising fillers and doping schemes such as one-dimensional nanowire [21,22], two-dimensional nanosheet [23], hybrid fillers [24] and multilayer structures [25] have been developed. And the fabricated nanocomposites present improved dielectric performances including high breakdown field, high energy density and high thermal conductivity. But these novel nanofillers are rarely employed to improve the electrical treeing resistance of polymers. And the effects of nanofillers distribution such as fillers size, shape and volume fraction on electrical tree growth are not fully understood yet, which limits the development of new insulation designs [26].
As a supplementary method to experiments, numerical simulation methods such as the fractal model [27,28], stochastic model [29] and deterministic model [30,31] have been developed to characterize the electrical tree growth process. However, these models are difficult to be applied to nanocomposites due to the inhomogeneous material properties such as permittivity and PD resistance. Moreover, insulation degradation develops progressively under the accumulated effects of numerous PDs, which is different from existing simulations in which the insulation status in each position is suddenly changed. Recently, to design polymers with high energy density, the phase field model was introduced to simulate the breakdown path of nanocomposites of polyvinylidene fluoride and BaTiO3, in which the breakdown situation is described with a continuous phase-field variable in the range of 0~1 [32,33]. Recent phase-field models have extended electrical-tree simulation to composition- and stress-dependent propagation in PP/POE blends and temperature-dependent degradation in XLPE [34,35]. Other recent formulations introduce electric- and stress-field driving energy or combine regularized phase-field damage with charge transport and stochastic breakdown strength to reproduce voltage-dependent morphology, branching, and conductive-channel evolution [36,37]. These advances improve the description of specific material systems and coupled degradation mechanisms; however, systematic microstructure-resolved comparisons of nanofiller content, shape, orientation, and composite architecture remain limited.
In this work, a microstructure-resolved phase-field/electrostatic framework is developed to simulate electrical-tree growth in neat polymers and nanocomposites. The polymer matrix, nanofillers, and evolving tree channels are represented on a fixed grid through spatially dependent material parameters, while electric-field redistribution is updated using a spectral iterative perturbation method. The framework is used to quantify the effects of filler content, shape, and orientation and to support high-throughput microstructure screening.

2. Simulation Models

2.1. Phase-Field Model for Electrical Tree Growth

The damage status of material is represented with a continuous order variable η (r, t), which is both spatially and temporally dependent, where t is time and r is the spatial position [38,39]. The η (r, t) varies from intact status, η (r, t) = 0, to the damaged status, η (r, t) = 1. Partial discharge (PD), oxidation, and chemical decomposition in the channel cause corrosion and carbonization along the wall of electrical trees, resulting in semiconducting characteristics of the damaged channels. In the present quasi-electrostatic phase-field model, the high effective permittivity assigned to the damaged phase is used as a simplified representation of the electric-field redistribution associated with electrical-tree channels, rather than as a direct description of semiconductor conduction. Accordingly, the relative permittivity of the damaged phase εB is set as a high value of 105. The permittivity of the composite during the microstructure evolution is dependent on η (r, t), and is interpolated by
ε r r = 4 η r 3 3 η r 4 ε B + 1 4 η r 3 3 η r 4 ε C r
where, εc(r) is the spatially dependent permittivity of intact nanocomposite which is determined by the properties of nanofiller and matrix.
The electrical tree growth is driven by free energy in the system.
F = Ω f sep η r + 1 2 c γ η r 2 + f ele η r d V
where, f sep η r = 16 α η 2 1 η 2 is the free energy density that drives the phase separation with α defining the energy barrier between intact and damage status. The second term is the gradient energy density in which γ is the gradient energy coefficient and c is a coefficient to adjust the growing speed. f ele η r = 1 / 2 ε r E r E r is the electrostatic energy density, where ε(r) is the spatially and temporally dependent dielectric permittivity. The local electric field E(r) can be obtained by solving the Possion equation with spectral iterative perturbation method [40]. The iterative form of depolarization potential φ r is described as follows.
ε ref j = 1 D 2 φ i + 1 r x j 2 = j = 1 D x j Δ ε r E j ext φ i r x j ρ r ε 0
where, εref is a homogeneous reference of the relative dielectric permittivity, and ∆ε = εr(r) − εref is the inhomogeneous perturbation. D is the dimension of space, and xj is jth component of the position vector. φi(r) is the depolarization potential in ith iteration, and ρ(r) is the charge density. E j ext is external electrical field in the direction of xj axis. The φ(r) can be obtained by solving Equation (3) iteratively in Fourier space, and the calculation is continued until a quasi-stationary solution is achieved with a relative error below 5 × 10⁻⁴. Here, the relative error is defined as the ratio of the maximum change in electric potential between two successive iterations to the maximum absolute value of the electric potential in the current iteration. The threshold of 5 × 10⁻⁴ is selected to balance the numerical accuracy and computational efficiency. After that, the electric field can be calculated as
E j r = E j ext φ r x j
The evolution of damage phase is described with a modified Allen-Cahn equation,
η r , t t = L 0 H f ele f th f sep η η r , t c γ 2 η r , t + f ele η η r , t
where, L0 is kinetic coefficient which represents the speed of damage evolution, H(felefth) is the Heaviside unit step function, fth is inception energy density to cause insulation damage. The driving forces from the phase separation and electrostatic energy can be derived as follows.
f sep η η r , t = 3 2 α η 1 η 1 2 η
f ele η η r , t = 6 η 2 η 3 ε B ε C ε 0 E r E r
A Fourier-space based method can be used to solve the Allen-Cahn equation [32]. Since the η(r, t) is rapidly varying for different positions, the gradient energy term is solved with an isotropic form of the Laplacian operator, which can be found in [41]. The evolution speed is related to coefficient c which is usually given a value of 1. In this work, the coefficient c is assigned as (8) to ensure a relatively stable propagation speed in the simulation domain usually within micrometer range.
c t = 2.71 log 1 + 4 L t / Δ x 2
where, Lt is the length of electrical tree and Δx is the grid size.
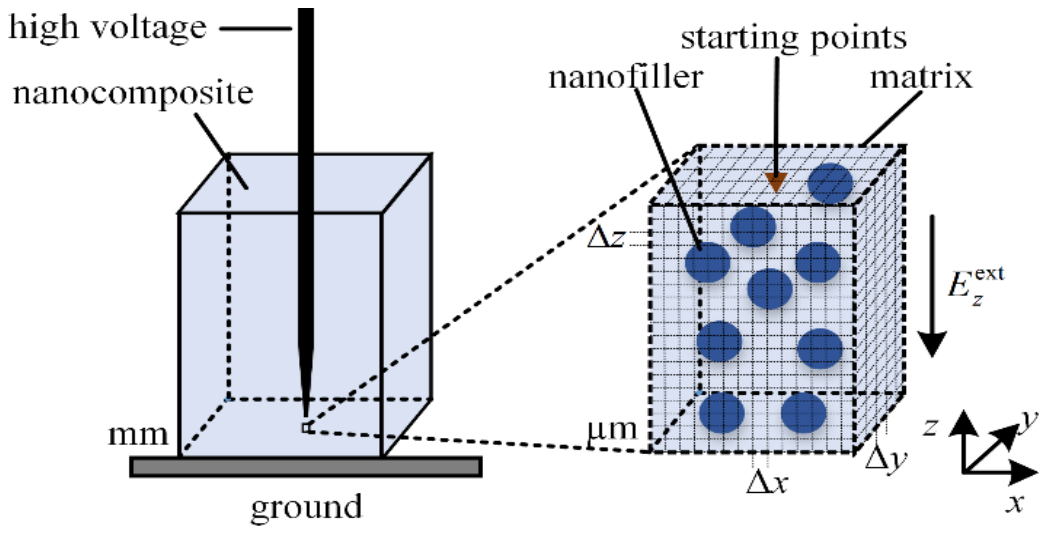
Nanocomposite specimens with several millimeters are generally used in the electrical treeing experiments. But the size of nanofillers and specimens differ greatly in size, which is difficult to be subdivided with uniform mesh grid in the numerical simulation. As a result, a subregion with size of several micrometers in the realistic specimen is used in the simulation as shown in Figure 1.
A mesh grid of NxΔx × NyΔyNzΔz with grid size of Δx = Δy = Δz = 20 nm and Nx = 128, Ny = 128, Nz = 256 is employed in the simulations. A time step Δt = 0.5 s is used to numerically solve (5). In phase-field simulations, a small value of γ can lead to an explosion in computational complexity, while a large value can result in the loss of interface meaning. Moreover, a small value of L0 increases the computational burden, while a large value reduces the simulation accuracy. To reproduce the shape of the electric trees in acceptable simulation time, the gradient energy coefficient γ is set as 10−10 J/m, and L0 is set as 10−9. A parameter sensitivity analysis was further performed for γ, L0, and Δt by decreasing each parameter while keeping the other simulation conditions unchanged. Lower values produced a more finely resolved electrical tree with more evident branch-type characteristics; however, the computational time was significantly increased. The adopted values (γ = 10−10 J/m, L0 = 10−9, and Δt = 0.5 s) already generate a branched morphology similar to experimentally observed electrical trees and capture the principal effects of nanofillers, including physical blocking and bypassing of the tree path and local electric-field distortion. Because the main objective of this work is to compare the relative effects of nanofiller shape and spatial distribution rather than reproduce the exact stochastic position of every individual branch, these parameters provide sufficient morphological fidelity and physical representativeness for the intended analysis while substantially improving simulation efficiency. They were therefore used in the subsequent simulations.
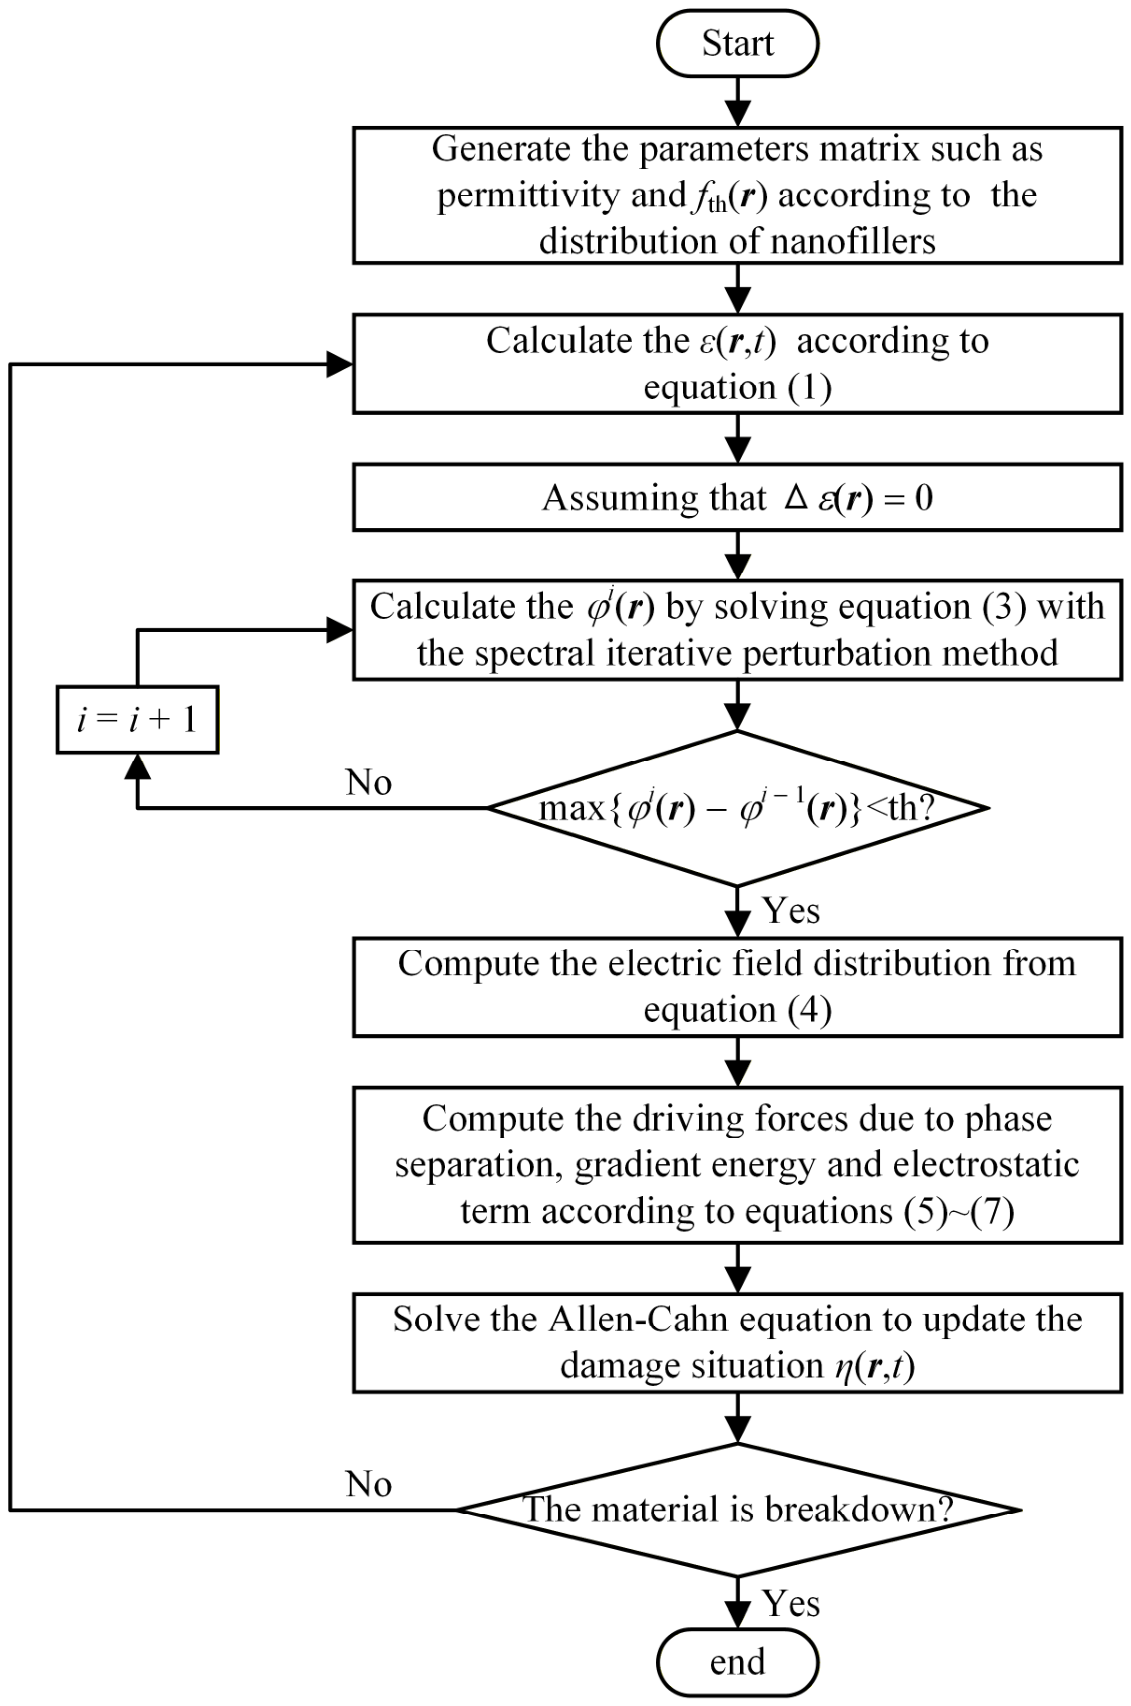
The different material properties of matrix, nanofillers even interfacial regions are characterized by ε(r, t), fth(r) and α(r). ε(r, t) determines the electric field distribution in the dielectrics. fth(r) and α(r) represent the inception energy and energy barrier for tree growth, respectively. Polyethylene (PE) has drawn wide application in power ca-ble, and is chosen as the matrix here whose relative permittivity is set as 2.2. Al2O3 is chosen as the nanofiller with permittivity of 9.3. fth is usually calculated by an equation similar to the electrostatic energy density, namely [32,33], where Eb is the breakdown strength. The AC breakdown strength of polyethylene is in the range of 70 kV/mm–200 kV/mm [42,43,44]. Here, a breakdown strength of 100 kV/mm is used, which gives rise to an inception energy density about 105 J/m3. As a result, 105 J/m3 is used for fth. The energy barrier parameter α(r) is determined by comparing the simulated characteristics of electrical trees with experimental results. Specifically, simulations of electrical tree morphologies under different energy barriers are conducted, and we find that a value of 5 × 10⁶ J/m3 gives rise to electrical tree morphologies similar to experimental observations [5,45]. The validation strategy adopted in this work is qualitative and trend based. Firstly, the matrix parameters are selected to reproduce the main experimentally observed characteristics of electrical trees in PE/XLPE, including branch-type morphology, progressive propagation from the tree tip, and electric-field concentration near the advancing front. Secondly, the predicted bypassing of electrical trees around nanofillers, increased branching in nanocomposites, and dependence on filler morphology and orientation are compared with previously reported experimental trends. It was well recognized that nanofillers physically obstruct the development of electrical trees, causing them to bypass the nanofillers [46,47,48]. Therefore, in this study, the inception energy density and energy barrier of nanofillers are set to values significantly higher than those of the polyethylene to simulate the effective blocking effect of nanofillers on electrical trees. As a result, the fth(r) and α(r) of nanofiller are set as 107 J/m3 and 5 × 10⁸ J/m3, respectively. An external electric field in the direction of z axis of 80 kV/mm is applied to the nanocomposite, and the η of several starting points at the middle of top surface is set as 1 to initiate the electrical tree. The flowchart for phase field model of electrical tree growth is summarized in Figure 2.
All simulations were implemented using an in-house MATLAB R2024a program and performed on a computer equipped with a 13th-generation Intel Core i7-1360P processor (12 cores and 16 threads) and 32 GB of memory. For the representative three-dimensional calculation with 128 × 128 × 256 grid points, a grid spacing of 20 nm, and a time step of 0.5 s, the physical domain was 2.56 × 2.56 × 5.12 micrometres and the wall-clock time was approximately 5090 s. Because the computational cost increases rapidly with the size of the uniform three-dimensional grid and the repeated electric-field solution, the present framework is intended for microscale mechanism analysis and relative comparison of nanofiller configurations rather than direct millimetre-scale simulation of practical insulation structures. Extension to component-scale applications will require parallel or GPU-accelerated field solvers, adaptive or multiresolution discretization, or multiscale coupling.

2.2. Characterization of Electrical Tree

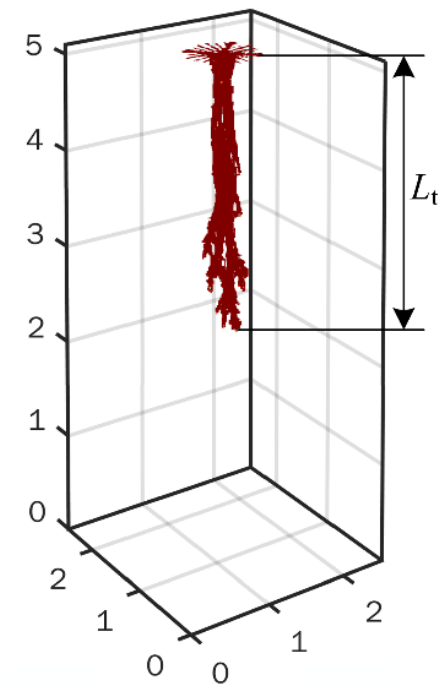
Quantifying tree-type structures is helpful for analyzing the effects of nanofillers. Here, two parameters including tree length and fractal dimension are employed to characterize the electrical growth process. Tree length (Lt) is a common parameter to characterize the shape of electrical tree. It is defined as the Euclidean distance between the tree tip and needle tip. A parameter, namely breakdown volume vb, is defined as the ratio of tree length and specimen length to evaluate the growth process of electrical tree, as shown in Figure 3. Another widely used parameter is fractal dimension Df which represents the tree shapes. Previous researches indicated that the higher the Df of the tree, the greater the deceleration of tree extension, and hence the longer the breakdown time [3]. The Df can be calculated with a box-counting method, in which the three-dimensional space is divided into cubes with edge length r, and the number of cubes required to cover the tree shape N(r) is counted. The N(r) for different values of r are counted sequentially, and then the negative value of Df can be estimated from the least squares linear fit of log(N(r)) via log(r).

3. Results and Discussion

In this section, the effects of nanofiller volume fraction, shape, and orientation on electrical-tree growth are investigated using the phase-field model. Considering the randomness of fillers distribution, the simulations are repeated five times for all cases.

3.1. Propagation of Electrical Tree in Neat PE

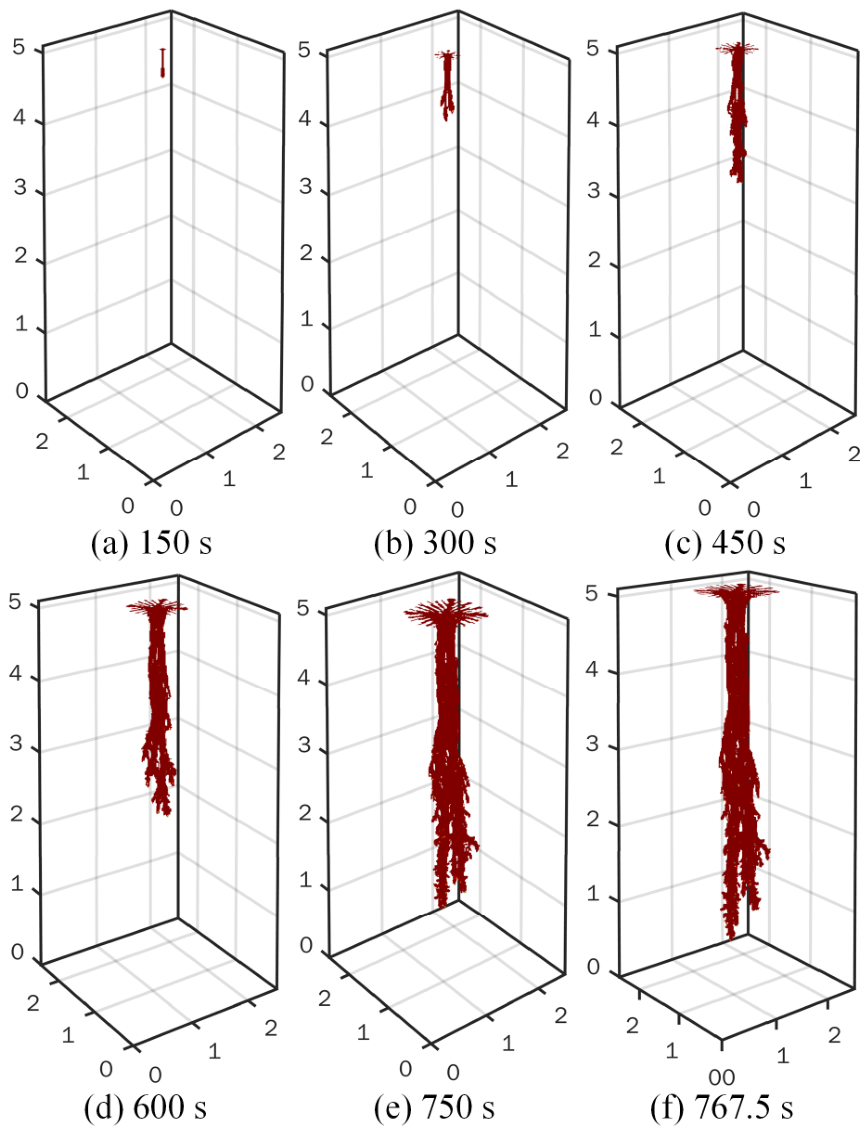
The propagation process of electrical tree in neat PE is firstly simulated, as shown in Figure 4. Since the maximum electric field concentrates on the tip of starting points, the electrical tree initiates from these positions. Some side branches are formed from 300 s, which is mainly caused by the gradient term in Equation (5). And the dendritic paths progressively grow from high stress regions, namely the tip of branches, and form the damaged path with tree shape.
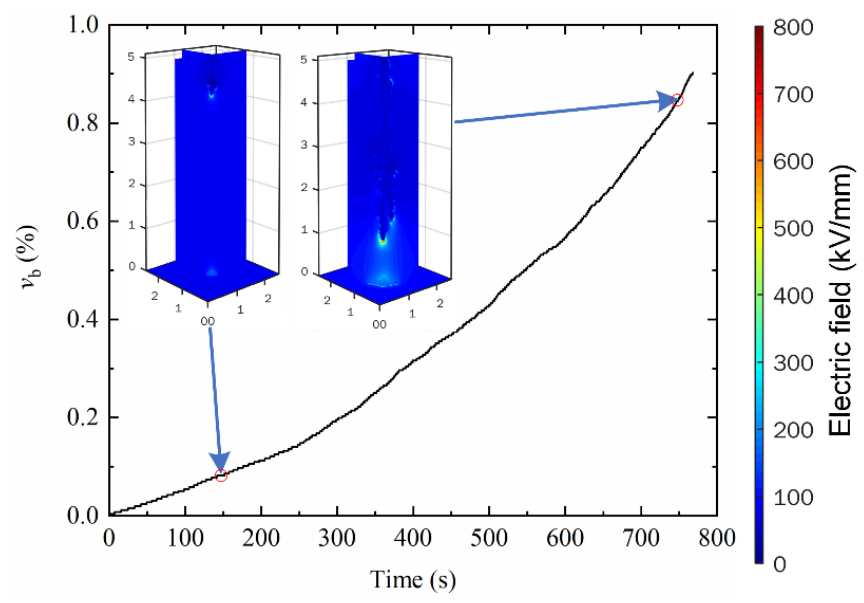
Figure 5 shows the evolution of breakdown volume at different time. As can be seen, the electrical tree grows slowly before 250 s and then develops faster until breakdown. The reason for that is the electric field continuously increases as the electrical tree approaching the bottom electrode, which speed up the growth process. The electric field distributions for 150 s and 750 s are shown in Figure 5. As can be seen, the maximum electric field concentrates on the tip of electrical tree, and the field strength at 750 s is much higher than that of 150 s, which verifies the above analysis.

3.2. Influence of Volume Fraction on Electrical Tree Growth

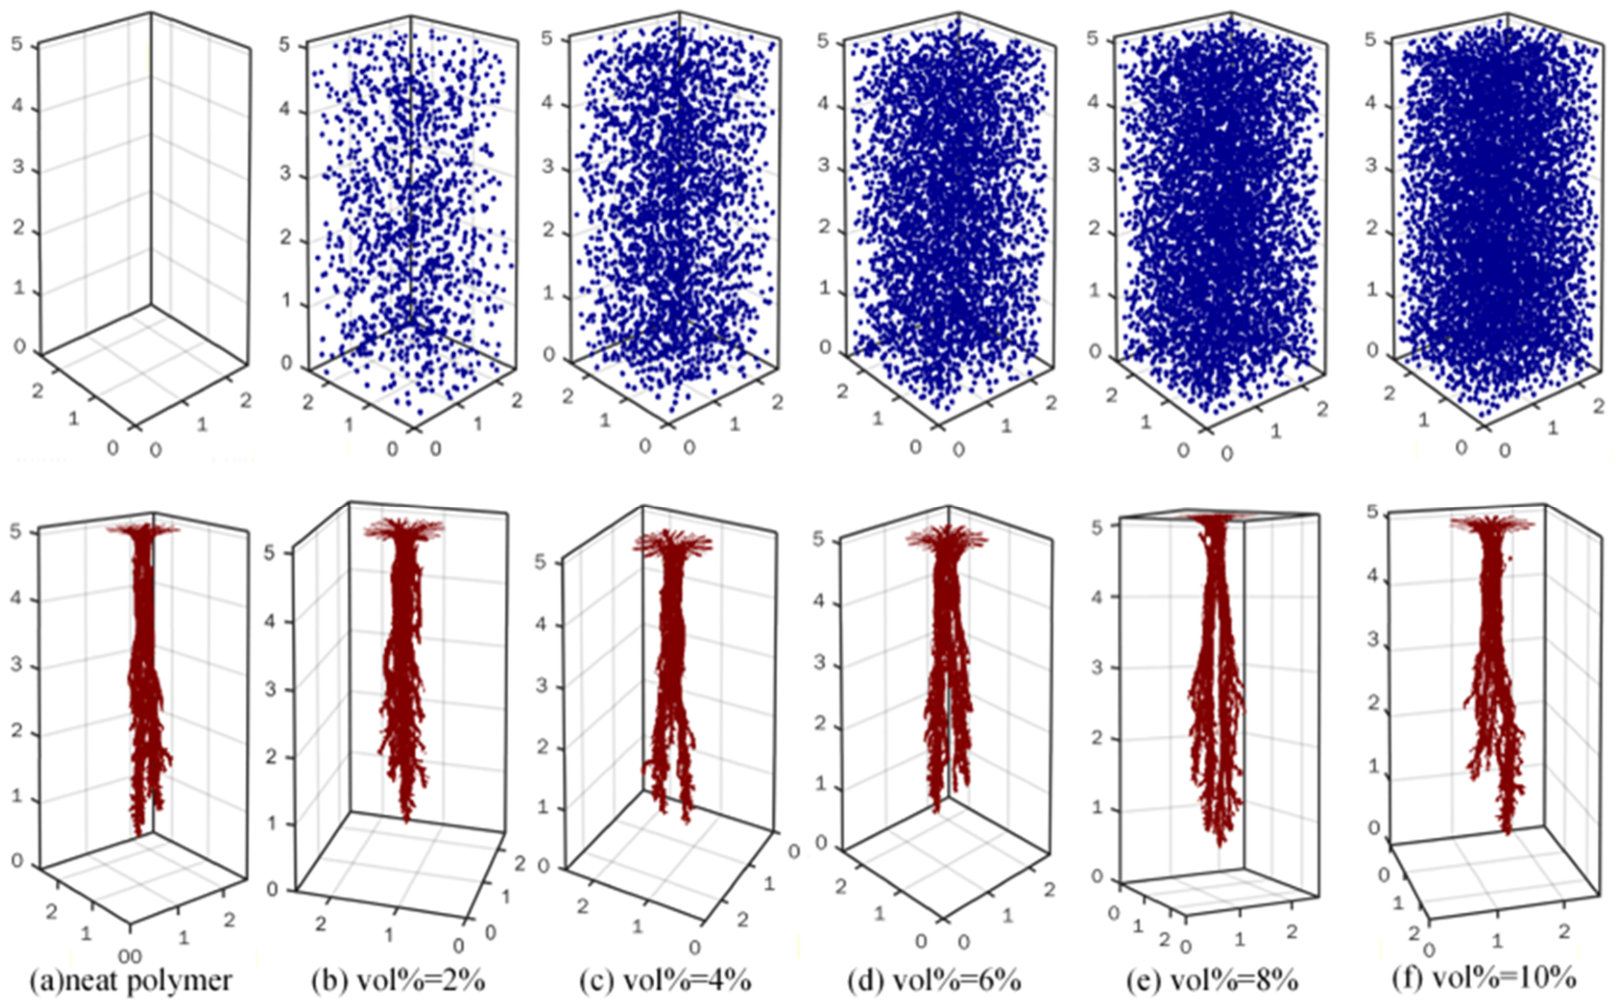
Figure 6 shows the electrical trees of PE/Al2O3 nanoparticle nanocomposites with volume fraction from 0%~10%. The radius of nanoparticles is 50 nm.
As can be seen, the tree shape of neat polymer is relatively straight and only two main branches are generated. For nanocomposite filled with 2 vol% nanoparticle, more thin and short side branches are produced. With the increase of the volume fraction, some of the side branches grow to a longer distance and more main branches are formed. This is consistent with experimental results that more branches are produced in nanocomposites which resemble the bush-branch or bush type pattern [13,14,15,16]. By observing the snapshots of electrical tree growth, we can find that the electrical tree bypasses the inorganic nanofillers, and new branches are easily formed when encountering nanofillers. That is, the nanofillers act as physical barriers in the propagation of electrical tree, which makes the electrical tree grow with a zigzag path and produces more branches [48,49,50,51]. The electrical tree structure has been observed with SEM in [48,49,50,51], and the results confirm that the nanofillers block the growth of electrical tree.
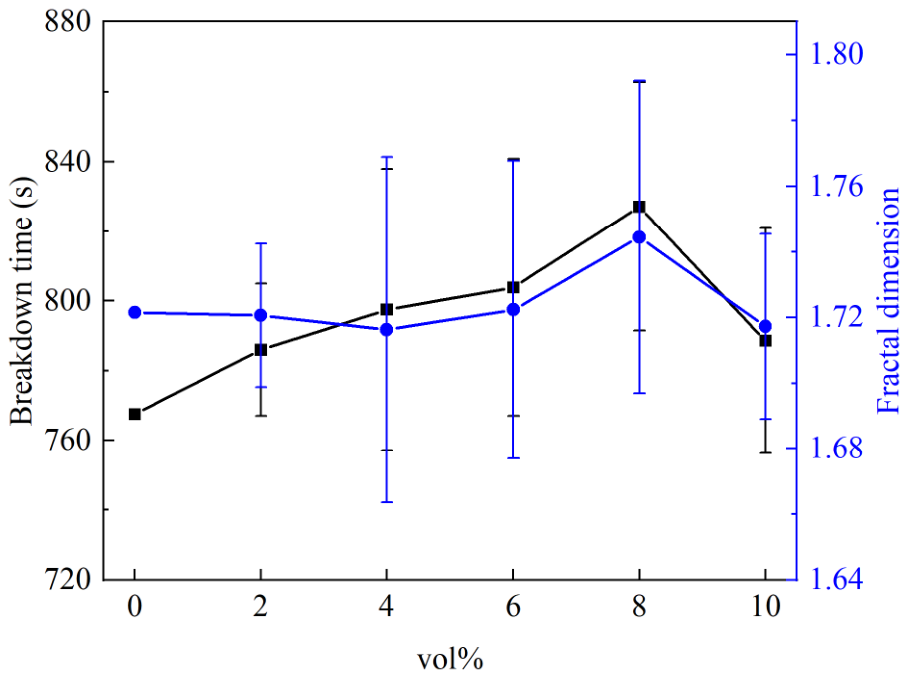
Figure 7 compares the breakdown time and fractal dimension of nanocomposites with different volume fractions. In the present simulations, the breakdown time is defined as the time required for the electrical tree to propagate through the simulation domain and reach the opposite electrode. Under identical simulation conditions, a longer breakdown time indicates slower overall electrical-tree propagation and therefore stronger relative electrical-tree resistance. The breakdown time increases from 767.5 s for neat PE to 786.0, 797.5, 803.9, and 827.1 s at nanoparticle contents of 2, 4, 6, and 8 vol%, respectively. Therefore, the nanocomposite containing 8 vol% nanoparticles exhibits the longest breakdown time, corresponding to an increase of 7.77% compared with neat PE. However, when the nanoparticle content is further increased to 10 vol%, the breakdown time decreases to 788.6 s, which is 4.65% lower than that at 8 vol%. The fractal dimension remains within a relatively narrow range of 1.7162–1.7223 at nanoparticle contents of 0–6 vol%, reaches a maximum value of 1.7444 at 8 vol%, and subsequently decreases to 1.7172 at 10 vol%. The simultaneous increase in breakdown time and fractal dimension at 8 vol% indicates that the electrical tree develops into a more branched and tortuous structure, which increases the propagation path length and delays breakdown. A similar phenomenon was also observed in the electrical-treeing experiments of silicone rubber/graphene composites reported in [52]. The reason for that can be explained as follows. With the increase of volume fraction, more nanoparticles are encountered during the growth of electrical tree, which hinder the propagation speed and tend to prolong the lifetime. As described above, the nanoparticles act as physical barriers in the propagation of electrical tree, which slow down the growth of electrical tree. As a result, the breakdown time increases with the volume fraction when it is lower than 8 vol%. However, since the permittivity of nanofiller is much higher than that of matrix, the electric field in nanocomposite is distorted.
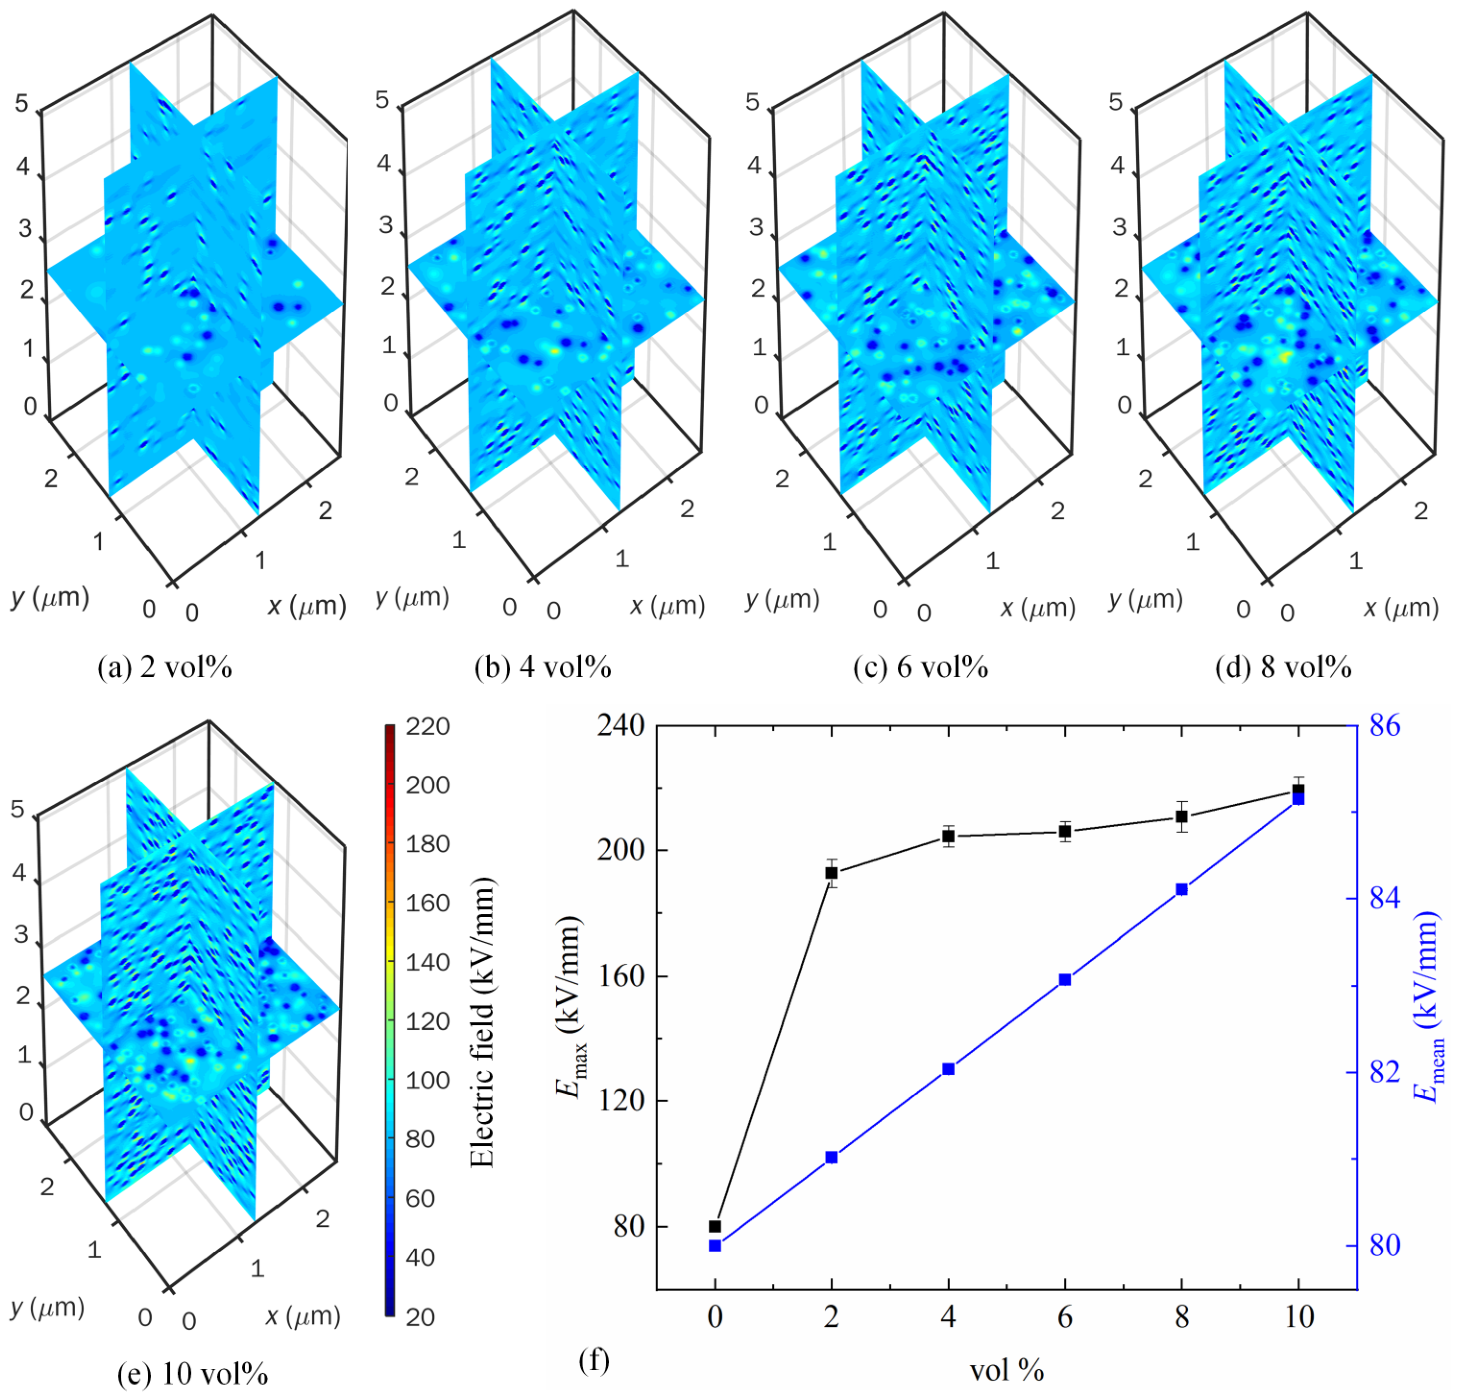
Figure 8 presents the electric-field distributions at different volume fractions, together with the maximum electric field Emax and mean electric field Emean in the matrix. The electric field is concentrated at the two shoulders of the nanoparticles along the electric-field direction. As quantitatively shown in Figure 8f, Emax increases sharply from 80.00 kV/mm for neat PE to 192.84 kV/mm at 2 vol%, and further increases to 219.48 kV/mm at 10 vol%. In contrast, Emean increases only from 80.00 to 85.1534 kV/mm over the same filler-content range. Thus, Emax increases by 174.35%, whereas Emean increases by only 6.44%, indicating that the nanoparticles mainly induce localized electric-field concentration rather than a uniform increase in the electric field throughout the matrix. At nanoparticle contents up to 8 vol%, the increased number of physical barriers and the associated increase in tree-path tortuosity dominate the propagation process, resulting in a progressively prolonged breakdown time. At 10 vol%, however, the stronger local electric-field concentration partially offsets the physical barrier effect, causing the breakdown time to decrease by 4.65% compared with that at 8 vol%. At this high filler loading, the reduced interparticle spacing also promotes the overlap of locally intensified electric-field regions in the polymer gaps, thereby providing preferential paths for damage evolution. Therefore, the competition between the physical barrier effect and localized electric-field enhancement produces an optimum nanoparticle content of approximately 8 vol% under the present simulation conditions. Moreover, the dielectric properties of nanofillers especially the permittivity have a significant effect on the propagation of electrical trees. Within the framework of the present model, nanofillers with higher permittivity generally induce stronger local electric-field distortion, which may accelerate electrical-tree propagation. From this perspective, nanofillers with smaller permittivity such as SiO2 are probably more preferred to improve the electrical tree resistance.
In addition to the competition between the physical barrier effect and electric-field enhancement, the adopted filler loading should also be considered in relation to interphase percolation. Since Al2O3 is electrically insulating, the relevant mechanism is not the formation of a directly conductive filler network. Instead, increasing the filler content reduces the interparticle spacing and may cause the interphase regions surrounding neighboring particles to overlap [53,54]. If these connected interphases contain weakly bonded polymer, excess free volume, defects, shallow traps, or locally intensified electric fields, they may form preferential paths for charge transport and electrical-tree propagation. Agglomeration can further enhance local interphase overlap and introduce void-rich or polymer-deficient regions, thereby increasing electric-field concentration and degrading the breakdown and electrical-treeing resistance. It should be emphasized that the present model assumes ideally dispersed fillers and does not explicitly represent interphase properties or filler agglomeration. Therefore, the optimum content of 8 vol% obtained here should not be interpreted as a universal percolation threshold, but as the optimum loading under the adopted geometrical and material parameters.

3.3. Influence of Nanofillers Shape and Distribution on Electrical Tree Growth

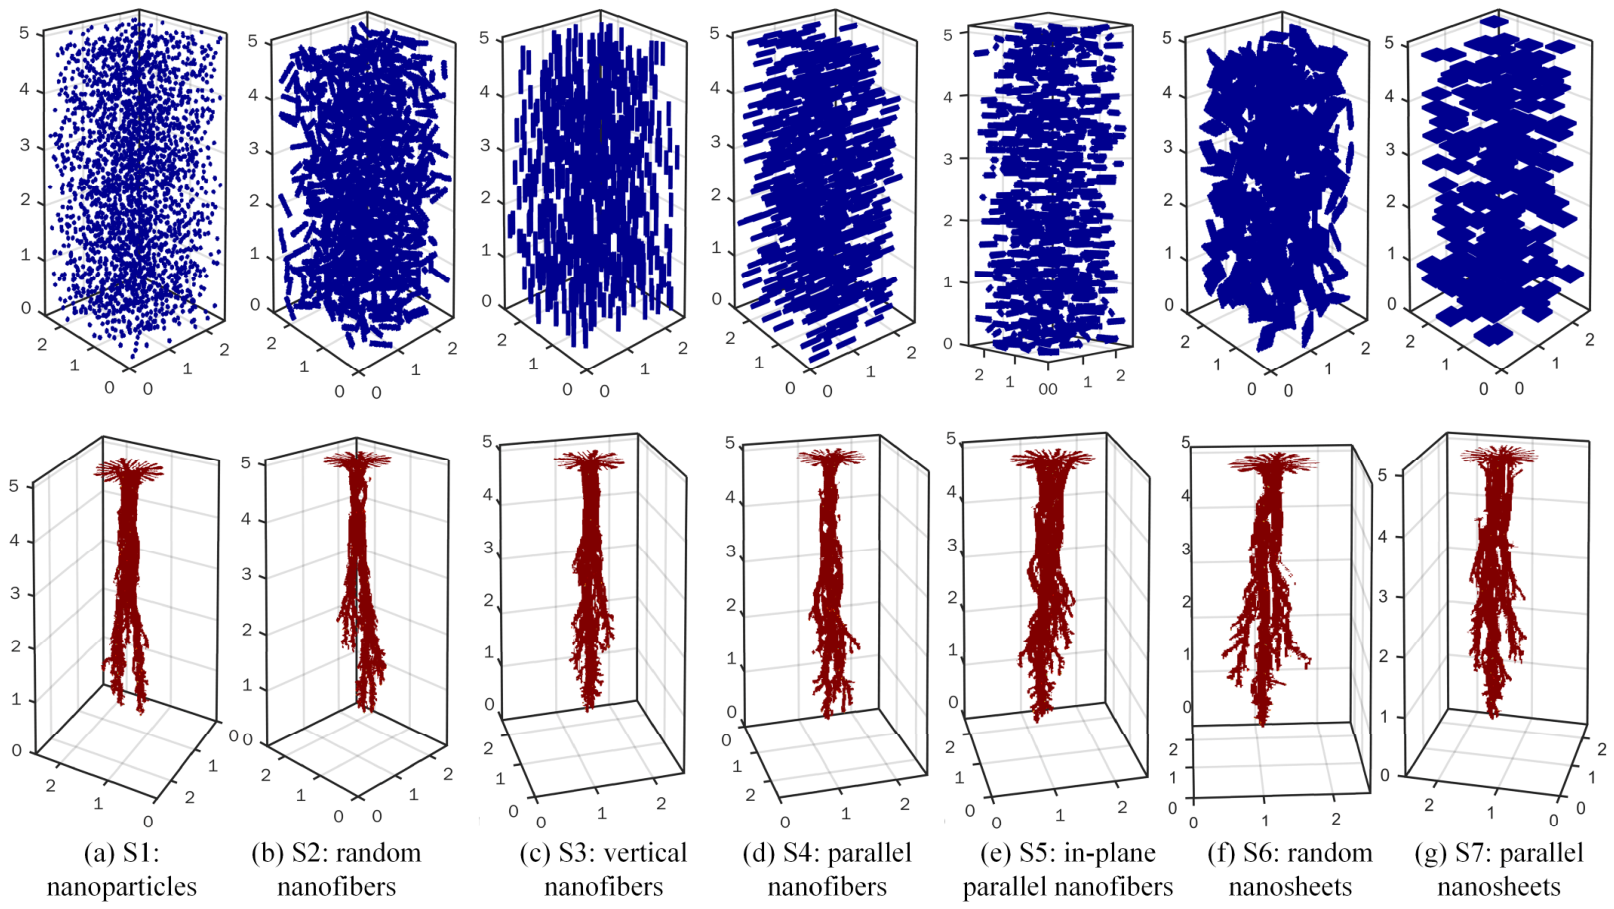
Figure 9 shows the electrical-tree morphologies of nanocomposites with different nanofiller shapes and distributions. Nanoparticle, nanofiber and nanosheet are considered in the simulations, and the influence of fillers distribution including random, vertical and parallel are analyzed. The length and radius of nanofibers are 400 nm and 40 nm respectively, and the width and thickness of nanosheet are 400 nm and 40 nm respectively. The volume fraction for all simulations is 4 vol%. As exhibited in Figure 9, due to the stronger blocking effect of nanofibers and nanosheets, electrical trees are forced to bypass more obstacles, resulting in more branched and tortuous structures. Nanosheets exhibit a stronger inhibiting effect than nanofibers, as shown in Figure 9f,g. Experimental comparisons between nanoalumina and tubular halloysite nanoclay in silicone rubber also demonstrated that nanofiller morphology significantly affects the electrical-tree growth rate and tree morphology [55]. Moreover, when the nanofiber and nanosheet are perpendicular to the growth direction of electrical tree (S4 in Figure 9d, S5 in Figure 9e and S7 in Figure 9g), the propagation path becomes more tortuous due to the interaction with nanofillers. In these cases, the nanocomposites present anisotropic resistance performance. That is, for S4 and S7, the electrical treeing resistance in z-axis is much better than in xy-axis. The importance of nanofiller orientation is also supported by Yang et al., who reported that electric-field-induced orientation of MMT layers in LDPE enhanced the suppression of electrical-tree initiation and propagation [56].
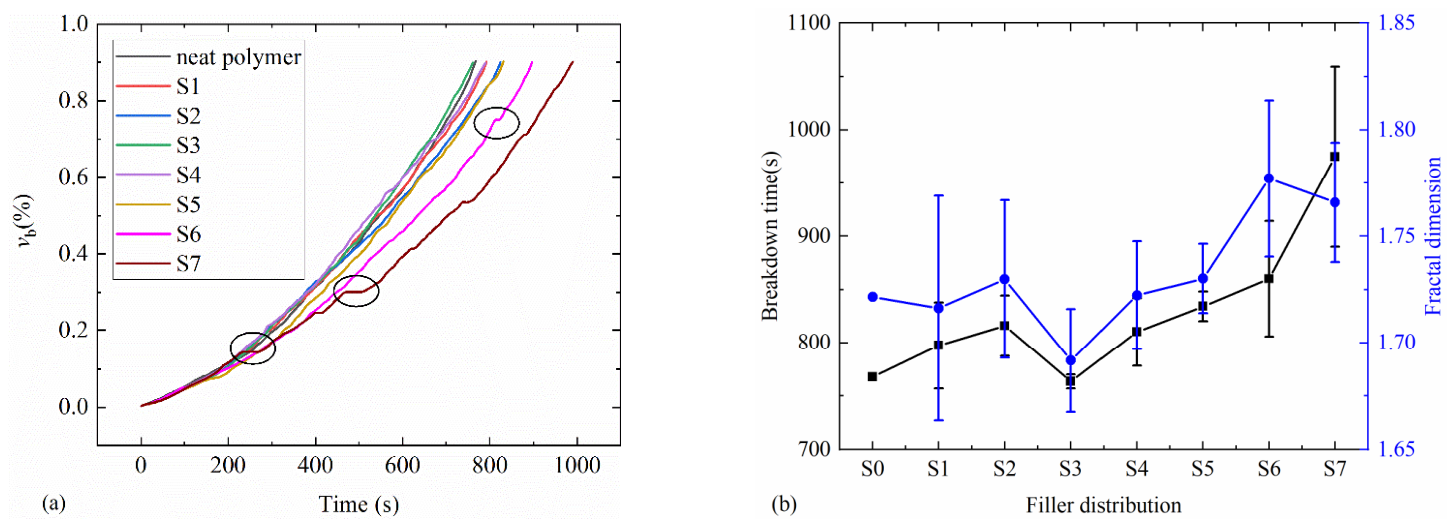
The breakdown volume vb, is adopted to evaluate the growth process of electrical tree. Figure 10a shows the evolution of vb for different kinds of nanocomposites, and Figure 10b compares the breakdown time and fractal dimension. Since electrical trees are easier to grow along the nanofibers, the breakdown time of S3 (nanofibers are parallel to the direction of electrical tree) is shorter than that of neat polymer. Since the nanosheets possess a larger aspect ratio and provide more extended barriers along the propagation path, S6 and S7 present optimal performance in hindering the electrical tree, which is superior to nanoparticle and nanofiber with optimized distribution such as S5. A similar barrier effect of platelet-shaped fillers was experimentally observed in graphene nanoplatelet/silicone-rubber composites, in which the electrical-tree length was inhibited and the tree morphology changed from a bush-branch structure to a bush structure at appropriate filler contents [52]. These conclusions are consistent with the above analysis of tree shapes for different composites.
Compared with neat PE, which has a breakdown time of 767.5 s, the nanoparticle-filled composite S1 prolongs the breakdown time by 3.91%. For the nanofiber-filled composites S2–S5, the change in breakdown time ranges from −0.52% to 8.69%, demonstrating that the effectiveness of nanofibers strongly depends on their orientation and spatial arrangement. In comparison, the nanosheet-filled composites S6 and S7 increase the breakdown time by 12.04% and 27.00%, respectively, indicating that nanosheets provide a more effective barrier to tree penetration. Breakdown time has also been experimentally used to evaluate the electrical-treeing speed of polymer composites [50,57]. It should be noted that the absolute simulated breakdown time depends on the kinetic coefficient, applied electric field, simulation-domain size, damage threshold, and other model parameters. Therefore, the breakdown time obtained here is mainly used as a comparative indicator under identical simulation conditions rather than as a direct quantitative prediction of the actual service lifetime of practical insulation systems.
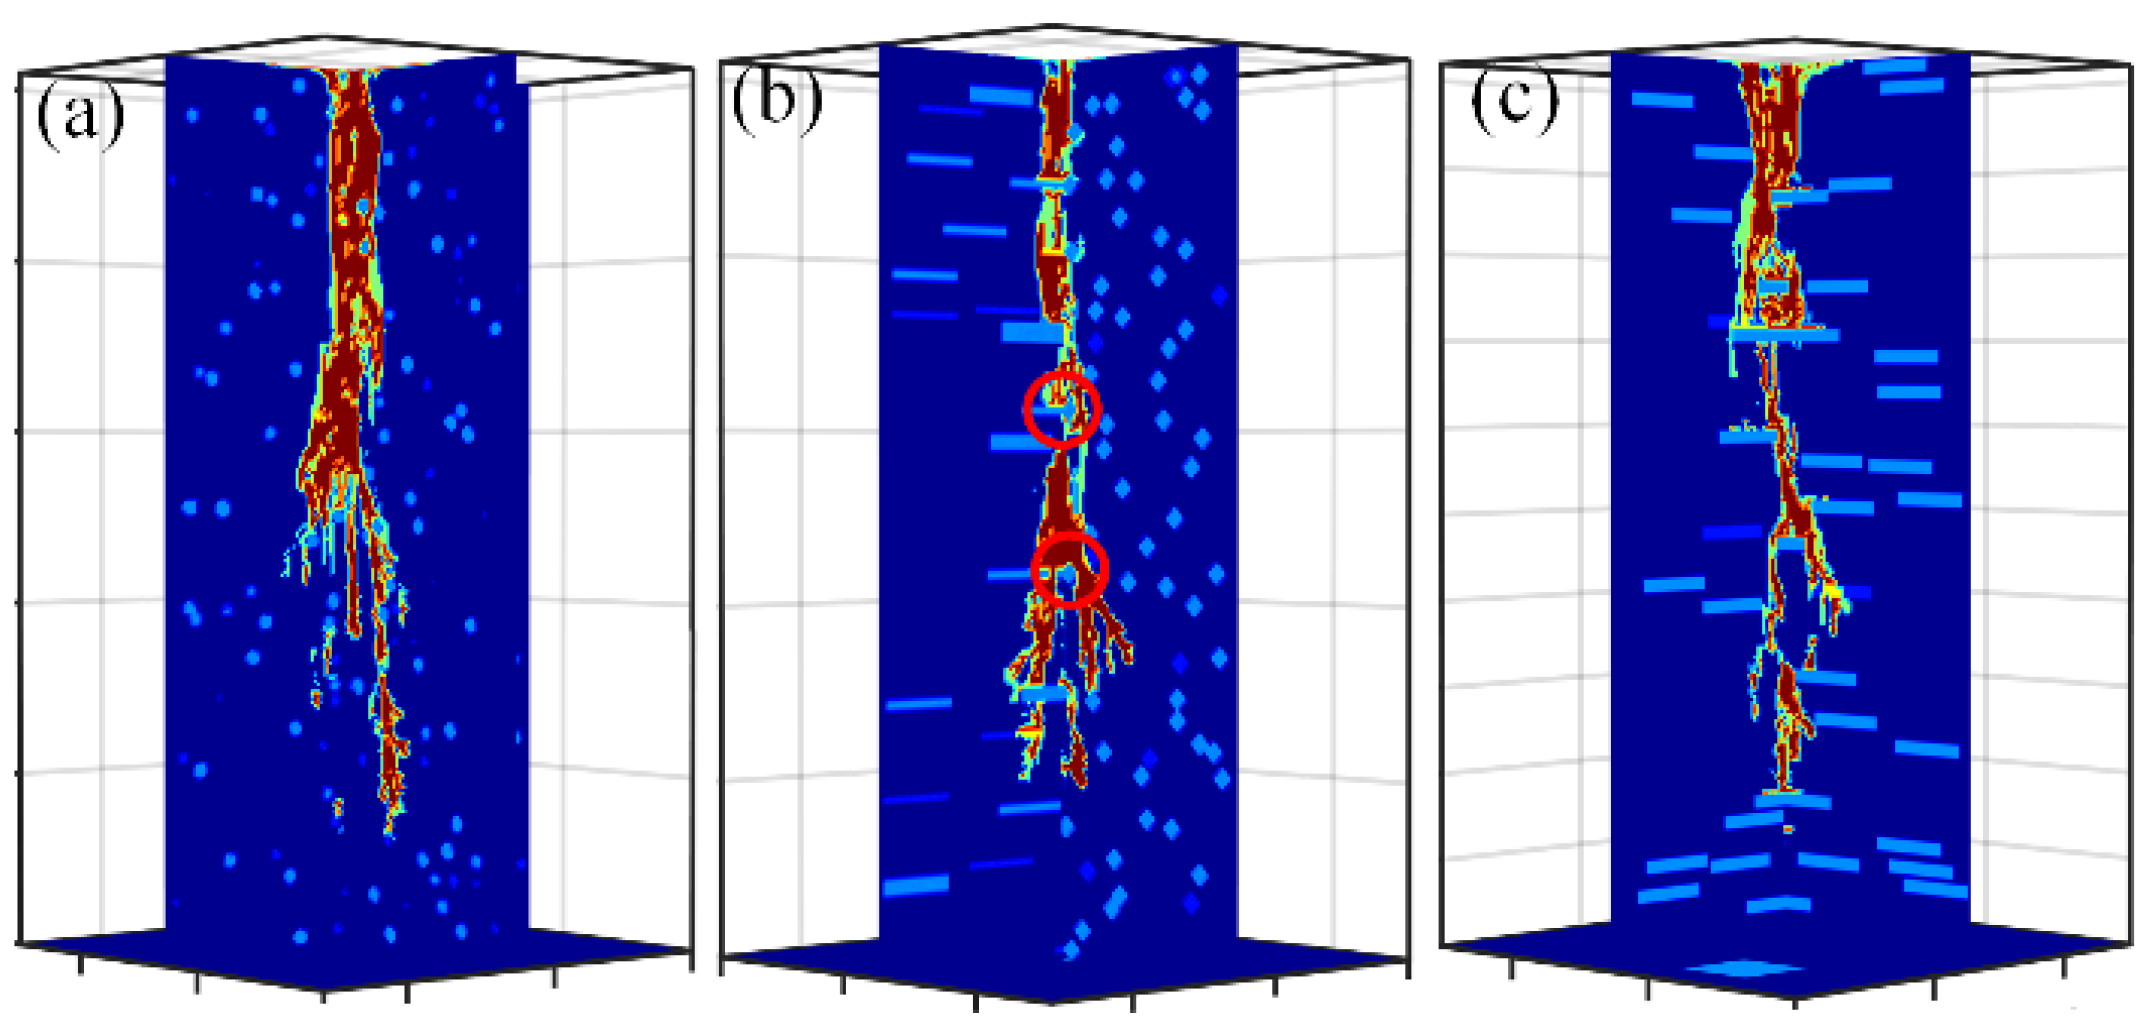
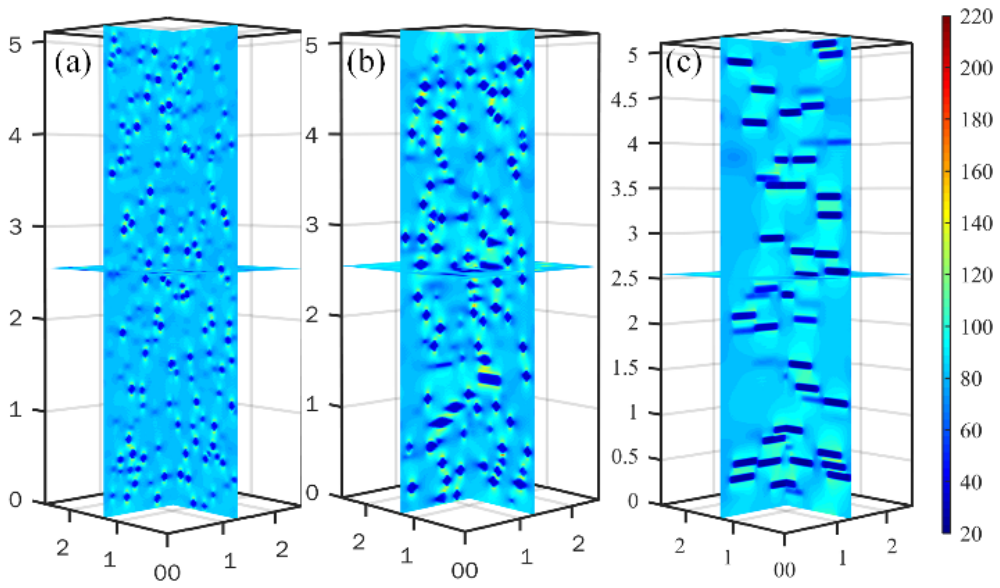
Figure 11 presents the snapshots of electrical tree for S1, S4 and S7, in which the areas with light blue color are nanofillers. The electrical trees in all three nanocomposites bypass the nanofillers and propagate through the intermediate polymer regions, confirming the physical barrier effect of the nanofillers on electrical-tree growth [48,49,50,51]. Compared to nanofiber and nanosheet, the electrical tree is easier to go around the nanoparticle. From Figure 11b, the nanofiber has favorable inhibition effect on the axial direction, but the electrical tree tends to bypass the filler on the radial direction as shown in the black circle. As a result, the nanofibers of S5 form a net structure which is beneficial to hinder the electrical tree, which has longer breakdown time than that of S4. The electrical tree is hard to bypass the nanosheet, and the growth process is terminated at some moments such as 230 and 470 s shown in the black circle of Figure 10a. Moreover, as shown by the electrical field distributions in Figure 12, S7 exhibits the most homogeneous electric-field distribution among the three cases, which reduces local field concentration and slows electrical-tree propagation. For composites with particles and fibers, the electrical fields are highly concentrated around the nanofillers, which guide the propagation path of electrical trees. As a result, the nanocomposites filled with nanosheets show optimal electrical treeing resistance, and fillers with sheet shape such as boron nitride and Al2O3 nanosheets are more preferred.
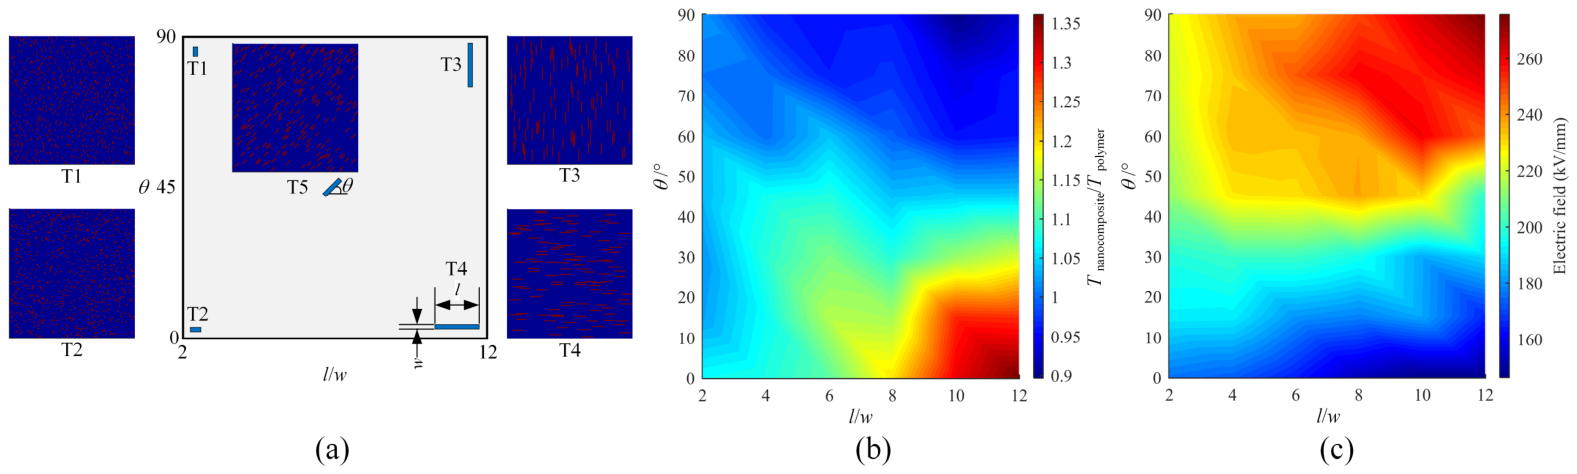
To further understand the influence of nanofillers shape and orientation on electrical tree characteristics, a high-throughput computation in 2D space is performed. Since the nanosheet presents optimal performance among different fillers, only the nanosheet is considered in the simulation, and different aspect ratios and orientation angles of nanosheet are assigned. For example, T3 in Figure 13a is defined with l/w = 12 and θ = 90°, T4 is defined with l/w = 12 and θ = 0°, and T5 is defined with l/w = 6 and θ = 45°. The breakdown time and maximum electric field for different aspect ratios and orientation angles are calculated using the 2D phase-field model as shown in Figure 13b,c. In Figure 13b, the ratios between breakdown times of nanocomposite and neat polymer, namely Tcomposite/Tpolymer are presented.
As can be seen from Figure 13, the distribution of breakdown time is contradictory to that of electric field, namely, the doping schemes with high electric field always present short breakdown time. For aspect ratios higher than 4, the life time decreases when the orientation angle increases. The electric field is enhanced and the electrical tree is easier to propagate along the nanofiber when θ increases, which reduces the life time of materials. For nanofiller with smaller aspect ratio, the orientation angle has little influence on breakdown time, and the nanocomposite shows almost isotropic performance in different directions. When the orientation angle is 0°, with the l/w changing from 2 to 12, the ratio of breakdown time monotonically increases from 1.07 to 1.36, and the maximum electric field is reduced. That is, nanosheet with larger aspect ratio shows better hindering effect when the propagation direction of electrical tree is perpendicular to the nanosheet. However, when the orientation angle is relatively high such as θ = 90°, the breakdown time decreases as the l/w increases. This is because larger nanofillers are more likely to form continuous paths for electrical-tree growth. In summary, the nanocomposite with θ = 0° and l/w = 12 exhibits the longest breakdown time and the lowest maximum electric field among all cases. For θ = 90° and l/w = 12, the breakdown time is the minimum among all cases, which is shorter than that of neat PE and resembles that of S3 in Figure 9. Several methods, such as hot-pressing, electrospinning, and electrically driven self-assembly technique [58,59,60], can be adopted to fabricate composites with oriented fillers, which can significantly improve the electric tree resistance.

3.4. Electrical Trees of Trilayered and Ternary Composites

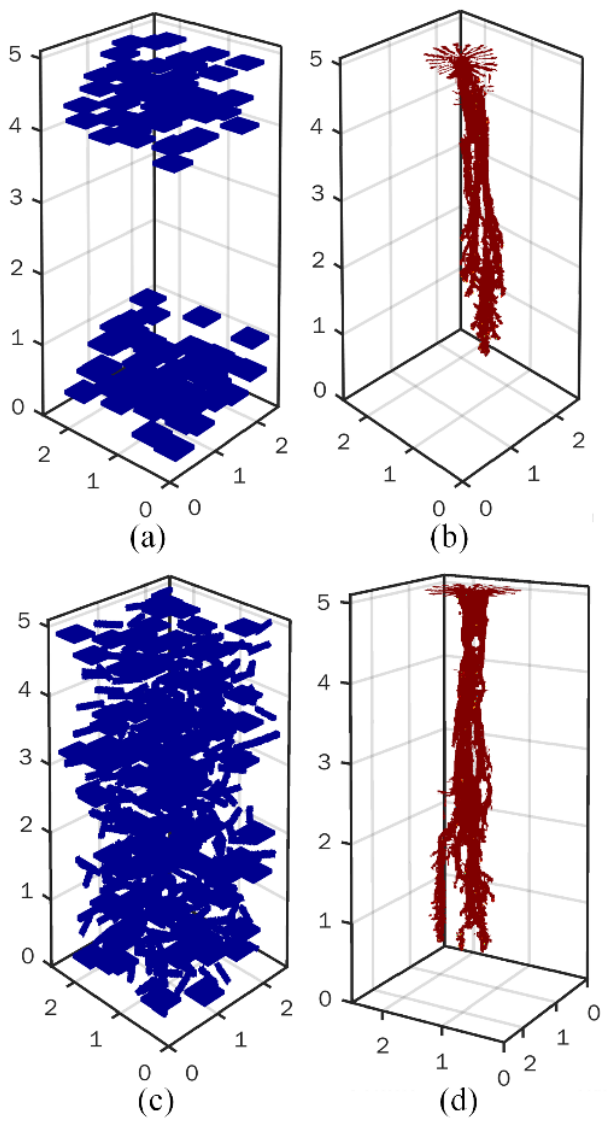
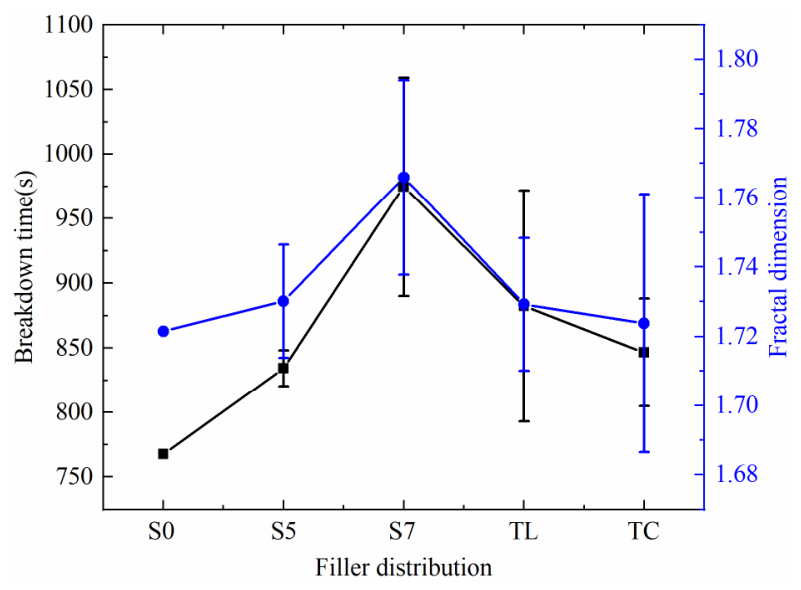
Nanocomposites with more complicated architecture such as multi-layer or ternary components have been designed to achieve high energy density or thermal conductivity. In this part, the electrical trees of trilayered (TL) and ternary composites (TC) are simulated. For the trilayered composite, the outer layers are filled with 4 vol% parallel nanosheet, and the central layer is neat PE, as shown in Figure 14a. Parallel nanosheets and in-plane parallel nanofibers both with 2 vol% are simultaneously added to the ternary composite, as shown in Figure 14c. The electrical trees of TL and TC simulated with the phase-field model are presented in Figure 14. As can be seen, several main branches are produced due to the hindrance of nanofillers, and it seems that TL and TC are with more branches than that of S1–S5 in the previous section. The breakdown time and fractal dimension of TL and TC are compared with composites with unitary fillers, as shown in Figure 15. Since nanosheets are added to both TL and TC, the life time is longer than that of nanocomposites filled with nanoparticle and nanofiber. Moreover, the breakdown time of TL and TC are close to even longer than that of nanocomposite with random nanosheets, but shorter than that of nanocomposite with parallel nanosheet. In a word, both trilayered and ternary composites present favorable electrical treeing resistance, and can be used in applications requiring multiple performances such as both high breakdown strength and superior treeing resistance or both high thermal conductivity and superior treeing resistance. For example, nanofibers tend to form a thermal conductive network while nanosheets are effective to improve the treeing resistance, then a composite like TC can be used to cases requiring both high thermal conductivity and superior treeing resistance.
The present phase-field model is mainly applicable to qualitative mechanism analysis and relative comparison of different nanofiller configurations under identical simulation conditions. Individual partial-discharge pulses, explicit carrier transport, space-charge evolution, thermal and chemical degradation, realistic interphase heterogeneity, filler agglomeration, and specimen-scale electrode geometry are not explicitly considered. Therefore, the calculated electrical-tree morphology and breakdown time should be interpreted as comparative indicators rather than direct quantitative predictions of the tree evolution and service lifetime of practical insulation systems. Incorporating charge transport, realistic interphase properties, and multiphysical degradation processes would further extend the predictive capability of the model.

4. Conclusions

A phase-field model is presented to characterize the electrical trees in nanocomposites, in which the damage phase is described with a continuous order variable. The kinetic equation is employed to model the aging of material in each position, which is more realistic than existing models in which the material is thought to be totally damaged when the electric field exceeds a critical value. Then the influence of nanofillers volume fraction, shape and orientation on electrical tree growth is discussed. The nanocomposite containing 8 vol% Al2O3 nanoparticles with a radius of 50 nm exhibits the longest breakdown time of 827.1 s, which is 7.77% higher than that of neat PE. When the nanoparticle content is further increased to 10 vol%, the breakdown time decreases by 4.65% relative to that at 8 vol%, owing to the competition between the physical barrier effect and localized electric-field enhancement. Compared with neat PE, randomly distributed and parallel nanosheets increase the breakdown time by 12.04% and 27.00%, respectively, demonstrating stronger inhibition of electrical-tree propagation than nanoparticles and nanofibers. Moreover, a high-throughput computation is performed to analyze the influence of nanofillers shape and orientation on electrical tree characteristics. When the electrical-tree propagation direction is perpendicular to the nanosheets, increasing the aspect ratio from 2 to 12 raises the normalized breakdown time from 1.07 to 1.36. Trilayered and ternary composites also present favorable electrical treeing resistance, and can be used to some cases requiring multiple performances. This work provides an effective tool to investigate the influence of nanofiller on electrical tree characteristics, which can guide the development of new insulation designs.

Author Contributions

All the authors equally contributed to develop the article. All authors have read and agreed to the published version of the manuscript.

Funding

This work was supported by the Open Research Fund of Hubei Technology Innovation Center for Smart Hydropower under Grant Number HBCXZX-JJ-202413.

Data Availability Statement

The data presented in this study are available on request from the corresponding author.

Conflicts of Interest

Jia Cheng, Guang Li, Chongzi Cao, Yanbing Ji were employed by the Hubei Technology Innovation Center for Smart Hydropower. The remaining authors declare that the research was conducted in the absence of any commercial or financial relationchips that could be construed as a potential conflict of interest.

References

  1. Liu, G.; Zhu, L.; Chang, Z.; Dastan, D.; Liu, Y.; Fan, R.; Shi, Z. Significantly Enhancing the High-temperature Breakdown and Capacitive Performances of Dielectric Polymers via Incorporating Alumina Nanotubes as Equivalent Crosslinking Points. Adv. Funct. Mater. 2025, 35, 2425001. [Google Scholar] [CrossRef] [Scilit]
  2. Zhang, Y.; Wu, Z.; He, J.; Zhang, D.; Hu, M. Electrical treeing behaviours in cross-linked polyethylene cables after thermal ageing. High Volt. 2023, 8, 749–759. [Google Scholar] [CrossRef] [Scilit]
  3. Liang, H.; Du, B. Simulation study on electrical tree propagation under electrical and mechanical stresses. J. Phys. D Appl. Phys. 2024, 57, 475502. [Google Scholar] [CrossRef] [Scilit]
  4. Pallon, L.K.H.; Nilsson, F.; Yu, S.; Liu, D.; Diaz, A.; Holler, M.; Chen, X.R.; Gubanski, S.; Hedenqvist, M.S.; Olsson, R.T.; et al. Three-Dimensional Nanometer Features of Direct Current Electrical Trees in Low-Density Polyethylene. Nano Lett. 2017, 17, 1402–1408. [Google Scholar] [CrossRef] [Scilit] [PubMed]
  5. Zheng, H.; Chen, G.; Rowland, S.M. The influence of AC and DC voltages on electrical treeing in low density polyethylene. Int. J. Electr. Power Energy Syst. 2020, 114, 105386. [Google Scholar] [CrossRef] [Scilit]
  6. Du, B.X.; Su, J.G.; Han, T. Compressive stress dependence of electrical tree growth characteristics in EPDM. IEEE Trans. Dielectr. Electr. Insul. 2018, 25, 13–20. [Google Scholar] [CrossRef] [Scilit]
  7. Tanaka, T. A quantum dot model for nanoparticles in polymer nanocomposites. IEEE Trans. Dielectr. Electr. Insul. 2019, 26, 276–283. [Google Scholar] [CrossRef]
  8. Dang, Z.M.; Yuan, J.K.; Yao, S.H.; Liao, R.J. Flexible Nanodielectric Materials with High Permittivity for Power Energy Storage. Adv. Mater. 2013, 25, 6334–6365. [Google Scholar] [CrossRef] [Scilit] [PubMed]
  9. Ding, S.; Yu, S.; Zhu, X.; Xie, S.; Sun, R.; Liao, W.H.; Wong, C.P. Enhanced breakdown strength of polymer composites by low filler loading and its mechanisms. Appl. Phys. Lett. 2017, 111, 153902. [Google Scholar] [CrossRef] [Scilit]
  10. Sima, W.; Tang, X.; Sun, P.; Sun, Z.; Yuan, T.; Yang, M.; Zhu, C.; Shi, Z.; Deng, Q. Nondestructive 3D Imaging of Microscale Damage inside Polymers-Based on the Discovery of Self-Excited Fluorescence Effect Induced by Electrical Field. Adv. Sci. 2023, 10, 2302262. [Google Scholar] [CrossRef] [Scilit] [PubMed]
  11. Imai, T.; Sawa, F.; Ozaki, T.; Shimizu, T.; Kido, R.; Kozako, M.; Tanaka, T. Influence of temperature on mechanical and insulation properties of epoxy-layered silicate nanocomposite. IEEE Trans. Dielectr. Electr. Insul. 2006, 13, 445–452. [Google Scholar] [CrossRef] [Scilit]
  12. Shang, C.; Du, Y.; Kang, H. Introduction of inorganic nano-particles into a polymer matrix to restrain the initiation and propagation of electrical trees in the corona condition. RSC Adv. 2017, 7, 53497–53502. [Google Scholar] [CrossRef] [Scilit]
  13. Chen, Y.; Imai, T.; Ohki, Y.; Tanaka, T. Tree initiation phenomena in nanostructured epoxy composites. IEEE Trans. Dielectr. Electr. Insul. 2010, 17, 1509–1515. [Google Scholar] [CrossRef] [Scilit]
  14. Raetzke, S.; Ohki, Y.; Imai, T.; Tanaka, T.; Kindersberger, J. Tree initiation characteristics of epoxy resin and epoxy/clay nanocomposite. IEEE Trans. Dielectr. Electr. Insul. 2009, 16, 1473–1480. [Google Scholar] [CrossRef] [Scilit]
  15. Du, B.; Su, J.; Tian, M.; Han, T.; Li, J. Understanding Trap Effects on Electrical Treeing Phenomena in EPDM/POSS Composites. Sci. Rep. 2018, 8, 8481. [Google Scholar] [CrossRef] [Scilit] [PubMed]
  16. Nyamupangedengu, C.; Cornish, D.R. Time-evolution phenomena of electrical tree partial discharges in Magnesia, Silica and Alumina epoxy nanocomposites. IEEE Trans. Dielectr. Electr. Insul. 2016, 23, 85–94. [Google Scholar] [CrossRef] [Scilit]
  17. Bordeori, M.M.; Gupta, N. Electrical Tree Growth in Nanocomposites. IEEE Trans. Dielectr. Electr. Insul. 2024, 31, 304–312. [Google Scholar] [CrossRef] [Scilit]
  18. Bordeori, M.M.; Gupta, N. Partial Discharge Activity During Electrical Tree Growth in Epoxy and Its Nanocomposites. IEEE Trans. Dielectr. Electr. Insul. 2025, 32, 466–473. [Google Scholar] [CrossRef] [Scilit]
  19. Song, J.; Lv, Z.; Wu, K.; Cheng, Y.; Wu, Z.; Zeng, X.; Li, S.Q. Quantitative Analysis of Electrical Tree Growth With Partial Discharge Characteristics of PCB Double Layer Under AC Voltage. IEEE Trans. Dielectr. Electr. Insul. 2025, 32, 1703–1711. [Google Scholar] [CrossRef] [Scilit]
  20. Li, H.; Mu, H.; Yao, H.; Yang, Y.; Zhao, X.; Qian, Z.; Liu, C.; Zhang, G. Characteristics of Electrical Tree Growing on Gel-Substrate Surface for Power Module at High-Frequency Positive Square Wave Voltage. IEEE Trans. Dielectr. Electr. Insul. 2025, 32, 314–324. [Google Scholar] [CrossRef] [Scilit]
  21. Huang, X.; Sun, B.; Zhu, Y.; Li, S.; Jiang, P. High-k polymer nanocomposites with 1D filler for dielectric and energy storage applications. Prog. Mater. Sci. 2019, 100, 187–225. [Google Scholar] [CrossRef] [Scilit]
  22. Li, H.; Ai, D.; Ren, L.; Yao, B.; Han, Z.; Shen, Z.; Wang, J.; Chen, L.Q.; Wang, Q. Scalable Polymer Nanocomposites with Record High-Temperature Capacitive Performance Enabled by Rationally Designed Nanostructured Inorganic Fillers. Adv. Mater. 2019, 31, 1900875. [Google Scholar] [CrossRef] [Scilit] [PubMed]
  23. Chen, J.; Huang, X.; Sun, B.; Jiang, P. Highly Thermally Conductive Yet Electrically Insulating Polymer/Boron Nitride Nanosheets Nanocomposite Films for Improved Thermal Management Capability. ACS Nano 2019, 13, 337–345. [Google Scholar] [CrossRef] [Scilit] [PubMed]
  24. Li, Q.; Chen, L.; Gadinski, M.R.; Zhang, S.; Zhang, G.; Li, H.U.; Iagodkine, E.; Haque, A.; Chen, L.Q.; Jackson, T.N.; et al. Flexible high-temperature dielectric materials from polymer nanocomposites. Nature 2015, 523, 576–579. [Google Scholar] [CrossRef] [Scilit] [PubMed]
  25. Wang, Y.; Chen, J.; Li, Y.; Niu, Y.; Wang, Q.; Wang, H. Multilayered hierarchical polymer composites for high energy-density capacitors. J. Mater. Chem. A 2019, 7, 2965–2980. [Google Scholar] [CrossRef] [Scilit]
  26. Raetzke, S.; Kindersberger, J. Role of interphase on the resistance to high-voltage arcing, on tracking and erosion of silicone/SiO2 nanocomposites. IEEE Trans. Dielectr. Electr. Insul. 2010, 17, 607–614. [Google Scholar] [CrossRef] [Scilit]
  27. Zuo, Z.; Dissado, L.A.; Chalashkanov, N.M.; Dodd, S.J.; Yao, C. Dielectric breakdown at sub-critical fields. Appl. Phys. Lett. 2018, 113, 112901. [Google Scholar] [CrossRef] [Scilit]
  28. Niemeyer, L.; Pietronero, L.; Wiesmann, H.J. Fractal Dimension of Dielectric Breakdown. Phys. Rev. Lett. 1984, 52, 1033–1036. [Google Scholar] [CrossRef] [Scilit]
  29. Noskov, M.D.; Sack, M.; Malinovski, A.S.; Schwab, A.J. Measurement and simulation of electrical tree growth and partial discharge activity in epoxy resin. J. Phys. D Appl. Phys. 2001, 34, 1389–1398. [Google Scholar] [CrossRef] [Scilit]
  30. Dodd, S.J. A deterministic model for the growth of non-conducting electrical tree structures. J. Phys. D Appl. Phys. 2003, 36, 129–141. [Google Scholar] [CrossRef] [Scilit]
  31. Lv, Z.; Rowland, S.M.; Chen, S.; Zheng, H. Modelling and simulation of PD characteristics in non-conductive electrical trees. IEEE Trans. Dielectr. Electr. Insul. 2018, 25, 2250–2258. [Google Scholar] [CrossRef] [Scilit]
  32. Shen, Z.H.; Wang, J.J.; Lin, Y.; Nan, C.W.; Chen, L.Q.; Shen, Y. High-Throughput Phase-Field Design of High-Energy-Density Polymer Nanocomposites. Adv. Mater. 2018, 30, 1704380. [Google Scholar] [CrossRef] [Scilit] [PubMed]
  33. Cai, Z.; Wang, X.; Luo, B.; Hong, W.; Wu, L.; Li, L. Dielectric response and breakdown behavior of polymer-ceramic nanocomposites: The effect of nanoparticle distribution. Compos. Sci. Technol. 2017, 145, 105–113. [Google Scholar] [CrossRef] [Scilit]
  34. Xu, H.; Yan, Q.; Du, B.; Xing, Y. Phase-Field Modeling of the Propagation of Electrical Trees in PP/POE Blends. IEEE Trans. Dielectr. Electr. Insul. 2024, 31, 1250–1258. [Google Scholar] [CrossRef] [Scilit]
  35. Li, Y.; Shan, Y.; Zhen, G.; Lan, L.; Liu, Y.; Zeng, X.; Liu, B. Experiment and Simulation of Temperature Effects on Partial Discharge and Electrical Treeing in XLPE Insulation. IEEE Trans. Dielectr. Electr. Insul. 2025, 32, 674–683. [Google Scholar] [CrossRef] [Scilit]
  36. He, K.; He, J.; Zhou, Y.; Gao, B. An Electric and Stress Field-Driven Electrical Tree Growth Model. IEEE Trans. Dielectr. Electr. Insul. 2025, 32, 742–750. [Google Scholar] [CrossRef] [Scilit]
  37. Bai, T.; Zhao, X.; Yang, Y.; Ma, Q. Numerical Simulation of Electrical Treeing in Epoxy Resin Using a Regularized Phase-Field Model. In Proceedings of the 8th International Conference on Energy Systems and Electrical Power (ICESEP 2026), Wuhan, China, 5–7 June 2026; pp. 883–886. [Google Scholar] [CrossRef] [Scilit]
  38. Karma, A.; Kessler, D.A.; Levine, H. Phase-Field Model of Mode III Dynamic Fracture. Phys. Rev. Lett. 2001, 87, 045501. [Google Scholar] [CrossRef] [Scilit] [PubMed]
  39. Cai, Z.; Wang, X.; Li, L.; Hong, W. Electrical treeing: A phase-field model. Extreme Mech. Lett. 2019, 28, 87–95. [Google Scholar] [CrossRef] [Scilit]
  40. Wang, J.J.; Ma, X.Q.; Li, Q.; Britson, J.; Chen, L.Q. Phase transitions and domain structures of ferroelectric nanoparticles: Phase field model incorporating strong elastic and dielectric inhomogeneity. Acta Mater. 2013, 61, 7591–7603. [Google Scholar] [CrossRef] [Scilit]
  41. Provatas, N.; Elder, K. Phase-Field Methods in Materials Science and Engineering; Wiley-VCH: Weinheim, Germany, 2010; pp. 262–263. [Google Scholar]
  42. Zhou, C.; Chen, G. Space charge and AC electrical breakdown strength in polyethylene. IEEE Trans. Dielectr. Electr. Insul. 2017, 24, 559–566. [Google Scholar] [CrossRef] [Scilit]
  43. Hosier, I.L.; Vaughan, A.S.; Swingler, S.G. The effects of measuring technique and sample preparation on the breakdown strength of polyethylene. IEEE Trans. Dielectr. Electr. Insul. 2002, 9, 353–361. [Google Scholar] [CrossRef]
  44. Hao, J.; Liu, Z.; Liao, R.; Li, J. Electro-thermal breakdown measurement of 500 kV cross-linked polyethylene submarine cable insulation material and its lifetime model analysis. IET Sci. Meas. Technol. 2020, 14, 862–869. [Google Scholar] [CrossRef] [Scilit]
  45. Arachchige, T.G.; Zhong, X.; Ekanayake, C.; Ma, H.; Saha, T. Characterization of Electrical Tree Initiation and Growth in XLPE Under Harmonic Waveforms. IEEE Trans. Dielectr. Electr. Insul. 2023, 30, 1974–1982. [Google Scholar] [CrossRef] [Scilit]
  46. Chen, S.; Lv, Z.; Carr, J.; Storm, M.; Rowland, S.M. Electrical tree growth in microsilica-filled epoxy resin. IEEE Trans. Dielectr. Electr. Insul. 2020, 27, 820–828. [Google Scholar] [CrossRef] [Scilit]
  47. Tanase, T.; Kato, T.; Tanaka, S.; Sano, A.; Kojima, H.; Fukushima, K.; Takezawa, Y. Prolonging electrical lifetime of mesogenic epoxy based alumina-mica composite sheet: Optimization of mica content by electrical tree progress simulation. IEEE Trans. Dielectr. Electr. Insul. 2018, 25, 2212–2219. [Google Scholar] [CrossRef] [Scilit]
  48. Danikas, M.G.; Tanaka, T. Nanocomposites-a review of electrical treeing and breakdown. IEEE Electr. Insul. Mag. 2009, 25, 19–25. [Google Scholar] [CrossRef] [Scilit]
  49. Tanaka, T.; Kozako, M.; Fuse, N.; Ohki, Y. Proposal of a multi-core model for polymer nanocomposite dielectrics. IEEE Trans. Dielectr. Electr. Insul. 2005, 12, 669–681. [Google Scholar] [CrossRef] [Scilit]
  50. Bian, W.; Wang, W.; Yang, Y. A Self-Healing and Electrical-Tree-Inhibiting Epoxy Composite with Hydrogen-Bonds and SiO2 Particles. Polymers 2017, 9, 431. [Google Scholar] [CrossRef] [Scilit] [PubMed]
  51. Wang, W.; Yang, Y. The Synergistic Effects of the Micro and Nano Particles in Micro-nano Composites on Enhancing the Resistance to Electrical Tree Degradation. Sci. Rep. 2017, 7, 8672. [Google Scholar] [CrossRef] [Scilit] [PubMed]
  52. Han, T.; Du, B.; Su, J.; Gao, Y.; Xing, Y.; Fang, S.; Li, C.; Lei, Z. Inhibition Effect of Graphene Nanoplatelets on Electrical Degradation in Silicone Rubber. Polymers 2019, 11, 968. [Google Scholar] [CrossRef] [Scilit] [PubMed]
  53. Li, S.; Min, D.; Wang, W.; Chen, G. Linking traps to dielectric breakdown through charge dynamics for polymer nanocomposites. IEEE Trans. Dielectr. Electr. Insul. 2016, 23, 2777–2785. [Google Scholar] [CrossRef] [Scilit]
  54. Park, S.H.; Hwang, J.; Park, G.S.; Ha, J.H.; Zhang, M.; Kim, D.; Yun, D.J.; Lee, S.; Lee, S.H. Modeling the electrical resistivity of polymer composites with segregated structures. Nat. Commun. 2019, 10, 2537. [Google Scholar] [CrossRef] [Scilit] [PubMed]
  55. Hafiz, M.; Fairus, M.; Mariatti, M.; Kamarol, M. A Comparative Study on Electrical Tree Growth in Silicone Rubber Containing Nanoalumina and Halloysite Nanoclay. IEEE Access 2019, 7, 24452–24462. [Google Scholar] [CrossRef] [Scilit]
  56. Yang, L.; Bai, G.; Liu, Y.; Gu, J.; Li, J.; Zhang, H. Electric field inducement of montmorillonite in LDPE and properties of electrical tree growing in this composite. IEEE Trans. Dielectr. Electr. Insul. 2015, 22, 1684–1693. [Google Scholar] [CrossRef] [Scilit]
  57. Wang, Q.; Deng, Y.; Yap, M.; Yang, Y.; Ma, J.; Chern, W.K.; Li, J.; Chen, Z. Electrical tree modelling in dielectric polymers using a phase-field regularized cohesive zone model. Mater. Des. 2023, 235, 112409. [Google Scholar] [CrossRef] [Scilit]
  58. Jiang, J.; Shen, Z.; Cai, X.; Qian, J.; Dan, Z.; Lin, Y.; Liu, B.; Nan, C.W.; Chen, L.; Shen, Y. Polymer Nanocomposites with Interpenetrating Gradient Structure Exhibiting Ultrahigh Discharge Efficiency and Energy Density. Adv. Energy Mater. 2019, 9, 1803411. [Google Scholar] [CrossRef] [Scilit]
  59. Song, Y.; Gao, X.; Zheng, M.; Hou, Y. Flexible, highly out-of-plane thermal conductive and electrically insulating multi-scale oriented BNNS/PDMS thermal interface materials. J. Alloys Compd. 2025, 1041, 183850. [Google Scholar] [CrossRef] [Scilit]
  60. Chen, X.; Fan, L.; Guo, X.; Zheng, H.; Cheng, S.; Zheng, P.; Zheng, L.; Zhang, X.A.; Zhang, Y. Self-adaptive thermal interface materials featuring low thermal resistance by combining phase change materials with magnetic field-induced filler alignment. Compos. Part B Eng. 2025, 304, 112687. [Google Scholar] [CrossRef] [Scilit]
Figure 1. Schematic of simulation model for electrical tree growth.
Electronics 15 03674 g001
Figure 2. Flow chart for phase field model of electrical tree growth in nanocomposite.
Electronics 15 03674 g002
Figure 3. Simulated tree structure and definition of tree length.
Electronics 15 03674 g003
Figure 4. Simulated evolution of the electrical tree in neat PE at (a) 150 s, (b) 300 s, (c) 450 s, (d) 600 s, (e) 750 s, and (f) 767.5 s.
Electronics 15 03674 g004
Figure 5. Evolution of breakdown volume for different times.
Electronics 15 03674 g005
Figure 6. Nanoparticle distributions (upper row) and the corresponding electrical-tree morphologies at the final simulation stage (lower row) in neat PE and PE/Al2O3 nanocomposites containing (a) 0, (b) 2, (c) 4, (d) 6, (e) 8, and (f) 10 vol% Al2O3 nanoparticles. The nanoparticle radius is 50 nm. Blue and red denote the Al2O3 nanoparticles and damaged electrical-tree channels, respectively.
Electronics 15 03674 g006
Figure 7. The breakdown time and fractal dimension of nanocomposites with different volume fraction.
Electronics 15 03674 g007
Figure 8. Electric-field distributions in PE/Al2O3 nanocomposites containing (a) 2, (b) 4, (c) 6, (d) 8, and (e) 10 vol% Al2O3 nanoparticles, and (f) the maximum electric field Emax and mean electric field Emean in the PE matrix as functions of nanoparticle volume fraction.
Electronics 15 03674 g008
Figure 9. Nanofiller distributions (upper row) and the corresponding electrical-tree morphologies at breakdown (lower row) for nanocomposites containing (a) S1, randomly distributed nanoparticles; (b) S2, randomly oriented nanofibers; (c) S3, vertically aligned nanofibers; (d) S4, parallel nanofibers; (e) S5, in-plane arranged nanofibers; (f) S6, randomly oriented nanosheets; and (g) S7, parallel nanosheets. Blue and red denote the nanofillers and damaged electrical-tree channels, respectively. The nanofiller volume fraction is 4 vol% in all cases.
Electronics 15 03674 g009
Figure 10. The evolution of breakdown time and comparison of breakdown time and fractal dimension. (a) The evolution of breakdown volume for nanocomposites doped with different fillers. (b) Comparison of breakdown time and fractal dimension for different kinds of nanocomposites.
Electronics 15 03674 g010
Figure 11. Snapshots of electrical trees and fillers distribution for S1 (a), S4 (b) and S7 (c). The areas with light blue color are nanofillers. The red circle indicates the inhibition effect of nanofillers on electrical tree growth.
Electronics 15 03674 g011
Figure 12. Electrical field distribution for composites with different nanofillers. (a) random nanoparticle, (b) in-plane parallel nanofibers, (c) parallel nanosheets.
Electronics 15 03674 g012
Figure 13. High-throughput computation of breakdown time and electric field for nanocomposites filled with nanosheets of different aspect ratio and orientation angle. (a) distribution of nanofillers, (b) breakdown time, (c) electric field.
Electronics 15 03674 g013
Figure 14. Electrical trees of trilayered and ternary nanocomposites. (a) nanofiller distribution of trilayered nanocomposite, (b) electrical tree morphology of trilayered nanocomposite, (c) nanofiller distribution of ternary nanocomposite, (d) electrical tree morphology of ternary nanocomposite.
Electronics 15 03674 g014
Figure 15. Comparison of breakdown time and fractal dimension of three-layer, ternary and other nanocomposites.
Electronics 15 03674 g015
Disclaimer/Publisher’s Note: The statements, opinions and data contained in all publications are solely those of the individual author(s) and contributor(s) and not of MDPI and/or the editor(s). MDPI and/or the editor(s) disclaim responsibility for any injury to people or property resulting from any ideas, methods, instructions or products referred to in the content.