1. Introduction
LoRa technology has seen rapid adoption in mobile platforms, including ground vehicles, unmanned aerial vehicles (UAVs), and Low Earth Orbit (LEO) satellite constellations [
1,
2,
3]. In high-mobility and LEO satellite scenarios, rapid relative motion introduces pronounced Doppler shifts and time-varying frequency offsets, imposing stringent requirements on receiver synchronization and frequency tracking [
4]. In addition, residual carrier frequency offset (CFO) and sampling time offset (STO) caused by Doppler effects, oscillator mismatch, and imperfect sampling synchronization can degrade the reliability of LoRa demodulation [
4]. Beyond synchronization impairments, satellite communication links may also be affected by electromagnetic interference, and recent studies have explored intelligent signal recognition techniques to enhance the robustness of satellite communication systems [
5]. Therefore, quantitatively characterizing the impact of residual STO and CFO on LoRa error performance is important for the design and evaluation of robust high-mobility communication systems.
Analytical performance modeling provides an efficient approach to evaluating wireless communication systems over a wide range of operating conditions. Although Monte Carlo simulations can accurately reproduce system performance, extensive simulations may become computationally demanding, particularly when multiple system parameters or low error-rate regions are considered. Moreover, simulation-based evaluations generally need to be repeated when system configurations change. In contrast, analytical error-rate expressions provide computationally efficient and reproducible tools for performance prediction, parameter optimization, and system design, while also revealing explicit relationships between physical impairments and communication performance [
6]. Therefore, deriving analytical symbol error rate (SER) expressions for LoRa under synchronization impairments is of both theoretical and practical significance.
The impact of frequency synchronization errors on LoRa has been extensively investigated. Experimental studies have demonstrated that LoRa exhibits considerable robustness against Doppler shifts in mobile and CubeSat communication scenarios. This characteristic enables unrestricted deployment in satellite links at orbital altitudes exceeding 550 km [
7]. However, those studies did not investigate the performance at different fractional CFOs. Considering the effect of fractional CFO on the system, the researchers in [
8] revealed a notable decrease in SER performance as the fractional CFO approached 0.5.
In recent years, considerable research attention has been directed toward synchronization and Doppler compensation for chirp-based communications in highly dynamic satellite scenarios. A chirp-based communication system for LEO satellite IoT has been proposed, which incorporates joint SCFO/STO synchronization and an LRO-assisted dynamic CFO tracking strategy [
4]. Farhat et al. investigated Doppler estimation and compensation techniques for LoRa direct-to-satellite communications, highlighting the importance of accurate Doppler correction in highly dynamic links [
9]. In addition, the optimization of protection intervals for chirp modulation under highly dynamic Doppler and fractional STO has been investigated, revealing that the interplay between residual timing errors and Doppler variation can markedly impair symbol recovery and Doppler tracking performance [
10]. Although the above studies have substantially advanced the understanding of LoRa under CFO, STO, and Doppler effects, most existing works focus on synchronization algorithms, compensation strategies, or the separate analytical treatment of individual impairments. The availability of tractable analytical SER models that explicitly quantify the joint impact of fractional STO and CFO remains limited.
To further explore the performance of LoRa under different scenarios, the authors in [
11] analyzed the bit error rate (BER) of chirp signals under Rayleigh and Additive White Gaussian Noise (AWGN) channels, providing a closed-form approximation for the BER performance of LoRa. To overcome the problem of computational precision and enhance accuracy over a wide BER range, simple asymptotic expressions were proposed for BER performance under Rice and Rayleigh channels in [
12]. For a heavy-multipath channel, simple BER approximations for coherent and non-coherent detection are calculated using the Gaussian Q-function in [
13]. However, they did not take CFO into account. Considering the inevitability of CFO, a closed-form asymptotic SER was introduced to characterize the impact of CFO on LoRa communication in [
14]. It indicates that in cases of large CFO, the error probability was simplified to 1. To further demonstrate the adaptability of LoRa to CFO, symmetric and asymmetric chirp signals were successively introduced in [
2,
15], demonstrating their favorable BER performance and capture capability in IoT applications. In LoRa communication, the impact of STO is as important as the impact of CFO on the system. The authors in [
16] introduced a LoRa interference model, in which the interference with the LoRa signal is neither chip- nor phase-aligned, and derived a corresponding expression for the SER and the frame error rate (FER). However, tractable analytical SER characterization that explicitly quantifies the joint impact of fractional STO and CFO remains insufficiently explored.
The primary objective of this work is to isolate and quantitatively characterize the performance degradation caused by fractional STO and CFO. Therefore, an AWGN channel is considered to separate the effects of synchronization impairments from other channel-dependent factors, such as multipath fading and shadowing. This assumption enables a tractable analytical derivation and provides a baseline framework for investigating the intrinsic impact of STO and CFO on the SER performance of LoRa systems.
Integer STO and CFO mainly result in shifts in the demodulated spectral peak, whereas their fractional components cause signal energy to leak into multiple FFT bins. Other frequency bins may exhibit higher levels of energy due to effects such as energy leakage and noise, leading to potential misdetection in signal detection. Furthermore, second-order Doppler drift exacerbates misdetection issues. Addressing this mandates the activation of Low Rate Optimization (LRO) [
17]. Crucially, deriving approximate SER bounds that account for the joint presence of STO and CFO is therefore required. The main contributions of this paper are summarized as follows:
A quantitative analysis of fractional STO and CFO interference is presented, culminating in the derivation of approximate SER bounds as a function of Spreading Factor (SF), STO, and CFO. Extensive simulations affirm the efficacy of these bounds under diverse parameter configurations.
By widening the frequency spacing of legitimate signals, LRO enhances detection robustness. We interpret the design rationale behind LRO and utilize the proposed analytical framework to rigorously evaluate its performance improvements.
3. Analysis of LoRa Performance
3.1. Analysis of Fractional STO and CFO Impact
After passing through the channel and with normalized STO
and CFO
, where
is the STO value and
is the CFO value, the FFT output
can be expressed as
where
is the FFT output without noise, which can be written as
where
and
According to (7), we can find that the STO and CFO can be expressed as deviations from the initial frequency offset, indicating that STO and CFO have an equivalent impact on LoRa. In addition, when the normalized STO
and CFO
are integers, the entire energy concentrated at the
-th bin leaks into the
-th bin, indicating that integer STO and CFO do not disperse energy across the entire demodulation domain. When considering the energy leakage caused by fractional STO and CFO, we derive an expression for the FFT output without noise at
-th bin.
where
is the distance between
-th bin and
-th bin. To evaluate the extent of energy leakage, we define
as follows:
Specifically, when there is no CFO, i.e.,
, (11) can be rewritten as
According to (12), we can find that is independent of transmitted symbol , indicating that the SER performance of the LoRa system is independent of . Moreover, the variation of primarily depends on . Consequently, the smaller the value of , the smaller the value of , which indicates that the amplitude of the frequency bins near the -th bin is larger. In addition, since , the LoRa system has the same SER when the STOs are and .
Therefore, the FFT output for a given transmitted symbol
can be written as
3.2. Approximate SER Bounds
The detection error occurs when the peak index of the FFT output
is different from the transmitted symbol
. Therefore, the SER with non-coherent detection can be calculated by
Since the probability of
being equal to
is extremely low and its impact on performance is negligible, we only consider the case where
is greater than
. According to (13),
consists of a deterministic energy-leakage component
and an additive complex Gaussian noise component, and therefore its magnitude follows a Rician distribution. When the deterministic leakage component is sufficiently strong relative to the noise component, the Rician distribution becomes concentrated around its deterministic component and can be approximated by a Gaussian distribution. This approximation has been adopted in previous analytical studies of LoRa error performance [
19,
20].
Conversely, when the deterministic leakage component is sufficiently weak compared with the noise component, the FFT-bin output is dominated by the complex Gaussian noise, and its magnitude approaches a Rayleigh distribution. Therefore, following the interference-driven/noise-driven classification adopted in previous LoRa performance analyses [
20], the FFT bins are divided into two categories according to the relative strength of the leakage component.
In the present formulation, the energy-leakage ratio defined in (11) is employed as a computationally convenient indicator for this classification. Based on numerical evaluations of the corresponding distribution fitting, a threshold of 10 dB is adopted as an empirical classification criterion. This threshold is not intended to represent a universal theoretical boundary of the Rician distribution, but provides a practical trade-off between approximation accuracy and analytical tractability for the considered system.
For leakage-dominated category I, when , can be regarded as a Gaussian distribution. The mean and variance of the Gaussian distribution are given by and . For the noise-dominated category II, when , can be approximated as a Rayleigh distribution with the scale parameter .
For the noise-dominated bins, the instantaneous maximum of the Rayleigh-distributed variables remains random. To obtain a tractable analytical SER expression, this random maximum is replaced by a representative deterministic value following the approximation adopted in [
20]. Accordingly,
where
depicts the
-th harmonic number, and
is the number of elements in category II. Therefore, the SER in (14) can be rewritten as
where the
and
are the error probabilities for category I and II, respectively.
where
is
-function and the expression for
. is as follows
Therefore, (16) can be further written as follows
3.3. Analysis of LRO
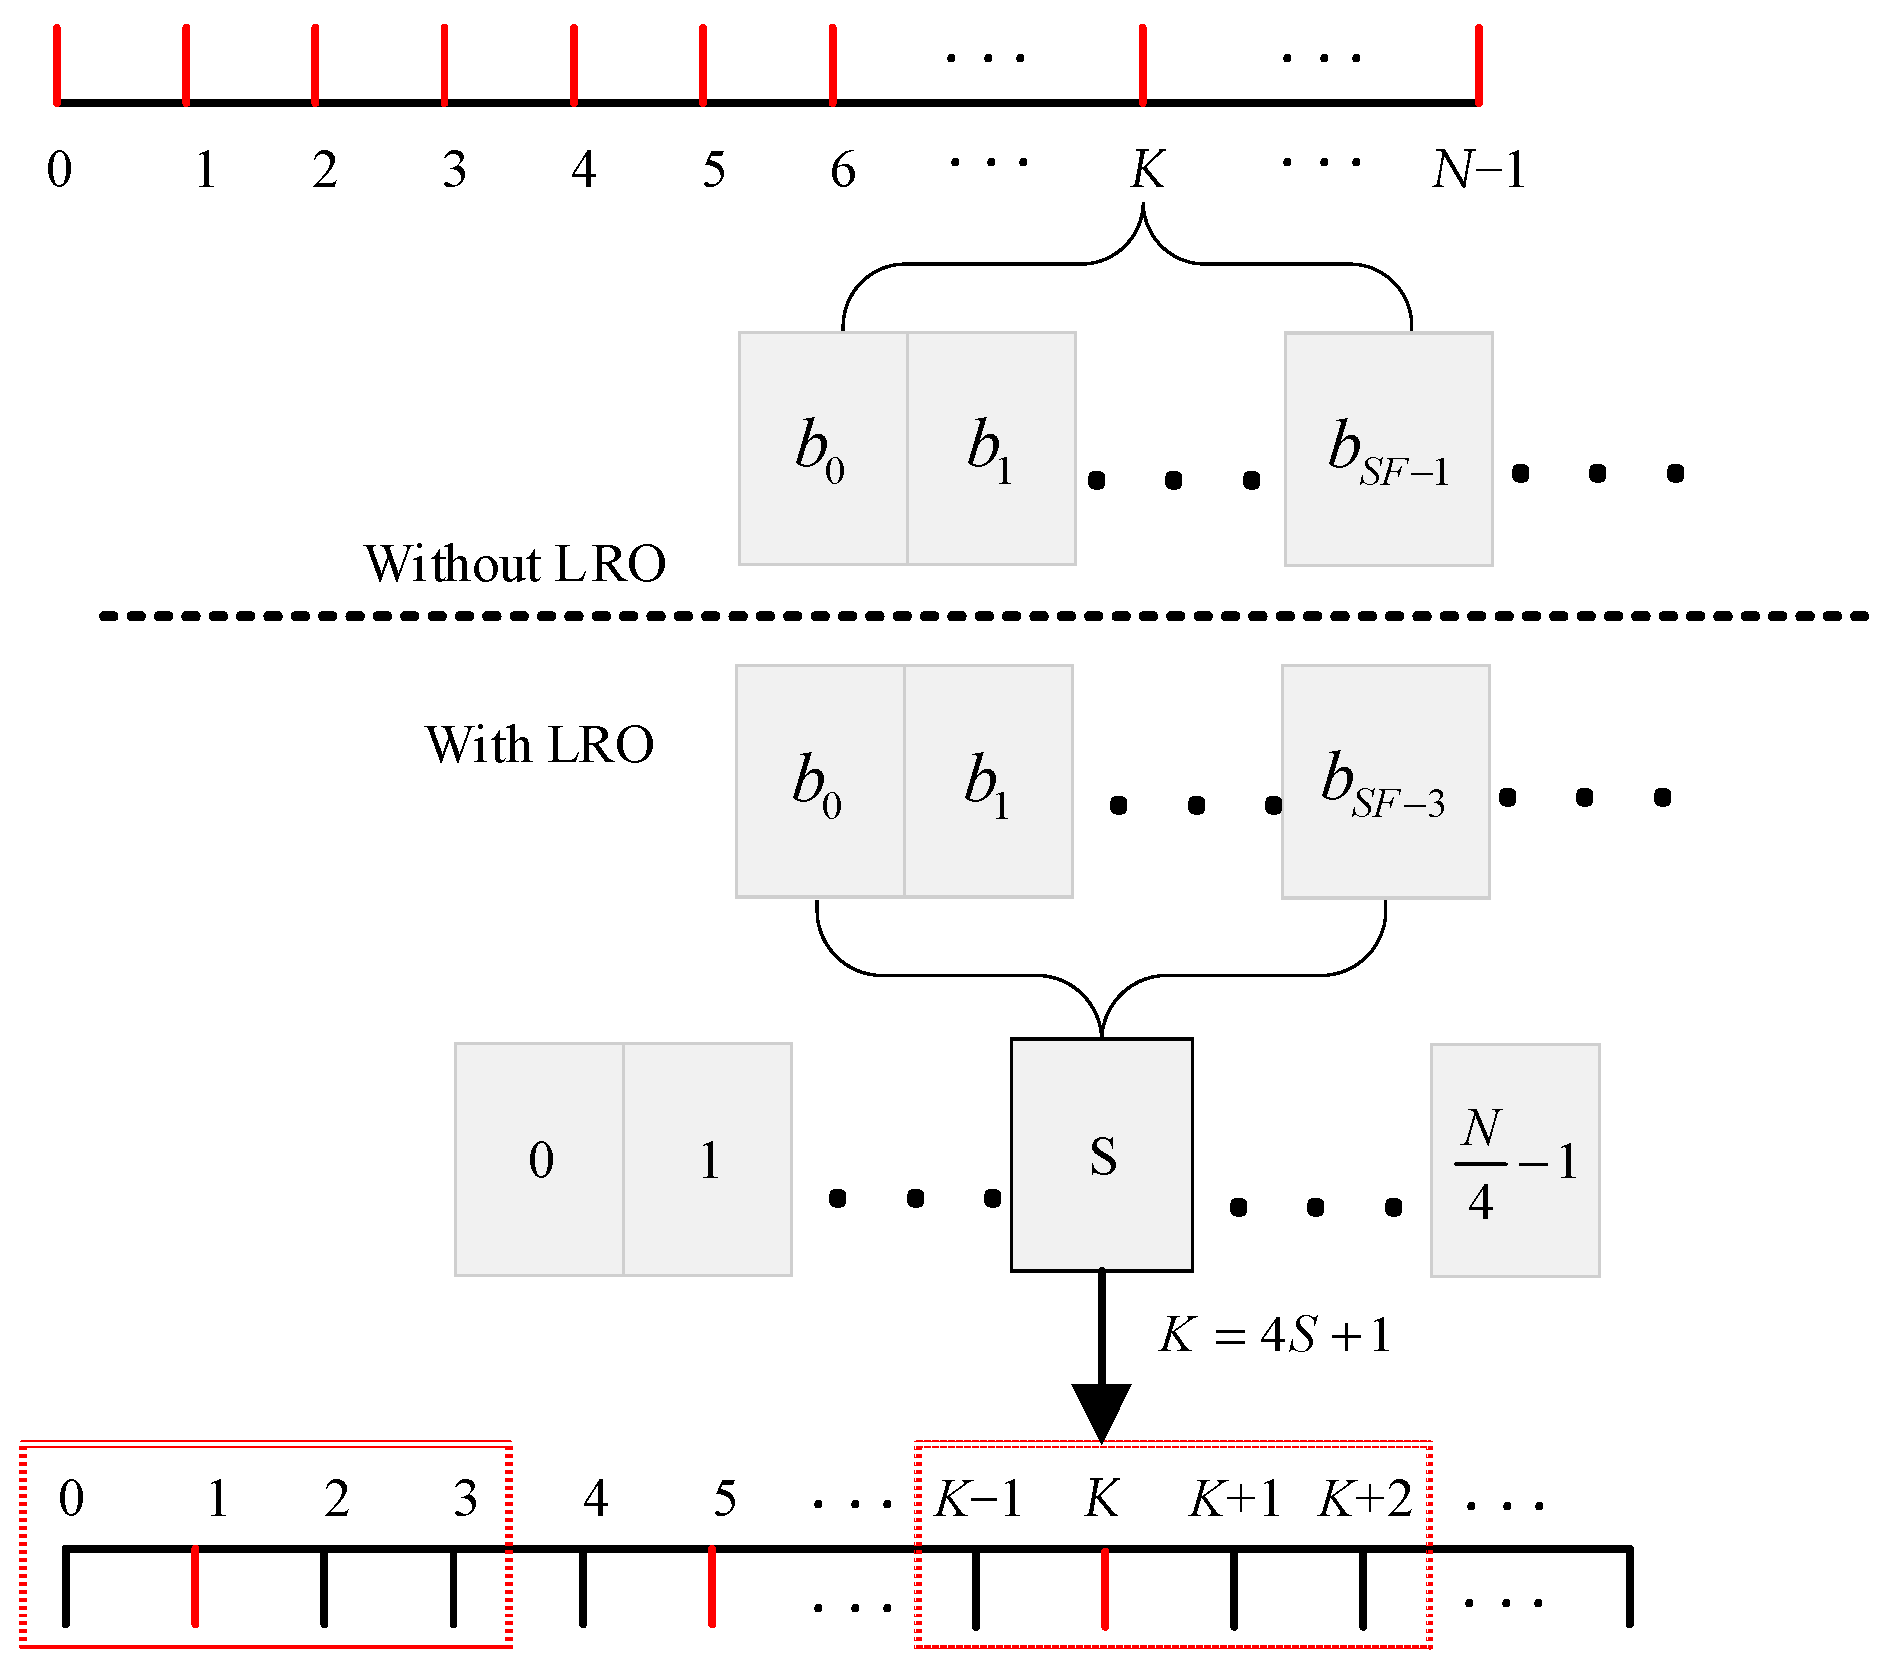
Low Rate Optimization is employed to enhance LoRa signal robustness by increasing the frequency separation between legitimate channels. This technique involves grouping each of
information bits into a packet and mapping them to a symbol index
. Within this framework, if the estimated symbol
is
, the error can be corrected because
remains within the legal frequency range of
. Although LRO reduces the overall data rate, the inclusion of a guard interval significantly mitigates detection errors. Therefore, the approximate SER bounds can be expressed as
4. Simulation Results
In this section, we construct a physical layer simulation model for the LoRa system.
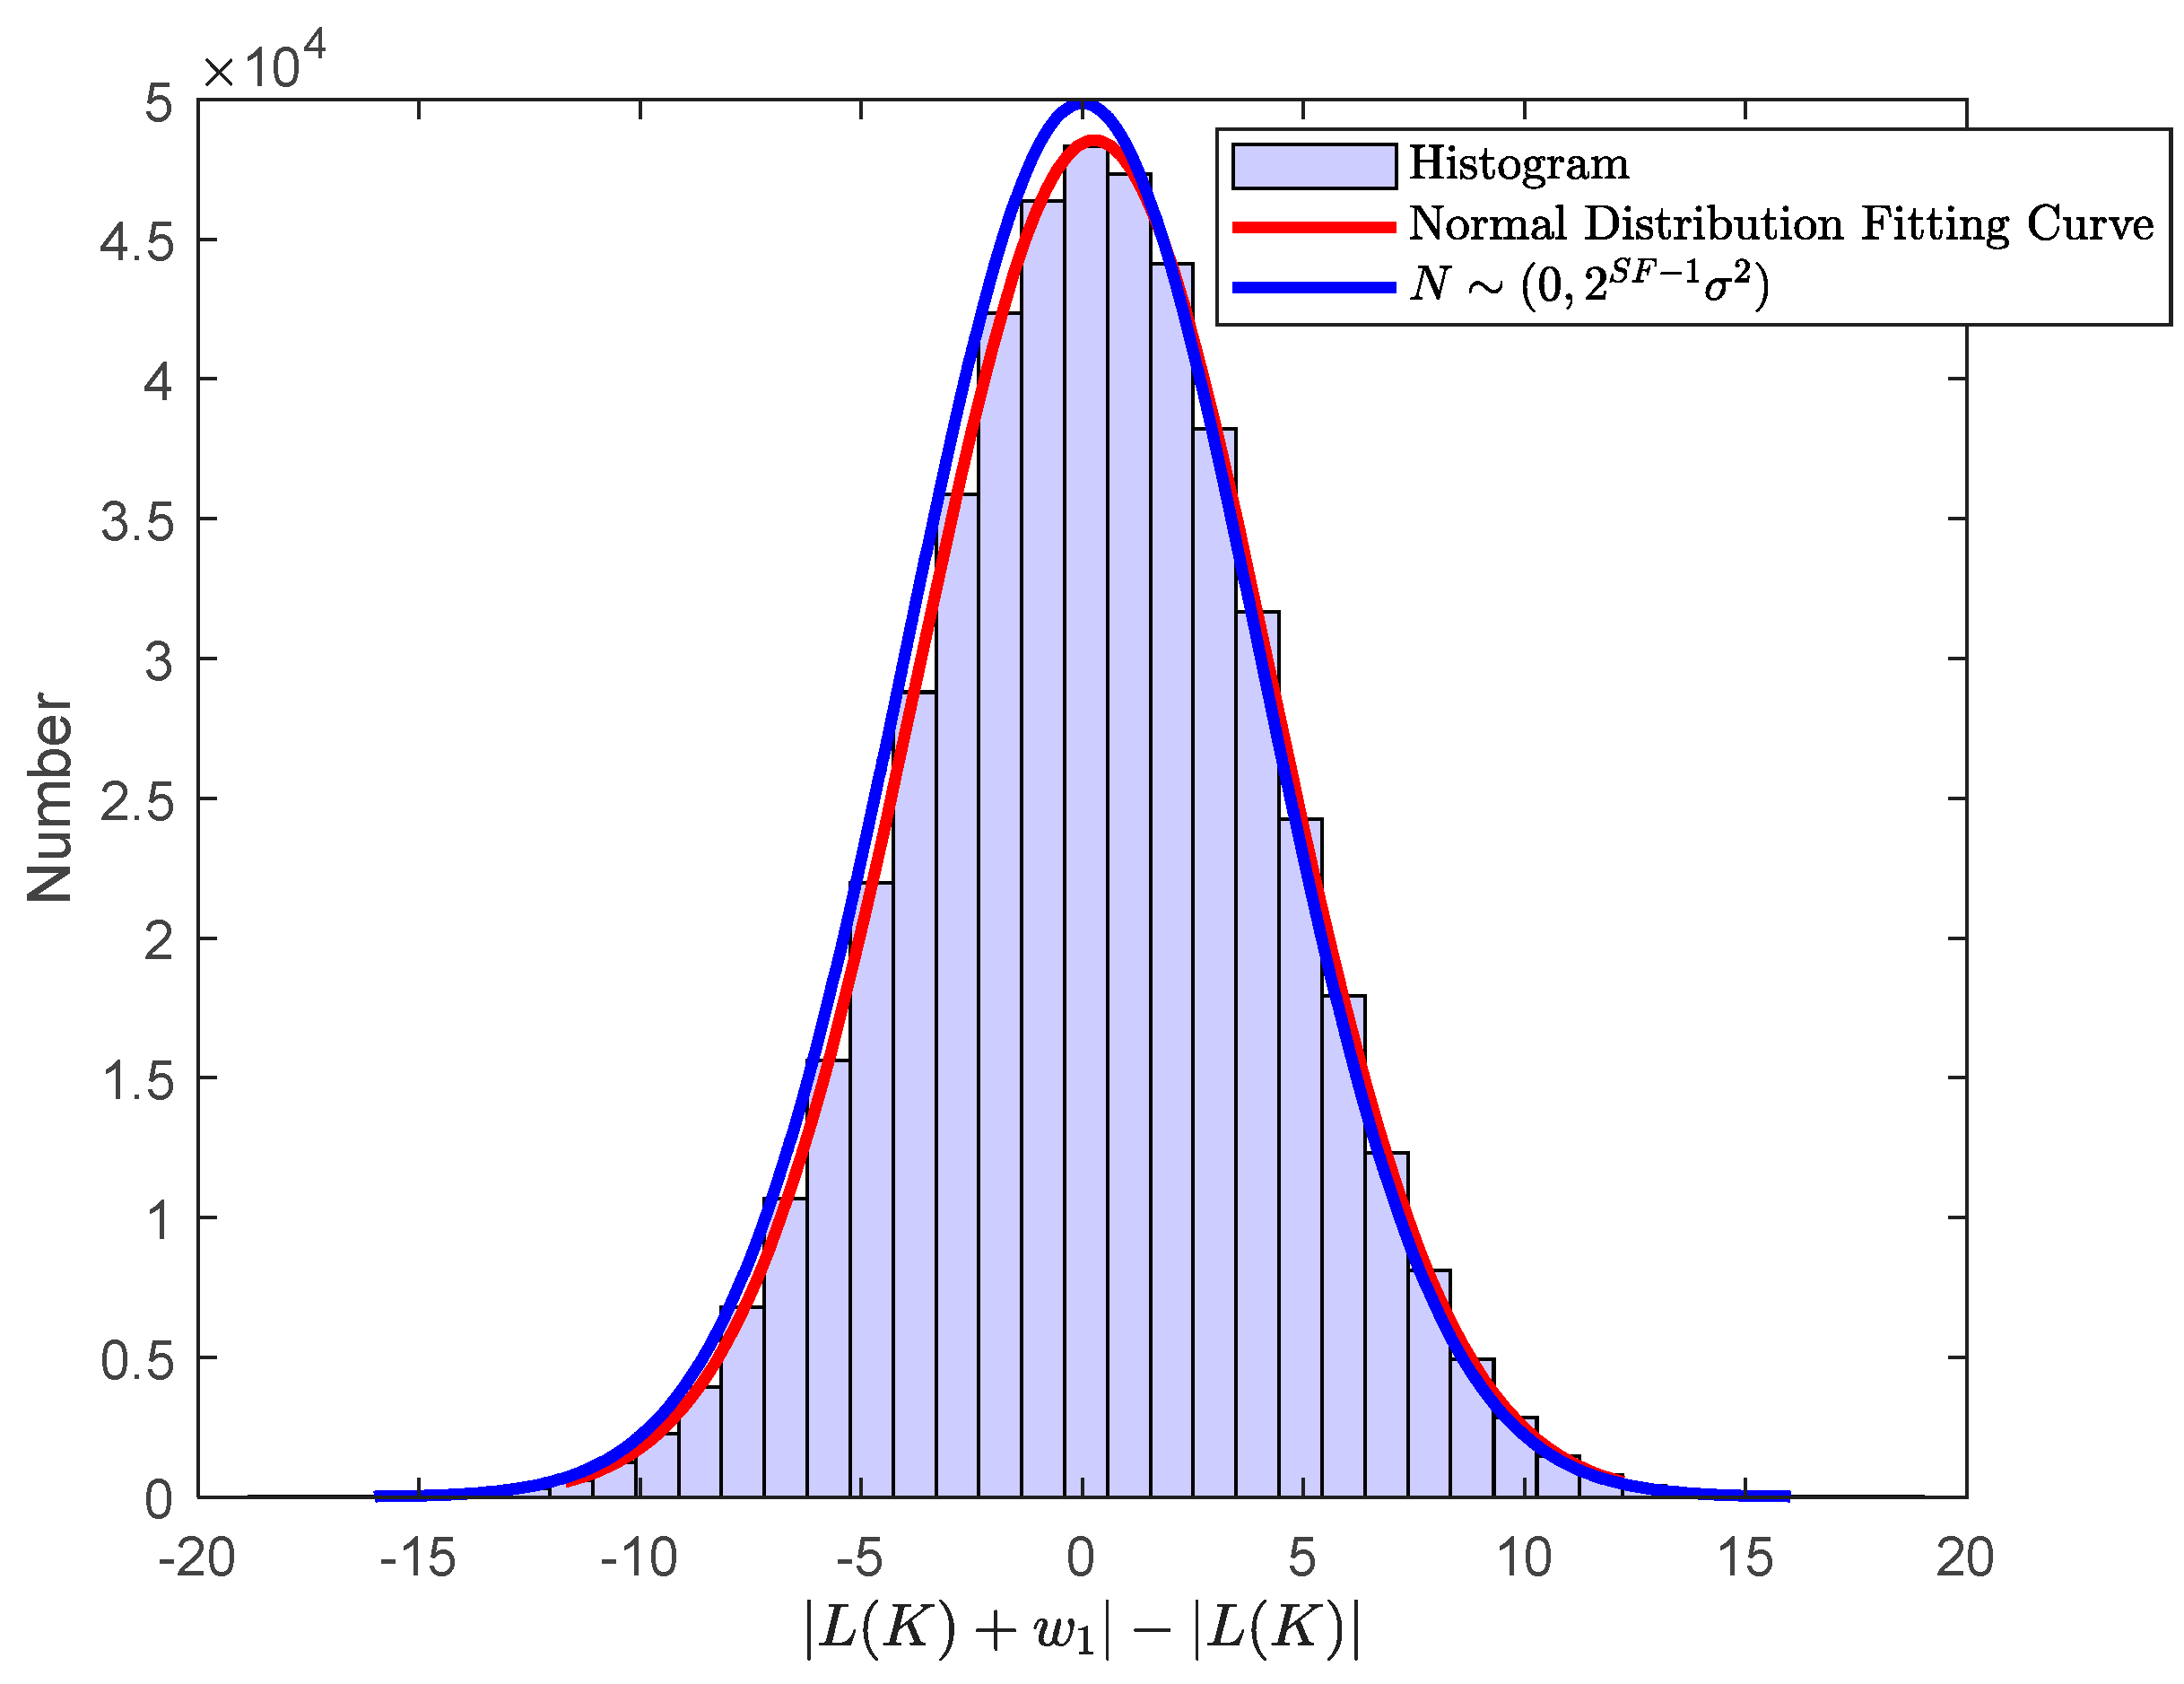
Figure 2 first validates the Gaussian approximation used in deriving the analytical SER expression. The approximate SER curves in
Figure 3,
Figure 4 and
Figure 5 and the non-LRO curves in
Figure 6 and
Figure 7 are calculated using (19), whereas the approximate SER curves with LRO in
Figure 6 and
Figure 7 are calculated using (20).
Figure 2 separately validates the Gaussian approximation used in deriving the analytical SER expression. The simulation parameters are summarized in
Table 2.
In
Figure 2, we conducted simulations of the fitted curves in (18) with
, spreading factor
, bandwidth
, STO
, and CFO
. We can find that when
,
could be regarded as a Gaussian distribution with mean
and variance
. This result is significant as it not only verifies the validity of (18) but also establishes a foundational framework for deriving approximate SER bounds under diverse scenarios.
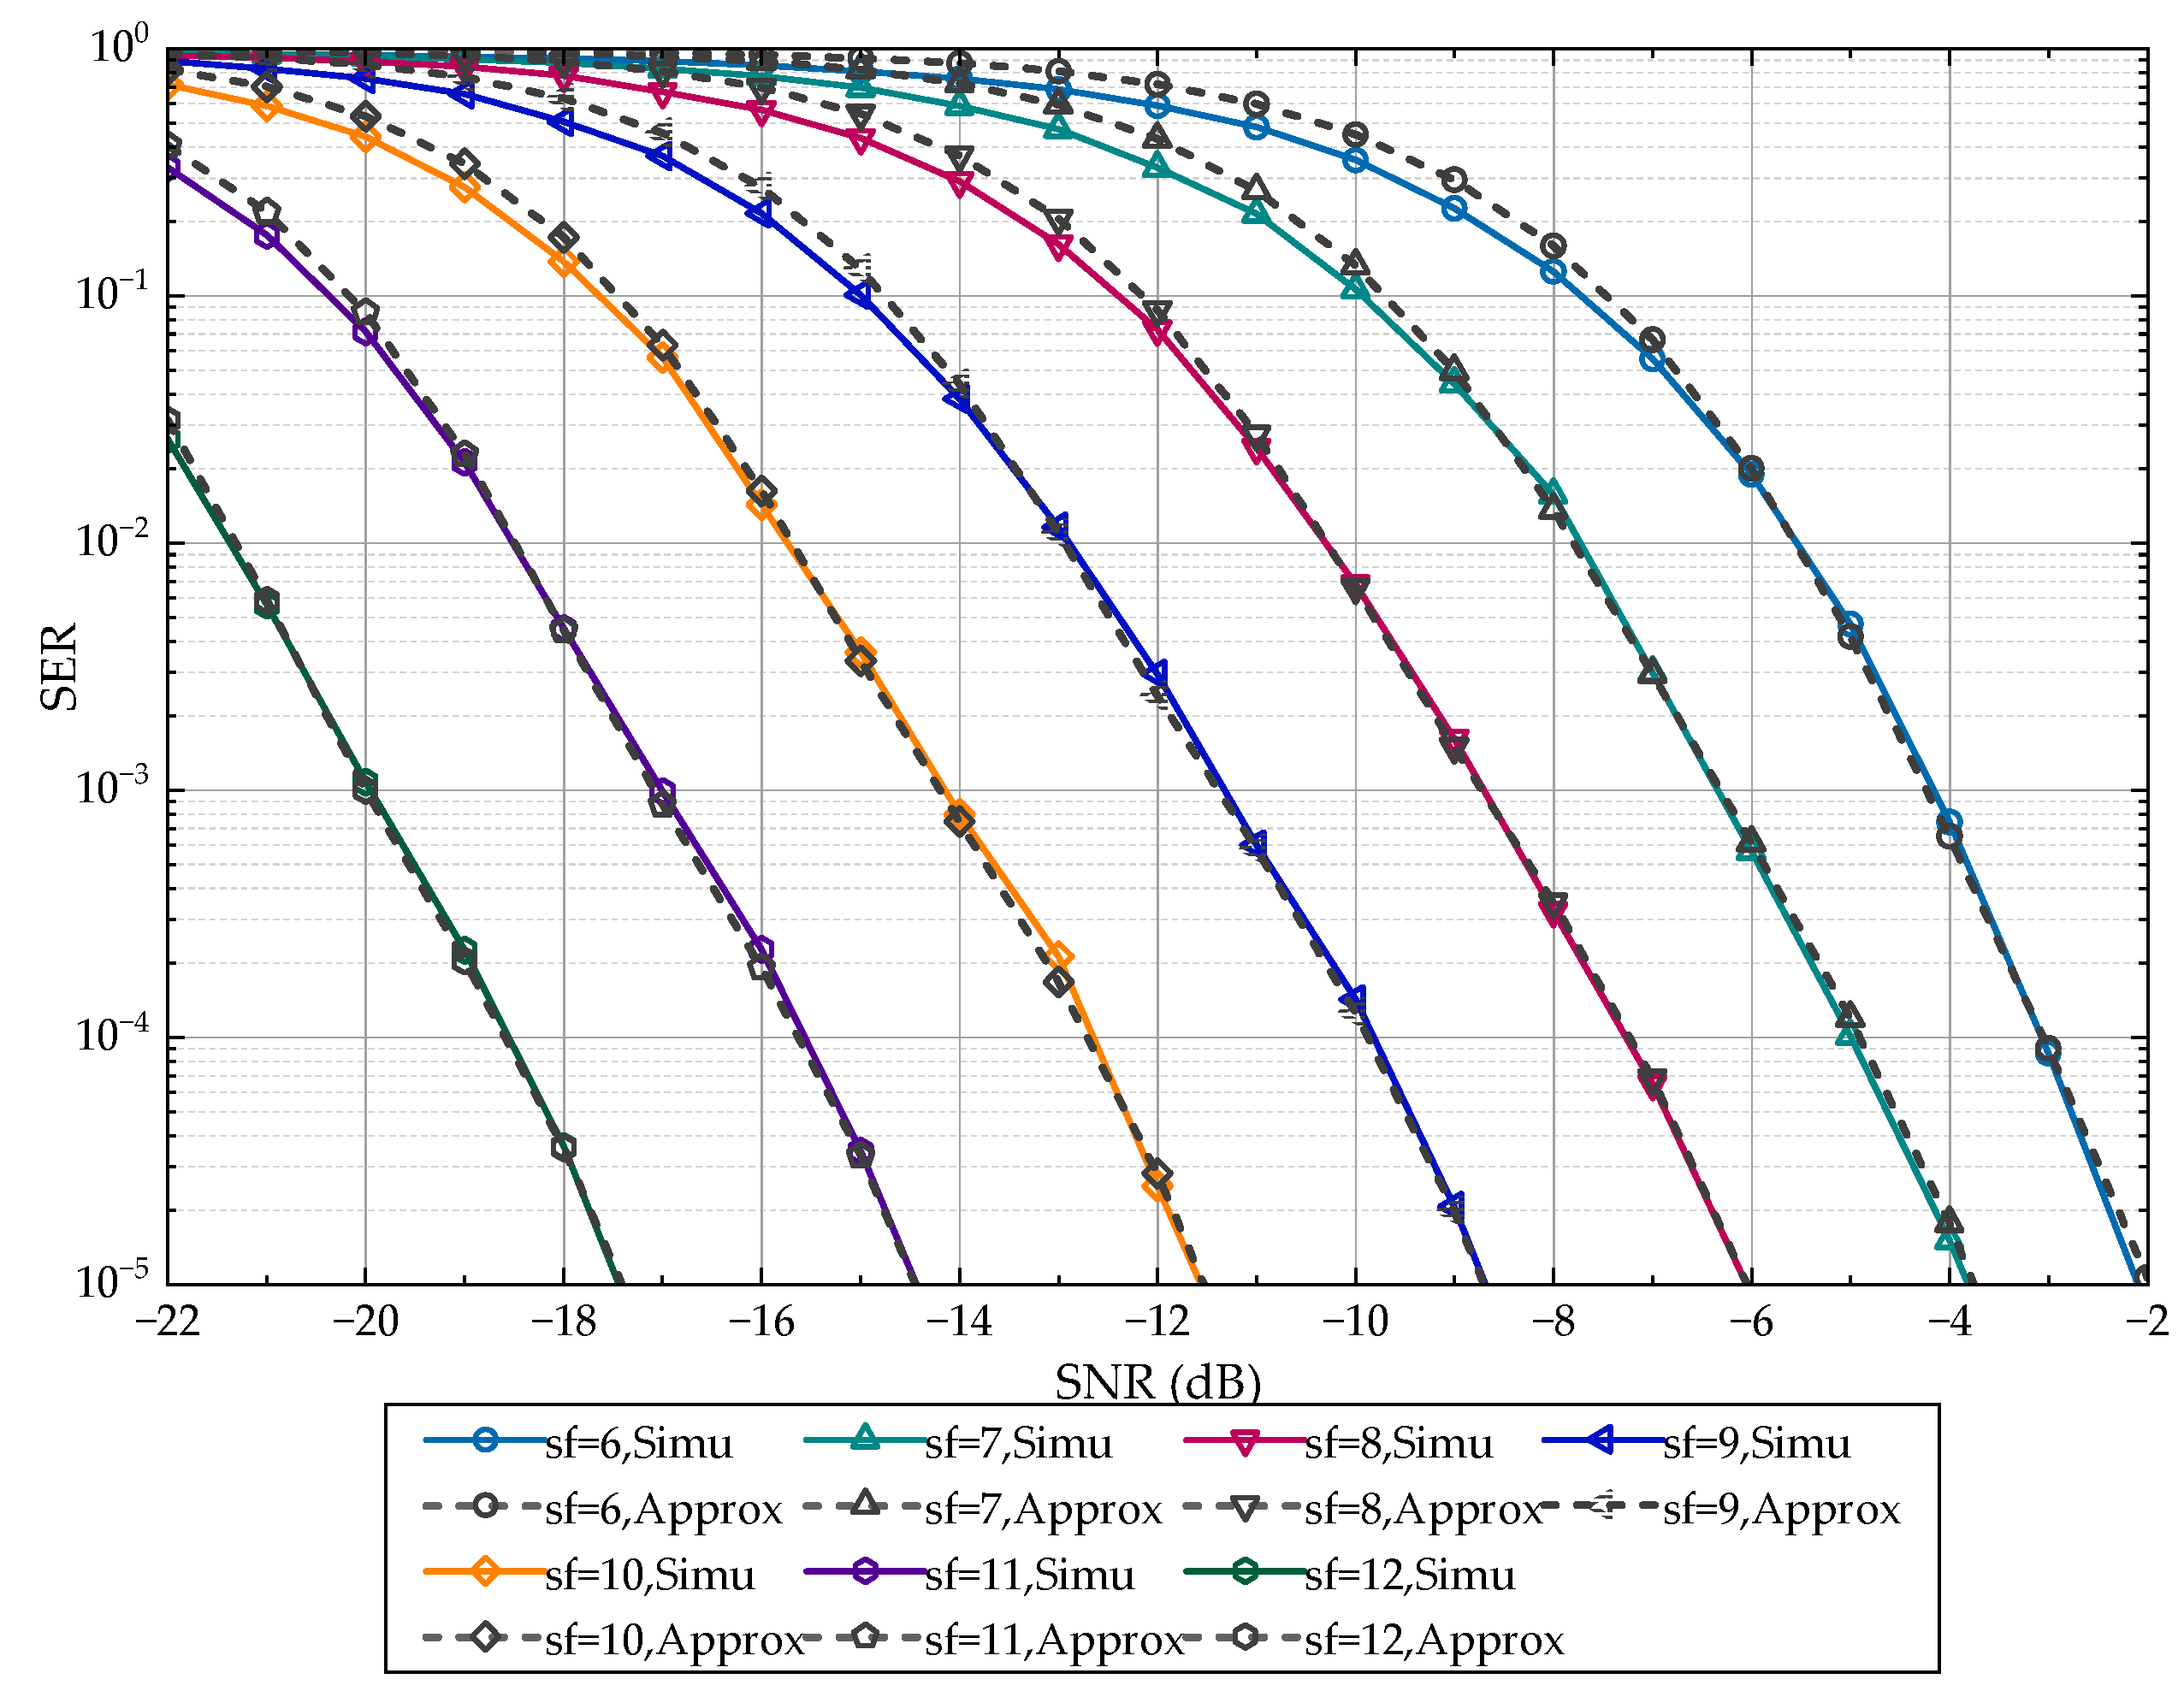
Figure 3 illustrates the approximate SER bounds for different
with STO
, CFO
and bandwidth
. To verify the effectiveness of the approximate SER bounds under different
, we added the simulated SER performance as a comparison. It is evident that the approximate SER bounds closely match the simulated SER for various
at high SNRs. However, there are some errors at low SNRs, mainly due to the fact that when
,
is simply considered a constant. Moreover, the SER performance improves as the
increases from 6 to 12. Similar results can be obtained from (11), when
increases,
increases for the same
. This implies that less energy is spread from the
-th bin, leading to a smaller chance of misdetection.
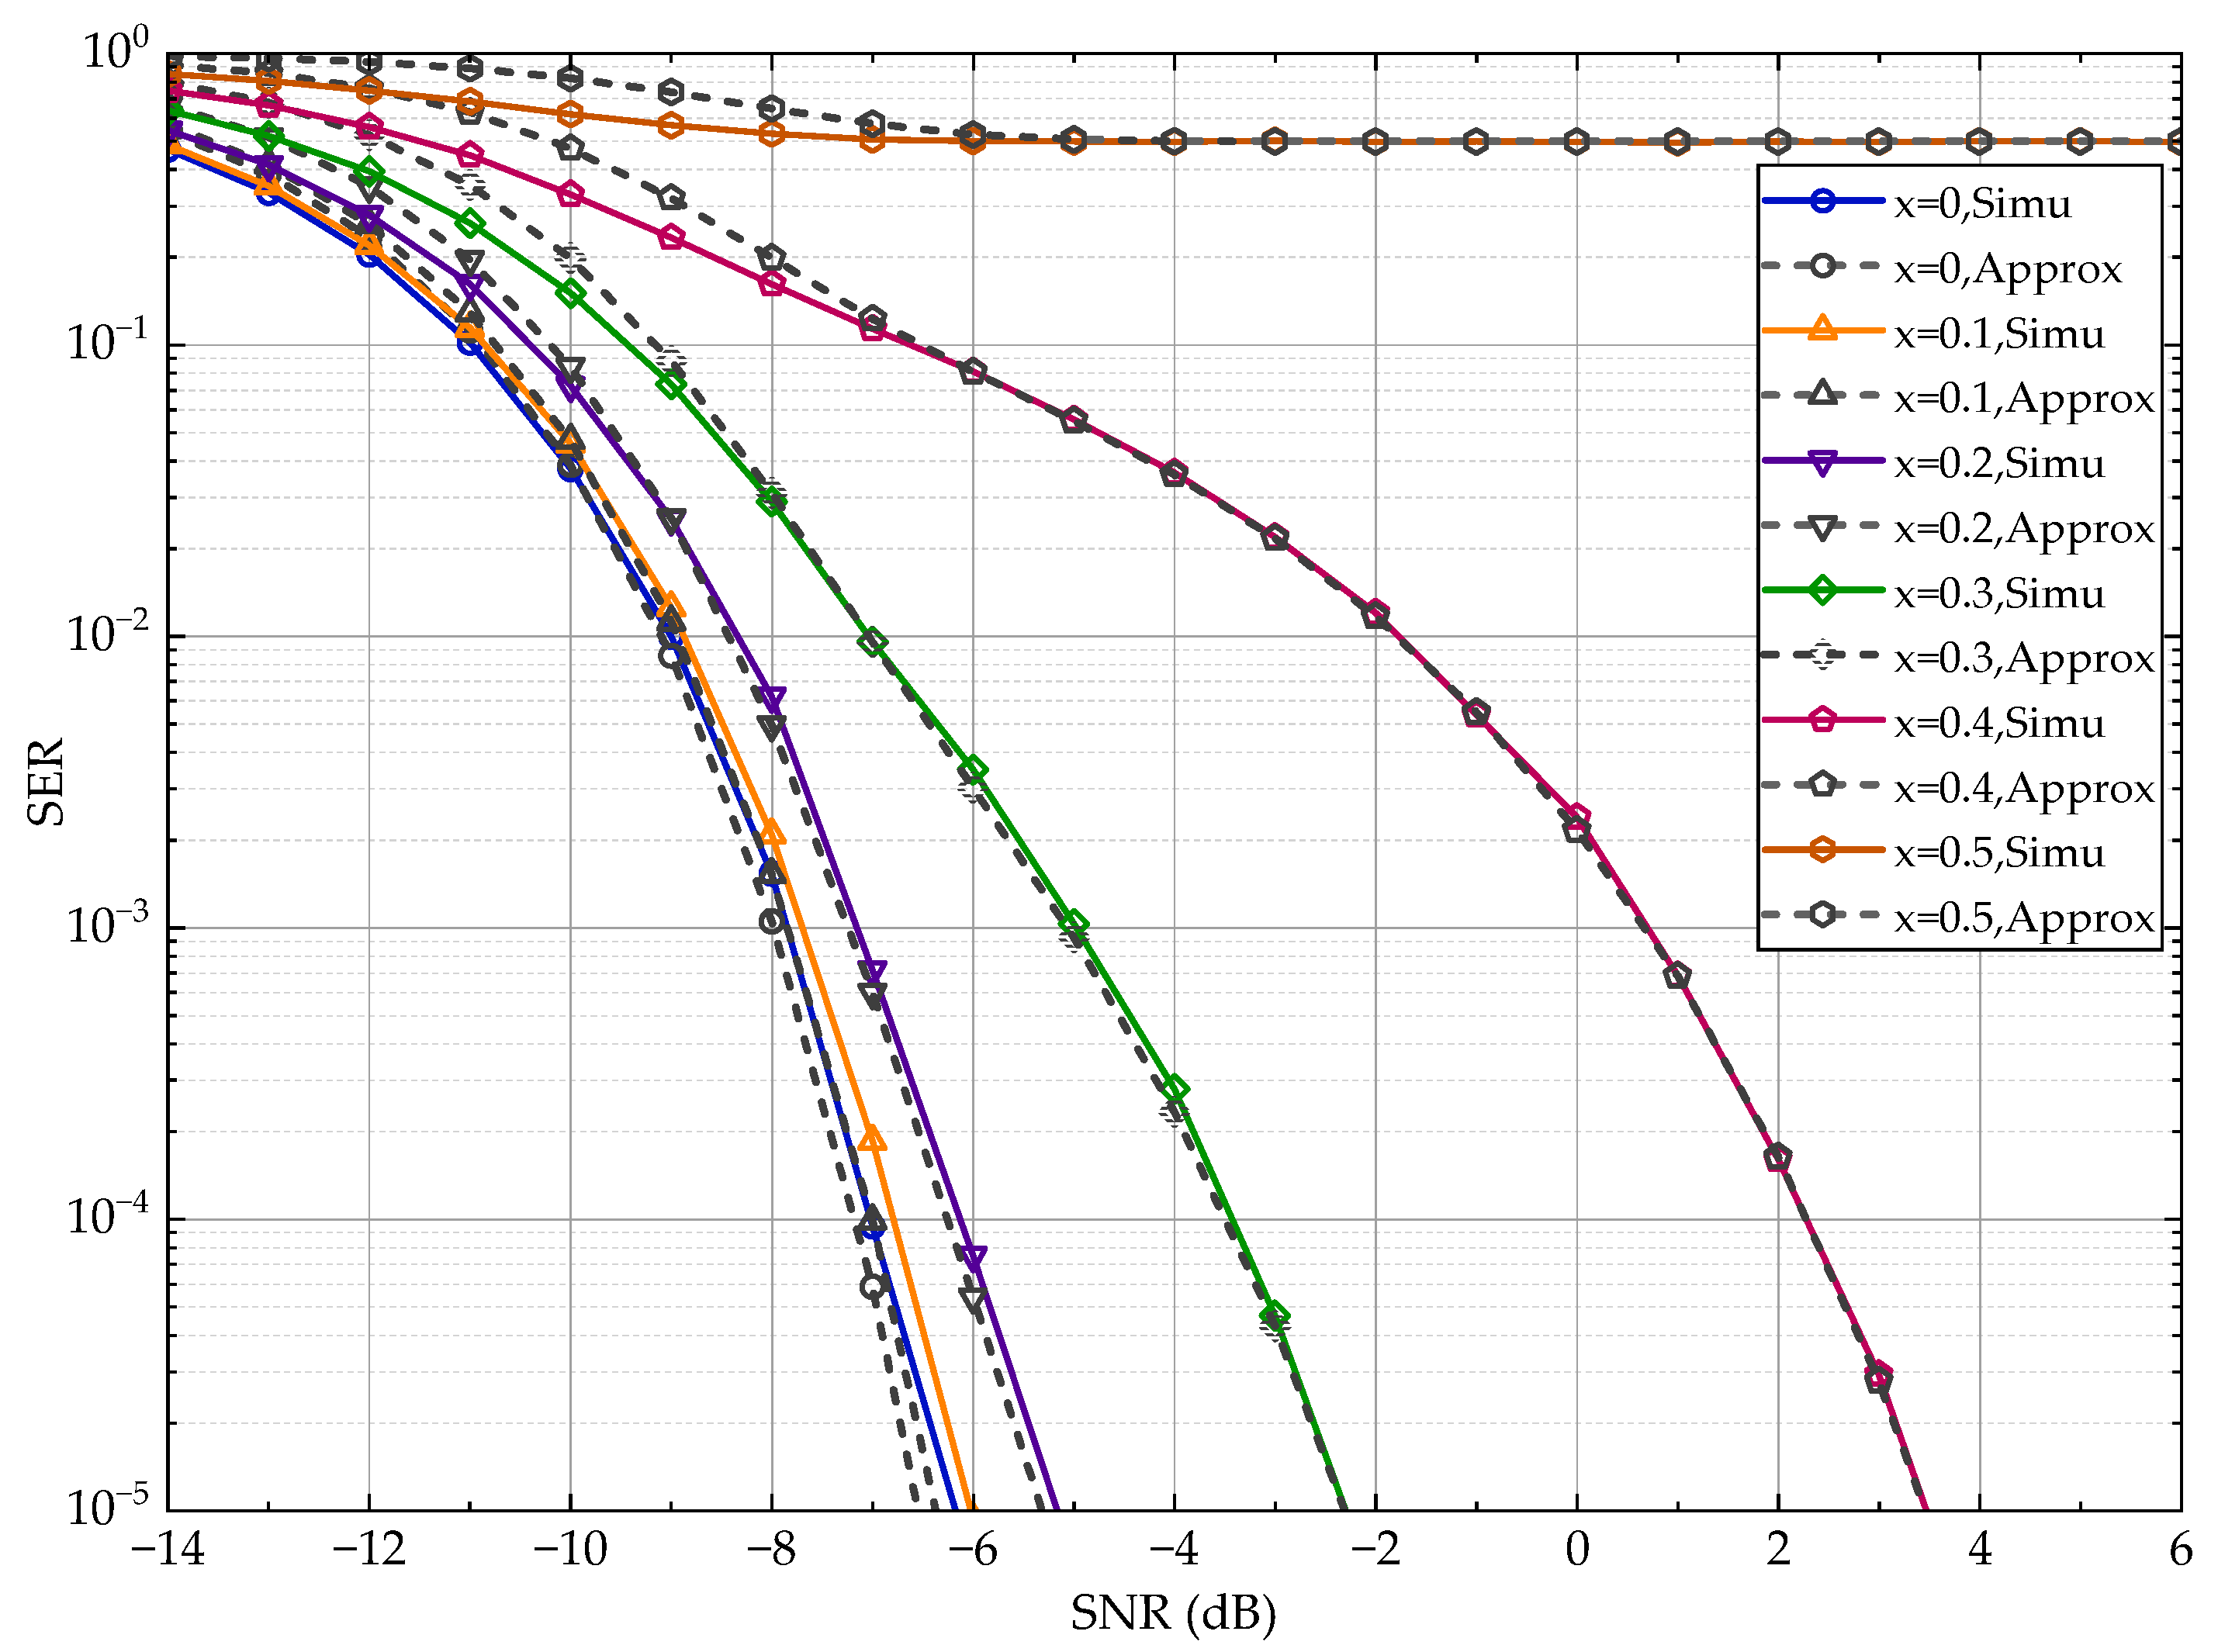
Figure 4 illustrates the impact of different fractional STOs on the SER performance with spreading factor
, CFO
and bandwidth
. According to (12), the LoRa system has the same SER when the fractional STOs are
and
. Consequently, we specifically simulated the SER performance only considering fractional STOs
. It is evident that the SER performance gradually decreases as the fractional STO
increases. Similar results can be obtained from (12), where an increase in fractional STO
leads to a decrease in
. This implies that more energy is spread from
-th bin, increasing the probability of a detection error. Specifically, at the fractional STO
, the calculation from (12) results in
, indicating that the energy in the
-th bin is comparable to that in a neighboring frequency bin. In this scenario, the judgment relies on noise only. Therefore, regardless of the degree to which the SNR is improved, the SER remains approximately 0.5. Therefore, the timing detection should guarantee that the timing error is smaller than 0.5.
In
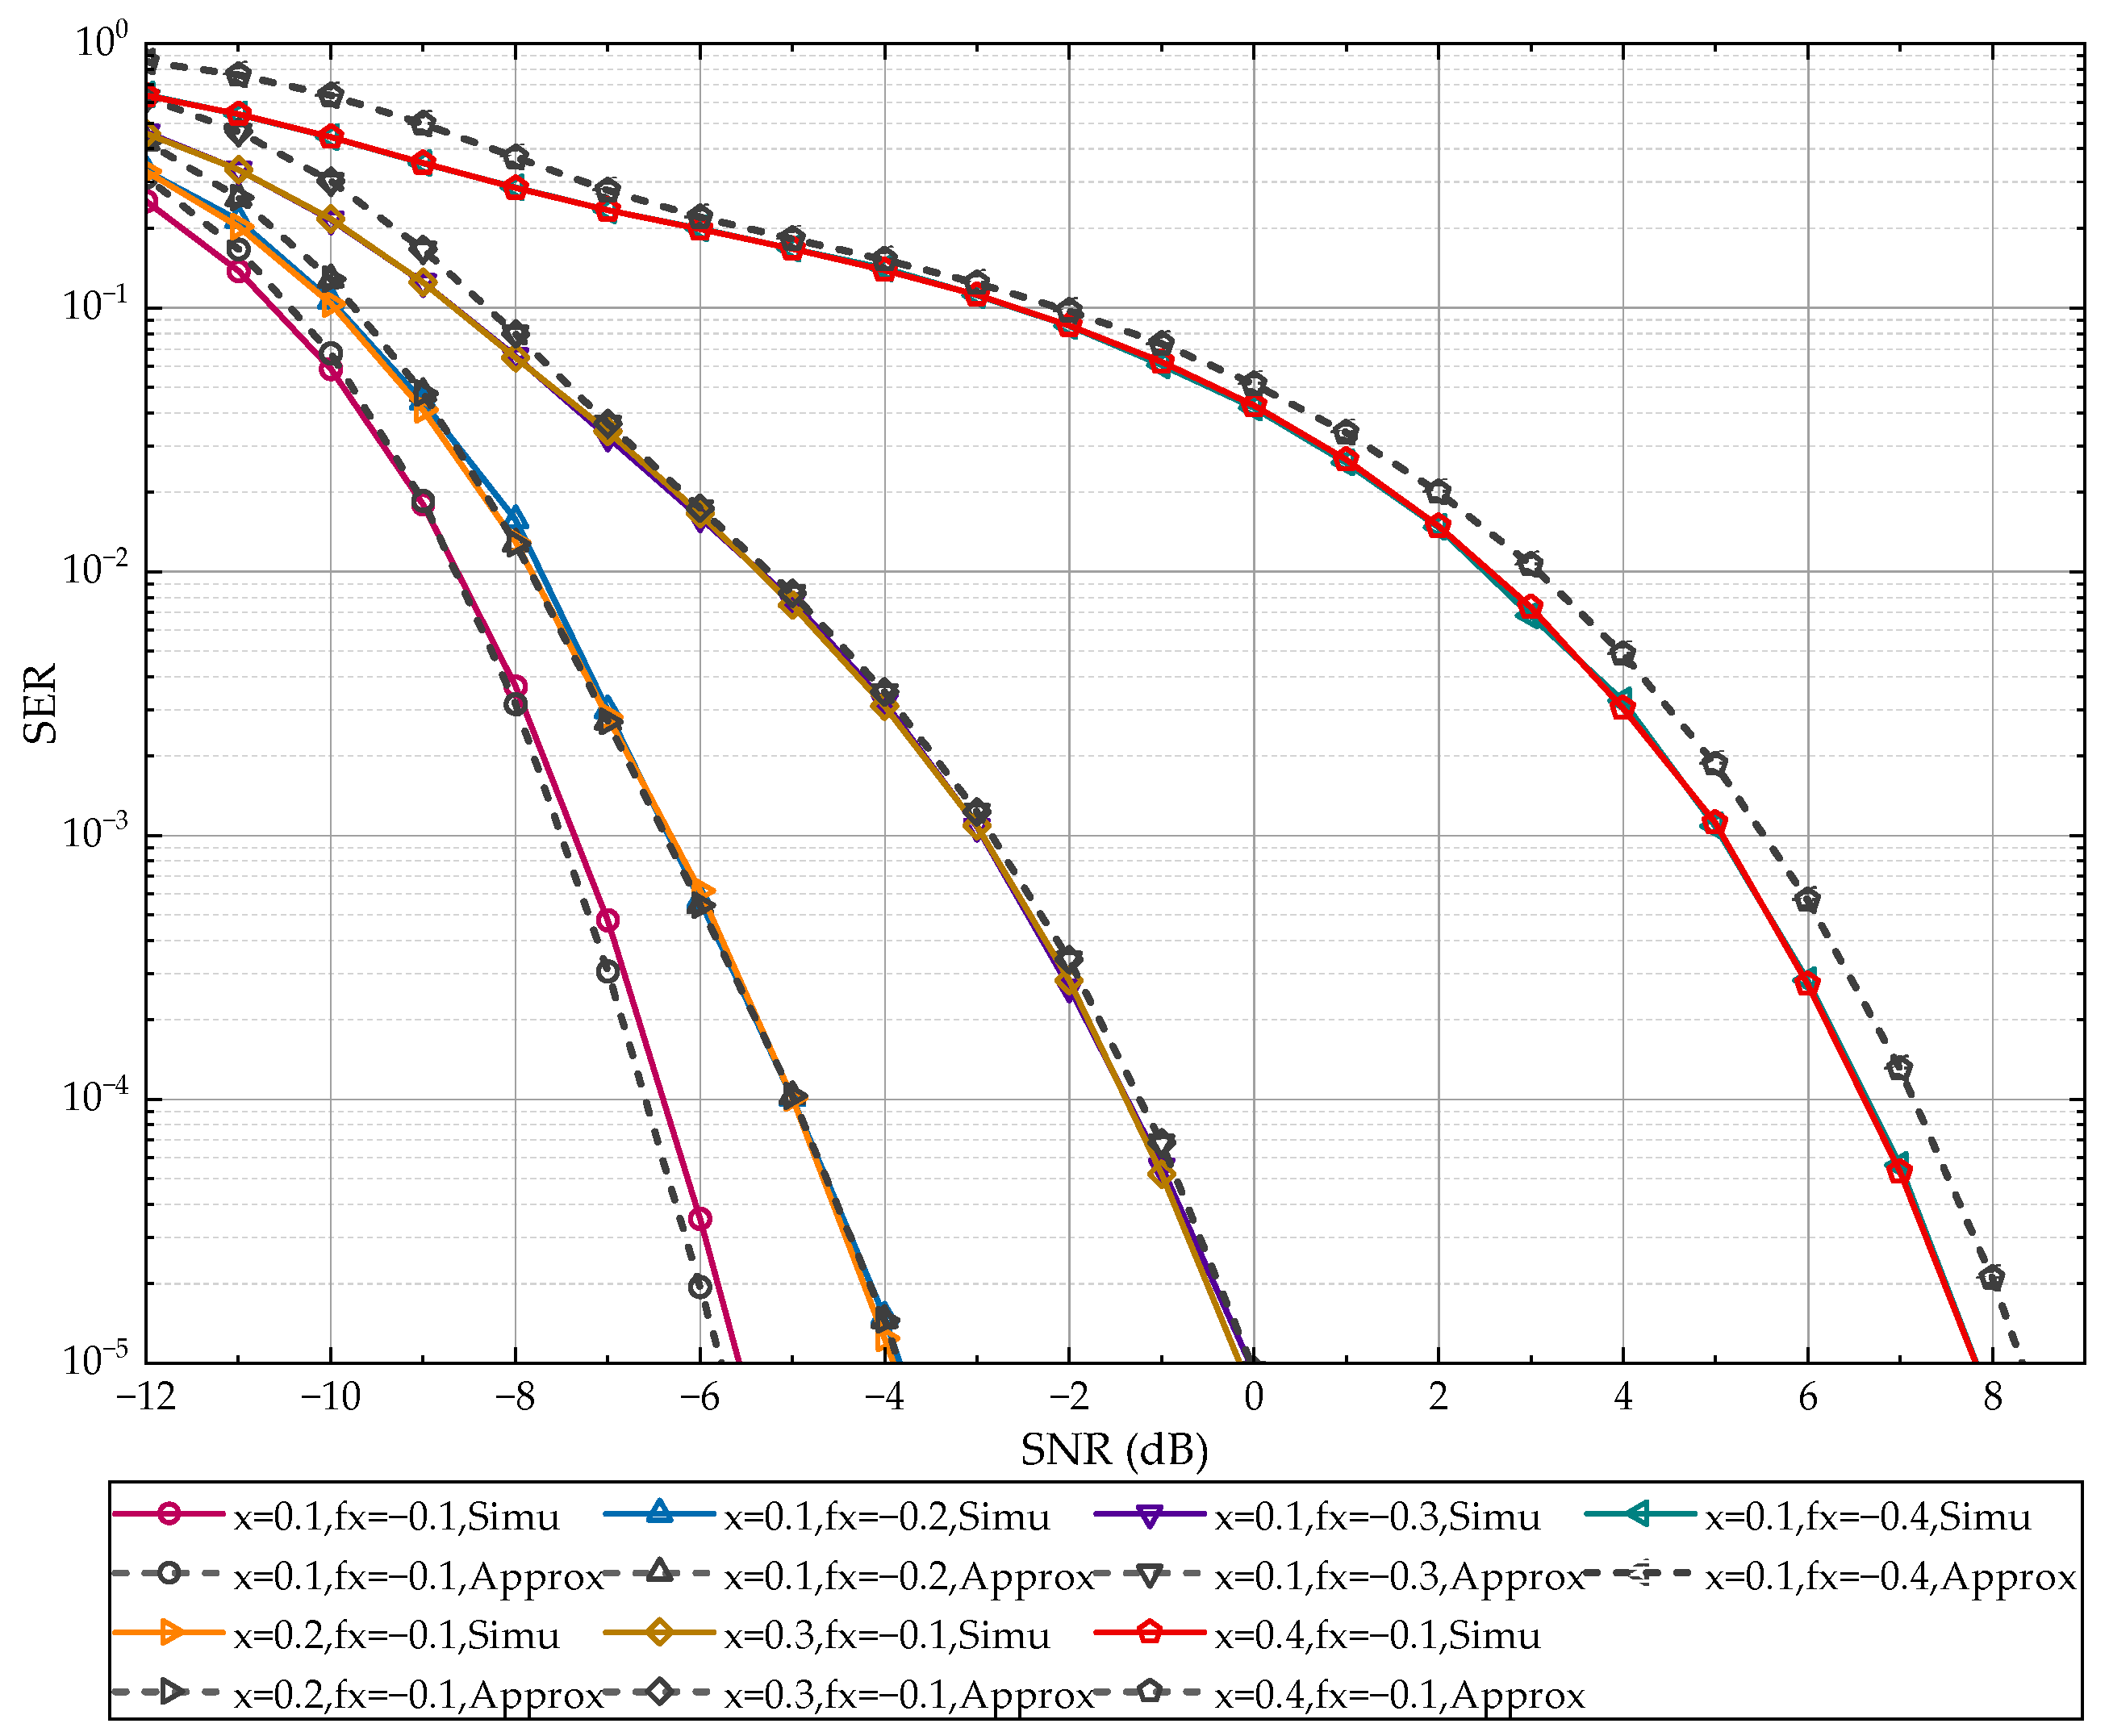
Figure 5, we compare approximate SER bounds with the simulated SER for different fractional STOs and fractional CFOs, using spreading factor
and bandwidth
. It is clear that when the fractional CFO is fixed, a larger fractional STO results in poorer SER performance. Similar conclusions can be drawn when the fractional STO is fixed. Additionally, exchanging the values of fractional STO and fractional CFO leads to approximately the same SER performance.
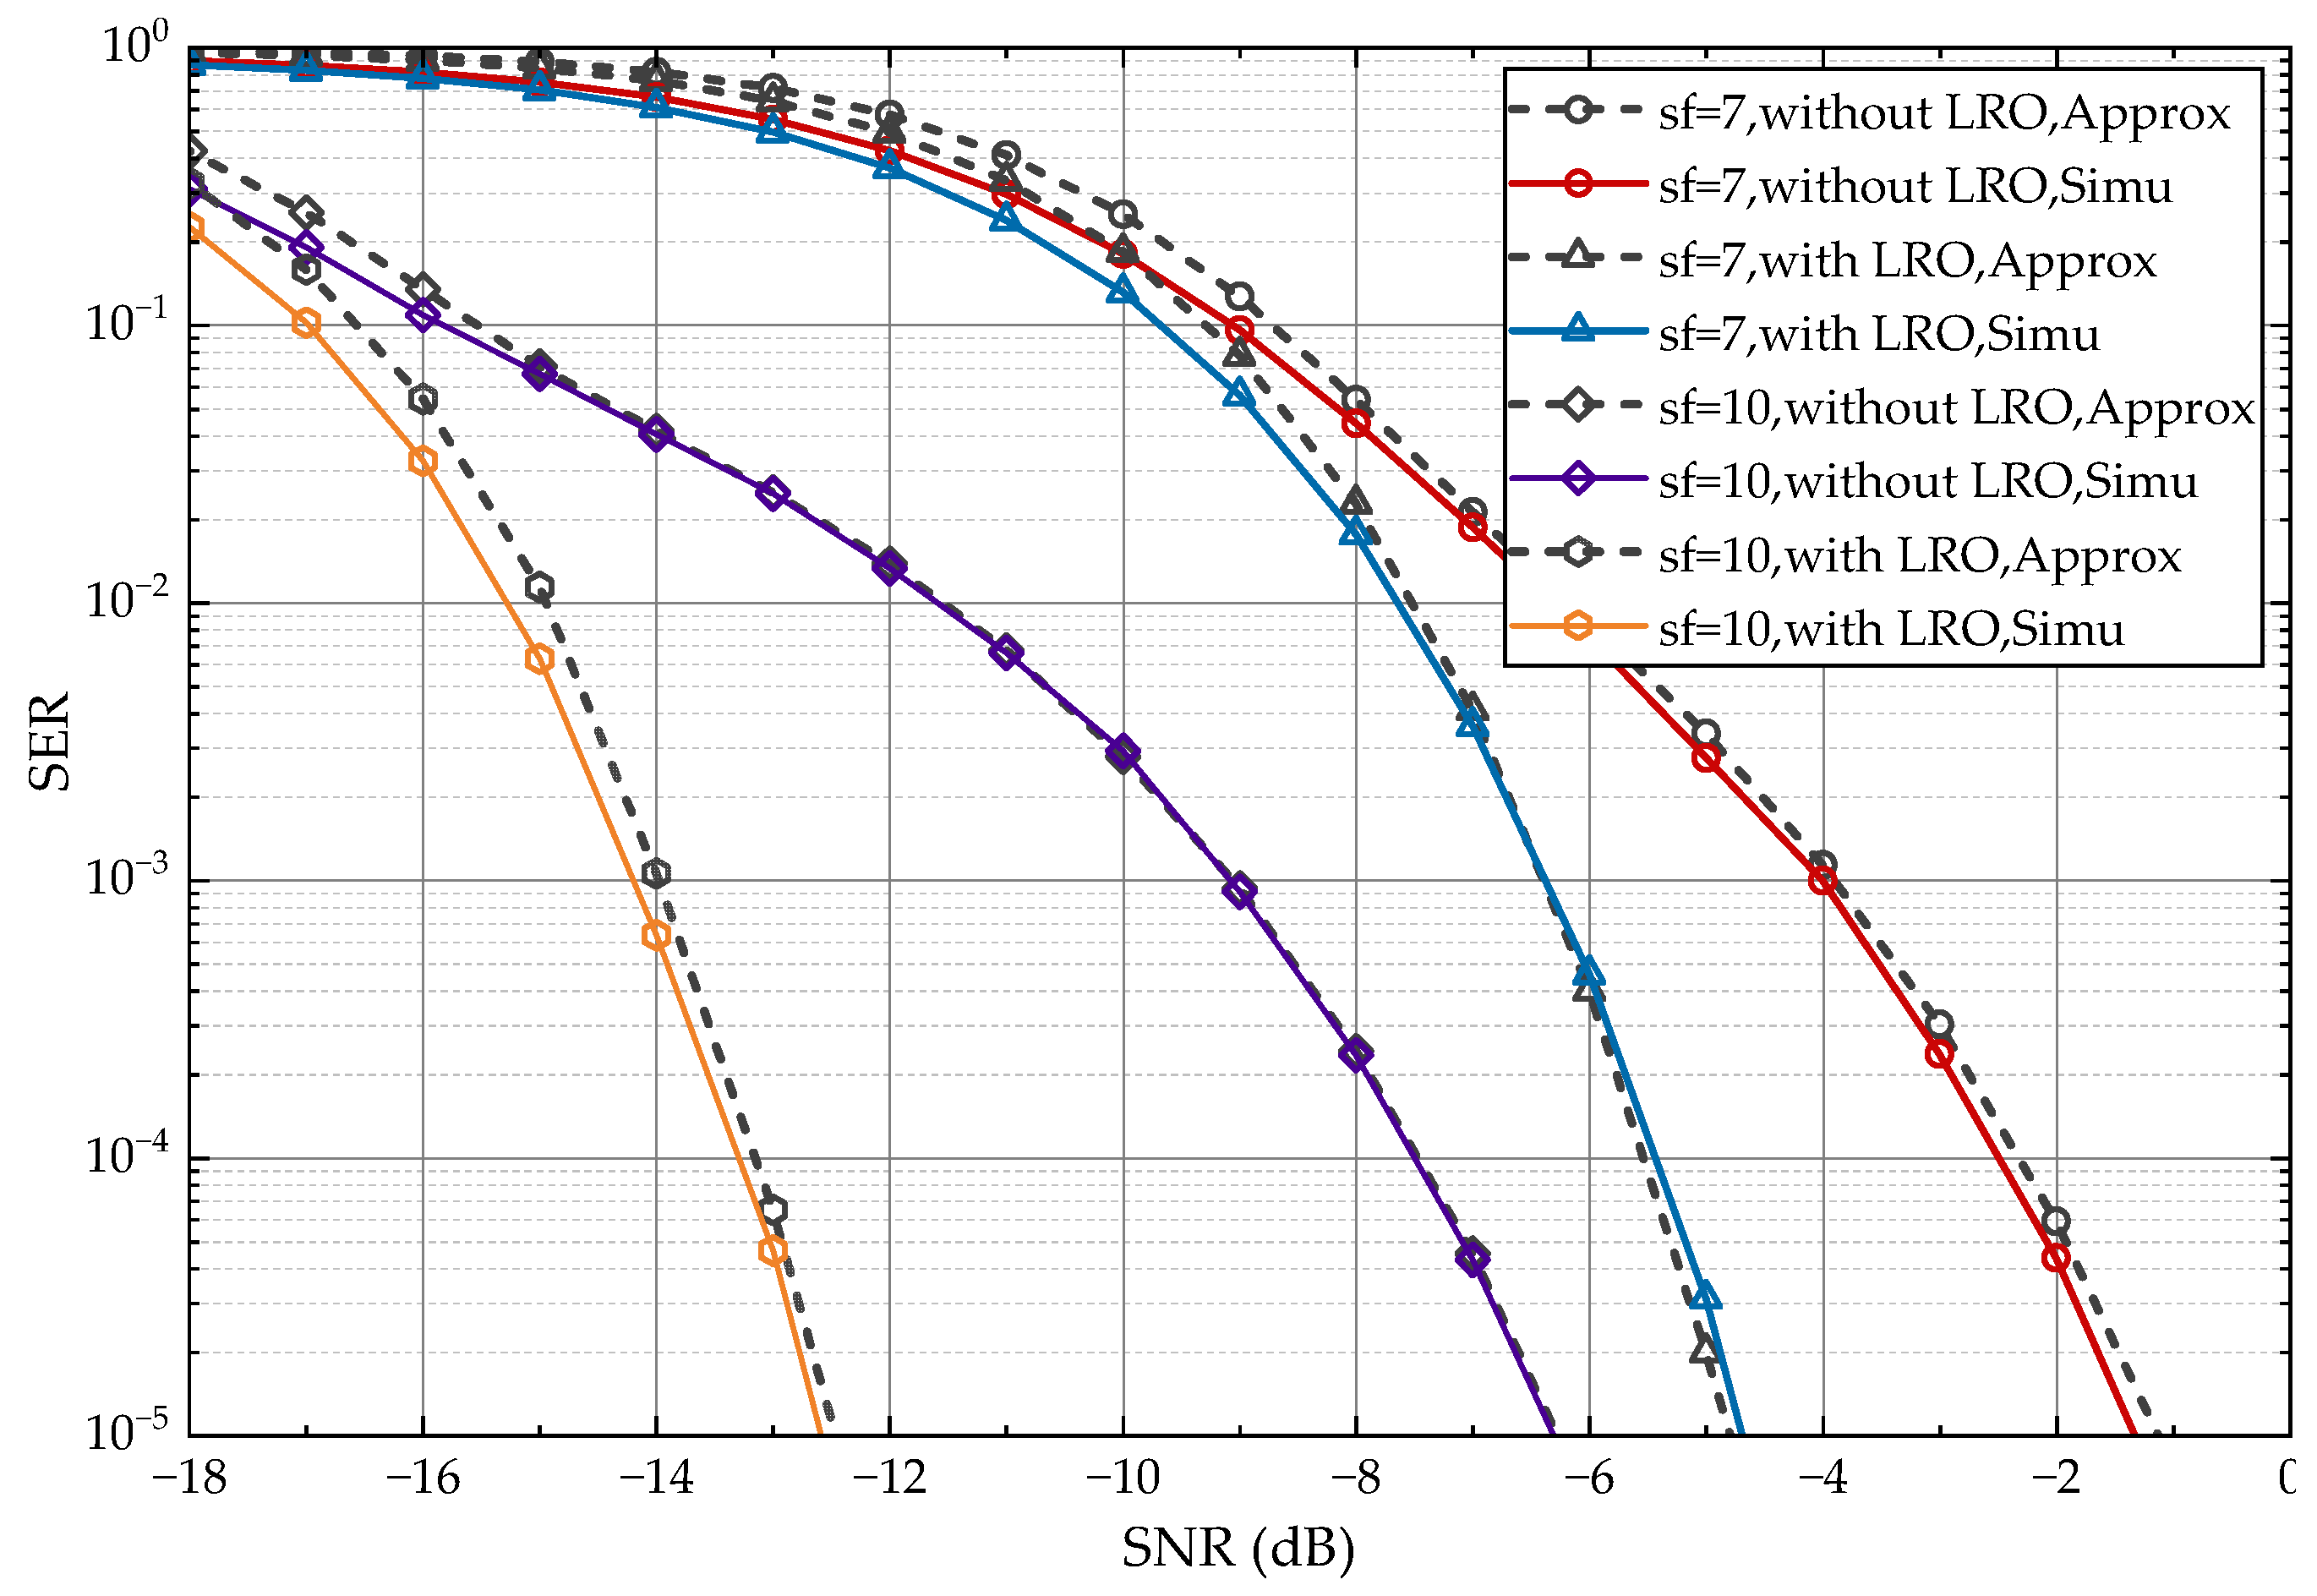
Figure 6 compares the SER performance of the LoRa system with and without LRO for
and
, under the fixed normalized STO (
), normalized CFO (
), and bandwidth
. For a given SF, enabling LRO shifts the SER curves toward lower SNR values. At an SER of
, the simulated results show that LRO provides an SNR gain of approximately 3.5 dB for
and approximately 6 dB for
. This improvement can be attributed to the two-bin guard interval introduced by LRO, which reduces the influence of energy leakage into the frequency bins close to the
-th bin. At low SNR, however, detection errors are mainly caused by noise peaks in more distant bins. Consequently, the difference between the LRO and non-LRO cases is relatively small. The larger gain observed for
indicates that, under the considered conditions, the benefit of LRO becomes more pronounced as the spreading factor increases.
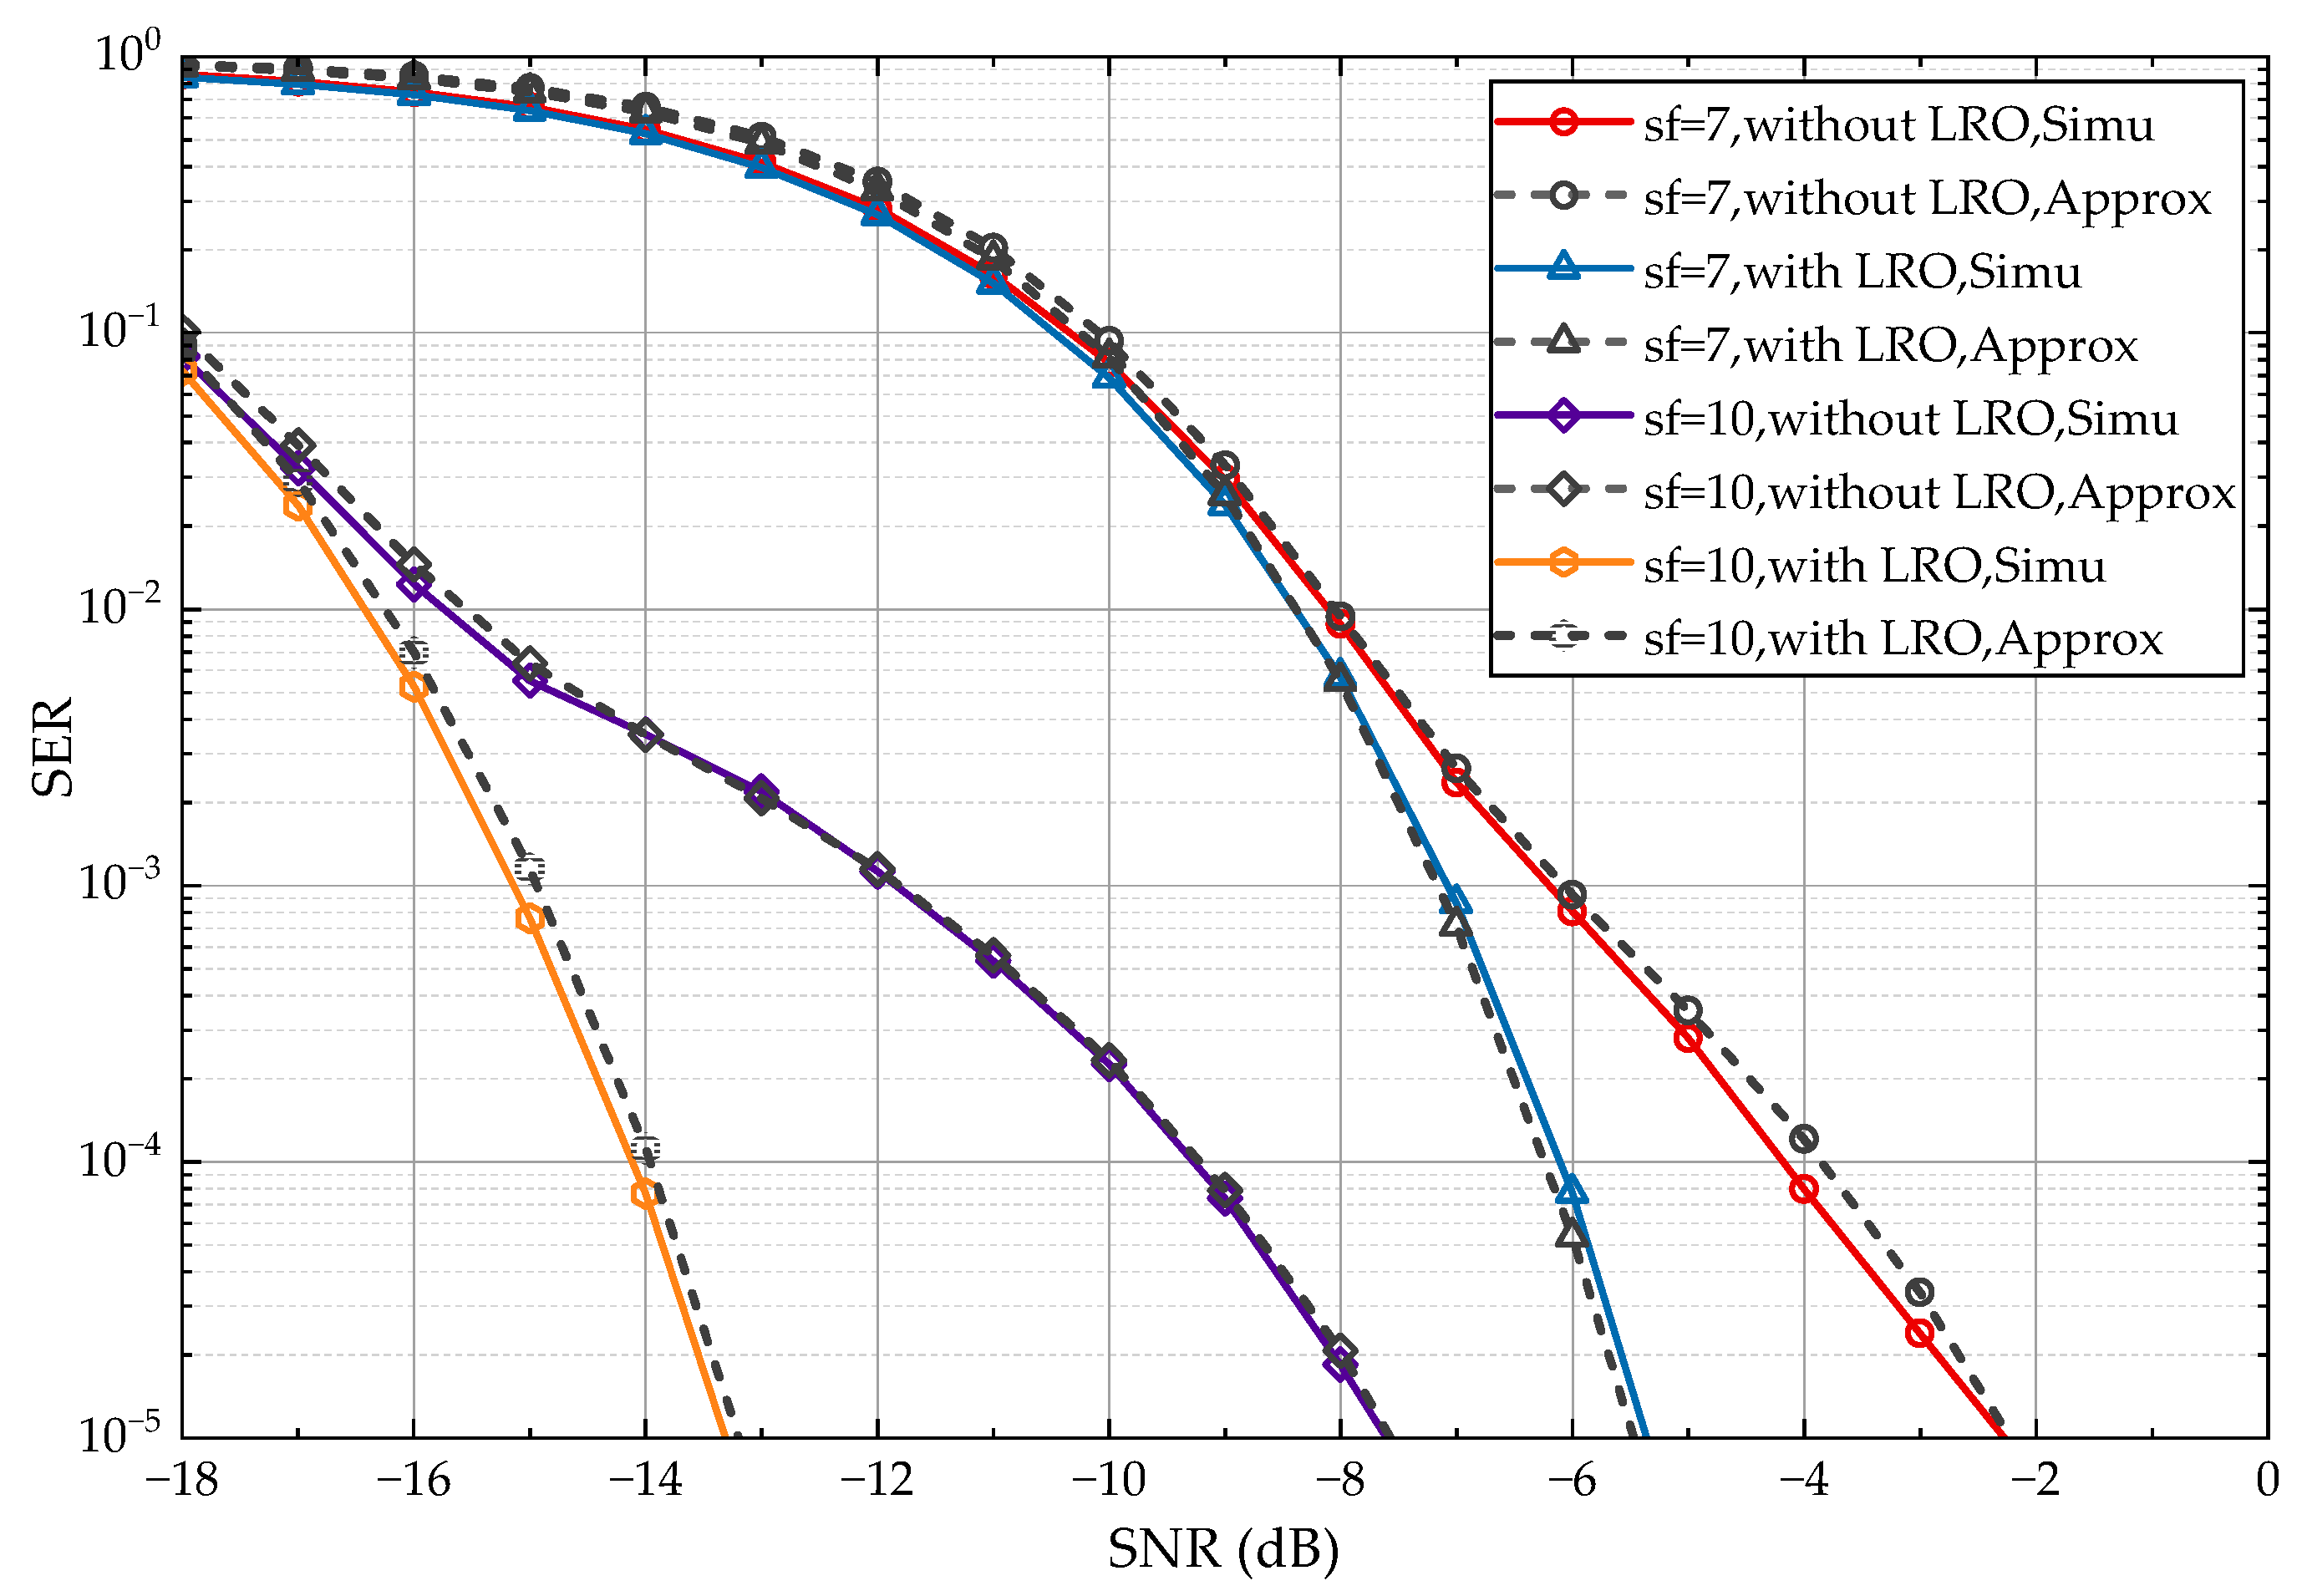
Figure 7 presents the average SER performance with and without LRO for
and
, with a bandwidth of
, random fractional STOs
and CFOs
. The approximate SER results closely follow the simulation results for both spreading factors, demonstrating the accuracy of the proposed approximation when different fractional STO and CFO values are considered. At low SNR, the difference between the LRO and non-LRO cases is relatively small because the detection errors are dominated by noise. At high SNR, however, LRO provides a clear performance advantage. At an SER of
, the corresponding SNR gain is approximately 3 dB for
and approximately 5.5 dB for
. These results show that LRO remains effective when the SER is averaged over different STO and CFO values and that its benefit becomes more pronounced for a larger spreading factor.