Article

The Influence of Run-Flat Tires on the Ride Comfort and Dynamic Behavior of the Vehicle

Department of Automotive Engineering and Transports, Technical University of Cluj-Napoca, 400641 Cluj-Napoca, Romania
*
Author to whom correspondence should be addressed.
Electronics 2026, 15(16), 3636; https://doi.org/10.3390/electronics15163636
Submission received: 16 July 2026 / Revised: 7 August 2026 / Accepted: 13 August 2026 / Published: 15 August 2026

Abstract

Run-flat tires improve vehicle safety by maintaining mobility under air pressure loss, yet their higher vertical stiffness is widely perceived to reduce ride comfort. This work proposes a simulation-based approach for assessing the impact of tire construction, size, and inflation pressure on vertical comfort using standardized random road excitations and frequency-weighted acceleration metrics. Vehicle vertical dynamics were captured using a two-degree-of-freedom quarter-vehicle formulation, built in MATLAB/Simulink and driven by stochastic road inputs representative of typical paved surfaces and realistic driving conditions. The vertical acceleration of the sprung mass was evaluated through an ISO-compliant frequency-weighting filter, enabling a comfort assessment directly linked to whole-body vibration criteria. Simulations over multiple tires and operating configurations showed that run-flat tires consistently produce higher weighted acceleration levels than conventional tires at matched conditions, and that increased inflation pressure further amplifies this comfort deficit. The results provided a quantitative characterization of the impact of run-flat technology on ride comfort and highlight the key role of tire-related parameters in shaping the vertical vibration environment experienced by vehicle occupants. All results are reported at the tire-suspension-sprung mass subsystem level and should be interpreted as indicative comparative benchmarks rather than absolute occupant comfort predictions. These insights can further inform the development of vibration-based monitoring strategies for tire and suspension performance.

1. Introduction

Run-flat tires are mainly used in premium passenger cars and in safety-critical applications, where maintaining mobility after a loss of inflation pressure is particularly important. Their adoption has steadily increased in recent years, with the global market projected to grow from USD 6.27 billion in 2023 to USD 8.82 billion by 2029 [1,2,3], reflecting the growing demand for safety-oriented tire technologies in modern vehicles.
Among all vehicle subsystems, the tire is unique in maintaining the sole physical interface with the road, governing the transfer of longitudinal and lateral forces, the attenuation of road-induced disturbances, and the overall stability of the vehicle. The tire-road interaction strongly influences handling, safety, and ride comfort under a wide range of operating conditions [4,5,6,7,8,9,10].
The failures caused by puncture, blowout, or gradual reduction in tire pressure may lead to loss of traction and vehicle destabilization, especially at high speeds, which explains the sustained research interest in tire constructions capable of preserving short-term post-failure mobility [5,7,8].
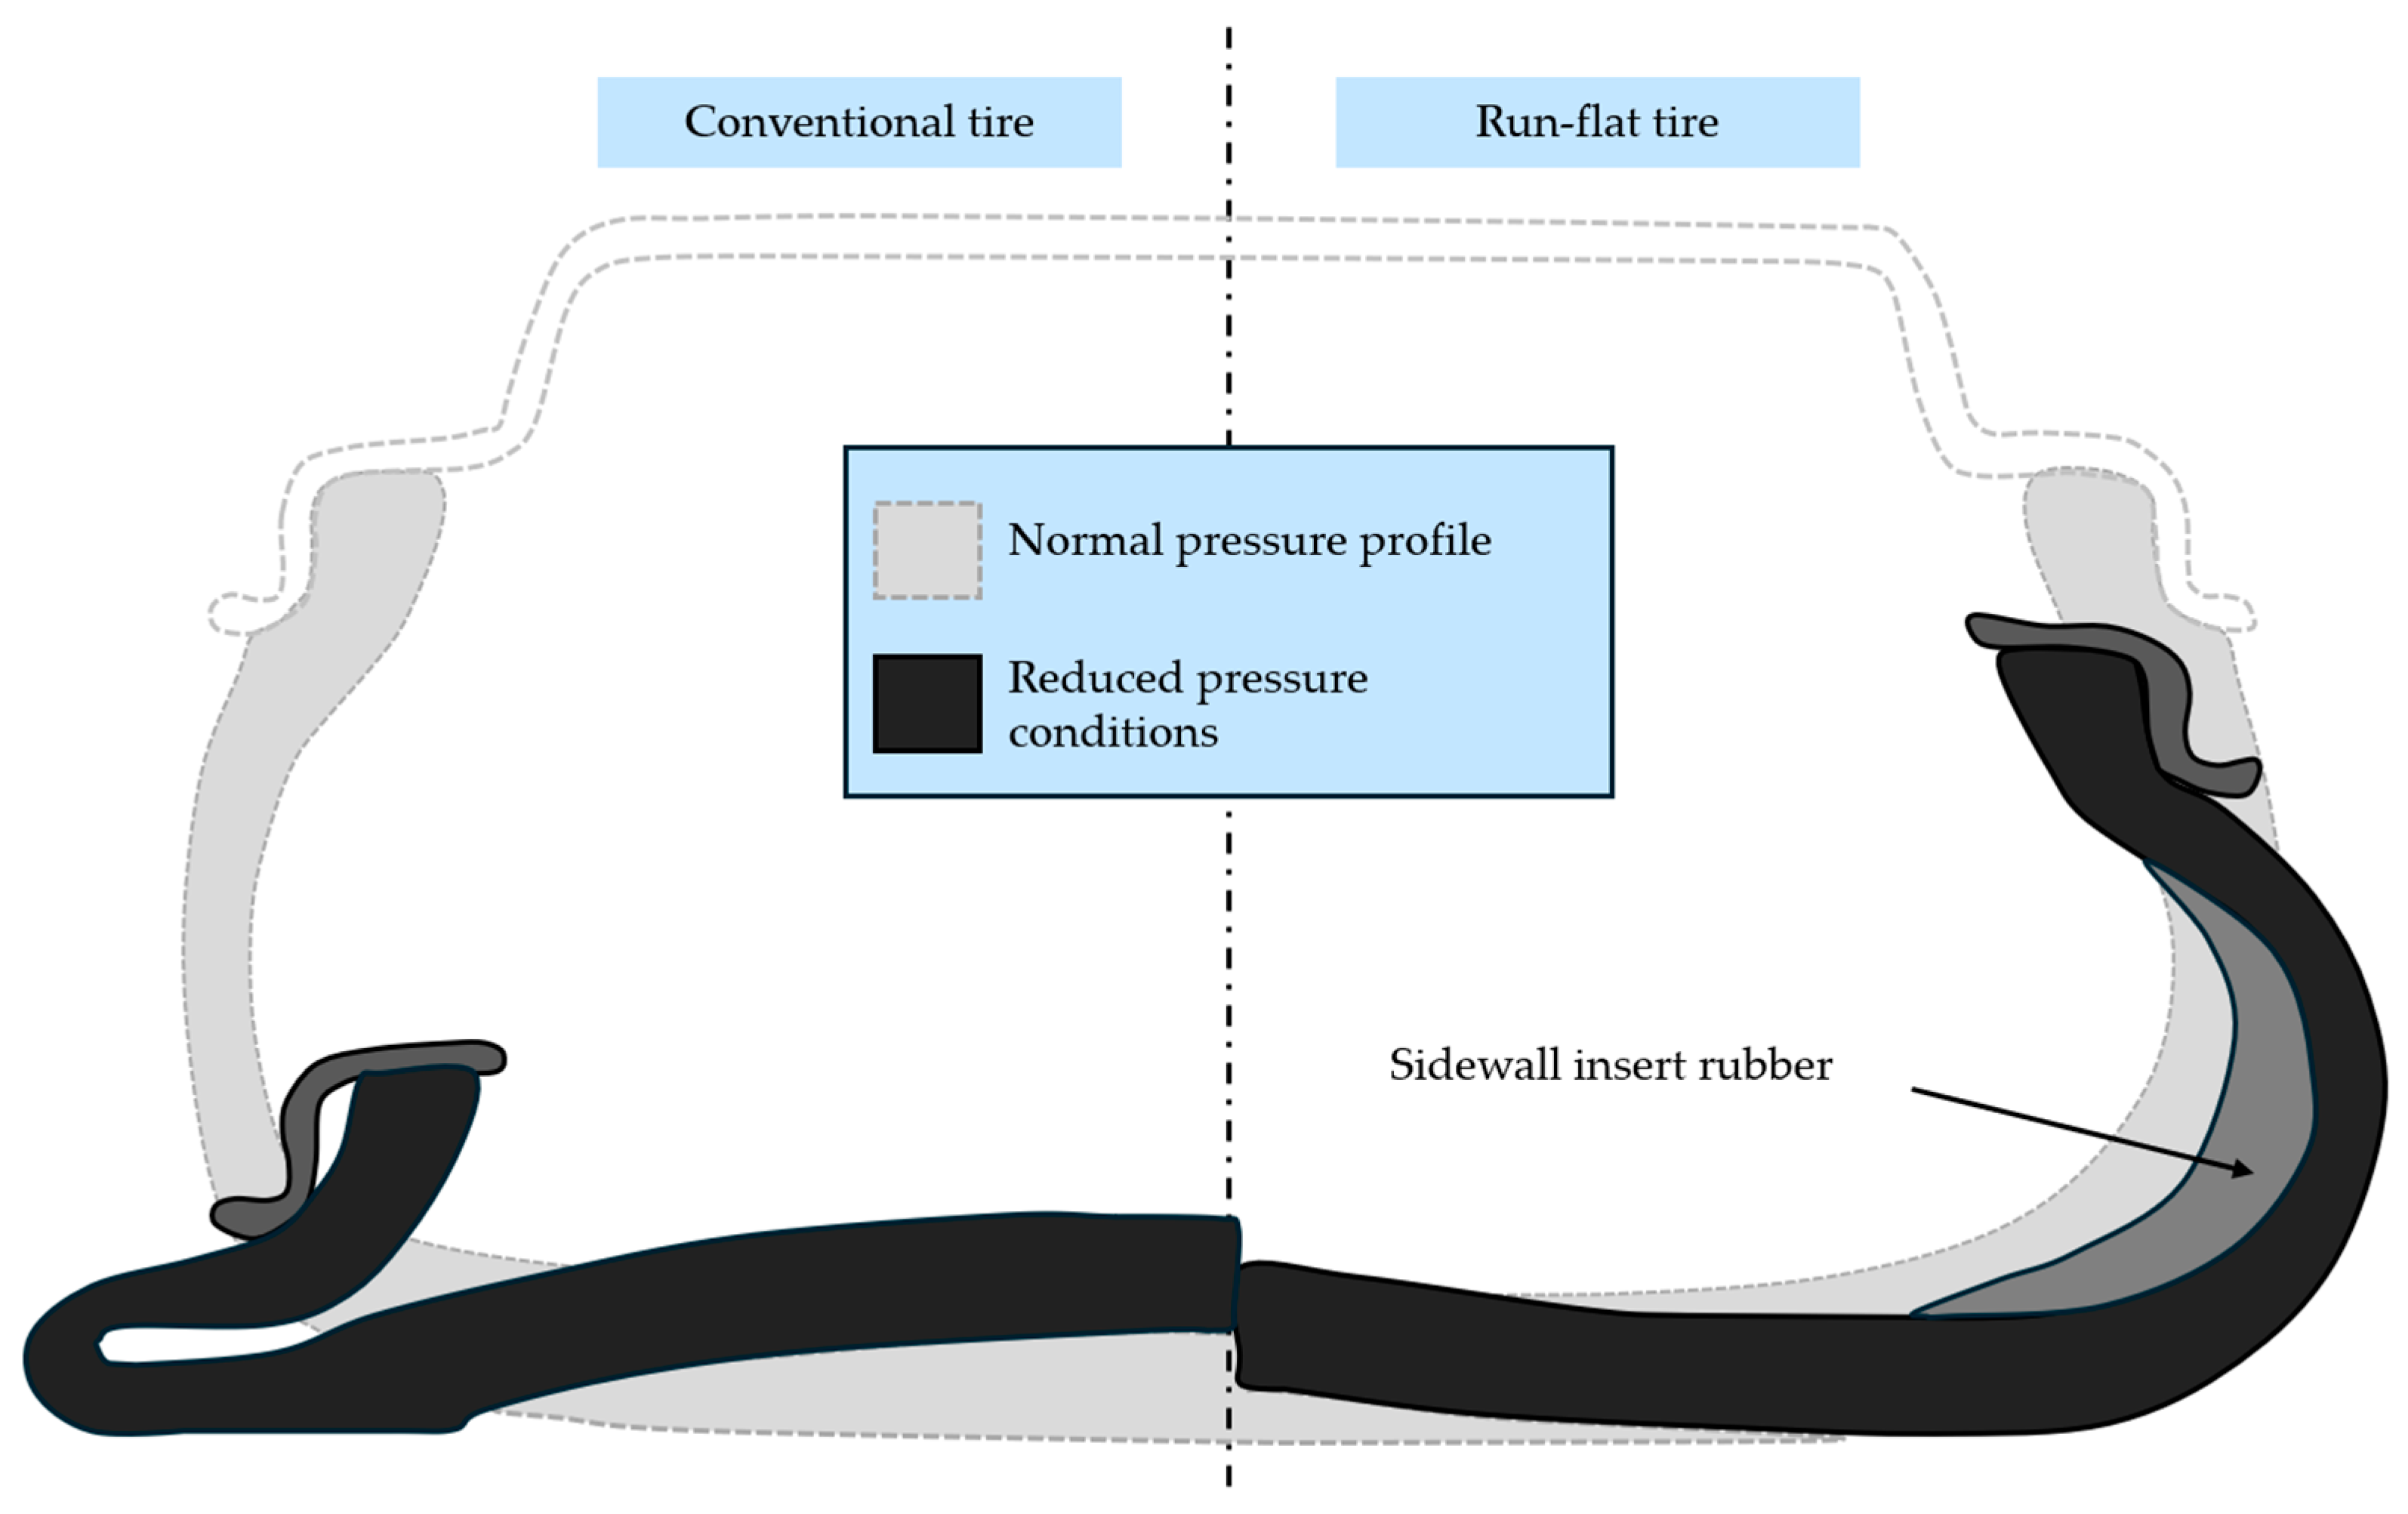
In response to these failure modes, run-flat technology was developed to extend usable mobility after a significant loss of inflation pressure. In Figure 1, the self-supporting design principle is illustrated, in which a stiffened sidewall construction and a reinforced bead area carry the vehicle load directly, even when the tire cavity pressure is substantially reduced [4,5,7,9,10,11,12].
This reinforced construction substantially increases sidewall stiffness compared with conventional tires, which improves post-failure controllability but reduces the tire’s ability to absorb road irregularities, resulting in higher vibration levels transmitted to the vehicle body and occupants. As a result, run-flat tires are generally associated with a firmer and less compliant ride than conventional tires, indicating an inherent trade-off between enhanced safety and ride comfort [5,13,14].
Ride comfort in the vertical direction is commonly investigated using simplified vehicle models, among which the two-degree-of-freedom quarter-vehicle model remains one of the most widely adopted approaches for studying suspension dynamics and tire-road interaction. In such models, the road excitation may be represented either by deterministic inputs, such as isolated obstacles, or by stochastic road profiles that capture the random nature of pavement roughness. The ISO 8608 framework [15] is widely used to describe road roughness through the one-sided power spectral density of vertical displacement and to generate artificial road profiles for parametric vibration studies. Previous studies based on quarter-vehicle formulations have shown that road longitudinal regularity is a primary factor governing the vibration response, while vehicle speed and suspension parameters modulate its amplitude and frequency content [15,16,17,18].
Although displacement-based indicators of the sprung mass are useful for describing structural response, human perception of ride comfort is more directly related to the magnitude and frequency content of the vertical acceleration transmitted to the body. For this reason, ISO 2631-1 [18] addresses this by defining frequency-weighted acceleration descriptors for whole-body vibration exposure, and ride comfort is typically quantified using the frequency-weighted root-mean-square (RMS) acceleration, in which the Wk weighting function emphasizes the 4–8 Hz band corresponding to the greatest human sensitivity to vertical vibration. This approach is consistent with broader vehicle dynamics research, where sprung-mass acceleration has been widely adopted as a primary comfort indicator and as a response variable for evaluating suspension design and control strategies [15,17,18,19,20].
In contrast, much of the literature on run-flat tires has focused on structural design, contact behavior under reduced-pressure or pressure loss operation, and vehicle stability in blowout-related scenarios, while the implications for ride comfort are often discussed qualitatively or inferred from simplified response indicators such as peak displacement [4,5,6,7,8,11,12,21]. Comparative analyses between conventional and run-flat tires rarely combine standardized random road excitation with ISO 2631-1 frequency-weighted acceleration metrics, which limits the direct interpretability of their findings in terms of actual passenger vibration exposure. Furthermore, the joint influence of tire construction, size, and inflation pressure on standardized comfort indicators has not been systematically quantified in a framework that can also support vibration-based monitoring applications. Indirect tire pressure monitoring systems (iTPMS) based on suspension or body accelerometers have shown sensitivity to changes in tire vertical stiffness and road roughness conditions [22], motivating a rigorous characterization of the vibration signatures associated with different tire configurations.
Accordingly, the present study develops a simulation-based framework to quantify the impact of tire construction (conventional vs. run-flat), size, and inflation pressure on vertical ride comfort under realistic road excitation. A two-degree-of-freedom quarter-vehicle model was implemented in MATLAB/Simulink and excited by stochastic road profiles representative of ISO 8608 Classes B and C, while the vertical acceleration of the sprung mass is evaluated using a digital implementation of the ISO 2631-1 Wk frequency weighting, verified against the standard one-third-octave band reference values. The framework is applied to 32 combinations of tire configuration, road class, and vehicle speed to characterize how run-flat technology and inflation pressure affect weighted RMS acceleration levels and the corresponding comfort classification. The results provide a quantitative characterization of the impact of run-flat tires on ride comfort and highlight the role of tire-related parameters in shaping the vertical vibration environment experienced by vehicle occupants, with implications for both passenger comfort assessment and vibration-based tire monitoring strategies.

2. Materials and Methods

2.1. Quarter-Vehicle Model

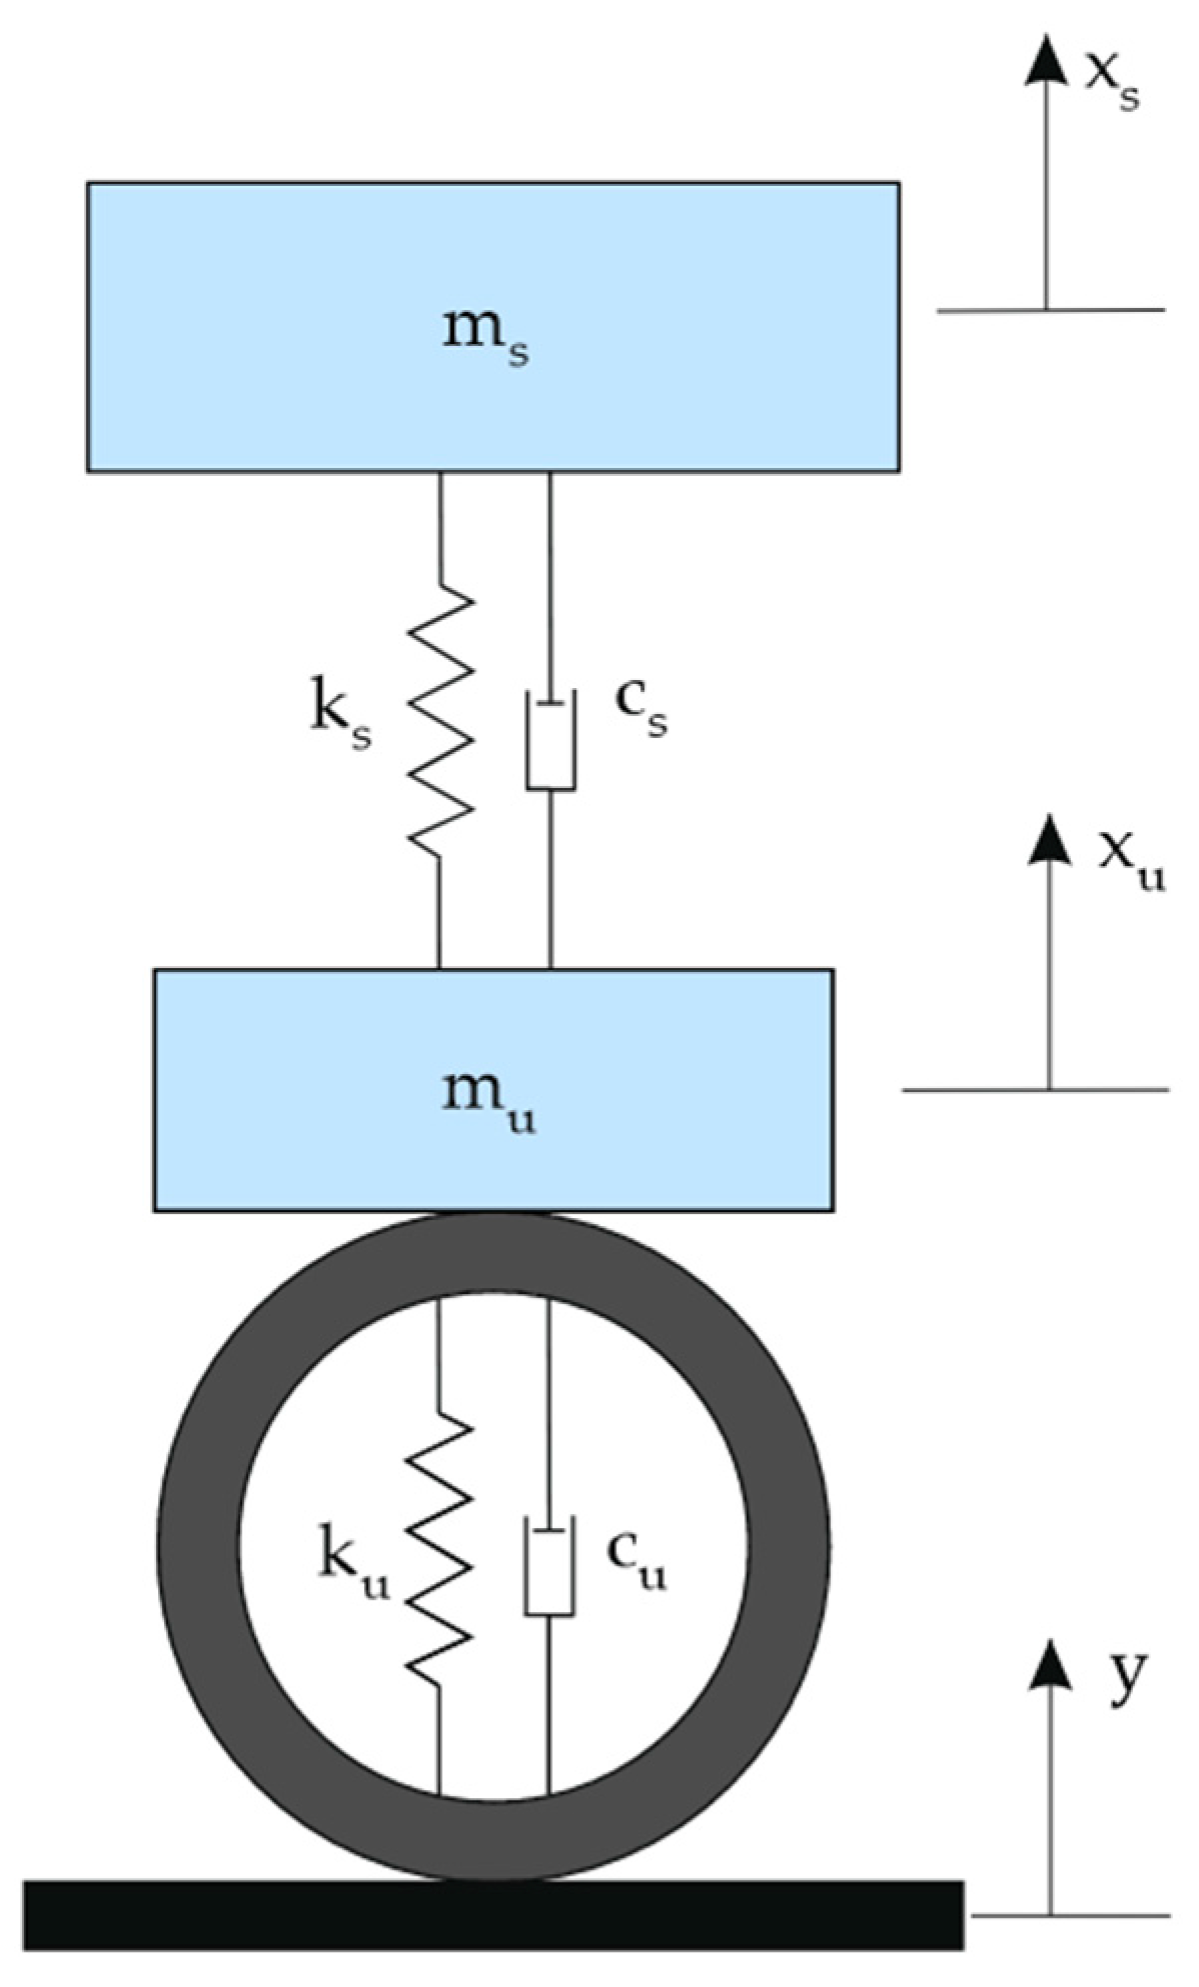
The vertical-plane dynamic behavior of the vehicle was analyzed through a two-degree-of-freedom (2-DOF) quarter-vehicle model, a well-established representation for the analysis of ride comfort and suspension performance [17,23,24]. The model isolates the vertical dynamics of a vehicle wheel, comprising the sprung mass (ms), representing one quarter of the vehicle body, and the unsprung mass (mu), which is defined by the wheel assembly, wheel hub, and rim. The suspension system is represented by a linear spring of stiffness ks and a viscous damper with coefficient cs. The tire was modeled as a parallel spring-damper element with vertical stiffness ku and damping coefficient cu, through which the road profile displacement y(t) was transmitted to the system. A schematic representation of the quarter-vehicle model is illustrated in Figure 2 [17,23,24].
The equations of motion governing the vertical dynamics of the quarter-vehicle system, derived from Newton’s second law of motion, were expressed as follows [5,24]:
m s x ¨ s = k s ( x s x u ) c s ( x ˙ s x ˙ u ) ,
m u x ¨ u = k s ( x s x u ) + c s ( x ˙ s x ˙ u ) k u ( x u y ) c u ( x ˙ u y ˙ ) .
where xs and xu represent the absolute vertical displacement of the sprung and unsprung masses, and y(t) is the road surface and displacement input. The tire damping coefficient cu was verified to be negligible for all tire configurations considered (cu/ku < 0.02) and was accordingly set to zero in the simulation, consistent with the approach adopted in the comparable studies [11,17].
It is acknowledged that the 2-DOF quarter-vehicle model does not capture pitch and roll dynamics, nor the seat-occupant biodynamic transfer function, which can modify both the magnitude and frequency content of vibration transmitted to the human body [17]. Consequently, the ISO 2631-1:1997 comfort classifications [18] applied herein pertain to the sprung mass vibration level and should be regarded as indicative comparative benchmarks between tire configurations, rather than as absolute occupant comfort predictions.
The model was implemented in the MATLAB R2024b/Simulink environment as a state-space formulation, ensuring full numerical transparency and reproducibility. The state vector x = [xs, ẋs, xu, ẋu]T was integrated numerically using the explicit Runge–Kutta solver ODE45 (Dormand–Prince pair), a variable-step method well suited to non-stiff ordinary differential equation systems arising from the quarter-vehicle state-space formulation. A relative tolerance of 10−6 was specified, with the maximum step size constrained to 5 × 10⁻³ s to ensure a minimum effective sampling frequency of Fs = 1000 Hz. The primary output quantity was the vertical acceleration of the sprung mass, ẍs(t), which constituted the input to the frequency weighting filter described in Section 2.3.
The physical consistency of the parameter set was verified through the analytical computation of the system’s natural frequencies. The sprung mass bounce frequency f 1 = 1 2 π · k s m s   = 1.46 Hz and the suspension damping ratio ζ = c s 2 k s · m s = 0.283 [24] both fall within the ranges characteristic of compact passenger car suspension systems ( f 1   [ 1.0 1.5 ]   H z , consistent with the minimum natural frequency reported for compact passenger cars, and ζ     [ 0.20 0.40 ] ) , as reported by [17,24]. The wheel-hop natural frequency, derived from Equations (1) and (2) by assuming a rigid sprung mass, f 2 = 1 2 π · k s + k u m u , ranges from 11.5 to 12.6 Hz for conventional tire configurations and from 12.6 to 13.9 Hz for run-flat configurations, consistent with the typical passenger car range of 10–15 Hz [17]. The systematic upward shift in f2 with increasing ku is physically consistent with the experimental observations of [6], which documented higher vertical stiffness in run-flat tires contributing to distinct wheel-hop behavior. Furthermore, in [25] it was demonstrated through experimental testing of a 2-DOF quarter-vehicle passive suspension rig that simulated and measured sprung mass accelerations are in close agreement, with minor discrepancies attributed to nonlinear tire stiffness effects not captured by the linear model, which represents the same modeling assumption adopted in the present study. In [26], a MATLAB/Simulink quarter-vehicle model was similarly validated against a MacPherson strut test rig using frequency-weighted RMS acceleration per ISO 2631-1:1997 as the objective function, confirming the adequacy of the 2-DOF linear formulation for parametric comfort studies.
The suspension system and damping parameters (ks, cs) were adopted from published data for a compact passenger vehicle [27]. The sprung and unsprung mass values were adopted as representative parameters for a compact passenger vehicle, consistent with the natural frequency validation presented in Section 2.1, where the resulting bounce and wheel-hop frequencies were shown to fall within literature-typical ranges for this vehicle class [17,24]. The vertical stiffness values (ku) for the 215/45R16 tire configurations were adopted from the empirical pressure-stiffness relationship reported in [27,28]. The corresponding values for the 225/45R17 configurations were approximated from the pressure-stiffness graphical representation for comparable tire constructions [11,27,29]. The complete set of parameters is summarized in Table 1. Direct experimental validation against full-vehicle road measurements was outside the scope of the present parametric study, as discussed in Section 4.

2.2. Road Profile Generation

To ensure a realistic and statistically representative road excitation input, stochastic road profiles were generated in accordance with ISO 8608:2016 [15], which classifies road surface roughness based on the one-sided vertical displacement power spectral density (PSD) [30].
According to ISO 8608:2016, the PSD of the road profile displacement is modeled as [15,30]:
G d ( n )   =   G d ( n 0 ) · ( n / n 0 ) w .
where n is the spatial frequency in cycles/m, n0 = 0.1 cycles/m is the reference spatial frequency, Gd(n0) is the unevenness index characterizing the road class, and w = 2 is the waviness exponent. Two road classes were considered, Class B (Gd(n0) = 64 × 10−6 m3/cycle) and Class C (Gd(n0) = 256 × 10−6 m3/cycle), corresponding to the geometric mean roughness values specified in ISO 8608:2016 [15] for moderately rough and rough paved surfaces, respectively.
Road profiles were synthesized in the time domain using the superposition-of-harmonics spectral method [16,31]. The spatial frequency range considered was n ∈ [0.01, 10] cycles/m, converted to the temporal frequency domain through the relationship fk = nk·v, where v is the vehicle speed [m/s]. The road displacement signal y(t) was reconstructed as:
y ( t )   =   k = 1 N A k cos ( 2 π f k t + φ k ) ,
where A k =   2 G d , t ( f k ) · Δ f are the harmonic amplitudes derived from the discretized PSD, fk are the component frequencies uniformly distributed over the range [0.01v, min(10v, Fs/2)] Hz, N = 500 is the number of frequency components, and φk are independent random phases uniformly distributed over the interval [0, 2π).
Two vehicle speeds were considered: 50 km/h (13.89 m/s), representative of urban and peri-urban driving conditions, and 80 km/h (22.22 m/s), corresponding to national road driving conditions. Each simulation was conducted over a total duration of T = 20 s, consistent with the minimum measurement duration prescribed by ISO 2631-1:1997 [18] for stationary random signals at the lowest frequency of interest (≥8 cycles at the 0.4 Hz high-pass cutoff frequency of the Wk weighting filter). The first 2 s of each simulation were excluded from all metric computation to eliminate solver transient effects. The complete set of simulation parameters and the resulting 32 scenarios is summarized in Table 2.

2.3. Frequency Weighting Filter

The primary comfort metric adopted in this study was the frequency-weighted RMS acceleration aw, defined in accordance with ISO 2631-1:1997 [18] as:
a w   =   [ ( 1 / T )   0 T a w 2 ( t )   d t ] 1 / 2 .
where aw(t) is the instantaneous frequency-weighted vertical acceleration signal [m/s2] and T is the measurement duration [s]. For vertical vibration in the z-axis, the Wk frequency weighting function is prescribed by ISO 2631-1:1997, exhibiting peak sensitivity in the 4–8 Hz band, which corresponds to the greatest human discomfort [18].
The analog Wk transfer function is defined in ISO 2631-1:1997 as the product of four filter stages [13,18,32]:
H ( p ) =   H h ( p ) · H l ( p ) · H t ( p ) · H s ( p ) .
where Hh(p) and Hl(p) are second-order Butterworth high-pass (f1 = 0.4 Hz) and low-pass (f2 = 100 Hz) band-limiting filters, Ht(p) is the acceleration-to-velocity transition filter (f3 = f4 = 12.5 Hz, Q4 = 0.63), and Hs(p) is the upward-step body resonance filter (f5 = 2.37 Hz, Q5 = 0.91, f6 = 3.35 Hz, Q6 = 0.91) [13,18,32].
The digital implementation of the Wk filter was carried out using the bilinear transformation method (Tustin method), following the reference MATLAB code published in ISO 8041-1:2017 [33]. The filter operates at a sampling frequency of Fs = 1000 Hz, satisfying the requirement Fs ≥ 9f2 = 900 Hz specified in ISO 8041-1:2017 [33]. The digital filter gain was normalized such that the response at 6.3 Hz matched the peak value specified in ISO 2631-1:1997, corresponding to the frequency of maximum Wk sensitivity. The digital implementation was subsequently verified against all 23 one-third-octave band reference values listed in ISO 2631-1:1997 [18], confirming agreement within the magnitude tolerance specified in ISO 8041-1:2017, respectively +12%/−11% for 0.631 Hz ≤ f ≤ 63.1 Hz, and +26%/−21% outside this range. The frequency band 0.5 Hz lies below the lower transition frequency and is therefore subject to the +26%/−21% tolerance [33].
Ride comfort was interpreted according to the six-category scale defined in ISO 2631-1:1997 [18]. The present results span the ‘fairly uncomfortable’ (0.500–0.800 m/s2), ‘uncomfortable’ (0.800–1.250 m/s2), and ‘very uncomfortable’ (1.250–2.000 m/s2) categories, with no scenario reaching the ‘not uncomfortable’, ‘a little uncomfortable’, or ‘extremely uncomfortable’ thresholds.
To assess the sensitivity of ride comfort to tire inflation pressure, the relative variation in weighted RMS acceleration between the two simulated pressure levels (0.20 MPa and 0.25 MPa) was computed for each tire type, size, road class, and speed condition. This analysis provided a quantitative basis for evaluating the detectability of pressure changes through vehicle dynamics response, which is relevant to indirect TPMS algorithms based on vertical dynamics monitoring.
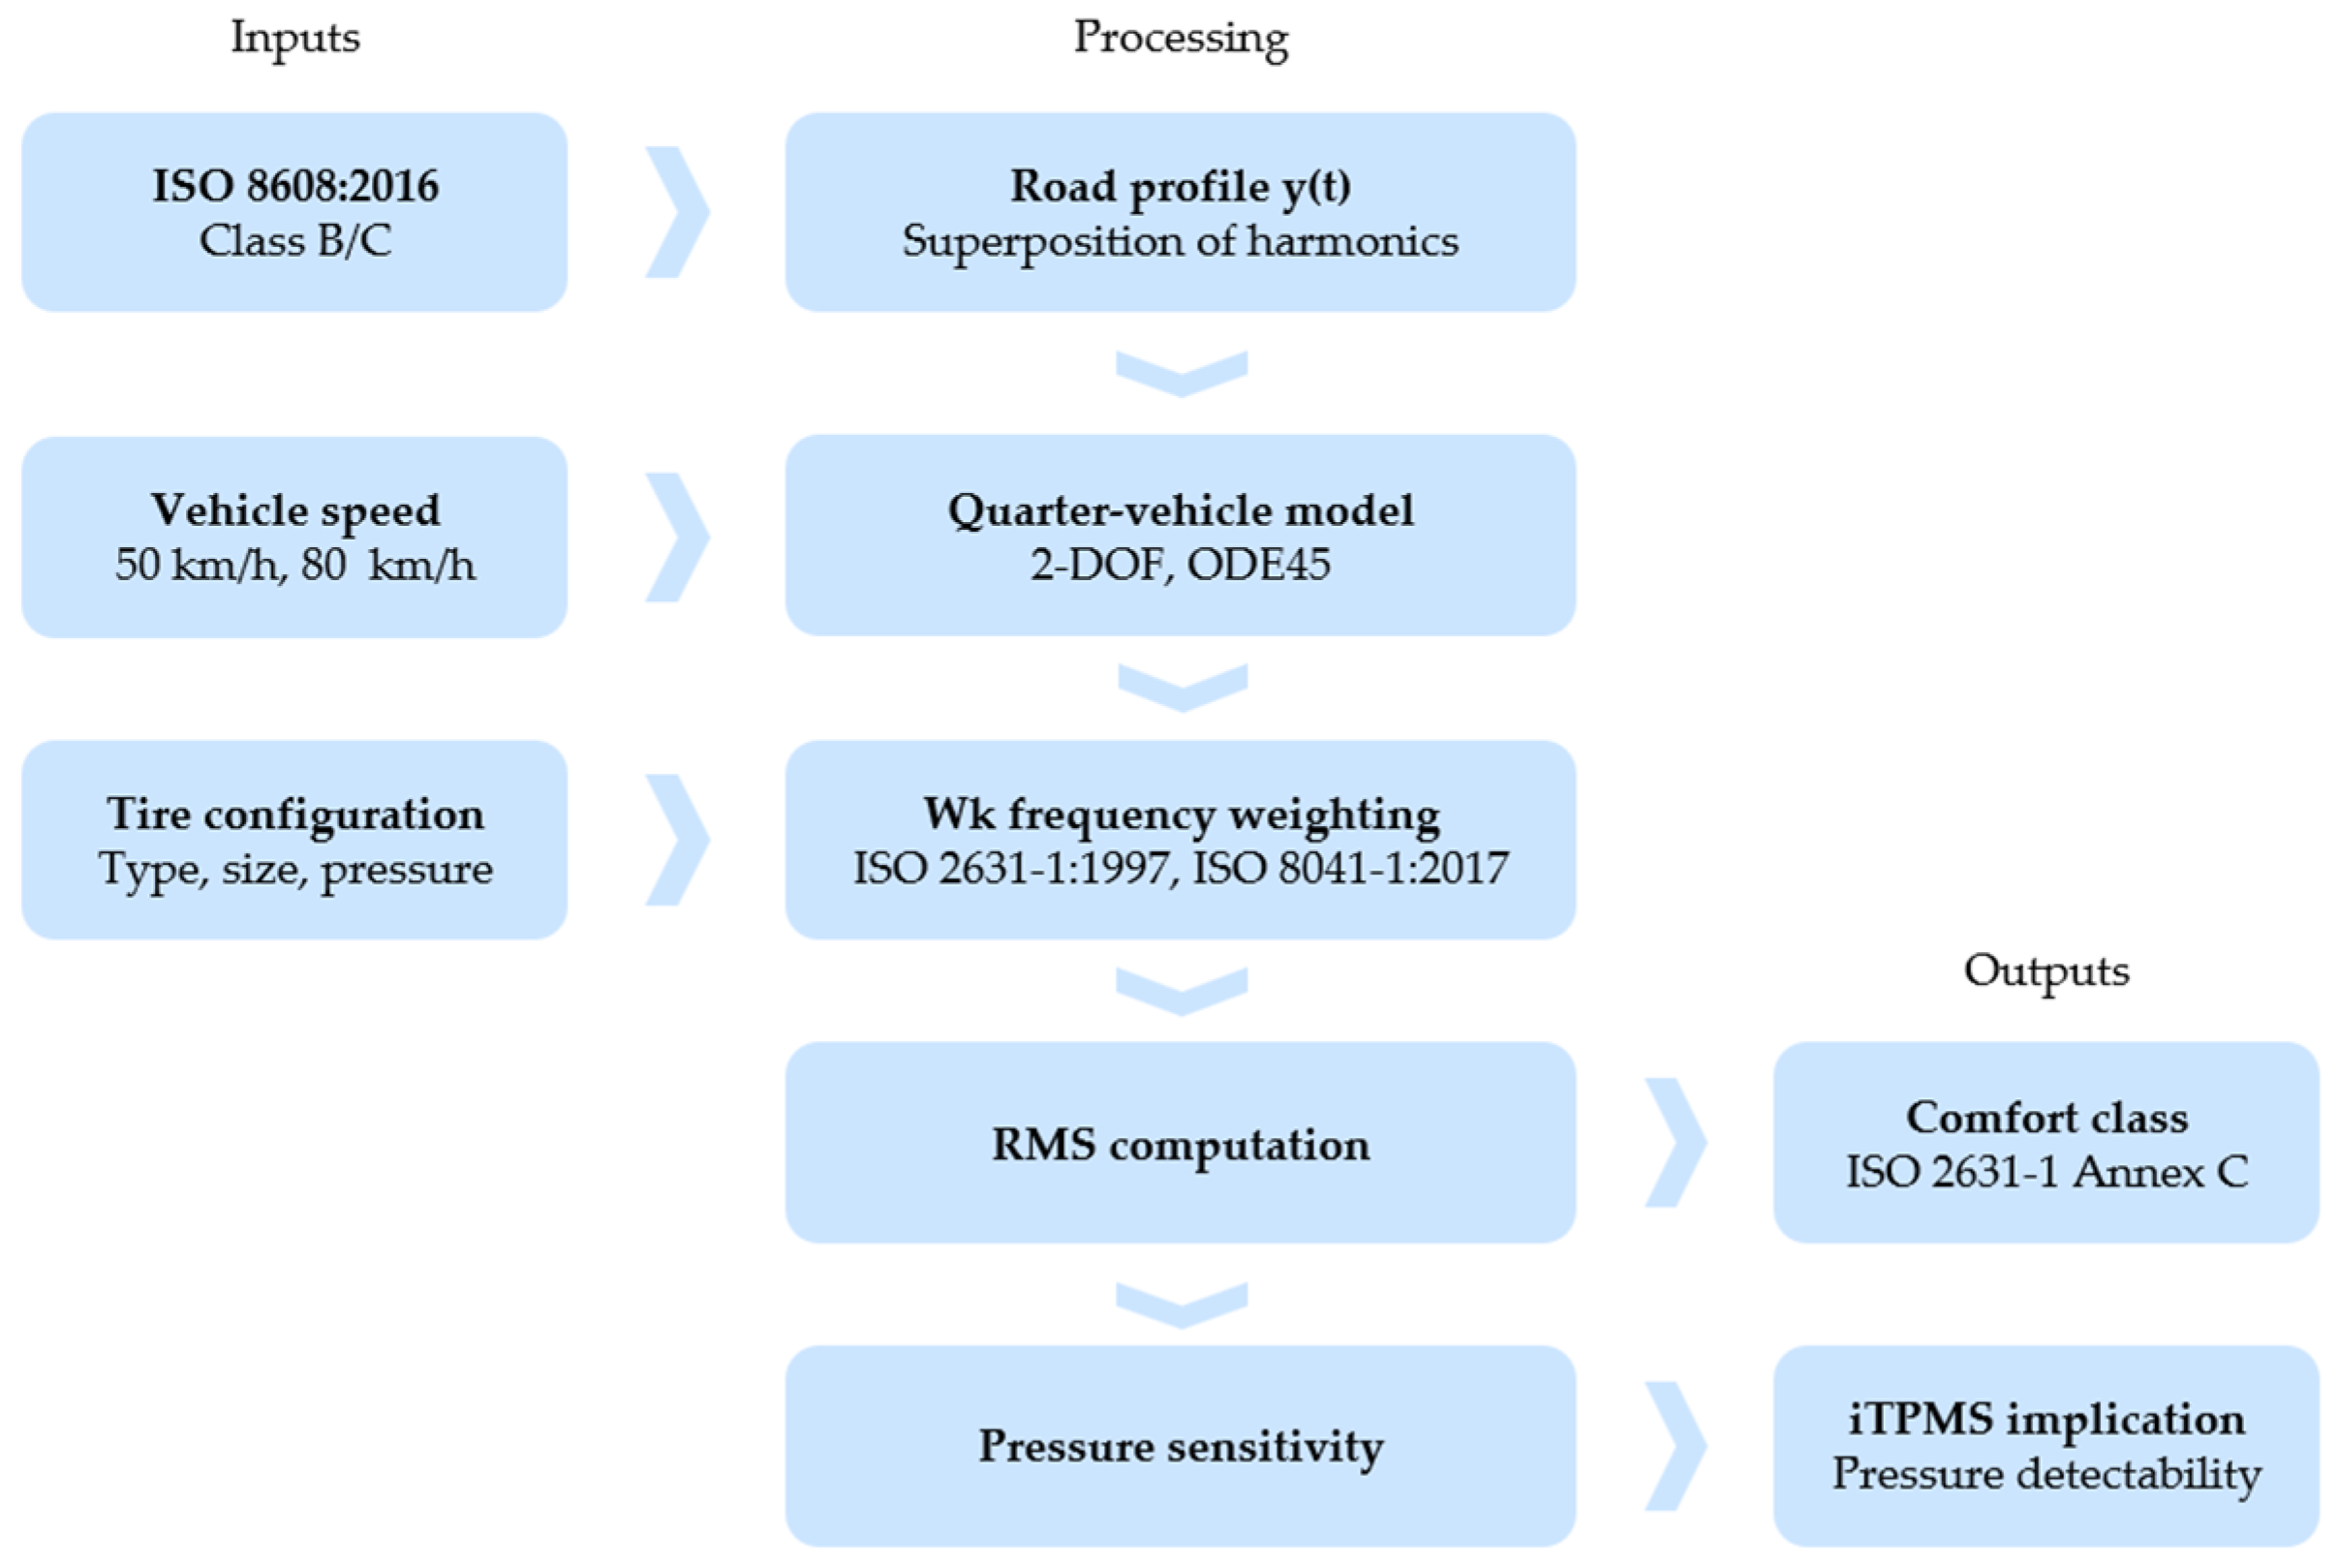
The complete simulation framework is illustrated in Figure 3. The quarter-vehicle state-space model receives the stochastic road displacement input y(t) generated per ISO 8608:2016 and produces the sprung mass acceleration ẍs(t). This signal is subsequently passed through the ISO 2631-1:1997 Wk digital filter, yielding the weighted acceleration aw(t), from which the RMS metric aw is computed. All simulations were performed in MATLAB.

3. Results

3.1. Weighted RMS Acceleration Across the Simulation

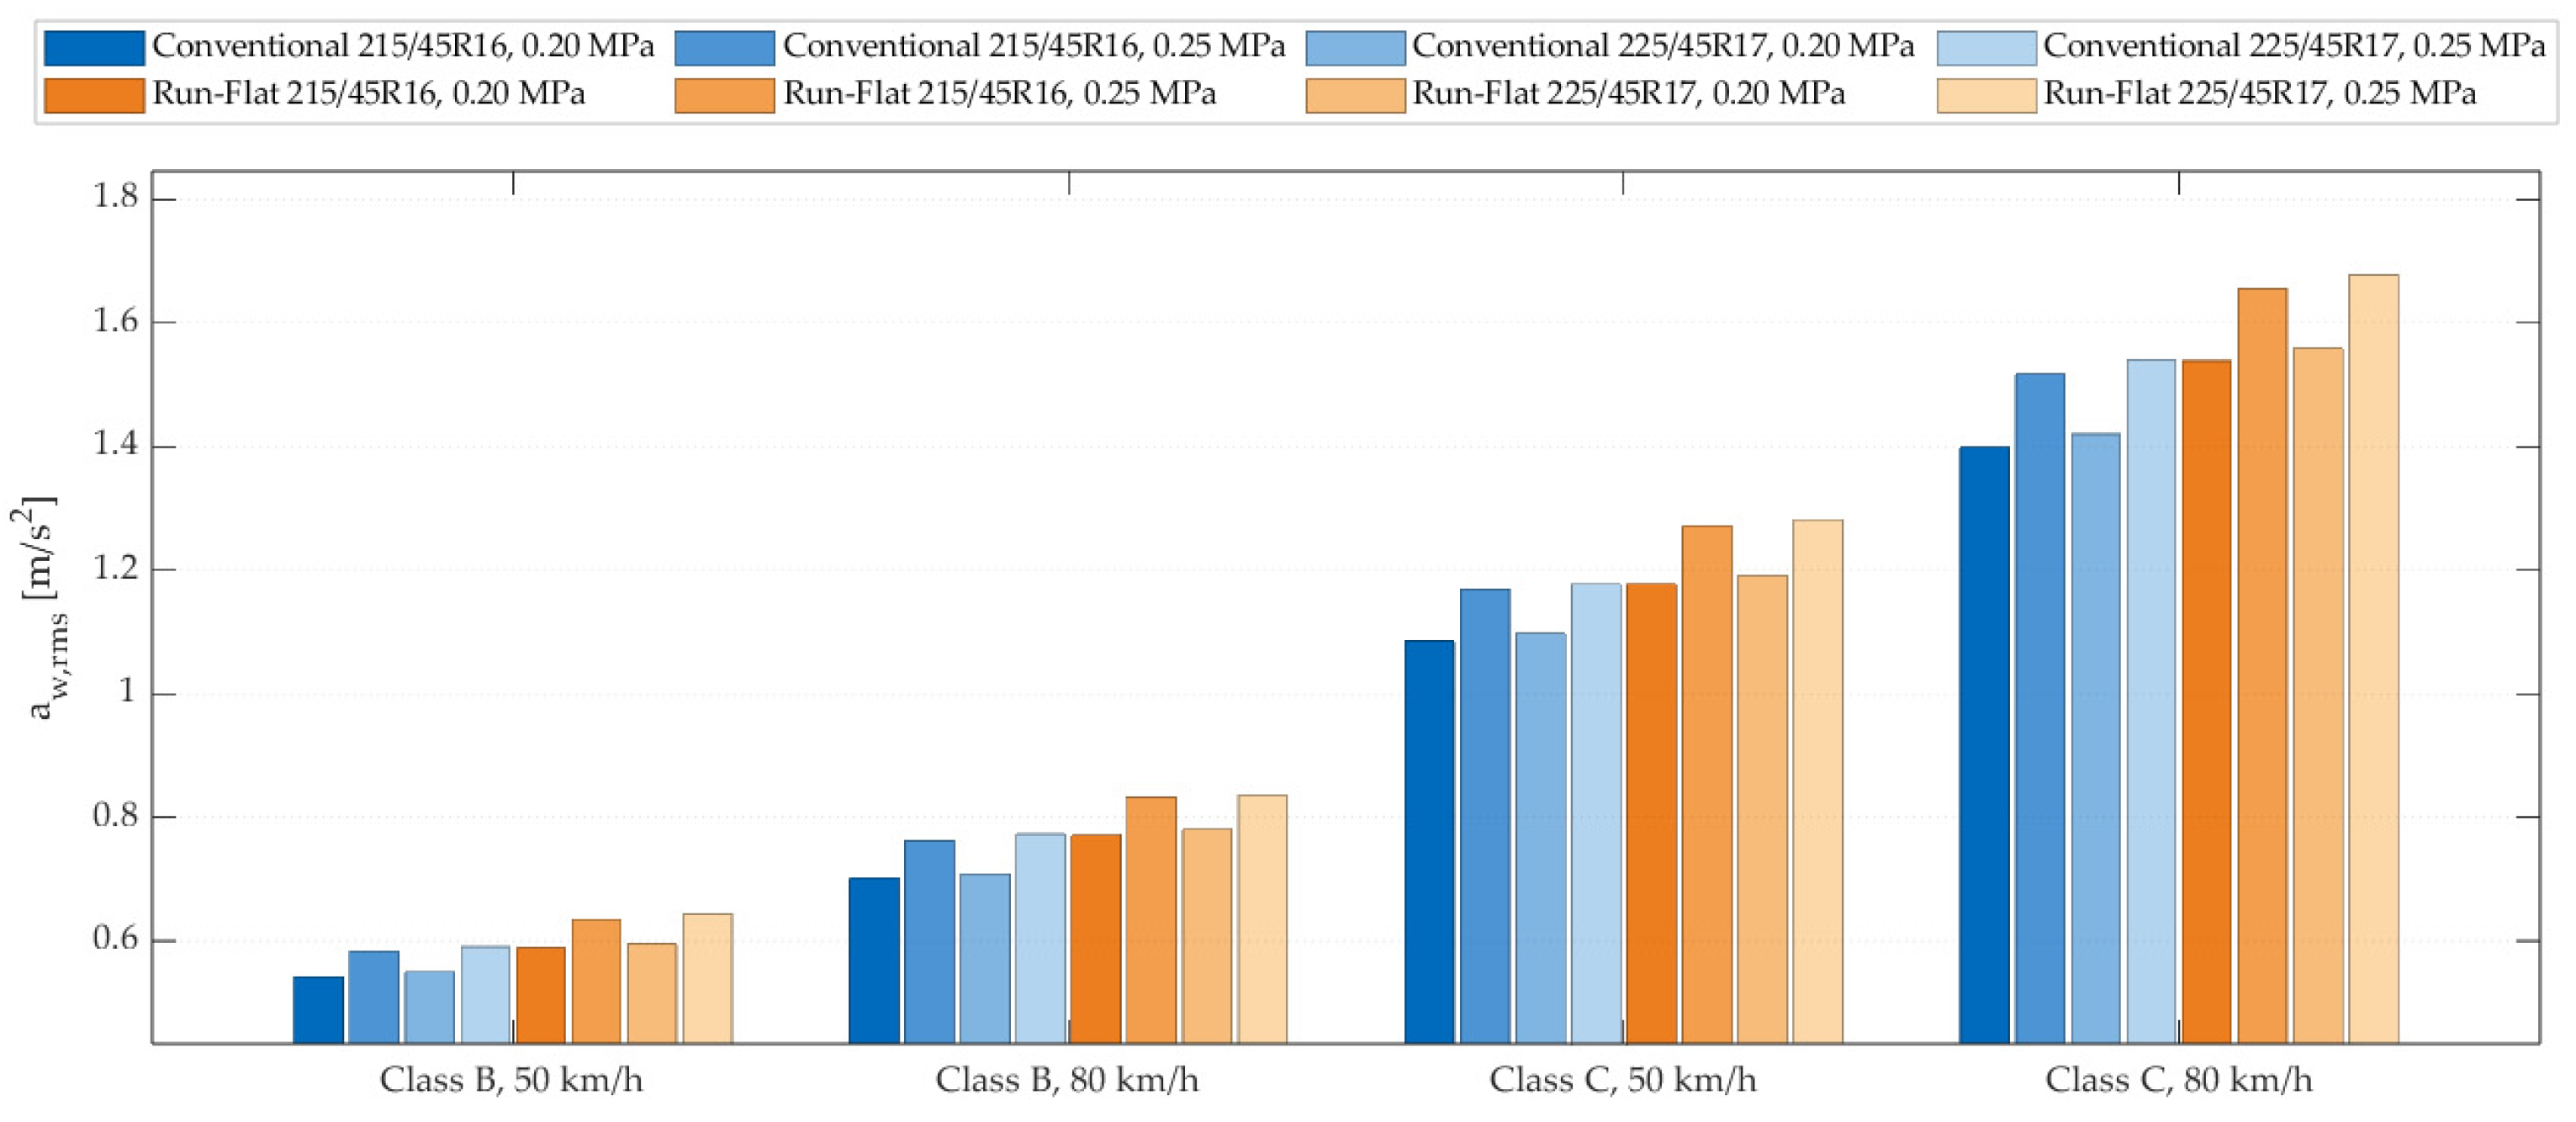
The frequency-weighted RMS acceleration aw,rms computed for the 32 simulated scenarios ranged from 0.542 m/s2 (conventional tire, 215/45R16, 0.20 MPa, Class B, 50 km/h) to 1.678 m/s2 (run-flat tire, 225/45R17, 0.25 MPa, Class C, 80 km/h), spanning three of the six ISO 2631-1:1997 comfort categories: fairly uncomfortable (Class B, 50 km/h, conventional tires), uncomfortable (Class B, 80 km/h, and Class C, 50 km/h), very uncomfortable (Class C, 80 km/h), with no scenario reaching the not uncomfortable or extremely uncomfortable thresholds. Figure 4 presents the complete set of results, grouped by road class and speed.
Across all 32 scenarios, the response followed four consistent and monotonic trends:
  • Run-flat tires produced higher aw,rms than the conventional equivalent at matched size, pressure, road class, and speed;
  • Increasing inflation pressure from 0.20 to 0.25 MPa produced higher aw,rms values for every configuration;
  • Class C excitation produced higher aw,rms than Class B at matched speed and tire configuration;
  • 80 km/h produced higher aw,rms than 50 km/h at matched road class and tire configuration.
The road-class dependence followed the expected analytical relationship closely. Since the road displacement PSD scaled linearly with Gd(n0) (Equation (3)) and the response variance scales linearly with the input PSD for a linear time-invariant system, the ratio aw,rms(Class C)/aw,rms(Class B) is expected to approach G d , C / G d ,   B =   256 / 64   =   2.000 . The simulated ratio averaged 1.998 across all eight tire configurations and both speeds, confirming that the quarter-vehicle model correctly propagates the ISO 8608:2016 road severity scaling and providing an internal consistency check on the implementation.
The complete set of values for all combinations of tire type, size, inflation pressure, road class, and speed, together with the corresponding comfort categories, is reported in Table 3.

3.2. Effect of Run-Flat Construction on Ride Comfort

The run-flat tires produced a consistent comfort deficit relative to the conventional equivalents, averaging 9% across all 32 matched comparisons (Figure 4). This reduction in comfort was stable across road class, speed, and inflation pressure, indicating that the stiffness increase associated with the reinforced run-flat sidewall, rather than the operating condition, is the dominant factor governing comfort degradation. The magnitude of this weakening effect is consistent with the relative increase in vertical stiffness ku between the conventional and run-flat variants at matched size and pressure (see Table 1).
The practical implication is that, although both tire types remained within the fairly uncomfortable to very uncomfortable categories under the simulated conditions, the run-flat configuration shifted the comfort classification boundary earlier. Under Class B/80 km/h excitation, the conventional tire remained at the fairly uncomfortable/uncomfortable threshold (0.702–0.773 m/s2) while the run-flat equivalent crossed into the uncomfortable category at the higher-pressure setting (0.771–0.836 m/s2).
A secondary, smaller effect was observed for tire size. The 225/45R17 configuration produced a 1.16% higher aw,rms than the 215/45R16 configuration at matched type, pressure, road class, and speed, consistent with the higher vertical stiffness ku associated with the larger rim diameter and lower aspect ratio (see Table 1).

3.3. Pressure Sensitivity and Implications for Indirect TPMS

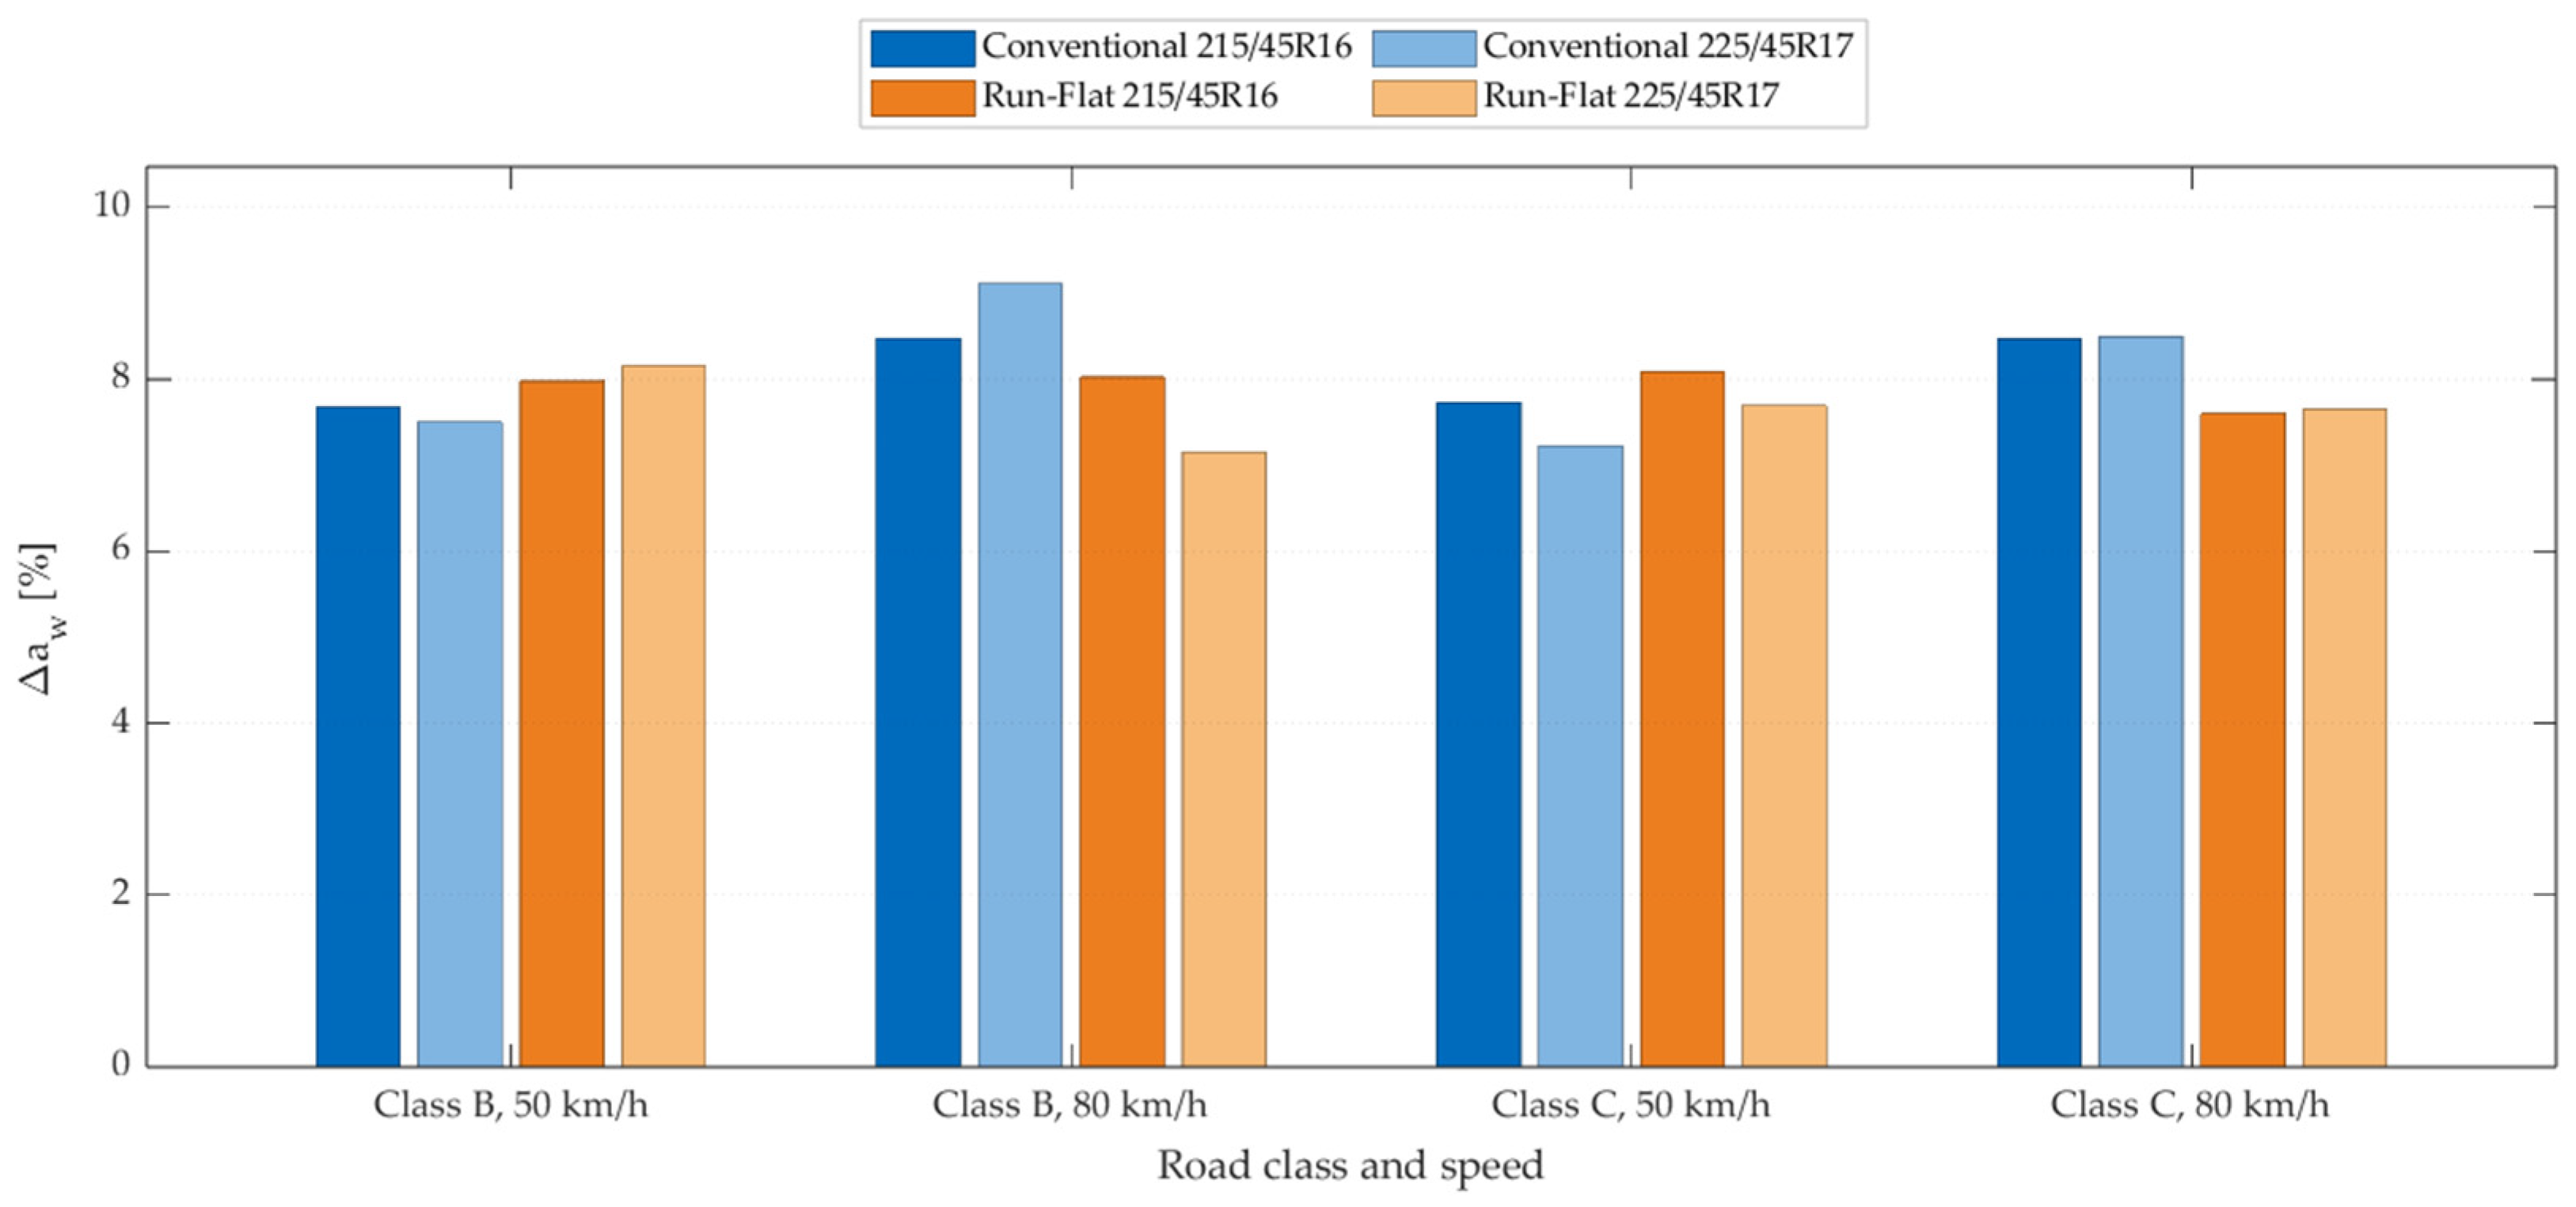
Figure 5 presents the relative change in aw,rms resulting from the pressure increase from 0.20 to 0.25 MPa, computed independently for each tire type, size, road class, and speed combination. The sensitivity averaged 8.09% for conventional tires and 7.8% for run-flat tires across all 16 matched pairs per type. The difference between the two means (0.29%) was not statistically significant.
This result indicates that a 0.05 MPa pressure change produces a similar percentage change in aw,rms for both tire types (~8%), even though the absolute acceleration levels differ. For iTPMS, which detects pressure loss from the relative change in vibration signal rather than its absolute level, this finding carries a specific practical implication. Vertical-dynamics-based iTPMS algorithms rely on estimating tire vertical stiffness ku from sprung and unsprung mass accelerations measured by on-board sensors. Reference [29] proposed an adaptive extended Kalman filter iTPMS that exploits the explicit correlation between inflation pressure and ku derived from a quarter-vehicle suspension model and validated the algorithm experimentally at laboratory level for tire type 225/45R17, the same dimension considered in the present study. This approach is consistent with the broader family of vertical-dynamics-based iTPMS methods, including tire torsional resonance frequency analysis [22], all of which rely on the stiffness-pressure correlation quantified in the present study. The current results demonstrate that stiffness-to-pressure sensitivity produces a statistically equivalent dynamic signature in both run-flat tires and conventional tires under identical road and speed conditions. This implies that a single unified pressure-to-stiffness calibration would be applicable across both tire types in a vertical-dynamics iTPMS implementation, provided that the baseline stiffness offset (ku,run-flat/ku,conventional = 1.233 ± 0.004 across all configurations, Table 1) is correctly initialized as a tire-type-specific parameter. This reduction in calibration complexity for multi-tire-type iTPMS implementations, and the quantitative basis provided by the present pressure sensitivity analysis, constitute, to the best of the authors’ knowledge, a quantitative basis not previously reported in the context of iTPMS calibration for mixed conventional and run-flat tire fleets.

3.4. Time-Domain Response Characteristics

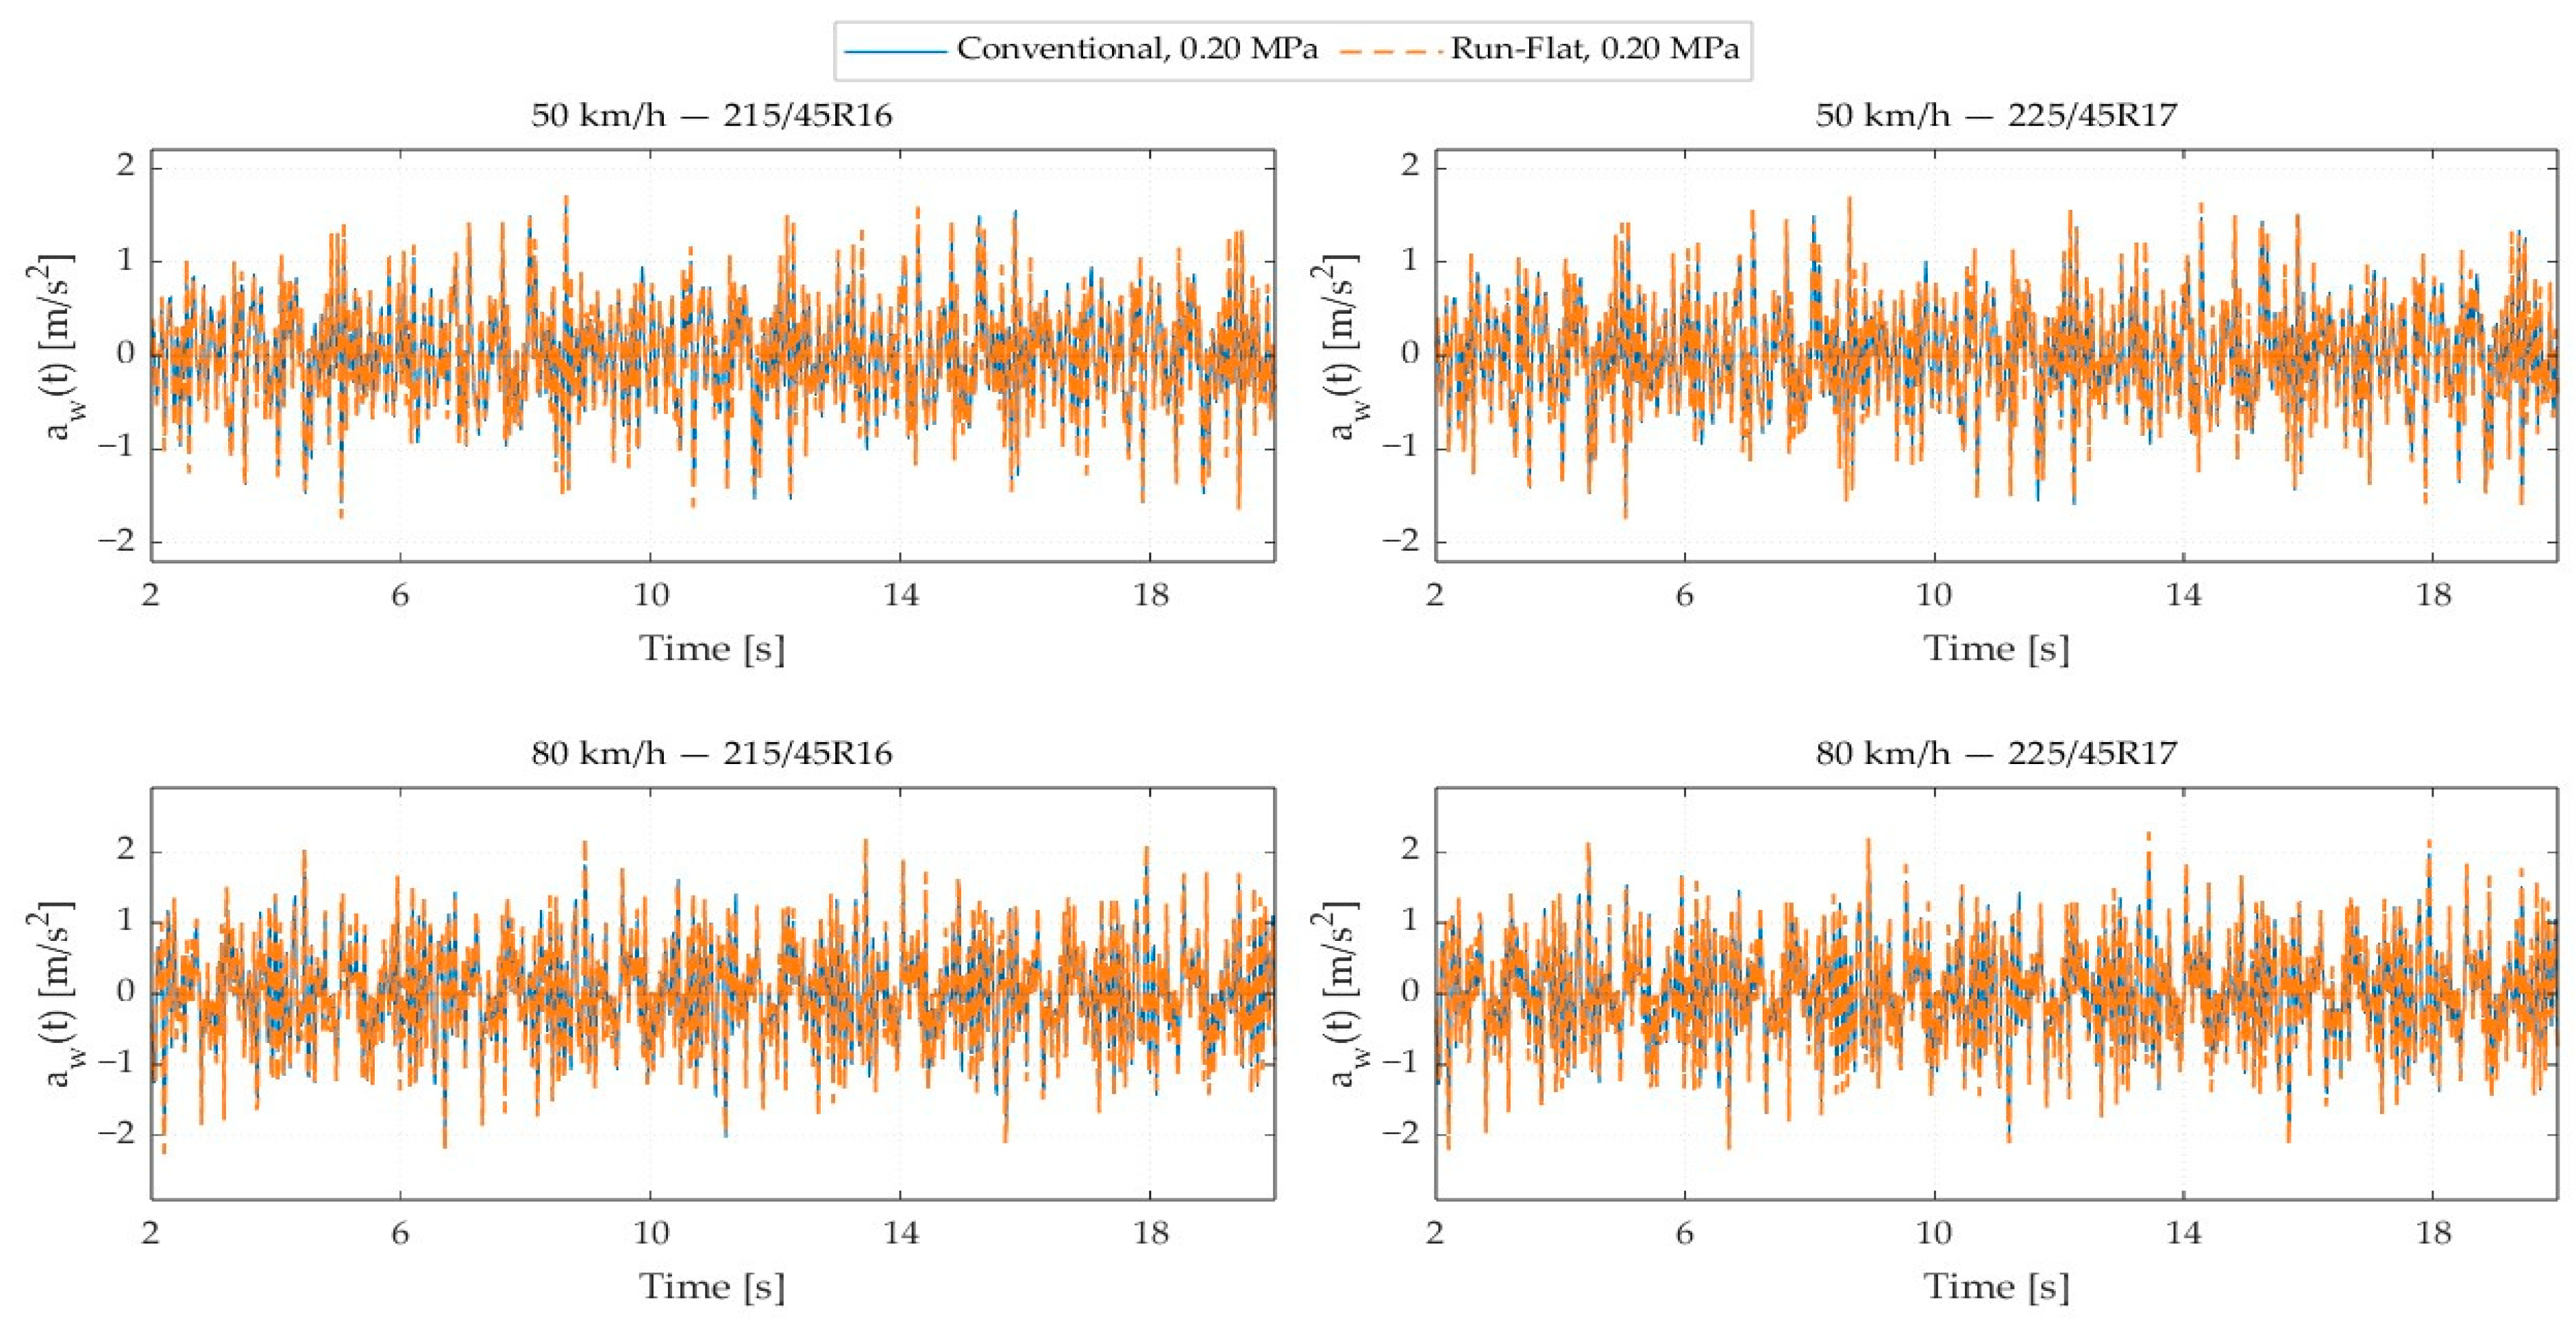
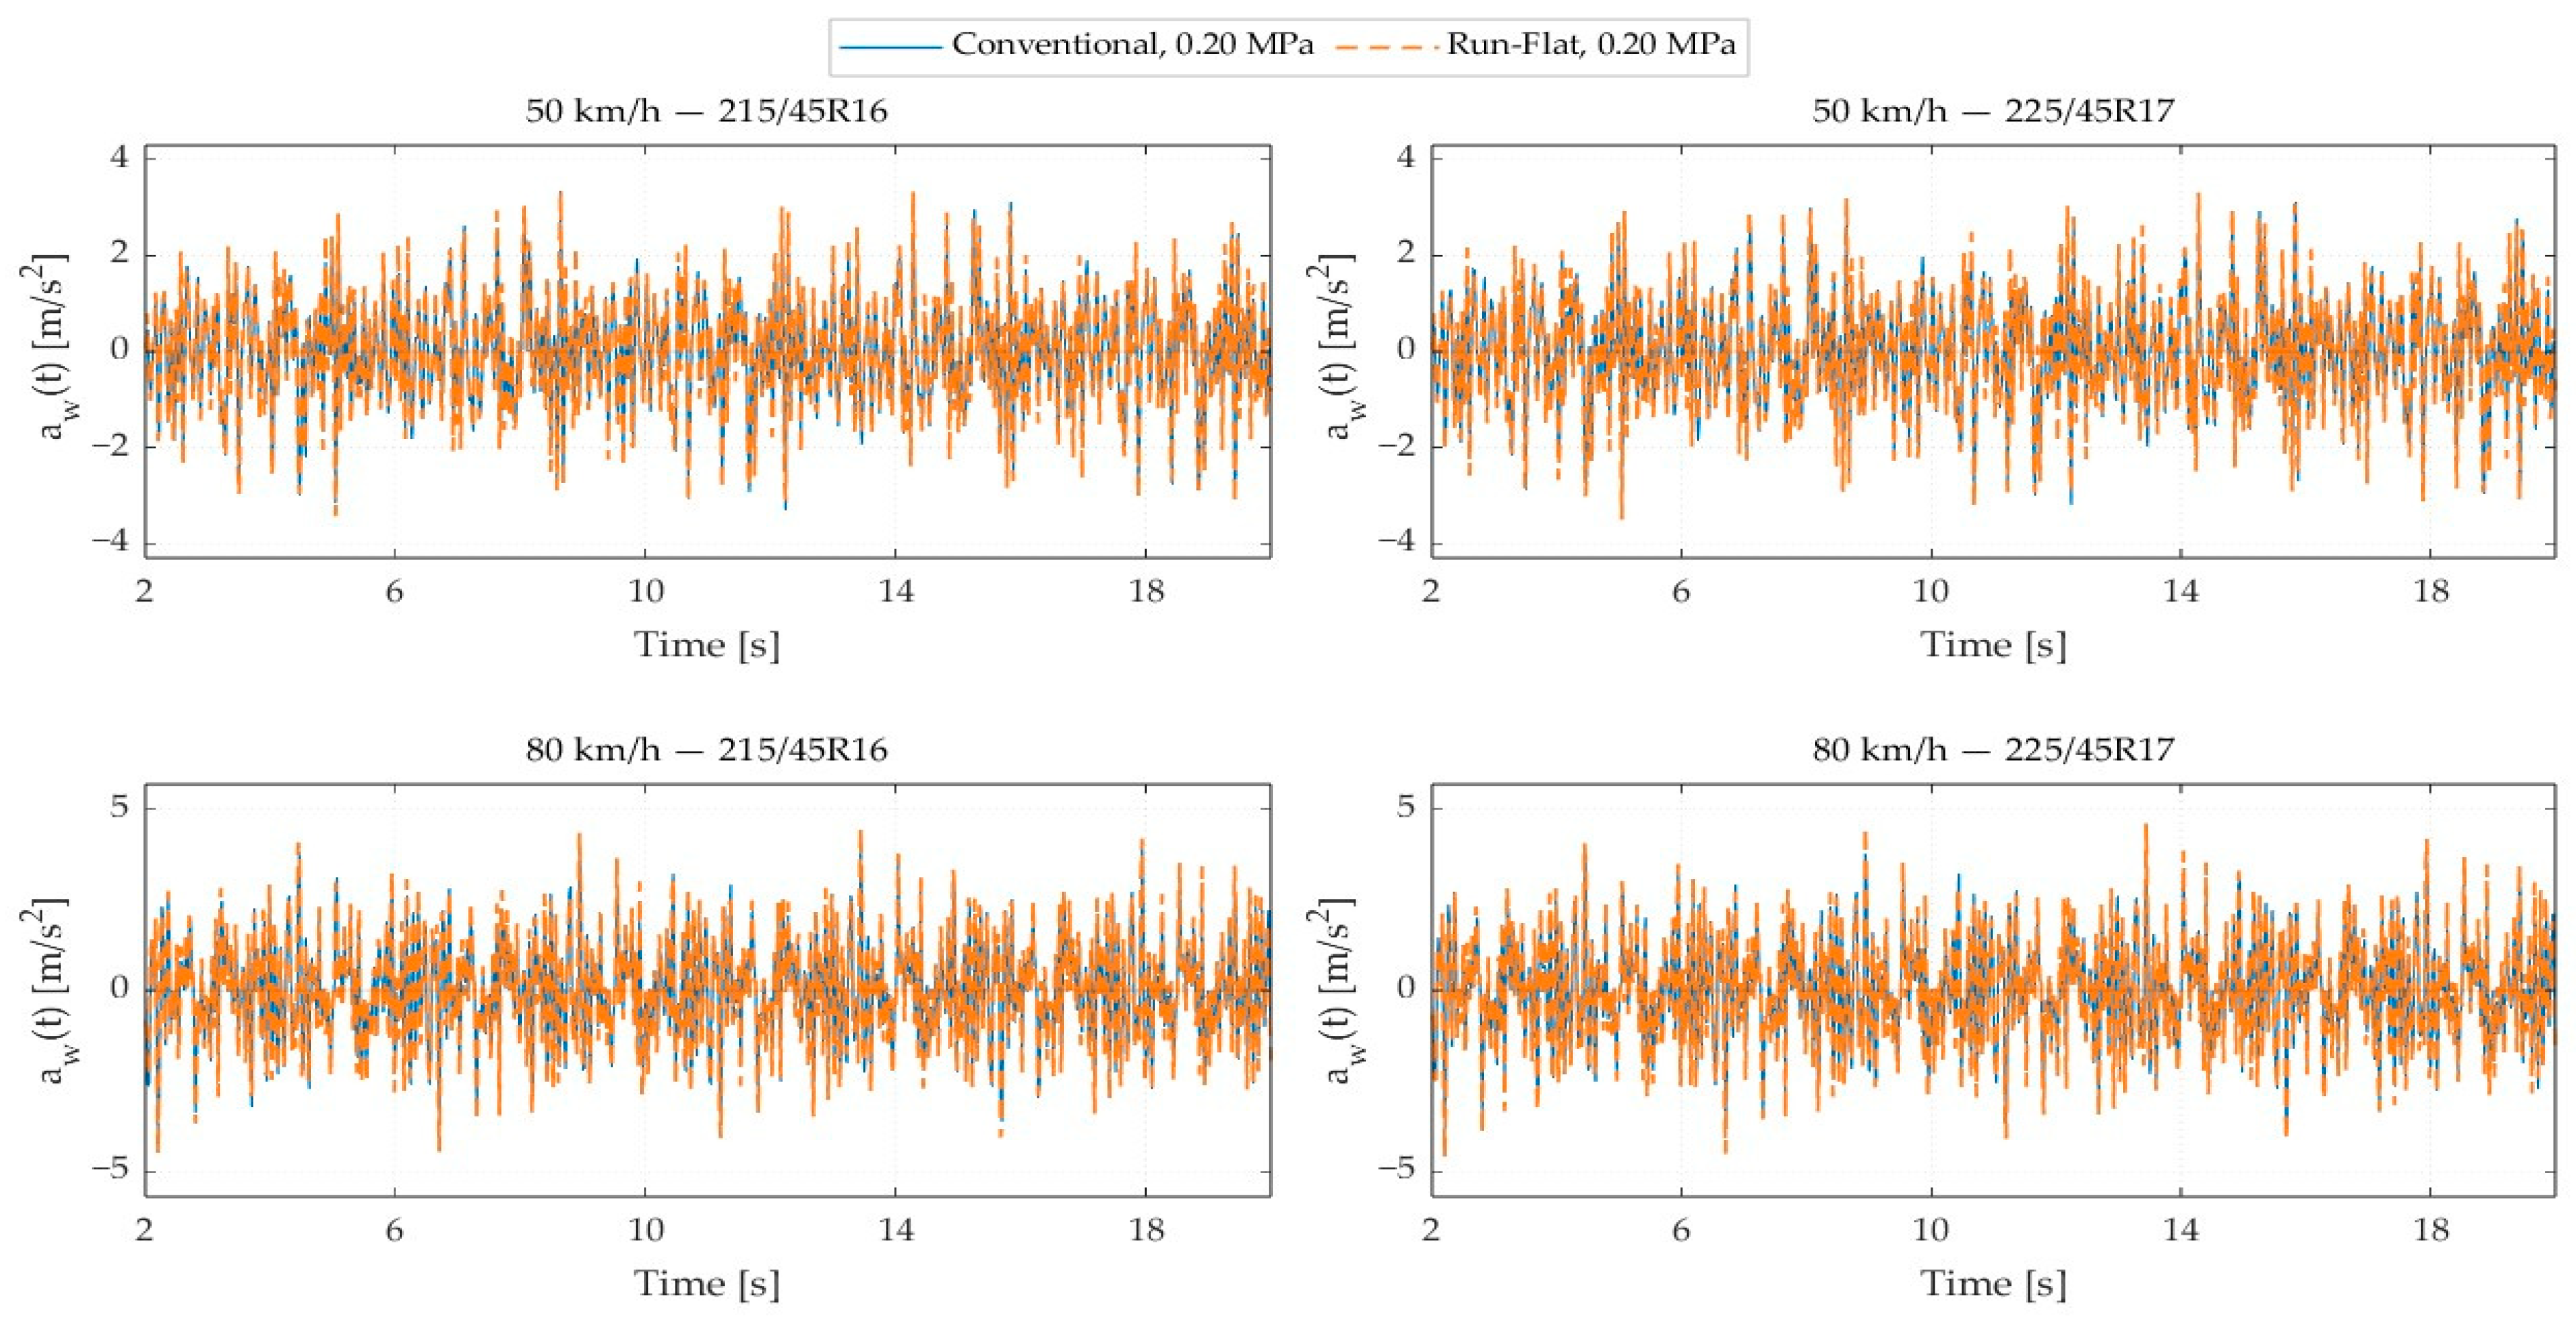
Figure 6 and Figure 7 show the time histories of the Wk-weighted acceleration avv(t) for the 215/45R16 and 225/45R17 tire configurations at 50 km/h and 80 km/h under ISO 8608 Class B and Class C excitation, respectively, comparing conventional and run-flat tires at 0.20 MPa. The peak instantaneous values reached approximately 1.7–2.3 m/s2 under Class B excitation and 3.4–4.7 m/s2 under Class C excitation, consistent with the stochastic, broadband nature of the ISO 8608:2016 road input. No persistent periodic component was observed in any of the 32 time histories, confirming the absence of resonance lock-in or numerical artifacts in the quarter-vehicle state-space integration.

4. Discussion

The simulation results demonstrate that, for the quarter-vehicle model and parameter set adopted in this study, tire construction (conventional vs. run-flat) exerts a consistent and quantifiable influence on ride comfort, while having no detectable differential effect on pressure sensitivity. The 9% run-flat comfort deficit observed here is consistent with the higher structural stiffness reported for run-flat constructions relative to conventional tires [11,26], and with the experimental comparison reported in [6], which similarly found increased vertical transmissibility for run-flat tires under matched conditions.
A more detailed quantitative comparison with [6] reveals a remarkable consistency: the ku,run-flat/ku,conventional ratio in the present study is 1.233 ± 0.004 across all four matched size pressure configurations (see Table 1), in close agreement with the [6] experimentally measured vertical stiffness ratio 1.231. This consistency provides external validation of the tire stiffness parameter set adopted in the simulation. This trend is independently corroborated by [11], which similarly reported higher vertical stiffness in run-flat constructions relative to conventional tires of equivalent size, consistent with the stiffness differentials adopted in Table 1. The ~9% increase in aw,rms is physically consistent with this stiffness differential; a 23% increase in ku produces a proportionally attenuated increase in sprung mass acceleration due to the low-pass filtering effect of the suspension above the wheel-hop frequency [17]. This attenuation mechanism is further supported by [34], which demonstrated experimentally that an increase in tire inflation pressure produces a proportional increase in unsprung mass vibration acceleration amplitude, together with an upward shift in the wheel-hop resonant frequency, precisely the behavior predicted by the present model. Discrepancies between the present simulation and [6] experimental context are expected due to differences in vehicle type, test conditions (quasi-static flat plank vs. dynamic random road excitation), and the neglect of nonlinear tire stiffness effects, which are known to introduce discrepancies between quasi-static and dynamic stiffness measurements [11], affecting the absolute magnitude of aw,rms but not the comparative ranking between tire types, which constitutes the primary conclusion of this study.
Agreement between the present simulation and [6] experimental findings is expected to be strongest under conditions of normal inflation pressure, moderate vehicle speed, and smooth to moderately rough surface, precisely the operating envelope covered by ISO 8608 Classes B and C at 50–80 km/h investigated in this study.
All 32 simulated scenarios produced aw,rms values above the not uncomfortable threshold (0.315 m/s2), and the Class C/80 km/h condition exceeded the uncomfortable threshold (0.800 m/s2) for all eight tire configurations. These magnitudes are higher than typically reported for passenger-vehicle ride comfort under comparable nominal road classes [16,35]. This discrepancy reflects, in part, the deliberately conservative nature of the present modeling choices, which isolate the tire-suspension-body subsystem and neglect additional compliance elements.
From a tire monitoring perspective, the similar pressure sensitivity observed for conventional and run-flat tires, approximately an 8% change in aw,rms for a 0.05 MPa pressure increase in both cases, indicates that iTPMS algorithms calibrated on conventional tires are expected to retain comparable sensitivity when applied to run-flat configurations, without requiring construction-specific recalibration. This conclusion holds within the linear stiffness range and operating conditions examined here (0.20–0.25 MPa, ISO 8608 Class B and C, 50–80 km/h), and warrants experimental confirmation.
Several limitations of the present study should be acknowledged. The present study is intentionally scoped at the tire-suspension-sprung mass subsystem level. First, the sprung-mass acceleration computed by the 2-DOF quarter-vehicle model represents the vehicle body response, not the seat-to-occupant interface specified as the reference measurement location in ISO 2631-1:1997. In a complete vehicle, the seat structure and cushion introduce additional compliance and damping that typically attenuate the acceleration transmitted from the vehicle body to the occupant. By isolating only the tire-suspension-body subsystem, the present model does not capture this attenuation and is therefore expected to overestimate the acceleration level experienced by a seated occupant. Second, the sprung and unsprung masses, suspension stiffness, and damping coefficient were adopted from representative literature values rather than identified experimentally for a specific vehicle platform, which limits the direct quantitative applicability of the results to any given production vehicle.
The principal modeling assumptions and their expected influence on the absolute values of aw,rms are characterized as follows. The linear tire stiffness assumption neglects the load and frequency dependence of ku, which is known to affect tire dynamic behavior [11], and may therefore introduce uncertainties in the absolute aw,rms values reported herein. The neglect of tire damping (cu/ku < 0.02 for all configurations) introduces a further uncertainty below 2%, consistent with standard practice in quarter-vehicle modeling [17,24]. The aw,rms values obtained in the present study are consistent in order of magnitude with those reported for passive quarter-vehicle suspensions subjected to ISO 8608 stochastic road excitation and evaluated per ISO 2631-1:1997 [30], providing further qualitative cross-validation of the simulation framework. Critically, these uncertainties are expected to affect all tire configurations proportionally, so that the comparative ranking between run-flat tires and conventional tires, which constitutes the primary conclusion of this study, is considered robust to these modeling assumptions.
Furthermore, the stochastic road profiles were generated using a single realization per scenario. Although the ISO 8608:2016 parameters fully specify the underlying spectrum, different random seeds yield slightly different time histories. A Monte Carlo extension, in which multiple independent realizations of each road class-speed-tire configuration are simulated and the resulting aw,rms statistics (mean and confidence intervals) are evaluated, would provide a more robust characterization of variability and is therefore identified as a direction for future work.

5. Conclusions

In summary, the proposed simulation framework combined a two-degree-of-freedom quarter-vehicle representation with ISO 8608:2016 stochastic road inputs and ISO 2631-1:1997 Wk frequency-weighted RMS acceleration to evaluate how tire construction, size, and inflation pressure shape vertical ride comfort across 32 scenarios spanning two road classes, two vehicle speeds, two tire sizes, and two pressure levels.
Run-flat tires consistently produced higher frequency-weighted RMS acceleration than the conventional equivalents across all 32 matched conditions, with a mean comfort deficit of approximately 9%. This decrease remained stable across road class, vehicle speed, and inflation pressure, indicating that the increased vertical stiffness of the reinforced run-flat sidewall is the primary factor governing the comfort degradation, independently of operating conditions. Under ISO 8608 Class B road excitation at 80 km/h, run-flat tires at 0.25 MPa crossed the ISO 2631-1:1997 boundary from fairly uncomfortable to uncomfortable, while the conventional equivalent remained below this threshold, illustrating the practical significance of the construction effect on comfort classification.
The sensitivity of aw,rms to a 0.05 MPa inflation pressure increase was approximately 8% for both tire types, with a difference of 0.29 percentage points between conventional and run-flat configurations that was not statistically significant. This invariance indicates that iTPMS algorithms calibrated on conventional tire dynamics are expected to retain comparable pressure-detection sensitivity when applied to run-flat equipped vehicles, without requiring construction-specific recalibration, within the operating range examined here.
The internal consistency of the model was confirmed by the ratio aw,rms(Class C)/aw,rms(Class B) = 1.998, in close agreement with the theoretical value of 2.000 derived from the ISO 8608:2016 road severity scaling. All results are subject to the limitations of the 2-DOF modeling framework, which does not account for seat-occupant compliance, pitch and roll dynamics, or vehicle-specific parameter identification, and should be interpreted as model-consistent rather than as absolute on-road predictions. This applies in particular to the tire-suspension-sprung mass subsystem scope of the present model. The present framework provides a reproducible basis for future extensions incorporating seat-occupant dynamics, vehicle-specific parameter identification, and experimental on-road validation.
From a practical standpoint, two directions emerge from the present results. First, the observed equivalence in pressure sensitivity between tire constructions (Section 3.3) suggests that a single, construction-independent calibration curve could be adopted for vertical-dynamics-based iTPMS algorithms, simplifying implementation for manufacturers offering both conventional and run-flat options on the same platform. Second, the demonstrated sensitivity of comfort classification to the combination of tire construction, road class, and speed (Section 3.1) suggests a potential application in comfort-aware speed advisory systems. Given real-time or a priori knowledge of road roughness class and tire configuration, potentially derived from the same suspension-vibration sensing used for iTPMS, a speed recommendation could be issued to maintain vibration exposure within a target ISO 2631-1 comfort category, a capability of particular relevance for semi-autonomous driving systems where ride comfort is an explicit optimization objective.
The results of this study confirm that run-flat tires offer important safety advantages, but they are accompanied by a measurable decrease in ride comfort, mainly due to their higher sidewall stiffness. Using the quarter-vehicle model and the ISO 2631-1 assessment framework, the analysis shows that inflation pressure, vehicle speed, and road quality directly influence the level of vibration transmitted to passengers. As a result, the choice of run-flat tires is a trade-off between post-puncture mobility and vehicle comfort, and these findings support modern strategies for suspension optimization and indirect tire monitoring systems.

Author Contributions

Conceptual design, methodological development, and manuscript preparation were carried out by C.-C.D.; conceptualization, critical review, and supervision were provided by N.B.; methodological refinement and review were performed by A.T.; review and literature analysis were performed by N.C.; language proofing and editing were performed by I.D. All authors have read and agreed to the published version of the manuscript.

Funding

The APC was funded by the Technical University of Cluj-Napoca. No other external financial support was received for this research.

Data Availability Statement

The original contributions presented in this study are included in the article. Further inquiries can be directed to the corresponding author.

Conflicts of Interest

The authors confirm that no conflicts of interest exist regarding this study.

References

  1. Run Flat Tire Market Set to Reach $6.66 Billion by 2030, Driven by a 4.02% CAGR. Available online: https://www.marknteladvisors.com/press-release/run-flat-tire-market-growth (accessed on 15 April 2025).
  2. Run-Flat Tire Inserts Market Growth—Trends & Forecast 2025 to 2035. Available online: https://www.futuremarketinsights.com/reports/run-flat-tire-inserts-market (accessed on 15 April 2025).
  3. Run Flat Tire Market Size and Outlook 2031. Available online: https://www.techsciresearch.com/report/run-flat-tire-market/3466.html (accessed on 15 April 2025).
  4. Cho, J.R.; Lee, J.H.; Jeong, K.M.; Kim, K.W. Optimum Design of Run-Flat Tire Insert Rubber by Genetic Algorithm. Finite Elem. Anal. Des. 2012, 52, 60–70. [Google Scholar] [CrossRef] [Scilit]
  5. Lv, T.; Zang, L.; Xue, C.; Li, Y.; Mao, Y.; Wang, X. Study on the Effect of Different Design Parameters of Sidewall Insert Rubber on the Mechanical Characteristics of Self-Supporting Run-Flat Tires. Lubricants 2023, 11, 458. [Google Scholar] [CrossRef] [Scilit]
  6. Veld, I.B.A. Run flat tires versus conventional tires: An experimental comparison. In Mechanical Engineering, DCT Rapporten; Technische Universiteit Eindhoven: Eindhoven, The Netherlands, 2006; Volume 2006.042. [Google Scholar]
  7. Wang, X.; Zang, L.; Wang, Z.; Zhao, Z.; Lin, F.; Teng, F. Analysis of Mechanical Characteristics of Inserts Supporting Run-Flat Tire during Pressure Relief. J. Braz. Soc. Mech. Sci. Eng. 2021, 43, 235. [Google Scholar] [CrossRef] [Scilit]
  8. Wang, X.; Zang, L.; Wang, Z.; Lin, F.; Zhao, Z. Study on the Stability Control of Vehicle Tire Blowout Based on Run-Flat Tire. World Electr. Veh. J. 2021, 12, 128. [Google Scholar] [CrossRef] [Scilit]
  9. Zang, L.; Wang, X.; Wu, C.; Teng, F.; Yang, S. Analysis of Load Characteristic and Contact Patch Characteristic of Support Insert Run-Flat Tire under Zero-Pressure Condition. Int. J. Automot. Technol. 2021, 22, 1141–1151. [Google Scholar] [CrossRef] [Scilit]
  10. Zang, L.; Xue, C.; Peng, X.; Jiao, J.; Feng, Y.; Mao, Y. Investigation on Dynamic Characteristics of Inserts Supporting Run-Flat Tyre Based on the Modified Non-Linear Ground Pressure Distribution. Int. J. Non-Linear Mech. 2024, 167, 104916. [Google Scholar] [CrossRef] [Scilit]
  11. Bae, J.-J.; You, Y.; Suh, J.B.; Kang, N. Calculation of the Structural Stiffness of Run-Flat and Regular Tires by Considering Strain Energy. Int. J. Automot. Technol. 2019, 20, 979–987. [Google Scholar] [CrossRef] [Scilit]
  12. Park, N.; Seo, J.; Kim, K.; Sim, J.; Kang, Y.; Han, M.; Kim, W. Sidewall-Insert Compound Based on ZnO-Treated Aramid Pulp Fibers for Run-Flat Tires. Compos. Interfaces 2016, 23, 781–796. [Google Scholar] [CrossRef] [Scilit]
  13. Ribeiro, J.G.T.; Cunha, A. Scenario-Driven Optimization of Passive Vehicle Suspensions: Explaining the Effectiveness of Asymmetric Damping. J. Vib. Eng. Technol. 2026, 14, 292. [Google Scholar] [CrossRef] [Scilit]
  14. Tiwari, A.; Akanksha, S.; Shubham, M.; Shahane, A. Study of road holding and ride comfort analysis with the help of quarter car model. Int. J. Sci. Dev. Res. (IJSDR) 2018, 13, 294–304. [Google Scholar]
  15. ISO 8608:2016; Mechanical Vibration—Road Surfaces Profiles—Reporting of Measured Data. International Organization for Standardization: Geneva, Switzerland, 2016.
  16. Agostinacchio, M.; Ciampa, D.; Olita, S. The Vibrations Induced by Surface Irregularities in Road Pavements—A Matlab® Approach. Eur. Transp. Res. Rev. 2014, 6, 267–275. [Google Scholar] [CrossRef] [Scilit]
  17. Gillespie, T. Fundamentals of Vehicle Dynamics; SAE International: Warrendale, PA, USA, 2021. [Google Scholar]
  18. ISO 2631-1:1997; Mechanical Vibration and Shock—Evaluation of Human Exposure to Whole-Body Vibration—Part 1: General Re-quirements. International Organization for Standardization: Geneva, Switzerland, 1997.
  19. Zhang, S.Y.; Zhu, M.; Li, Y.; Jiang, J.Z.; Ficca, R.; Czechowicz, M.; Neilson, R.; Neild, S.A.; Herrmann, G. Ride Comfort Enhancement for Passenger Vehicles Using the Structure-Immittance Approach. Veh. Syst. Dyn. 2021, 59, 504–525. [Google Scholar] [CrossRef] [Scilit]
  20. Yang, Y.; Liu, C.; Chen, L.; Zhang, X. Phase Deviation of Semi-Active Suspension Control and Its Compensation with Inertial Suspension. Acta Mech. Sin. 2024, 40, 523367. [Google Scholar] [CrossRef] [Scilit]
  21. Liu, H.; Pan, Y.; Bian, H.; Wang, C. Optimize Design of Run-Flat Tires by Simulation and Experimental Research. Materials 2021, 14, 474. [Google Scholar] [CrossRef] [Scilit] [PubMed]
  22. Jin, L.; Peng, X.; Liu, J.; Zhang, Q.; Li, J.; Li, L. Robust Algorithm of Indirect Tyre Pressure Monitoring System Based on Tyre Torsional Resonance Frequency Analysis. J. Sound. Vib. 2022, 538, 117198. [Google Scholar] [CrossRef] [Scilit]
  23. Danci, C.C.; Irina, D.U.M.A.; Buidin, T.I.C.; Cordoș, N.; Todoruț, A. Vertical vibration analysis of a Formula Student vehicle using different suspension system configurations. In Cluj-Napoca, Acta Technica Napocensis; Applied Mathematics, Mechanics, and Engineering; U.T.PRESS Publishing House: Cluj-Napoca, Romania, 2024; Volume 67, pp. 121–130. [Google Scholar]
  24. Jazar, R.N. Vehicle Dynamics: Theory and Applications; Springer International Publishing: Cham, Switzerland, 2017. [Google Scholar]
  25. Patil, S.A.; Joshi, S.G. Experimental Analysis of 2 DOF Quarter-Car Passive and Hydraulic Active Suspension Systems for Ride Comfort. Syst. Sci. Control Eng. 2014, 2, 621–631. [Google Scholar] [CrossRef] [Scilit]
  26. Nagarkar, M.P.; El-Gohary, M.A.; Bhalerao, Y.J.; Vikhe Patil, G.J.; Zaware Patil, R.N. Artificial Neural Network Predication and Validation of Optimum Suspension Parameters of a Passive Suspension System. SN Appl. Sci. 2019, 1, 569. [Google Scholar] [CrossRef] [Scilit]
  27. Danci, C.C.; Burnete, N.; Todoruț, A.; Cordoș, N.; Duma, I. Analysis of the tire vertical stiffness influence on the vehicle safety. J. Eng. Sci. Innov. 2025, 10, 93–102. [Google Scholar] [CrossRef] [Scilit]
  28. Yang, L.; Ballo, F.; Previati, G.; Gobbi, M. Robust Optimization of Road Vehicle Suspension Considering the Variation of Tire Vertical Stiffness. J. Model. Optim. 2019, 11, 8–15. [Google Scholar] [CrossRef] [Scilit]
  29. Lee, D.-H.; Yoon, D.-S.; Kim, G.-W. New Indirect Tire Pressure Monitoring System Enabled by Adaptive Extended Kalman Filtering of Vehicle Suspension Systems. Electronics 2021, 10, 1359. [Google Scholar] [CrossRef] [Scilit]
  30. Múčka, P. Simulated Road Profiles According to ISO 8608 in Vibration Analysis. J. Test. Eval. 2018, 46, 405–418. [Google Scholar] [CrossRef] [Scilit]
  31. Shinozuka, M.; Jan, C.-M. Digital Simulation of Random Processes and Its Applications. J. Sound Vib. 1972, 25, 111–128. [Google Scholar] [CrossRef] [Scilit]
  32. Rimell, A.N.; Mansfield, N.J. Design of Digital Filters for Frequency Weightings Required for Risk Assessments of Workers Exposed to Vibration. Ind. Health 2007, 45, 512–519. [Google Scholar] [CrossRef] [Scilit] [PubMed]
  33. ISO 8041-1:2017; Human Response to Vibration—Measuring Implementation—Part 1: General Purpose Vibration Meters. International Organization for Standardization: Geneva, Switzerland, 2017.
  34. Konieczny, Ł.; Burdzik, R.; Warczek, J.; Czech, P.; Wojnar, G.; Młyńczak, J. Determination of the effect of tire stiffness on wheel accelerations by the forced vibration test method. J. Vibroeng. 2015, 17, 4469–4477. [Google Scholar] [CrossRef] [Scilit]
  35. Jugulkar, L.M.; Singh, S.; Sawant, S.M. Analysis of Suspension with Variable Stiffness and Variable Damping Force for Automotive Applications. Adv. Mech. Eng. 2016, 8, 1687814016648638. [Google Scholar] [CrossRef] [Scilit]
Figure 1. Comparison of conventional tire and run-flat tire sidewall profiles under reduced inflation pressure [4,5,7,11,12].
Electronics 15 03636 g001
Figure 2. Quarter-vehicle model [17,23,24].
Electronics 15 03636 g002
Figure 3. Overview of the simulation framework.
Electronics 15 03636 g003
Figure 4. RMS Wk-weighted acceleration aw,rms for all eight tire configurations across four road class-speed combinations (ISO 8608 Class B and C, 50 and 80 km/h).
Electronics 15 03636 g004
Figure 5. Relative change in aw,rms due to inflation pressure increase from 0.20 to 0.25 MPa, for each tire type and size across four road class-speed combinations.
Electronics 15 03636 g005
Figure 6. Wk-weighted acceleration time-history aw(t) for conventional and run-flat tire configurations under ISO 8608 Class B road excitation at 0.20 MPa.
Electronics 15 03636 g006
Figure 7. Wk-weighted acceleration time-history aw(t) for conventional and run-flat tire configurations under ISO 8608 Class C road excitation at 0.20 MPa.
Electronics 15 03636 g007
Table 1. Dynamic and structural parameters used in the simulation model.
ParameterAssigned ValueMeasurement UnitReferences
Suspension system damping coefficient1725[Ns/m][27]
Stiffness constant of front spring28,000[N/m][27]
Vertical stiffness of conv. tire (0.20 MPa, 215/45 R16)215,521[N/m][27,28]
Vertical stiffness of conv. tire (0.25 MPa, 215/45R16)260,949[N/m][27,28]
Vertical stiffness of conv. tire (0.20 MPa, 225/45R17)221,174[N/m][11,27,29]
Vertical stiffness of conv. tire (0.25 MPa, 225/45R17)268,394[N/m][11,27,29]
Vertical stiffness of run-flat tire (0.20 MPa, 215/45R16)265,091[N/m][27,28]
Vertical stiffness of run-flat tire (0.25 MPa, 215/45R16)320,968[N/m][27,28]
Vertical stiffness of run-flat tire (0.20 MPa, 225/45R17)274,021[N/m][11,27,29]
Vertical stiffness of run-flat tire (0.25 MPa, 225/45R17)330,662[N/m][11,27,29]
Unsprung mass (quarter-vehicle equivalent)47[kg][27]
Sprung mass (quarter-vehicle equivalent)330.75[kg][27]
Table 2. Simulation scenarios.
Analyzed FactorValue
Tire typeConventional, run-flat
Tire dimension215/45R16, 225/45R17
Inflation pressure0.20 MPa, 0.25 MPa
Road class (ISO 8608)Class B, Class C
Vehicle speed50 km/h (13.89 m/s), 80 km/h (22.22 m/s)
Simulation time20 s
Sampling frequency1000 Hz
Total scenarios32
Table 3. Frequency-weighted RMS acceleration aw,rms and ISO 2631-1:1997 comfort classification.
Tire TypeSizePressure [MPa]Road ClassSpeed [km/h]aw,rms
[m/s2]
ISO 2631-1 Comfort Category
Conventional215/45R160.20B500.542Fairly uncomfortable
Conventional215/45R160.25B500.584Fairly uncomfortable
Conventional225/45R170.20B500.549Fairly uncomfortable
Conventional225/45R170.25B500.590Fairly uncomfortable
Run-flat215/45R160.20B500.588Fairly uncomfortable
Run-flat215/45R160.25B500.635Fairly uncomfortable
Run-flat225/45R170.20B500.595Fairly uncomfortable
Run-flat225/45R170.25B500.644Fairly uncomfortable
Conventional215/45R160.20B800.702Fairly uncomfortable
Conventional215/45R160.25B800.762Fairly uncomfortable
Conventional225/45R170.20B800.709Fairly uncomfortable
Conventional225/45R170.25B800.773Fairly uncomfortable
Run-flat215/45R160.20B800.771Fairly uncomfortable
Run-flat215/45R160.25B800.833Uncomfortable
Run-flat225/45R170.20B800.780Fairly uncomfortable
Run-flat225/45R170.25B800.836Uncomfortable
Conventional215/45R160.20C501.085Uncomfortable
Conventional215/45R160.25C501.169Uncomfortable
Conventional225/45R170.20C501.098Uncomfortable
Conventional225/45R170.25C501.177Uncomfortable
Run-flat215/45R160.20C501.177Uncomfortable
Run-flat215/45R160.25C501.272Very uncomfortable
Run-flat225/45R170.20C501.191Uncomfortable
Run-flat225/45R170.25C501.282Very uncomfortable
Conventional215/45R160.20C801.399Very uncomfortable
Conventional215/45R160.25C801.517Very uncomfortable
Conventional225/45R170.20C801.420Very uncomfortable
Conventional225/45R170.25C801.541Very uncomfortable
Run-flat215/45R160.20C801.539Very uncomfortable
Run-flat215/45R160.25C801.656Very uncomfortable
Run-flat225/45R170.20C801.559Very uncomfortable
Run-flat225/45R170.25C801.678Very uncomfortable
Disclaimer/Publisher’s Note: The statements, opinions and data contained in all publications are solely those of the individual author(s) and contributor(s) and not of MDPI and/or the editor(s). MDPI and/or the editor(s) disclaim responsibility for any injury to people or property resulting from any ideas, methods, instructions or products referred to in the content.