1. Introduction
As the smart grid gradually advances towards digitalization and intelligence, the secondary system of smart substations, as the core hub of the grid, exhibits significant characteristics such as a large number of devices, complex information interaction, and heterogeneous data sources [
1,
2,
3,
4]. Currently, the condition assessment of the secondary system of smart substations faces multiple technical challenges [
5,
6,
7,
8]. Firstly, traditional assessment methods often rely on single or limited indicators such as equipment self-check information or historical action accuracy rates, which struggle to comprehensively reflect the system’s true operating conditions across multiple dimensions, including health status, information transmission, and environmental coupling. This results in the issue of “data silos”. Furthermore, Boolean alarm information generated by the self-check of secondary equipment is often overlooked by traditional assessment methods, leading to a “passivation” of the assessment results for the secondary system of smart substations. Therefore, there is an urgent need to establish a high-precision, multi-dimensional real-time condition assessment system for the secondary system of smart substations.
In the realm of digital twin modeling and monitoring applications, researchers both domestically and internationally have conducted in-depth studies [
9,
10,
11,
12,
13,
14,
15,
16]. Reference [
11] introduces digital twins into smart substations, constructing a digital grid architecture encompassing physical, perception, transmission, data, platform, and application layers. This framework is applicable for the future development of digital twin smart substations. Reference [
12] establishes a real-time interaction system between physical and virtual substations and sets up a digital twin test platform to verify its consistency with the physical test platform. Reference [
13] applies digital twin technology to the field of power system protection, extending it to conduct virtual collaborative testing among different digital twins such as protection relays. This significantly enhances the safety and economic benefits of future secondary system protection testing for power grids. Reference [
14] utilizes digital twins to integrate real-time measurements, physical grid virtual models, and state estimation algorithms into an advanced distribution management system. This system maintains continuous synchronization with real-time grid conditions and employs case studies to demonstrate the practicality of the constructed framework in the real-time state assessment of smart substations. Digital twin technology is gradually extending to underlying modeling methods such as component classification and coding for substation equipment and 3D point cloud recognition, providing technical support for the high-precision virtual twin construction of secondary systems [
15,
16].
In terms of the application of weighting methods, commonly used weighting methods include the Analytic Hierarchy Process (AHP), entropy weight method, variable weight method, and combined weighting method [
17,
18,
19,
20,
21,
22,
23,
24,
25,
26]. AHP and its extended methods have been widely used for determining subjective weights in substation equipment condition assessment. Reference [
21] proposes a hybrid multi-criteria decision-making method based on AHP for the comprehensive evaluation system of the entire life cycle of substations, verifying the applicability of AHP in multi-attribute priority ranking. Reference [
22] combines AHP with the Technique for Order Preference by Similarity to an Ideal Solution (TOPSIS), using Rough AHP (RAHP) to calculate index weights and the improved TOPSIS technique for the comprehensive evaluation of substation busbar power quality, thereby achieving a more comprehensive and accurate assessment of substation operating conditions. However, AHP is highly subjective, with results relying on expert preferences, and unable to handle the interdependence and feedback relationships between indicators. The combined weighting method, which considers both subjective and objective weights, can effectively reduce the chance errors caused by single weighting methods. Reference [
23] establishes a comprehensive evaluation model for the health status of secondary equipment using a subjective–objective combined weighting method that combines AHP and the entropy weight method, effectively reducing the biases caused by single weighting methods. Reference [
24] proposes a combined weighting method based on the Analytic Hierarchy Process and the entropy weight method to obtain the weights of indicators, using the cloud model to replace the membership function to assess the state of secondary equipment in order to address the complex fault mechanisms of secondary equipment and the difficulty in mining potential risks of equipment with traditional single indicators. Reference [
25] further addresses the issue of high sensitivity of the entropy weight method by introducing the anti-entropy weight method and AHP for combined weighting and improves the timeliness of relay protection system condition evaluation through an information trend prediction strategy. Reference [
26] combines the improved AHP, anti-entropy weight method, and coefficient of variation method to determine the combined weights of indicators for relay protection equipment condition evaluation, effectively overcoming the limitations of single weighting methods. The aforementioned research has made significant progress in digital twin modeling and the application of weighting methods. However, most work still focuses on the independent application of single technical dimensions, lacking a systematic evaluation framework that deeply couples the real-time mapping capability of digital twins with the comprehensive evaluation capability of combined weighting methods. Reference [
12] constructed a digital twin testing platform for intelligent substation networks, and its contribution is also reflected in the feasibility and engineering consistency verification of the system architecture. Reference [
13] extends digital twins to the field of virtual collaborative testing for relay protection, and its innovation focuses on a collaborative testing framework across digital twins, rather than breakthroughs in underlying modeling algorithms. Therefore, systematic architecture innovation and deep integration of multiple technologies in the secondary system state assessment scenario of intelligent substations are also important contributions to promoting progress in the field. Reference [
14] points out that the core value of digital twins in distribution network monitoring lies in architecture design and system integration.
In summary, this article proposes a state evaluation method for the secondary system of intelligent substations based on digital twin and combination weighting methods. Firstly, a four-layer digital twin architecture consisting of “physical perception, data interaction, virtual twin, service application” is constructed to achieve precise mapping and real-time closed-loop interaction of multi-source heterogeneous data in the secondary system. On this basis, a comprehensive and multi-level evaluation index system for the secondary system of intelligent substations is established from three dimensions: equipment health status, information transmission quality, and environmental conditions. Next, a combined weighting evaluation model is proposed that integrates the subjective weights of the Analytic Hierarchy Process and the objective weights of the coefficient of variation method, effectively avoiding the inherent shortcomings of a single weighting method. Finally, taking a certain 220 kV intelligent substation as the object, a digital twin simulation platform was constructed to conduct multi-state evaluation and verification of the operating status of typical secondary equipment, typical fault case verification, as well as ablation and sensitivity analysis, to verify the effectiveness and robustness of the proposed model.
2. Construction of a State Evaluation Index System for the Secondary System of Smart Substations
2.1. Four-Layer Architecture Design of Digital Twins
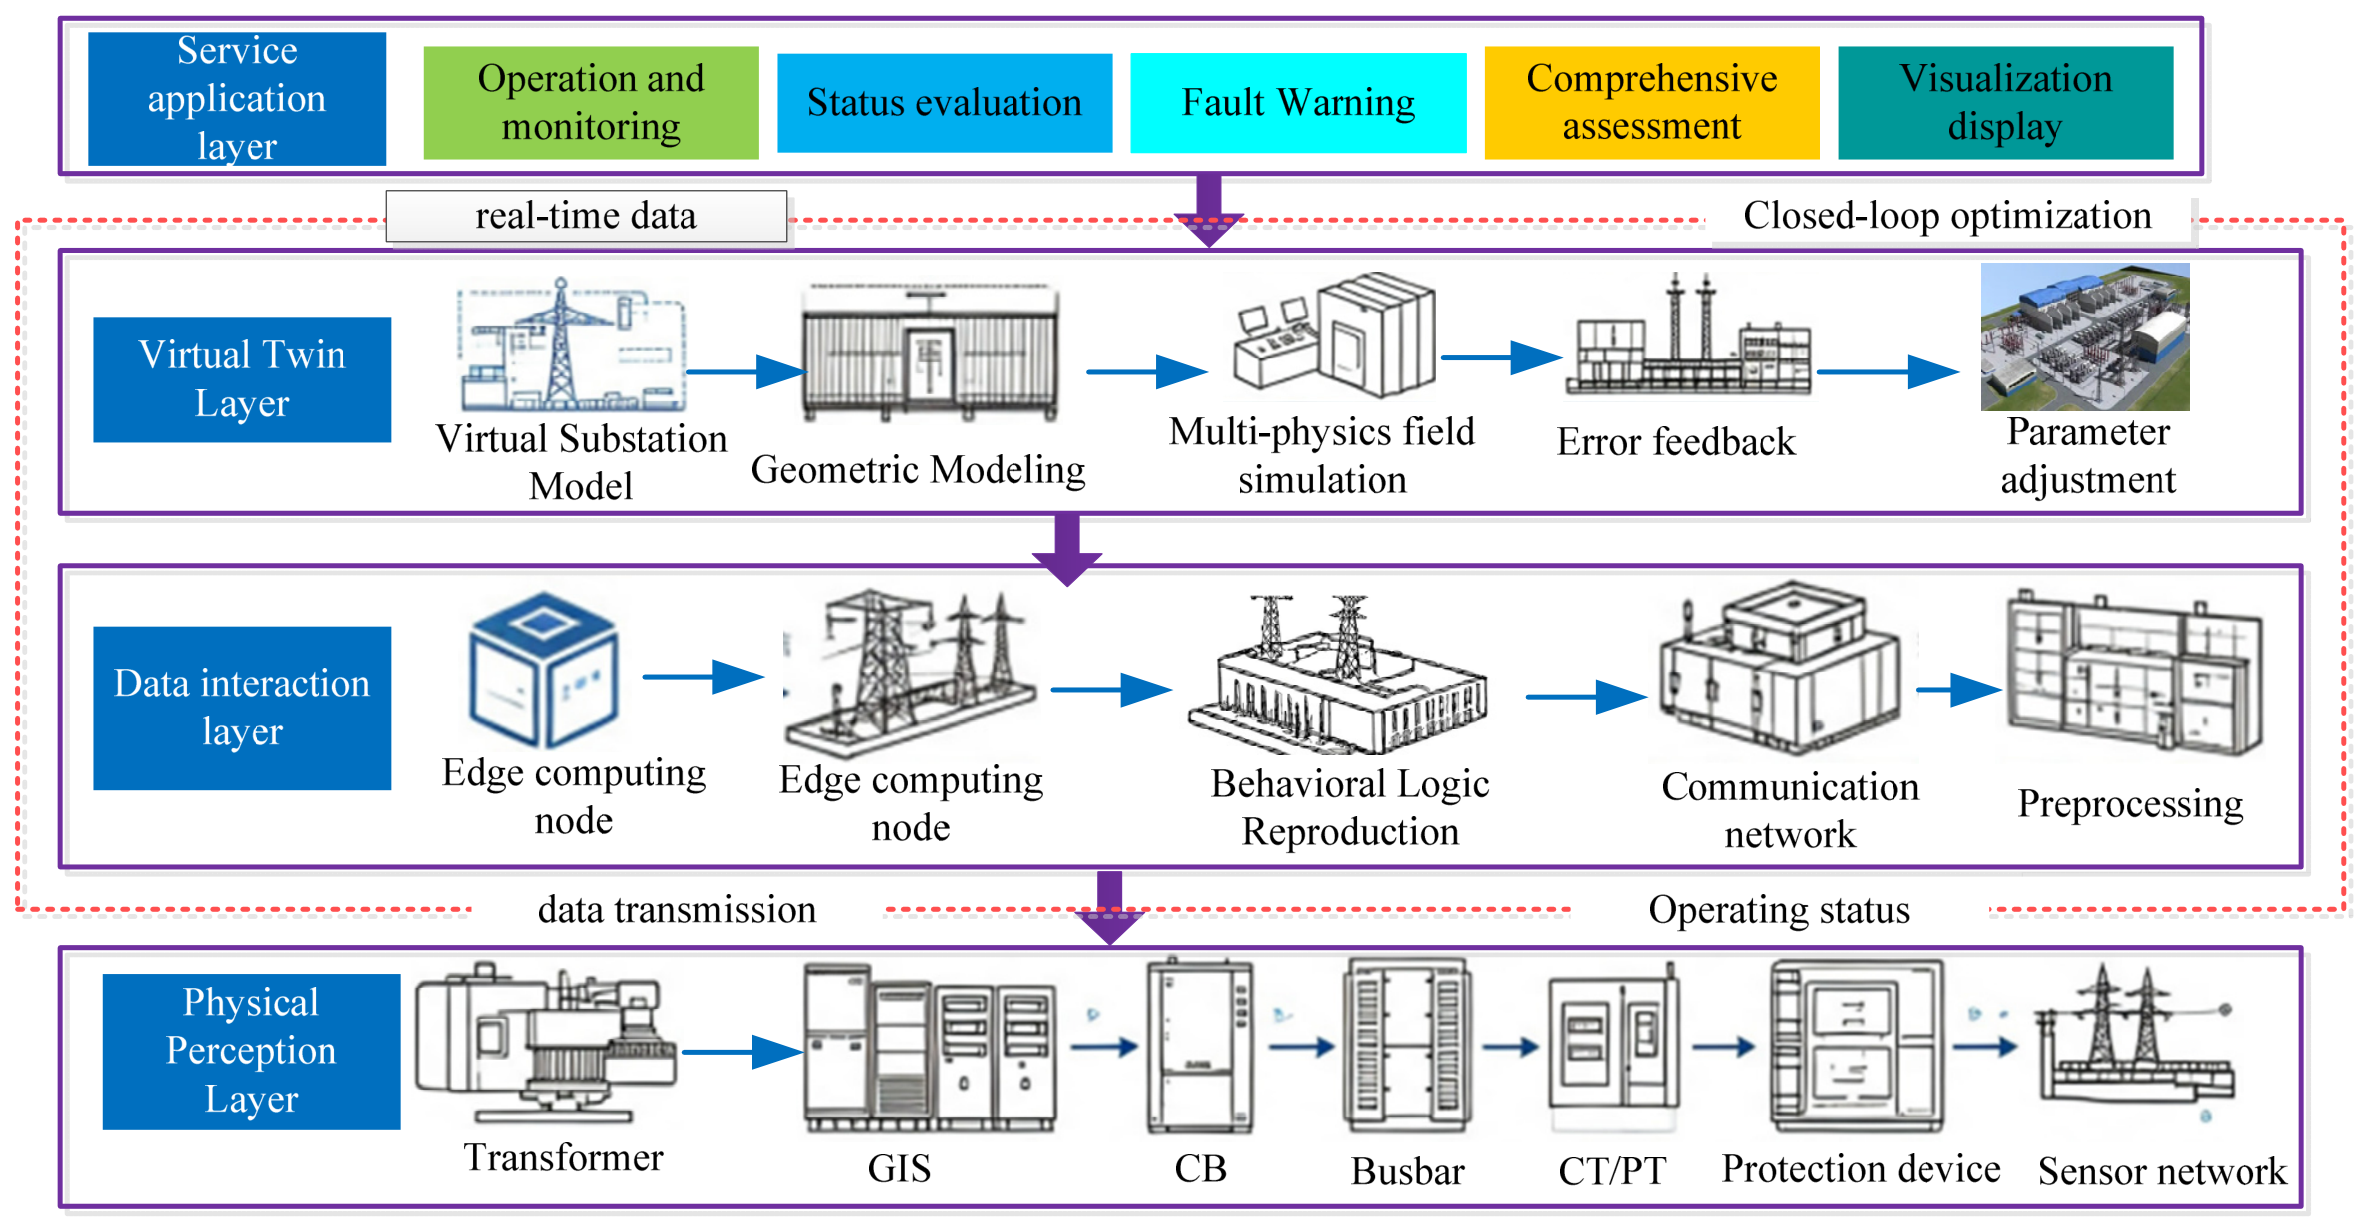
Digital twin technology deeply integrates physical entities, virtual simulation models, and data transmission technology. It can real-time reproduce the operating status of physical systems, simulate and analyze the development trend of system behavior, and achieve optimized control over the entire lifecycle of equipment. This technology has core features such as multidimensional mapping, real-time interaction, dynamic iteration, and service empowerment, which are highly compatible with the operational characteristics of complex systems in intelligent substations. To study the specific application of digital twin technology in the secondary system state evaluation system of intelligent substations, this paper constructs a four-layer digital twin architecture, with the core link of “physical perception data interaction virtual twin service application”. Each layer forms a complete closed-loop operation mechanism through data flow and technology collaboration. The overall architecture is shown in
Figure 1.
- (1)
Physical Perception Layer: The underlying foundation that constitutes the overall architecture of an intelligent substation, serving as the data source for the twin system. Its main task is to collect comprehensive operational status information of physical devices and systems, providing raw data support for subsequent data processing, model construction, and functional applications. This layer is mainly composed of various on-site equipment such as measurement, metering, and monitoring devices. Specifically, it includes fiber optic temperature sensors (monitoring winding temperature and oil temperature), vibration sensors (capturing mechanical vibration frequency and displacement), PMU phasor measurement units (collecting electrical parameters such as voltage, current, and power), SF6 gas monitors (tracking GIS equipment gas density and humidity), and environmental monitoring equipment such as temperature and humidity sensors. These sensors collect data according to the IEC 61850 standard protocol [
27], and the sampling frequency is dynamically adjusted between 100 Hz and 1 kHz based on parameter importance, providing raw data support for subsequent data processing, model construction, and functional applications.
- (2)
The data interaction layer connects the physical perception unit and the virtual twin unit and is a key data transfer module in the entire architecture. This layer is responsible for the transmission, screening and pre-processing of multi-source heterogeneous data. The hardware and functional modules involved include three core components: edge computing node, 5G and optical fiber communication network, and data pre-processing unit. The edge computing node is deployed at the substation end to complete the initial improvement of data quality nearby. The communication network adopts a differentiated transmission strategy, utilizing 5G network slicing technology to ensure low latency transmission of critical information (such as fault transient data and GOOSE/SV messages), with end-to-end latency controlled within 10 ms. Non critical data (such as routine monitoring records and historical trend data) are transmitted in bulk through fiber optic networks. The data preprocessing unit standardizes and formats the raw data, eliminates format differences between data from different sources, and provides high-quality, time-aligned data input for the virtual twin layer.
- (3)
Virtual twin layer: the core module in the secondary system state evaluation system. This layer utilizes techniques such as geometric modeling, multi-physics field simulation, and behavioral logic replication to construct virtual images that correspond one-to-one with physical devices, thereby achieving high-precision digital mapping of physical entities and ensuring real-time synchronization between virtual simulation devices and on-site physical devices. This has formed a relatively mature technical system in current research on digital twin modeling of power systems. The specific modeling process is as follows: ① Geometric modeling: Import the equipment CAD drawings into the Unity 3D platform to build a millimeter-level precision 3D geometric model, covering the appearance, internal structure, and power grid topology of the equipment, supporting interactive operations such as scaling, rotation, and sectional views. ②Multi-physics modeling: Building a physical field model of the equipment based on the ANSYS 2025 R1 simulation platform. Behavioral logic modeling utilizes MATLAB/Simulink R2025a to construct device operation behavior models (such as protection logic and control strategies) and receives real-time data-driven data through the data interaction layer to ensure synchronization between virtual and physical device operation behaviors. ③ Model calibration: Using an error feedback mechanism to optimize model accuracy. After inputting real-time physical device data into the virtual model, calculate the mean absolute percentage error (MAPE) between the model output value and the actual measurement value. If the MAPE exceeds 5%, the particle swarm optimization (PSO) algorithm is used to iteratively correct key parameters (such as transformer oil thermal conductivity and circuit breaker trip time threshold) until the accuracy requirements are met. The calibrated model parameters are dynamically updated to the virtual twin to ensure long-term fidelity of the model.
- (4)
Service application layer: The terminal that realizes value output in the digital twin architecture, mainly aimed at the operation and control needs of secondary system equipment. This layer has multiple core functions such as equipment health status evaluation, abnormal working condition warning prompt, etc. It specifically includes four functional modules: operation status monitoring, comprehensive status evaluation, fault early warning, and 3D visualization display. ① The operation status monitoring module presents real-time device operation parameters, power grid flow data, and on-site environmental information. Once the data exceeds the standard threshold, a red warning signal is marked on the interface to promptly indicate abnormal conditions. ② The comprehensive evaluation module relies on preset evaluation models and algorithms to calculate the current operating status level of the equipment and output standardized status evaluation reports. This module is embedded with the combined weighting evaluation algorithm proposed in
Section 3 of this article. ③ The fault warning module uses virtual simulation models to deduce the development process of faults and predict the time period of fault occurrence and its impact range. ④ The visualization display module is based on WebGL technology to construct a 3D simulation scene, supporting remote access and retrieval, and assisting staff in immersive verification of equipment operation status.
In summary, the entire architecture can form a complete technical loop of “perception, collection, data transmission, virtual modeling, scene application”, as shown in
Figure 1, providing solid technical support for the precise and intelligent operation and maintenance of intelligent substations.
2.2. Construction of State Evaluation Index System
The sampled data of the secondary system in intelligent substations generally have characteristics such as complex sources, diverse types, and prominent noise interference. Electromagnetic disturbances during the transmission of electrical signals, shock noises caused by mechanical vibrations of equipment, as well as changes in temperature and humidity, and various random environmental interferences, all to varying degrees, affect the accuracy of the detection results. The information collected at a single monitoring point has limitations and cannot comprehensively and truly reflect the actual operating conditions of the equipment. To address this, the processing method of multi-source data fusion can effectively improve the accuracy of system monitoring. Based on the actual operating characteristics of the data sampling quality and feature distribution of the secondary system, this article builds a three-level progressive evaluation model, with the overall process including three core links: evaluation index establishment, index weight assignment, and comprehensive status assessment. This study selects three dimensions: the health condition of secondary equipment (U1), information transmission quality (U2), and on-site environmental conditions (U3), as the core evaluation indicators of the operating status of the secondary system. The selection of three indicators, namely device appearance status, optical power, and operating temperature, in the health status is mainly based on the observable parameter system of secondary equipment online monitoring [
28,
29,
30,
31]. The appearance status of the equipment comprehensively reflects qualitative factors such as mechanical integrity, indicator light status, and wiring reliability. Optical power is a direct indicator of the health status of optical modules in process layer networks (merging units, intelligent terminals, switches). The operating temperature directly affects the failure rate of electronic components. The selection of six indicators in information transmission, including accuracy, completeness, consistency, timeliness, correctness, and redundancy, based on the general framework for evaluating the information quality of secondary systems in intelligent substations, has been widely accepted as a standard dimension for information quality evaluation in both academia and industry. The selection of environmental temperature, humidity, and dust concentration in environmental conditions is based on the significant impact of the operating environment of secondary equipment in smart substations on equipment reliability. The ambient temperature directly affects the operating temperature of relay protection equipment. Environmental humidity affects insulation performance and condensation risk. The dust concentration affects the heat dissipation efficiency and contact reliability, which together constitute a complete description of the external environment for the operation of secondary equipment. The complete state evaluation index system of the secondary system’s intelligent substation is shown in
Table 1.
2.3. Realization of Secondary System State Evaluation
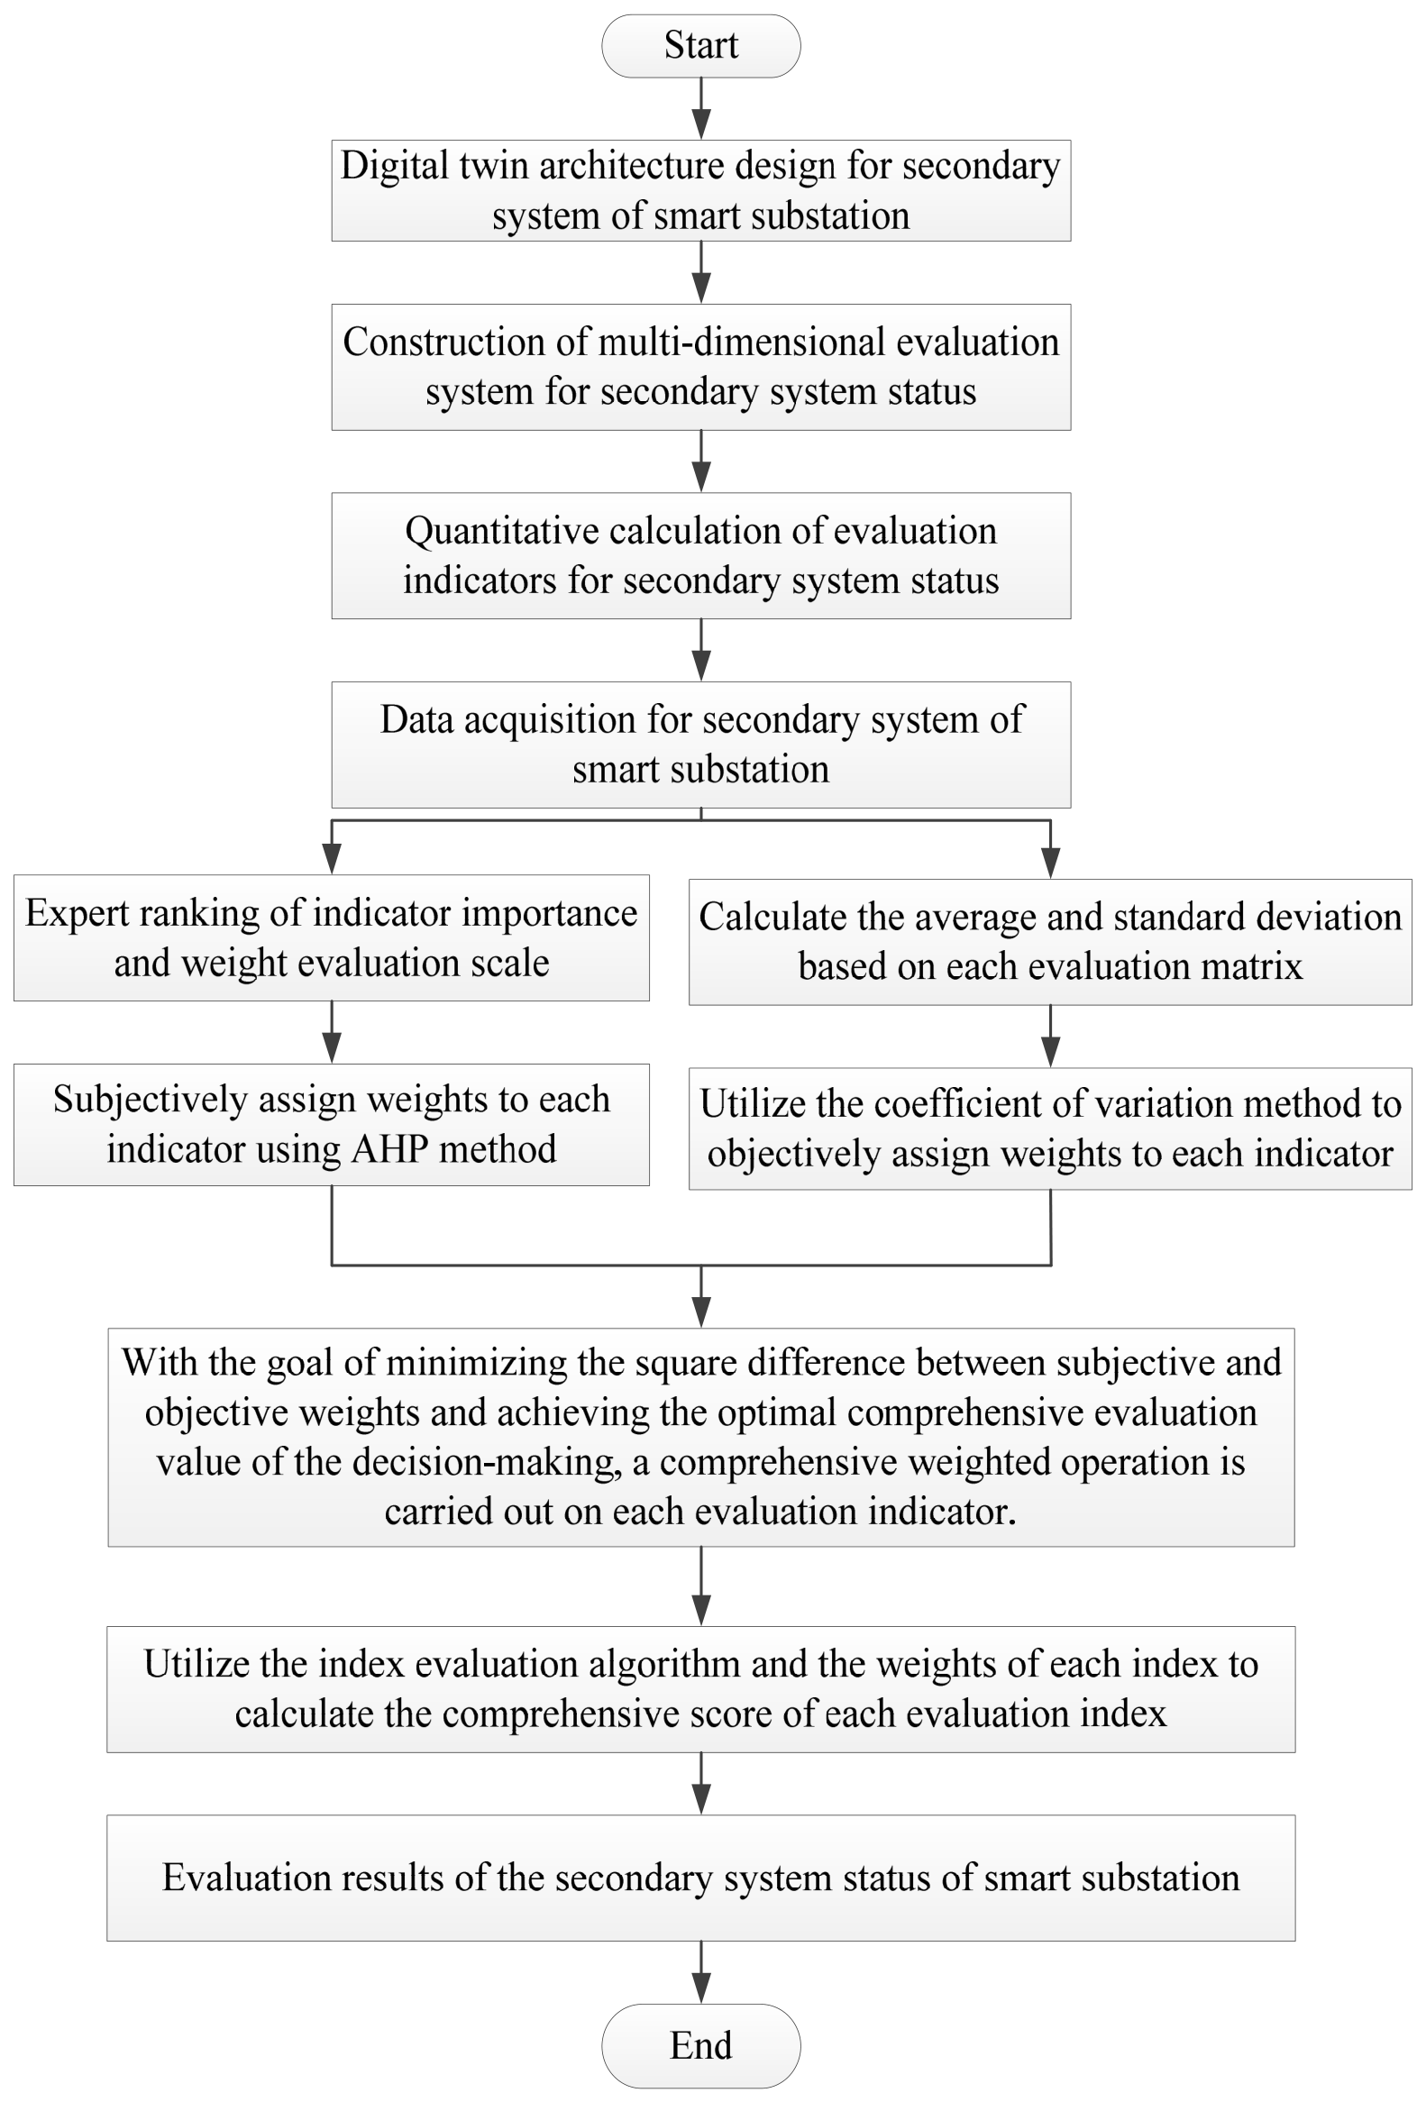
The secondary system status evaluation of intelligent substations covers a large number of devices, and the related monitoring data is massive in volume and rich in dimensions. Traditional evaluation methods are difficult to meet the analysis requirements of this scenario. Therefore, this paper conducts a special study on the secondary system of intelligent substations. The research first relies on the definition rules of various evaluation indicators to complete the quantitative calculation of all indicators and obtain the corresponding scores for each indicator. On this basis, AHP and the coefficient of variation method are integrated to carry out the weight calculation work, and the precise allocation of the combined weights of the indicators is completed through two methods: subjective weighting and objective weighting. Finally, by combining the quantitative scores of each indicator with the combined weight data, the overall operation status evaluation conclusion of the secondary system of intelligent substations is obtained. The complete evaluation implementation process is shown in
Figure 2.
2.4. Real-Time Interaction Mechanism of Digital Twin
The core value of digital twin systems lies in achieving bidirectional real-time mapping and closed-loop interaction between physical entities and virtual models. This section systematically elaborates on the real-time interaction mechanism of the constructed digital twin architecture from four aspects: data synchronization, state estimation, model update, and delay processing.
- (1)
Data synchronization mechanism
The multi-source heterogeneous data collected by the physical perception layer is transmitted in real-time to the virtual twin layer through the data interaction layer, and the state variables of the virtual twin layer are continuously synchronized with the physical devices. Data synchronization is implemented based on the IEC 61850 standard protocol: process layer devices (merging units, intelligent terminals) upload sampling values (50 Hz/100 Hz) through SV messages and upload switch status (triggered by displacement) through GOOSE messages. The station control layer equipment uploads device self-test information and alarm signals through the MMS protocol (with a cycle of 1 s). After summarizing the above three types of data sources, the data interaction layer aligns and encapsulates them into standardized twin data frames according to timestamps and inputs them into the virtual twin layer to drive model updates.
- (2)
Real-time state estimation
For state variables that are difficult to measure directly, such as transformer winding hot spot temperature and circuit breaker contact wear, this paper uses the Unscented Kalman Filter (UKF) algorithm for real-time state estimation. UKF approximates the posterior state distribution of nonlinear systems through a deterministic sampling strategy (Sigma point set), without the need to calculate the Jacobian matrix, and is suitable for the nonlinear characteristics of quadratic system state equations. The state estimation results and direct measurement data together constitute the complete state space description of the virtual twin layer and provide data input for the comprehensive evaluation module of the service application layer.
- (3)
Model dynamic update strategy
The model update of the virtual twin layer adopts a dual-track parallel mechanism: ①Parameter-level update (high-frequency, minute level): Through the real-time data stream of the data interaction layer, recursive least squares (RLS) is used to online-correct the key parameters of the model (such as thermal conductivity and time constant), minimizing the error between the virtual model output and the physical measurement values. The RLS algorithm has low computational complexity and fast convergence speed, making it suitable for embedded edge node deployment. ②Structural-level update (low-frequency, daily/weekly): When a device undergoes maintenance, replacement, or software upgrade, the structure or behavioral logic of the physical system changes. At this point, a structural-level update of the virtual twin layer needs to be triggered, and geometric model adjustment, physical field boundary condition correction, or behavioral logic model reconstruction needs to be performed again. The updated model can only be put into operation after being calibrated by MAPE (MAPE < 5%).
- (4)
Communication delay handling: In response to the possible occurrence of micro-burst delays in 5G networks during peak periods or network congestion, this article adopts the following layered processing strategy:
Key data (GOOSE trip command, fault recording start signal): Independent resources are allocated through 5G network slicing to ensure end-to-end latency ≤ 10 ms and reliability ≥ 99.999%. Real-time monitoring data (SV sampling values, device status variables): transmitted via fiber optic network with a latency of ≤20 ms. A data priority queue scheduling mechanism is enabled in case of network congestion. Non-critical data (historical records, trend analysis data): transmitted in batches through fiber optics, allowing for second-level latency.
Delay compensation mechanism: When the packet delay exceeds the threshold, the virtual twin layer activates the predictive compensation mode and extrapolates the current state value based on the UKF state estimation results. After the delayed data arrives, it is corrected and backfilled to ensure that the continuous operation of the evaluation module is not affected by transient communication fluctuations.
Through the synergistic effect of the four mechanisms mentioned above, the digital twin architecture constructed in this article has achieved a leap from “static modeling” to “dynamic evolution”, providing reliable digital foundation support for real-time state evaluation of the secondary system of intelligent substations.
3. Quantitative Calculations of Evaluation Indicator
In the secondary evaluation system of intelligent substations, the acquisition method for equipment health status indicators involves a horizontal comparison of the operating conditions of the equipment under test with those of the same type of equipment. Environmental condition indicators do not require comparison analysis and can be directly judged according to established evaluation standards. Among all the evaluation indicators, the quantitative determination of information transmission quality is the most complex. This indicator can be quantitatively analyzed in combination with the data characteristics of the secondary system and the on-site operation and maintenance requirements.
(1) Accuracy: Based on the on-site operation and maintenance standards of intelligent substations, this paper sets reasonable numerical range thresholds for various monitoring data and clearly specifies the number of significant digits for each type of data. The statistical work mainly includes two items: the total number of samples exceeding the threshold range
QU211 in the sample data and the total number of valid samples that meet the accuracy standard
QU212. Based on the above statistical data, the actual accuracy ratio of information transmission in the secondary system can be further calculated. The specific calculation formula is as follows:
where
Q represents the total amount of dataset’s data, and
QU261 represents the number of redundant data records in the dataset.
(2) Completeness: In the entire process of data collection, transmission and reception in intelligent substations, there may be issues such as data gaps or data failures. By counting the number of blank data
QU221 and the number of invalid data
QU222 within the sample, the completeness ratio of the overall data set can be calculated. The corresponding calculation expression is shown in Formula (2):
(3) Consistency: The core of the determination is to quantify the degree of deviation of a single piece of data from the overall data’s changing pattern. This assessment includes two dimensions of test criteria. On one hand, there is temporal reference consistency, where the same type of monitoring data does not experience significant fluctuations at adjacent sampling moments, which can serve as a verification basis for similar data. On the other hand, there is logical matching consistency, where different types of data at the same sampling moment need to conform to the established mathematical correlation rules. Suppose the data set to be evaluated P contains n types of data, which can be denoted as X = {X1, X2, ..., Xn}, where each type of data Xi covers N samples, and the corresponding sample set is xi = {xi1, xi2, ..., xiN}.
(a) Temporal consistency test of similar data. First, mark the sample data of the same type in a discrete point form on the coordinate system. Use the least squares method to fit all discrete sample points and construct a fitting model:
y =
e0 +
e1x1 + ... +
enxn, where
e0,
e1,...,
en are the parameters to be solved. Using the completed fitting model, the remaining data of the same type can be predicted, and based on this, the data deviation sequence can be derived. The calculation formula is shown in Formula (3):
where
yi is the
i-th actual value of the indicator
y, and
is the
i-th predicted value of the indicator
y.
Based on the actual operation norms of the substation and the experience of industry experts, the minimum deviation discrimination threshold Kc was studied and set. When the calculated value of |Bi| is greater than the threshold Kc, it can be determined that this sample point is abnormal data in the similar time series data. Through the verification statistics of each sample data one by one, the total number of abnormal samples with time series mismatch of similar data is finally counted.
(b) Logical consistency check of different data. The core purpose of this check is to verify the deviation range between the predicted values of the regression model and the actual collected values, and ensure that the deviation value is within the set threshold. The specific implementation steps are as follows: Select one type of data from the dataset as the dependent variable
yi of the model, and the remaining types of data as the independent variables
xki of the model. The construction of the regression equation and the calculation formula for parameter solving are shown in Formula (4):
where
β0 represents the random error, while
β1,
β2, ...,
βp represent the regression coefficients.
Using the regression equation, the data of the dependent variable can be predicted, the deviation sequences of different data types can be calculated, and based on the requirements of intelligent substation operation and maintenance and expert opinions, the minimum deviation threshold
Kr is set. If |
Bi| >
Kr, then it is considered that this data is an abnormal point of logical inconsistency. All the data in the data set are inspected one by one, and finally, the number of logical inconsistencies of different types of data in the intelligent substation is obtained. Therefore, the calculation of the consistency ratio in the data set is shown as Formula (5):
where
QU231 represents the number of inconsistencies in reference to the same data, and
QU232 represents the number of logical inconsistencies in different data.
(4) Timeliness: The monitoring data of each business system in the intelligent substation all have a unique source of collection. The system will automatically upload the monitoring data at fixed time intervals. If there is a deviation between the actual update time and the preset standard time, it indicates a delay in data update. This article defines the maximum time deviation threshold based on the actual operation conditions of the substation. If the time difference in data updates exceeds this threshold, it can be determined as data update lag. The specific calculation formula for data timeliness is shown in Formula (6):
where
QU241 represents the number of data updates that are not timely.
(5) Accuracy: Data accuracy is mainly composed of two assessment dimensions: format compliance and length compliance. The data format includes various writing forms such as percent signs, separators, and decimal points. The research combines actual business requirements to determine a unified standard format and counts the number of all samples that do not conform to the standard format. The data length is set according to the on-site business operation standards and has fixed requirements, thereby screening out abnormal data. The calculation method for the overall accuracy rate of the data set is shown in Formula (7).
where
QU251 represents the number of incorrect data formats in the dataset, and
QU252 is the number of incorrect data lengths in the dataset.
(6) Redundancy: The data redundancy issue in substations can be mainly categorized into two types: the duplicate records that occur compared to the reference data set and the duplicate data that emerges within a single data set.
(1) Redundancy of reference data set records. In the collection process of intelligent substations, two sets of monitoring devices are provided, and during the operation of the devices, two independent data sets will be generated. The study selects one of the sets as the standard reference sample, screens the duplicate contents between the two sets of data, and counts the number of redundant records QU261.
(2) Data redundancy within the data set. This detection focuses on checking the duplicate contents in the row and column dimensions of the data set and determines whether the number of duplicate samples exceeds the preset standard. After calculating the total amount of internal duplicate data
QU262, the redundancy ratio of the data set can be further calculated, and the corresponding calculation formula is shown in Formula (8).
where
QU2621 is the number of identical data in each row of the dataset, and
QU2622 represents the number of identical data in each column of the dataset.
5. Simulation Calculation and Result Analysis
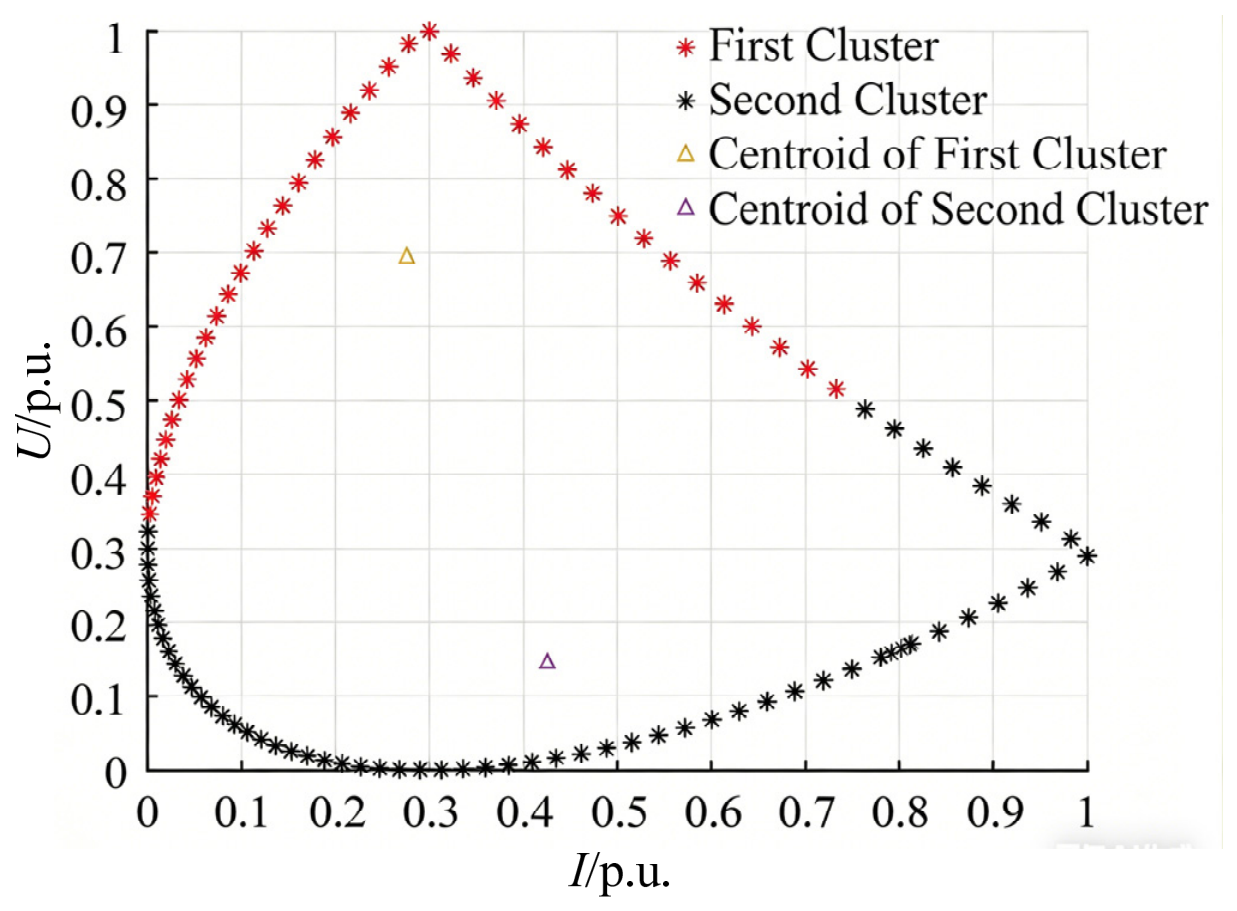
This paper relies on the established intelligent substation secondary equipment status assessment model and selects multiple types of typical secondary equipment, such as monitoring units, merging units, network switches, and intelligent terminals, as research samples. All the equipment is connected to the power grid secondary equipment status monitoring management system. The research conducts performance comparison analysis by combining simulation and instance verification with traditional secondary equipment status assessment methods. In this experiment, 2000 sets of valid voltage and current sample data were selected from databases such as the relay protection information system and the online monitoring platform of a certain 220 kV intelligent substation to provide data support for the evaluation of the secondary system status. During the data sampling period, the 220 kV intelligent substation did not experience any protection misoperation, refusal to operate, or abnormal alarm events of the secondary equipment. The experimental equipment adopts a bus-based communication architecture and builds a typical relay protection system structure. After standardizing and normalizing the original experimental data, the optimized
K-means algorithm is used to complete the data preprocessing operation, and the final clustering analysis results are shown in
Figure 3.
5.1. Simulation Calculation
(1) Weight calculation based on AHP. Invite 10 experts from work and research related to the status assessment of secondary systems in substations to rate the importance of the 12 impact indicators listed in this article. The survey questionnaire will be in the form of a Likert scale, and the impact level will be scored on a scale of 1–10. The higher the score, the greater the impact of the indicator. After obtaining the raw data, the data matrix will be analyzed and summarized, as shown in
Table 2.
Based on the data characteristics and ranking fluctuations of various indicators in
Table 2, the expert weighting method combining the Likert scale and AHP was used to collect expert scores, calculate the mean of each indicator, and generate judgment matrices A for the relevant criterion layer and indicator layer according to the 1–9 scale criteria in
Table 3. Using Equations (10) and (11), the weights of the health status indicator layer were calculated as W1 = [0.3716, 0.2227, 0.4057], the weights of the information transmission indicator layer were W2 = [0.1513, 0.1185, 0.3108, 0.0962, 0.2731, 0.0901], and the weights of the environmental condition indicator layer were W3 = [0.1483, 0.3461, 0.5056]. From this, the maximum eigenvalue λ was calculated. The maximum values are 3.049, 6.5061, and 3.0709, and the average random consistency index RI values are shown in
Table 4. By combining Equations (12) and (13), CR is calculated as 0.0422, 0.0816, and 0.0611, all less than 0.10. Through consistency verification, the weight calculation of each indicator is reasonable and does not require adjustment, indicating reliable judgment.
The subjective weight values of each indicator were calculated, and the specific weight results of each indicator are summarized in
Table 5. According to the calculated data, it can be found that in the secondary system state evaluation system of substations, the priority of information consistency and correctness indicators is the highest, and the corresponding weight values also rank first. The core reason for this result is that the industry experts involved in the evaluation gave the highest scores to these two indicators, recognizing their decisive role in the overall quality of secondary equipment information data.
(2) Objective weight calculation using the coefficient of variation method. Based on the coefficient of variation method, an index judgment matrix was established, and the calculations were completed according to Formulas (14)–(17). Finally, the objective weights of each evaluation index were obtained. The specific calculation results were also organized into
Table 5. Comparative analysis shows that the index weights solved by the coefficient of variation method have a high overall consistency with the calculation results of the analytic hierarchy process method.
(3) Comprehensive weight calculation using the combination weighting method. With the core optimization principles of minimizing the sum of the squares of the deviations between subjective and objective weights and maximizing the comprehensive evaluation value of the decision-making scheme, Formulas (18)–(20) were used for calculation, and the relative importance coefficient of subjective weight α = 0.6142 and the relative importance coefficient of objective weight
β = 0.3854 were obtained. To verify the effectiveness and accuracy of the combined weighting model constructed in this study, this paper selected the AHP-entropy weight method in reference [
23] as a control method. The comparison of the weight calculation results of the two methods is shown in
Table 5.
5.2. Simulation Result Analysis
The weight obtained by the combination weighting method used in this article is basically the same as those obtained by the traditional AHP entropy weighting method, which proves the accuracy of the combination weighting method in this article. Experts believe that the top three importance levels for evaluating the secondary system status of substations are consistency, correctness, and operating temperature, with consistency having the highest weight of 0.1414. This weight value is consistent with the subjective judgment of experts, fully reflecting the influence of their subjective experience on the weight. Due to the limited amount of timely data, the calculated objective weight is the smallest, while expert experience indicates that the importance of redundancy is the smallest and the weight is the smallest. In the weights calculated in this article, the weight value of timeliness is consistent with the objective weight, reflecting the influence of objective data on the weight. The values of the combined weights in this article are between the subjective and objective weight values, taking into account both the subjective judgment of experts and the objective situation of the data itself, which is in line with the actual situation of the power grid and proves the applicability of the combined weighting method in this article.
Based on the evaluation data and weights of the indicators, combined with Formula (21), the evaluation score of the secondary system status of the intelligent substation is calculated to be 97.3164 ∈ [95, 100], and the data quality of the secondary system of the intelligent substation is “excellent”, consistent with the historical operation records of the data source platform (unprotected misoperation/refusal to move, no secondary device abnormal alarms). Based on the comprehensive score output by the evaluation model and the scores of each criterion layer, it can be used as a multi-level triggering basis for fault warning: ① Attention level warning (comprehensive score drops to 85–95) triggers equipment status attention, and it is recommended to shorten the inspection cycle. ② Alarm level warning (comprehensive score drops to 75–85) triggers operation and maintenance alarm, and it is recommended to arrange special testing. ③ Emergency level warning (comprehensive score drops below 75) triggers emergency response, suggesting arranging maintenance immediately. In addition, based on the evaluation results of the article, the problem of “insufficient maintenance” or “excessive maintenance” in traditional maintenance processes can be solved by dynamically adjusting the maintenance cycle. Equipment with consistently excellent evaluation scores can have their maintenance intervals appropriately extended, while equipment with decreasing evaluation scores or at the “average” level should have their maintenance intervals shortened and inspection frequency increased.
To further verify the effectiveness and applicability of the combination weighting method proposed in this article, the weight calculation and comparative analysis of two current mainstream combination weighting methods, the AHP anti-entropy weighting method [
31] and the G1 and coefficient of variation method [
26], will be conducted. Comparing the objective weights of the coefficient of variation method, entropy weight method, and inverse entropy weight method, taking dust concentration as an example: the entropy weight method assigns a dust concentration of 0.1095 (the second highest weight under the entropy weight method, second only to consistency 0.1226), the coefficient of variation method assigns 0.0917, and the inverse entropy weight method assigns 0.0855, reflecting the sensitivity differences among the three objective weighting methods. The entropy weight method has the most severe response to the degree of data dispersion and is prone to producing extreme weights that are either too large or too small. The anti-entropy weight method effectively suppresses the generation of extreme weights by changing the structure of the logarithmic term, making the weight distribution more balanced. The coefficient of variation method, based directly on the ratio of standard deviation to mean, has a sensitivity between the two. Therefore, the value of the combined weight (AHP coefficient of variation method combination) in this paper is strictly between the corresponding AHP subjective weight and the objective weight of the coefficient of variation method. The evaluation score under the combination of weights in this article is 97.3164, and the difference in scores between the AHP entropy weight method (97.2158), AHP anti-entropy weight method (97.0682), and G1 and coefficient of variation method (97.1246) is within 0.32%, which verifies the rationality and reliability of our method in weight allocation.
5.3. Real-Time Analysis
The data update frequency of the physical perception layer is configured differentially based on the importance of different data types. The sampling frequency is set as follows: 4 kHz for merging units/PMUs, 1 Hz for intelligent terminals with displacement triggering, 1 Hz for protection/measurement and control devices, 10 Hz for optical module monitoring, 1 Hz for temperature and humidity concentration sensors, and 0.1 Hz for dust concentration sensors. To test and evaluate the calculation time of each stage of the model, three typical operating conditions were selected: normal, overload, and fault. Each test was repeated 100 times, and the average and longest time of each stage were recorded. The results are shown in
Table 6. The calculation of the entire evaluation process takes about 2.6138 s, with the longest time being 3.4385 s. The improved K-means clustering preprocessing accounts for 69.8% of the total calculation time and is the main time-consuming step in the evaluation process. The total proportion of quantitative calculation of indicators is 16.8%, while the total proportion of weight calculation and comprehensive evaluation is only 6.5%.
To test the communication delay of the data interaction layer, end-to-end delay tests were conducted on both critical and non-critical data, with each test repeated 500 times. The average delay of SV sampling values transmitted through optical fiber was 2.3 ms, and the average delay of GOOSE tripping commands transmitted through 5G slicing was 4.8 ms, meeting the standard requirement of less than 10 ms. The average delay of data preprocessing output was 18.4 ms. The synchronization data volume of the 3D model was large, with an average delay of 156.3 ms, but its non-real-time interaction properties allowed for second-level delay, which did not affect the real-time judgment function of the evaluation system.
5.4. Multi-State Evaluation Verification
To further verify the discriminative ability of the evaluation model proposed in this article for different health states, four evaluation scenarios for different health states were simulated and constructed on the 220 kV intelligent substation digital twin simulation platform by adjusting key indicator parameters. The detailed settings are shown in
Table 7, and the parameter settings are configured according to the standard thresholds in
Table 7. Among them, optical power, consistency, and dust concentration are differentiated gradient setting indicators, and other indicators are only adjusted within a small range that matches each state level.
Input the above four sets of scenario data into the evaluation model of this article, calculate the scores of each indicator according to the quantitative calculation method of each indicator in
Section 3, and then combine the weights in
Table 5 to calculate the comprehensive evaluation score according to Equation (21). The results are shown in
Table 8.
From
Table 8, it can be seen that the comprehensive scores of the four scenarios are 97.98, 90.67, 80.72, and 67.95, respectively, which fully correspond to their respective preset health levels. The score differences between adjacent levels are 7.31 points, 9.95 points, and 12.77 points, respectively, showing a trend of widening with the degree of state degradation, indicating that the model has good sensitivity in distinguishing different levels of states. The trend of changes in the scores of each criterion layer and the comprehensive score is highly consistent, which verifies that the three-dimensional evaluation index system (health status, information transmission, environmental conditions) constructed in this paper can effectively reflect the overall changes in the system status under different operating conditions. During the progression from excellent to poor scenarios, the information transmission score decreased from 97.62 points to 68.54 points, a significant decrease of 29.08 points, which is greater than the 27.57-point decrease in health status scores. This also indicates that consistency is highly sensitive to data quality.
5.5. Verification of Typical Fault Cases
To further verify the ability of the evaluation model to identify state degradation under abnormal operating conditions, three typical fault modes in the secondary system of the intelligent substation were selected for simulation verification: abnormal merging unit sampling, switch port packet loss, and GOOSE communication interruption. Simulate the abnormal fault of merging unit sampling on the digital twin simulation platform: set the A-phase current sampling value to have an amplitude jump at t = 0.5 s, with a deviation of 15% of the rated value, and recover after 200 ms. The changes in key indicators before and after the malfunction are shown in
Table 9. During the malfunction, accuracy sharply decreased from 97.8% to 82.3% due to sampling values exceeding the normal threshold range, consistency decreased from 97.5% to 71.6% due to data mutation deviating from the fitting model, and accuracy decreased to 79.8% due to abnormal data format. The comprehensive evaluation score dropped sharply from 97.83 before the fault to 76.51 during the fault period, and the status level decreased from “excellent” to “average”. After the fault was restored, it rebounded to 97.69.
Simulate switch port packet loss failure on the simulation platform and gradually increase the packet loss rate of the switch receiving port from the normal value of 0% to 8%. As the packet loss rate increases, the indicators of information transmission in various dimensions change, as shown in
Table 10. When the packet loss rate reaches 8%, the comprehensive score drops to 79.62, and the status level decreases from “excellent” to “average”. The consistency index showed the most significant decrease, from 97.5% to 76.8%, due to packet loss causing discontinuity in the data sequence, resulting in a large number of sample points being identified as abnormal in temporal consistency testing.
The GOOSE message with this interval is completely interrupted at t = 0.3 s and will be restored after 400 ms. During the fault period, the relevant protective devices are unable to receive the circuit breaker position signal and lockout signal for this interval. The pre- and post-fault evaluation results are shown in
Table 11. During the malfunction, the information transmission score dropped sharply to 72.38, the overall score dropped to 85.64, and the status level was downgraded from “excellent” to “good”. The health status and environmental condition scores remain basically unchanged, and GOOSE communication interruption mainly affects the quality of information transmission, while the health status and environmental conditions of the equipment itself have not undergone substantial changes.
Comparing the evaluation results under the three typical fault modes mentioned above, as shown in
Table 11, the evaluation models can effectively identify state degradation and provide reasonable level judgments. The maximum reduction in evaluation caused by merging unit sampling anomalies is 21.32 points, and the accuracy of the sampled data is directly related to the core function of the secondary system. The score decrease caused by GOOSE communication interruption is relatively small, at 12.41 points, because GOOSE communication interruption mainly affects the accuracy and completeness of information transmission, while environmental conditions, equipment health status and other indicators are not significantly affected.
The above multi-state evaluation and fault case verification results indicate that the evaluation model proposed in this paper can not only provide accurate “excellent” ratings under normal operating conditions, but also effectively identify different levels of state degradation and abnormal working conditions under typical fault modes, proving that the model has good universality and robustness.
5.6. Ablation and Sensitivity Analysis
To further verify the robustness and reliability of the evaluation model proposed in this article, this section conducts ablation and sensitivity analysis from two dimensions: deletion of digital twin information and changes in subjective and objective weight ratios. To verify the actual contribution of each layer of the digital twin architecture to the evaluation results, four sets of ablation experiments were designed to remove or weaken different levels of information input in the digital twin architecture and observe the changes in evaluation scores. The experimental plan and results are shown in
Table 12. It can be seen that the comprehensive score of scenario B (deleting the virtual twin layer) decreased from 97.32 to 90.63, a decrease of 6.87%, and the status level decreased from “excellent” to “good”. The comprehensive score of scenario C (deleting data interaction layer preprocessing) further decreased to 87.52, a decrease of 10.07%. The original data, without edge computing node filtering, exception removal and compression processing, contains more electromagnetic interference noise and outliers, resulting in deviations in the calculation of accuracy, consistency and other indicators. The comprehensive score of scenario D (deleting real-time feedback from the service application layer) is 97.05, which is only 0.27 points lower than the benchmark value of 97.32, with a deviation of only 0.28%. This indicates that the real-time feedback function of the service application layer mainly serves the display and alarm of state evaluation results. The comprehensive score of scenario E (with the physical perception layer removed) is only 83.42, a decrease of 14.28% from the benchmark value, and the state level has dropped to “average”. This result indicates that relying solely on simulated data from virtual models cannot accurately reflect the true operating state of the secondary system without the measured data from the physical perception layer. The results indicate that the physical perception layer has the greatest impact on the evaluation results among the layers of digital twins, followed by the data interaction layer and the virtual twin layer, while the service application layer has the least impact.
To verify the rationality of the ratio and evaluate the sensitivity of the score to the weight ratio, set
α = [0.2, 0.9] with a step size of 0.1,
β = 1 −
α. According to Equation (20), recalculate the combination weights and substitute them into the evaluation model to observe the trend of the comprehensive evaluation score. The combination weights and evaluation scores under different alpha values are shown in
Table 13. Within a wide range of
α∈[0.4, 0.8], the comprehensive score remains stable between 95.67 and 97.32, with a maximum fluctuation amplitude of less than 2. This indicates that the evaluation model is insensitive to changes in subjective weight allocation and can maintain stable evaluation conclusions even when the weight allocation deviates from the optimal solution in this paper. The highest comprehensive score of 97.32 was obtained at
α = 0.6142, verifying that the subjective and objective weight allocation solved by the moment estimation theory is indeed the optimal solution.
6. Conclusions
This article proposes a state evaluation method based on digital twins and the combination weighting method to address key issues in the state evaluation of secondary systems in intelligent substations, such as the difficulty in integrating multi-source heterogeneous data, single evaluation indicators, and insufficient real-time performance. This method achieves precise mapping and real-time interaction between physical entities and virtual models by constructing a four-layer digital twin architecture, and integrates the subjective weights of the AHP and the objective weights of the coefficient of variation method to establish a combined weighting evaluation model, thereby achieving a comprehensive quantitative evaluation of the multidimensional state of the secondary system.
(1) The four-layer digital twin architecture of “physical perception, data interaction, virtual twin, service application” constructed can effectively achieve accurate mapping and real-time closed-loop interaction of multi-source heterogeneous data in the secondary system. The health status, information transmission, and environmental conditions of the secondary system are selected as the evaluation indicators, and a comprehensive evaluation index system for the operation status of key equipment in the secondary system of intelligent substations is built.
(2) The combination weighting strategy combining the Analytic Hierarchy Process and the coefficient of variation method was adopted, and the principle of minimizing the sum of squares of subjective and objective deviations was introduced for weight optimization. The resulting combination weights were between subjective and objective weights, taking into account both expert experience and objective data characteristics. Compared with the AHP entropy weight method (97.2158), the AHP anti-entropy weight method (97.0682), and the G1 and coefficient of variation method (97.1246), the evaluation score and state evaluation score of the proposed method were 97.3164, with differences within 0.32%, verifying the rationality and stability of the weight allocation scheme and meeting the requirements of on-site equipment operation.
(3) The indicator system constructed in this article mainly focuses on the state evaluation under steady-state operating conditions, and insufficient consideration is given to the dynamic coupling relationship between indicators during transient fault processes. Moreover, the subjective judgment of AHP in the combination weighting process may still introduce certain expert preference errors. Future research will introduce a dynamic adaptive weight adjustment mechanism and combine it with artificial intelligence methods such as deep learning to achieve online self-evolution of evaluation models. At the same time, it will explore the deep integration application of digital twin and multi-agent collaboration technology in secondary system fault deduction and early warning.