Article

A Visual Detection and Multi-Zone Personnel Safety Control Method for Firework Manufacturing Workshops


1
School of Information Engineering, Nanchang University, Nanchang 330031, China
2
Jiangxi Provincial Safety Risk Monitoring and Early Warning Center, Nanchang 330000, China
3
Nanchang Mineral Systems Co., Ltd., Nanchang 330000, China
*
Author to whom correspondence should be addressed.
Electronics 2026, 15(16), 3547; https://doi.org/10.3390/electronics15163547
Submission received: 5 July 2026 / Revised: 2 August 2026 / Accepted: 7 August 2026 / Published: 10 August 2026
(This article belongs to the Section Computer Science & Engineering)

Abstract

Real-time visual detection is essential for personnel safety control in firework manufacturing workshops, where inadequate personnel-count control can increase safety risks in hazardous production zones. This study proposes a visual detection and multi-zone personnel safety control method that combines edge-oriented personnel detection, cross-camera identity association, and polygon-based boundary filtering. The detection module is built on YOLO26, which supports inference without non-maximum suppression (NMS). A Global Attention Mechanism (GAM) is adopted instead of the Convolutional Block Attention Module (CBAM) because its sequential channel-spatial attention preserves cross-dimensional interactions without the global pooling operations used in CBAM, thereby retaining weak spatial cues from small personnel targets. GAM is incorporated after the Spatial Pyramid Pooling-Fast (SPPF) module to improve detection under overhead views, dust, and occlusion. A cross-camera person re-identification (ReID) layer maintains identity consistency across workshops, while an Irregular Electronic Fence (IEF) excludes detections outside hazardous operating boundaries. On in-situ data collected from Deren Firework Co., Ltd., the proposed method achieves a 98.3% mean average precision at an intersection-over-union threshold of 0.5 (mAP@0.5) with a per-image central processing unit (CPU) processing time of 36.5 ms. Compared with YOLOv8n, this represents a 5.9 percentage point improvement in mAP@0.5 and a 54.6% latency reduction. A three-month field deployment detected 15 safety breaches and supported timely intervention in 4 critical overcrowding incidents, indicating the practical applicability of the method under the evaluated factory conditions.

1. Introduction

Visual detection is often used in industrial safety monitoring, where camera streams must be converted into timely warnings under site-specific constraints. Firework manufacturing is a representative high-risk scenario because production activities combine explosive materials, restricted operating zones, and strict personnel-density requirements. Analyses of accidents in fireworks establishments have shown that weaknesses in technical, organizational, and management controls can contribute to major incidents [1]. A recent study based on more than 100 fireworks production accidents in China further illustrated the complexity of safety risks in this sector and developed models for enterprise safety assessment and decision support [2]. Since personnel behavior is a direct trigger of many safety violations, machine-learning approaches have been used to examine human factors and reduce human-error-related risks in fireworks- and match-related industries [3]. Deep-learning-based human detection has also been proposed for safety enforcement in manufacturing sites [4]. However, these studies mainly support risk assessment or general personnel detection. They do not directly address real-time multi-zone personnel safety control in hazardous firework manufacturing workshops.
Visual detection provides a practical route for converting workshop video streams into safety information. Early single-stage detectors such as YOLO and SSD enabled real-time object detection [5,6]. Subsequent studies showed that YOLO-based models can be adapted to challenging visual tasks, including bridge damage inspection, aerial remote-sensing small-target detection, and underwater target detection [7,8,9]. In addition, related models have been applied to fire and smoke detection [10,11], industrial object counting and, in some cases, tracking [12,13], and human detection and people counting [14,15]. These applications indicate that visual detection can support industrial safety control, but the requirements of hazardous firework manufacturing workshops are more restrictive than those of generic detection or counting tasks. Most existing visual-detection studies focus on object recognition performance within a single task domain, whereas firework manufacturing requires simultaneous detection, cross-camera identity association, and spatial filtering under site-specific safety constraints.
One practical barrier is the limited availability of representative industrial data. As reported in industrial object detection research, collecting and annotating sufficient training data is labor-intensive, and dataset scarcity can limit both detection performance and generalization [16]. For firework manufacturing, task-specific in-situ data are therefore needed to capture illumination changes, dust, occlusion, overhead camera views, and the spatial layouts of production workshops.
Practical deployment also requires deterministic edge inference under visually degraded workshop conditions. Many object detectors still rely on non-maximum suppression (NMS) during post-processing to remove redundant boxes [17]. Recent end-to-end detectors, such as YOLOv10 and Detection Transformer (DETR)-based models, have attempted to remove this step while maintaining real-time detection performance [18,19]. In parallel, YOLO-based studies have applied and enhanced the Global Attention Mechanism (GAM) to improve feature extraction and detection speed in thermal-image vision tasks [20]. Related studies have further shown that improved YOLOv8-based systems can support automatic counting and multi-object tracking in industrial environments [21], and can also be adapted to personnel safety monitoring in complex high-risk settings such as oilfield well sites [22]. These findings indicate that reliable monitoring in hazardous firework manufacturing workshops depends not only on detection speed but also on stable feature extraction and task-oriented model adaptation.
A further challenge is maintaining consistent identities when workers move across non-overlapping workshops. This problem is commonly addressed by cross-camera person re-identification (ReID), which has also been studied in industrial scenarios such as power grids [23]. To reduce cross-camera discrepancies, recent studies have explored semantic transformation [24], similarity exploration [25], and prototype learning [26]. When privacy constraints limit the use of appearance information, trajectory-based multi-camera ReID provides another option [27]. Other work has improved cross-camera robustness through dynamic re-weighting and cross-camera learning [28], as well as cross-camera self-distillation [29]. However, appearance-based ReID can still be affected by similar clothing, occlusion, viewpoint changes, and high-traffic transitions, so it should be integrated with task-specific counting logic rather than used as an isolated tracking solution. For the present task, without reliable cross-camera ReID, the same worker may be counted repeatedly after moving between separate workshops, making global personnel-threshold judgment inaccurate.
Precise spatial delimitation is also important for personnel safety control. Algorithm-driven electronic fencing has been explored as a practical approach for industrial safety monitoring, with advantages in real-time supervision and precise positioning [30]. However, simple rectangular regions of interest (ROIs) can easily include adjacent corridors or nearby safe areas, which may increase false alarms. Polygon-based learning has also been investigated for more accurate boundary representation of irregular targets [31], which provides useful inspiration for constructing an Irregular Electronic Fence (IEF) adapted to workshop layouts. Nevertheless, polygonal boundaries require site-specific calibration and may be sensitive to personnel located near the hazardous-zone boundary, which motivates a combined evaluation of detection, counting, and spatial filtering.
These considerations require an integrated visual detection and multi-zone personnel safety control method that links fast edge detection, cross-camera identity association, and precise spatial constraints. In this study, YOLO26 is adopted as the baseline detector because recent benchmarking has evaluated its scale-dependent performance and parameter efficiency for personal protective equipment detection in industrial safety applications [32]. On this basis, GAM is integrated to enhance feature extraction, and cross-camera ReID and the IEF are further introduced to support personnel safety control in hazardous firework manufacturing workshops.
The main contributions of this work are summarized as follows:
  • GAM is integrated into the YOLO26 Spatial Pyramid Pooling-Fast (SPPF) node to improve small-target personnel detection under dusty, occluded, overhead-view workshop conditions.
  • A cross-camera ReID-based collaborative counting strategy is developed to maintain global identity consistency across multiple workshops and support reliable local and global personnel-count judgment.
  • An IEF is introduced to match irregular workshop boundaries and reduce spatial false alarms in safe transit corridors.
The remainder of this paper is organized as follows: Section 2 presents the experimental materials, including the in-situ data used in this study and the rationale for selecting YOLO26 for real-time personnel safety control in firework manufacturing workshops. Section 3 describes the proposed method, including the integration of the GAM, the ReID-assisted multi-zone collaborative counting strategy, and the irregular electronic fence logic. Section 4 presents and discusses the experimental evaluation, including ablation studies and the practical field deployment. Finally, Section 5 concludes the study.

2. Preliminary

2.1. In-Situ Industrial Data

This study uses in-situ data collected from Deren Firework Co., Ltd. (Nanchang, China) to support model training and evaluation (Figure 1). High-speed cameras mounted at 10 independent workshops employed a 24-h stochastic sampling protocol to capture illumination variance, industrial dust, motion blur, and occlusion. The resulting corpus comprises 10,000 high-resolution images, distributed evenly across 10 production stages (1000 per production stage) to reduce class imbalance. Following sequential augmentation, balancing, and normalization, the data were partitioned into training, validation, and testing sets (60:20:20) for model evaluation.

2.2. Selection of Object Detection Model

Real-time object detection has gradually shifted from accuracy-centric design toward deployment-efficient edge inference. Earlier models like YOLOv5 and YOLOv7 were often hindered by anchor-based constraints and non-maximum suppression (NMS) overhead. While YOLOv8 and YOLOv11 introduced architectural improvements, their continued reliance on Distribution Focal Loss (DFL) and sequential NMS introduced computational complexity and latency variance, which are problematic in time-sensitive industrial monitoring systems.
In contrast, this study adopts YOLO26, which follows a deployment-oriented edge-first design. By redesigning the prediction head for native dual-head matching, YOLO26 achieves end-to-end NMS-free inference, ensuring deterministic latency and an approximately 43 percent Central Processing Unit (CPU) speedup over predecessors. The removal of the DFL module further streamlines model export to edge engines such as ONNX or TensorRT. Progressive Loss and Small-Target-Aware Label Assignment enhance the detection of minute personnel features from high-altitude perspectives, while the Stochastic Gradient Descent (SGD) optimizer supports stable convergence on site-specific industrial data.

3. Methods

The method contains three connected modules: YOLO26-GAM personnel detection, ReID-assisted multi-zone collaborative counting based on site-specific personnel-count requirements, and polygon-based IEF filtering. The detection module identifies worker locations from video streams collected across 10 workshops. The ReID-based coordination layer then associates identities across cameras to prevent duplicate counting before the local and global personnel thresholds are evaluated. Finally, the IEF module determines whether each detected worker is located within the hazardous operating boundary, preventing detections in safe transit corridors from contributing to safety-threshold violations. The YOLO26-GAM detection structure is shown in Figure 2. The ReID and IEF components are described through their mathematical and logical formulations.

3.1. YOLO26-GAM Visual Detection

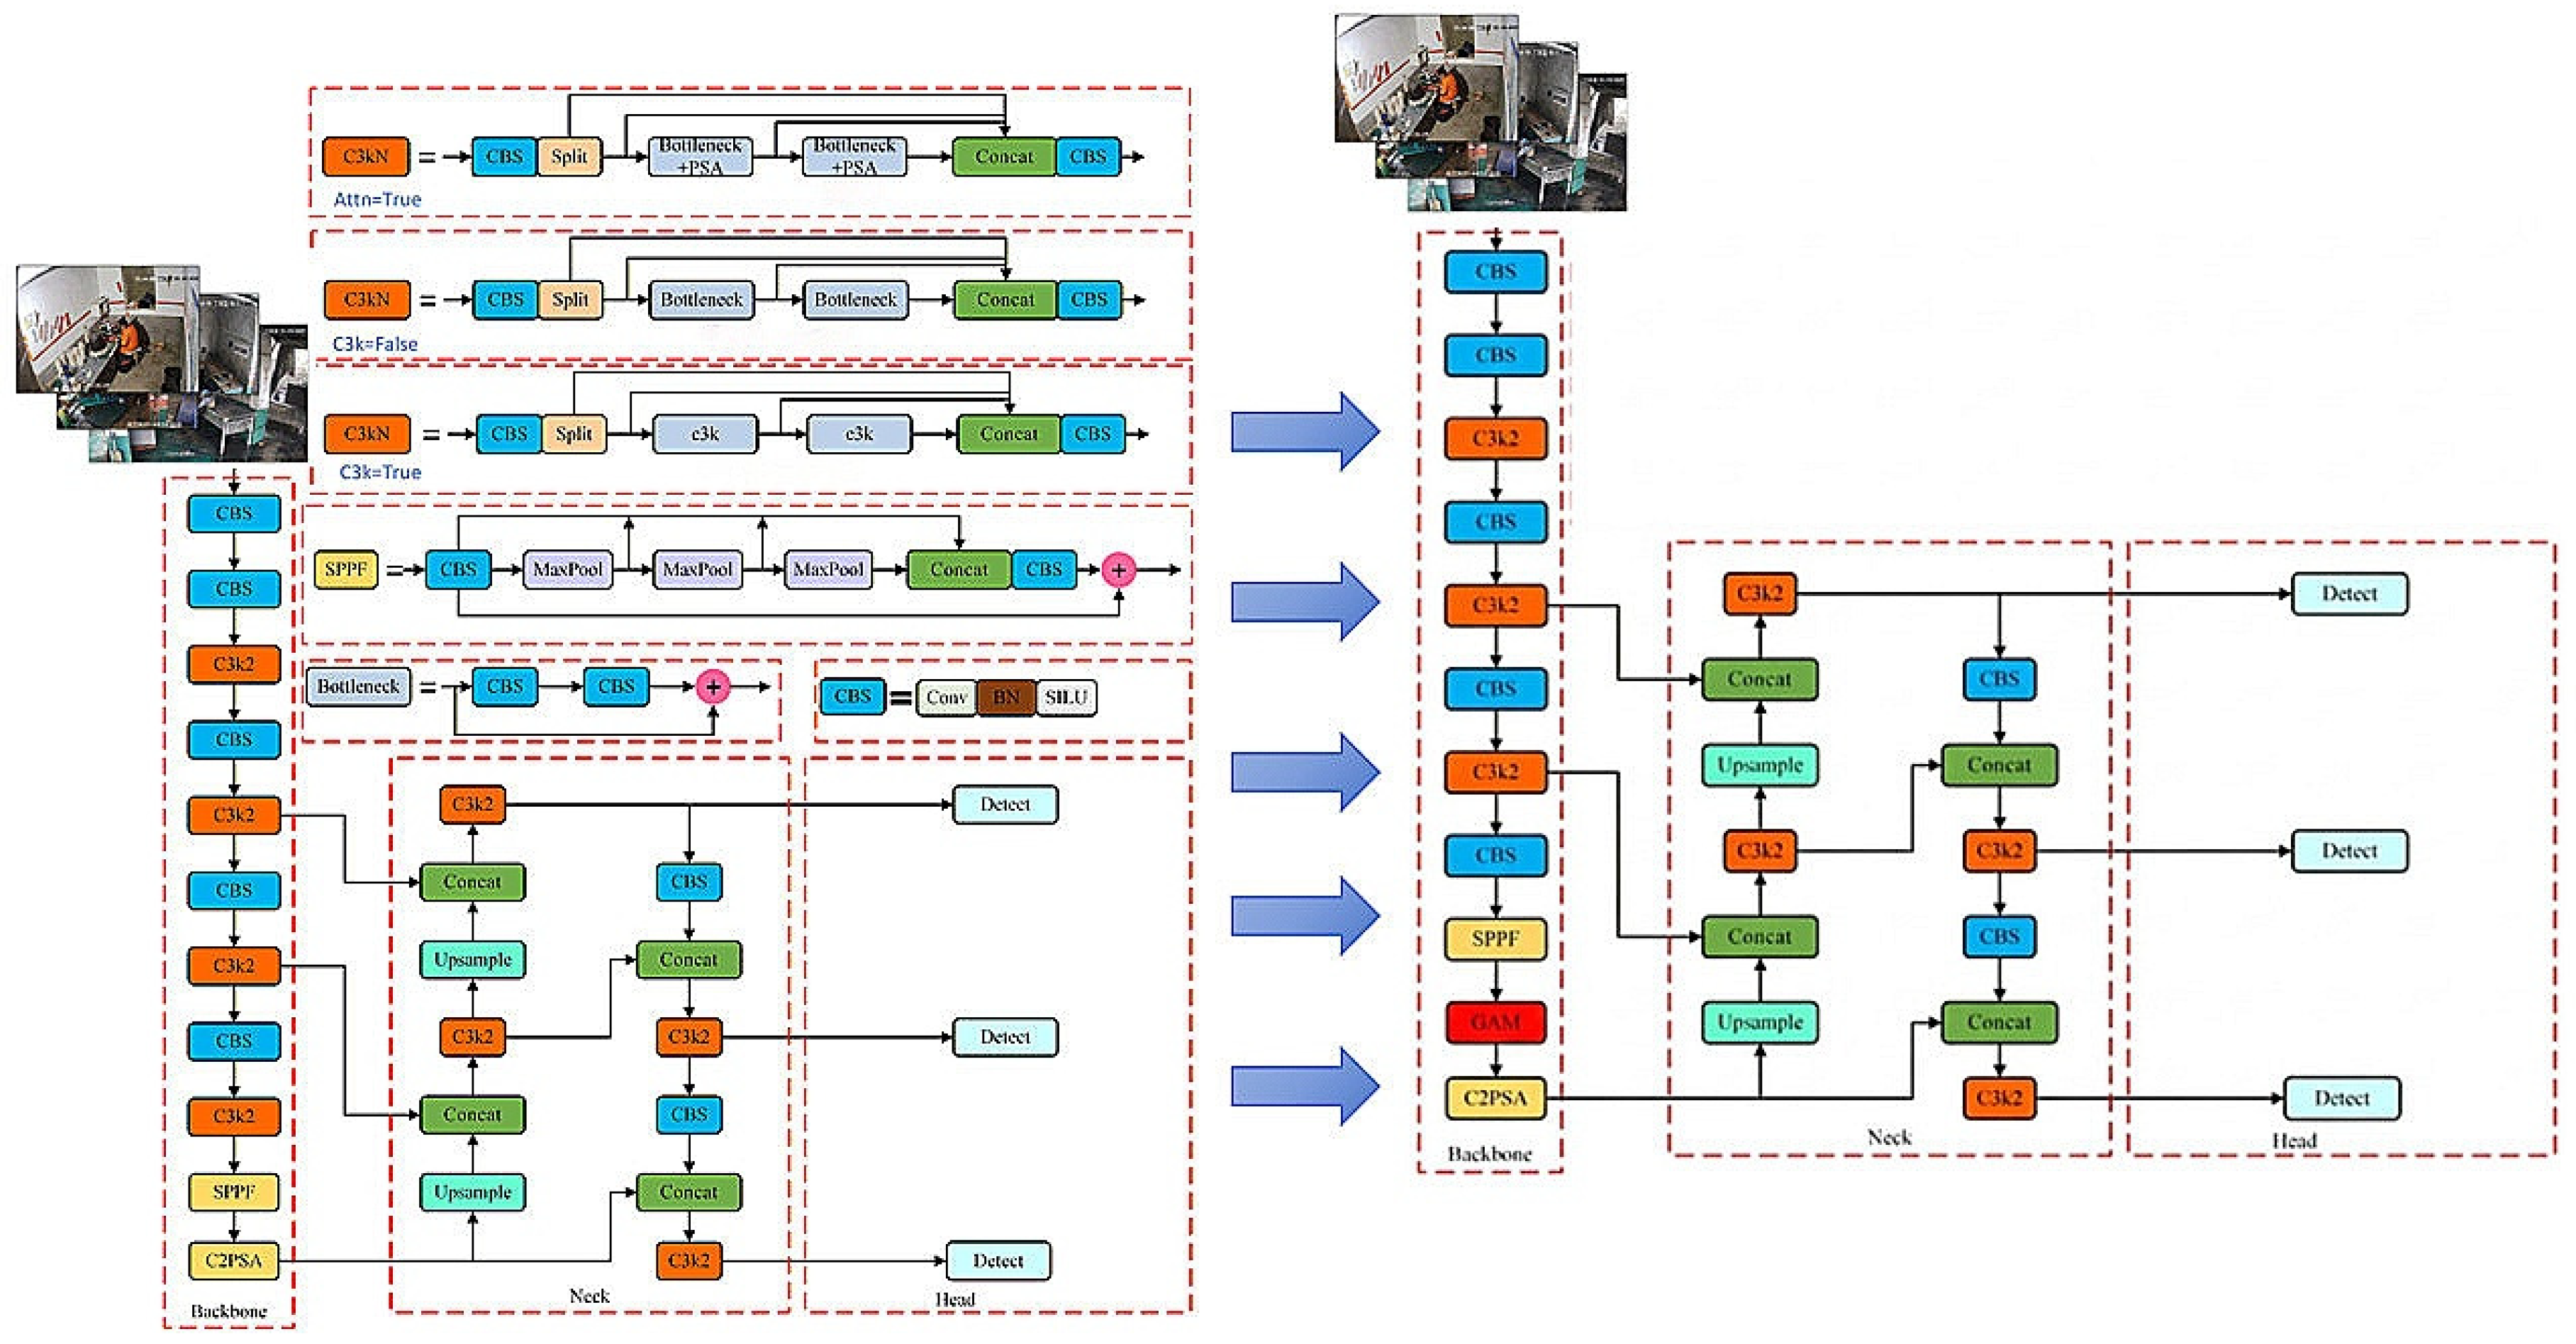
The method is built on the edge-optimized YOLO26 architecture, which serves as the detection baseline because of its end-to-end NMS-free inference and simplified regression pipeline. In firework manufacturing workshop surveillance, personnel features are often weakened by high-altitude camera perspectives and industrial dust, leading to information loss in deep semantic layers. To address these conditions, GAM is integrated at the terminal stage of the Backbone. As illustrated in Figure 2, the GAM module is positioned after the SPPF layer to refine the deepest semantic features before they are propagated into the feature fusion Neck.
The primary motivation for integrating GAM at the tail of the Backbone is to mitigate the information reduction that occurs during successive downsampling. While traditional attention modules like Squeeze-and-Excitation (SE) or Convolutional Block Attention Module (CBAM) use global pooling to compress features, they often discard fine-grained spatial details. In contrast, GAM adopts a sequential channel-spatial attention structure that uses 3D permutations to preserve information across all dimensions. The structure of the GAM in this study is shown in Figure 3.
The refinement process for an input feature map F 1 R C × H × W is formulated as:
F 2 = M c ( F 1 ) F 1
F 3 = M s ( F 2 ) F 2
where M c and M s represent the channel and spatial attention submodule, and ⊗ denotes element-wise multiplication.
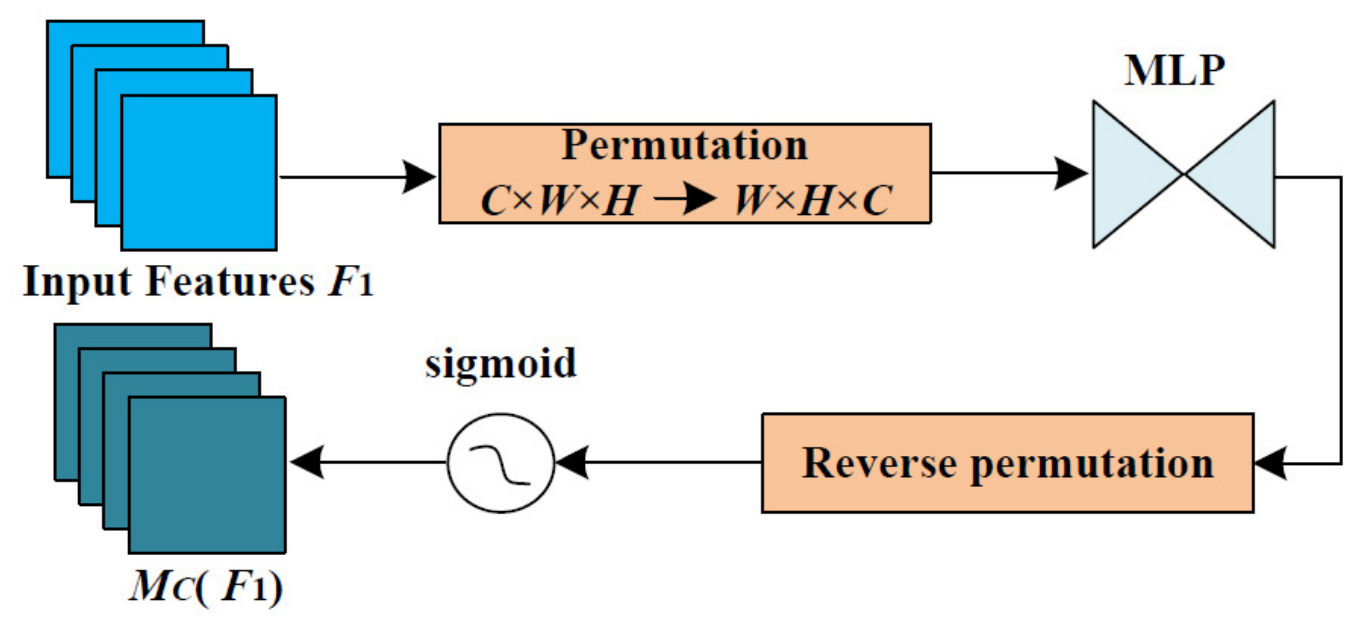
The channel attention submodule M c is designed to enhance cross-dimensional interactions while mitigating the information loss commonly associated with global pooling operations. The structures of channel attention submodules are illustrated in Figure 4. It uses a 3D permutation π to transpose the input feature map F R C × H × W into a latent space R H × W × C , which maintains spatial feature integrity during channel-wise processing. Subsequently, these dependencies are amplified through a two-layer Multi-Layer Perceptron (MLP) with a reduction ratio r, followed by an inverse permutation π 1 . The implementation is formulated as:
M c ( F ) = B N ( W 1 ( σ ( W 0 ( π ( F ) ) + b 0 ) ) + b 1 )
where W 0 R C / r × C and b 0 R C / r denote the weights and biases of the encoder layer, while W 1 R C × C / r and b 1 R C represent the decoder layer. B N denotes Batch Normalization used for gradient stabilization, and σ represents the activation function.
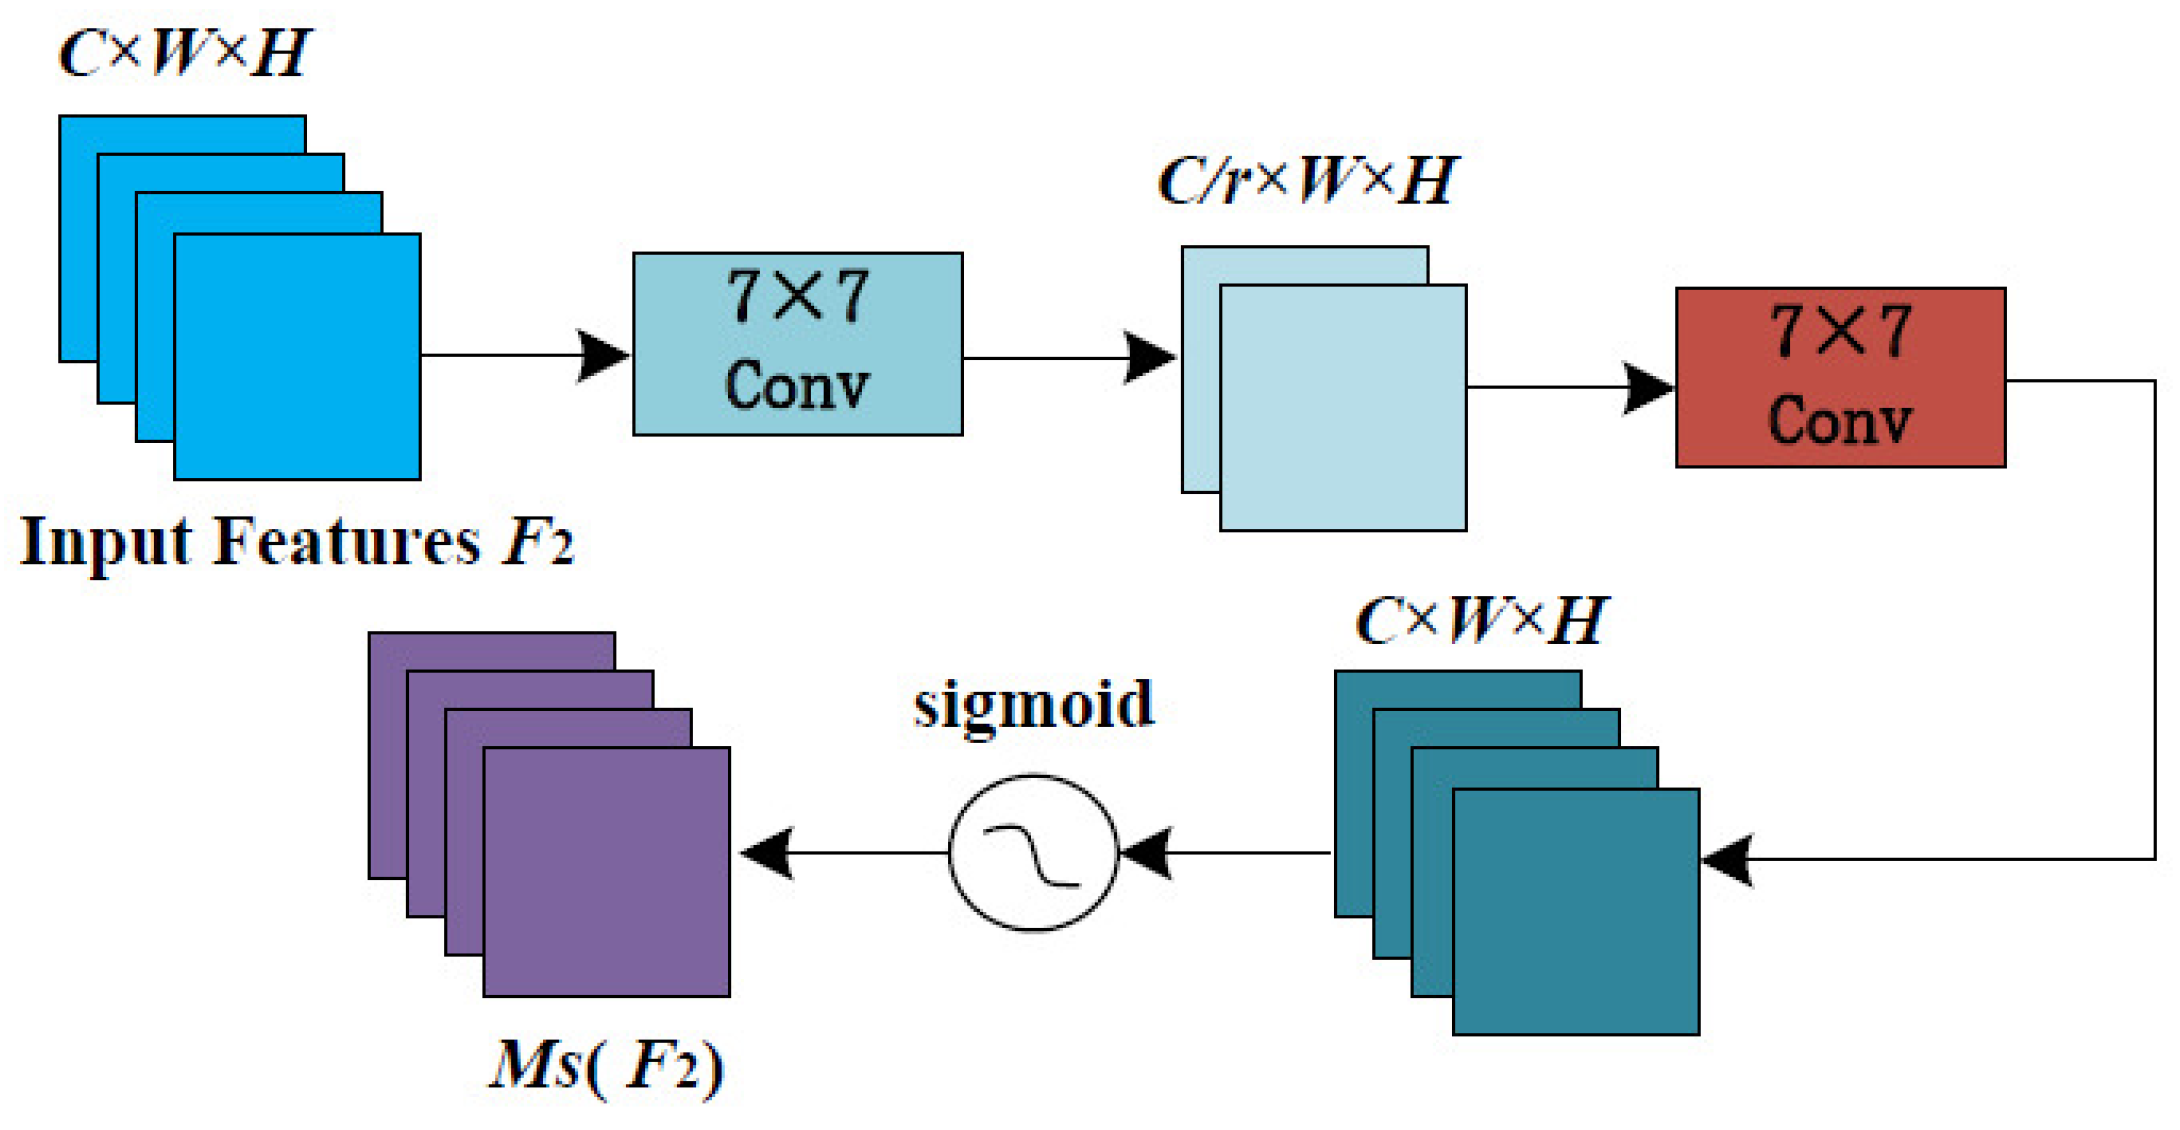
To focus on high-frequency spatial features within cluttered factory environments, such as workers’ personal protective equipment (PPE) or body contours, the spatial submodule M s fuses information without the need for downsampling. The structures of spatial attention submodules are illustrated in Figure 5. Unlike traditional attention modules that rely on max-pooling, M s uses two consecutive 7 × 7 convolutional layers to achieve spatial information fusion. To counter the increased parameter count following the removal of pooling layers, we incorporate grouped convolutions and a channel shuffle mechanism, ensuring computational efficiency on resource-constrained edge devices. The mapping relationship is defined as follows:
M s ( F ) = σ ( B N ( s h u   f   f   l e ( f 1 7 × 7 ( f 0 7 × 7 ( F ) ) ) ) )
where f 7 × 7 denotes the convolutional operation with a 7 × 7 kernel to expand the receptive field, and s h u   f   f   l e represents the channel reorganization operation that facilitates cross-group information flow.
The placement of GAM after the SPPF layer forms a feature transition node in the YOLO26-GAM detection model. While SPPF expands the receptive field via adaptive spatial pooling to process multi-scale objects, it lacks the mechanism for deep interactive learning between feature channels. By inserting GAM at this junction, the model achieves the following objectives:
  • Global Refinement of Deep Semantics: It refines the P5 layer features where semantic information is most abstract but spatial resolution is lowest, distilling worker-related signatures from cluttered industrial backgrounds.
  • Enhanced Feature Fusion Foundation: It ensures that the Neck receives more discriminative and spatially aware representations, which improves the subsequent “one-to-one” label assignment process in the NMS-free head and increases the detection recall of small targets in high-altitude views.
The selection of GAM over alternative attention mechanisms is experimentally evaluated in Section 4.3 using the same post-SPPF insertion position and identical training conditions.

3.2. ReID-Assisted Multi-Zone Personnel Safety Control

3.2.1. Mathematical Model for the Site-Specific “10/2” Personnel-Count Constraint

Based on the practical safety-management requirements of Deren Firework Co., Ltd. (Nanchang, China), this study formulates a site-specific hierarchical personnel-count constraint, hereafter referred to as the “10/2” constraint. This constraint is modeled as a dual-level control strategy involving local and global spatial limits. The numerical thresholds are an internal operational rule established for the participating factory rather than a generally applicable industry or national standard. The local threshold limits personnel aggregation within each hazardous workshop, whereas the global threshold limits the number of personnel simultaneously present across the 10 monitored workshops. These values should therefore be recalibrated according to the workshop layout, production process, and safety-management requirements when the method is transferred to another site.
Let S = { s 1 , s 2 , , s 10 } represent the set of ten monitored workshops within the facility. At any discrete time t, let n i ( t ) denote the number of detected personnel in workshop s i . The system state is constrained by the following mathematical model:
  • Local Capacity Constraint: To prevent excessive personnel density in high-risk zones, the personnel count of any individual workshop i is bounded by:
    n i ( t ) θ l o c a l , i { 1 , , 10 }
    where θ l o c a l = 2 . Any state where n i ( t ) > 2 triggers an immediate Level-1 localized alarm.
  • Global Aggregate Constraint: To limit the total number of personnel simultaneously present across the monitored workshops, the global personnel count N t o t a l ( t ) is constrained by:
    N t o t a l ( t ) = i = 1 10 P i ( t ) θ g l o b a l
    where P i ( t ) is the set of ReID identities identified in workshop s i , and θ g l o b a l = 10 . The operator ∪ represents a non-redundant union achieved through cross-camera identity fusion.

3.2.2. Cross-Camera Identity Association via Person Re-Identification

A critical challenge in multi-workshop personnel safety control is the over-counting phenomenon caused by personnel transitioning between camera fields of view. To resolve this, we implement a ReID-based coordination layer to ensure identity consistency.
For every detection box b i , k (the k-th person in workshop i), the corresponding person crop is resized to 256 × 128 pixels (height × width) and processed using FastReID with an ImageNet-pretrained ResNet-50-IBN backbone. The network was fine-tuned on identity-labeled personnel images collected at the factory. Global average pooling and a batch-normalization neck produce a 2048-dimensional appearance embedding f i , k , which is L2-normalized before cross-camera identity matching. To determine whether an individual is already present in the global registry, we calculate the maximum cosine similarity s c o s between f i , k and the Global Feature Gallery G :
s c o s ( f i , k , G ) = max g G f i , k · g f i , k g
The official FastReID bagtricks_R50-ibn configuration was adopted without hyperparameter modification as a reproducible training baseline. This setting combines identity classification and triplet objectives with identity-balanced sampling, following the standard ReID baseline design in [33]. The configuration was then used to fine-tune the ReID model on the factory identity-labeled personnel images. The resulting configuration is summarized in Table 1.
The similarity threshold is set to τ = 0.65 for the current factory deployment; for deployment at other sites, it should be recalibrated using site-specific validation data. The de-duplication logic follows a threshold-based decision gate:
Identity Match: If s c o s τ , the system recognizes the target as an existing identity moving between camera views.
New Entry: If s c o s < τ , the target is classified as a new personnel entry. The feature f i , k is appended to G , and N t o t a l is incremented by 1.
By integrating this ReID layer, the site-specific counting logic suppresses redundant triggers caused by overlapping fields of view or rapid transitions between monitored workshops, supporting the reliability of the proposed safety-control method.
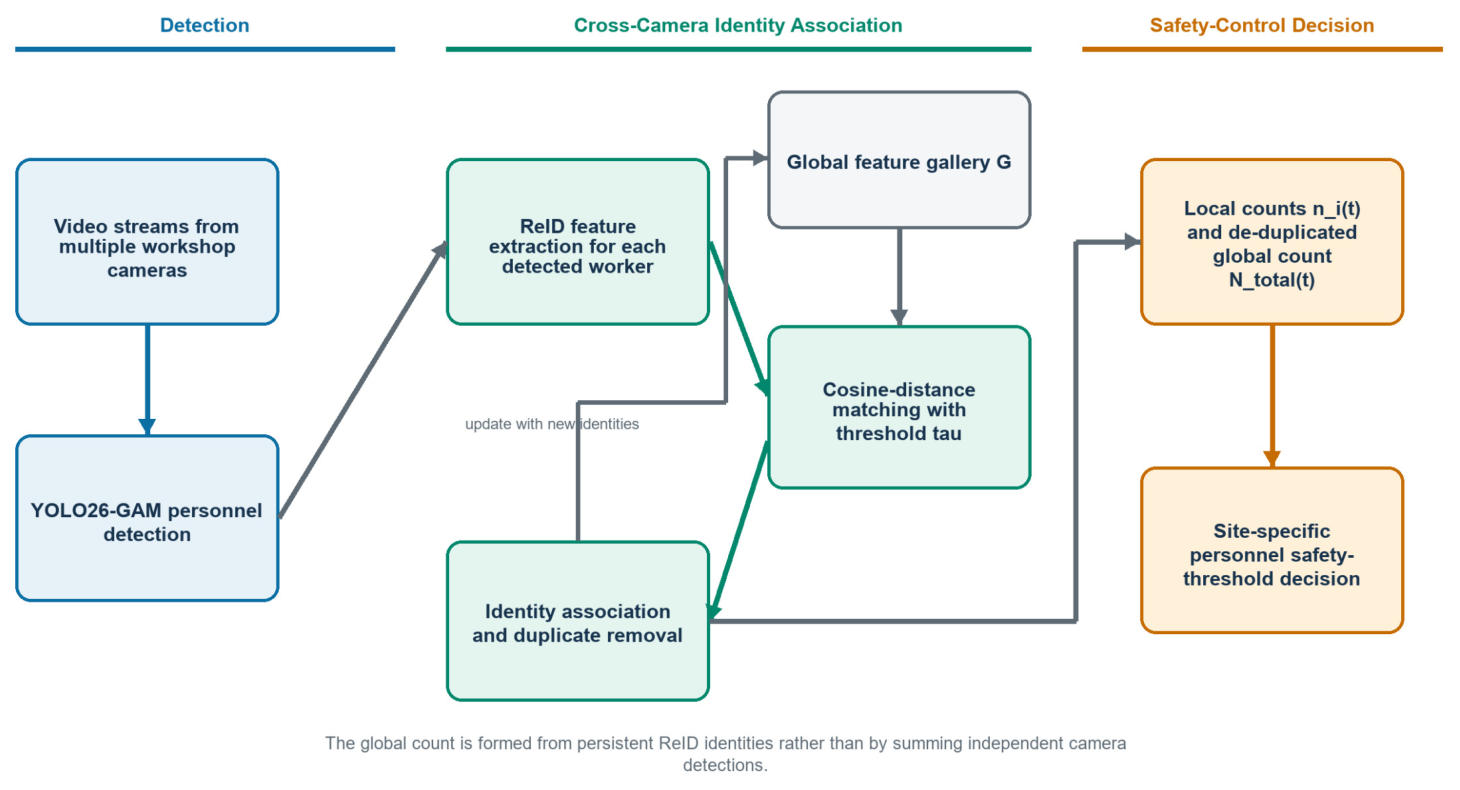
The complete ReID-assisted coordination process is summarized in Figure 6. Personnel detections from each camera are converted into ReID features and compared with the global feature gallery. Matched workers retain their existing global identities, whereas unmatched workers are registered as new identities. The resulting de-duplicated identity set is then used to calculate local and global personnel counts before the site-specific safety thresholds are evaluated.

3.3. Polygon-Based Irregular Electronic Fence

The IEF is modeled as a closed planar polygon P , which provides the geometric flexibility required to accommodate the heterogeneous layouts of firework production lines. In implementation, each electronic fence is calibrated into an irregular shape to align with the safe-operating boundary of the corresponding workshop zone.
The geometry of each fence P is defined by an ordered sequence of n vertices, represented by the vertex set V :
V = { v 1 , v 2 , , v n } = { ( x 1 , y 1 ) , ( x 2 , y 2 ) , , ( x n , y n ) }
where v i denotes the pixel coordinates normalized to the range [ 0 , 1 ] relative to the image dimensions. The boundary of the polygon is formed by the union of n directed edges E = { e 1 , e 2 , , e n } , where e i connects vertex v i to v i + 1 . By defining the monitored area as a vector-based polygon rather than a rigid rectangle, the method excludes non-functional background elements, such as explosion-proof partitions and fixed mechanical structures.
To determine whether a detected worker is within the operational boundary, we employ the Ray Casting Algorithm. This algorithm is computationally efficient and suitable for non-convex polygons common in firework workshops.
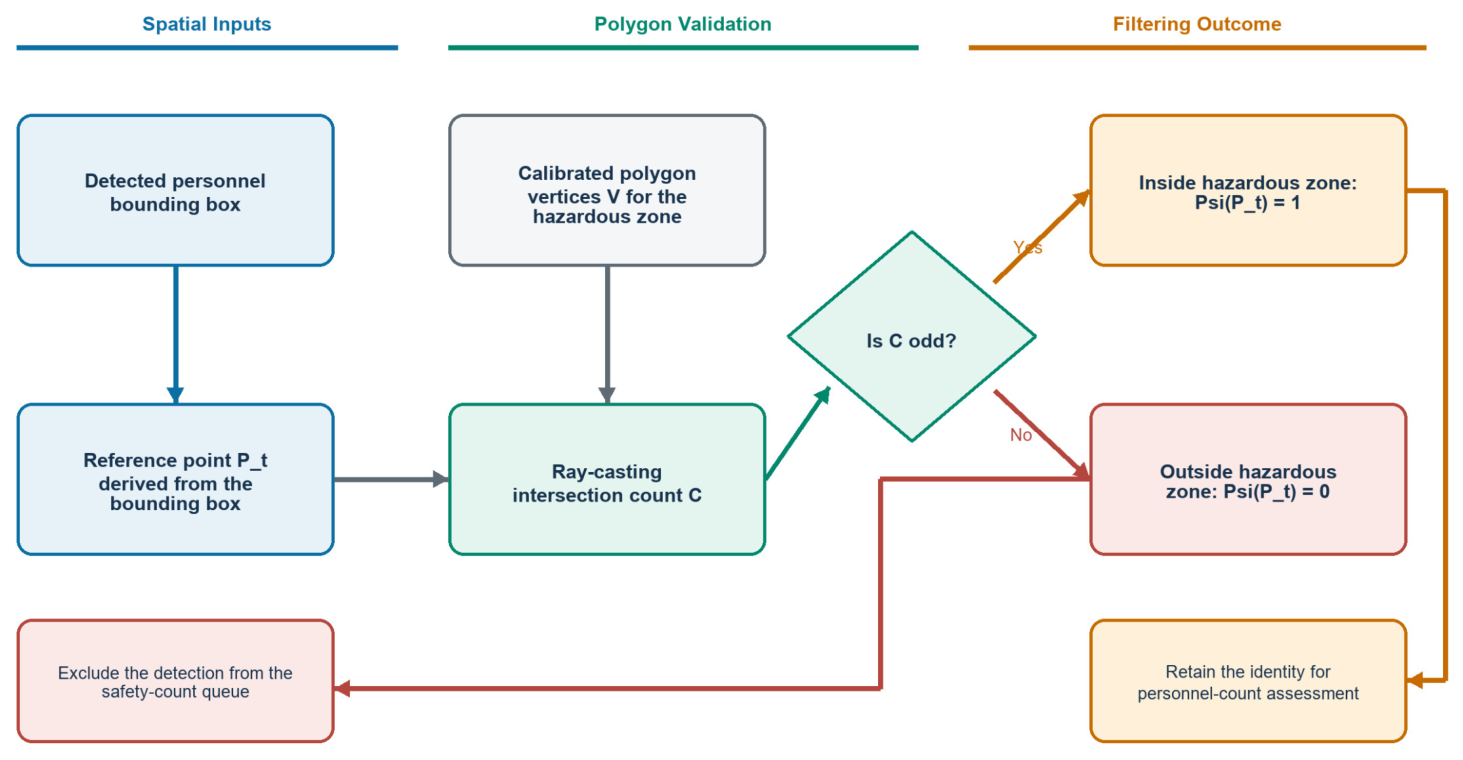
The complete filtering process is shown in Figure 7. For each detected worker, the centroid of the bounding box is used as the reference point P t . The ray-casting test evaluates P t against the calibrated polygon: an odd number of edge intersections indicates that the worker is inside the hazardous operating zone and should be retained for personnel-count assessment, whereas an even number indicates that the detection lies outside the zone and should be excluded from the safety-count queue.
The decision function Ψ ( P t ) is defined as follows:
Ψ ( P t ) = 1 , P t Ω 0 , P t Ω
Mathematically, the state P t Ω is confirmed if a horizontal ray starting from P t and extending to infinity intersects the edges of the polygon P an odd number of times. Let E j be the edge connecting ( x j , y j ) and ( x j + 1 , y j + 1 ) . The intersection count C is calculated, and the target is validated only if:
C 1 ( mod 2 )
Targets with Ψ ( P t ) = 0 are immediately suppressed by the inference engine, preventing background interference from being registered as safety violations.

4. Experiments

4.1. Experimental Setup

4.1.1. Training Protocols

To ensure convergence on the site-specific industrial data, the YOLO26-based detection model was trained for 200 epochs using a Muon-style SGD optimizer on an NVIDIA RTX 4090 GPU (24 GB; NVIDIA Corporation, Santa Clara, CA, USA). Unlike the standard SGD in YOLOv8, this hybrid approach incorporates Muon-style orthogonalization to enhance gradient orthogonality and stabilize deep semantic layers. Key hyperparameters were standardized to an initial learning rate of 0.01, a weight decay of 0.0005, and a batch size of 16. All input imagery was resized to a 640 × 640 pixel resolution to maintain consistent feature extraction across the production stages. The field cameras were installed at a uniform height of 4.5 m, and the monitored personnel wore the standard workwear used at Deren Firework Co., Ltd.

4.1.2. Evaluation Metrics

To quantify detection performance across workshop zones, this study reports precision (P), recall (R), and mean average precision at an IoU threshold of 0.5 (mAP@0.5). Precision denotes the proportion of predicted workers that are correct, whereas recall denotes the proportion of ground-truth workers successfully detected by the model. mAP@0.5 is used as the primary accuracy metric because it summarizes localization and classification performance under a consistent overlap criterion.
For edge deployment, we further report the number of parameters, giga floating-point operations (GFLOPs), and inference latency in milliseconds. These efficiency metrics are included because a firework manufacturing workshop monitoring system must maintain both high detection accuracy and stable real-time performance. In the detector and attention-mechanism comparisons, latency denotes the single-image inference time of the detection model. Parameters and GFLOPs describe detector complexity only; they do not include the ReID gallery or IEF filtering. In the ablation study, processing time denotes the per-image latency of each enabled configuration, including FastReID feature extraction, gallery matching, and IEF filtering when these modules are activated.
To quantify run-to-run variability in the attention-mechanism comparison, YOLO26 + CBAM and YOLO26 + GAM were trained and evaluated in five matched runs using the same data partition, training protocol, and random-seed settings. Precision, recall, and mAP@0.5 are reported as mean ± standard deviation. The primary statistical comparison was mAP@0.5 between YOLO26 + GAM and YOLO26 + CBAM. A two-sided paired t-test was performed on the five matched mAP@0.5 values, and the mean difference was reported with a 95% confidence interval. The significance level was set to α = 0.05 .

4.2. Benchmarking of Edge Detection Models

To evaluate detection performance and deployment feasibility, we conducted a benchmark analysis against nine representative object detection models. These include legacy baselines (Faster Region-based Convolutional Neural Network (Faster R-CNN), Single Shot Multibox Detector (SSD)), previous YOLO iterations (version 5, version 6, version 7), and recent state-of-the-art versions (version 8, version 9, version 10, version 11). For a controlled comparison, all models were trained and evaluated using the same data partition and an input resolution of 640 × 640 pixels. Single-image CPU latency was measured on the same workstation equipped with an NVIDIA RTX 4060 Ti GPU (NVIDIA Corporation, Santa Clara, CA, USA) and an Intel Core i5-12600KF CPU (Intel Corporation, Santa Clara, CA, USA). The quantitative results are detailed in Table 2.

4.2.1. Accuracy and Localization Analysis

The experimental data show that the unaugmented YOLO26 baseline provides strong detection performance for pyrotechnic personnel detection, achieving an mAP@0.5 of 96.3 percent. As shown in Table 2, this baseline architecture alone represents a 3.9 percentage point improvement over the YOLOv8n baseline. Compared with YOLOv10n, YOLO26 improves precision, recall, and mAP@0.5 by 3.9, 5.0, and 3.5 percentage points, respectively. Compared with YOLOv11n, the corresponding improvements are 3.3, 3.3, and 2.8 percentage points.
In high-risk firework manufacturing workshops, capturing minute personnel features from high-altitude perspectives is challenging due to pixel scarcity. Compared with earlier iterations such as YOLOv7 and YOLOv8, YOLO26 uses Progressive Loss and Small-Target-Aware Label Assignment to strengthen supervision for small objects. Furthermore, integrating GAM at the SPPF transition node helps suppress industrial background noise and dust interference, improving worker localization under low-visibility conditions.

4.2.2. Real-Time Responsiveness and Edge Feasibility

Efficiency and deterministic latency are critical for time-sensitive pyrotechnic safety monitoring. The YOLO26 baseline achieves a 37.5 ms single-image CPU latency, corresponding to latency reductions of 53.3% and 5.1% relative to YOLOv8n and NMS-free YOLOv10n, respectively. Although YOLO26 contains 0.2 M more parameters than YOLOv10n, it requires 0.9 fewer GFLOPs and reduces latency by 2.0 ms. Relative to YOLOv11n, YOLO26 reduces latency by 18.6 ms, parameters by 0.1 M, and computation by 0.7 GFLOPs. This efficiency is attributed to a native end-to-end NMS-free architecture and the removal of Distribution Focal Loss (DFL), which eliminate sequential post-processing bottlenecks and simplify the regression pipeline for enhanced hardware compatibility. Together with the accuracy gains reported above, these results justify selecting YOLO26 because it provides the most favorable accuracy–latency balance among the evaluated recent YOLO models.

4.3. Attention Mechanism Analysis for Industrial Visual Features

To further enhance feature extraction and focus the model on salient regions (for example, worker PPE and silhouettes) within complex factory backgrounds, this study evaluates the integration of several representative attention mechanisms. Specifically, we incorporate CBAM, GAM, Shuffle Attention, and SE modules into the YOLO26 architecture. For a controlled comparison, all attention modules are inserted after the SPPF layer and evaluated under identical training and hardware conditions. These enhancements aim to suppress industrial noise and illumination interference while strengthening informative channel-spatial representations.
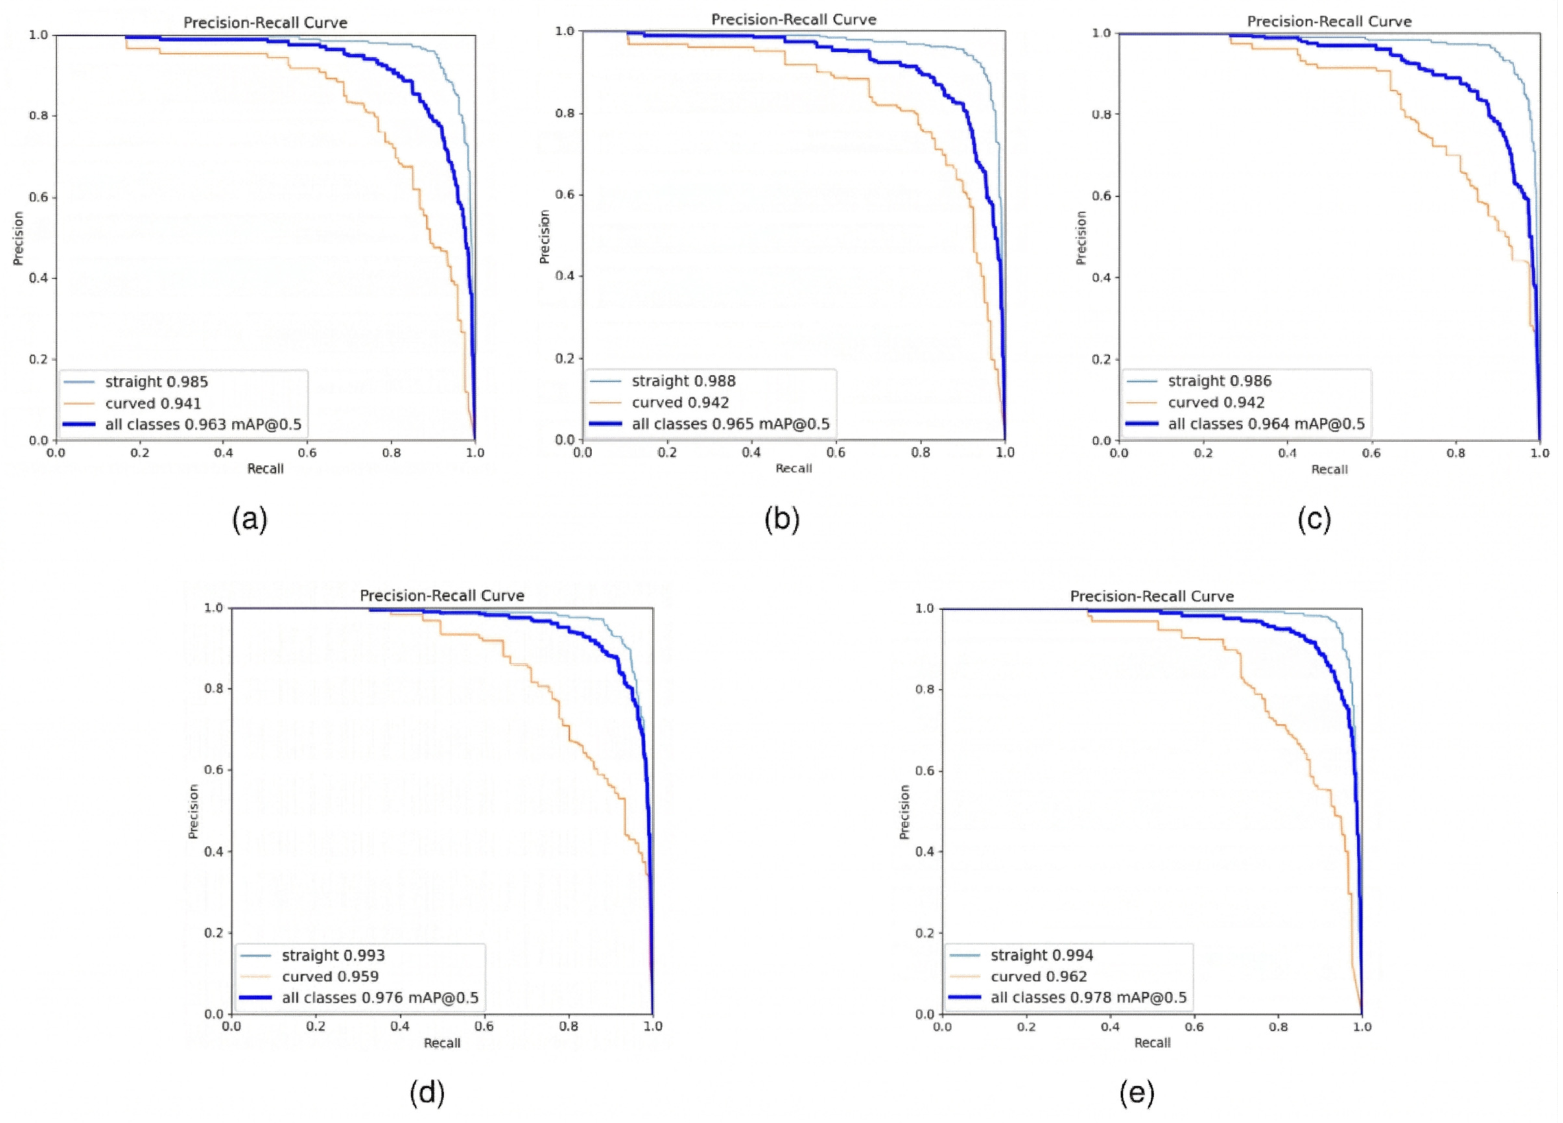
Comparative experiments were conducted using the in-situ dataset, and the results were analyzed using multiple evaluation metrics. Figure 8 presents the precision–recall (P–R) curves for the baseline YOLO26 and its attention-augmented variants. The precision–recall curves show the trade-off between precision and recall and reflect the model’s sensitivity to small and occluded personnel targets. The curves indicate that the integration of the GAM produces the largest high-precision and high-recall region, suggesting stronger detection performance. The detailed numerical results are summarized in Table 3.
The analysis in Table 3 shows that attention modules improve the baseline YOLO26 performance, with different computational overheads. GAM and SE produced the largest latency reductions, decreasing inference time by 0.8 ms and 0.6 ms per image, respectively. The mAP@0.5 of these two variants increased by 1.5 and 1.3 percentage points, respectively. These results suggest that global interactive features help distinguish workers from cluttered workshop equipment.
Compared with CBAM, GAM increases mAP@0.5 from 96.5% to 97.8%, while reducing the parameter count from 4.25 M to 2.90 M and the computational complexity from 13.75 to 6.67 GFLOPs. This controlled comparison provides the experimental basis for selecting GAM.
To visualize the regions contributing to personnel detection, Grad-CAM [34] was applied to the baseline, CBAM, and GAM variants. The heatmaps were generated from the same workshop image and the same personnel-detection instance for all three variants.
Figure 9 qualitatively compares the Grad-CAM responses of the three detector variants on the same workshop image. The baseline response extends across the worker and surrounding workbench region. Both CBAM and GAM concentrate the response nearer to the worker in the lower central work area; the GAM response is more localized around the worker while showing less activation in the surrounding background. This qualitative observation is consistent with the improved detection metrics of YOLO26 + GAM in Table 3; it is provided as a visual interpretation rather than an additional quantitative metric.

Repeated-Run Statistical Analysis

Table 4 reports the repeated-run results for the CBAM and GAM variants. YOLO26 + GAM achieved higher mean precision, recall, and mAP@0.5 than YOLO26 + CBAM. The paired comparison showed that the mean mAP@0.5 improvement was 1.30 percentage points (95% confidence interval: 1.11–1.49 percentage points), t ( 4 ) = 18.51 , p = 0.0000501 .

4.4. ReID-Assisted Multi-Zone Safety-Control Analysis

To evaluate the ReID-assisted collaborative counting strategy, we conducted multi-zone coordination experiments based on the site-specific “10/2” personnel-count constraint across 10 independent production workshops. The evaluation focused on identity consistency and safety-alert response under varying personnel densities and occlusion scenarios.

4.4.1. Multi-Zone Personnel Counting Accuracy

The ReID-assisted collaborative counting logic was quantified using counting accuracy and alarm success rate. A primary challenge in multi-camera environments is the identity fragmentation that occurs when workers transition between non-overlapping camera fields of view. To mitigate this, the system integrates a ReID module that maintains a unified global identity registry, allowing a worker’s identity to remain persistent across the facility.
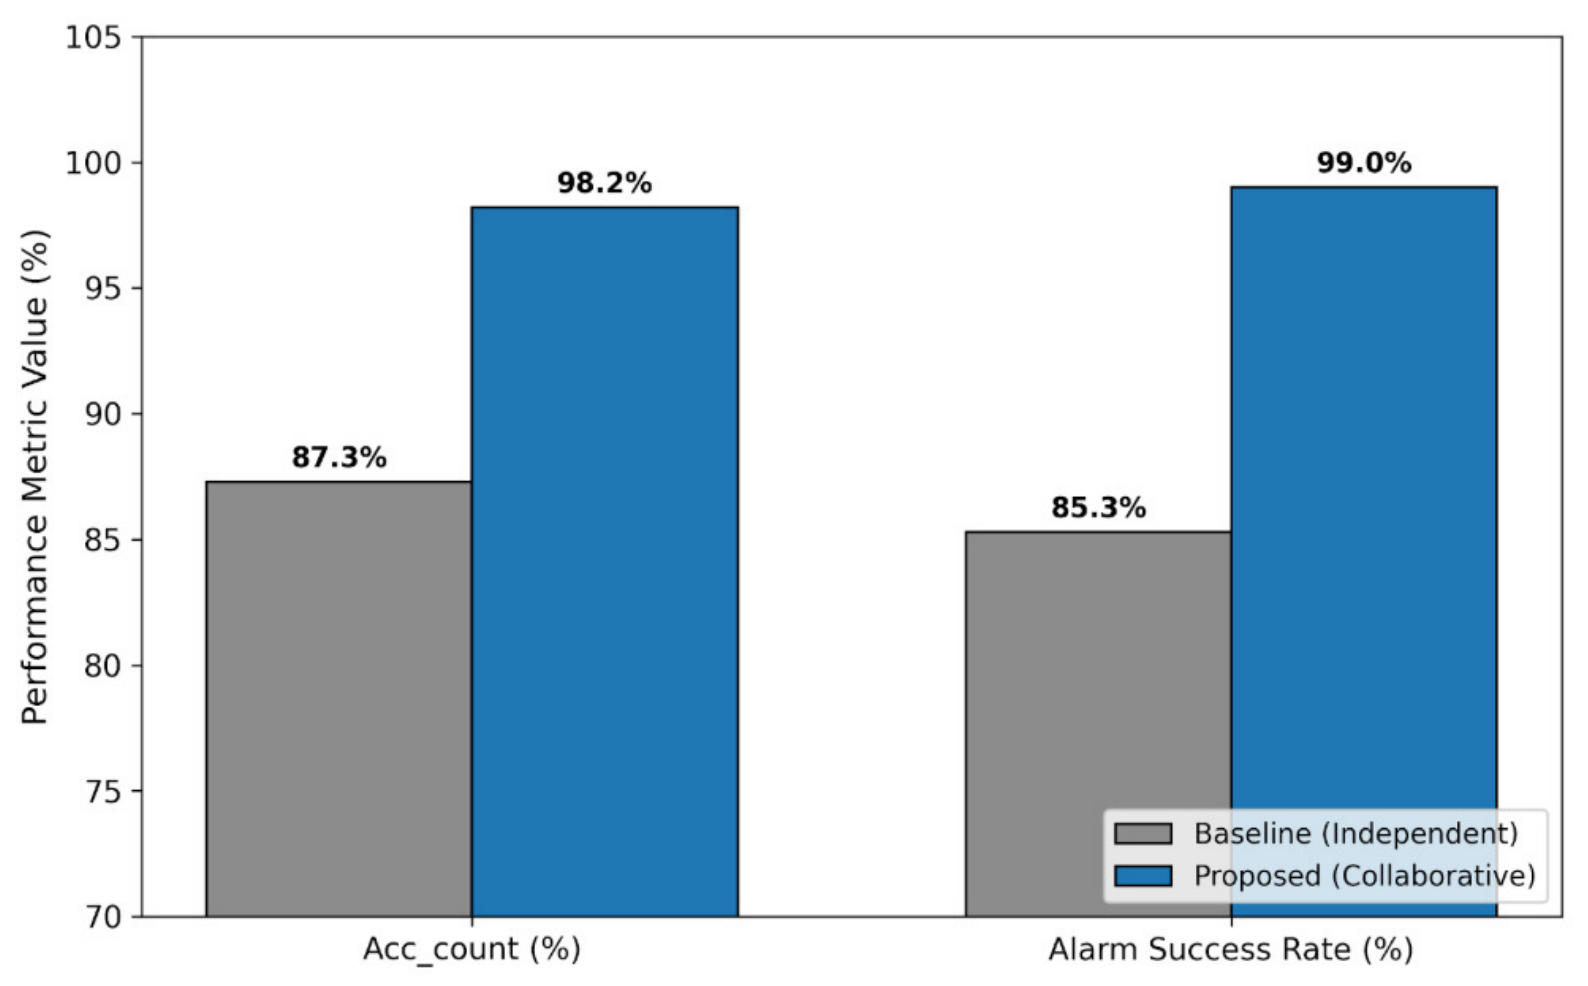
We compared the proposed method against a baseline method that employs independent counting for each workshop without cross-camera coordination. The results, summarized in Table 5, show that the proposed method achieves a global counting accuracy of 98.2 percent, higher than the baseline’s 87.3 percent.

4.4.2. Alarm Logic and Response Analysis

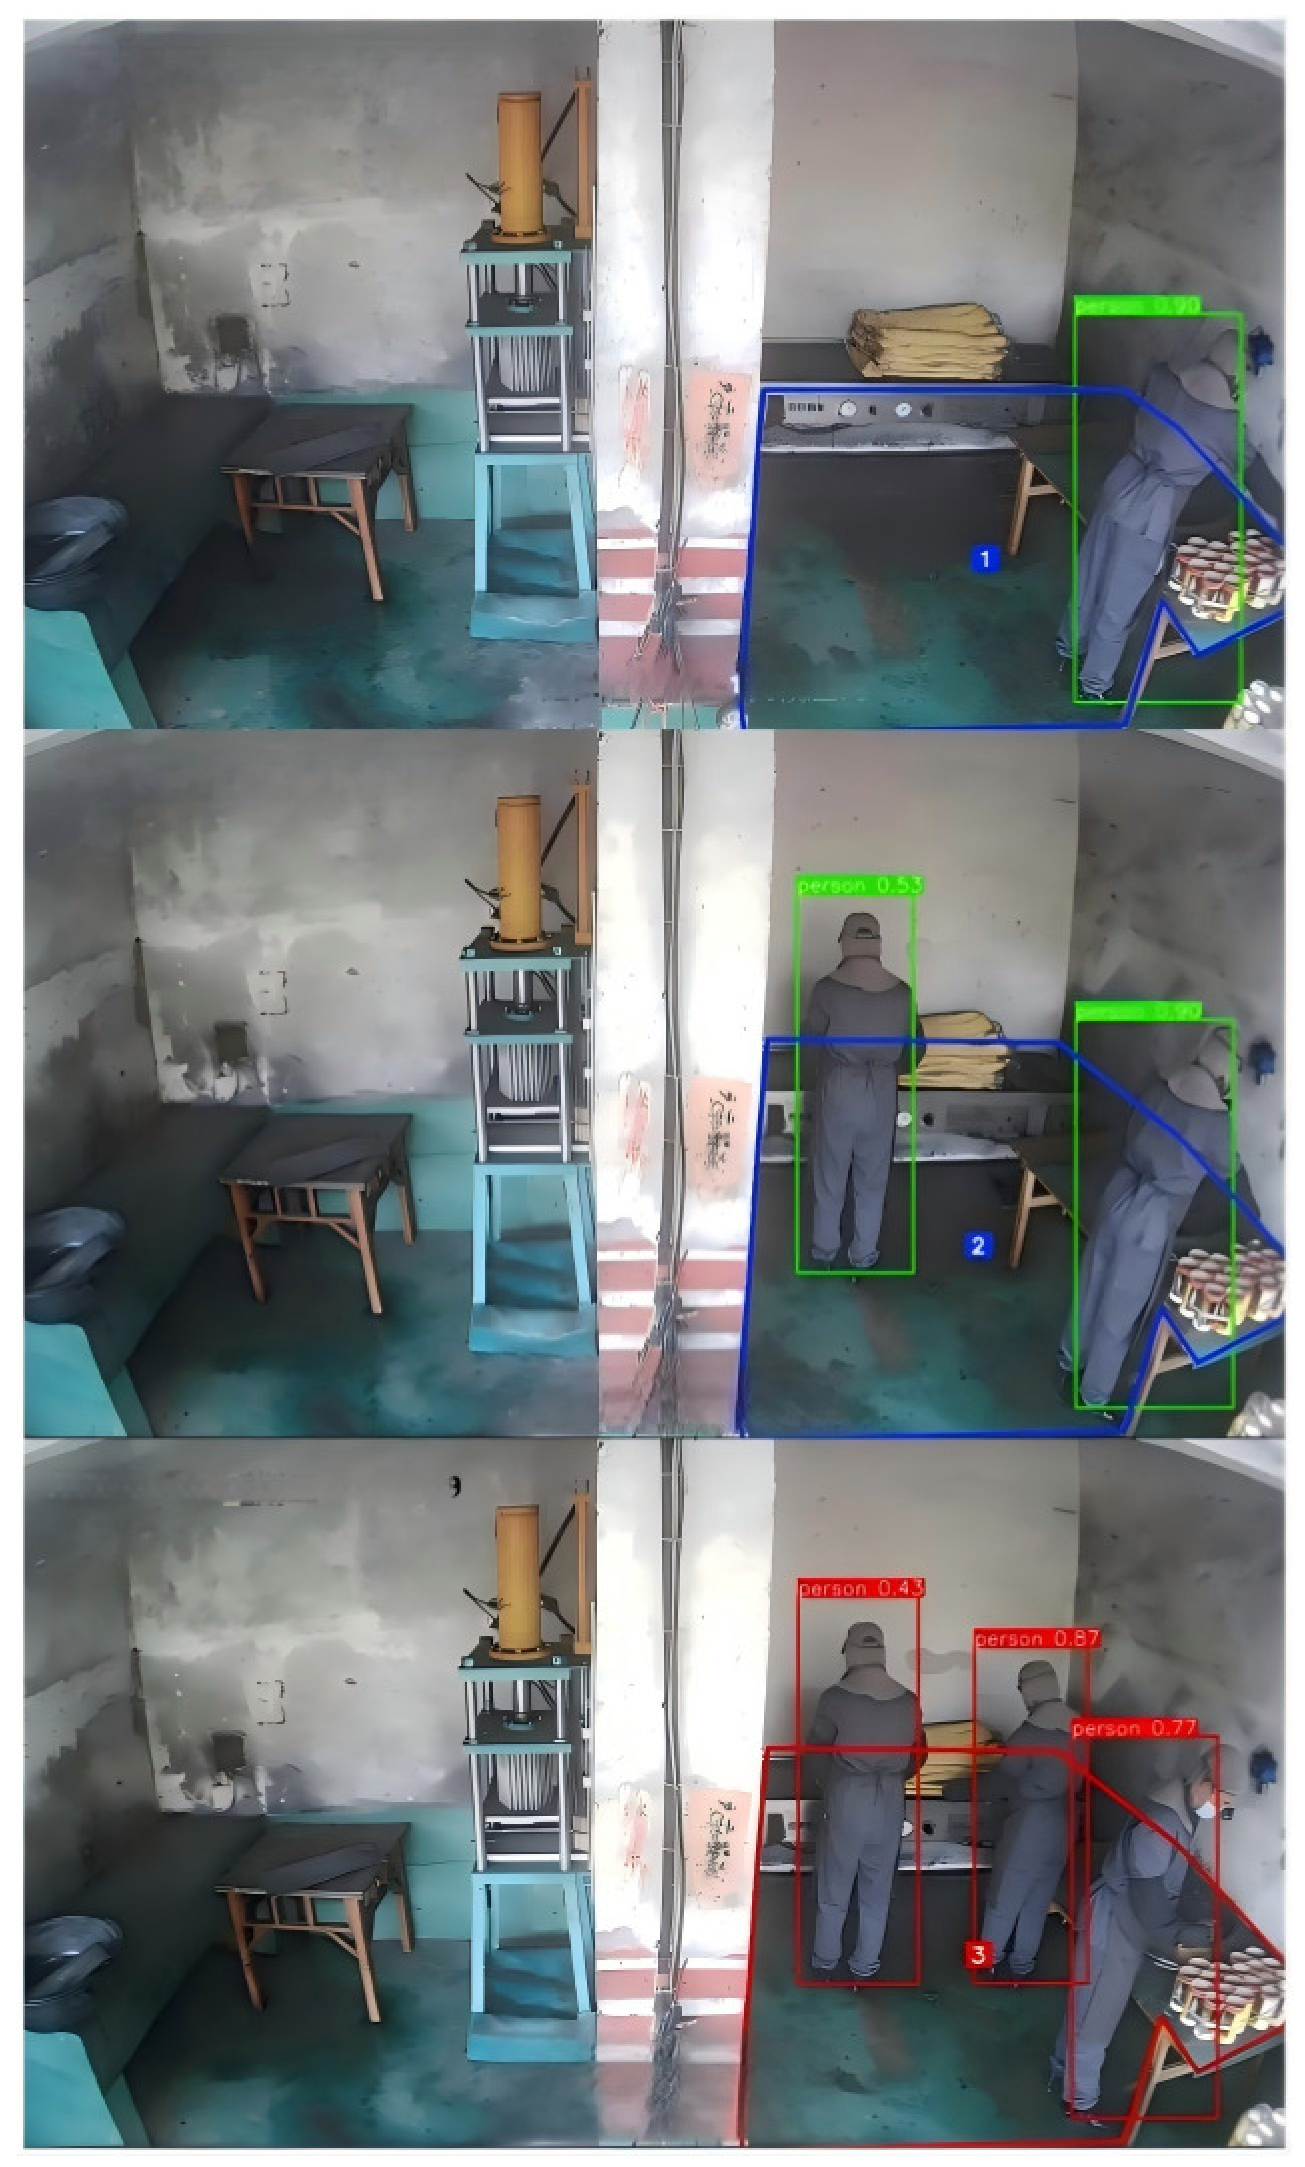
The proposed personnel safety control method enforces the site-specific “10/2” constraint (that is, the sum of personnel across workshops is less than or equal to 10 and each workshop personnel count is less than or equal to 2). Figure 10 verifies the local personnel-count constraint: the system maintains a normal monitoring state when the count is less than or equal to 2, whereas a third individual in the detection zone ( n i 3 ) triggers the safety threshold and activates a real-time visual and auditory alarm. Figure 11 further shows that the proposed method maintains more stable counting and alarm triggering than the baseline model.
In the baseline model, environmental occlusions frequently triggered identity switching, leading to redundant counts and a 12.4% false alarm rate. In the proposed method, the ReID coordination layer maintains a global feature gallery and applies cosine-similarity matching to improve identity consistency across non-overlapping camera views. Across the multi-zone evaluation cases, the proposed method achieved a 99.0% alarm success rate (Table 5), supporting reliable real-time alarm triggering under the tested site- specific conditions.

4.5. Spatial Filtering Analysis of the Irregular Electronic Fence

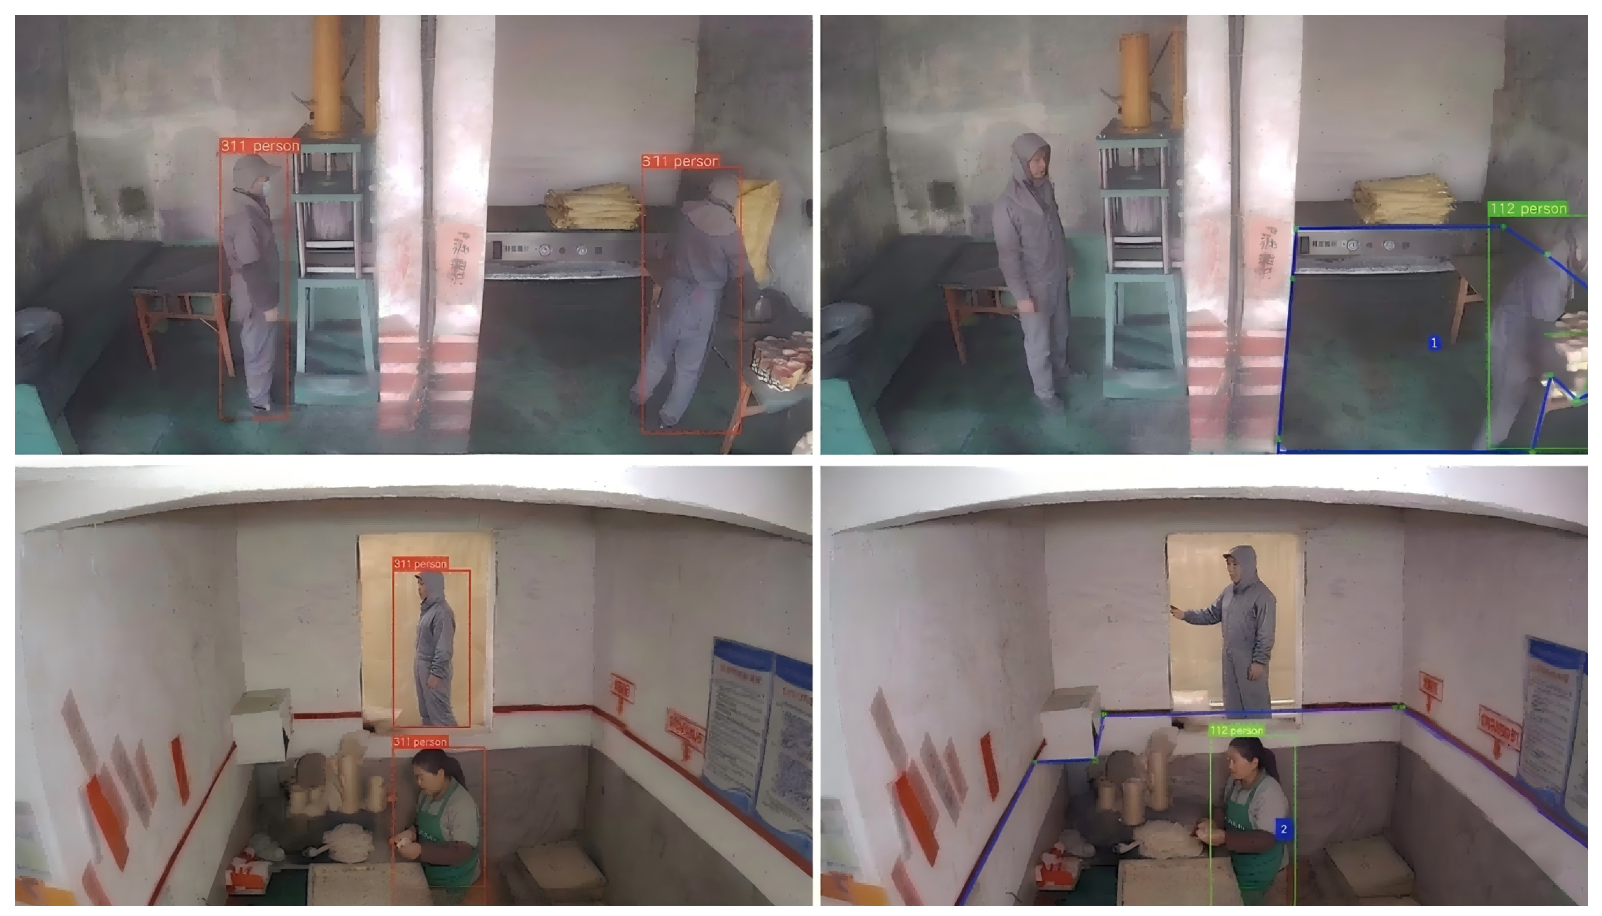
The physical layout of pyrotechnic factories is characterized by high fragmentation, where hazardous production units are often separated by safe transit corridors or administrative zones. In such complex industrial topographies, a standard rectangular detection window often captures personnel in both hazardous and safe areas, leading to frequent false alarms. To evaluate the effectiveness of the proposed polygon-based electronic fence, we compared the system performance in scenarios with and without the irregular ROI constraints.
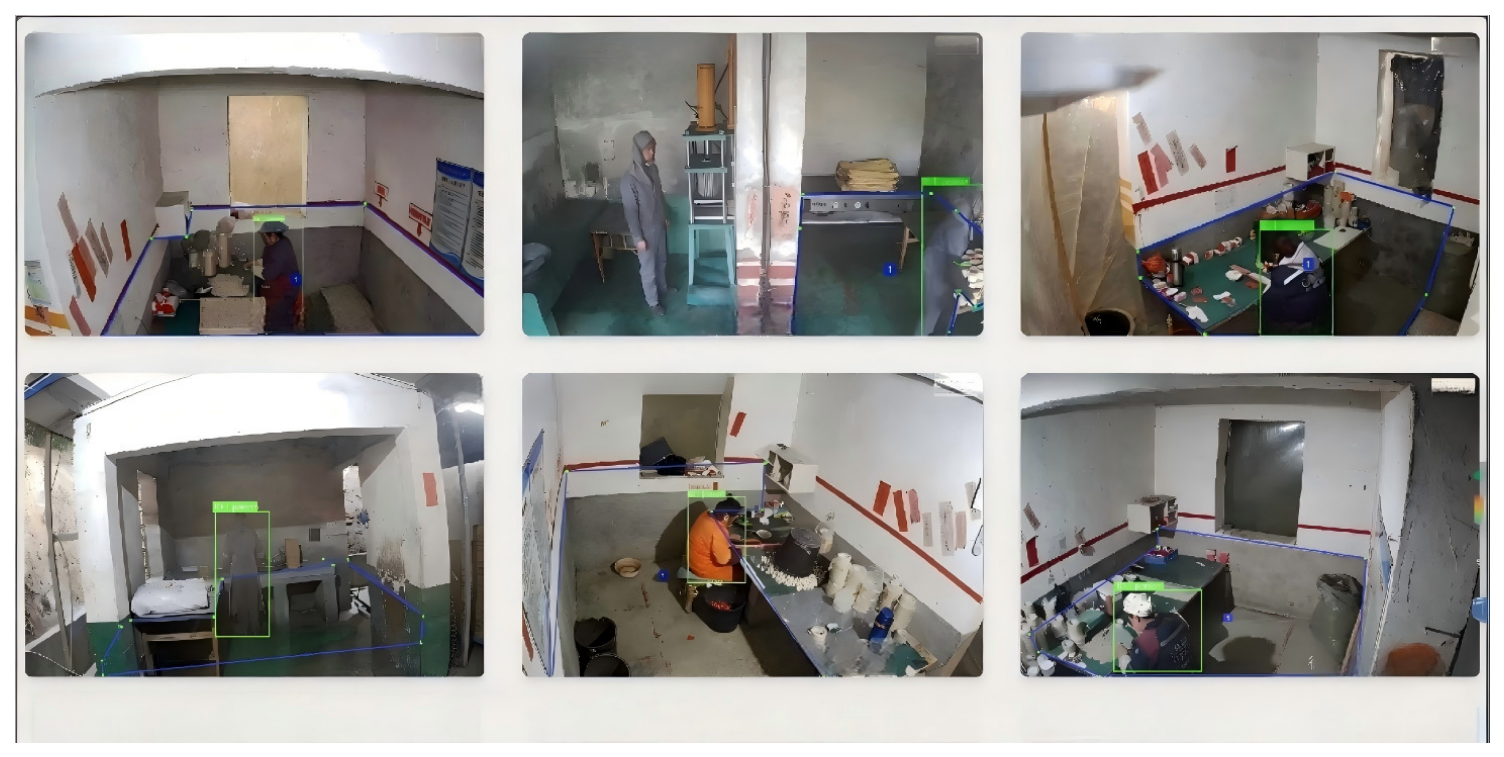
Figure 12 shows the calibrated irregular electronic fence layouts across multiple workshop zones. The electronic fences shown as blue lines are adapted to the boundaries of different hazardous operating areas, providing the spatial basis for subsequent filtering analysis.
To quantify the impact of the electronic fence, we introduced the False Detection Rate (FDR), True Positive Rate (TPR), and Zone-Specific Alarm Precision as key metrics. The FDR specifically measures the ratio of personnel detected in unauthorized or safe-background regions to the total detections. The comparative results are summarized in Table 6.
As indicated in Table 6, the integration of the IEF reduced the FDR from 18.5 percent to 2.2 percent. While the True Positive Rate (TPR) changed only slightly, the Alarm Precision improved by 17.8 percentage points. This improvement indicates that the centroid-based inclusion logic f ( x , y ) effectively filters out detections that are spatially irrelevant to safety-critical operations.
Figure 13 provides a visual comparison of the detection outcomes in a multi-functional workshop scene, where the left and right panels illustrate the system’s performance without and with the IEF, respectively.
The visual comparison shows two typical outcomes:
  • Left panel (standard YOLO26 without fence): The system shows over-detection. Personnel transiting through the non-production corridor are detected and incorrectly factored into the site-specific personnel-count logic. This leads to a false breach of the single-workshop safety threshold ( n i 2 ), triggering an erroneous emergency alert.
  • Right panel (proposed YOLO26 with IEF): By using a polygon ROI that conforms to the workshop’s hazardous boundary, the system achieves accurate spatial localization. Although personnel remain visible in the adjacent corridor, the centroid validation logic f ( x , y ) recognizes that their coordinates reside outside the defined hazard area A, and they are therefore filtered from the counting queue.

4.6. Ablation Study

To examine both the individual effects and the interactions of the proposed modules, GAM, the irregular electronic fence, and the ReID-assisted counting logic were evaluated as single-module, pairwise, and full configurations. The results are summarized in Table 7, where a ✓ indicates the inclusion of a particular module.
The ablation analysis in Table 7 first quantifies the contribution of each individual module. Compared with the Basic configuration, GAM improves precision, recall, and mAP@0.5 by 1.7, 1.4, and 1.5 percentage points, respectively, while reducing inference latency by 0.8 ms. The ReID configuration, including FastReID feature extraction and gallery matching, increases recall by 2.1 percentage points and mAP@0.5 by 1.0 percentage point, while adding 0.2 ms of per-image processing time. These results indicate that GAM strengthens personnel feature extraction, whereas the ReID-assisted counting logic improves identity consistency with limited computational overhead.
The Fence-only configuration increases precision by 1.8 percentage points but decreases recall and mAP@0.5 by 4.3 and 2.2 percentage points, respectively. This trade-off occurs because polygon-based spatial filtering suppresses detections outside the hazardous operating boundary but may also exclude personnel located close to the calibrated boundary. Its ray-casting operation adds 0.3 ms to the per-image processing time.
The computational costs in Table 7 are direct end-to-end measurements for each enabled configuration and should not be interpreted as an additive sum of standalone module costs. Relative to the 37.5 ms Basic configuration, GAM reduces the detector time to 36.7 ms, whereas the ReID-only and Fence-only configurations require 37.7 ms and 37.8 ms, respectively. Thus, FastReID feature extraction and gallery matching add 0.2 ms in the ReID-only comparison, and ray-casting filtering adds 0.3 ms in the Fence-only comparison. The full configuration is reported as a separately measured end-to-end result.
The pairwise experiments further clarify the interactions among the modules. GAM + Fence achieves a precision of 98.0% and an mAP@0.5 of 97.4%, showing that GAM partially compensates for the recall reduction introduced by spatial filtering. GAM + ReID provides the strongest pairwise result, reaching 98.1% precision, 94.8% recall, and 98.1% mAP@0.5 with a per-image processing time of 36.9 ms. Fence + ReID improves all three detection metrics relative to the Basic configuration, but its 38.0 ms processing time and 96.6% mAP@0.5 indicate that spatial filtering remains the main source of the observed accuracy–efficiency trade-off.
The full GAM + Fence + ReID configuration achieves the best overall performance, with 98.6% precision, 95.4% recall, 98.3% mAP@0.5, and a per-image processing time of 36.5 ms. Relative to the Basic configuration, these results represent improvements of 3.2, 3.6, and 2.0 percentage points in precision, recall, and mAP@0.5, respectively, together with a 1.0 ms reduction in processing time. The complete configuration is therefore selected as the optimal solution because it provides the best balance among personnel detection accuracy, cross-camera identity consistency, spatial filtering, and real-time inference efficiency.
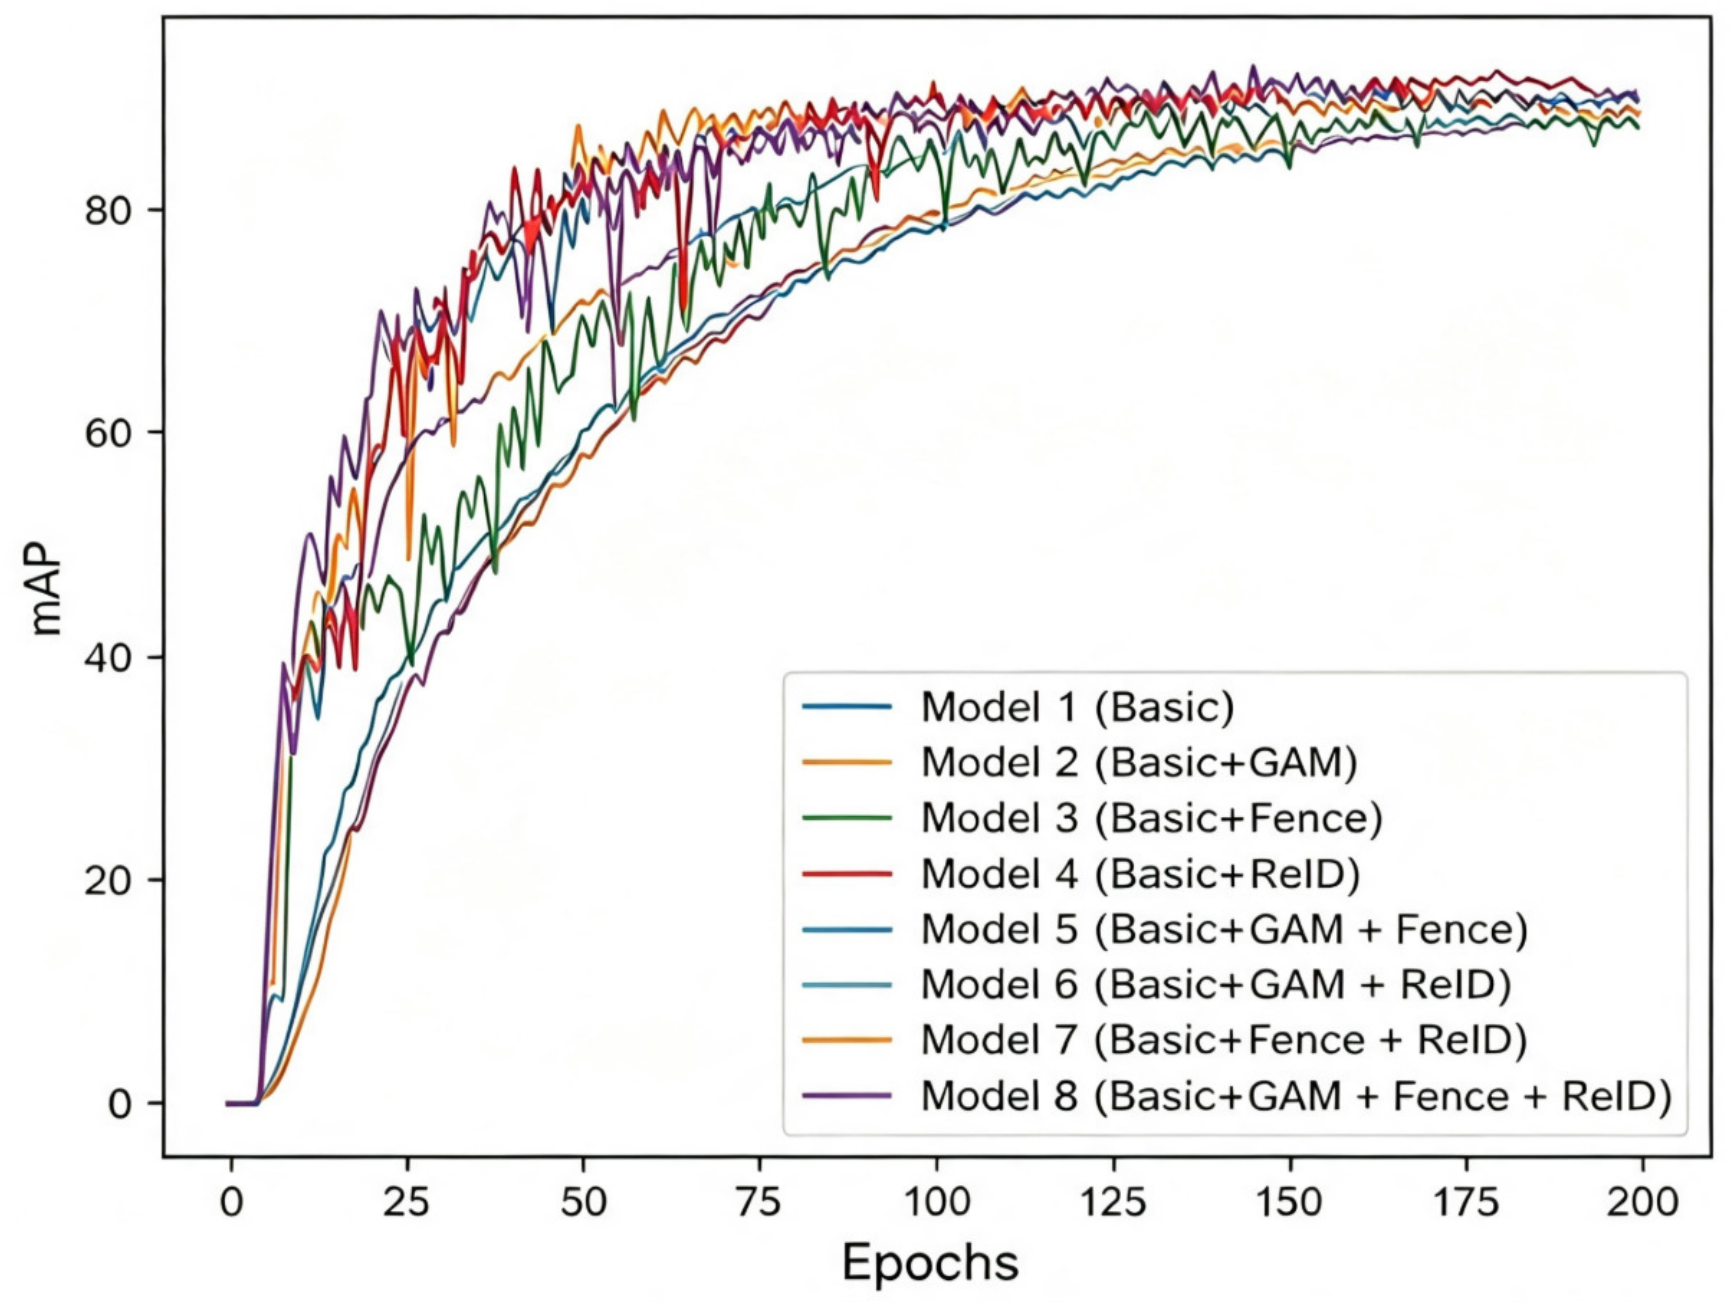
Figure 14 presents the validation mAP@0.5 trajectories of all eight ablation configurations over 200 training epochs.

4.7. Field Deployment in an Electronic Industrial Safety-Control System

To validate the method under practical production conditions, the system was implemented in the production work zones of Deren Firework Company Limited. The deployment consists of two primary subsystems: the hardware configuration and the software platform.
  • Hardware Configuration: The setup integrates high-speed industrial cameras positioned at high-altitude workstations and a Programmable Logic Controller (PLC) featuring dual-termination modes, including manual emergency override and relay-based automated shutdown mechanisms.
  • Software Architecture: As illustrated in Figure 15, the platform incorporates three core functionalities: real-time multi-workshop video monitoring, detection visualization with hierarchical personnel-count overlays, and a relay status control interface.
The operational workflow transitions from real-time stream acquisition to personnel detection, followed by centroid-based validation within the IEF. The site-specific personnel-count constraint is continuously monitored; localized breaches ( n i > 2 ) or global breaches ( n i > 10 ) trigger real-time audiovisual alerts and automated equipment disengagement via PLC relay control. System maintenance remains minimal, primarily involving periodic database purging and ReID registry verification. During a three-month deployment at Deren Firework Co., Ltd., the deployed system detected 15 safety violations and supported timely intervention in 4 critical overcrowding incidents in hazardous zones. These results indicate that the method can support real-time safety intervention in hazardous production zones.

4.8. Failure Case Analysis

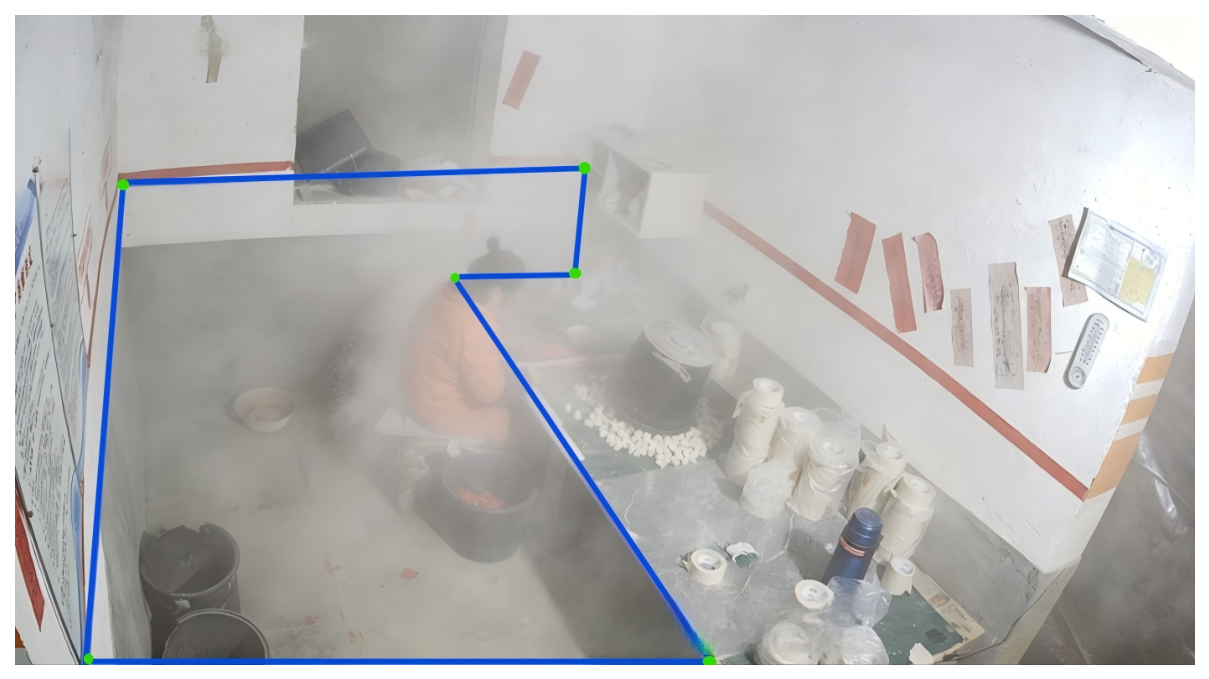
Figure 16 illustrates a representative missed-detection case observed during field deployment. In this frame, dense dust accumulated near the camera and substantially reduced the contrast of a worker located inside the blue IEF boundary. The worker was therefore not detected by the front-end detector and could not be included in the subsequent ReID association or personnel-counting process. This case demonstrates that GAM, ReID, and IEF filtering cannot compensate for missed detections caused by severe image degradation. In practical deployment, lens cleaning, camera repositioning, or complementary sensing should be considered when persistent dust obscuration is present.

4.9. Monitoring Data Security and Privacy Considerations

The present study focuses on functional safety monitoring and does not experimentally evaluate data-security or privacy-protection mechanisms. In practical deployment, workshop video streams, incident records, and ReID feature galleries should be protected through authenticated access, encrypted transmission and storage, access logging, and limited data-retention periods. Personnel images exported for safety review should also be anonymized when visual identity is not required. Recent cryptanalysis has shown that structural weaknesses in video cryptosystems can permit recovery of encrypted content, indicating that monitoring-video encryption requires rigorous security evaluation rather than reliance on unverified proprietary designs [35].

4.10. Limitations and Future Validation

Several limitations remain. First, although Grad-CAM visualizations and quantitative attention-mechanism comparisons support the selected GAM design, additional representative scenes are needed to characterize its spatial responses systematically under diverse small-target, dust, and occlusion conditions. Second, the repeated-run statistical analysis was limited to the GAM–CBAM comparison on the present in-situ data. Broader statistical validation across additional detectors, sites, and operating conditions is still required. Third, as illustrated in Figure 16, severe dust or long-term occlusion can cause missed detections; workers located near calibrated polygon boundaries may also be filtered incorrectly. Because the current FastReID implementation relies on appearance embeddings and cosine-similarity matching, extreme illumination changes, dense dust occlusion, similar work uniforms, and high-traffic transitions may reduce feature discriminability and cause false identity matches or identity switches. The present evaluation therefore does not establish equivalent ReID performance under all such extreme conditions; future work should examine temporal constraints, trajectory information, or multimodal cues for more robust association. Although the 10-camera deployment met the current real-time processing requirements, increasing the number of cameras and gallery identities will increase FastReID feature-extraction, matching, and synchronization costs; larger deployments therefore require workload profiling and distributed edge–cloud scheduling. Finally, the field deployment was conducted in one firework factory. Although the in-situ evaluation includes 10 independent workshops and their associated camera views, all cameras were installed at a uniform height of 4.5 m and personnel wore factory-specific workwear. The present results therefore do not demonstrate robustness to different camera heights, workshop layouts, personnel uniforms, lighting conditions, or camera counts, nor do they constitute external validation across factories. Future multi-site validation should assess these conditions and recalibrate the IEF polygons, the ReID threshold, and the edge-processing schedule as required.

5. Conclusions

This study presents a visual detection and multi-zone personnel safety control method for firework manufacturing workshops. By integrating YOLO26-GAM personnel detection, ReID-assisted multi-zone collaborative counting, and a polygon-based IEF, the method converts distributed workshop video streams into local and global safety-threshold decisions. The main findings are as follows:
  • With YOLO26-GAM as the detection core, the proposed method improved small-target personnel detection under dusty, occluded, and overhead-view workshop conditions. On the in-situ data, it achieved a 98.3% mAP@0.5 with a per-image CPU processing time of 36.5 ms. Relative to YOLOv8n, this corresponds to a 5.9 percentage point improvement in mAP@0.5 and a 54.6% latency reduction.
  • The ReID-assisted multi-zone collaborative counting strategy maintained identity consistency across non-overlapping cameras and supported local and global personnel-count control. This design reduced duplicate counting and improved the reliability of safety-threshold assessment in multi-workshop monitoring.
  • The polygon-based IEF aligned the monitored region with irregular workshop boundaries. By excluding detections in safe transit corridors and other non-hazardous areas, the method reduced spatial false alarms while preserving the real-time responsiveness required for safety intervention.
A three-month field deployment at Deren Firework Co., Ltd. further demonstrated the practical feasibility of the method. The deployed system detected 15 safety violations and supported timely intervention in 4 critical overcrowding incidents in hazardous zones, indicating its value for visual detection-based personnel safety control under the evaluated factory conditions.
Future research will focus on distributed edge-cloud collaboration for fleet-level factory management. Multimodal electronic sensing, including infrared thermal imaging and hazardous gas detection, will also be investigated to extend the method to broader explosive-materials production scenarios. Future validation will extend repeated-run statistical analysis to additional factory sites and evaluate robustness under different camera heights, workshop layouts, personnel uniforms, lighting conditions, and camera counts.

Author Contributions

Conceptualization, X.Y., H.T., B.X. and P.T.; methodology, X.Y., H.T., B.X. and P.T.; software, X.Y. and P.T.; validation, H.W. and W.L.; writing—original draft preparation, X.Y., B.X. and H.W. All authors have read and agreed to the published version of the manuscript.

Funding

This work was supported by the Key Research and Development Program of Jiangxi Province (20261BCG330026, 20232BBG70031).

Institutional Review Board Statement

Not applicable.

Informed Consent Statement

Not applicable.

Data Availability Statement

The data presented in this study are not publicly available due to industrial safety and enterprise confidentiality restrictions.

Conflicts of Interest

The author Peiqiang Tian is from Nanchang Mineral Systems Co., Ltd., Nanchang 330000, China. The remaining authors declare that the research was conducted in the absence of any commercial or financial relationships that could be construed as a potential conflict of interest.

References

  1. Pirone, A.; Vallerotonda, M.R.; Bragatto, P.A. Lessons learned from recent accidents in fireworks establishments. Chem. Eng. Trans. 2016, 53, 259–264. [Google Scholar]
  2. Wang, F.; Wang, X.; Liu, D.; Liu, H. Comprehensive safety risk evaluation of fireworks production enterprises using the frequency-based ANP and BPNN. Heliyon 2023, 9, e21724. [Google Scholar] [CrossRef] [PubMed]
  3. Nallathambi, I.; Savaram, P.; Sengan, S.; Alharbi, M.; Alshathri, S.; Bajaj, M.; Aly, M.H.; El-Shafai, W. Impact of fireworks industry safety measures and prevention management system on human error mitigation using a machine learning approach. Sensors 2023, 23, 4365. [Google Scholar] [CrossRef] [PubMed]
  4. Daud, M.M.; Saad, H.M.; Ijab, M.T. Conceptual design of human detection via deep learning for industrial safety enforcement in manufacturing site. In 2021 IEEE International Conference on Automatic Control & Intelligent Systems (I2CACIS); IEEE: Piscataway, NJ, USA, 2021; pp. 369–373. [Google Scholar]
  5. Redmon, J.; Divvala, S.; Girshick, R.; Farhadi, A. You only look once: Unified, real-time object detection. In Proceedings of the IEEE Conference on Computer Vision and Pattern Recognition (CVPR); IEEE: Piscataway, NJ, USA, 2016; pp. 779–788. [Google Scholar]
  6. Liu, W.; Anguelov, D.; Erhan, D.; Szegedy, C.; Reed, S.; Fu, C.Y.; Berg, A.C. SSD: Single shot multibox detector. In European Conference on Computer Vision (ECCV); Springer: Cham, Switzerland, 2016; pp. 21–37. [Google Scholar]
  7. Du, F.; Jiao, S.; Chu, K. Application Research of Bridge Damage Detection Based on the Improved Lightweight Convolutional Neural Network Model. Appl. Sci. 2022, 12, 6225. [Google Scholar] [CrossRef]
  8. Wang, K.; Zhou, H.; Wu, H.; Yuan, G. RN-YOLO: A Small Target Detection Model for Aerial Remote-Sensing Images. Electronics 2024, 13, 2383. [Google Scholar] [CrossRef]
  9. Sun, Y.; Chen, W.; Wang, Q.; Fang, T.; Liu, X. Improvement and Optimization of Underwater Image Target Detection Accuracy Based on YOLOv8. Symmetry 2025, 17, 1102. [Google Scholar] [CrossRef]
  10. Li, J.; Xu, R.; Liu, Y. An Improved Forest Fire and Smoke Detection Model Based on YOLOv5. Forests 2023, 14, 833. [Google Scholar] [CrossRef]
  11. Liu, B.; Wang, J.; An, Q.; Wan, Y.; Zhou, J.; Chen, X. Gardens Fire Detection Based on the Symmetrical SSS-YOLOv8 Network. Symmetry 2025, 17, 1269. [Google Scholar] [CrossRef]
  12. Çelik, M.; Akar, F.; Bayılmış, C.; Akgün, D. A real-time valve counting system based on YOLOv8. In 2024 8th International Artificial Intelligence and Data Processing Symposium (IDAP); IEEE: Piscataway, NJ, USA, 2024; pp. 1–5. [Google Scholar]
  13. Akar, F.; Berber, S.; Koca, O.; Bayılmış, C. A real-time carboy tracking and counting system based on YOLOv8 and ByteTrack. In 2024 International Conference on Artificial Intelligence, Metaverse and Cybersecurity (ICAMAC); IEEE: Piscataway, NJ, USA, 2024; pp. 1–5. [Google Scholar]
  14. Elaoua, A.; Nadour, M.; Cherroun, L.; Elasri, A. Real-time people counting system using YOLOv8 object detection. In 2023 2nd International Conference on Electronics, Energy and Measurement (IC2EM); IEEE: Piscataway, NJ, USA, 2023; pp. 1–5. [Google Scholar]
  15. Shyaa, T.A.R.; Hashim, A.A. Enhancing real human detection and people counting using YOLOv8. BIO Web Conf. 2024, 97, 00061. [Google Scholar] [CrossRef]
  16. Hu, J.; Xiao, F.; Jin, Q.; Zhao, G.; Lou, P. Synthetic data generation based on RDB-CycleGAN for industrial object detection. Mathematics 2023, 11, 4588. [Google Scholar] [CrossRef]
  17. Chen, J.; Shao, C.; Su, Z. Mixed Label Assignment Realizes End-to-End Object Detection. Electronics 2024, 13, 4856. [Google Scholar] [CrossRef]
  18. Wang, A.; Chen, H.; Liu, L.; Chen, K.; Lin, Z.; Han, J.; Ding, G. YOLOv10: Real-time end-to-end object detection. Adv. Neural Inf. Process. Syst. 2024, 37, 107984–108011. [Google Scholar] [CrossRef]
  19. Zhao, Y.; Lv, W.; Xu, S.; Wei, J.; Wang, G.; Dang, Q.; Liu, Y.; Chen, J. DETRs beat YOLOs on real-time object detection. In Proceedings of the IEEE/CVF Conference on Computer Vision and Pattern Recognition (CVPR); IEEE: Piscataway, NJ, USA, 2024; pp. 16965–16974. [Google Scholar]
  20. Dinh, H.T.; Kim, E.-T. A Lightweight Network Based on YOLOv8 for Improving Detection Performance and the Speed of Thermal Image Processing. Electronics 2025, 14, 783. [Google Scholar] [CrossRef]
  21. Chen, J.; Zhao, J.; Zhang, D.; Ye, Z.; Liu, J.; Huang, W. Research on an image recognition automatic counting system based on improved YOLOv8. In 2024 IEEE 6th International Conference on Power, Intelligent Computing and Systems (ICPICS); IEEE: Piscataway, NJ, USA, 2024; pp. 1417–1421. [Google Scholar]
  22. Cheng, G.; Zhao, Q. An oil field well site personnel safety gear detection algorithm based on improved YOLOv8. In 2025 10th International Conference on Intelligent Computing and Signal Processing (ICSP); IEEE: Piscataway, NJ, USA, 2025; pp. 585–589. [Google Scholar]
  23. He, J.; Zhang, L.; Zhang, X.; Xu, T.; Wang, K.; Li, P.; Liu, X. Symmetry-Guided Prototype Alignment and Entropy Consistency for Multi-Source Pedestrian ReID in Power Grids: A Domain Adaptation Framework. Symmetry 2025, 17, 672. [Google Scholar] [CrossRef]
  24. Chen, J.; Wang, Y.; Qin, J.; Liu, L.; Shao, L. Fast person re-identification via cross-camera semantic binary transformation. In Proceedings of the IEEE Conference on Computer Vision and Pattern Recognition (CVPR); IEEE: Piscataway, NJ, USA, 2017; pp. 3873–3882. [Google Scholar]
  25. Lin, Y.; Wu, Y.; Yan, C.; Xu, M.; Yang, Y. Unsupervised person re-identification via cross-camera similarity exploration. IEEE Trans. Image Process. 2020, 29, 5481–5490. [Google Scholar] [CrossRef] [PubMed]
  26. Duan, B.; Zhang, W.; Wu, D.; Wang, L.; Li, B.; Wang, W. Cross-camera prototype learning for intra-camera supervised person re-identification. In International Conference on Artificial Neural Networks (ICANN); Springer: Cham, Switzerland, 2023; pp. 401–413. [Google Scholar]
  27. Mendes, D.; Correia, S.; Jorge, P.; Brandão, T.; Arriaga, P.; Nunes, L. Multi-Camera Person Re-Identification Based on Trajectory Data. Appl. Sci. 2023, 13, 11578. [Google Scholar] [CrossRef]
  28. Yin, Q.; Wang, G.A.; Wu, J.; Luo, H.; Tang, Z. Dynamic re-weighting and cross-camera learning for unsupervised person re-identification. Mathematics 2022, 10, 1654. [Google Scholar] [CrossRef]
  29. Chen, J.; Gao, C.; Sun, L.; Sang, N. CCSD: Cross-camera self-distillation for unsupervised person re-identification. Vis. Intell. 2023, 1, 27. [Google Scholar] [CrossRef]
  30. Wang, C.; Zhang, K.; Li, Y.; Cui, Y.; Zhang, D.; Yang, H. Exploration of the application of electronic fences driven by computer algorithms in industrial safety. In Fourth International Conference on Electronics Technology and Artificial Intelligence (ETAI 2025); SPIE: Bellingham, WA, USA, 2025; Volume 13692, pp. 1377–1383. [Google Scholar]
  31. Zhuang, Y.; Zhang, J.; Feng, J.; Zhang, J. Aerial oriented object detection with rasterized polygon-based learning. In IGARSS 2025–2025 IEEE International Geoscience and Remote Sensing Symposium; IEEE: Piscataway, NJ, USA, 2025; pp. 6073–6077. [Google Scholar]
  32. Çarklı Yavuz, B. Scale-Dependent Performance Analysis of YOLO26 and YOLOv11 for PPE Detection. Electronics 2026, 15, 1146. [Google Scholar] [CrossRef]
  33. Luo, H.; Gu, Y.; Liao, X.; Lai, S.; Jiang, W. Bag of Tricks and a Strong Baseline for Deep Person Re-Identification. In Proceedings of the 2019 IEEE/CVF Conference on Computer Vision and Pattern Recognition Workshops (CVPRW); IEEE: Piscataway, NJ, USA, 2019; pp. 1487–1495. [Google Scholar]
  34. Selvaraju, R.R.; Cogswell, M.; Das, A.; Vedantam, R.; Parikh, D.; Batra, D. Grad-CAM: Visual Explanations from Deep Networks via Gradient-Based Localization. In Proceedings of the IEEE International Conference on Computer Vision (ICCV); IEEE: Piscataway, NJ, USA, 2017; pp. 618–626. [Google Scholar]
  35. Lin, Y.; Wei, Y.; Chen, D.; Li, Y.; Erkan, U.; Toktas, A.; Gao, S.; Zhang, Y. Cryptanalysis and Improvement of a Video Cryptosystem via Chaos and S-Box. ACM Trans. Multimed. Comput. Commun. Appl. 2026, 22, 173. [Google Scholar] [CrossRef]
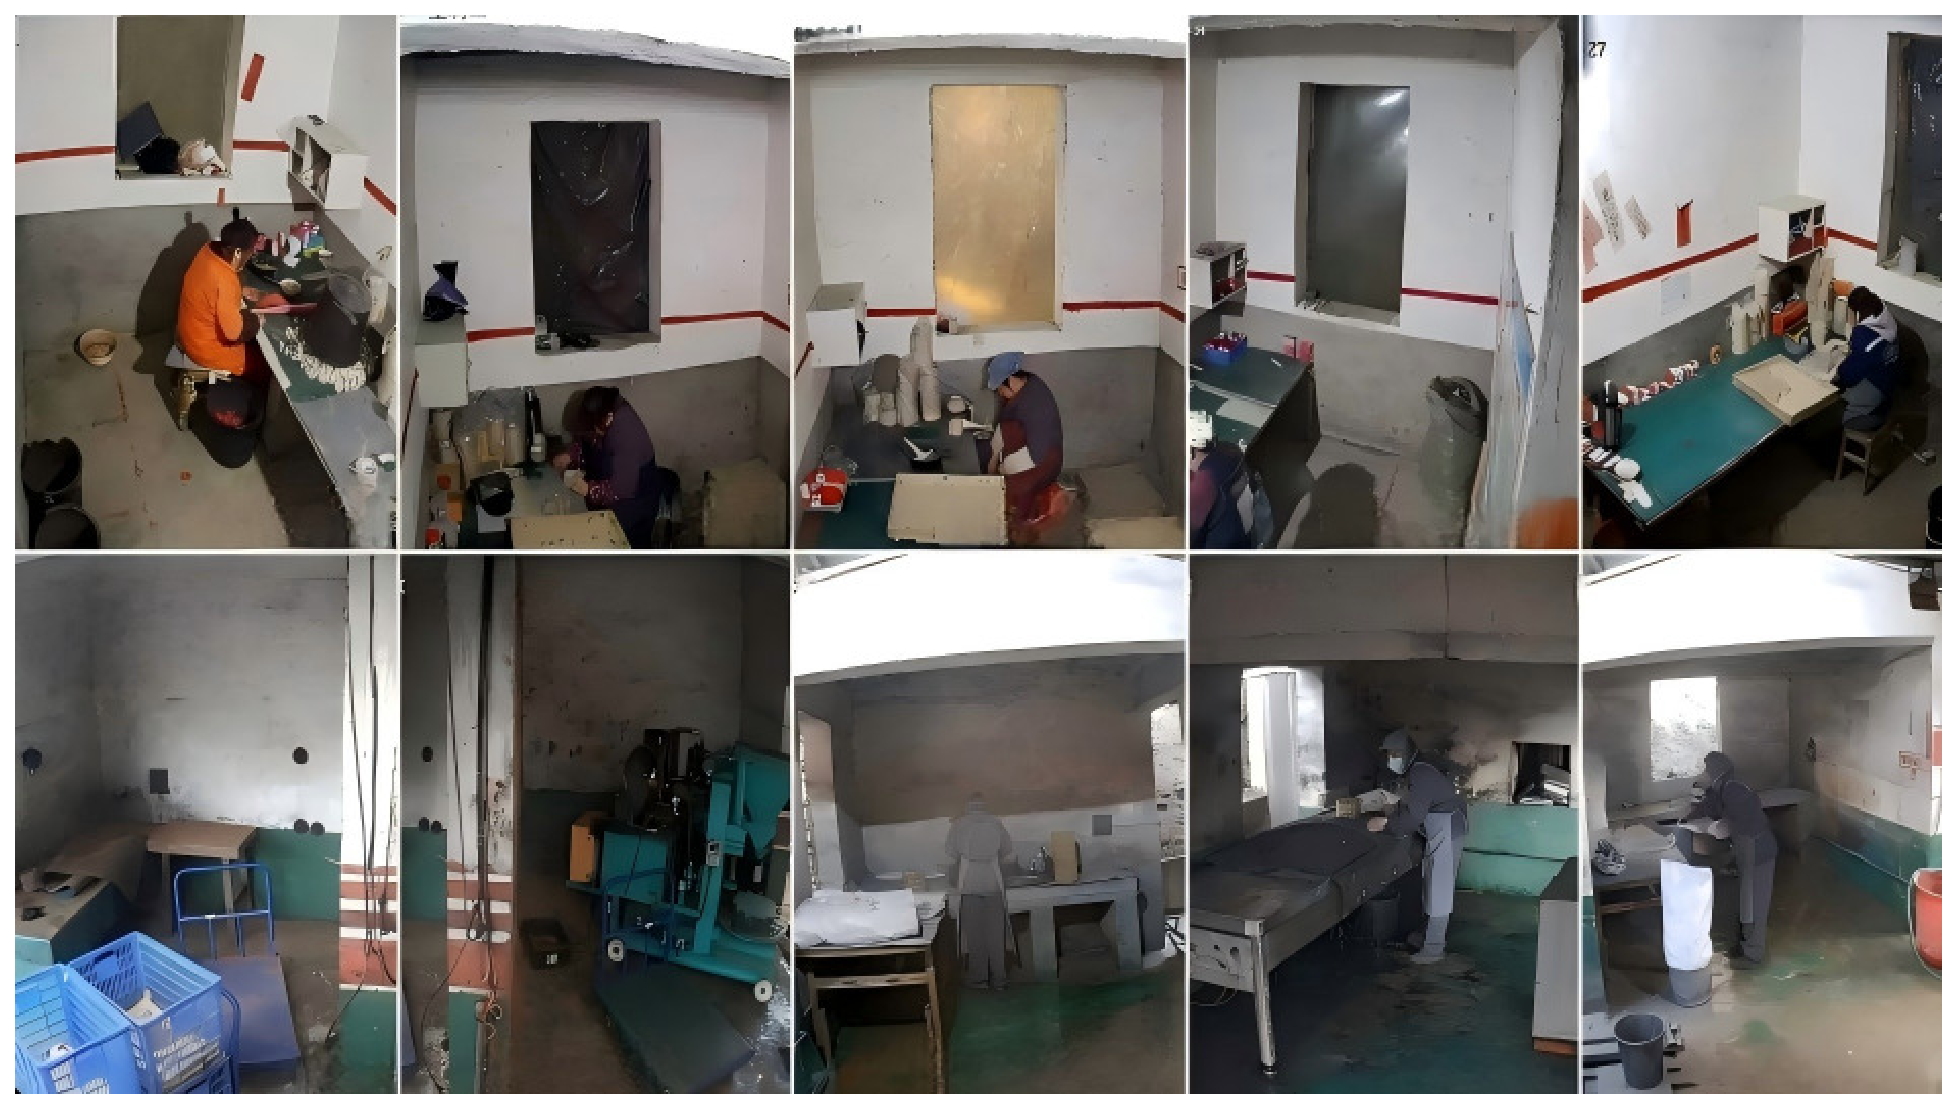
Figure 1. On-site image data collected from 10 workshop zones.
Electronics 15 03547 g001
Figure 2. Integration of the GAM module within the YOLO26 backbone. Dashed boxes distinguish the backbone, neck, and head, while arrows indicate the feature-flow directions.
Electronics 15 03547 g002
Figure 3. Structure of the GAM in this study. Arrows indicate the sequential channel- and spatial-attention operations; M c and M s denote the channel and spatial attention maps, respectively.
Electronics 15 03547 g003
Figure 4. Structure of the channel attention submodule in the proposed method. Arrows indicate feature-map flow, and colored blocks denote the permutation, MLP, batch-normalization, and sigmoid operations.
Electronics 15 03547 g004
Figure 5. Structure of the spatial attention submodule in the proposed method. Arrows indicate feature-map flow, and colored blocks denote the convolution, channel-shuffle, batch-normalization, and sigmoid operations.
Electronics 15 03547 g005
Figure 6. Workflow of the ReID-assisted multi-zone personnel safety-control module. Arrows indicate the flow from camera detections to feature extraction, gallery matching, identity registration, and safety-count evaluation.
Electronics 15 03547 g006
Figure 7. Logical workflow of polygon-based irregular electronic fence filtering. Arrows indicate centroid extraction, polygon membership testing, and retention or exclusion from the safety-count queue.
Electronics 15 03547 g007
Figure 8. Precision–recall curves after introducing different attention mechanisms: (a) YOLO26, (b) YOLO26_CBAM, (c) YOLO26_Shuffle, (d) YOLO26_SE, and (e) YOLO26_GAM.
Electronics 15 03547 g008
Figure 9. Grad-CAM visualizations for a representative workshop image: (a) original image, (b) YOLO26 baseline, (c) YOLO26 + CBAM, and (d) YOLO26 + GAM. Warmer colors indicate higher relative activation.
Electronics 15 03547 g009
Figure 10. Verification of the site-specific “10/2” personnel-count constraint. Green boxes indicate personnel within the monitored zone, red boxes indicate a local-count breach, and blue numbers denote the current personnel count.
Electronics 15 03547 g010
Figure 11. Counting and alarm performance comparison between the independent baseline and the proposed ReID-assisted multi-zone collaborative method.
Electronics 15 03547 g011
Figure 12. Irregular electronic fence layouts across multiple workshop zones. Blue polygons denote hazardous operating boundaries, green boxes indicate retained personnel detections, and blue numbers show the associated personnel counts.
Electronics 15 03547 g012
Figure 13. Personnel detection without (left) and with (right) IEF filtering. Red boxes indicate unfiltered detections, green boxes indicate detections retained for counting, blue polygons delineate hazardous operating zones, and blue numbers show the personnel count used for the safety assessment.
Electronics 15 03547 g013
Figure 14. Validation mAP@0.5 convergence of the eight ablation configurations over 200 training epochs.
Electronics 15 03547 g014
Figure 15. Software architecture and real-time monitoring interface deployed at the factory site. Green boxes denote retained personnel detections, blue polygons mark IEF boundaries, and blue numbers indicate the personnel counts used for safety assessment.
Electronics 15 03547 g015
Figure 16. Representative missed-detection case under severe airborne dust. The blue polygon denotes the IEF boundary, and the worker inside the monitored zone is not detected.
Electronics 15 03547 g016
Table 1. FastReID configuration used for cross-camera identity association.
ComponentConfiguration
BackboneImageNet-pretrained ResNet-50-IBN with last stride 1.
Feature representationGlobal average pooling, batch-normalization neck, 2048-dimensional embedding, and L2 normalization for matching.
Input and augmentationTraining and test crops of 256 × 128 pixels; random horizontal flipping, padding, and random erasing with probability 0.5.
SamplingNaive identity sampler; batch size 64 with four images per identity.
LossCross-entropy loss with label smoothing ϵ = 0.1 and hard-mining triplet loss with margin 0.3.
OptimizationAdam optimizer; initial learning rate 0.00035; weight decay 0.0005.
Schedule120 epochs; MultiStepLR milestones at epochs 40 and 90 with γ = 0.1 ; 2000 warm-up iterations.
Table 2. Performance comparison of different detection models on the in-situ pyrotechnic personnel data. Bold values indicate the best value in each column.
ModelP (%)R (%)mAP@0.5 (%)CPU Latency (ms/Image)Params (M)GFLOPs
Faster R-CNN92.485.191.5455.241.1205.2
SSD-VGG1682.576.885.8110.526.360.4
YOLOv5n88.684.391.273.62.67.7
YOLOv6n89.185.292.178.44.511.4
YOLOv7-tiny87.886.591.865.26.113.2
YOLOv8n90.287.392.480.43.28.7
YOLOv9-tiny90.887.993.175.17.126.4
YOLOv10n91.586.892.839.52.36.7
YOLOv11n92.188.593.556.12.66.5
Ours (YOLO26)95.491.896.337.52.55.8
Table 3. Performance comparison of YOLO26 with different attention mechanisms. Bold values indicate the best value in each column.
ModelP (%)R (%)mAP@0.5 (%)Latency (ms/Image)Params (M)GFLOPs
YOLO26 (Baseline)95.491.896.337.52.505.80
YOLO26 + CBAM95.692.196.537.34.2513.75
YOLO26 + Shuffle96.291.496.437.42.505.80
YOLO26 + SE95.992.897.636.92.525.82
Ours (YOLO26 + GAM)97.193.297.836.72.906.67
Table 4. Repeated-run statistical comparison of YOLO26 + CBAM and YOLO26 + GAM. Values are the mean ± standard deviation over five matched runs.
ModelP (%)R (%)mAP@0.5 (%)
YOLO26 + CBAM95.42 ± 0.2992.54 ± 0.3096.50 ± 0.15
YOLO26 + GAM97.12 ± 0.2493.60 ± 0.2797.80 ± 0.13
Table 5. Performance evaluation of ReID-assisted multi-zone collaborative counting. Bold values indicate the results of the proposed method.
MethodScenario Acc count (%)Alarm Success Rate (%)ReID Precision (%)
Baseline (Independent)Global (Overall)87.385.3Not applicable
Proposed (Collaborative)Global (Overall)98.299.097.1
Table 6. Impact of irregular electronic fence on system reliability. Bold values indicate the results of the proposed configuration.
ConfigurationFDR (%)TPR (%)Alarm Precision (%)
Baseline (Without Fence)18.598.880.6
Proposed (With IEF)2.299.198.4
Improvement(−16.3)(+0.3)(+17.8)
Table 7. Results of the individual, pairwise, and full ablation configurations of the proposed YOLO26-based method. Bold values indicate the best overall result.
No.GAMFenceReIDP (%)R (%)mAP@0.5 (%)Processing Time
(ms/Image)
1 (Basic) 95.491.896.337.5
2 97.193.297.836.7
3 97.287.594.137.8
4 95.793.997.337.7
5 98.092.997.437.0
6 98.194.898.136.9
7 97.692.796.638.0
8 (Ours)98.695.498.336.5
Disclaimer/Publisher’s Note: The statements, opinions and data contained in all publications are solely those of the individual author(s) and contributor(s) and not of MDPI and/or the editor(s). MDPI and/or the editor(s) disclaim responsibility for any injury to people or property resulting from any ideas, methods, instructions or products referred to in the content.