Author Contributions
Conceptualization, X.C. and J.T.; methodology, X.C.; software, X.C.; validation, X.C.; formal analysis, X.C.; investigation, X.C.; resources, J.T.; data curation, X.C.; writing—original draft preparation, X.C.; writing—review and editing, X.C., J.T. and S.D.; visualization, X.C.; supervision, J.T.; project administration, J.T.; funding acquisition, J.T. All authors have read and agreed to the published version of the manuscript.
Figure 1.
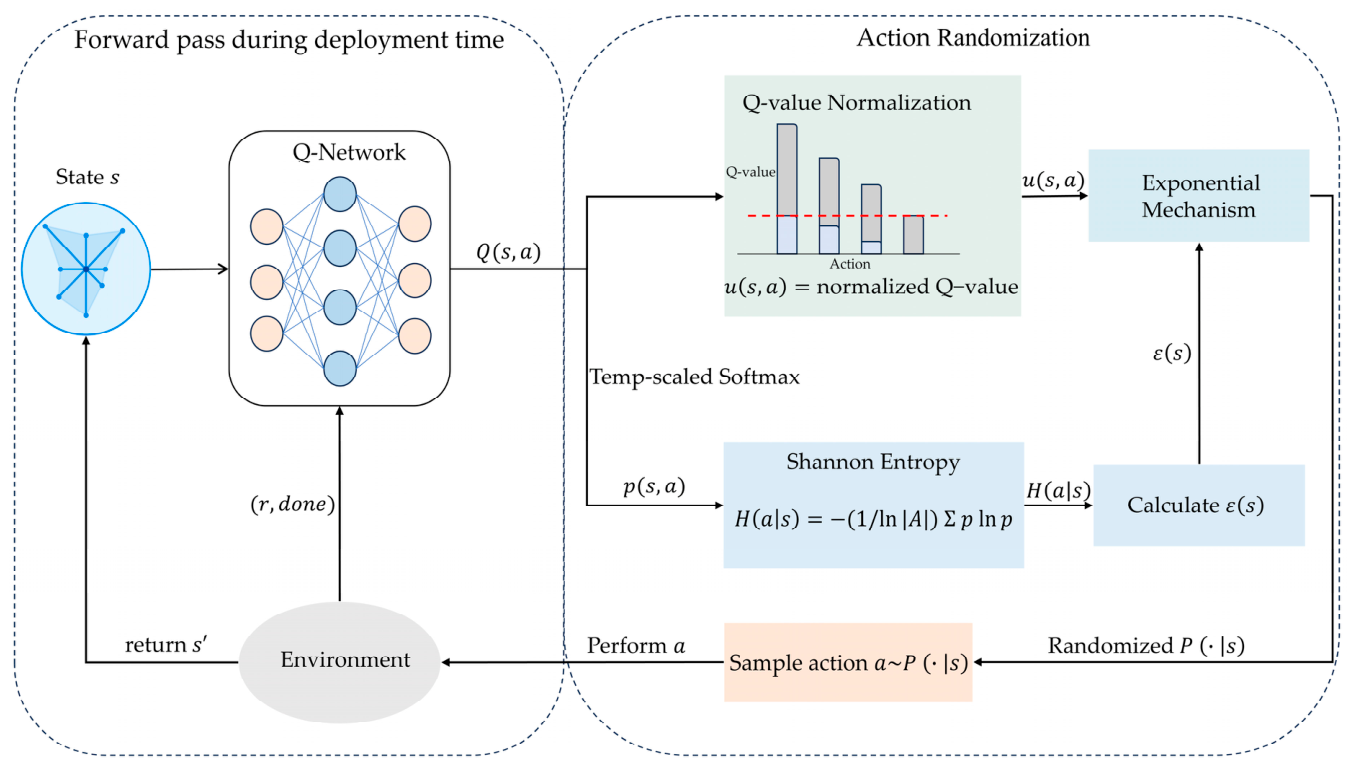
Overall workflow of the proposed deployment-time defense. During the forward pass, the Q-network maps the current state to the Q-values . In the action-randomization stage, the Q-values are min–max normalized into the utility , while a temperature-scaled Softmax of the Q-values yields the normalized Shannon entropy ; then determines the state-adaptive privacy budget . The exponential mechanism combines and to produce the randomized sampling distribution , from which the action is drawn and applied to the environment, which in turn returns the next state and the tuple . denotes the conditional probability distribution over actions given state , as defined in Equation (6). In the Q-value Normalization panel, the red dashed line indicates the normalized maximum value of 1, representing the upper bound of the min–max normalized Q-values. In the Q-Network diagram, orange circles denote the input- and output-layer neurons and blue circles denote the hidden-layer neurons. The blue star symbol represents the agent’s current state s.
Figure 1.
Overall workflow of the proposed deployment-time defense. During the forward pass, the Q-network maps the current state to the Q-values . In the action-randomization stage, the Q-values are min–max normalized into the utility , while a temperature-scaled Softmax of the Q-values yields the normalized Shannon entropy ; then determines the state-adaptive privacy budget . The exponential mechanism combines and to produce the randomized sampling distribution , from which the action is drawn and applied to the environment, which in turn returns the next state and the tuple . denotes the conditional probability distribution over actions given state , as defined in Equation (6). In the Q-value Normalization panel, the red dashed line indicates the normalized maximum value of 1, representing the upper bound of the min–max normalized Q-values. In the Q-Network diagram, orange circles denote the input- and output-layer neurons and blue circles denote the hidden-layer neurons. The blue star symbol represents the agent’s current state s.

Figure 2.
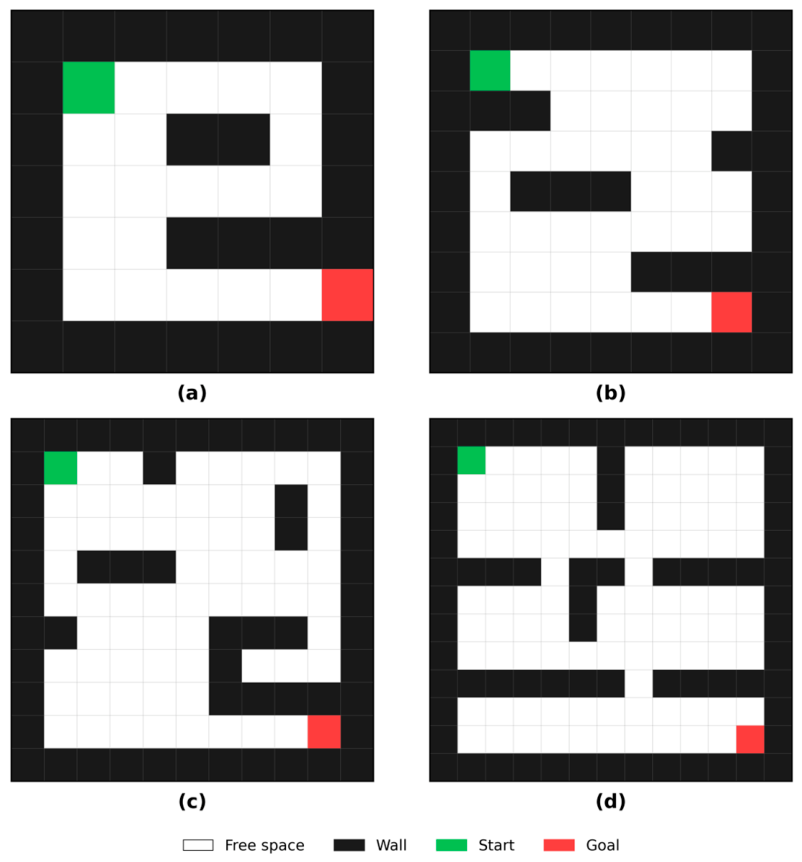
Representative GridWorld environments of the four scales used in the experiments: (a) 7 × 7; (b) 9 × 9; (c) 11 × 11; (d) 13 × 13. Black cells denote walls, white cells denote free space, green marks the start position, and red marks the goal.
Figure 2.
Representative GridWorld environments of the four scales used in the experiments: (a) 7 × 7; (b) 9 × 9; (c) 11 × 11; (d) 13 × 13. Black cells denote walls, white cells denote free space, green marks the start position, and red marks the goal.
Figure 3.
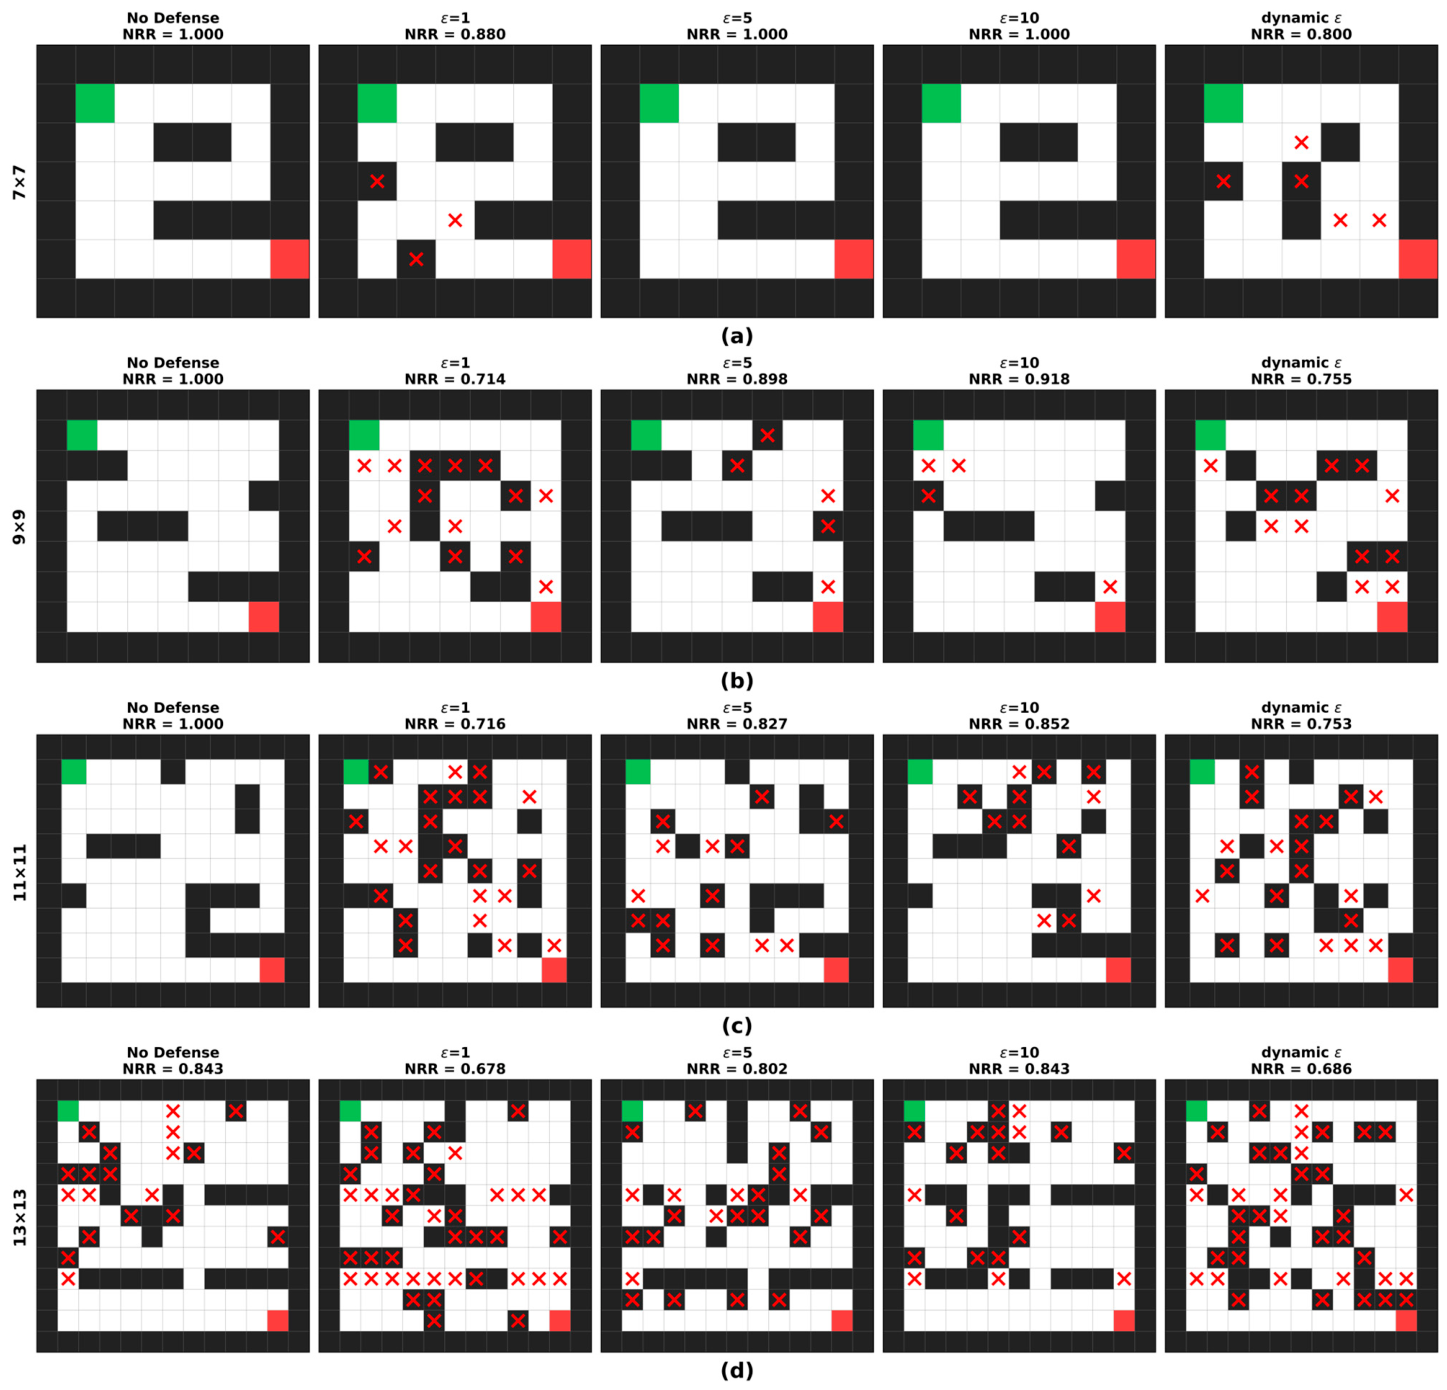
Visualization of maps inferred by the simulated-annealing attack under different defenses on the four GridWorld environments: (a) 7 × 7; (b) 9 × 9; (c) 11 × 11; (d) 13 × 13. Each row shows the maps recovered under no defense, three fixed-budget schemes (), and the proposed Entropy-Driven Action Randomization (EDAR). Red crosses (×) mark interior cells whose reconstructed state differs from the ground-truth map. The normalized recovery rate (NRR) value below each panel quantifies the recovery rate; lower NRR indicates stronger privacy protection.
Figure 3.
Visualization of maps inferred by the simulated-annealing attack under different defenses on the four GridWorld environments: (a) 7 × 7; (b) 9 × 9; (c) 11 × 11; (d) 13 × 13. Each row shows the maps recovered under no defense, three fixed-budget schemes (), and the proposed Entropy-Driven Action Randomization (EDAR). Red crosses (×) mark interior cells whose reconstructed state differs from the ground-truth map. The normalized recovery rate (NRR) value below each panel quantifies the recovery rate; lower NRR indicates stronger privacy protection.
Figure 4.
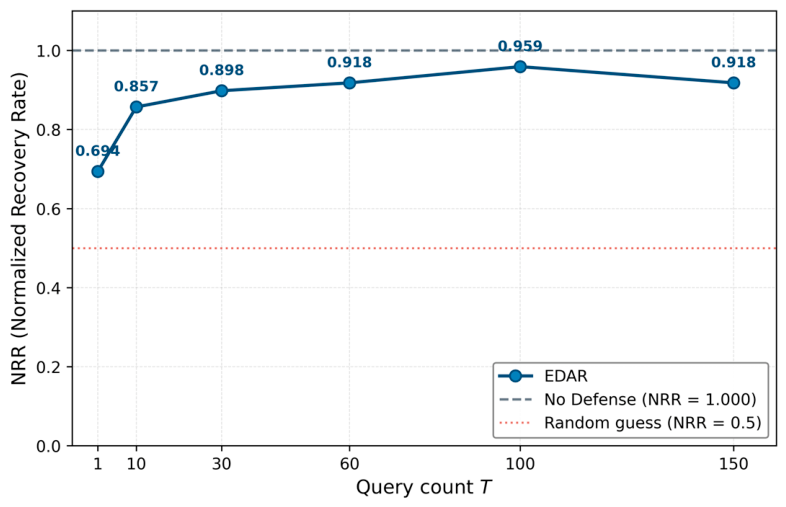
NRR versus the per-state query count on the 9 × 9 GridWorld map.
Figure 4.
NRR versus the per-state query count on the 9 × 9 GridWorld map.
Table 1.
Training hyperparameters of the Double Deep Q-Network (DDQN) agent.
Table 1.
Training hyperparameters of the Double Deep Q-Network (DDQN) agent.
| Parameter | Symbol | Value |
|---|
| Learning rate | | 0.001 |
| Discount factor | | 0.99 |
| Episodes | — | 1000 |
| Replay buffer size | — | 15,000 |
| Target network update interval | — | 500 |
| Initial exploration rate | — | 1 |
| Final exploration rate | — | 0.05 |
| Exploration decay rate | — | 0.996 |
Table 2.
Parameters of the simulated-annealing-based policy inversion attack.
Table 2.
Parameters of the simulated-annealing-based policy inversion attack.
| Parameter | Symbol | Value |
|---|
| Initial temperature | | 2.0 |
| Minimum temperature | | 0.01 |
| Cooling rate | | 0.98 |
| Maximum iterations per restart | | 3000 |
| Number of independent restarts | | 3 |
| Queries per state | | 20(EDAR); 1(NoDefense) |
Table 3.
NRR of the simulated-annealing attack under different defenses across the four GridWorld scales. Lower is better. Results report means ± standard deviations across three independent training seeds.
Table 3.
NRR of the simulated-annealing attack under different defenses across the four GridWorld scales. Lower is better. Results report means ± standard deviations across three independent training seeds.
| Scale | No Defense | | | | EDAR |
|---|
| 7 × 7 | 1.00 ± 0.00 | 0.95 ± 0.05 | 1.00 ± 0.00 | 1.00 ± 0.00 | 0.95 ± 0.02 |
| 9 × 9 | 1.00 ± 0.00 | 0.77 ± 0.01 | 0.90 ± 0.05 | 0.97 ± 0.01 | 0.82 ± 0.04 |
| 11 × 11 | 0.96 ± 0.04 | 0.69 ± 0.04 | 0.85 ± 0.08 | 0.86 ± 0.04 | 0.73 ± 0.01 |
| 13 × 13 | 0.84 ± 0.02 | 0.66 ± 0.03 | 0.78 ± 0.04 | 0.77 ± 0.02 | 0.68 ± 0.03 |
| Average | 0.95 | 0.77 | 0.88 | 0.90 | 0.79 |
Table 4.
Average privacy and utility metrics across the four GridWorld scales. RR: reward retention = mean episode return of the agent/mean episode return of the no-defense baseline × 100%; Avg. Return: mean episode return of the agent; SR: success rate (percentage of episodes reaching the goal); Steps: average number of steps per episode; NRR Red: NRR reduction (baseline NRR minus protected NRR; larger is better). Results report means ± standard deviations across three independent training seeds.
Table 4.
Average privacy and utility metrics across the four GridWorld scales. RR: reward retention = mean episode return of the agent/mean episode return of the no-defense baseline × 100%; Avg. Return: mean episode return of the agent; SR: success rate (percentage of episodes reaching the goal); Steps: average number of steps per episode; NRR Red: NRR reduction (baseline NRR minus protected NRR; larger is better). Results report means ± standard deviations across three independent training seeds.
| Scheme | RR | Avg. Return | SR | Steps | NRR Red |
|---|
| No Defense | 100% | +1.00 ± 0.00 | 100% | 15 | — |
| ε = 1 | 6.2% ± 1.2% | +0.06 ± 0.01 | 99.3% | 134 | 19.3% |
| ε = 5 | 99.4% ± 0.1% | +0.99 ± 0.00 | 100% | 23 | 7.0% |
| ε = 10 | 100% ± 0.0% | +1.00 ± 0.00 | 100% | 16 | 5.3% |
| EDAR | 78.9% ± 1.2% | +0.79 ± 0.01 | 100% | 58 | 16.4% |
Table 5.
Comparison between EDAR and four training-stage differential privacy (DP) methods on the four GridWorld scales, in terms of per-map NRR, average NRR (Avg. NRR), and utility metrics (RR, SR, Steps). Lower NRR and higher reward retention indicate better privacy and utility, respectively.
Table 5.
Comparison between EDAR and four training-stage differential privacy (DP) methods on the four GridWorld scales, in terms of per-map NRR, average NRR (Avg. NRR), and utility metrics (RR, SR, Steps). Lower NRR and higher reward retention indicate better privacy and utility, respectively.
| Method | DP Layer | 7 × 7 | 9 × 9 | 11 × 11 | 13 × 13 | Avg. NRR | RR | SR | Steps |
|---|
| No Defense | — | 1.00 | 1.00 | 1.00 | 0.84 | 0.96 | 100% | 100% | 15 |
| DDQN-DP-SGD | Gradient | 1.00 | 1.00 | 0.97 | 0.85 | 0.95 | 100% | 100% | 16 |
| PPO-DP-SGD | Policy Gradient | 1.00 | 0.93 | 0.95 | 0.79 | 0.91 | 74.8% | 75.0% | 134 |
| DQN-RewPerturb | Reward | 1.00 | 1.00 | 1.00 | 0.78 | 0.94 | 100% | 100% | 15 |
| DP-DRL | Observation | 1.00 | 1.00 | 0.98 | 0.89 | 0.96 | 98.3% | 100% | 17 |
| EDAR | Action | 0.95 | 0.82 | 0.73 | 0.68 | 0.79 | 78.9% | 100% | 58 |
Table 6.
Comparison of simulated annealing (SA) and genetic-algorithm (GA) policy inversion attacks on the 7 × 7 GridWorld map under the no-defense DQN agent.
Table 6.
Comparison of simulated annealing (SA) and genetic-algorithm (GA) policy inversion attacks on the 7 × 7 GridWorld map under the no-defense DQN agent.
| Attack | Retraining Required | Time (s) | NRR |
|---|
| GA | Yes | 4511 | 0.895 |
| SA | No | 1.1 | 1.000 |
Table 7.
Sensitivity of EDAR to the budget bounds and on the 9 × 9 map. Each configuration is evaluated over five independent SA attack trials. Lower NRR indicates stronger privacy, and higher reward retention indicates better utility. The configuration (, ) appears as the anchor row in both blocks; the two entries report independent sets of five trials, and the small numerical differences reflect sampling variance.
Table 7.
Sensitivity of EDAR to the budget bounds and on the 9 × 9 map. Each configuration is evaluated over five independent SA attack trials. Lower NRR indicates stronger privacy, and higher reward retention indicates better utility. The configuration (, ) appears as the anchor row in both blocks; the two entries report independent sets of five trials, and the small numerical differences reflect sampling variance.
| Configuration | NRR | RR | Steps |
|---|
| fixed | | | |
| 0.82 ± 0.06 | 74.0% | 55 |
| 0.83 ± 0.08 | 80.2% | 51 |
| 0.87 ± 0.07 | 90.5% | 33 |
| 0.91 ± 0.06 | 97.2% | 29 |
| fixed | | | |
| 0.83 ± 0.08 | 75.2% | 54 |
| 0.81 ± 0.07 | 71.6% | 58 |
| 0.79 ± 0.04 | 68.5% | 64 |
| 0.78 ± 0.03 | 52.6% | 68 |
Table 8.
Budget signal ablation on the 9 × 9 map (, , five trials each). All three signals preserve the core EDAR advantage over fixed-budget baselines.
Table 8.
Budget signal ablation on the 9 × 9 map (, , five trials each). All three signals preserve the core EDAR advantage over fixed-budget baselines.
| Budget Signal | NRR | RR |
|---|
| Entropy + Linear (default) | 0.82 ± 0.06 | 74.0% |
| Entropy + Sqrt | 0.84 ± 0.08 | 76.7% |
| Q-gap + Linear | 0.85 ± 0.04 | 78.4% |