1. Introduction
Electrical systems and components for automotive and sea, undersea, air, and space vehicles have a common focus: to increase power density and efficiency. This involves the use of a higher voltage, larger electrical insulation design field (to achieve reduced volume and weight), and power electronics supply to provide direct current (DC) and alternating current (AC) voltage, with high modulation frequency and fast switch rise time. If, on one hand, this is fundamental to improving performance of electrical assets, on the other hand it can significantly affect their reliability. Insulation can undergo accelerated electrothermal aging which will reduce component life and reliability with respect to design specifications. Design criteria must, therefore, consider higher fields, temperature and appropriate life laws for intrinsic aging, including load dynamics, voltage transients and the environment [
1,
2,
3].
Aging rate can be further increased, and dramatically, if harmful phenomena such as PD or space charge under DC are triggered during operation, i.e., extrinsic aging occurs [
1,
2,
3,
4,
5,
6]. This risk must be accounted for by design, that must be PD and/or space-charge-free, besides, e.g., by dedicated, PD-resistant materials (concept of reliability redundance) [
7].
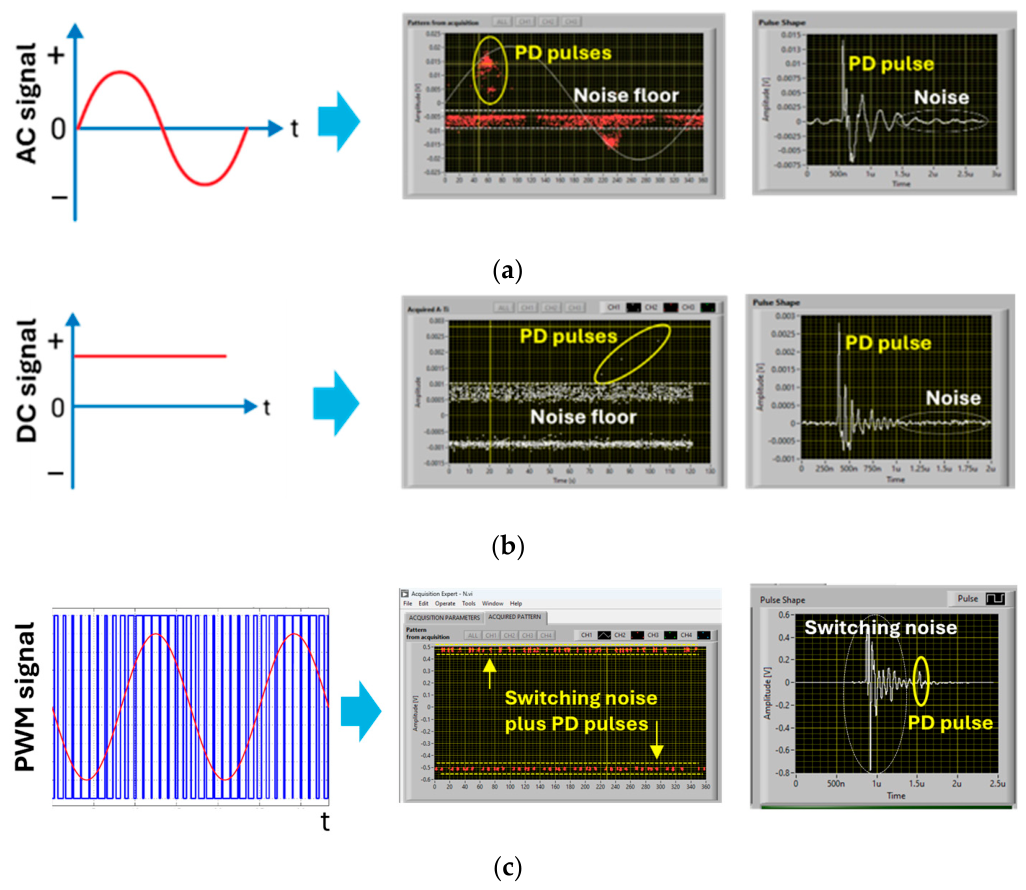
However, while measuring PD under sinusoidal AC voltage is quite an assessed and standardized procedure in the laboratories or on the field, measurement of the same under DC or PWM waveforms is a challenging task, as can be seen in
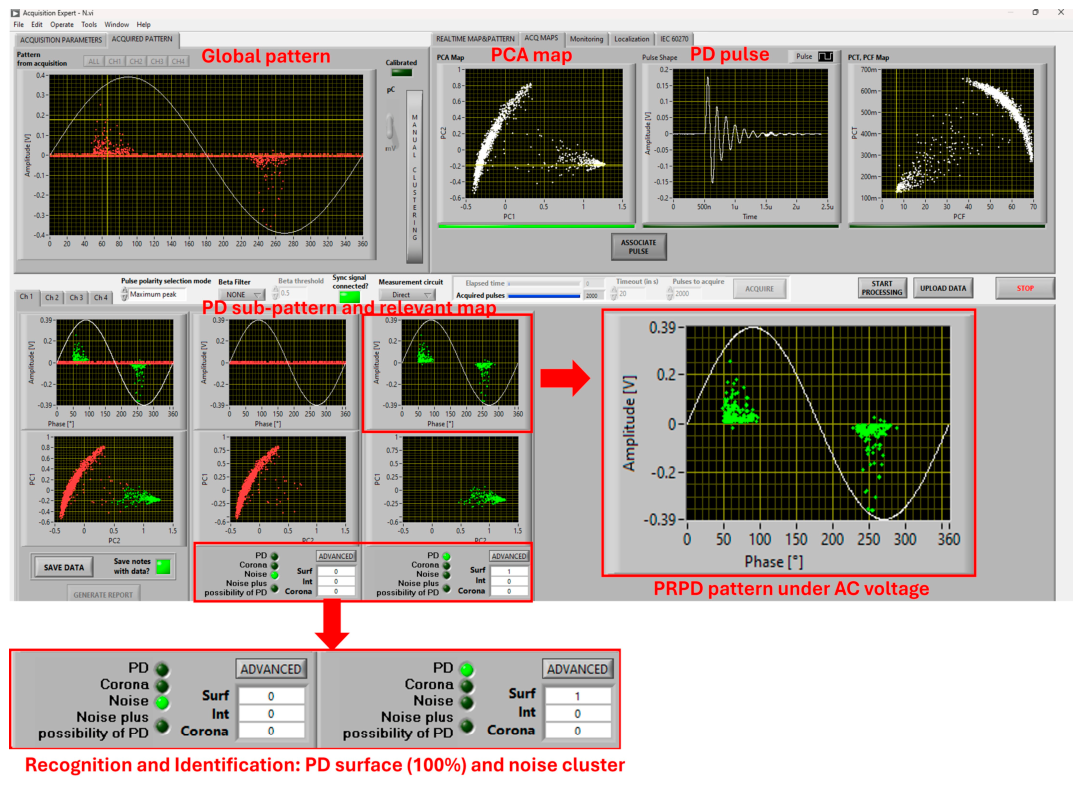
Figure 1, where PD patterns measured for AC, DC, and PWM are presented.
Noise recognition is the first problem. Techniques are available for filtering out noise under sinusoidal AC voltage [
8,
9] that are based on the capability to distinguish the noise from PD pulses in measurement records, generally resorting to phase-resolved PD patterns (PRPD) (see
Figure 1a). In addition to noise recognition, source-separation techniques based on the temporal and spectral characteristics of measured signals have been proposed in [
9], where waveform-shape and spectral content features are used to form clusters associated with different PDs prior to the identification stage. However, the same does not apply to the measurements done under DC, distorted AC (with harmonic voltages) and PWM voltage waveforms [
10,
11]. In case of DC, the voltage phase reference does not exist, which makes PD measurements consist of a record of pulses that can be collected only on time-based plots (time-resolved PD patterns, TRPD), as highlighted in
Figure 1b. This makes noise recognition complex, if not impossible, for human experts.
AC-modulated (PWM) voltage supply may be endowed with the phase reference, but the type of PRPD is completely different from that obtained under sinusoidal AC [
12,
13,
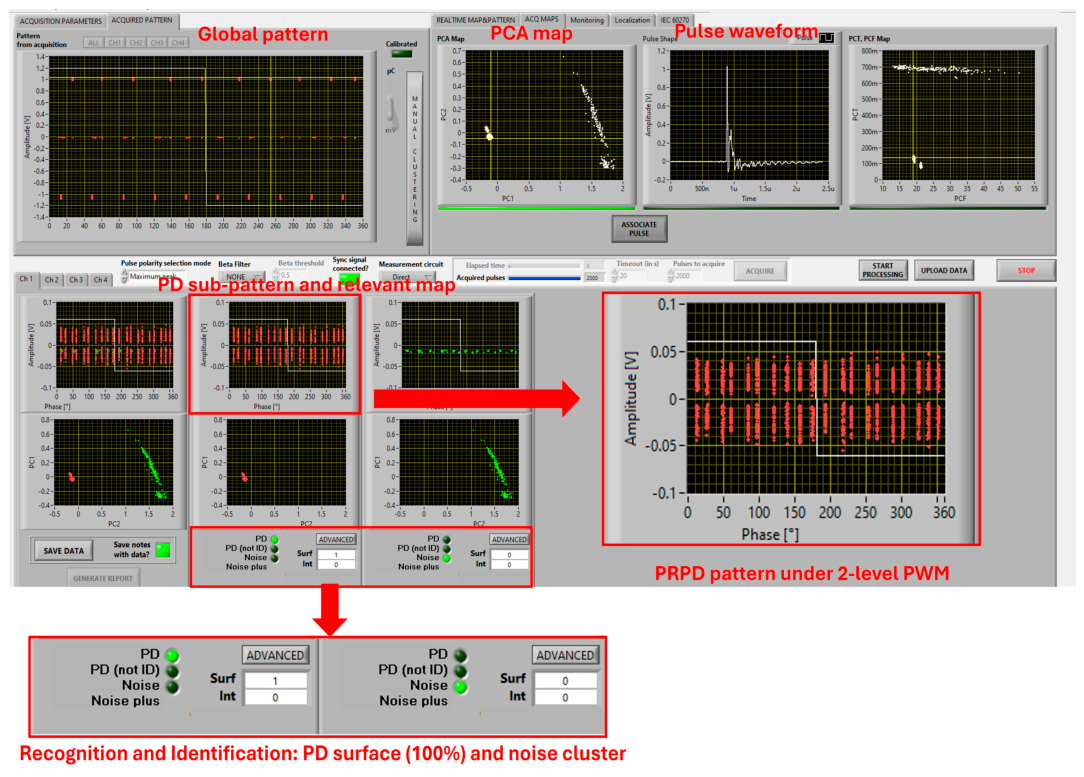
14] as can be seen in
Figure 1c. PD pulses are generated (from cavities, delamination, interfaces and insulation surface), when the electric field inside a defect or at an interface exceeds the field for discharge inception, which often occur during voltage impulse rise time, that is, during jump voltage [
5,
10,
11]. Under PWM, PDs are prevailingly triggered, therefore, at each repetitive voltage impulse, giving rise to the so-called comb-like patterns that differ substantially from those achieved under sinusoidal AC voltage;
Figure 1c [
15,
16,
17]. Distinguishing PD pulses from noise, rejecting noise and identifying the type of source generating PD [
18] may become complex, and even unfeasible, under power electronics, if not, sometimes, in controlled lab conditions [
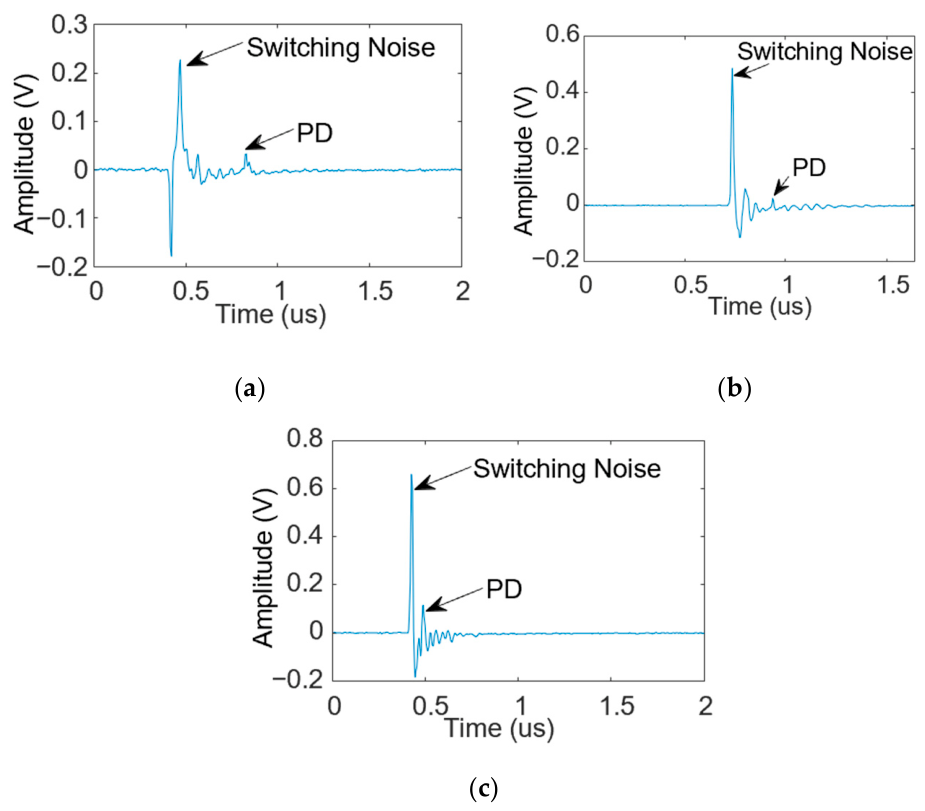
19]. As regards noise, in addition to that typical of sinusoidal AC (e.g., white noise), power electronics switching generates high-magnitude electromagnetic noise which can overlap the PD pulses and prevent the PD from being detected either partly or completely. As shown in
Figure 2, for switches with different slew rates and considering a test object consisting of enameled wires (in the form of twisted pair [
16,
18,
20]), it can be seen that the faster the rise time and the higher the supply voltage peak value compared to partial discharge inception voltage (PDIV), the more PD can overlap with the switching voltage impulses. This makes it hard to distinguish PD pulses from noise signals.
An innovative approach for efficient extraction of PD signals from switching noise (under PWM operation), which is based on time-domain filtering, is demonstrated in this paper and applied to motor accelerated aging monitoring.
After effective filtering, it becomes easier, but still crucial, to monitor PD behavior and harmfulness during aging, primarily referring to key parameters, i.e., PD amplitude and pulse repetition rate. These parameters, central to PD diagnostics, must be correlated with insulation degradation, aging, and remaining life (or, better, maintenance time) [
21]. A potentially meaningful metric for electrical asset components is the health index [
22,
23], or dynamic health index (
DHI) [
24], which provides valuable insights into aging and reliability, assessing PD characteristics alongside PD defect types. Internal discharges, for instance, are more severe and this accelerates aging more rapidly than surface discharges, making defect-type identification critical in the
DHI algorithm. This paper evaluates
DHI based on PD amplitude, repetition rate, and likelihood of discharge typology, offering a refined diagnostic approach.
The structure of this paper is as follows.
Section 2 provides a concise overview of partial discharge (PD) phenomena under pulse-width modulation (PWM) power supply, highlighting that effective denoising can be achieved by operating in the time domain rather than the frequency domain, particularly at high switch slew rates. The innovative time-domain noise rejection method used in this paper is detailed in
Section 3.
Section 4 outlines the structure and application of a new automatic, unsupervised PD monitoring system under PWM voltage supply.
Section 5 describes the test setup and the results of PD measurements/monitoring on a PWM-fed motor with artificial defect, subjected to accelerated aging.
Section 6 implements an innovative
DHI algorithm, based on PD measurements, to assess aging conditions during motor aging, through the automated PD monitoring system.
3. New Approach to PD Measurement Under Repetitive Impulses: Time-Domain Switching Noise Rejection
Since a major hindrance in PD detection under power electronics is switching noise, the first step for any measurement or monitoring system is effective extraction of PD pulses from such noise.
A new approach is proposed in this paper, and its effectiveness is validated through measurements performed on insulated wires and motors. It is based on time-domain processing of a series of signal acquisitions and the calculation of the deviation of the level of deterministic and random components. The proposed filtering method [
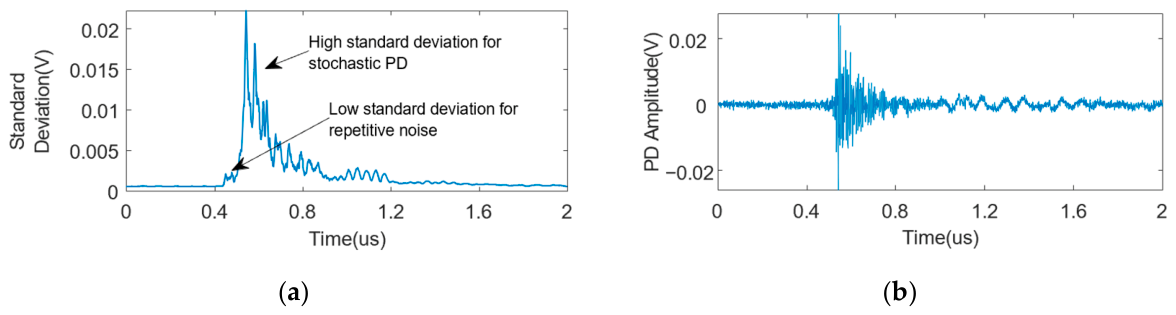
18] consists of determining the standard deviation of a series of acquired signals (each of them having a length long enough to be able to record both switching noise and PD pulses, if any), having in mind that PD pulses which could be embedded in switching noise signals are more randomly structured than pure switching impulses. The latter are almost deterministic in nature; the former have stochastic components generated by variable magnitude, occurrence time and shape. Hence, the presence of PD pulses in switching noise signals could be spotted by sudden variance increase in a series of acquired signals (standard deviation method;
Figure 4).
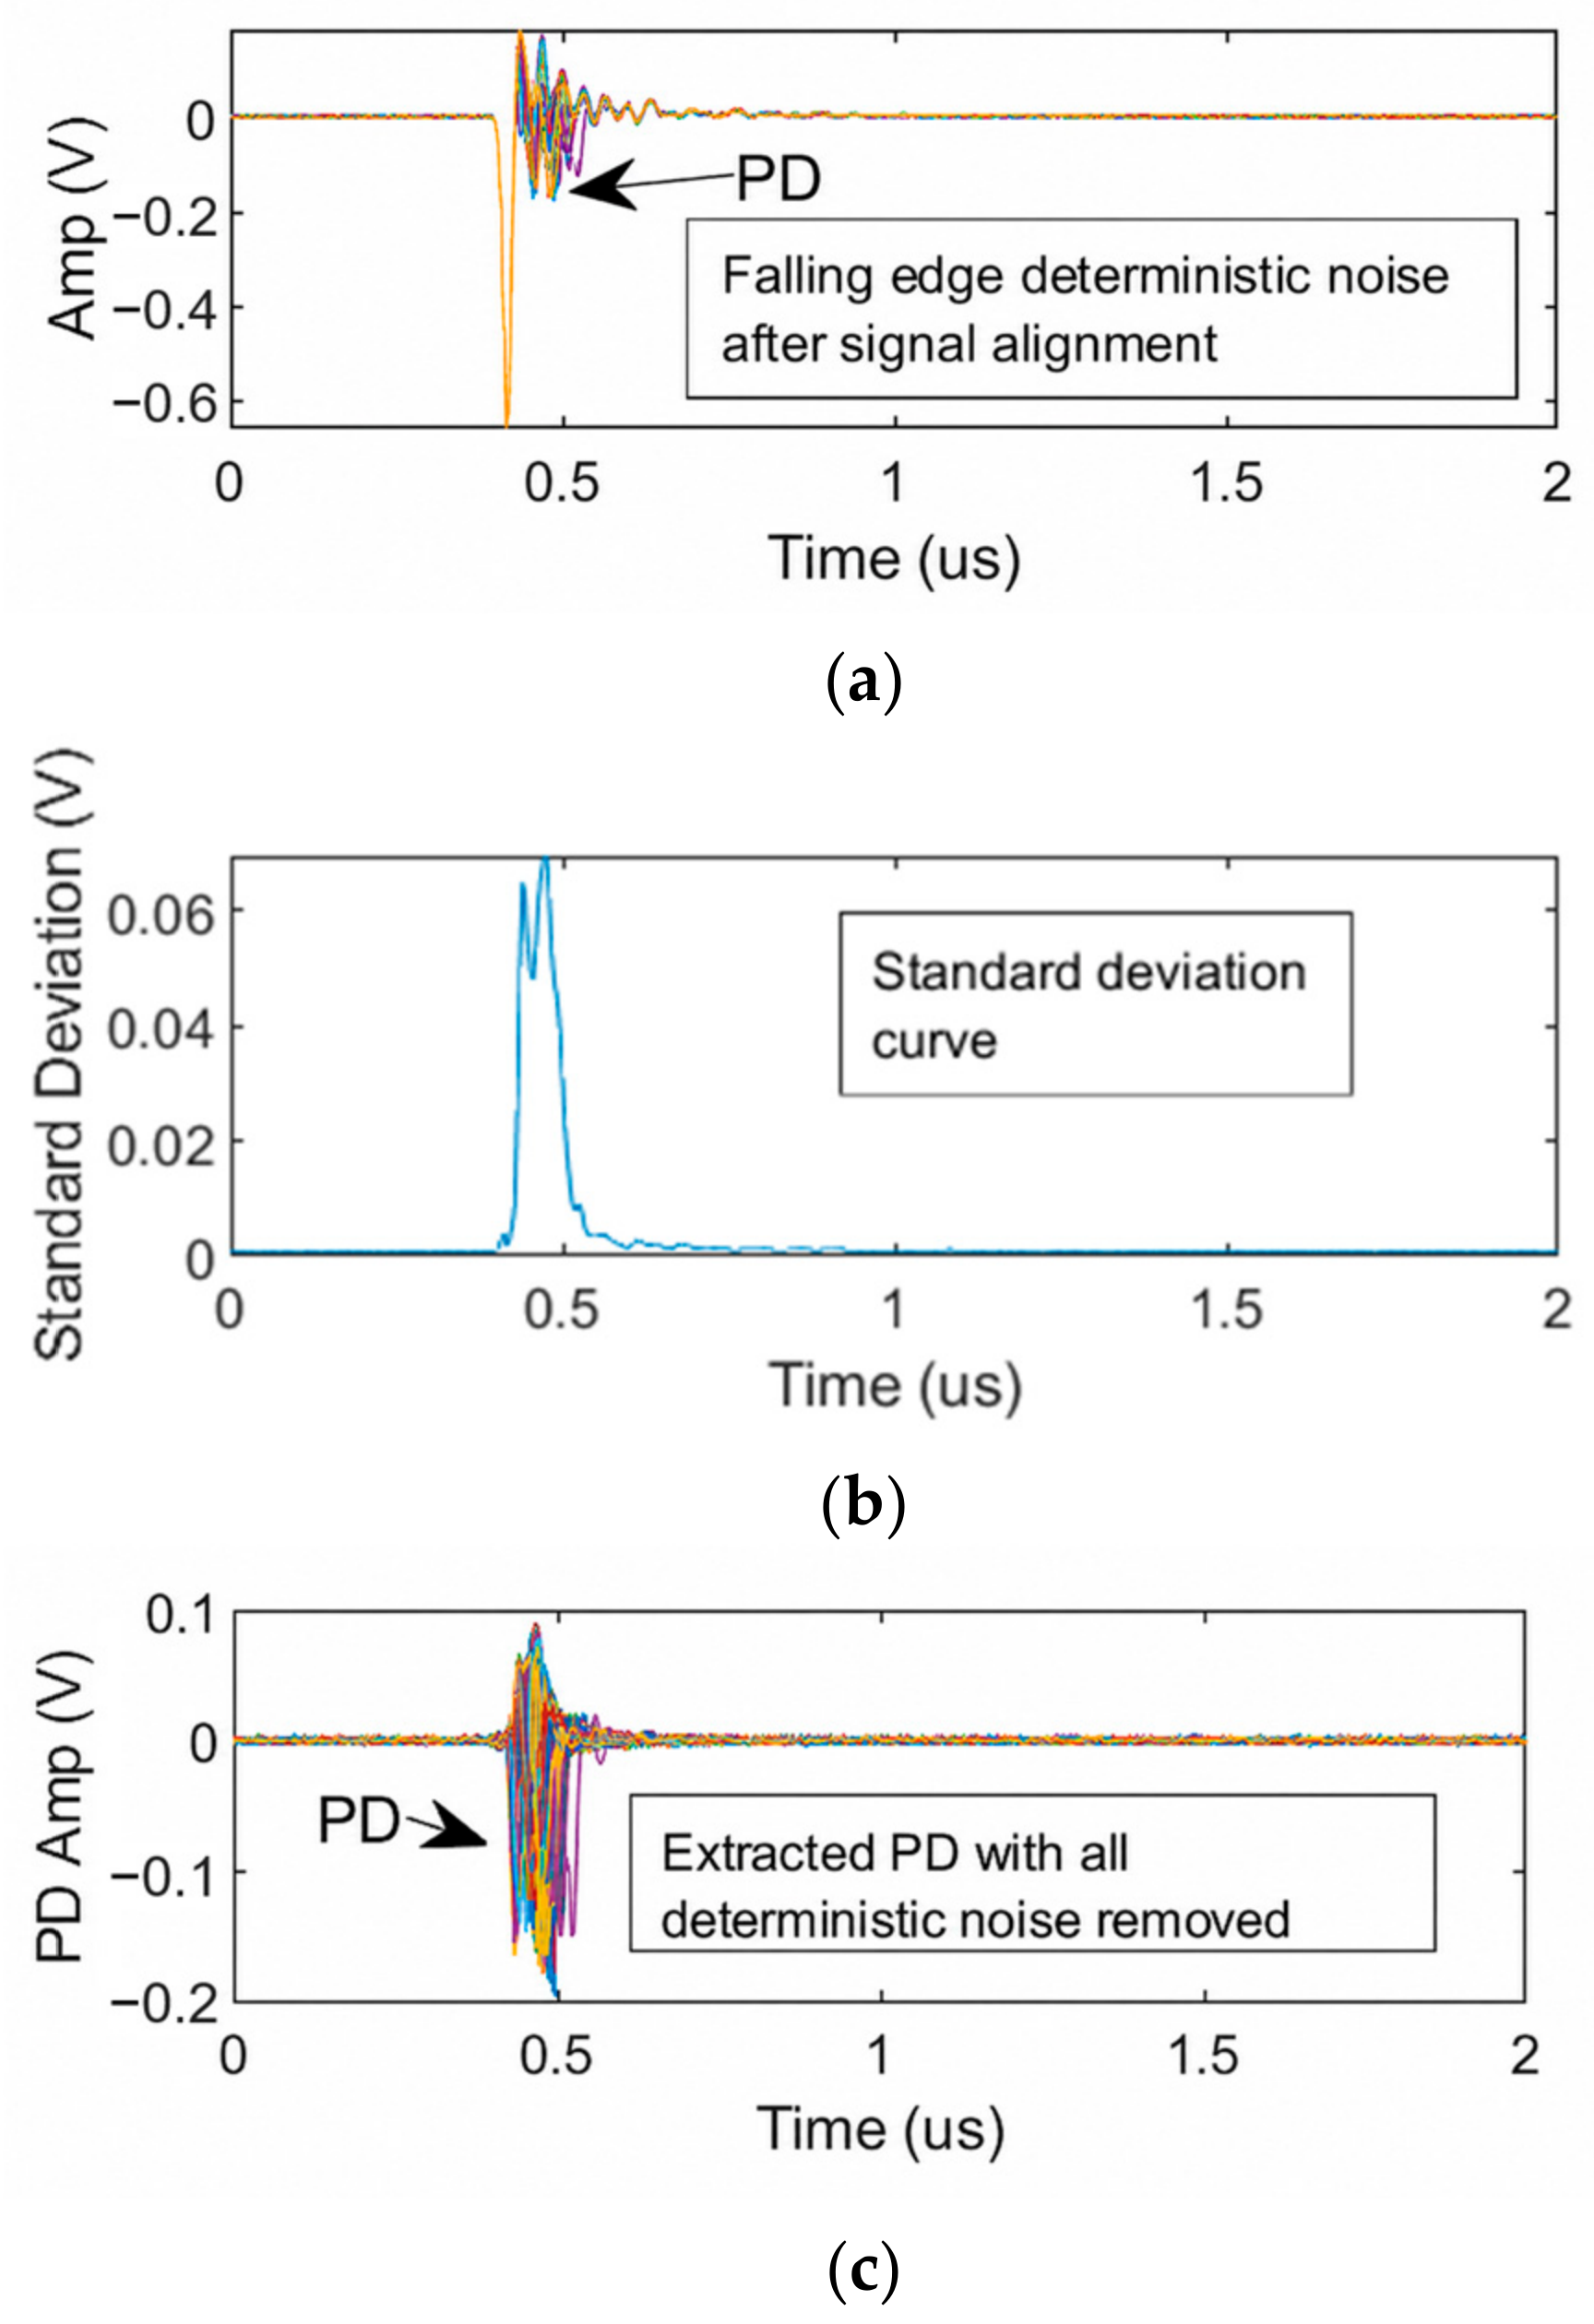
Figure 4a shows an example of an application of the standard deviation methods to the case of
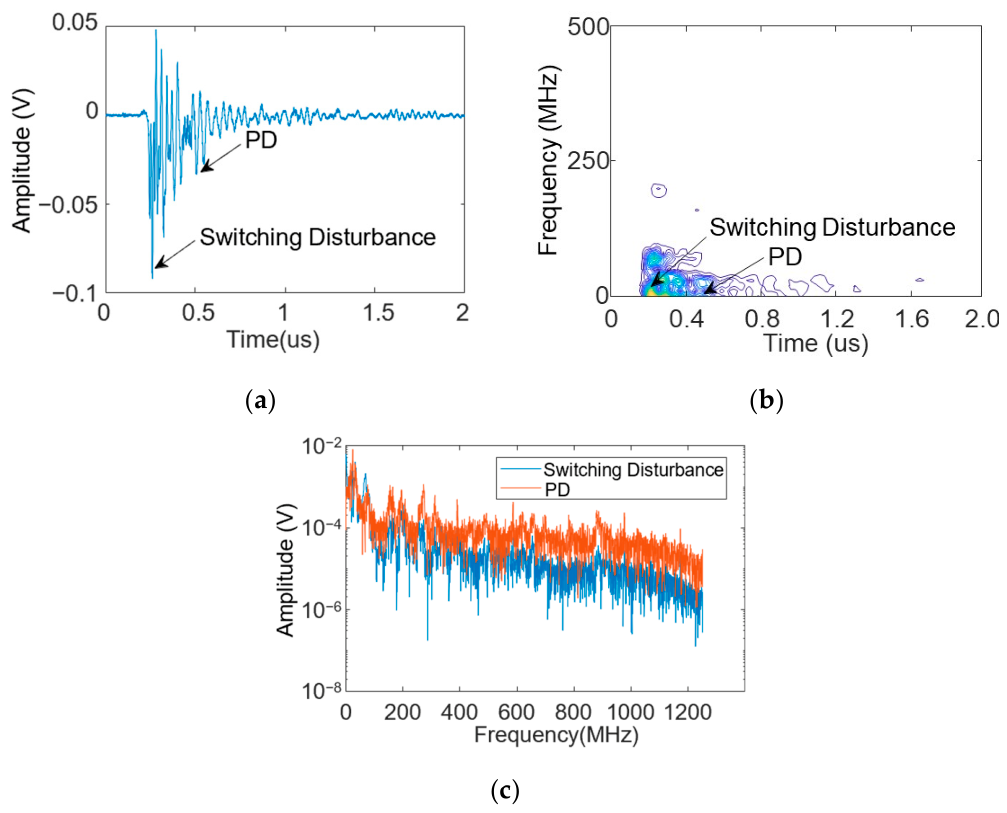
Figure 3a. A total of 250 traces (signal series) have been acquired, and their moving standard deviation calculated: the onset of the sharp increase in the standard deviation is considered as the time at which one or more PD pulse occurs. During laboratory tests at increasing voltage, the onset of the sharp increase in standard deviation is also taken as PDIV. Each PD pulse can then be extracted from the background switching noise, filtering out the deterministic component from each trace, as shown in
Figure 4b.
Figure 5 displays another example of application of the time-based denoising, re-sorting to the innovative criterion described above. Tests were performed again on twisted pairs of insulated wires, at 1.8 kV DC bus voltage, using a two-level inverter configuration with modulation at 100 Hz, carrier at 5 kHz, and rise time at 100 ns: PD pulses could not be distinguished even by an expert operator, but they are extracted through the proposed innovative filter.
It must be emphasized that while the concept of time-based filtering and denoising is clear and apparently effective (when noise is, in general, deterministic), implementing it may pose considerable challenges. Firstly, a group of acquired (deterministic) signals will always have some variance in time alignment, which could be of the order of a few nanoseconds. Even if small, this can significantly increase the standard deviation of deterministic switching pulses, especially those with sharp rise time. Therefore, the application of this technique requires adequate signal processing to reduce the variance and achieve almost perfect alignment. Secondly, for very fast rise times, the deterministic switching noise can be sharp and can present multi-peaks equivalent in magnitude (as in
Figure 5a). This might imply (depending on sampling rate) that acquired signals have insufficient number of samples around a peak, reflecting a non-negligible increase in standard deviation. Therefore, preprocessing the acquired signals by applying appropriate signal alignment techniques is a necessary step before the standard deviation-based filtering can be applied. This can be done by applying, for example, fractional delay filters, peak interpolation, or other suitable techniques.
4. An Automatic Unsupervised PD Testing and Monitoring System
The above time-domain approach can be included in a global algorithm with the purpose of automatizing PD acquisition and analytics for electrical insulation systems fed by any type of voltage waveform, including power electronics.
The whole automatic algorithm (software version: 1.5.3-M; Seiktron, Weston, FL, USA), called SRI (Separation, Recognition and Identification), should allow separation of PD pulses from other types of noise to be achieved, aside that caused by switching, or including residuals of switching noise not completely eliminated by the time-domain filtering. Further, it should be able to recognize PD pulses from those caused by noise and reject the latter, i.e., recognition, and, eventually, carry out the identification of the type of source generating PD (in relation to the level of PD harmfulness). Three types of PD sources are considered, that is (in descending order of harmfulness), internal, surface and corona discharges [
26].
The algorithms to achieve automatic separation and recognition of PD pulses and residual noise are mostly based on pulse shape-based quantities; see, e.g., [
18]. Going a bit more in detail, the residual amount of noise, as well as other types of noise or disturbance, can be separated from PD (and then rejected) after clustering the quantities coming from multi-dimensional mapping of signal-related parameters, such as equivalent time and frequency, entropy, skewness, kurtosis (of each pulse), etc. The representation of the multi-dimensional data in a reduced (e.g., a two-dimensional) space can be achieved through principal component analysis (PCA) [
27,
28,
29,
30]. The first two principal components should ideally provide the best two-dimensional map for automatic cluster separation, bearing in mind that if this does not work effectively, a reduced size multi-dimensional space can still be used. Automatic separation of clusters is challenging since the number of clusters is not known a priori. Hierarchical clustering or density-based clustering can be, then, effective techniques, since they do not require knowledge of the number of clusters and are based on similarities among different clusters [
31]. However, an optimization criterion based on a threshold distance must be implemented to achieve automatic clustering, in order to obtain the minimum number of meaningful and informative clusters, each related to a specific signal-generating phenomenon [
31,
32].
Recognition, i.e., PD or noise pulses, relies on various criteria that are mostly based on statistical processing of signal characteristics. Among these criteria, the amount of randomness in the recorded signals belonging to each sub-cluster can help in recognition of PD from noise (white) pulses. PD signals are inherently more structured (being a response to a discharge signal) compared to noise signals (e.g., white noise), which are more dispersed, thus displaying a kind of random structure. Hence, linear prediction (LP) analysis can be used to predict sharp changes in a signal structure corresponding to sudden onset of PD (PD inception). It has been shown in [
27] that the density probability analysis of LP residuals is significantly more skewed for the residual relevant to PD pulse than for noise. Such an approach does not work if noise has deterministic components, as for power electronics switching, and this is why the time-domain filtering presented above is necessary before entering the SRI process.
Identification of the type of source generating PD relies on artificial intelligence techniques (specifically fuzzy logic) applied to PRPD sub-patterns that have been “cleaned” from noise thanks to separation and recognition steps. As mentioned, identification can be referred to within three categories (i.e., internal, surface, or corona discharges) based on harmfulness criteria, with a likelihood level between 0 and one, with one being certainty of identification. In this way, identification can be a key tool to single out the risk inherent to PD aging and maintenance, that is, for diagnostic purposes. Indeed, as reported in many papers and even in standard documents (e.g., [
26]), without knowing the type of defect triggering PD, maintenance action loses its effectiveness. In addition, without separating PD from noise and from other PD sources, identification made by expert systems (as those using artificial intelligence, AI), rather than expert people, is often meaningless [
33,
34].
Notably, identification under DC and power electronics can be developed only through AI techniques. As regards AC sinusoidal supply, human experts generally have experience and understanding. For AC, identification criteria stem from the impact of physics and phenomenology of the type of discharge on PRPD pattern features. PRPD patterns generated by discharge in cavities or delamination inside insulation have marginal phase distribution that starts generally before the voltage zero crossing, has reasonably low-amplitude dispersion in the marginal amplitude distribution (thus values between, e.g., two and four of the shape parameter, β, of the cumulative Weibull distribution of discharge magnitude), and phase distribution ranging between near zero to maximum 120° and 180° to 300° (for positive and negative voltage half-periods, respectively) [
26]. Considering that the validity of the algorithm must cover a broad set of insulation systems, as well as different types of circuits and sensors, insulation defects, surface condition, and field distributions, the above criteria cannot be sharp, but they must be fuzzified, providing as an output an identification likelihood for one or more of the three categories.
Among the work on PWM-derived PD studies in the literature, a laboratory-based machine learning-based approach has been proposed in [
19] for PD diagnostics under PWM voltage excitation. PWM-related disturbances are first reduced through signal preprocessing. Individual PD events are then represented by features including spectral content and temporal occurrence characteristics. These features are subsequently processed using supervised learning algorithms, including decision trees and long short-term memory (LSTM) networks, for automated defect classification and PD source identification.
Compared with supervised machine learning approaches, which rely on training datasets and feature learning algorithms for defect classification, the SRI methodology proposed in this paper combines signal processing, statistical analysis, and fuzzy logic identification. This provides a physically interpretable framework for PD separation, recognition, and identification, while avoiding dependence on extensive training datasets, which can be used in any on-field environment (thus also for PD and health condition monitoring; see next sections).
Regarding implementation practicalities, the SRI software platform (SRI: 1.5.3-M) was developed in the LabVIEW environment as user interface, and Phyton (Version: 2.0.3) for the analytics section. The computational requirements of the proposed separation, recognition, and identification (SRI) algorithm are such to enable real-time PD data processing on conventional laboratory computers. The SRI software was installed and tested on a standard PC equipped with a multi-core Intel processor, 16 GB RAM, and a Windows operating system. No dedicated GPU or high-performance computing hardware was required.
5. PD Measurements and Accelerated Aging Under PWM
This section is structured to progressively demonstrate the application of the PD measurement methodology, beginning with simpler test objects and advancing to more complex, application-relevant components. This ensures systematic development and demonstration of the methodology, moving from basic models to practical, real-world systems. First, twisted-pair specimens are employed to assess the performance of the time-domain PD pulse extraction technique, focusing on its ability to separate PD signals from switching noise. Next, multiple flat insulation specimens placed between two electrodes are used to demonstrate the capability of the SRI approach to distinguish between PD typology (likelihood of surface or internal discharges). With these essential elements of the PD measurement process validated, the final experimental stage involves an accelerated aging test carried out on low-voltage motors, representative of electrified transportation components, aimed at demonstrating the practical implementation of the dynamic health index, the primary focus of this work in the context of electric vehicle applications. The following sections detail the setup, procedures, and experimental investigations described above.
5.1. Experimental Setup
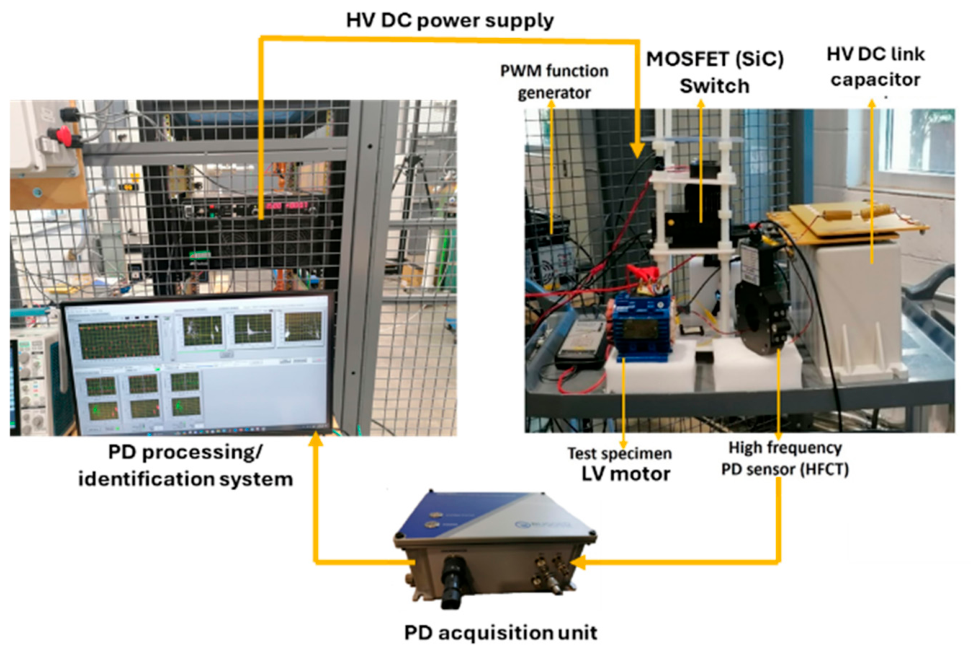
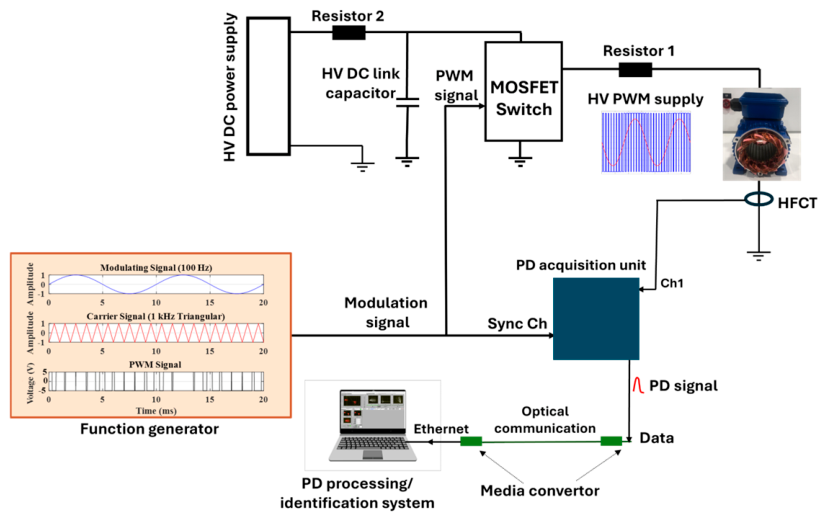
The experimental setup and electrical layout are shown in
Figure 6 and
Figure 7. The power supply was provided by an adjustable high-voltage (HV) PWM designed and manufactured in the authors’ lab.
It is made by a DC power supply (Spellman High Voltage Electronics Corporation, Hauppauge, NY, USA), ±10 kV, which powers the HV SiC modules through a capacitor bank with PCB busbar, which minimizes the stray inductance in the switching loop. SiC modules (Behlke Power LLC, Billerica, MA, USA) are switched to generate HV PWM with high dV/dt and carrier frequency up to 50 kHz. Series resistors are applied in the switching loop to regulate the dV/dt of the output, in order to have a rise time between 20 and 1000 ns. The generator box also contains a current sensor to detect the electrical breakdown of test objects, and HV relays to switch off the supply voltage to the specific test object that has failed: this allows accelerated life testing plus PD monitoring to be carried out on a number of test objects (up to five) fed in parallel.
PDs were measured/monitored by a broadband detector (10 kHz to 100 MHz) with a sampling rate of 250 MS/s (HPM601; Rugged Monitoring, Quebec city, QC, Canada), endowed with the fully automatic analytics software able to extract PD from switching noise and run the SRI approach. Sensors were both antennas and a high-frequency current transformer (HFCT), but the results reported in this paper come from the HFCT which has the advantage of better robustness and easier installation on the ground lead.
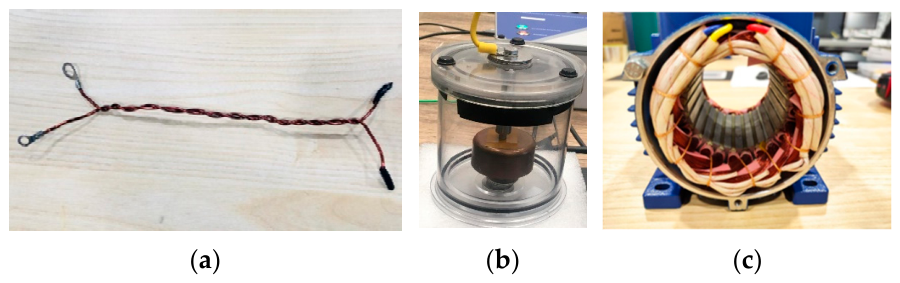
Figure 8 presents the test objects investigated in this study.
5.2. Standard Deviation-Based PD Extraction in Twisted Pairs
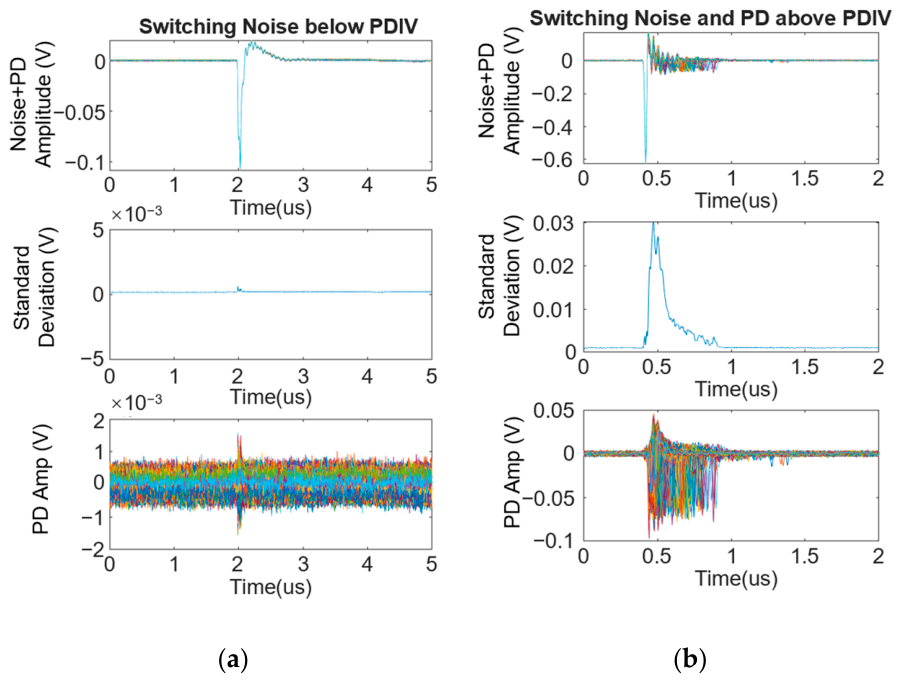
PDIV measurements on twisted pairs, prepared from the wires used in the motors, were conducted with modulation frequencies ranging from 100 to 1000 Hz and carrier frequencies from 1 to 10 kHz, using a rise time between 50 and 200 ns. The PDIV was determined by increasing the applied voltage in steps of 100 V. The inception voltage was indeed singled out by the standard deviation time filter, at the level of voltage where the software was able to identify a sharp and well-defined rise. As an example,
Figure 9 displays the overlap of 100 traces (after signal alignment) relevant to voltage switching noise transients below (but near) and above the PDIV, having removed most of the switching noise by the time-domain filter described above; the output of the (automatic) standard deviation test is also reported.
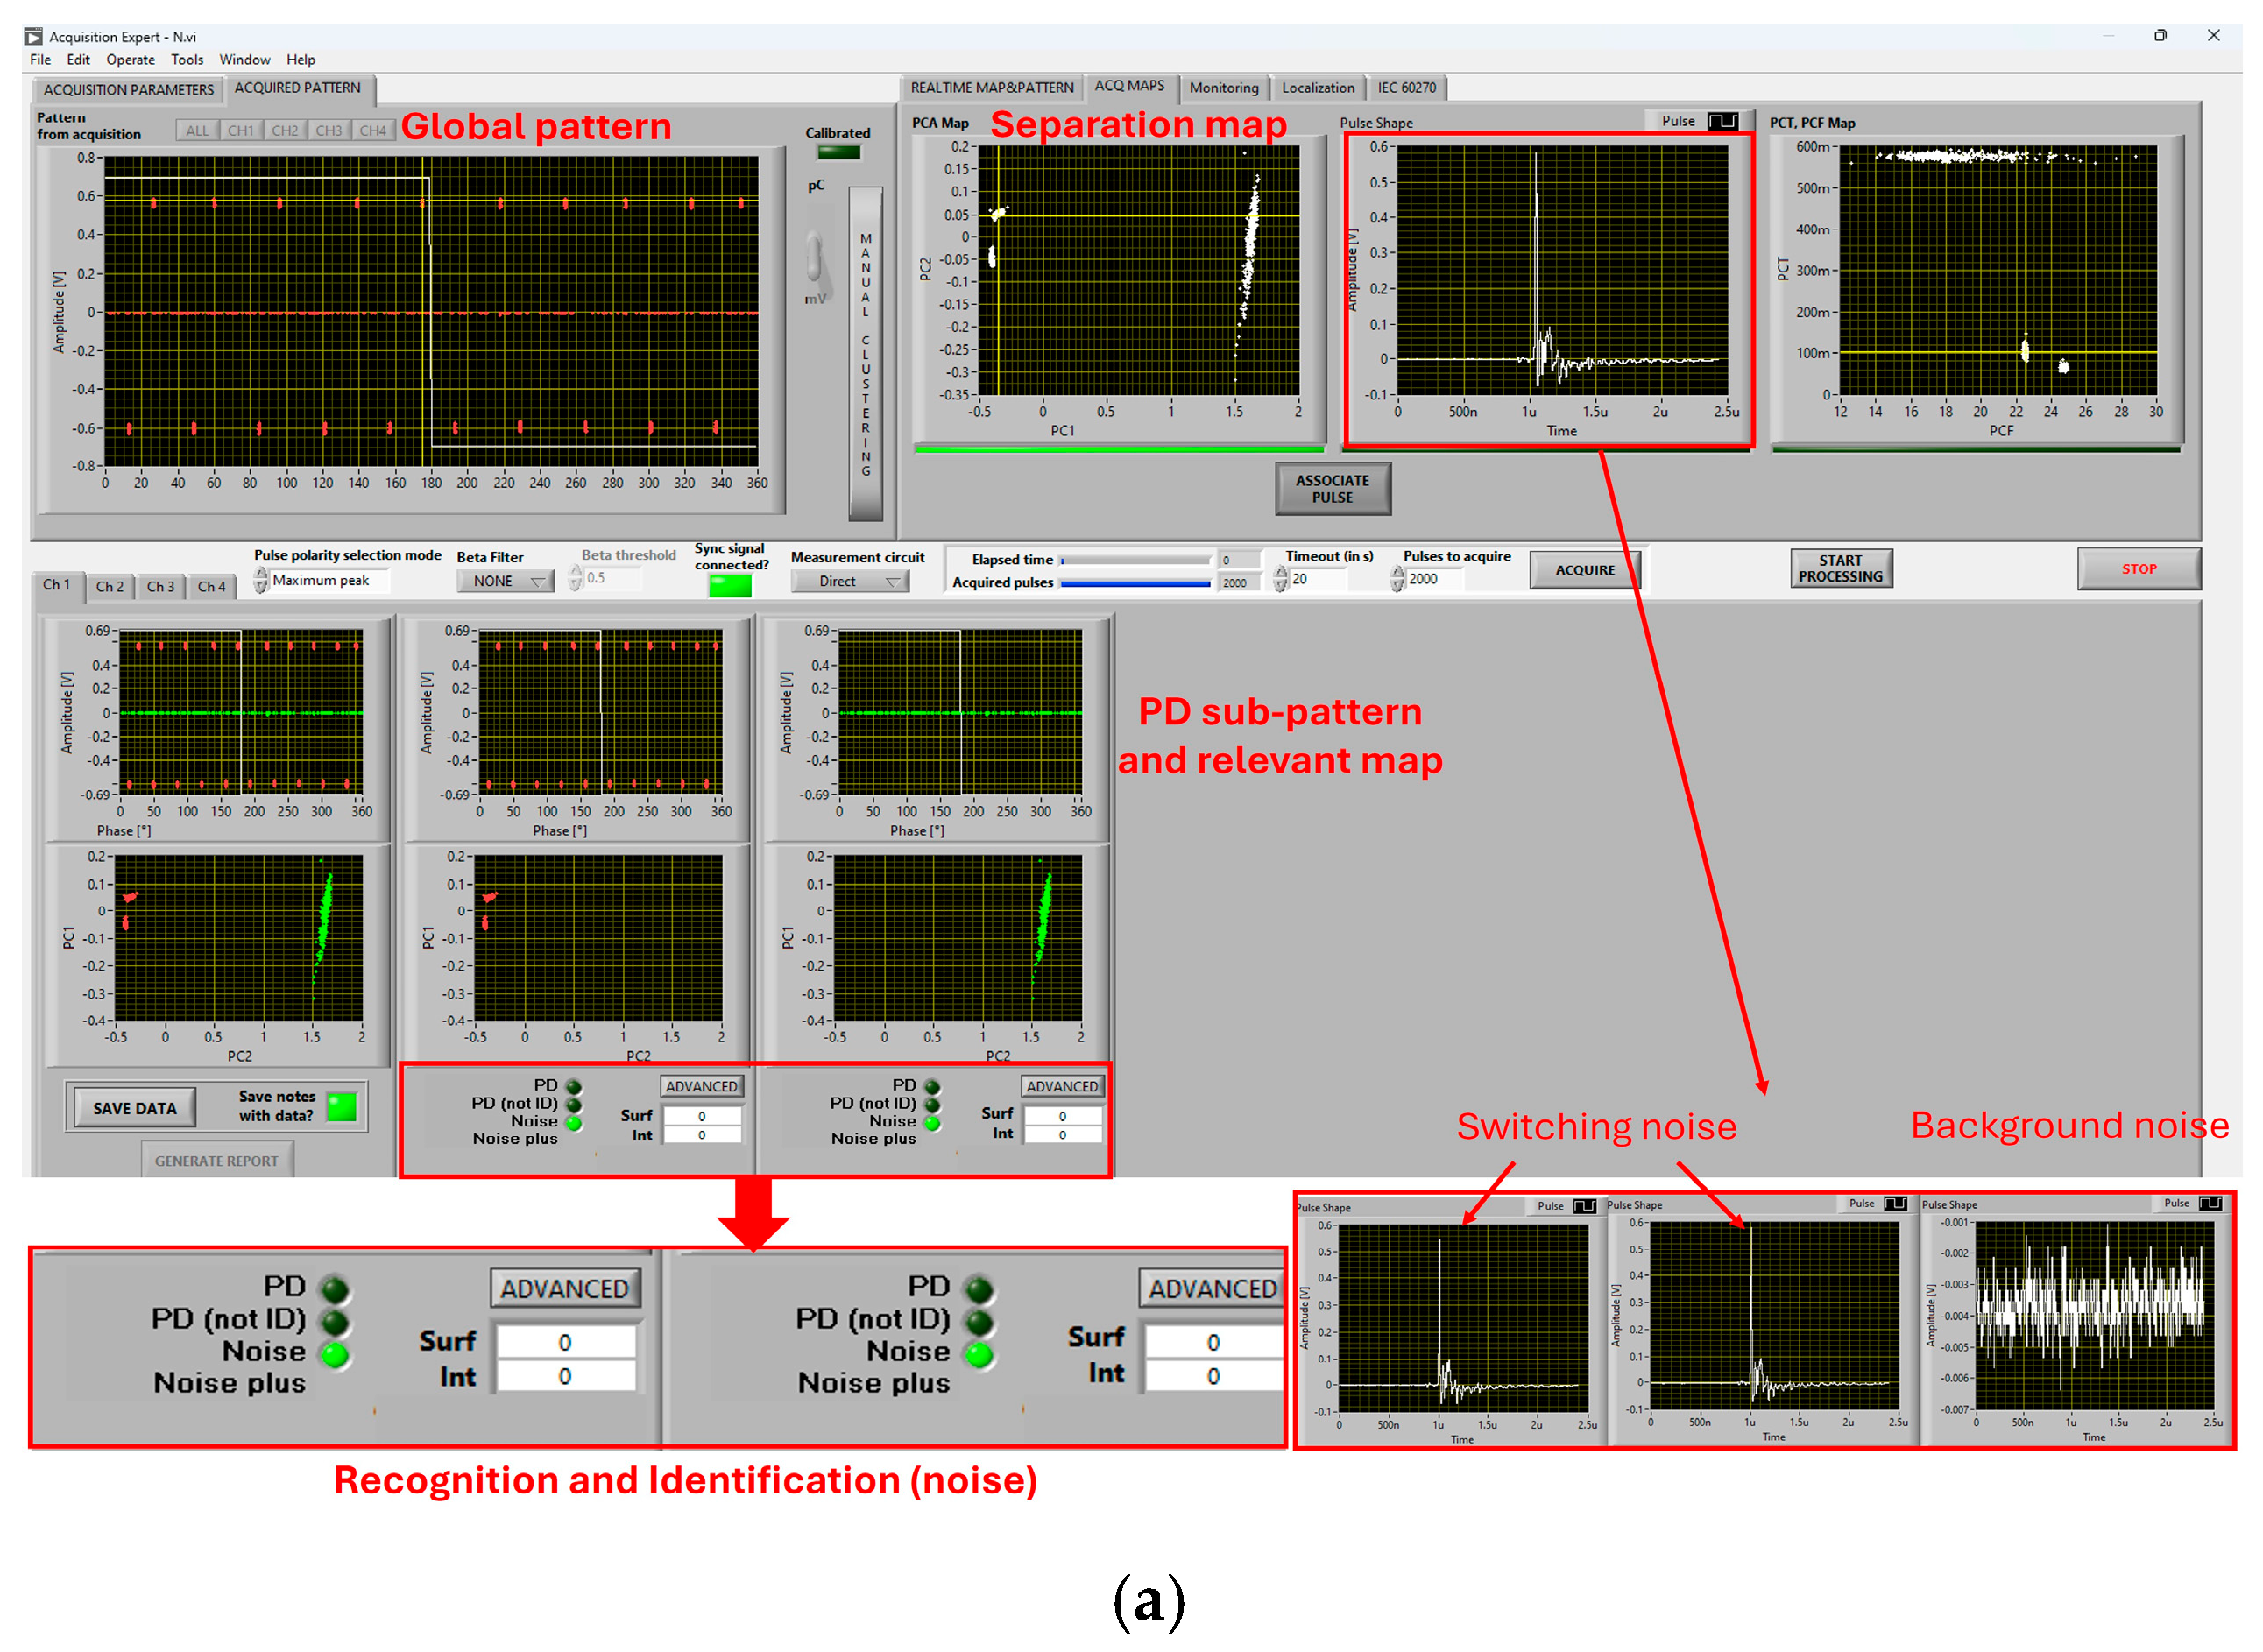
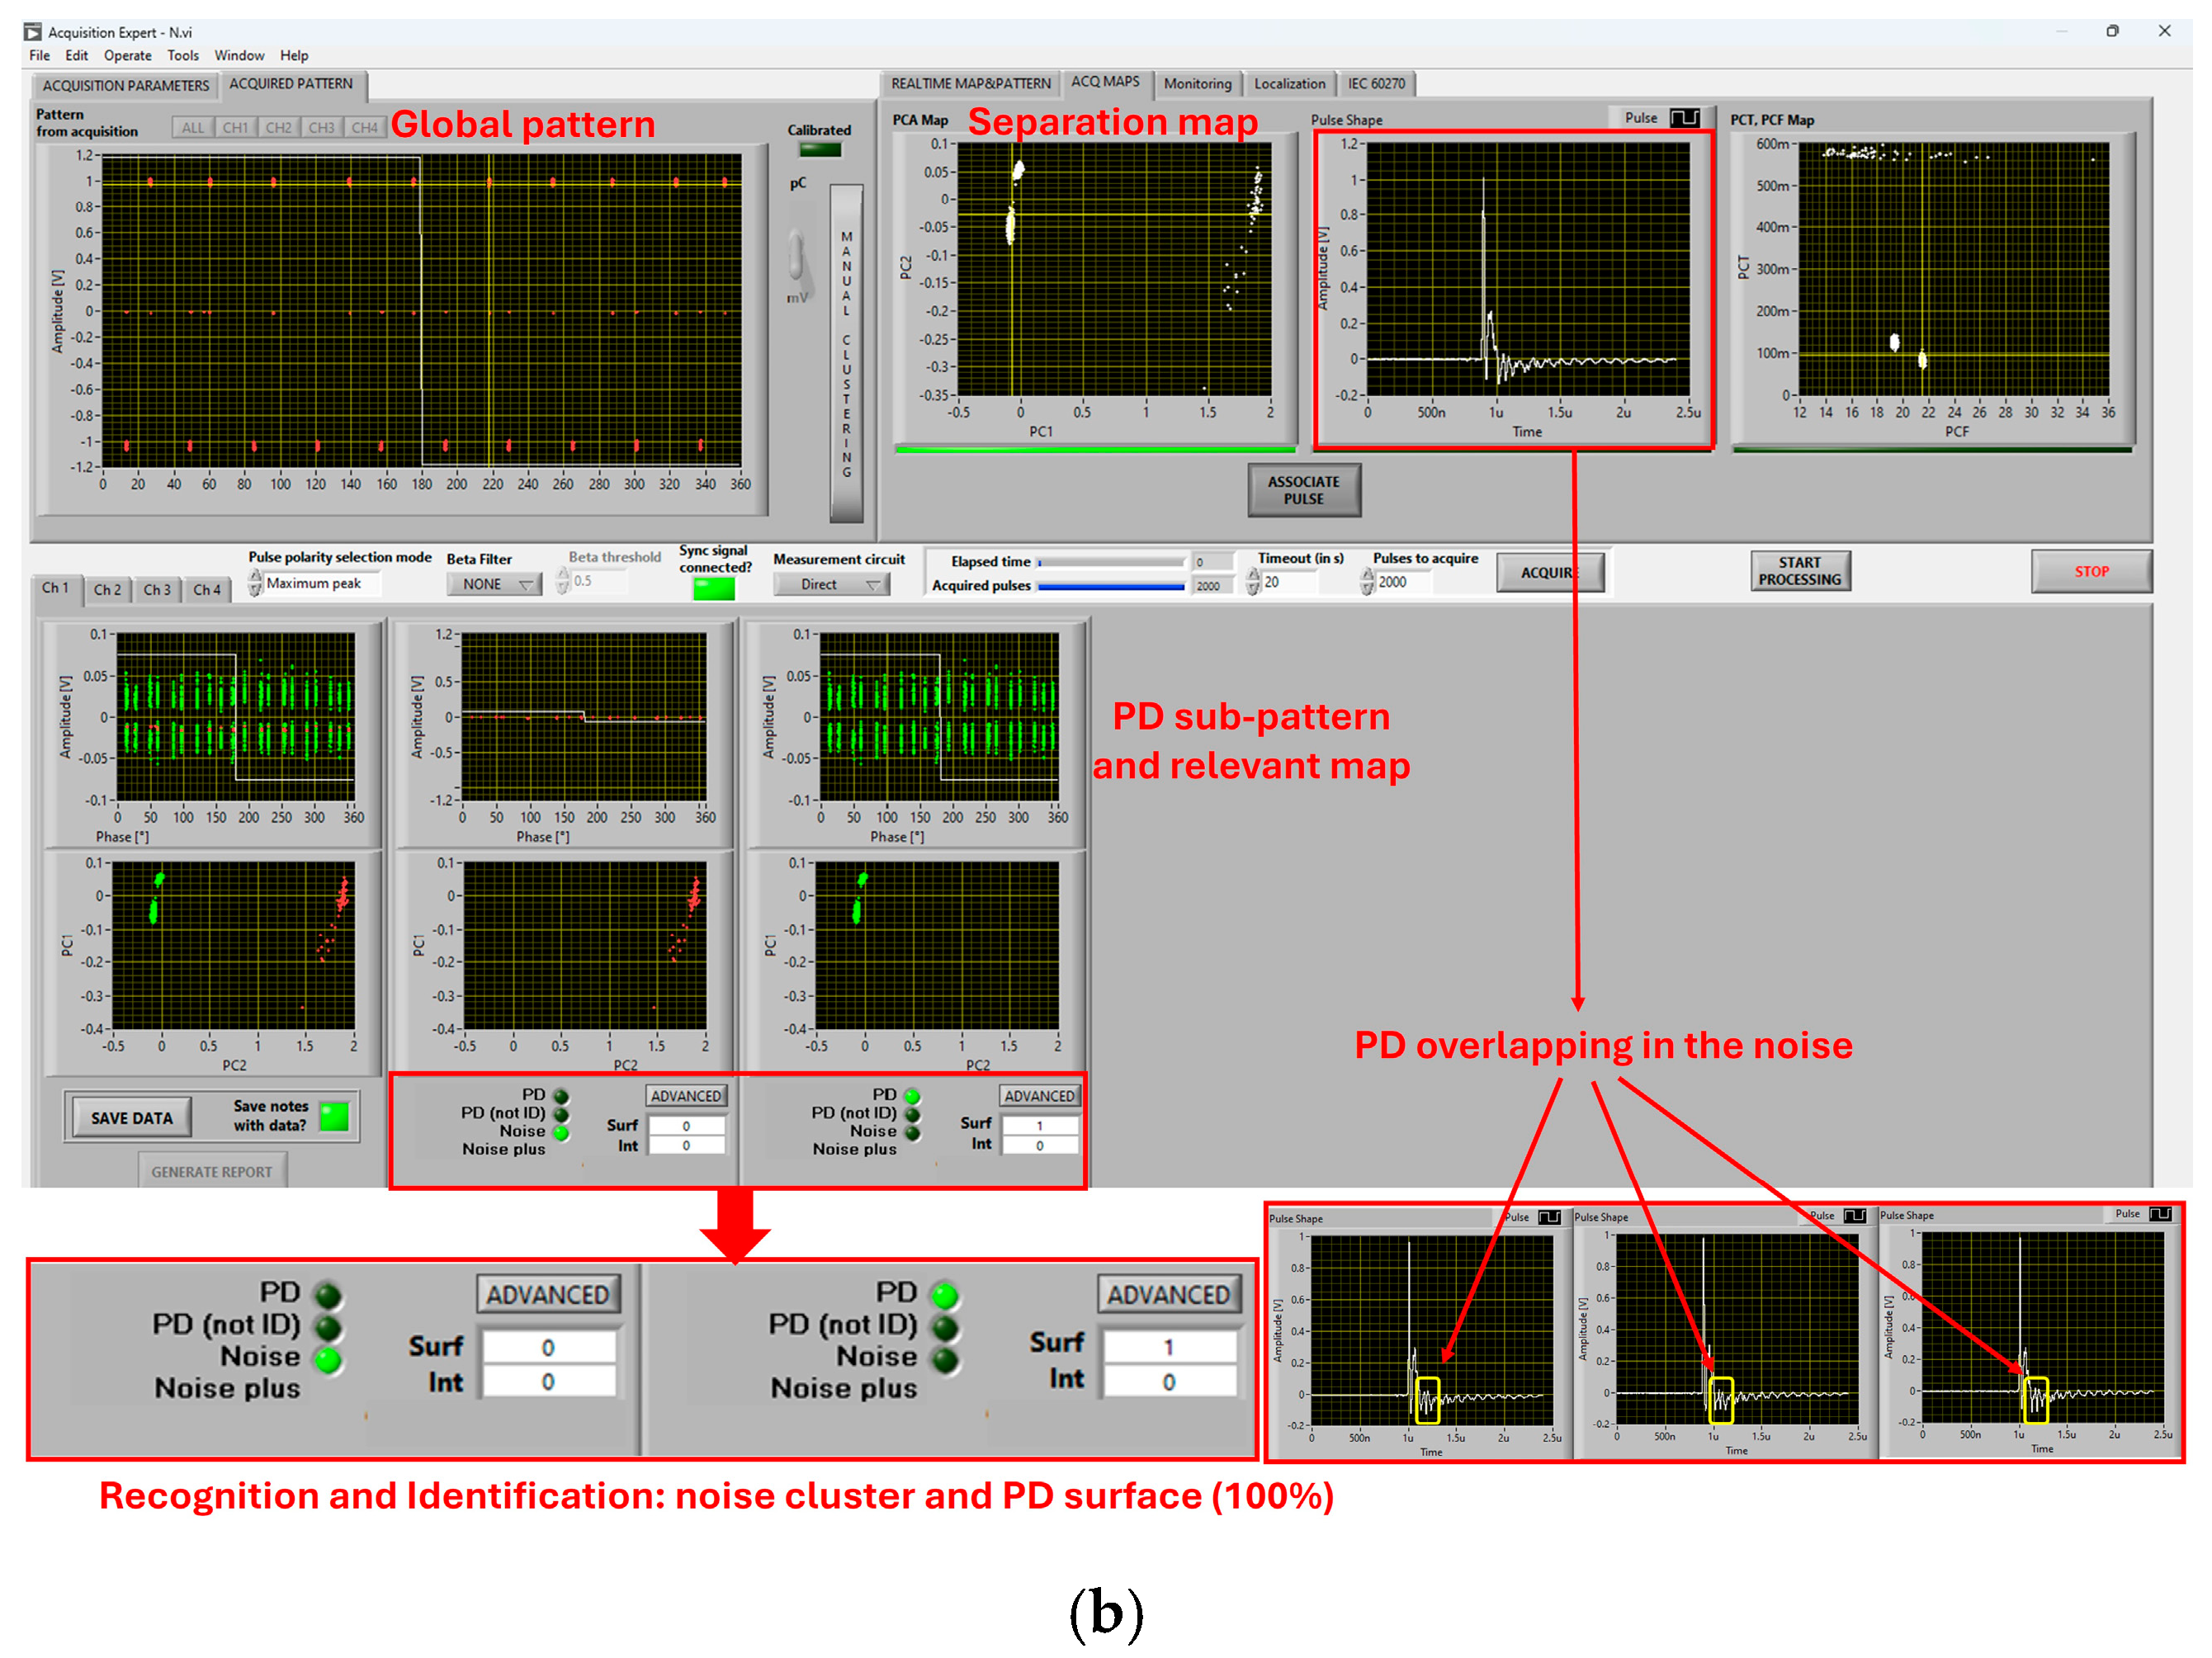
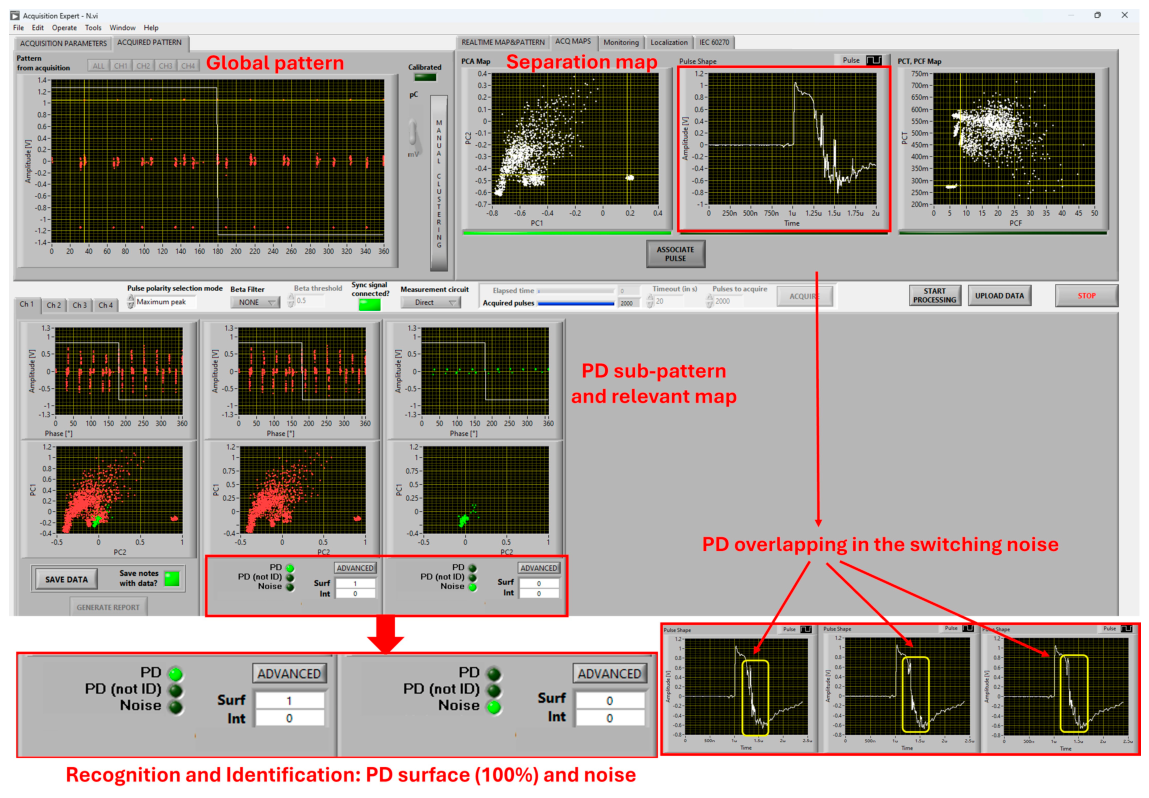
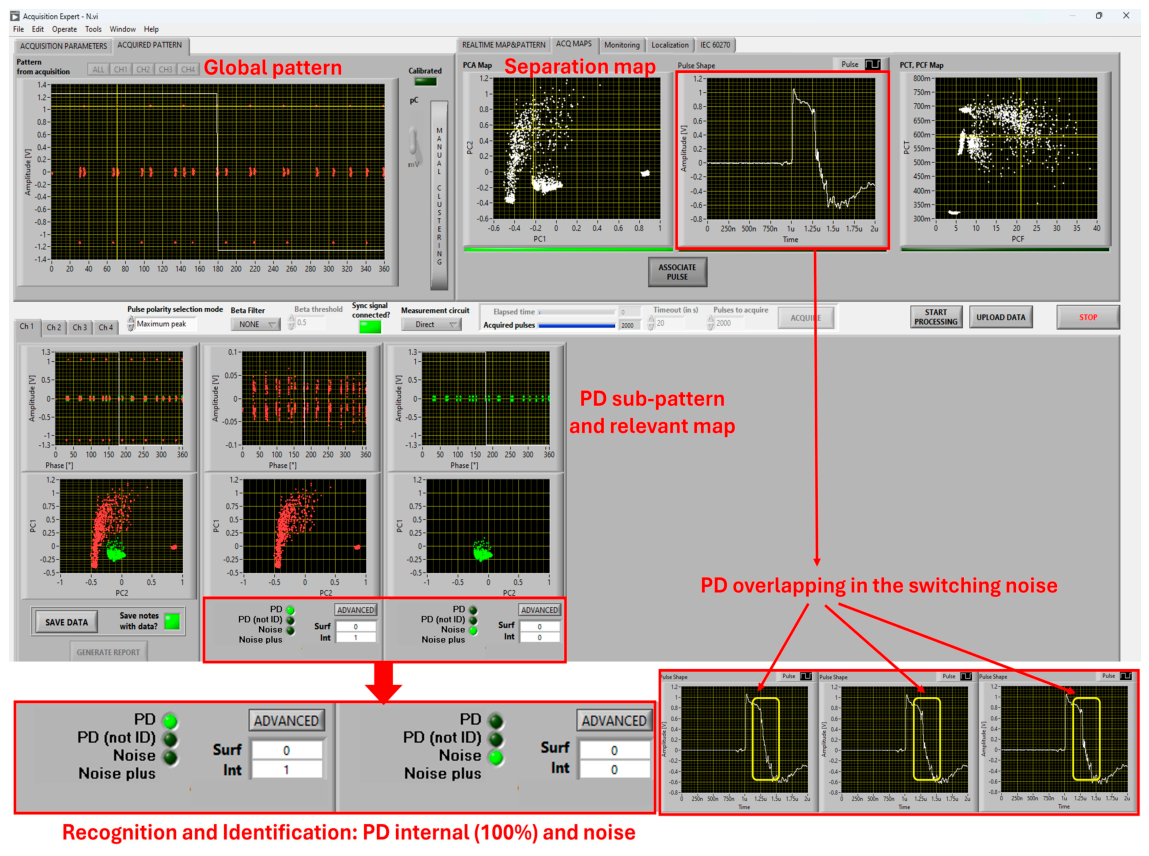
Figure 10 reports two screenshots of the automatic software, taken during PDIV measurements on twisted pairs, below and above PDIV (rise time 60 ns, modulation 100 Hz, carrier 1 kHz). The global PRPD pattern below PDIV (
Figure 10a) shows just residual switching noise after time-domain filtering, which is recognized by the automatic analysis software. Above PDIV (
Figure 10b) one can see overlapped noise and PDs which are separated by the PCA map and recognized. PDs are identified as 100% internal, as expected from discharges occurring in air between two insulated wires. As seen from
Figure 10b, most partial discharges occur during rising and falling times at each voltage impulse (jump voltage [
35]).
5.3. SRI-Based PD Analysis of Flat Insulation Specimens with Vertical Electrodes
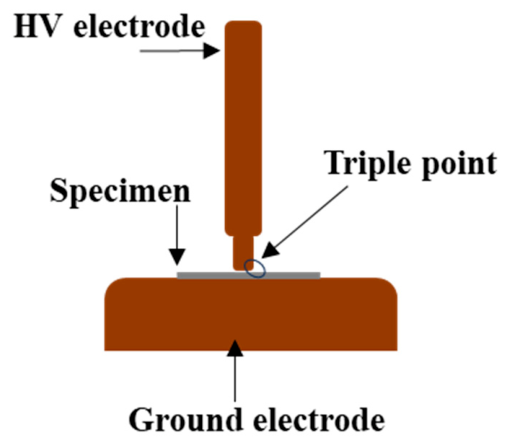
Figure 11 illustrates a test object (shown in
Figure 8b) made by a flat insulation specimen (Kapton CR film) placed between two electrodes, which is able to generate a tangential field large enough to trigger surface PD at the triple point under AC sinusoidal voltage. An example of the PD separation, recognition and identification carried out by automatic PD measurement and analytics, obtained from the innovative software developed, is shown in
Figure 12. PD and noise pulses are separated by PCA and clustering, and they are recognized, yielding sub-patterns corresponding to PD and noise, respectively. The PD sub-pattern is processed by a fuzzy identification algorithm which provides the output as the surface discharges with likelihood 100% (i.e., certain identification).
This can work for a PRPD pattern obtained under AC sinusoidal voltage, or sometimes for AC-modulated voltage with five or more inverter levels (which would make the PRPD tend towards something similar to sinusoidal AC). For most types of inverters used in electrified transportation, particularly electric vehicles, the number of levels is, however, from two to three; thus, the PRPD (for the test object in
Figure 11) has a typical comb-like pattern structure, as shown in
Figure 13 [
34,
36]. As a result, most of the fuzzy identification structures working for AC cannot be applied.
Therefore, under power electronics, identification becomes less robust than under AC sinusoidal voltage, having to count fundamentally on one parameter, that is, the shape parameter of the Weibull distribution (that keeps behaving similarly to AC, but with different ranges of values).
5.4. PD Monitoring and Accelerated Aging of LV Motors
As shown in
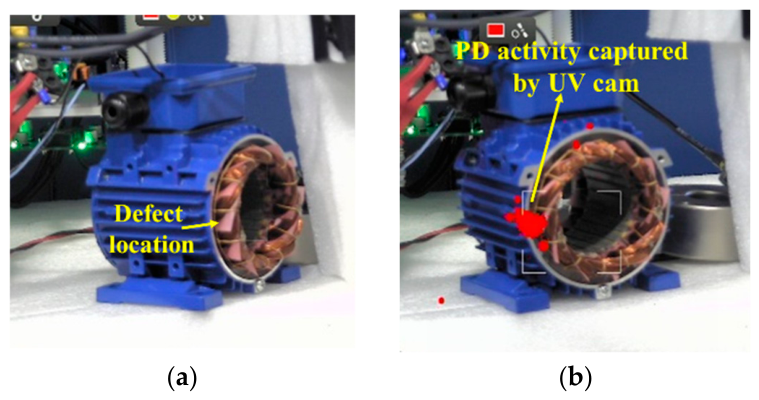
Figure 14, some low-voltage motors (0.12 kW, 220 V) were tested off-line to estimate the PDIV and then aged at 1.5 PDIV while monitoring PD. PD monitoring was then carried out on motors endowed by an artificial defect (by scratching/removing a small part of insulation film between coil winding and ground), during the accelerated aging test at 1.5 PDIV, till breakdown. PD patterns and related quantity evolution were recorded, with the purpose of assessing the diagnostic capability properly brought about by the automatic SRI approach and supporting the
DHI algorithm presented in the next section. In addition to PD measurement using HFCT, a UV camera (UViRCO Technologies (Pty) Ltd., Pretoria, South Africa), exhibiting UV sensitivity 2.05 × 10
−18 Watt/cm
2 and a resolution of 640 × 512, was used to achieve visual validation of PD activity at the defect location. The photo of the motor captured during test by the UV camera below PDIV is shown in
Figure 14a while
Figure 14b shows the PD activity at the defect location, i.e., between coil and ground, at 1.5 PDIV.
Figure 15 and
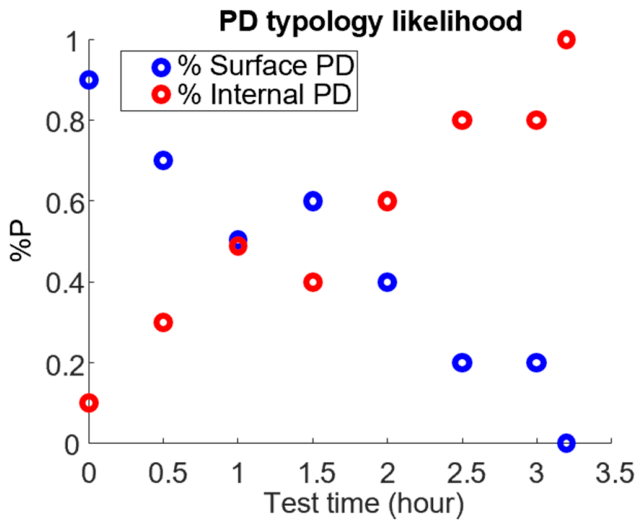
Figure 16 display PRPD sub-patterns after separation for the unaged and aged motor. As can be seen, besides some noise which is properly recognized, fuzzy logic applied to PRPD sub-patterns identifies PD as caused mostly by surface discharges, with a likelihood decreasing with time, and the internal PD became dominant when approaching breakdown.
Having rejected noise, automatic trending of PD quantities, as amplitude,
A, repetition rate (
RR) and identification likelihood (ID), can become feasible for each sub-pattern associated with PD phenomena. While we can have, especially in MV motors with Type II insulation [
35], various PD phenomena simultaneously active, as slot discharges plus end-winding or bar-to-bar discharges [
33], the approach on which identification is based is to split PD typology into three fundamental classes, i.e., internal, surface and corona discharges, based on harmfulness criteria.
This can be applied, simply and directly, also to typical motors used in electric vehicles, with Type I (organic) insulation. For organic insulation, PD in internal defects should be absent on new motors and if (or when) they appear due to aging, insulation would prematurely fail (in a time much shorter than design life), whatever the type of defects are generating internal PD. Surface PDs can be tolerated for longer times, compared to internal ones, since the driving field is mostly tangential to insulation surface. This, indeed, causes a slower damage rate (failure occurs when pit formation will turn the driving field into orthogonal to insulation surface, thus triggering bulk insulation breakdown). Corona discharges will hardly affect insulation reliability. These considerations are summarized by numbers in
Table 1, where weight is a measure of the harmfulness of the type of PD source.
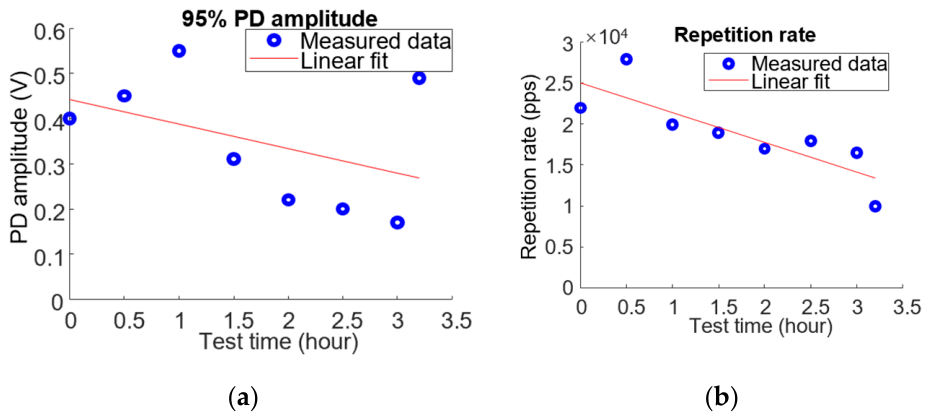
Figure 17 reports the trend of PD amplitude and repetition rate during motor accelerated aging, as a function of aging time, till breakdown. As can be seen, contrary to what is commonly expected, both magnitude and repetition rate tend to decrease (but not monotonically) with aging, the former showing a fast increase just before motor breakdown. This is perhaps the worst situation for diagnostics, since it may be even thought that motor health is improving with time under stress. The breakdown is sudden, so that preventive maintenance, based on the PD amplitude and repetition rate time trend, cannot be planned properly. This is a typical case when one could have doubts about PD as a diagnostic indicator, even if most often, and on several other asset components, the PD parameter trend is often increasing (at least for one quantity between amplitude and RR). It is therefore of paramount importance to single out a further quantity, PD-based, that can show the effect, in terms of aging, of time under stress and allow condition maintenance procedures to be implemented. This is the topic of the next section.
6. Dynamic Health Index (DHI) for Motor Under Accelerated Aging
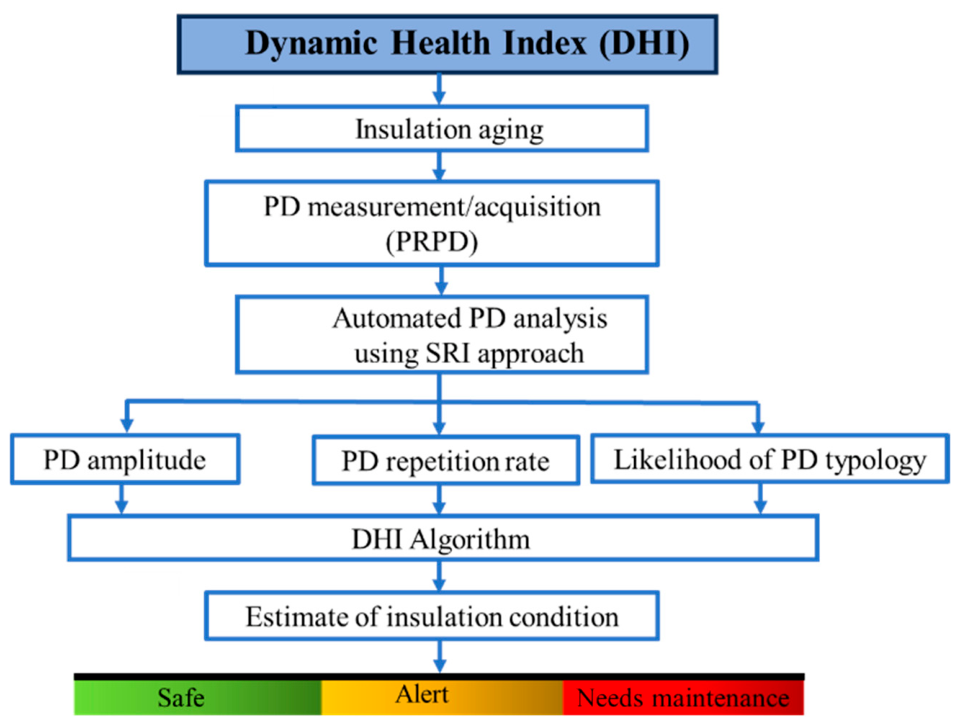
The overall framework of
DHI is presented in
Figure 18. As mentioned, the key diagnostic marker is partial discharge, which is at the same time a diagnostic property and prevailing cause of accelerated aging and premature failure of organic insulation.
The SRI software structure for noise rejection and PD identification can be developed into an SRID one, where D stands for diagnostics, implementing the concept of
DHI introduced in [
27,
36] relevant to PD-associated quantities. In order to provide a simple figure of the impact of PD on motor health conditions, and, therefore, establish an optimized condition-based maintenance plan, the reliability-based approach presented in [
35] could be exploited here.
DHI is a number going from one (unaged, design conditions) to 0 (incoming failure), varying with time under stress, t, which is defined through diagnostic quantities, in this case the extent and type of PD.
DHI estimation starts from the identification of each prevailing PD class i, (i = 1, …, 3, according to
Table 1), and defining the global reliability,
RPc, as [
27,
36]
which becomes, considering absolute value and
SCmin = 1 and the time dependence of the index,
where
DHIP(t) is the preliminary
DHI(t), and
Here,
Wk is the weight, i.e., harmfulness, of each PD phenomenon occurring in a machine according to
Table 1,
Sk is the score, i.e., the numeric ranks associated with the measured PD phenomenon, and
SCmax and
SCmin are maximum and minimum score values for the diagnostic indicators (typical values are, e.g., five and one, respectively). In the case of one diagnostic quantity, PD, and if only one subcomponent is present in reliability and weight expressions (2) and (3),
k is associated with the likelihood of surface or internal PD,
Pk; thus
k = 1 and 2, respectively (
P1 = likelihood of surface PD,
P2 = likelihood of internal PD).
Score can be defined conveniently by a quantity related to the damage caused by PD, i.e., a damage rate,
DR, which is given by the product of the average amplitude of discharges
A and their repetition rate
RR:
where “signs” is the sign of the quantity vs. time slope, that is, =1 if increasing, and =−1 if decreasing.
Pk is the likelihood percentage provided by the identification in the automatic analytics by the software,
A0 is a reference PD amplitude, and
RR0 is a reference repetition rate. Eventually, it can be written as
where
h < 1. As an example, if
Amax = 10
A0 and
RRmax = 50
RR0, then
h = 1/100. Notably, Equation (1) holds for one PD phenomenon (one cluster recognized as PD in the separation map) of a given identification, but it could hold also for more PD phenomena simultaneously active, i.e., more than one automatic cluster recognized due to PD. In this case, the total reliability can be defined as
where
Rc is the index associated with each PD cluster/sub-pattern. The final
DHI can be corrected by introducing an adjusting factor,
AF, based on the experience of previous failure/visual inspection/other diagnostic quantities as
Applying this innovative
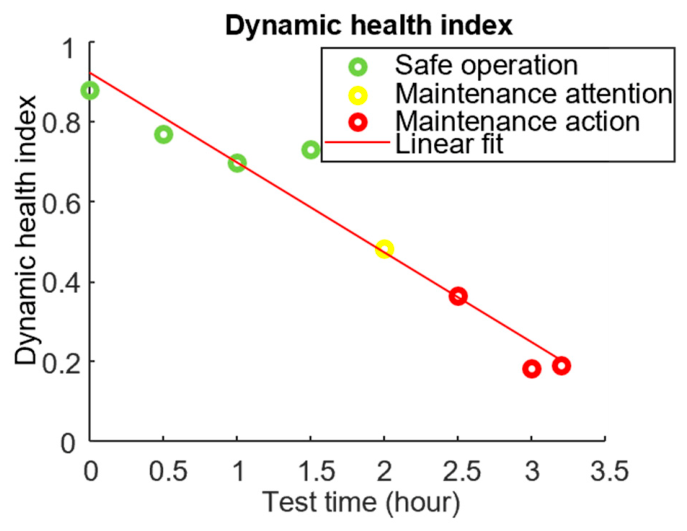
DHI approach to the results of motor PD monitoring shown in
Figure 17, with Pk behavior reported in
Figure 19 (Equation (4)), the
DHI time behavior of
Figure 20 is obtained (Equation (7) with
AF = 0). As can be seen,
DHI displays a reasonably liner decrease, which would allow end points to be established and, consequently, maintenance actions. As an example, the color scheme shown in
Figure 20 defines three zones, corresponding to different end points: green, till
DHI = 0.7, where the system is still considered functional, yellow (
DHI down to 0.4) where maintenance has to be planned, and red, below 0.4, where maintenance must be performed, otherwise premature failure can be expected. End-point values can change, depending on the electrical asset component (and their values must be established by accelerated life testing), but they can be considered a solid reference for a specific type of electrical asset component (e.g., Type I motor as in the case dealt with here).
In addition to the results discussed above, the applicability of the developed DHI algorithm has been further verified through experiments performed on multiple motor types, as well as on flat insulation specimens. These tests have consistently confirmed the robustness and reliability of the approach across different insulation systems and operating conditions, supporting the findings reported here. Due to space constraints, these additional results are not presented in the current manuscript; however, they will be detailed in future work to provide broader statistical validation and deeper analytical insight into the proposed index performance.
7. Conclusions
The approach presented here, being automatic and able to extract PD pulses from switching noise, even for high slew rates, seems to be able to fill a gap in PD technology, that is, the relation between PD measurements and insulation system design and diagnostics. This would be extremely useful in order to improve the design and reliability of E-vehicles and, in general, of any electrical component in electrified transportation assets. Innovation brought about by time-domain PD pulse extraction and SRID would allow to detect, analyze and identify the type of defect generating PD, reject all types of noise, trend PD parameters and output a simple, summarizing quantity, the dynamic health index, that can be the basis for any maintenance action.
It is worthwhile, as a final note, to highlight that this approach has potential for both off-line testing, as for quality control of motors or health index evaluation at any maintenance time of the electric vehicle (time-based or condition-based), not only for on-line monitoring.