1. Introduction
Student dropout has been recognized as one of the most complex and important issues in higher education systems [
1,
2,
3]. Students who leave university without completing a degree may face limited employment opportunities and lower income prospects. From a social perspective, student dropout may increase costs related to re-employment training, unemployment support, and other welfare programs. From a university perspective, dropout can also lead to direct financial losses and reduced educational sustainability. To address this issue, many studies have developed machine learning models for predicting student performance, graduation, or dropout in higher-education and technology-mediated learning environments [
4,
5,
6].
In practical university settings, dropout prediction models are often used to generate candidate lists of students who may require academic support or counseling. Therefore, model evaluation should not be limited to prediction accuracy alone. A useful candidate list should include a sufficient number of actual dropout students while remaining manageable for institutional intervention. This requirement creates a practical trade-off between dropout candidate coverage and counseling burden.
Most existing studies have selected the best model using accuracy-oriented metrics such as accuracy, precision, recall, or the F1 score. Although these metrics are useful for evaluating classification performance, they do not directly indicate whether the resulting candidate list is suitable for intervention planning. For example, a model with the highest F1 score may produce a compact and accurate candidate list, but it may exclude some actual dropout students who could have been identified by a slightly larger list. Conversely, a model with higher recall may include more actual dropout students, but it may also increase false positives and counseling burden.
This study addresses this issue by formulating student dropout prediction as a candidate-list construction problem under limited institutional resources. Rather than assuming that prediction results directly lead to dropout reduction, we focus on whether actual dropout students are included in the candidate list. In this setting, true positives represent actual dropout students covered by the candidate list, while false positives contribute to additional counseling burden. The objective is therefore not to maximize a single performance metric, but to select a model and decision threshold that provides a favorable balance between the candidate coverage and the list size.
To achieve this, we first show that given a set of candidate models, a model with the highest recall maximizes the dropout candidate coverage. Based on this observation, the target coverage is determined using the model. We then adjust the classification thresholds of other models so that they satisfy the target value. To reduce the risk of test-set-based threshold optimization, threshold adjustment is performed using only the training and validation datasets, without using the test dataset. After threshold adjustment on the validation folds, the candidate models are evaluated under the same or similar target coverage conditions. In this case, the model with the highest precision minimizes false positives, i.e., the size of the candidate list. Therefore, we select the model as a solution to provide a balanced candidate list. The method was evaluated using 28 candidate models implemented with various machine learning algorithms and sampling settings. As learning data, academic records collected from 20,050 students at a four-year university in Seoul, Republic of Korea, were used.
The contributions of this paper can be summarized as follows:
We review existing studies on university-level student dropout prediction and discuss their common reliance on accuracy-oriented evaluation metrics such as the F1 score.
We formulate the practical trade-off between the dropout candidate coverage and counseling burden, emphasizing that the model with the highest F1 score alone does not necessarily provide the most useful candidate list for institutional intervention.
We present a method to determine the target coverage and model-specific classification thresholds to find a solution model that provides a balanced candidate list. The target coverage and thresholds are determined using only the training and validation datasets, while the test dataset is reserved strictly for final evaluation.
The method was evaluated using 28 candidate models implemented with various machine learning algorithms and sampling settings. For comparison, the solution model was evaluated against two reference models: the default highest-F1 model and the validation-derived threshold-tuned highest-F1 model.
We provide additional analyses, including validation-based hyperparameter tuning, repeated-seed robustness analysis, SHAP-based interpretation of the solution model, and Jaccard similarity analysis of selected candidate lists, to examine robustness, interpretability, and candidate-list stability of the proposed method.
The remainder of this paper is organized as follows.
Section 2 reviews related work.
Section 3 presents the materials and methods, including the problem formulation, model selection procedure, candidate models, dataset, and evaluation protocol.
Section 4 reports the experimental results.
Section 5 discusses the findings, implications, and limitations of the proposed method.
Section 6 concludes the paper.
2. Related Work
Student Dropout Prediction (SDP) has been widely studied as an important application of machine learning in education, aiming to identify students at risk of dropout and support timely planning for interventions [
2]. Previous studies have used institutional administrative and academic records, including student registration information, personal and family background variables, academic performance indicators, and grade records, to estimate students’ risk of university dropout [
7]. Depending on the prediction target and application context, student dropout prediction studies can be broadly categorized into course-level dropout prediction and university-level dropout prediction. Course-level dropout prediction focuses on predicting withdrawal from a specific course or online learning program and has been actively investigated in MOOC settings, where course-level learning behavior logs and public benchmark datasets are relatively accessible [
8,
9]. By contrast, university-level dropout prediction aims to estimate whether a student will eventually leave the university, using institutional administrative and academic records such as registration information, personal and family background variables, academic performance indicators, and grade records [
7].
University-level dropout prediction often relies on institution-specific administrative and academic records, such as enrollment information, academic records, grades, attendance, scholarship records, tuition-related information, and counseling-related records [
10,
11,
12]. Because these data are generated and managed within individual universities, data availability and privacy considerations become important issues in this setting [
10]. Nevertheless, university-level dropout prediction is practically important because identifying potential dropout students can support retention policies, student counseling, academic assistance, and the efficient allocation of institutional resources [
10,
12].
Existing studies on higher-education decision support and university-level dropout prediction have applied a wide range of machine learning and deep learning algorithms to institutional academic and administrative data. These studies have demonstrated that university-held data can be used to support decision-making and identify students at risk of dropout. However, as summarized in
Table 1, prior studies have mainly focused on improving predictive performance, handling class imbalance, modeling semester-level records, or enhancing explainability. Relatively few studies have explicitly formulated dropout prediction as an operational candidate-list construction problem that jointly considers dropout candidate coverage and counseling burden under limited institutional resources.
Class imbalance is an important evaluation issue in student dropout prediction. In many educational settings, dropout students account for only a small proportion of the total student population, making the dropout class the minority class. In such cases, accuracy alone can be misleading because a model may appear to perform well by correctly classifying the majority class while failing to identify actual dropout students. Prior studies have therefore used evaluation metrics, such as precision, recall, F1-score, ROC curves, and precision–recall curves, or have applied data-level imbalance handling methods such as SMOTE, ADASYN, SMOTE + Tomek, and SMOTE + ENN to mitigate the class imbalance problem [
11,
12,
16,
21].
Barros et al. further showed that, under imbalanced educational data, performance interpretation can be sensitive to the label setting and evaluation perspective. Their study discusses the “accuracy paradox,” where a high accuracy value does not necessarily indicate a high-quality model when the minority class is not properly identified [
22]. In a university-level setting, Kim et al. proposed an SDP system that combines an XGBoost model trained with SMOTE for high dropout precision and a CatBoost model trained with a SMOTEENN-based resampling strategy for high dropout recall [
12]. Cho et al. examined SMOTE, ADASYN, and Borderline-SMOTE and reported that oversampling did not consistently improve F1-score across models [
11]. These studies contributed to improving classification performance under class imbalance, but they did not explicitly formulate the counseling burden that arises when prediction results are used to construct a counseling candidate list.
In addition, the practical outcome of a dropout prediction model depends heavily on the classification threshold. Most predictive models produce a dropout probability or risk score for each student, and students whose scores exceed a given threshold are classified as dropout candidates. Lowering the threshold can include more actual dropout students in the candidate list, thereby increasing recall and true positives. However, it can also increase false positives and expand the number of students selected for counseling, which may impose additional burdens on limited counseling staff and administrative resources. Conversely, raising the threshold can reduce the candidate-list size, but it increases the risk of excluding students who may require intervention. Therefore, threshold selection is not merely a post-processing step; rather, it determines the trade-off between dropout candidate coverage and counseling burden.
Classification threshold selection has also been discussed as an important issue in cost-sensitive learning and operational classification. Elkan argued that different types of misclassification errors can incur different costs and that optimal decisions should be made by minimizing expected cost based on class probability estimates rather than relying on a fixed default threshold [
23]. Similarly, Provost and Fawcett noted that, in real-world environments, class distributions, misclassification costs, and target operating conditions may be imprecise or subject to change. They further discussed classifier evaluation in relation to various operational metrics, including accuracy, expected cost, precision, recall, and workforce utilization [
24]. These studies support the view that threshold selection is not merely a post-processing step but an important procedure for adapting model outputs to operational constraints.
In university dropout prediction, a predictive model is not only used to classify students as dropouts or non-dropouts but can also support the construction of a candidate list of students who may require counseling or academic assistance. Kim et al. explicitly connected dropout prediction to student counseling and proposed an SDP system that aims to improve dropout precision and recall for university-level intervention [
12]. From this perspective, true positives correspond to actual dropout students included in the candidate list, which can be interpreted as dropout candidate coverage. In contrast, false positives correspond to students who are selected as counseling candidates but do not eventually drop out, thereby increasing the counseling burden. Therefore, a practically useful dropout prediction model should not be evaluated only by a single classification metric such as F1-score. Instead, it should include a sufficient number of actual dropout students while keeping the candidate-list size within a manageable range for institutional counseling resources.
In educational data mining, several studies have used prediction outputs to prioritize students under limited intervention resources. Lakkaraju et al. proposed a machine learning framework for identifying students at risk of adverse academic outcomes and emphasized the need to rank students by risk estimates when schools can intervene with only a limited number of students [
25]. Aguiar et al. also proposed a prioritization approach for students at risk of not graduating high school on time, focusing on who should be selected, when they should be supported, and why they are at risk [
26]. In addition, Purdue University’s Course Signals demonstrated how learning analytics-based risk indicators can be connected to early intervention actions such as feedback messages, reminders, referrals to academic advisors or resource centers, and face-to-face meetings [
27]. Early warning system studies have similarly focused on identifying at-risk students early enough to support timely intervention [
21,
28].
However, these studies mainly focus on early warning, student prioritization, course-level intervention, or high-school-level intervention. They do not directly address the problem of selecting a university-level dropout prediction model by jointly considering dropout candidate coverage and candidate-list size under validation-derived operating conditions. Existing university-level dropout prediction studies have generally compared and selected models using classification-oriented metrics such as accuracy, precision, recall, F1-score, sensitivity, or AUC [
10,
12]. These metrics are useful for evaluating predictive performance, but they do not directly answer an operational question faced by universities: how many students should be selected as counseling candidates while maintaining sufficient coverage of actual dropout students?
A model with the highest F1-score may provide a balanced trade-off between precision and recall, but it may not necessarily generate the most appropriate candidate list under limited counseling resources. Conversely, a high-recall model may include more actual dropout students, but it can also increase false positives and expand the counseling workload. Therefore, the highest-F1 model is not always the most useful model for counseling-oriented dropout intervention. This gap motivates the need to reformulate university-level dropout prediction as a candidate-list construction problem rather than a simple classification performance maximization problem.
To address this gap, this study proposes a validation-derived model selection framework that balances dropout candidate coverage and counseling burden. Instead of selecting a model solely based on the highest F1-score, the proposed framework derives target coverage and model-specific thresholds from the training and validation data and then selects a solution model that can reduce candidate-list size under the same or similar coverage conditions. In this respect, the present study extends prior university-level dropout prediction research by explicitly considering candidate-list construction for institutional intervention planning.
3. Materials and Methods
This section describes the formulation of dropout candidate-list construction, the proposed validation-derived model selection procedure, the candidate models, the dataset, and the experimental protocol.
3.1. Background
Student dropout prediction (SDP) can be formulated as a binary classification problem. Let denote the given input data, which is divided into a training/validation dataset and a test/evaluation dataset . The former is used for model training, classification threshold estimation, and final model selection, while the latter is used only once for final performance evaluation. For each sample , let be the ground-truth label, where indicates a dropout student, and otherwise. A model estimates a dropout probability for . Given a classification threshold , the predicted label is assigned as 1 if , and 0 otherwise.
The main symbols used in this paper are summarized in
Appendix A.1. To evaluate the classification performance of a model on a given evaluation dataset, the confusion matrix consisting of
,
,
, and
is commonly used.
is the number of true positive samples whose labels are predicted as positive
and are actually positive
.
is the number of false positive samples whose labels are predicted as positive
but are actually negative
. In SDP, dropout students are treated as the positive class. Thus,
represents the number of students who were predicted as dropout candidates and actually dropped out. Similarly,
represents the number of students who were predicted as dropout candidates but did not drop out.
and
can be interpreted in the same manner. Then, the total number of samples in a given evaluation dataset can be expressed as
The number of samples belonging to the positive and negative classes, denoted as NP and NN, respectively, can be represented as follows:
Accuracy is one of the most widely used metrics and is defined as the number of correctly predicted samples divided by the total number of samples:
However, accuracy can be misleading when the data are highly imbalanced. Consider a dataset with a dropout rate of 5%. A classifier that predicts all samples as non-dropout can still achieve 95% accuracy, although it fails to identify any dropout students. Conversely, a classifier that predicts all samples as dropout would achieve only 5% accuracy. This example shows that and should be considered together when evaluating model performance.
Precision reflects the reliability of positive predictions and is sensitive to false positives. It is defined as the proportion of positive predictions that are actually correct:
Recall reflects the proportion of actual positive samples that are correctly identified and is therefore sensitive to false negatives. It is also called the true positive rate (TPR):
To jointly consider precision and recall, the F1 score is commonly used. It is defined as the harmonic mean of precision and recall:
As discussed in
Section 2, dropout prediction studies often involve skewed class distributions and therefore commonly use the F1 score for model evaluation. However, as discussed in this paper, the F1 score alone may not fully reflect the usefulness of the candidate list for institutional intervention.
3.2. Problem Formulation
This study aims to identify a dropout prediction model that provides a practically useful candidate list for institutional intervention. Unlike conventional model selection based primarily on accuracy-oriented metrics, the proposed formulation considers two aspects simultaneously: dropout candidate coverage and candidate-list size. Dropout candidate coverage reflects how many actual dropout students are included in the candidate list, whereas the candidate-list size represents the number of students who may require counseling or academic support.
No counseling intervention was conducted in this study. Counseling burden refers to the expected institutional workload implied by the size of the predicted dropout candidate list.
Because this study does not include post-intervention counseling outcome data, we do not directly estimate the actual reduction in student dropouts. Instead, we focus on whether actual dropout students are included in the candidate list generated by the model. Under this setting, the number of true positives, , represents the number of actual dropout students covered by the candidate list. Therefore, increasing improves dropout candidate coverage, but it may also increase and consequently enlarge the candidate list.
Accordingly, the practical objective is to achieve a favorable trade-off between and . A larger indicates that more actual dropout students are covered by the candidate list, whereas a smaller indicates a lower counseling burden. Since increasing often requires lowering the classification threshold, it may also increase . Therefore, the problem is not to maximize a single metric but to select a model and threshold that provide a suitable balance between coverage and burden.
Let denote a set of candidate models, where each model produces a dropout probability for each sample . Given a classification threshold , is included in the candidate list if . The following observations clarify the relationship among , recall, precision, and the candidate-list size.
Observation 1. For a given evaluation dataset, and recall are proportional because the number of actual positive samples is fixed.
Proof. Let denote the number of actual positive samples in the dataset. Then, recall is defined as . Since is fixed for the dataset, recall increases as increases, and vice versa. Therefore, and recall are proportional on the same evaluation dataset. □
Observation 2. When two candidate lists cover the same number of actual positive samples, the list with higher precision has a smaller candidate-list size.
Proof. Precision is defined as , where is the candidate-list size. If two models have the same , a higher precision implies a smaller denominator, . Therefore, among the candidate lists with the same , the list with higher precision is always smaller. □
Observation 1 indicates that increasing is equivalent to increasing recall on the same evaluation dataset, which corresponds to improving dropout candidate coverage. Observation 2 indicates that, when the same or coverage is considered, precision can be used to identify a model that provides a smaller candidate list. These two observations motivate the proposed model selection scheme. In what follows, we discuss how to select a solution model that provides a balanced dropout candidate list.
3.3. Model Selection Procedure
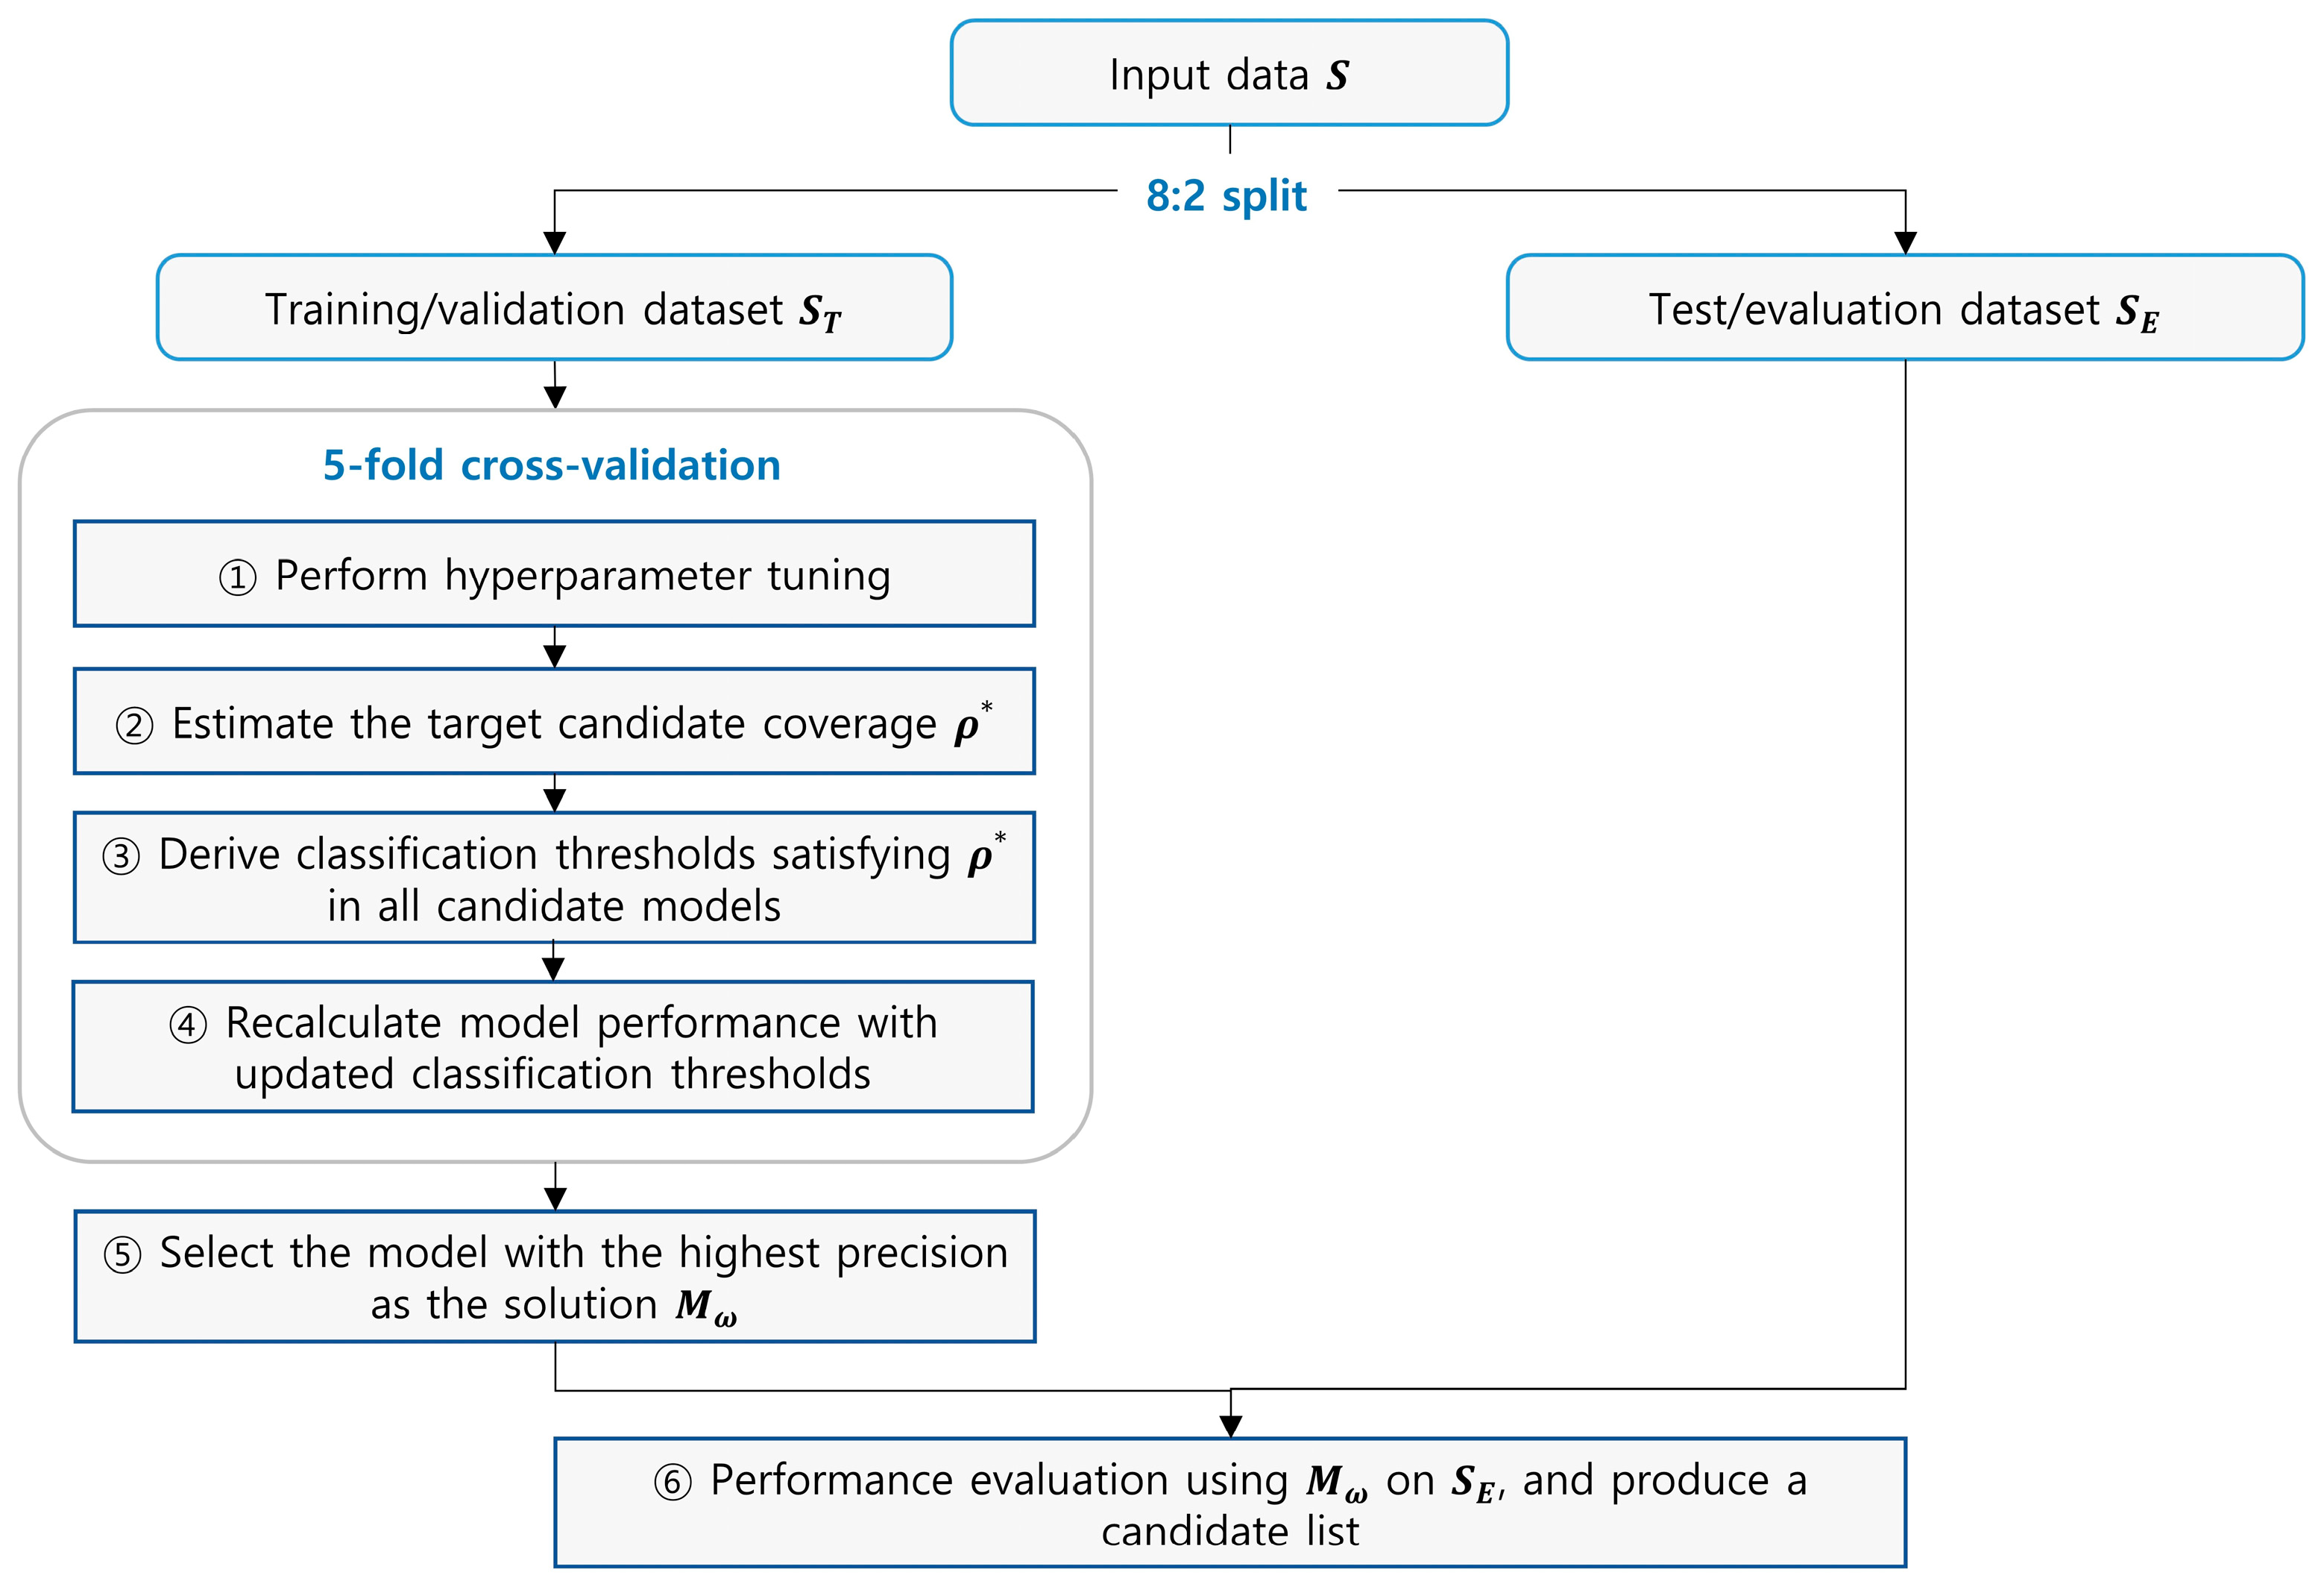
The basic idea of the proposed method is simple. Let denote the model with the highest recall. From Observation 1, we set the recall of as a target value to maximize the dropout candidate coverage. We then adjust the classification thresholds of other models to satisfy the target coverage. After the threshold adjustment, the recall of all models becomes similar or nearly the same. This implies that all models provide the same or similar if they are evaluated on the same dataset. In this case, from Observation 2, the model with the highest precision minimizes . Therefore, we finally select the model as a solution and produce the dropout candidate list using the model.
The target candidate coverage and classification thresholds are determined during the training/validation stage. To obtain a stable and robust model, -fold cross-validation was applied in this stage, and the calculation of the two factors is influenced by this process. For example, the target candidate coverage, denoted as , is calculated as an average of validation results. Since -fold cross-validation is applied, the training/validation dataset is divided into the equal-sized subsets. Then, the recall of model is calculated as an average of the recall values obtained from the subsets. After the average recall of all models is obtained, the highest value is selected as .
The derivation of classification thresholds is also affected by the cross-validation process. To find the threshold satisfying in , we first calculate corresponding to . Since each subset in may have a different number of positive samples, the is calculated differently for each subset. Let the of for the -th subset be . Then, can be calculated as , where is the number of positive samples in the -th subset. After obtaining , a scanning process begins to find the threshold corresponding to . The validation samples in are sorted by predicted dropout scores. If the cumulative number of actual dropout students reaches at a certain score, the scanning process is stopped and the score is selected as the threshold for the -th fold, . Once the process for all subsets is complete, the average of the thresholds is calculated, and this is set as a new threshold for .
Since the classification threshold of the model has been updated, its performance is recalculated on
. After the performance of all models is updated with their new thresholds, the model with the highest precision is selected as the final solution,
.
Figure 1 summarizes the model selection procedure in the proposed method. For each step from 1 to 4, five-fold cross-validation was applied. The hyperparameter tuning step is discussed in
Section 3.4.
3.4. Candidate Models and Implementation
To construct the candidate model set U, we combined seven machine learning algorithms with four sampling settings. The machine learning algorithms included the decision tree (DT), support vector machine (SVM), deep neural network (DNN), random forest (RF), XGBoost (XGB), CatBoost (CB), and LightGBM (LGBM). The sampling settings consisted of the original imbalanced data, SMOTE [
29], Borderline-SMOTE (BL-SMOTE) [
30], and ADASYN [
31]. Thus, a total of 28 candidate models were implemented and evaluated under the proposed method.
Hyperparameter tuning was performed only within the training/validation stage. Specifically, a limited validation-based grid search was conducted for DT, RF, DNN, XGB, CB, and LGBM. The test dataset was not used during the hyperparameter tuning. For each model, candidate hyperparameter combinations were evaluated using five-fold stratified validation, and the configuration with the highest mean validation F1 score at the default threshold of 0.5 was selected.
A limited grid search was used instead of an exhaustive, large-scale search to maintain a feasible computational cost while reducing the dependence of the results on arbitrary default hyperparameters. SVM was not included in the hyperparameter search because of its computational cost in the current experimental setting. Therefore, SVM was implemented using LinearSVC with fixed settings. Since LinearSVC does not provide calibrated probability estimates, its decision_function output was transformed into a monotonic score in the range of 0 to 1 and used for threshold-based candidate-list construction.
The hyperparameter search space and selected settings used in the experiments are provided in
Appendix A.2. When the selected settings differed across sampling settings, the selected values are reported separately. When the same value was selected for all sampling settings, a single value was reported.
The tree-based and boosting models were implemented using standard Python libraries, including DecisionTreeClassifier, RandomForestClassifier, XGBClassifier, CatBoostClassifier, and LGBMClassifier. The DNN model was implemented using Dense layers with ReLU activation in the hidden layers and a sigmoid activation in the output layer. The SVM model was implemented using LinearSVC with fixed settings, and its decision_function output was used as a monotonic score for threshold-based candidate-list construction. All candidate models were trained and evaluated within the same validation-derived method. The experiments were conducted using Python 3.12.3, scikit-learn 1.8.0, imbalanced-learn 0.14.1, XGBoost 3.2.0, CatBoost 1.2.10, LightGBM 4.6.0, TensorFlow 2.21.0, Keras 3.14.1, SHAP 0.51.0, NumPy 2.4.4, and pandas 3.0.3.
3.5. Dataset
To validate the proposed method, we used academic records collected from a four-year university in Seoul, Republic of Korea. The original dataset contained 20,050 student records. After preprocessing and excluding records with missing or invalid values, 19,717 records were used in the experiments. Among these records, 2524 were dropout students, resulting in a dropout rate of approximately 12.80%.
The dataset was divided into a training/validation dataset and a test/evaluation dataset with a ratio of 8:2. The former contained 15,773 records, including 2019 dropout students. The latter contained 3944 records. The actual number of dropout students in the test dataset was 505; this value was used only for final performance evaluation and was not used to determine the target candidate coverage, classification thresholds, or final model selection.
The input data consisted of student-level variables and semester-level variables. Student-level variables were used directly as input features. Semester-level variables were expanded into fixed-length semester-wise features after arranging each student’s semester records in reverse chronological order. For example, the semester-level variable GPA was expanded into GPA_Sem1 to GPA_Sem8, where Sem1 represents the most recent semester position and Sem8 represents the oldest retained semester position. This representation enables the candidate models to use semester-wise academic information while maintaining a fixed input dimension. In total, the final input contained 92 features, consisting of 4 student-level features and 88 semester-level features. The feature names listed in
Table 2 are the same as those used in the SHAP analysis in
Section 4.4. The target variable was the final student status, where dropout students were labeled as 1 and non-dropout students were labeled as 0.
Table 2 summarizes the input variables used for model training.
3.6. Evaluation Metrics and Statistical Analysis
Model performance was evaluated using true positives (), false positives (), false negatives (), precision, recall, F1 score, and candidate-list size. In this study, represents the number of actual dropout students included in the predicted candidate list, whereas represents the number of non-dropout students included in the candidate list. Candidate-list size was calculated as .
Dropout candidate coverage was evaluated using recall, because recall measures the proportion of actual dropout students included in the candidate list. Candidate-list burden was evaluated using candidate-list size and . Precision was used to assess how efficiently the candidate list included actual dropout students under a given coverage condition.
Candidate-list overlap was assessed using Jaccard similarity. For the repeated-seed robustness analysis, the full experimental procedure was repeated using 30 different random seeds. Wilcoxon signed-rank tests were used to compare the proposed method with the threshold-tuned highest-F1 baseline across the repeated runs.
4. Results
4.1. Baseline Model Performance
Before evaluating the proposed method, we first selected a reference model for performance comparison. To simplify the discussion, the model with the highest F1 score is adopted as the default baseline. To find the model, the 28 candidate models were evaluated on the validation folds using the default decision threshold of 0.5. In this experiment, the LightGBM + ADASYN model showed the best performance.
On the test dataset, the LightGBM + ADASYN baseline model achieved = 438, = 42, = 67, precision = 0.913, recall = 0.867, F1 score = 0.889, and a candidate-list size of 480.
Although this baseline model achieved strong precision and F1 performance, it covered only 438 of the 505 actual dropout students in the test dataset. This result indicates that the best-F1 model can provide a compact and accurate candidate list, but it may still exclude some actual dropout students.
4.2. Validation of the Proposed Method
The proposed method was applied to the 28 candidate models using only the training/validation dataset. First, we identified the model with the highest recall to determine the target candidate coverage. In this experiment, the SVM + ADASYN model achieved the highest average validation recall of 0.935. Therefore, the target coverage was determined as 0.935.
After the model-specific thresholds were obtained and model performance was recalculated, we compared the validation precision of the models to identify the final solution. The LGBM + SMOTE model achieved the highest mean validation precision of 0.839 while maintaining a validation recall comparable to the target coverage. Therefore, the LGBM + SMOTE model was selected as the final solution model because it provided the most favorable validation-level balance between dropout candidate coverage and candidate-list size.
After the solution model was determined using the training/validation dataset, the model was applied to the test dataset to obtain the final candidate list. The model achieved = 474, = 95, = 31, precision = 0.833, recall = 0.939, F1 score = 0.883, and a candidate-list size of 569.
Compared with the baseline model with the highest F1 score, the proposed method increased dropout candidate coverage from 0.867 to 0.939, identifying 36 additional actual dropout students. This improvement was accompanied by an increase in false positives from 42 to 95 and an increase in candidate-list size from 480 to 569. This result indicates that the proposed method intentionally shifts model selection from maximizing the default F1 score alone toward increasing dropout candidate coverage under a manageable candidate-list size.
To examine whether the improvement could be obtained simply by threshold tuning of a strong single model, we also compared the proposed method with a threshold-tuned single-model baseline. For this purpose, the highest-F1 model was retained for threshold tuning, and the same threshold selection procedure discussed in
Section 3.3 was applied to the model. The threshold-tuned model achieved
= 469,
= 101,
= 36, precision = 0.823, recall = 0.929, F1 score = 0.873, and a candidate-list size of 570 on the test dataset.
Table 3 compares the performance of the proposed method with the two baseline models in the main experimental split.
Compared with the threshold-tuned highest-F1 baseline, the proposed model identified 5 additional dropout students, reduced false positives by 6, and reduced the candidate-list size by 1. It also improved precision from 0.823 to 0.833 and F1 score from 0.873 to 0.883. Although this improvement was modest, the result suggests that the proposed method can provide a favorable coverage-burden balance in the main experimental split. To further examine whether this comparison was dependent on a particular random split, we conducted an additional repeated-seed robustness analysis.
4.3. Hyperparameter Tuning Analysis
To reduce the reliance of experimental results on arbitrary default hyperparameters, a limited validation-based grid search was conducted within the training/validation stage. The test dataset was not used during this process. The hyperparameter search space and selected settings for the experiments are provided in
Appendix A.2.
The final selected solution model belonged to the LGBM family, and the LGBM models showed consistently strong validation performance across sampling settings. Among the models evaluated at the default threshold of 0.5, the LGBM + ADASYN model achieved the highest F1 score of 0.902, followed closely by the LGBM + SMOTE model with an F1 score of 0.901. The difference between these models was small, indicating that the strong validation performance of the LGBM models was not limited to a single sampling setting.
It should be noted that the proposed method does not select the final solution model solely by maximizing the validation F1 score at the default threshold. Instead, after fold-specific validation-derived thresholds were applied to approximate the target coverage, the final model was selected based on the mean validation precision. Under this procedure, the LGBM + SMOTE model was selected as the final solution model because it achieved the highest mean validation precision under the target coverage. This result shows that the proposed method incorporates the coverage-burden trade-off after threshold derivation, rather than simply selecting the model with the highest validation F1 score.
4.4. SHAP-Based Interpretation of the Solution Model
To improve the interpretability of the selected solution model, a SHAP-based analysis for the LGBM + SMOTE model was conducted. This analysis was conducted only as a post hoc interpretation of the already fixed final model. It was not used for hyperparameter tuning, threshold selection, target coverage estimation, or final model selection.
The SHAP analysis was conducted using 2000 samples from the test dataset. Since the final model and its threshold had already been fixed before this analysis, the use of these samples was limited to model interpretation. The selected model used 92 input features, consisting of 4 student-level features and 88 semester-level features. The feature names used in the SHAP analysis correspond to the input variable names summarized in
Table 2.
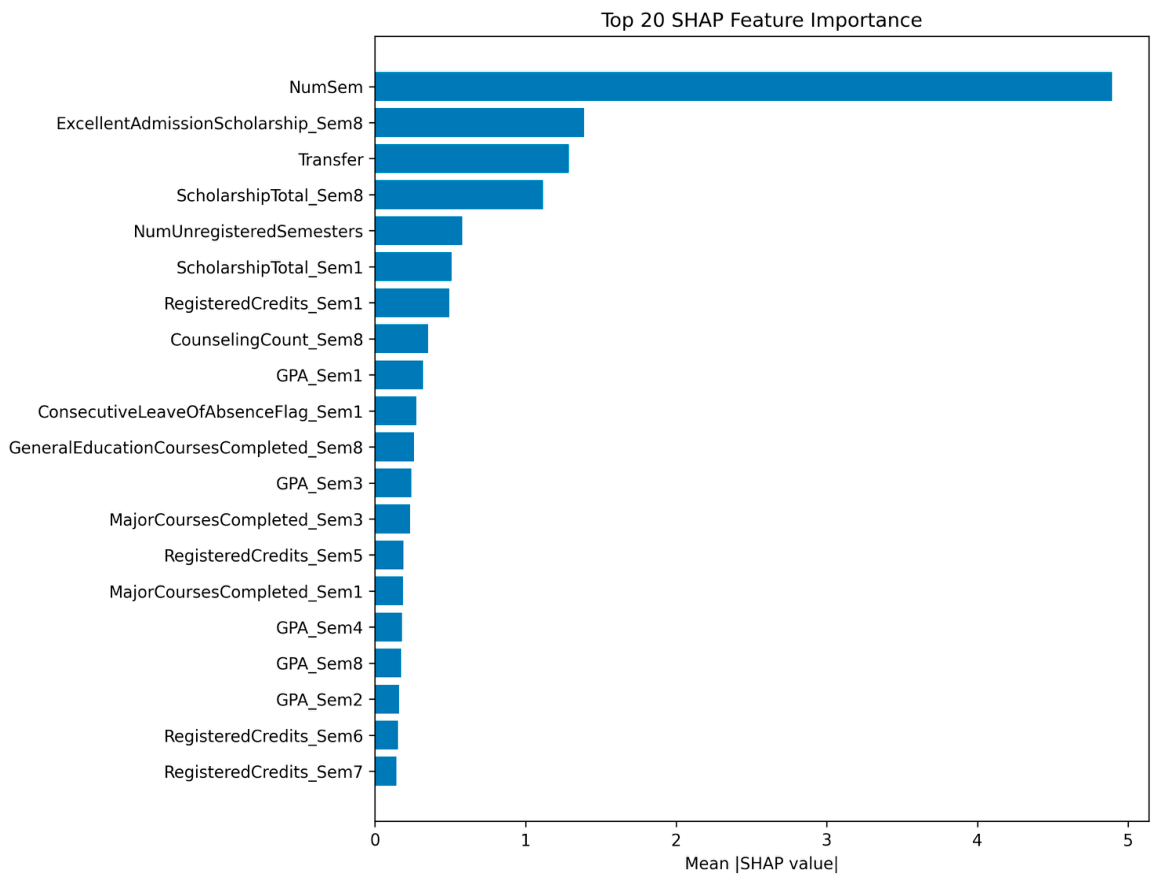
At the group level, semester-level features accounted for 58.18% of the total mean absolute SHAP importance, whereas student-level features accounted for 41.82%. This result indicates that the selected solution model used both student-level information and semester-wise academic variables, with semester-level information contributing slightly more to the model output.
Figure 2 presents the top 20 features ranked by mean absolute SHAP value.
The most influential feature was NumSem, followed by ExcellentAdmissionScholarship_Sem8, Transfer, ScholarshipTotal_Sem8, and NumUnregisteredSemesters. The remaining top-ranked features included scholarship-related variables, registered-credit variables, counseling count, GPA-related variables, course-completion variables, and a consecutive leave-of-absence flag. These results suggest that the final selected model relied on both student-level information and semester-level academic records when estimating dropout risk. Because ScholarshipTotal was binarized during preprocessing, the corresponding SHAP importance should be interpreted as the contribution of scholarship receipt rather than the raw scholarship amount.
It should be noted that SHAP values explain the contribution of features to model predictions and do not imply causal relationships. Therefore, the results should be interpreted as model-level evidence of which variables were influential in estimating dropout probability, rather than as evidence that changing a specific feature would directly reduce dropout.
4.5. Candidate-List Stability Analysis
To examine the stability of the selected candidate lists, we conducted a Jaccard similarity analysis. The Jaccard similarity measures the overlap between two candidate lists and is defined as the size of their intersection divided by the size of their union. In this study, the final candidate list generated by the proposed LGBM + SMOTE model was compared with the candidate lists generated by the two baseline models shown in
Table 3.
The proposed candidate list showed a Jaccard similarity of 0.844 with the highest-F1 baseline and 0.950 with the threshold-tuned highest-F1 baseline. These values indicate that the proposed method did not generate an unstable or substantially unrelated candidate list. Instead, the proposed list largely overlapped with those of strong baseline models while improving the balance between dropout candidate coverage and counseling burden.
The overlap with the threshold-tuned highest-F1 baseline was particularly high. Although the proposed method selected LGBM + SMOTE and the threshold-tuned highest-F1 baseline used LGBM + ADASYN, the two candidate lists had 555 students in common, with a Jaccard similarity of 0.950. This result indicates that, in the main experimental split, the proposed method produced a candidate list that was highly consistent with a strong threshold-tuned baseline, while achieving higher dropout candidate coverage, fewer false positives, and a slightly smaller candidate list, as shown in
Table 3.
Across all compared candidate lists, the mean Jaccard similarity with the proposed candidate list was 0.769, with a standard deviation of 0.150. The minimum and maximum values were 0.144 and 1.000, respectively. The minimum value was associated with a candidate list that was much broader than the proposed list. Overall, these results suggest that the proposed method provides a stable candidate-list construction strategy relative to the compared candidate lists.
4.6. Repeated-Seed Robustness Analysis
To examine whether the comparison with the threshold-tuned highest-F1 baseline was dependent on a particular random split, we repeated the full experimental procedure using 30 different random seeds. For each seed, the training/test split, validation-based target coverage estimation, model-specific threshold derivation, final model selection, and test evaluation were performed independently. Therefore, this analysis evaluates the robustness of the entire validation-derived selection procedure rather than the stability of a fixed threshold obtained from a single split.
As shown in
Table 4, the proposed method achieved a mean
of 471.13 and a mean recall of 0.933, while the threshold-tuned highest-F1 baseline achieved a mean
of 471.67 and a mean recall of 0.934.
5. Discussion
The experimental results show that selecting a dropout prediction model solely by the highest F1 score may not provide the most appropriate candidate list for institutional intervention. The default highest-F1 baseline, LGBM + ADASYN, achieved high precision and a relatively compact candidate list under the default threshold of 0.5. However, it covered only 438 of the 505 dropout students in the test dataset, corresponding to a dropout candidate coverage of 0.867. This indicates that the model with the highest F1 score can provide an accurate candidate list, but it may still exclude additional actual dropout students.
The proposed method increased dropout candidate coverage compared with the default highest-F1 baseline. Specifically, the proposed LGBM + SMOTE model covered 474 actual dropout students, increasing recall from 0.867 to 0.939. This improvement required a larger candidate list and more false positives, which reflects the inherent trade-off between dropout candidate coverage and counseling burden. Therefore, the proposed method should not be interpreted as improving all classification metrics. Rather, it intentionally shifts model selection toward higher candidate coverage while keeping the candidate-list size manageable.
The comparison with the threshold-tuned highest-F1 baseline further clarifies the contribution and limitation of the proposed method. In the main experimental split, the threshold-tuned LGBM + ADASYN model achieved a dropout candidate coverage of 0.929 with a candidate-list size of 570, whereas the proposed LGBM + SMOTE model achieved a higher coverage of 0.939 with a slightly smaller candidate list of 569 students. However, because the difference in the main split was modest, we additionally performed a repeated-seed robustness analysis.
Across 30 random seeds, the proposed method did not significantly increase or recall compared with the threshold-tuned highest-F1 baseline. Instead, it maintained comparable dropout candidate coverage while significantly reducing false positives and candidate-list size. It also improved precision and F1 score. Therefore, the proposed method should be interpreted as improving candidate-list efficiency under comparable coverage, rather than as consistently maximizing dropout candidate coverage beyond the threshold-tuned baseline.
The candidate-list stability analysis also supports this interpretation. The proposed candidate list had a Jaccard similarity of 0.950 with the threshold-tuned highest-F1 baseline, indicating that the two lists largely overlapped. However, the proposed method achieved a more efficient candidate-list construction within this highly similar candidate pool, particularly by reducing false positives and candidate-list size under comparable coverage. This suggests that the proposed method does not generate an unstable or substantially different candidate list but refines candidate-list construction by selecting a more suitable model under the validation-derived coverage target.
It is important to emphasize that the proposed method does not estimate the actual effect of counseling or academic intervention. Because post-intervention outcome data were not available, the analysis was limited to whether actual dropout students were included in the candidate list. Thus, the reported improvement should be interpreted as improved dropout candidate coverage and candidate-list construction, not as evidence of actual dropout reduction.
This study has several limitations. First, the experiments were conducted using data from a single university. Although the dataset contains a large number of student records, additional validation using datasets from other institutions is required to assess generalizability. Second, candidate-list size was evaluated as a proxy for counseling burden, but actual institutional burden may depend on staff availability, counseling intensity, intervention type, and follow-up procedures. Third, the proposed method assumes that including an actual dropout student in the candidate list is useful for intervention planning, but the actual effectiveness of the intervention depends on post-prediction institutional actions. Fourth, although the test dataset was not used for target coverage estimation, threshold derivation, or final model selection, the same validation folds were used for both threshold derivation and model selection. This may introduce limited validation-level optimism, and the results should therefore be interpreted as the final test evaluation of a validation-derived procedure rather than as evidence of a universally optimal operating point.
Overall, the results indicate that the proposed validation-derived method can support more transparent candidate-list construction by separating threshold estimation and model selection from final test evaluation.
6. Conclusions
This study investigated model selection for university student dropout prediction from the perspective of candidate-list construction. While previous studies have commonly selected models using accuracy-oriented metrics such as the F1 score, the practical use of dropout prediction models requires consideration of both dropout candidate coverage and counseling burden. To address this issue, we proposed a validation-derived model selection method in which the target candidate coverage, model-specific classification thresholds, and final solution model are determined using only training/validation data. The test dataset was reserved strictly for final performance evaluation.
Using academic records from 20,050 students, we evaluated 28 candidate models constructed from seven machine learning algorithms and four sampling settings. The proposed method selected LGBM + SMOTE as the final solution model. The selected model achieved = 474, = 95, = 31, precision = 0.833, recall = 0.939, F1 score = 0.883, and a candidate-list size of 569 on the test dataset.
Additional repeated-seed analysis over 30 random seeds showed that the proposed method maintained dropout candidate coverage comparable to the threshold-tuned highest-F1 baseline while significantly reducing false positives and candidate-list size. These results suggest that the proposed method can provide a practical model selection strategy for improving candidate-list efficiency while maintaining the target level of dropout candidate coverage. Importantly, the method does not use the test dataset for threshold estimation or model selection, thereby reducing the risk of test-set-based threshold optimization.
This study has several limitations. First, the experiments were conducted using data from a single university, and further validation using datasets from other institutions is required. Second, candidate-list size was used as a proxy for counseling burden, although actual intervention burden may vary depending on institutional resources and counseling procedures. Third, this study did not include post-intervention counseling outcome data, which limits the evaluation to candidate-list construction rather than actual dropout reduction.
Future research will extend the proposed method in three directions. First, we will validate the method using datasets from multiple institutions to examine its generalizability. Second, we will incorporate post-intervention outcome data when available to evaluate whether improved candidate-list construction leads to actual dropout reduction. Third, we will investigate adaptive intervention strategies that consider not only dropout risk but also institutional counseling capacity and student-specific intervention needs.