Article

Causal Graph-Enhanced Large Language Models for Automated Fault Diagnosis and Intelligent Operation and Maintenance in Distributed Computing Systems

1
School of Software Engineering, East China Normal University, Shanghai 200062, China
2
College of Energy Engineering, Zhejiang University, Hangzhou 310058, China
*
Author to whom correspondence should be addressed.
Electronics 2026, 15(11), 2359; https://doi.org/10.3390/electronics15112359
Submission received: 21 April 2026 / Revised: 11 May 2026 / Accepted: 26 May 2026 / Published: 29 May 2026

Abstract

Modern distributed computing systems face increasingly complex architectural evolution and potentially costly failures, calling for efficient and robust automated diagnosis to ensure the stability of large-scale data processing. Existing data-driven approaches are constrained by scarce labeled data and black-box behaviors, while expert-based knowledge-driven solutions suffer from high construction costs and insufficient coverage of dynamic scenarios, especially when domain expertise is limited. This work proposes a fault diagnosis framework that integrates a unified causal graph (UCG) with large language models (LLMs), leveraging a dual knowledge-driven and data-driven mechanism to construct causal graph representations and dynamically generate structured diagnostic reasoning chains-of-thought based on system state awareness. Here, “causal” is used in a restricted sense, combining knowledge-driven dependencies with data-driven statistical regularities. Experimental results indicate that, using GPT-4o as an example, this study achieves accurate fault identification across the eight evaluated fault scenarios within the controlled evaluation scope of this study. Labeled instances are partitioned using stratified sampling into 80% for training and 20% for held-out evaluation; the procedure is repeated five times with independent train–test partitions, and reported matching rates are averaged across these runs. Compared with baselines that rely solely on fault information or on symptom information, the fault matching rate improves by 41.4% and 33.5%, respectively. By tightly coupling structured causal logic with generative artificial intelligence, the approach significantly enhances the interpretability and reliability of the diagnostic process and provides high-value, expert-level support for intelligent operations and maintenance (O&M) in distributed computing systems.

1. Introduction

A distributed computing system refers to a software architecture or platform that coordinates and manages multiple independent computing components interconnected over a network, thereby presenting them to users as a unified, coherent entity. At its essence, this paradigm entails decomposing complex tasks into subtasks, scheduling them for parallel execution across multiple nodes, and aggregating results to enable efficient and robust large-scale data processing [1,2,3]. Amid the swift evolution of Internet technologies, distributed computing systems, which harness their superior efficiency, scalability, and dynamic processing attributes, exhibit substantial utility in both industrial and scientific domains within the big data era [4]. In practical industrial deployments, these systems grapple with fluctuating infrastructure resources while necessitating timely scaling to handle peak traffic loads. Moreover, as pivotal data processing entities, their computational precision is paramount. System failures can initiate cascading disruptions, progressing from localized anomalies to overarching crises, inflicting severe economic damage [5]. A notable case is the Amazon S3 outage on 28 February 2017, precipitated by configuration errors, which broadly impaired the S3 cloud storage service and put numerous websites offline; estimates indicate losses of at least $150 million for S&P 500 companies and $160 million in revenue for U.S. financial services firms [6]. Hence, ensuring the stability and availability of technologies are critical in distributed computing systems. Fault diagnosis technologies provide an effective strategy that efficiently conserves resources while promptly eliminating system faults.
Fault diagnosis constitutes a methodical procedure fundamentally focused on ascertaining whether a system, device, or service has malfunctioned and pinpointing the exact fault locus to underpin subsequent remediation and restoration. Contemporary fault diagnosis techniques for distributed computing systems are chiefly classified into two paradigms: data-driven and knowledge-driven approaches. Data-driven methods position data as the central asset and employ advanced artificial intelligence algorithms to automatically learn or discover associations between faults and symptoms from system runtime data. The primary artificial intelligence algorithms of data-driven models comprise supervised learning and unsupervised learning. Supervised learning entails harnessing labeled training datasets to derive mappings between input features and established output labels, thereby yielding predictive models; representative algorithms include decision trees, convolutional neural networks, and k-nearest neighbors [7,8,9]. Conversely, unsupervised learning analyzes unlabeled datasets to discern intrinsic structures, patterns, or correlations without external directives, prioritizing the exposition of the data’s inherent architecture over discrete outcome prediction [10]. Canonical unsupervised techniques include clustering and dimensionality reduction. Knowledge-driven methods replicate human experts’ domain knowledge, reasoning protocols, and specialized competencies to address complex tasks conventionally executed by specialists. These methods prominently feature two core constituents: serving as a repository for factual domain information, and an inference engine that generates novel inferences from preexisting knowledge via constructs such as if-then rules. Prevalent knowledge-driven techniques include diagnostic rules and Bayesian networks [11,12,13]. Industrial fault diagnosis in rotating machinery has also advanced few-shot cross-domain learning. For example, by combining model-agnostic meta-learning with genetic optimization for transportation motor bearings [14] and high-resolution time–frequency feature learning based on parameterized iterative time–frequency–multisqueezing transforms for bearing faults [15]. Graph neural networks (GNNs) have been increasingly studied for fault diagnosis by organizing multivariate operating signals into graphs and learning relational patterns among sensors or process variables [16]. In addition, related graph-convolutional architectures have also been explored for sensor fault detection and isolation in networked monitoring and digital-twin-style deployments, highlighting the role of explicit dependency modeling in operational reliability [17].
Although these methods have made substantial strides, they continue to confront significant challenges in practical deployments within distributed computing systems. Given the heterogeneous and context-specific nature of various distributed systems, algorithmic solutions require tailored development approaches for distinct operational scenarios, thereby impeding the transferability of fault diagnosis models and domain knowledge across different system architectures. As Jung observed, amassing representative training data that comprehensively captures all relevant faults proves both costly and protracted, often yielding datasets that inadequately encompass the full array of fault scenarios [18]. Moreover, supervised learning-based approaches frequently lack reliability due to their opacity. Knowledge-driven methods are profoundly dependent on domain experts’ specialized knowledge; for example, constructing such as knowledge graphs entails exorbitant costs. While fully manual construction assures precision, it exacts substantial labor and temporal investment [19]. Furthermore, knowledge-driven methods, besides their heavy dependence on human expertise and resources, also suffer from low accuracy, as rule-based systems and expert knowledge bases often fail to comprehensively cover diverse and complex fault scenarios in dynamic environments [20].
In real-world production environments, domain experts in fault diagnosis rapidly scrutinize runtime data, conduct in-depth investigations of anomalous events, and synthesize domain knowledge to formulate reasoning chains. They subsequently corroborate these chains by identifying pertinent symptoms within the operational system. Ultimately, they furnish interpretable fault diagnoses alongside dependable recommendations for remediation and maintenance decisions. Contemporary fault management and maintenance in distributed computing systems confront a critical trade-off: knowledge-driven approaches impose exorbitant costs for domain knowledge construction, whereas data-driven approaches are constrained by the scarcity of high-quality labeled fault data. Thus, an ideal fault diagnosis paradigm for distributed systems which can solve problems like an expert should perform thorough data parsing and mining, construct integrative reasoning chains blending domain knowledge with runtime data, and deliver interpretable analyses coupled with operational and maintenance directives.
Large language models (LLMs) exhibit substantial promise in addressing these challenges, given their proficiency in processing extensive unstructured data, extracting pertinent information, and facilitating fault pattern recognition alongside the formulation of preliminary hypotheses. The efficacy of LLMs in augmenting diagnostic processes and furnishing recommendations via comprehensive data analysis has been substantiated across diverse domains, notably yielding impressive outcomes in medical diagnostic support [21], cloud incident root cause analysis [22], and sensor-based industrial fault diagnosis [23]. Moreover, LLMs can replicate domain experts’ reasoning protocols in fault diagnosis, generating natural language explications that delineate inferential steps, underscore evidentiary support for diagnoses, and advance hypotheses with accompanying interpretive rationales. Nevertheless, LLMs confront notable limitations. In fault diagnosis scenarios, LLMs exhibit deficiencies in diagnostic accuracy and reasoning correctness due to their lack of domain-specific knowledge comprehension. Furthermore, general-purpose LLMs lack training in specialized domains and generally falter in assimilating the specialized knowledge and temporal dynamic domain knowledge of distributed systems, which encompass intricate architectural configurations and fault signatures, thereby impairing their aptitude for dissecting complex causal sequences and fault localization [24]. However, HVAC fault diagnosis methods proposed by Zhang et al. based on LLMs have demonstrated potential in improving diagnostic accuracy for LLMs [25].
To mitigate the challenges posed by deficiencies in domain-specific proficiency, model fine-tuning and Retrieval-Augmented Generation (RAG) have emerged as viable solutions [26,27,28,29]. Fine-tuning improves their understanding of a specialized domain and their ability to produce accurate and contextually relevant outputs, thus enhancing domain-specific performance. The scarcity of high-quality annotated data for model fine-tuning and the high training costs limit its widespread application in practical scenarios. RAG integrates LLMs with external knowledge repositories, enabling dynamic knowledge augmentation and elevated response precision without incurring the substantial costs associated with model retraining [24,30]. Nonetheless, conventional RAG primarily retrieves discrete documents or textual fragments, thereby encountering difficulties in discerning intricate interrelations among these elements and their encompassing contextual framework. To redress these limitations, Graph Retrieval-Augmented Generation (Graph RAG) has been introduced, adeptly resolving the limitations inherent in traditional RAG. Graph RAG encodes external knowledge within a graph-based representation, utilizing nodes and edges to manifest explicit, multifaceted interconnections among knowledge entities [31]. For example, the To-FD-EKG framework proposed by Men et al., which integrates a fault-diagnosis event knowledge graph with large language models, demonstrates the tremendous potential of knowledge graphs to enhance the accuracy, interpretability, and engineering practicality of intelligent decision-making in the field of industrial fault diagnosis [32]. However, challenges emerge in both graph construction and precise retrieval operations. The universal graph construction approaches demonstrate insufficient adaptation to domain-specific contexts, and the accuracy of targeted information retrieval within graph structures proves inadequate for specialized domain applications. Recent surveys on Artificial Intelligence for IT Operations (AIOps) and microservice root-cause analysis chart how logs, traces, metrics, and large language models are jointly used for incident understanding and localization in cloud-style systems [33,34]. Building on that contemporary thread, this work focuses on coupling an incrementally refined causal graph with graph learning and language-model inference over retrieved fault chains for distributed computing fault identification. The representative fault-diagnosis lines discussed above are summarized in Table A1.
Hence, this study introduces a fault diagnosis framework based on distributed computing systems that leverage large language models and knowledge graphs. By synergistically combining domain knowledge with data-driven algorithms to construct the graph structure, the framework bolsters the reasoning proficiency and interpretability of LLMs, while harnessing their natural language generation capabilities to emulate an intelligent operations and maintenance (O&M) expert. This expert delivers interpretable fault diagnoses alongside intelligent O&M recommendations. The proposed approach addresses three pivotal questions:
  • Question 1: How to systematically construct domain-specific causal graphs for particular fields and effectively integrate them with causal relationship networks?
  • Question 2: How to generate coherent and relevant chains of reasoning to enable reasoning and decision-making?
  • Question 3: Can causal graph-augmented LLMs enhance the accuracy of fault diagnosis in distributed computing systems?
To tackle question 1, we present a hybrid knowledge-driven and data-driven methodology for constructing a unified causal graph (UCG), which rigorously uncovers causal chains between runtime anomaly symptoms and faults, augmented by domain expertise, to yield a comprehensive causal graph. For question 2, we propose a system state-aware diagnostic chain generation technique that derives context-specific reasoning chains from the system’s causal graph based on real-time status, thereby enhancing reasoning precision and enabling visualized inference processes. Addressing question 3, this study introduces an LLMs-based reasoning and O&M diagnosis framework, which furnishes interpretable reasoning outputs in a structured format which contains encompassing fault data, associative evidence, and O&M recommendations while proffering tailored auxiliary decision schemes for O&M operations.

2. Methodology

The proposed methodology in this study, depicted in Figure 1, encompasses three key stages: the construction of UCG, the identification of system states and anomalous symptoms to generate structured diagnostic reasoning chains-of-thought and fault diagnosis conclusions and auxiliary operation and maintenance decision recommendations based on large language models. The UCG construction stage primarily involves building an initial knowledge-driven graph, which is then augmented through data-driven discovery of potential anomalous symptoms and causal relationships to form the complete UCG (Section 2.1). During the stage of identifying system states and anomalous symptoms for structured diagnostic reasoning chain generation, the system’s current operational status and anomalous symptoms are perceived and identified. Subsequently, structured diagnostic thought processes are generated based on the established UCG (Section 2.2). In the LLM-based fault diagnosis conclusion and auxiliary O&M decision recommendation stage, fault diagnosis conclusions are generated, and auxiliary O&M decision recommendations are provided, leveraging LLMs and the diagnostic reasoning chains-of-thought. This stage also supports further human–computer interaction to achieve intelligent O&M decision-making (Section 2.3).

2.1. Construction of UCG

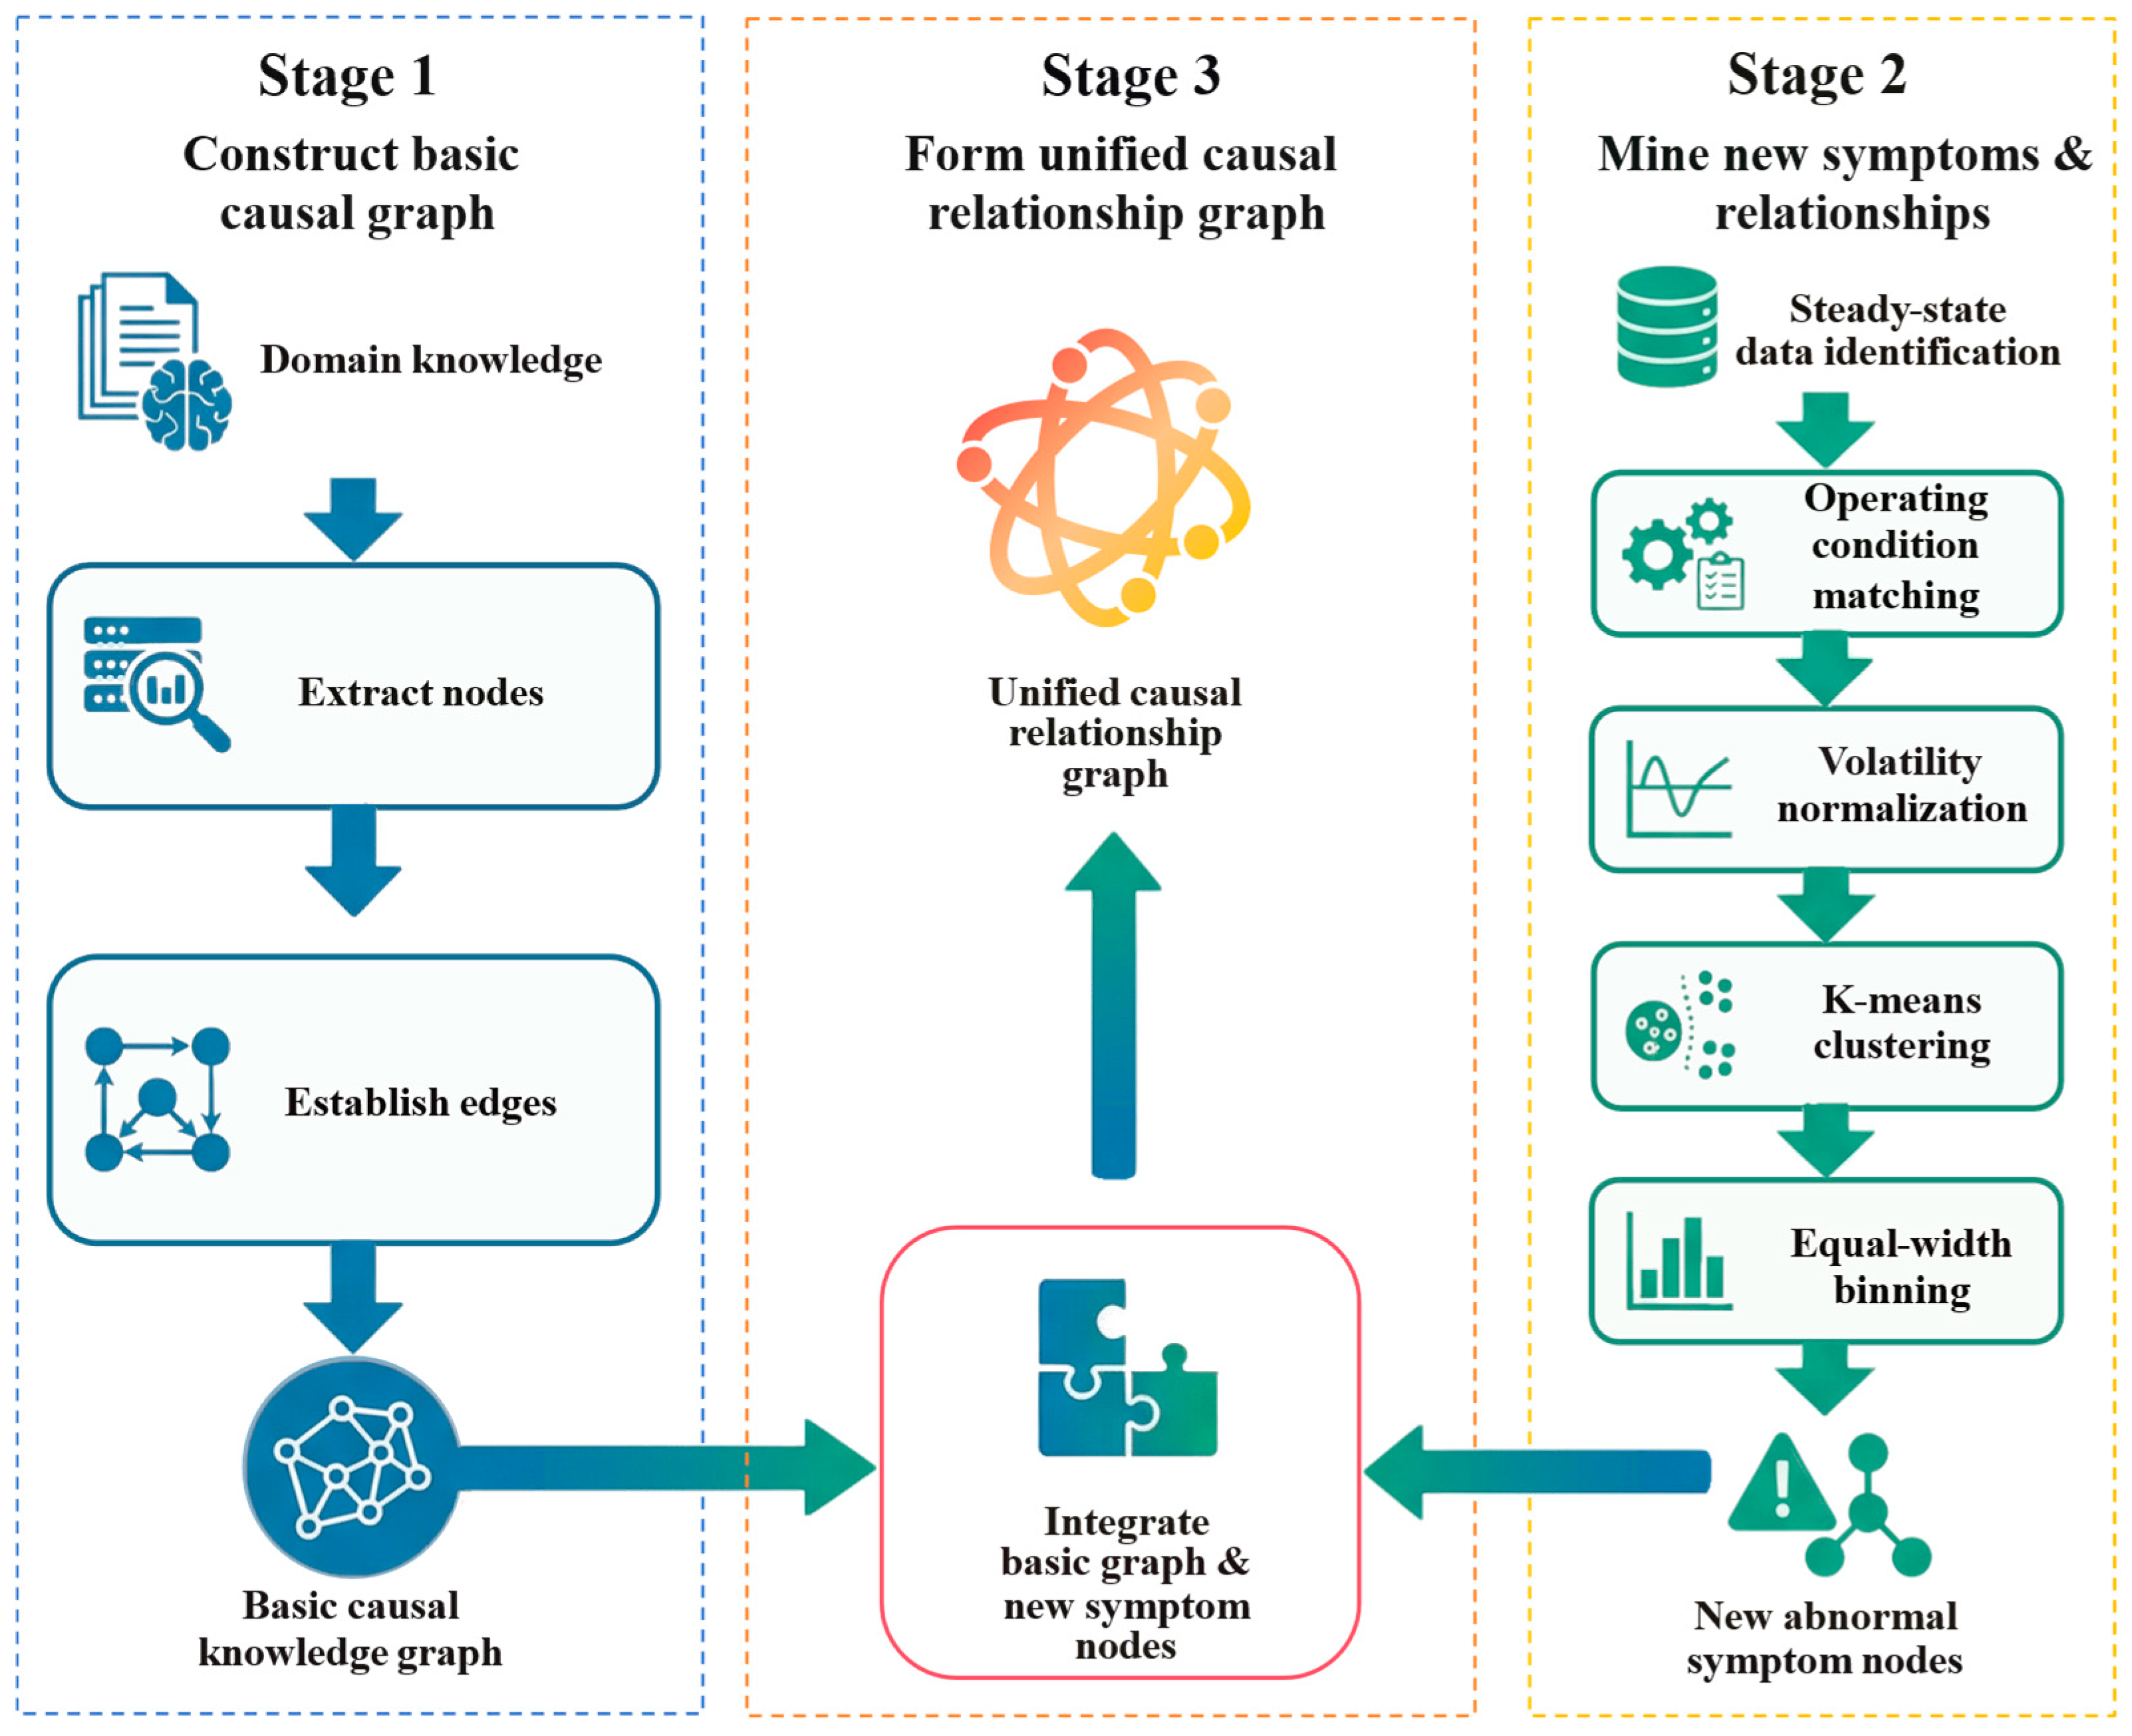
Figure 2 presents the roadmap for constructing the UCG, which consists of three stages. In the first stage, nodes such as components, services, symptoms, faults, and O&M actions are extracted from domain knowledge, and causal relationships among these nodes are established to form a basic causal knowledge graph. In the second stage, steady-state segments are first identified and matched with corresponding operating conditions. Followed by fluctuation normalization. K-means clustering is then applied to mine previously unknown anomalous symptoms, and equal-width binning is used to generate graded symptom nodes, thereby revealing symptoms and relationships that are not captured by the knowledge-driven phase. In the third stage, both data-driven and knowledge-driven methodologies are harmonized through the integration of the basic causal graph with newly identified symptom nodes and their interconnections, culminating in the generation of the UCG characterized by standardized node representation and a coherent structural framework. Scope of causality in the UCG. The “causal” in this study means knowledge-driven links capture documented dependencies and fault symptom narratives, while data-driven links summarize statistical regularities obtained via volatility analysis, clustering, and binning. We describe the knowledge-driven side using intervention-style wording that parallels Pearl’s do-operator [35], because the do-operator names an external intervention that fixes a variable to a chosen value and suspends its usual endogenous mechanisms rather than restating passive observational co-occurrence alone. Data-driven relations remain statistical summaries under this same scope.

2.1.1. Construction of Basic Graph Based on Causal Knowledge

The purpose of this step is to construct a basic causal knowledge graph by leveraging distributed system high-level design (HLD), domain knowledge, system operation documents, fault diagnosis tickets, and O&M solutions. HLD, a key software engineering phase, offers an abstract system overview, documenting organizational, informational, and technical requirements [36]. For instance, architecture diagrams such as context diagrams, container diagrams, component diagrams, data flow diagrams, and Unified Modeling Language (UML) diagrams broadly contain information on system components, data flows, message flows, dependencies, service-to-service communications, and interactions with external entities. Domain knowledge, often tacit expertise formalized in troubleshooting manuals and expert knowledge bases, provides established causal chains, failure types, inspection methods, root causes, and recommended resolutions between system entities [37,38]. System operation documents outline normal behaviors, key monitoring indicators, configurations, routine protocols, and interactions among components to support baseline understanding [33]. Fault diagnosis tickets document real-world incidents, capturing symptoms, affected services or components, diagnostic processes, root causes, and initial fixes [39]. O&M solutions detail verified remediation steps, preventive strategies, playbooks for standard procedures, and lessons from historical outages [34].
Knowledge graphs, through their core elements of nodes and relationships, are used to represent and organize complex information and knowledge. Nodes represent the basic entities or concepts in the graph, which can be any concrete or abstract objects; in distributed computing systems, components, services, monitoring symptoms, and faults can all be regarded as nodes. Relationships connect different nodes in the graph, indicating their interactions and associations. In this study, the relationships are directed, representing causal or dependency relationships [40,41].
This study extracts system components and services as nodes from architecture diagrams and domain knowledge in the HLD, extracts symptoms as nodes from system operation documents, and extracts faults and O&M methods as nodes from fault diagnosis tickets and O&M solutions. After identifying the nodes, causal relationships are constructed between system components and service nodes, which can be directly identified from HLD and domain knowledge as having evident connections. Symptoms represent states of services. Based on system operation documents, service nodes are connected to respective symptom nodes via direct dependency relationships, and according to fault diagnosis tickets and O&M solutions, direct relationships between basic symptom nodes and fault nodes are identified, along with O&M method nodes corresponding to fault nodes. At this point, the preliminary construction of the basic causal graph is completed.

2.1.2. Methodology for Constructing the Unified Causal Relationship Graph

This step is to use data-driven techniques to augment the initial causal graph, which comprises nodes and relationships derived from the knowledge-driven method outlined in Section 2.1.1, thus yielding a comprehensive causal relationship graph. This step facilitates the identification of nodes and relationships undetectable or omitted by the knowledge-driven approach. To enrich the baseline causal graph via data-driven causal chains, the proposed method utilizes steady-state data identification, operating condition matching [42], volatility normalization, K-means-based anomaly identification [43], and data binning techniques for identifying nodes and relationships overlooked by antecedent knowledge-driven techniques [44].
The first step is to identify steady-state data of a distributed computing system. This study raised an approach to delineate data segments within the distributed computing system wherein an identical task executes continuously beyond its predefined minimum effective duration threshold [45]. Monitoring data is initially segregated by task identifier or task type, enabling the extraction of continuous segments exceeding the stipulated minimum threshold from each category. Nonetheless, runtime data in distributed computing environments frequently incorporates data points stemming from transient faults or unstable operations, which are inherently dynamic and inconsistent, thereby obscuring reliable operating condition insights and risking misguided fault diagnosis. To counteract this, the proposed methodology scrutinizes data point values against alarm activation thresholds for diverse monitoring indicators to detect anomalies, concurrently evaluating the sequence of consecutive anomalous points relative to the alarm’s minimum successive trigger threshold. Anomalous data failing to satisfy alarm activation criteria is classified as invalid and expeditiously discarded.
Following the steady-state identification process, the resultant steady-state data is benchmarked against historical samples from fault-free operational periods. This step ensures matching operating condition data is available as a reference for the subsequent identification of anomalous symptoms and system states, thereby avoiding inaccuracies caused by varying workloads in the distributed computing system. Through using the Euclidean distance formula d to effectively identify whether the steady-state data of the distributed computing system and the historical samples from the fault-free operation period are under the same operating condition. To this end, one emblematic feature variable is selected in this step to pinpoint the most analogous fault-free conditions. This variable comprises stable system symptoms minimally perturbed by faults. Specifically, a Work Pressure Indicator (WPI) is employed as the criterion for operating condition alignment. WPIs are indicators unaffected by the load of the distributed computing system; they are related only to operating conditions and can accurately indicate the current operating state of the distributed computing system.
d ( P , Q ) = ( p q ) 2
V o l a t i l i t y = x c u r r e n t x n o r m a l x m a x x m i n
J = j = 1 k x C j | x μ j | 2
where d represents the Euclidean distance, P represents the steady-state data points set, Q represents the historical data points set for matching, p and q represent WPIs for P and Q, volatility quantifies the symptom’s deviation from its normal value, xcurrent represents the current symptom value, xnormal represents the mean value of this indicator derived from the optimal fault-free operating condition sample set, xmax represents the historical maximum value under the matched fault-free operating condition, xmin represents the corresponding historical minimum value, J represents the objective function value to minimize, k represents the preset number of clusters, Cj represents the j-th cluster, x represents a data point in Cj, and μj represents the centroid of the j-th cluster.
After the operating condition matching, the formula Volatility is applied to standardize the selected feature variables from both historical fault-free data and current fault data. This step employs min–max normalization to align fault data with normal data, ensuring all variable values fall within a unified 0-to-1 range and adaptively mitigating biases arising from scale differences. For example, network-related metrics, which can vary from tens of bytes to millions of bytes, undergo min–max normalization to ensure comparability across instances with different network traffic volumes [46].
Then, the proposed method employs the K-means clustering algorithm to conduct in-depth analysis and detect hidden anomalous symptoms therein. This method utilizes Equation J to distinguish normal from anomalous patterns by minimizing the sum of squared distances from data points to their cluster centroids known as squared error distortion or within-cluster sum of squares, thereby effectively identifying anomalous symptoms in the data.
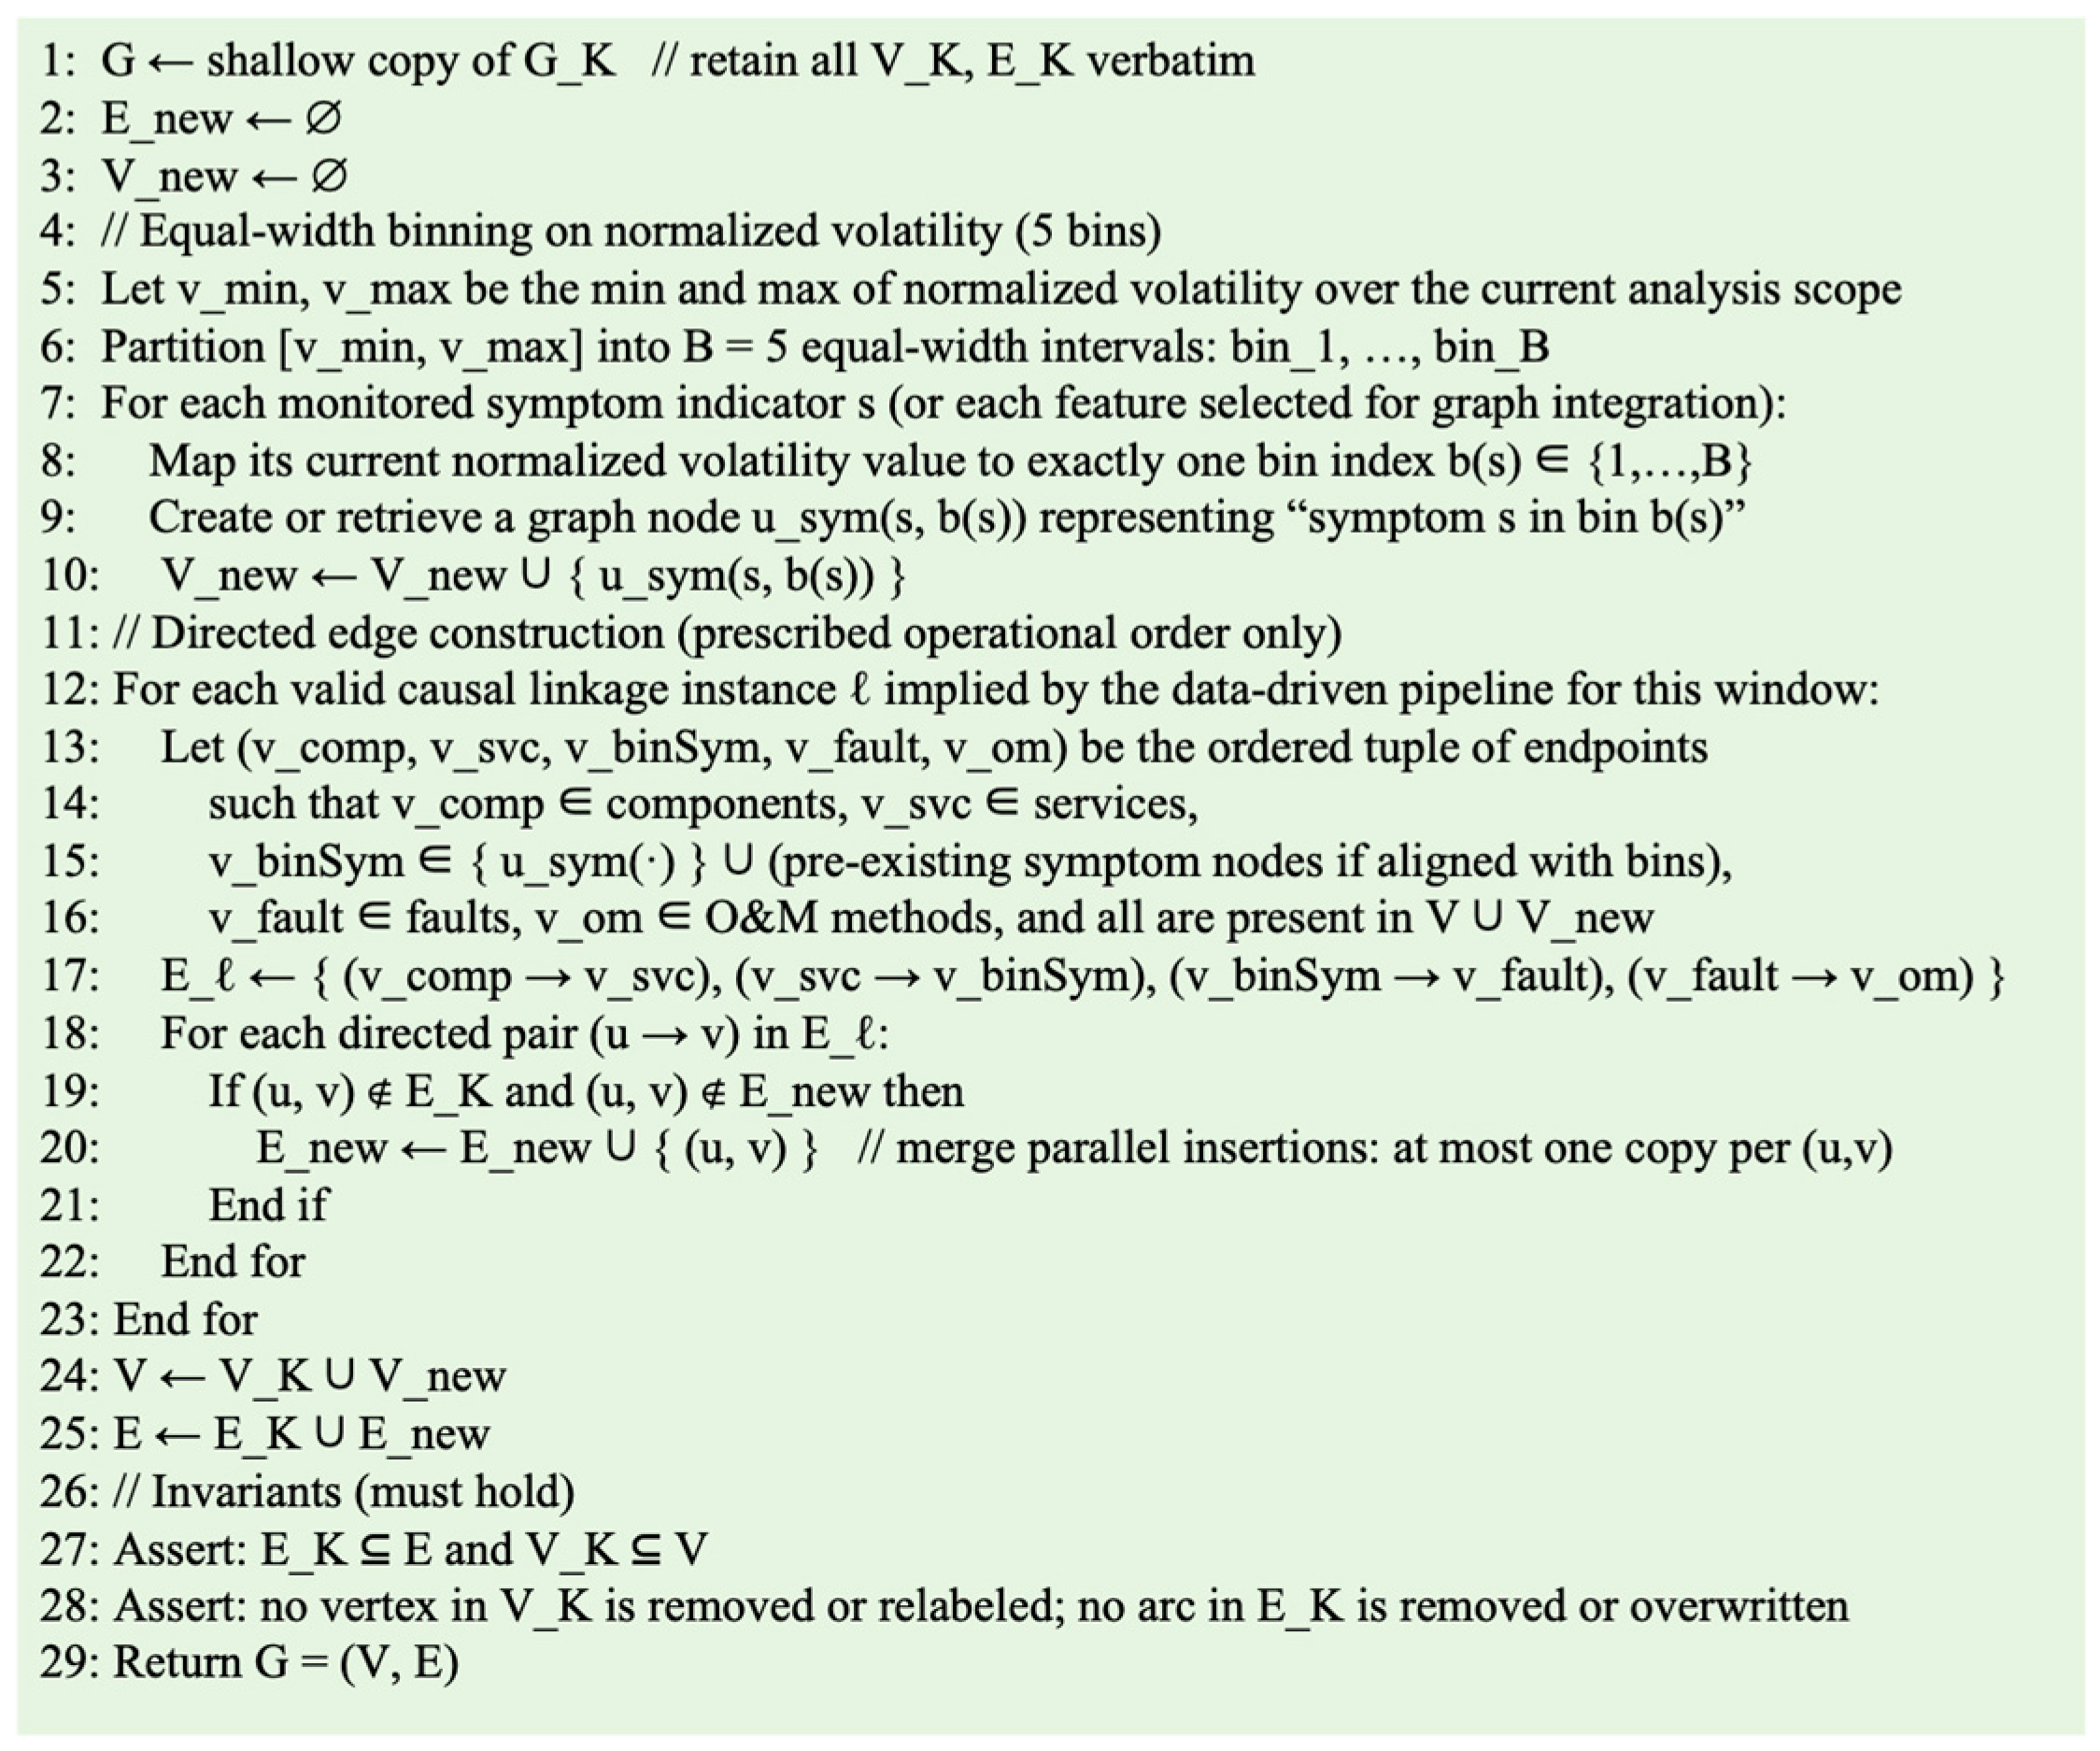
Finally, to integrate the identified anomalous symptoms as nodes into the unified causal relationship graph, this method employs equal-width data binning techniques. Equal-width data binning uniformly divides the range of normalized volatility data into 5 bins of equal width, with each bin covering the same value interval [47]. After sorting the normalized volatility data, the values are partitioned into five bins, each representing a specific symptom state under the current operating condition. This enables anomalous symptoms and their fault impact severity levels to be integrated as new nodes into the unified causal relationship graph. For edge construction, only directed links are added that follow the prescribed operational order from system components to services, then to binned symptoms, then to faults, and finally to O&M methods. Parallel insertions that repeat the same ordered pair are merged so that each directed edge appears at most once. These data-driven graph updates are strictly additive and do not remove, relabel, or override knowledge-driven vertices and arcs established in Section 2.1.1, preserving a knowledge-first precedence in the unified graph. The corresponding procedure is summarized in Figure A1. Simultaneously, the binning results optimize the baseline causal graph from Section 2.1.1, ensuring a unified quantitative scale for all nodes and relationships in the final graph. Therefore, the nodes and causal edges from Section 2.1.1, along with the nodes identified in this study, are standardized into the unified structure (“node_name_bin”), wherein distributed computing system components and O&M phases are designated as root nodes, with their child nodes as sub-nodes. Fundamentally, faults are represented by edges connecting these discrete symptom nodes to fault nodes and O&M method nodes, thereby forming a comprehensive unified causal relationship graph.

2.2. Automatic Generation of Diagnostic Reasoning Chains via System State Perception

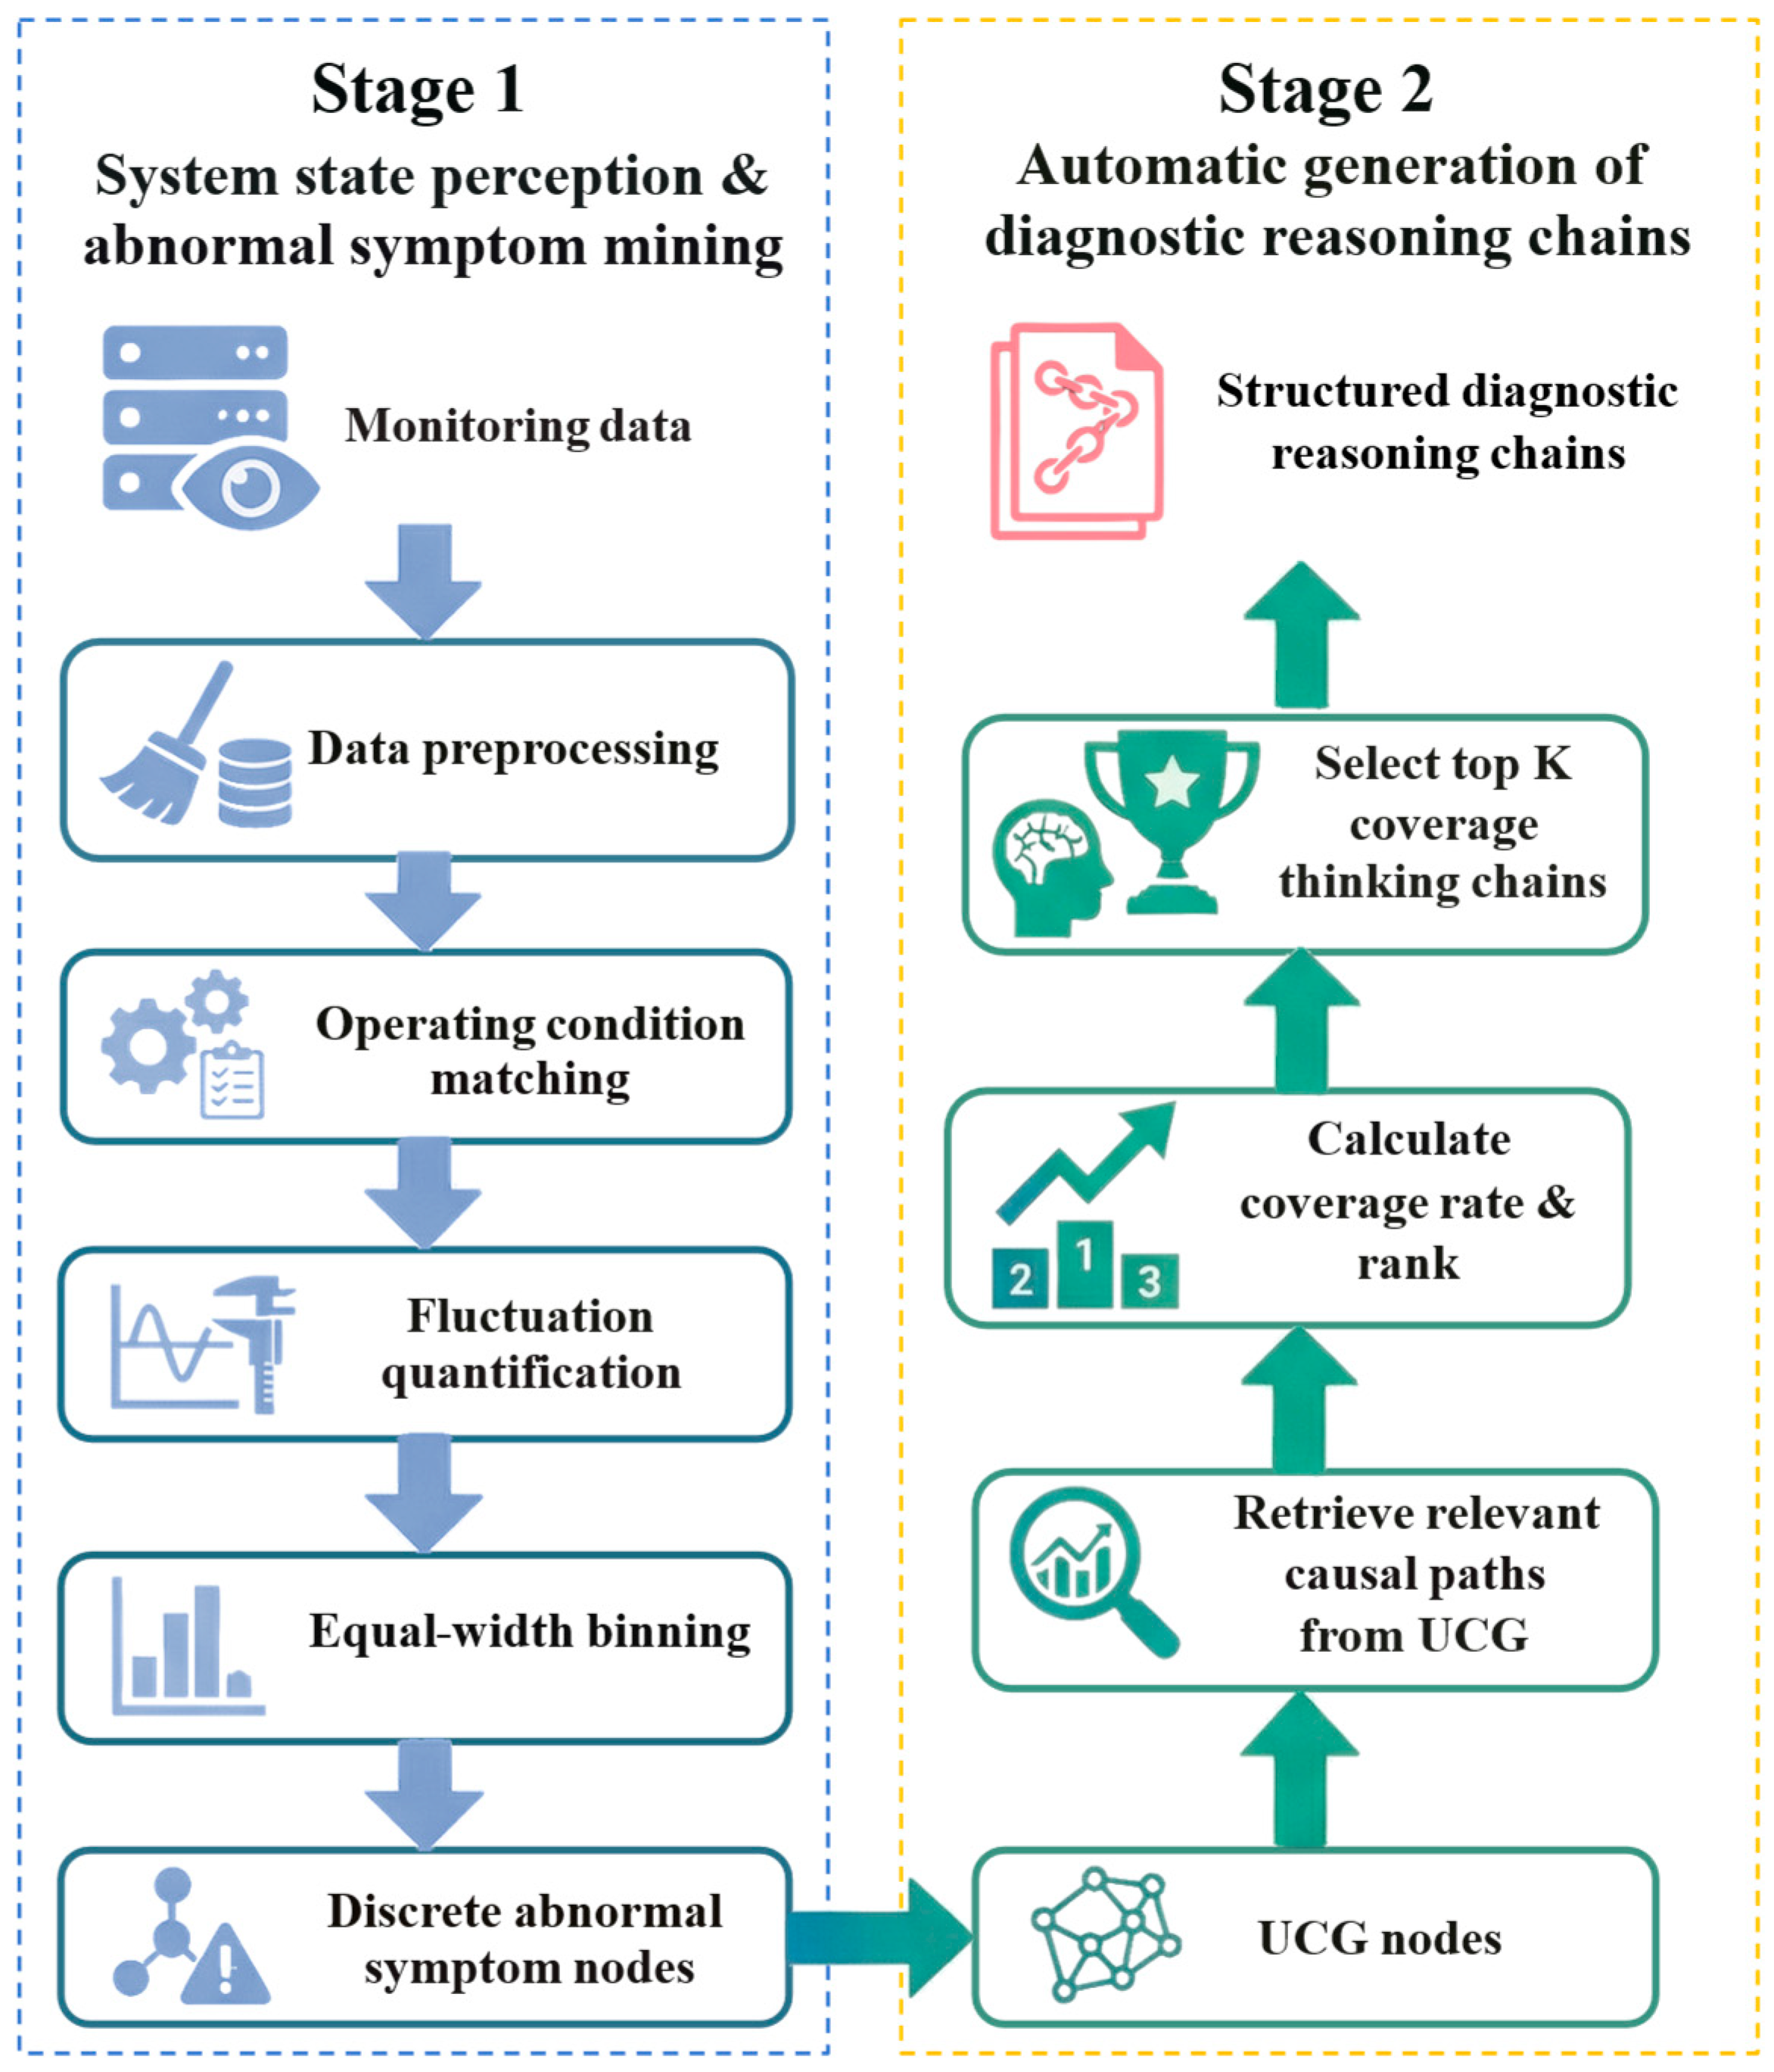
Figure 3 illustrates the flow of automatic generation of diagnostic reasoning chains, which consists of two stages. The first stage starts from raw monitoring data, performs data preprocessing, and then conducts operating-condition matching, fluctuation quantification, and equal-width binning. In this way, continuous monitoring time series are transformed into discrete abnormal symptom nodes. In the second stage, UCG Nodes which are transferred from abnormal symptom nodes are used as starting points to retrieve relevant causal paths from the UCG. Coverage is then computed and ranked, and the Top K most relevant causal chains are selected. Finally, these are organized into structured diagnostic reasoning chains.

2.2.1. System State Perception and Abnormal Symptom Mining

The purpose of this step is to identify system state and abnormal symptoms from distributed computing systems. This includes removing noise and implausible zero values by using the Isolation Forest algorithm, identifying abnormal symptoms via operating condition matching, volatility quantification, equal-width binning, and mapping discrete anomaly metrics to corresponding nodes in the UCG.
Upon system anomaly detection and alert triggering, operational indicators data spanning 10 min before and after the alert is acquired. Indicators frequently manifest anomalous values or implausible zero values, attributable to monitoring malfunctions, network latency, or ephemeral system perturbations. The proposed method leverages the Isolation Forest algorithm to detect and excise anomalous data points. This algorithm executes anomaly detection by gauging the facility of isolating data points from normal data, evincing its robustness and efficacy in managing high-dimensional, large-scale datasets [48]. An anomaly score calculated by formula s close to 1 indicates that the data point is easily isolated and thus highly likely to be determined as an anomalous point [49,50].
Subsequently, the methods proposed in Section 2.1.2 are employed. The data is matched with the nearest fault-free state sample set, followed by evaluating the deviation intensity from the normal baseline through volatility calculations. The standardized volatility is then discretized into symptom states, thereby providing granular, structured inputs for downstream fault diagnosis and reasoning chain generation.
s ( x , n ) = 2 E ( h ( x ) ) c ( n )
where s represents anomaly score, x represents data point, n represents the sampling size, c represents the normalization factor, E represents the average path length of all isolation trees, h represents the path lengths of x.

2.2.2. Diagnostic Reasoning Chain Generation

This subsection delineates the methodology for retrieving pertinent causal subgraphs from the graph database via causal relationship retrieval, and subsequently generating interpretable diagnostic reasoning chains therefrom, thereby furnishing a foundational basis for subsequent fault localization and decision-making. This process seeks to convert system-detected anomalies into human-interpretable diagnostic pathways, thus augmenting the interpretability and precision of operation and maintenance practices in distributed computing systems.
Firstly, causal relationship retrieval efficiently extracts local causal relationship paths related to the currently identified abnormal symptoms from the constructed UCG. Upon system identification of the corresponding state and node for the abnormal symptom, the process initiates from that node in the graph, matching the pattern where the current node points to a fault relationship and then to a fault node, while traversing all non-duplicate fault relationship sets. Subsequently, after querying the fault relationship set, it retrieves all complete causal relationship chains associated with these relationships, traverses and extracts elements containing the fault relationship set, employs regular expressions to match all related fault relationships, and returns the complete paths to construct the full diagnostic reasoning chains. Through these two steps, this method efficiently retrieves pertinent causal relationships and nodes related to abnormal symptoms, organizing them into interpretable diagnostic reasoning chains that provide structured input for subsequent large language model inference and fault localization. Meanwhile, to avoid information overload, each retrieved causal relationship chain is assessed by formula cr computing the coverage rate between its constituent abnormal node set and the node set extracted from the actual operational anomaly data. Coverage rates are ranked in descending order, with the top K most pertinent causal relationship chains selected according to a predefined threshold, while those exhibiting lower relevance are filtered out. In this study, K is fixed to 3, because the coverage rates of candidate causal chains ranked below the third position fall sharply and remain well under the 50% usability threshold, so retaining only the top three chains preserves practically useful evidence. This filter process effectively alleviates information overload and diminishes undue computational pressure on subsequent analyses.
c r = | S s u b S a c t | | S a c t |
where cr represents coverage rate, Ssub represents the collection of abnormal symptom nodes within the pertinent causal subgraph drawn from the UCG, Sact represents the set of empirically identified abnormal symptom nodes derived from the operational data post-preprocessing.
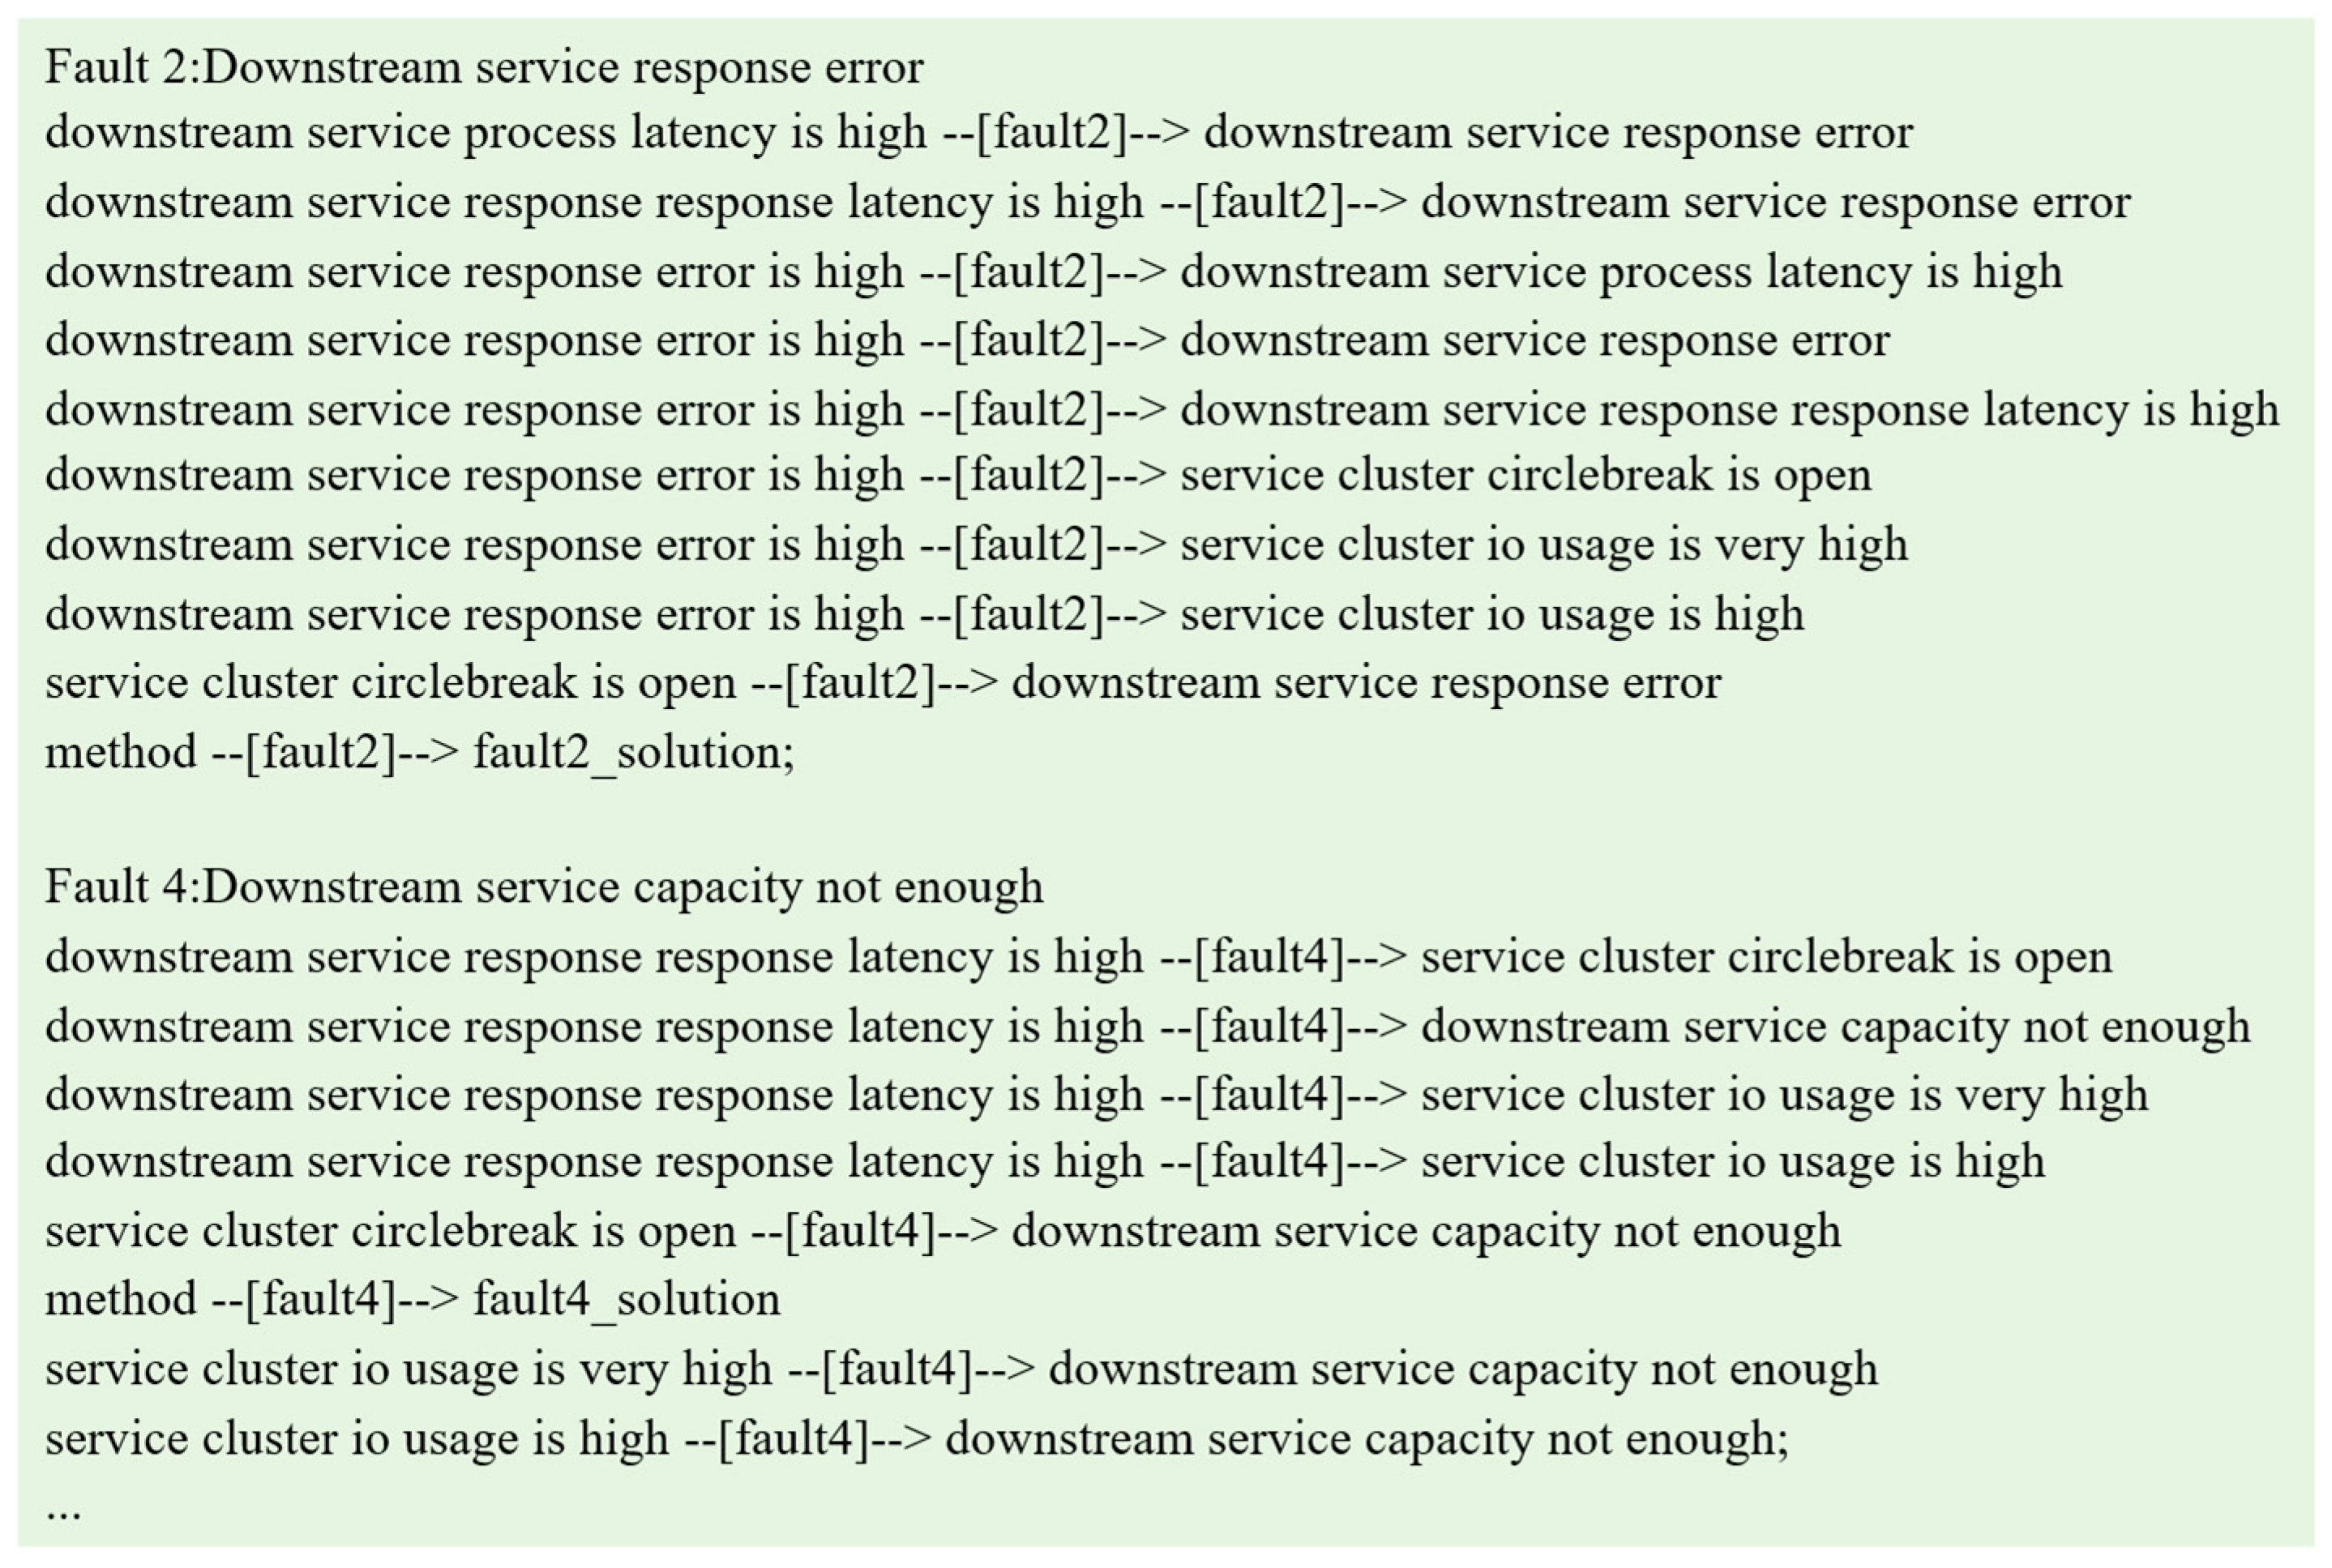
Finally, the causal relationship chains that have undergone information pruning are converted into structured diagnostic reasoning chains. A diagnostic reasoning chain needs to include the possible fault name as well as clear relationships between nodes. Table 1 shows some examples of structured diagnostic reasoning chains. “fault *” designates the fault implicated or elucidated by the respective reasoning chain; “node *” denotes pivotal entity nodes in the UCG; and the arrow symbol with fault name signifies the directed causal chains between nodes. The aforementioned procedure enables the extraction of the most pertinent diagnostic pathways from an extensive repository of causal relationships, while concurrently rendering them in a standardized format, thereby augmenting the interpretability, precision, and efficacy of subsequent large language model-driven fault diagnosis reasoning.

2.3. Fault Diagnosis and Auxiliary Operation and Maintenance Framework Based on LLMs

2.3.1. Fault Diagnosis

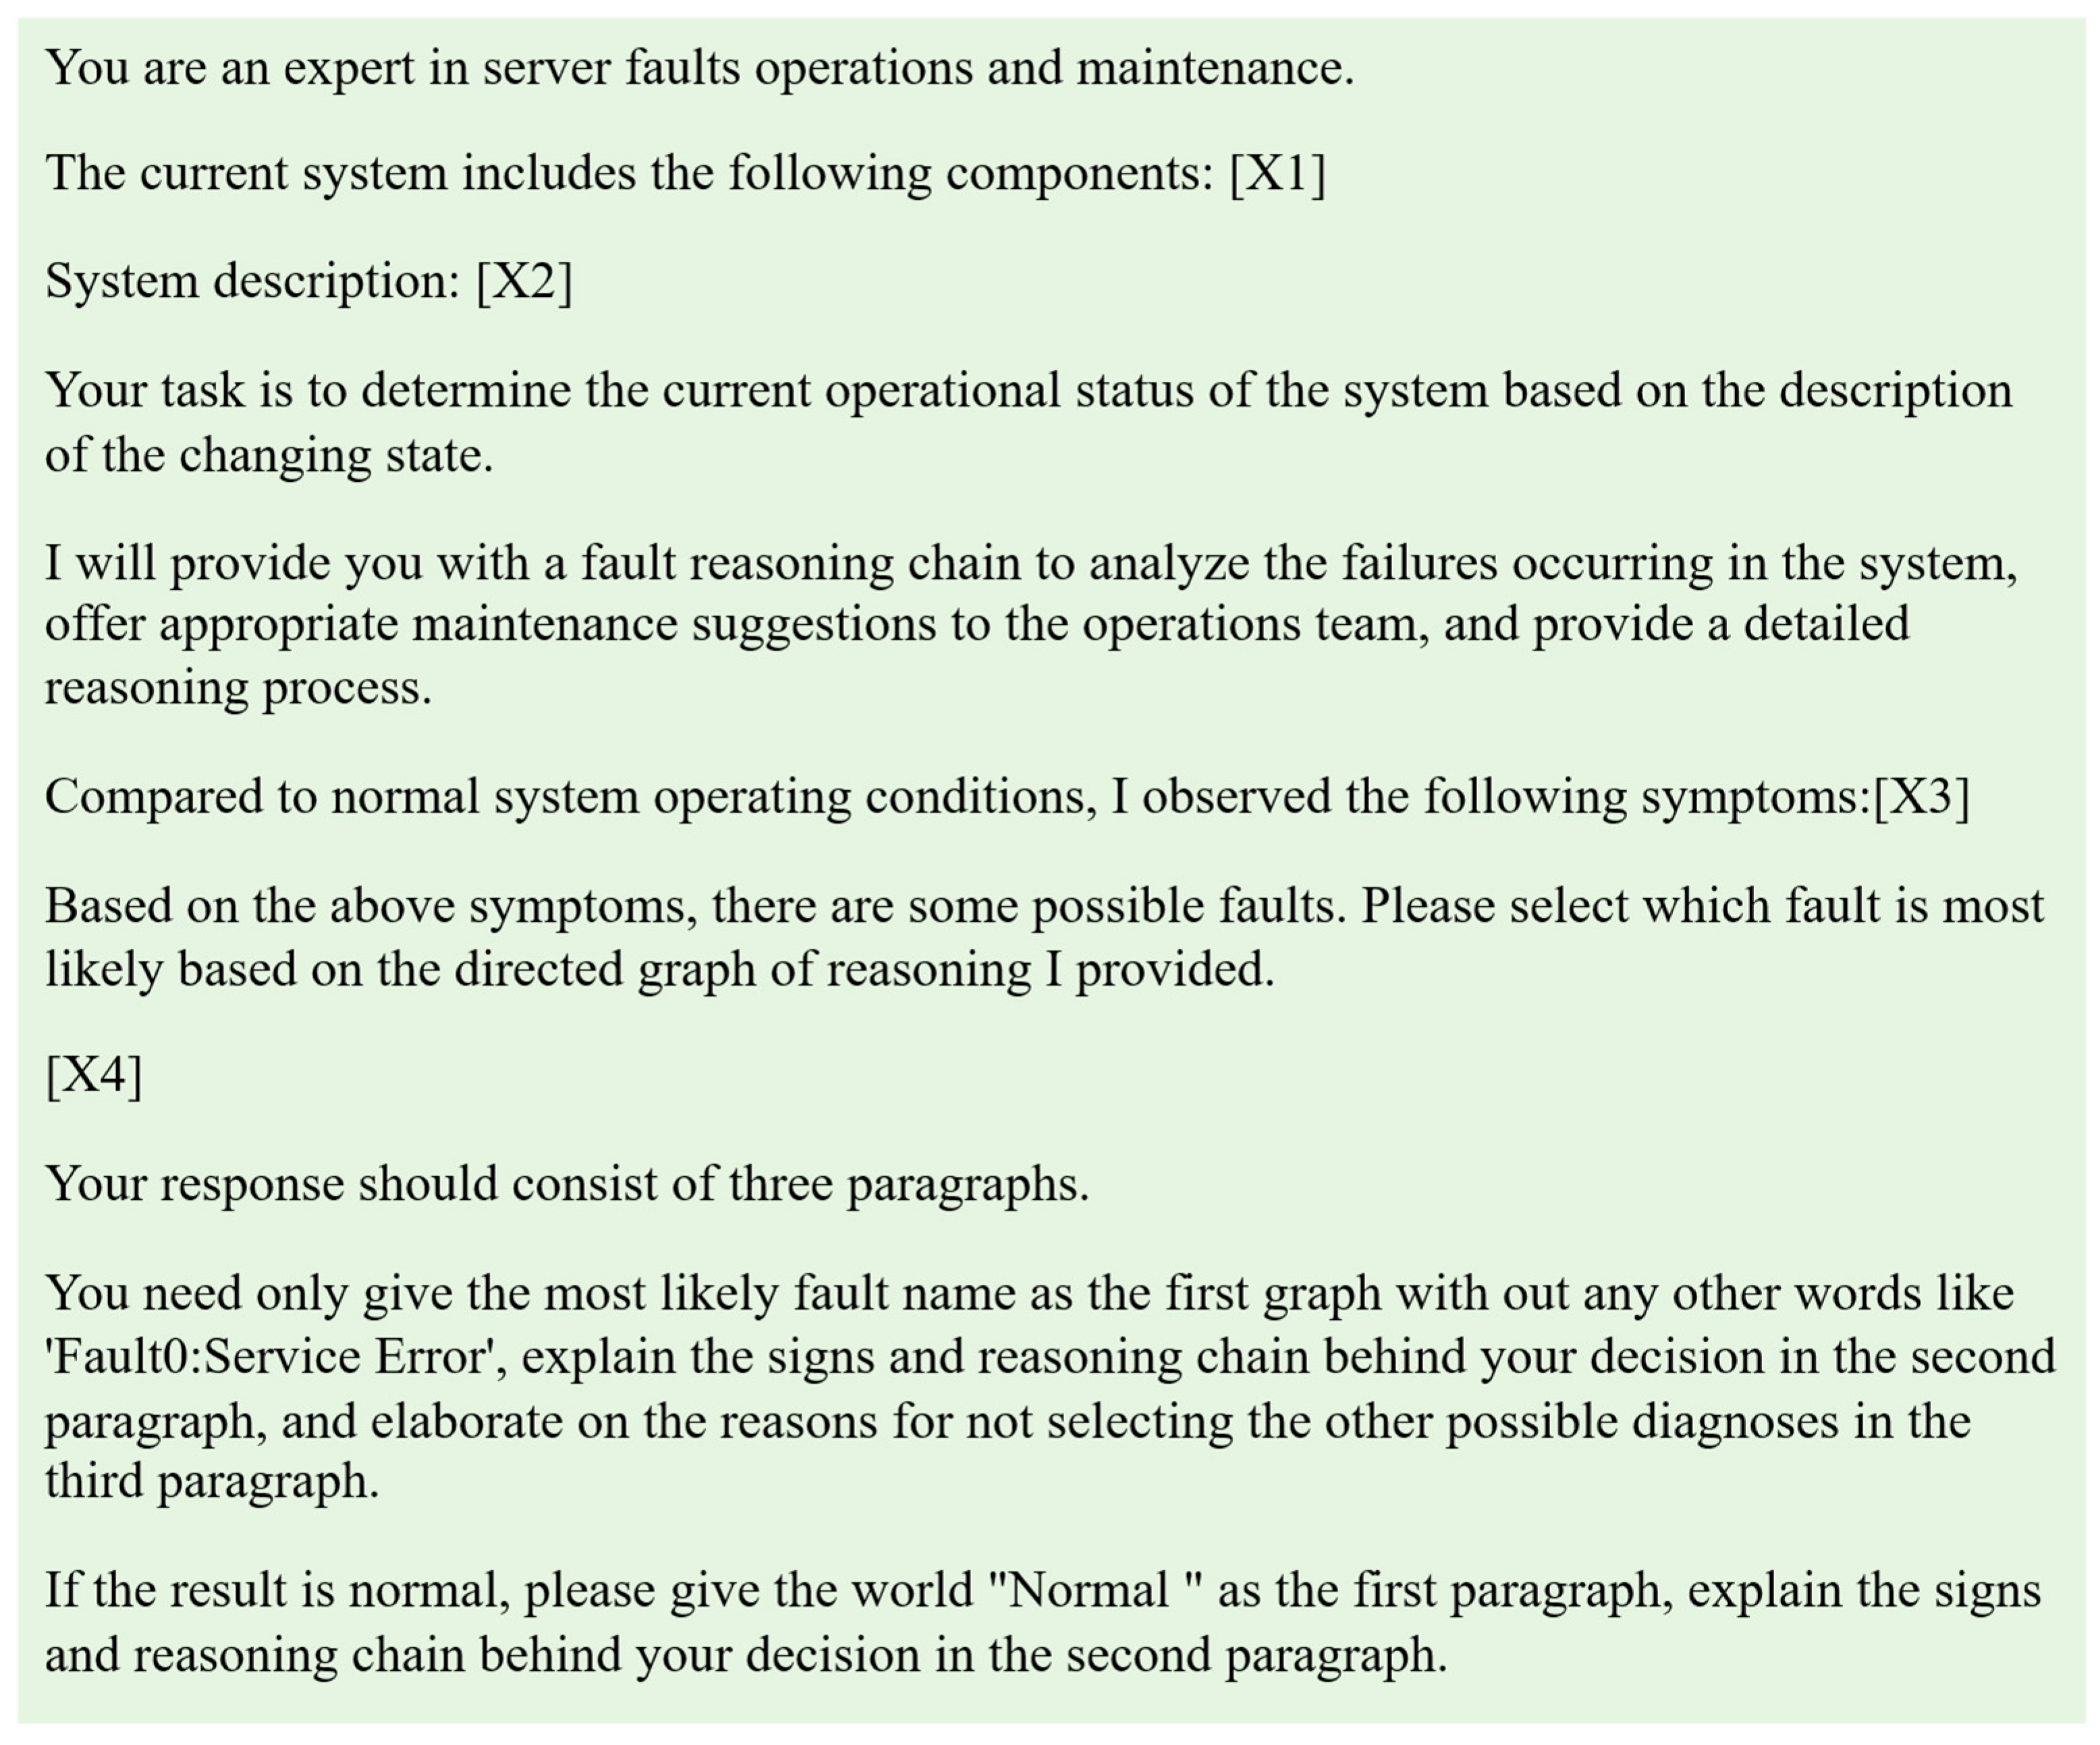
Fault diagnosis constitutes a pivotal component of the proposed framework. Its principal objective is to deliver structured inputs encompassing the system’s anomalous states and prospective causal pathways to large language models, thereby enabling them to emulate domain experts’ diagnostic reasoning and accurately discern the most probable root cause of faults amid a multitude of potential scenarios. This approach synthesizes the anomalous symptoms identified in Section 2.2.1 with the diagnostic reasoning chains constructed in Section 2.2.2 into a unified prompt template and fills the slots X1–X4 shown in Table 2. As depicted in Figure 4, the prompt template furnishes the LLMs with comprehensive system background, contemporaneous anomalous indicators, and an array of inferred fault propagation chains from the causal graph, thus steering the model toward precise and focused analytical deliberation.
The output of the large language model adheres to a tripartite structure, comprising: identification of the most probable fault, the diagnostic rationale and reasoning pathway, and explication of the selection criteria. It specifies the name of the most likely fault and provides a comprehensive elaboration of the supporting rationale, incorporating the pertinent symptoms and the fault propagation dynamics along the causal chain. Concurrently, it elucidates the logical grounds for excluding other candidate faults as the primary cause. This approach not only yields fault conclusions but also furnishes a detailed reasoning process, thereby substantially enhancing the sophistication and interpretability of fault diagnosis.

2.3.2. Auxiliary Operation and Maintenance Decision Suggestions

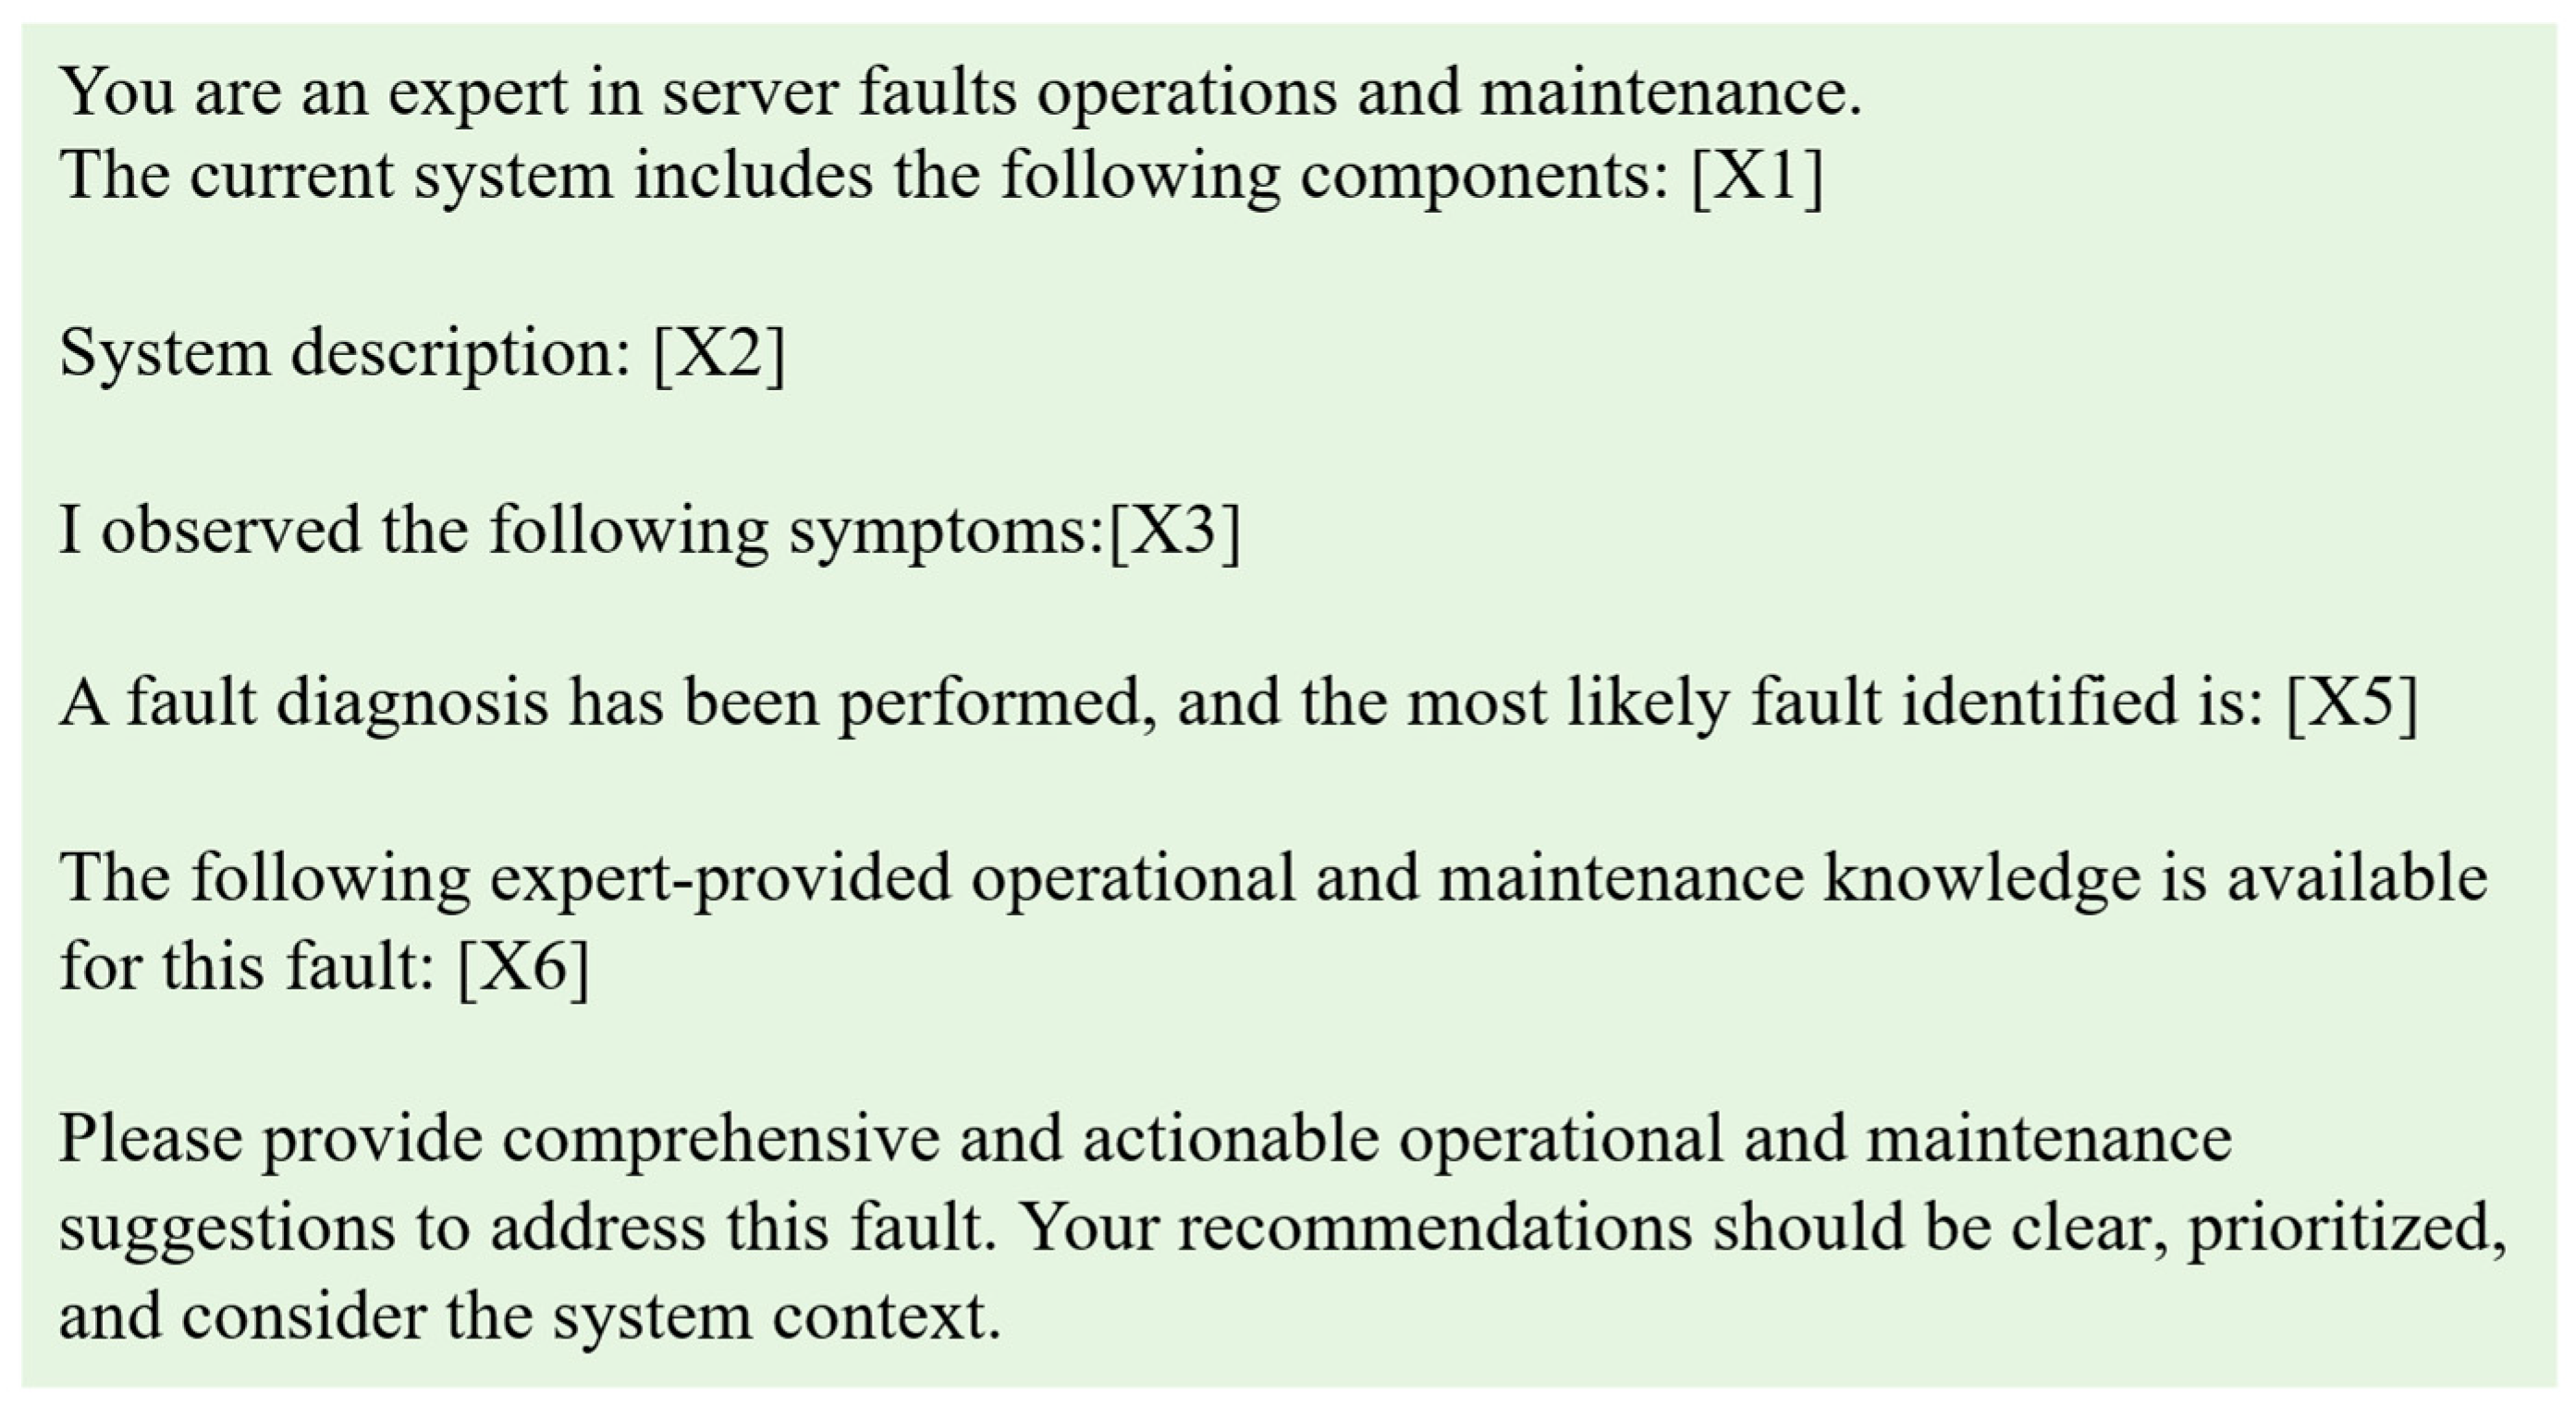
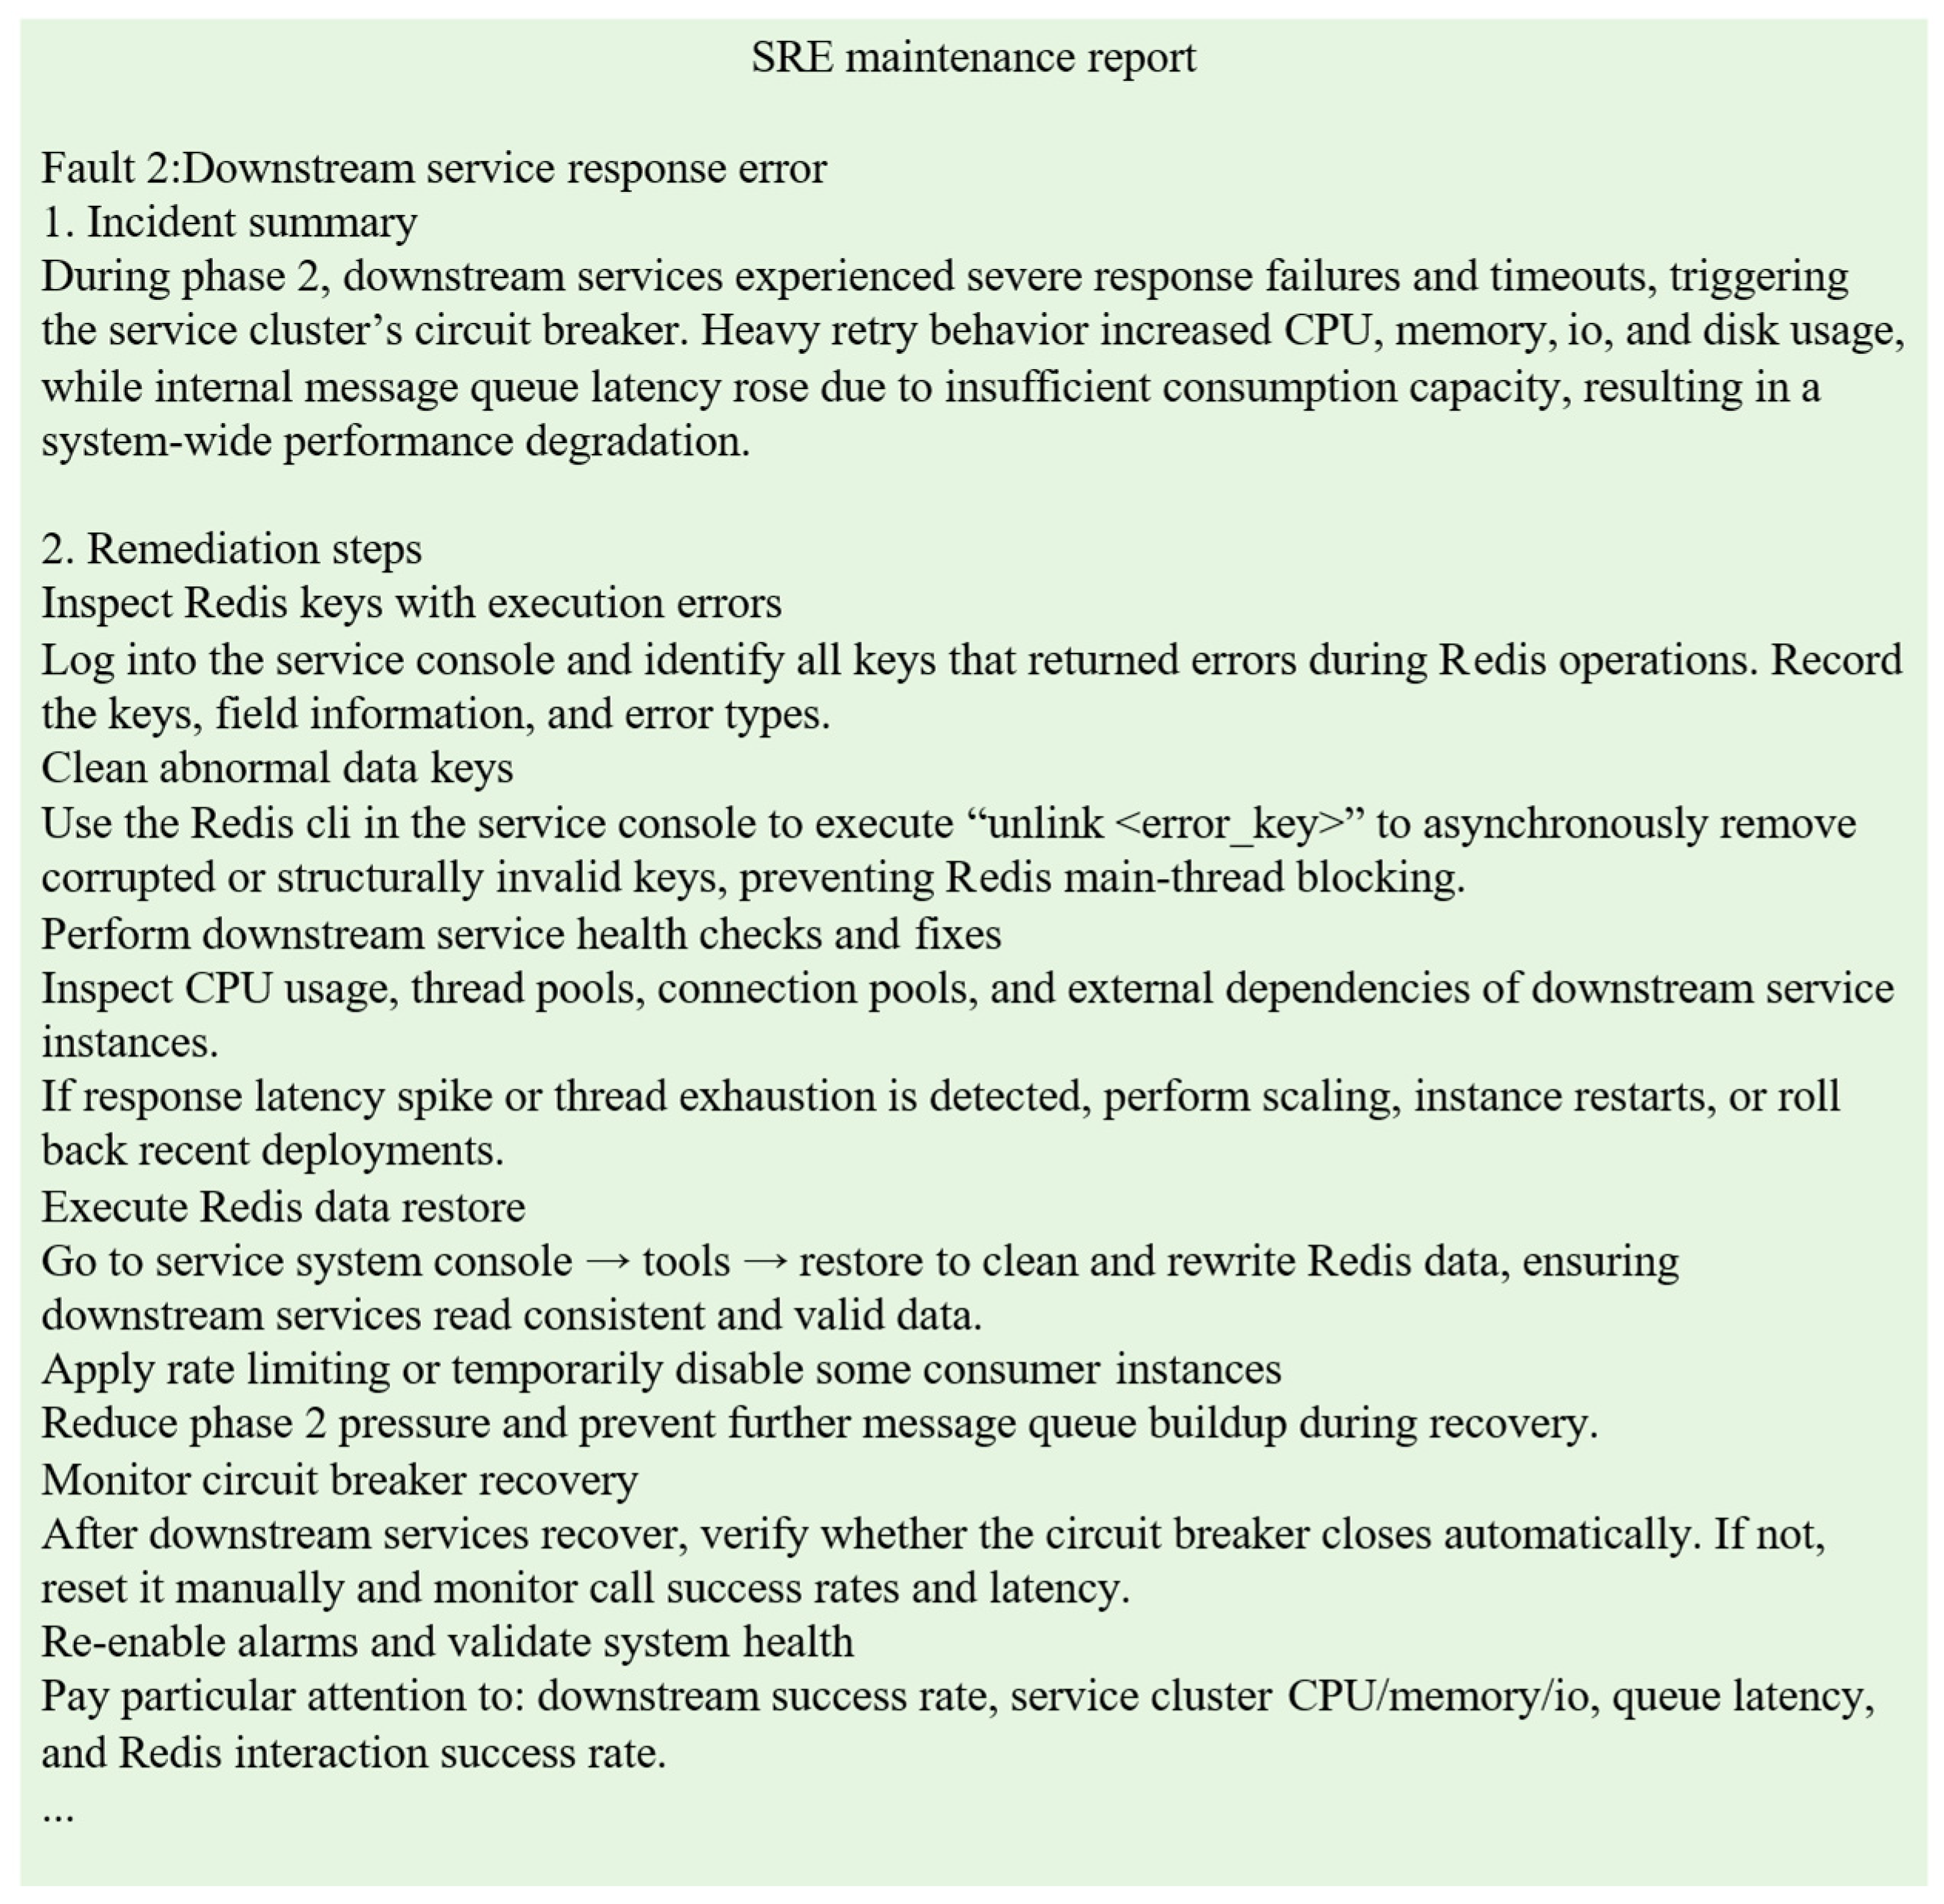
Following the pinpointing of the predominant fault alongside its intricate reasoning trajectory, this subsection expounds upon harnessing the sophisticated generative prowess of large language models to deliver bespoke auxiliary decision recommendations for O&M within distributed computing ecosystems. This empowers O&M practitioners to adeptly ameliorate faults and augment system proficiency. Upon ascertaining the principal fault determination per Section 2.3.1, it is juxtaposed against the filtered reasoning chains derived from Section 2.2.2, thence integrated with test set annotations to evaluate its precision. Subsequently, the framework interrogates the UCG that leveraging the fault identifier to retrieve domain-specific O&M expertise and remediation strategies pertinent to discrete anomalies in distributed systems. As illustrated in Figure 5, premium auxiliary O&M advisories are engendered through the orchestration of a dedicated prompt template for decision suggestion formulation. According to Table 2, slots X1–X3 and X5–X6 need to be filled. This prompting methodology systematically integrates the characteristics of the identified fault, the prevailing anomalous system states, and the domain-specific O&M knowledge base housed in the UCG. It thereby empowers the LLMs to generate precise, actionable, and contextually attuned auxiliary decision recommendations for O&M, while producing a comprehensive report deliverable to SRE personnel. Figure 6 exemplifies such an O&M report.

3. Results

3.1. Distributed Computing System Introduction

The distributed computing system investigated in this study represents a computational framework designed for promotional pricing on e-commerce platforms. This architecture enables consumers to readily visualize estimated product purchase prices during promotional events, thereby facilitating informed purchase planning and elevating prospective transaction probabilities. Owing to the immense scale of e-commerce inventories and the persistent real-time fluctuations in promotions, the system demands stringent guarantees of real-time performance, high concurrency, and computational integrity.
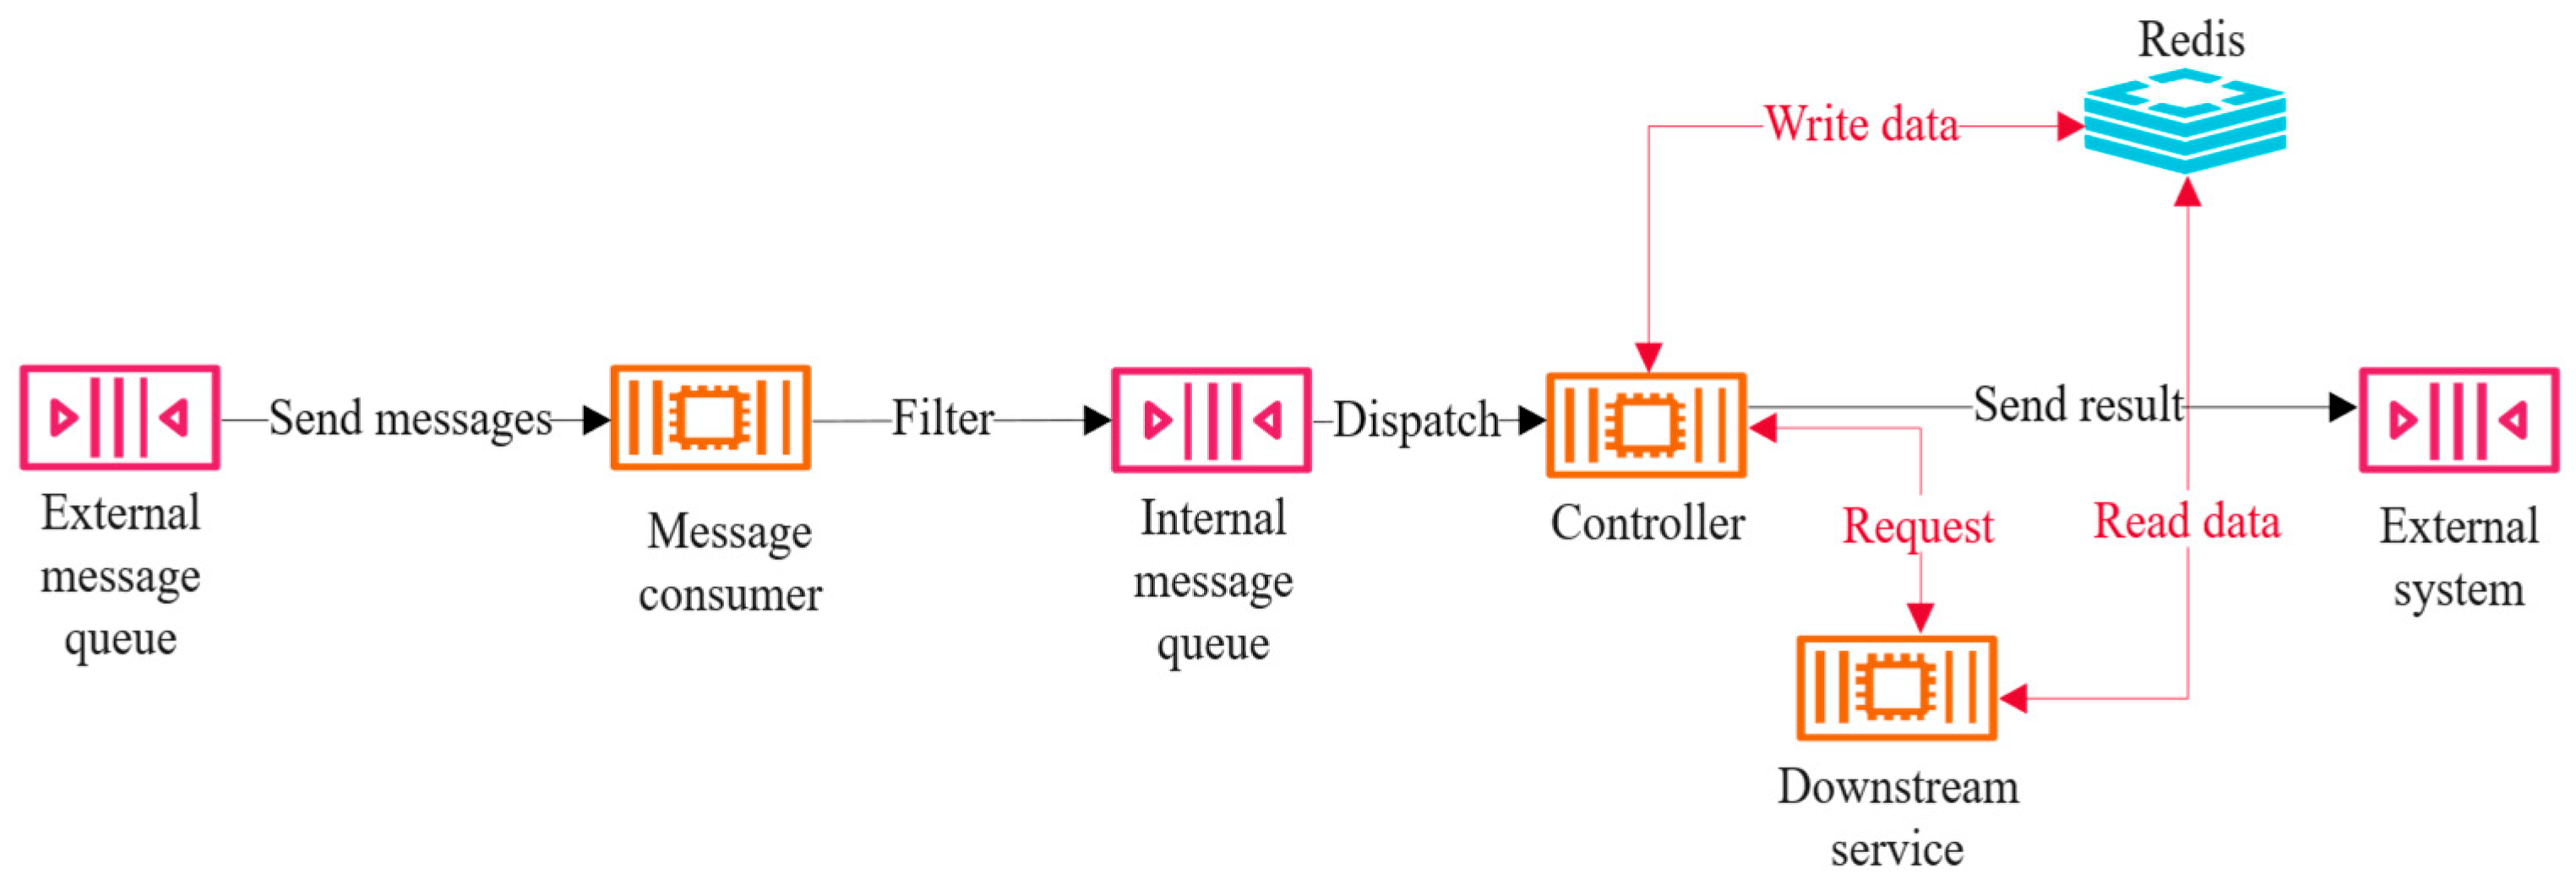
Activation of the distributed computing system occurs via an external message queue to derive promotional prices, with operations partitioned into two discrete phases. As illustrated in Figure 7, Phase 1 involves the message consumer component retrieving data from the external message queue, reformatting it for internal queue compatibility, and enqueuing the processed payloads. The external message queue continuously emits messages, which the external message consumer captures and relays to the internal message queue. In Phase 2, the service cluster extracts messages from the internal message queue, persists the data within the Redis cluster, and subsequently invokes downstream services for processing. These downstream services access the most recent Redis data, execute computations, aggregate results, and return them to the service cluster. Key system components include Redis cluster CPU utilization, service cluster CPU usage, service cluster I/O throughput, service cluster memory usage, service cluster disk utilization, service cluster messages-per-second processing capacity, external message consumer, internal message queue, external message queue, downstream service error responses, downstream service processing latency, downstream service response latency, and service cluster circuit breaker.

3.2. Dataset Preparation

The datasets used in this study primarily originate from a digital twin of an e-commerce promotional pricing distributed computing system. This system simulates real-world operating environments to generate a comprehensive dataset encompassing various fault modes and system performance indicators. The operating conditions of this experiment are set based on the requests per second (RPS) of the external message queue and internal message queue as the WPI, specifically a steady-state workload where each message queue processes 10,000 messages every 10 s. After accumulating sufficient runtime data, it is randomly divided by using stratified sampling to preserve class proportions into a training set and a test set, with 80% of the data allocated to training and the remaining 20% to testing. This procedure is repeated five times with independent train–test partitions, and the detailed experiment results in Section 3.5 correspond to the mean across these five runs.
To realistically simulate the operating conditions of the distributed computing system and enable controllable fault injection and data collection, this study constructs an experimental platform based on a digital twin of the distributed computing system. The system is deployed on the Elastic Compute Cloud instances of Amazon Web Services (AWS), utilizing high-performance c7g.xlarge instances. These instances provide high-performance computing resources capable of supporting the complexity and scale requirements of distributed system simulation. The storage and management of the UCG constructed in this study utilize the industry-leading graph database Neo4j. The fault diagnosis and auxiliary operation and maintenance framework based on large language models was developed on a MacBook Pro, equipped with an Apple M4 Pro chip, 24 GB memory, and 512 GB storage. In the intelligent agent fault diagnosis and auxiliary operation and maintenance decision-making stages, gpt-4o is selected as the core large language model. gpt-4o’s powerful reasoning and generation capabilities enable it to effectively process structured causal chain information and natural language descriptions of system states, generating high-quality diagnosis results and operation and maintenance suggestions.
Representative fault data is obtained through controlled simulation methodology incorporating pressure testing under steady-state conditions. Three fault categories are systematically induced: Redis performance degradation, message queue disruption via erroneous data injection, and downstream service invocation delays. Gremlin chaos engineering tool is employed to assess system resilience and generate comprehensive fault scenarios for experimental validation. This study emulates eight distinct fault scenarios, as delineated in Table 3, which enumerates critical anomalies such as Redis cluster capacity insufficiency, downstream service response errors, breakdowns, and capacity constraints, alongside service cluster resource limitations and downstream timeouts; these representations facilitate comprehensive evaluation of system robustness across diverse failure modes. Leveraging the seamless integration of the distributed computing system’s metrics with AWS CloudWatch monitoring, performance indicators of key components and services—captured at 10 s granularity, including CPU utilization, memory usage, network I/O, and request latency—are continuously acquired. The principal symptoms and key performance indicators monitored via AWS CloudWatch are itemized in Table 4, which details metrics such as Redis engine CPU usage, overall CPU, memory, downstream processing latency, and response latency, providing a multifaceted view of system health and anomaly detection. Through these meticulously orchestrated experimental configurations, a robust evaluation milieu is established to comprehensively validate the proposed methodology.

3.3. The Unified Causal Relationship Graph

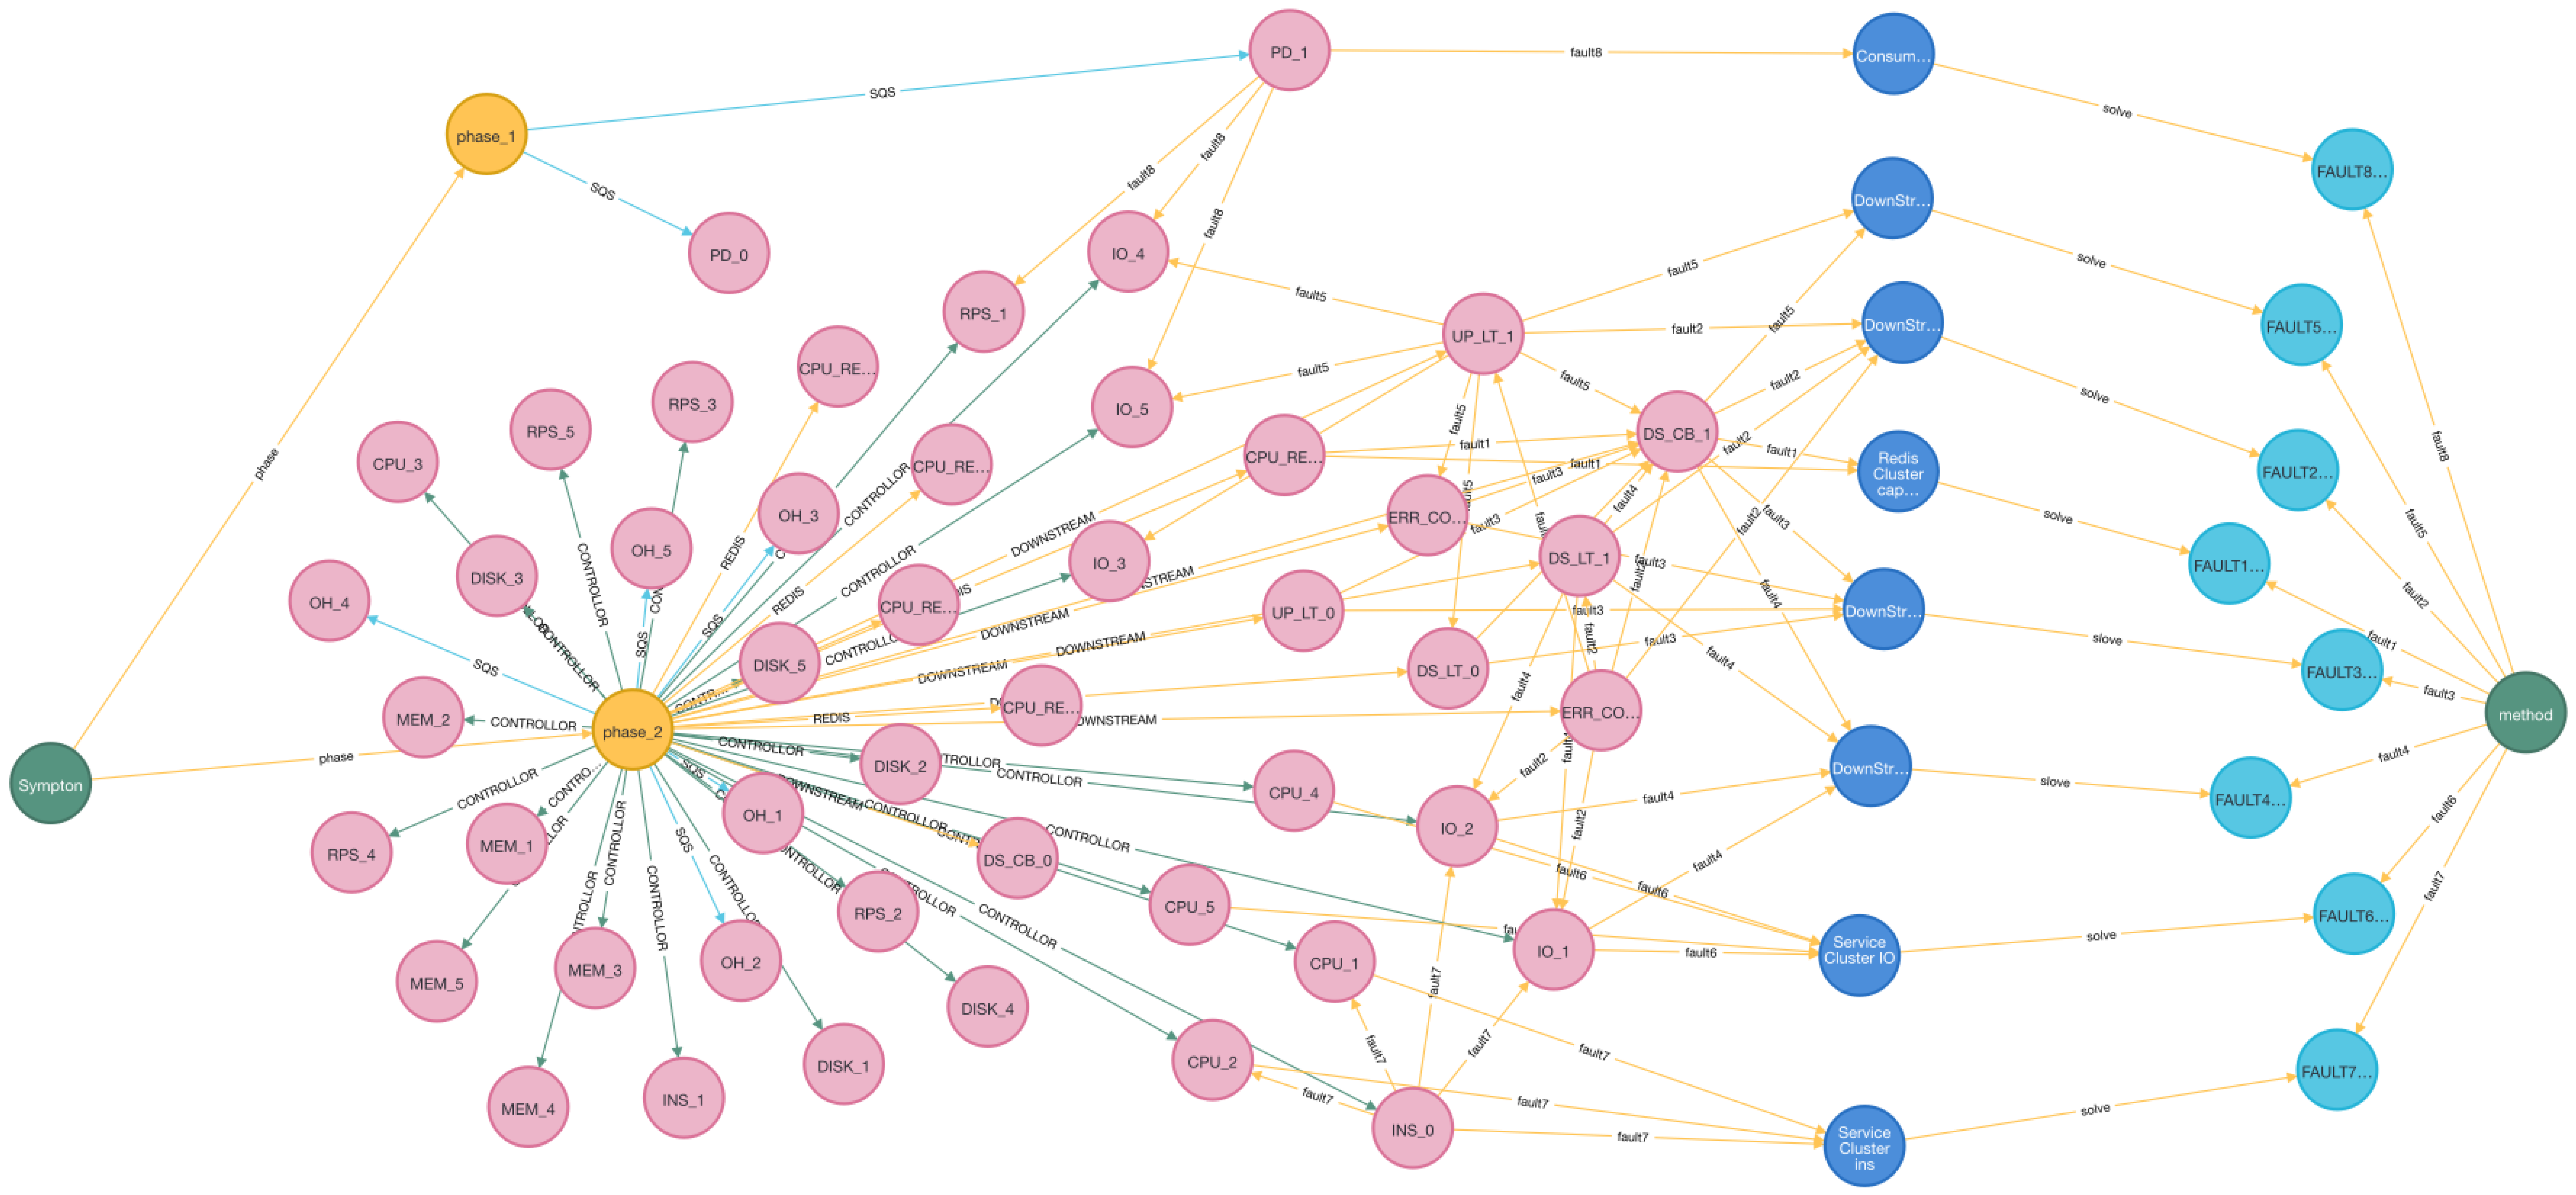
This section details the construction of the UCG and verifies its completeness. According to the method in Section 2.1.1, a distributed computing system and fault relationship architecture diagram is constructed based on domain knowledge. The basic causal graph in Section 2.1.1 is built from domain documents and tickets, while the data used in Section 2.2.2 is kept separate from those knowledge, and the coverage rate there partially supports that the UCG aligns with the observed fault context. Based on the method in Section 2.1.2, after obtaining the data following steady-state identification, this study selects OH as the WPI for working condition matching, which represents the pressure currently borne by the system. When using the K-means clustering method to identify abnormal symptoms in the normalized data after volatility calculation, the number of clusters is set to k as 5. This choice originates from the quantitative grading standards for symptoms in actual operation and maintenance systems, namely “low”, “lower”, “normal”, “higher”, and “high” five categories, which effectively cover the continuum from normal to severe abnormalities. By randomly initializing k centroids and iteratively performing assignment and update steps until the objective function converges or the maximum number of iterations is reached. In this study, based on the five-level quantitative grading standard for symptoms in actual O&M systems, the number of clusters k for K-means is set to 5. For reproducibility and clarity, K-means training uses a fixed random seed where random state is 0 and a maximum iteration budget max iteration is 300; this stops when the change in cluster centroids falls below 10−4 tolerance under the solver’s default Lloyd refinement rule, or earlier if cluster assignments no longer change between iterations. The corresponding pseudocode is provided in Figure A2. After clustering, labels are manually mapped based on the statistical position and density distribution of each cluster’s centroid: the lowest cluster as “low”, the second lowest as “lower”, the middle as “normal”, the second highest as “higher”, and the highest as “high”. As Figure 8 presents, these quantitatively graded symptom nodes are integrated into the UCG as intermediate entities in fault propagation paths, establishing directed causal relationships with system components and fault nodes. There are respectively 27, 8, 7, and 5 nodes establishing causal relationships through “controller”, “downstream”, “SQS”, and “Redis”. This includes eight operation and maintenance method nodes and eight fault nodes corresponding to eight fault relationships. In addition, it includes 47 symptom nodes, 2 phase nodes, and 2 root nodes. Different colored nodes represent different entities: green denotes the start and end points, pink denotes symptoms, blue denotes fault types, cyan denotes maintenance methods, and orange denotes service stages.

3.4. Generation of Chain of Thought

This section primarily aims to evaluate the precision of the generated chains of thought. The hit rate is calculated using the formula hr by comparing the nodes derived from abnormal symptoms identified in Section 2.2.1 with the filtered K chains-of-thought paths extracted via pruning in Section 2.2.2, selecting the maximum coverage rate as the hit rate. Each test dataset entry corresponds to a specific fault; faults are grouped to aggregate hit rates per category, thereby assessing model performance across diverse fault scenarios.
h r = m a x i = 1 x N N U C G , i
where hr represents hit rate, i represents the value of counter, X represents the number of chains, N represents the number of abnormal symptom nodes identified from system runtime data, NUCG,i represents the count of UCG nodes retrieved in the i-th group from the filtered and structured chains-of-thought ensemble.
As shown in Table 5, retrieved chains-of-thought hit rates all exceed 93%, fully satisfying the required precision standards. Figure 9 presents an example of a generated chain of thought, where the chain path is already structured, aligning with Slot X4 in the prompt design of Section 2.3. Thus, no further structural adjustments are needed, enabling direct usage and effectively reducing computational overhead.

3.5. Auxiliary Decision-Making for O&M

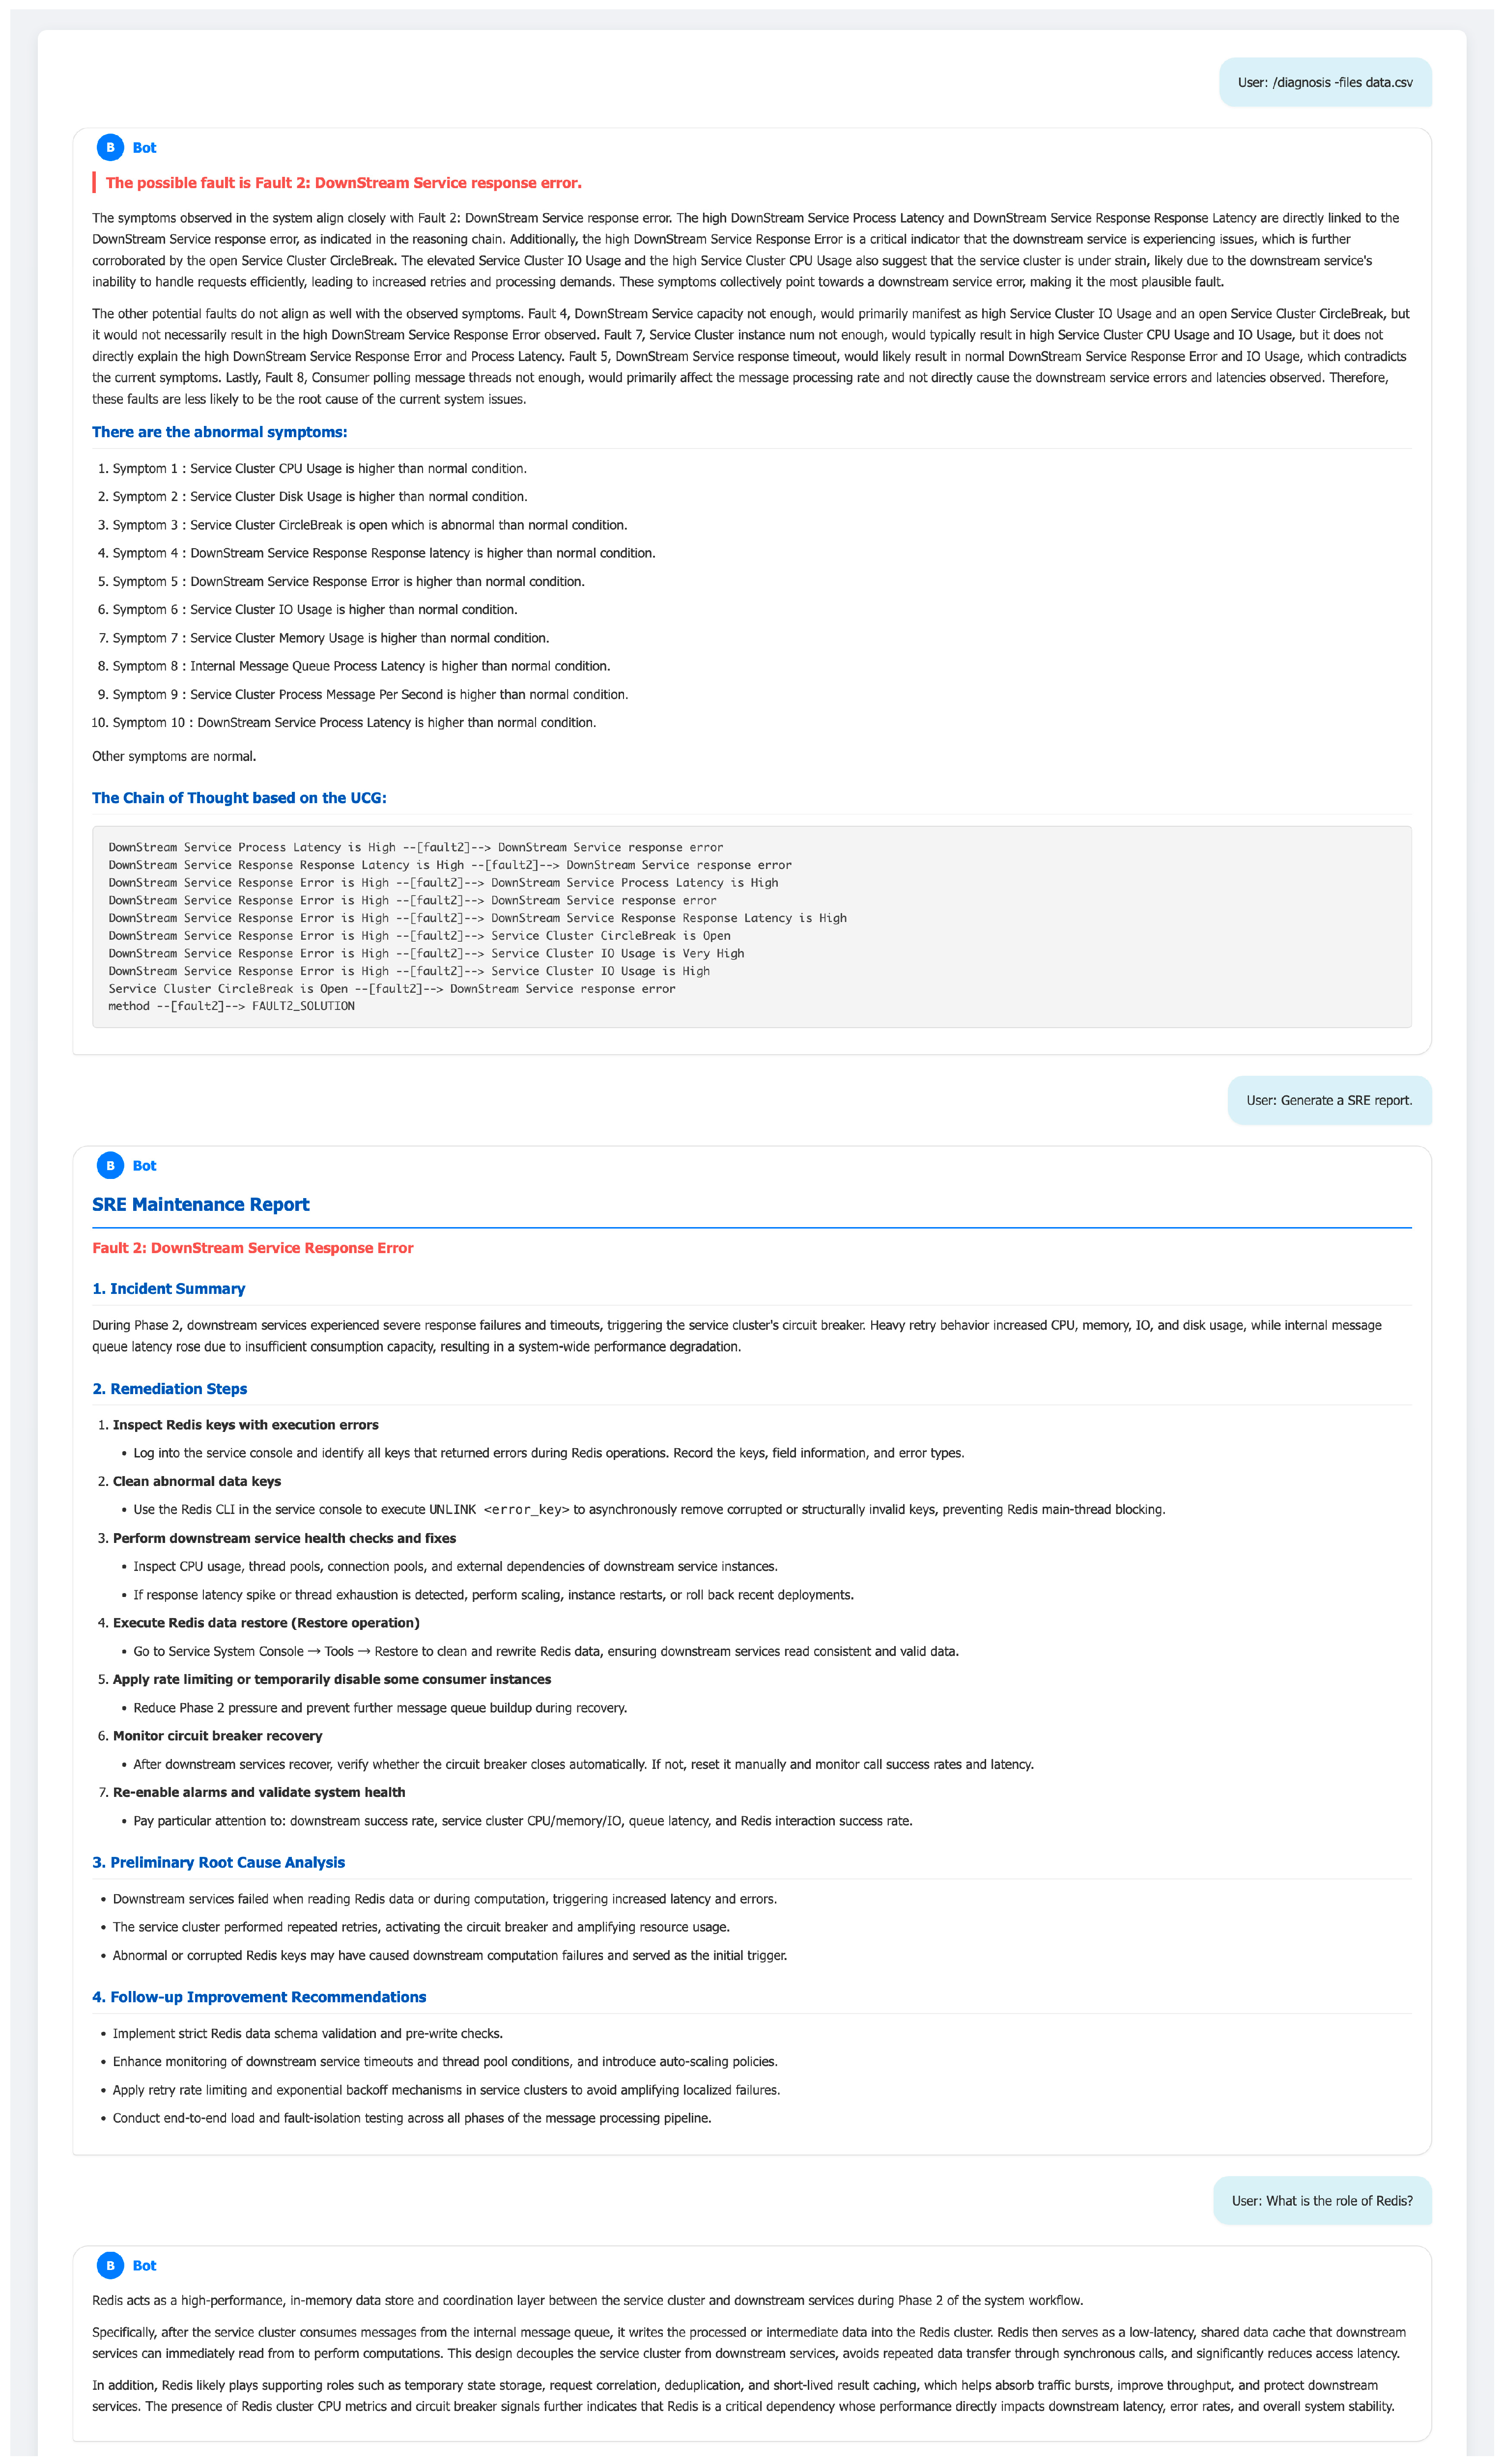
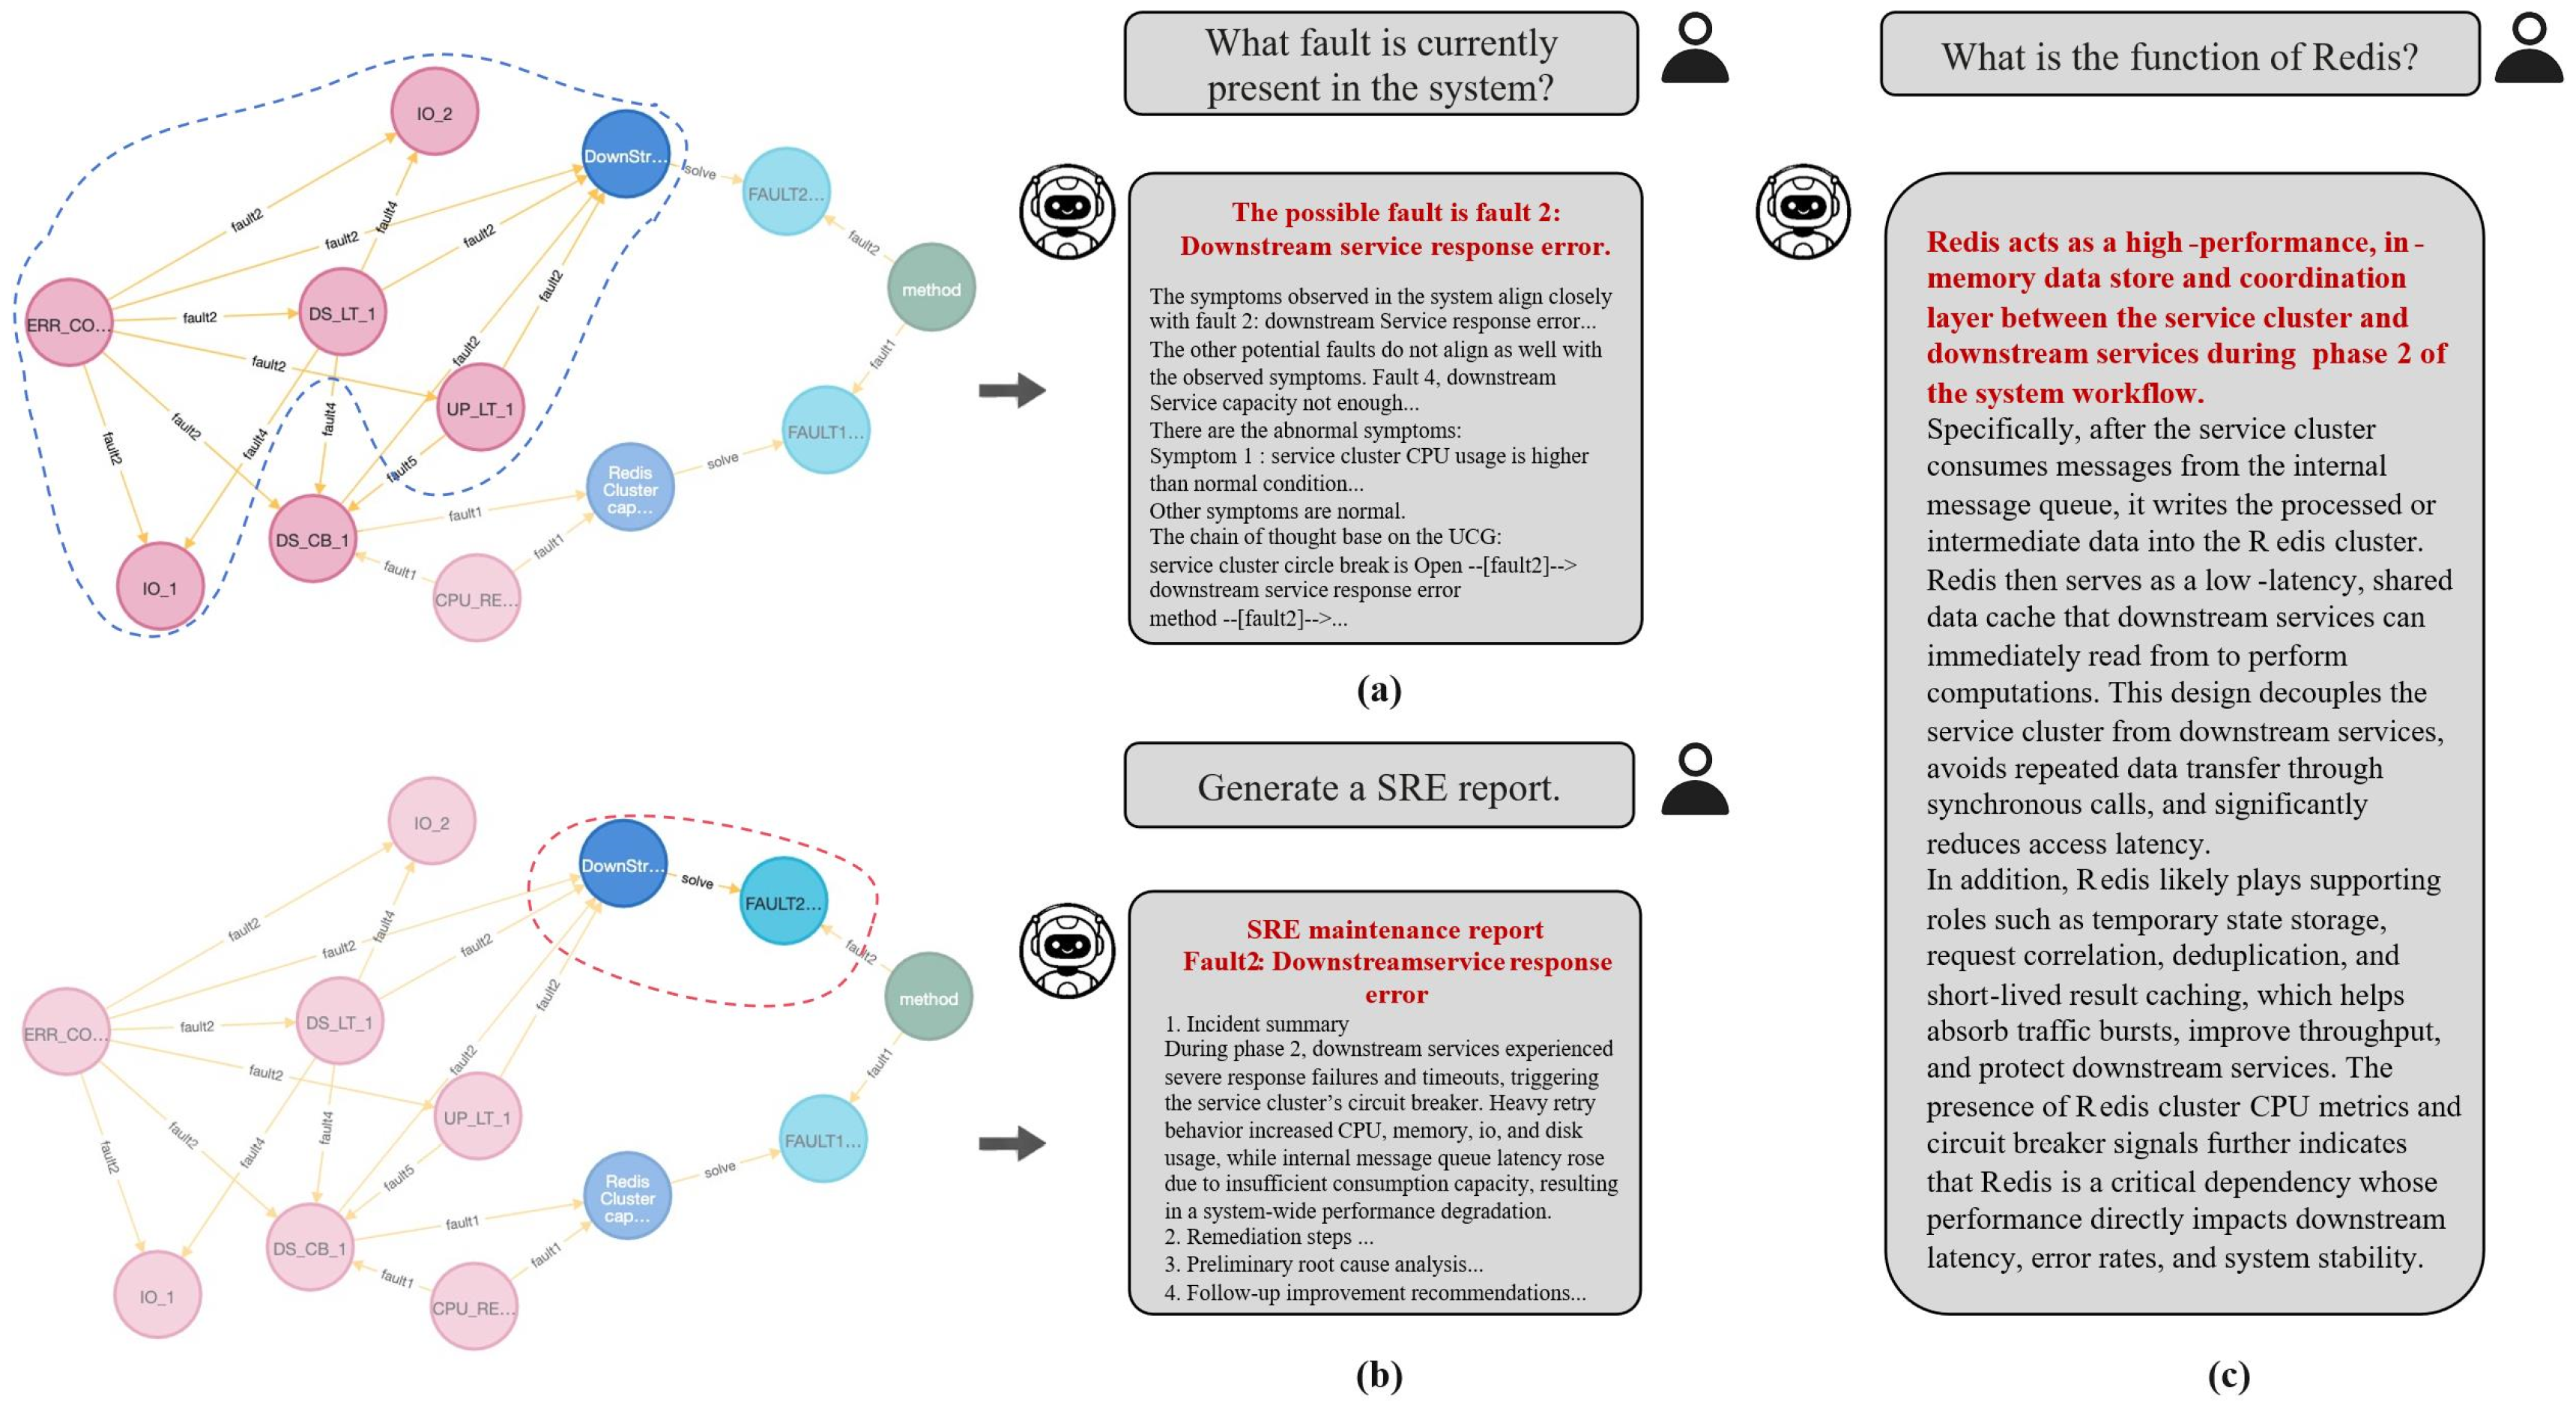
This study proposes an interactive O&M framework that launches the intelligent O&M diagnosis function via human–computer interaction. It supports users in submitting data files collected over a specific time period to AWS S3 storage, with the system executing diagnosis. Experiments employed manual uploads on fault diagnosis completion, the framework not only automatically generates O&M reports but also promptly responds to user inquiries via subsequent human–machine interactions. Figure 10 illustrates an instance of user interaction with the interactive O&M framework, yielding structured fault diagnosis conclusions based on the uploaded file, which includes the reasoning process, chain of thought, and reasons for excluding other faults. The human–machine interaction-generated O&M diagnosis report can be directly submitted to SRE personnel, providing reliable O&M methods. Furthermore, users can engage in direct conversational interactions regarding the distributed computing system and its fault diagnosis; the framework, grounded in general and domain-specific knowledge, delivers accurate answers and operational recommendations. An illustrative practical fault-diagnosis example is presented in Figure A4.
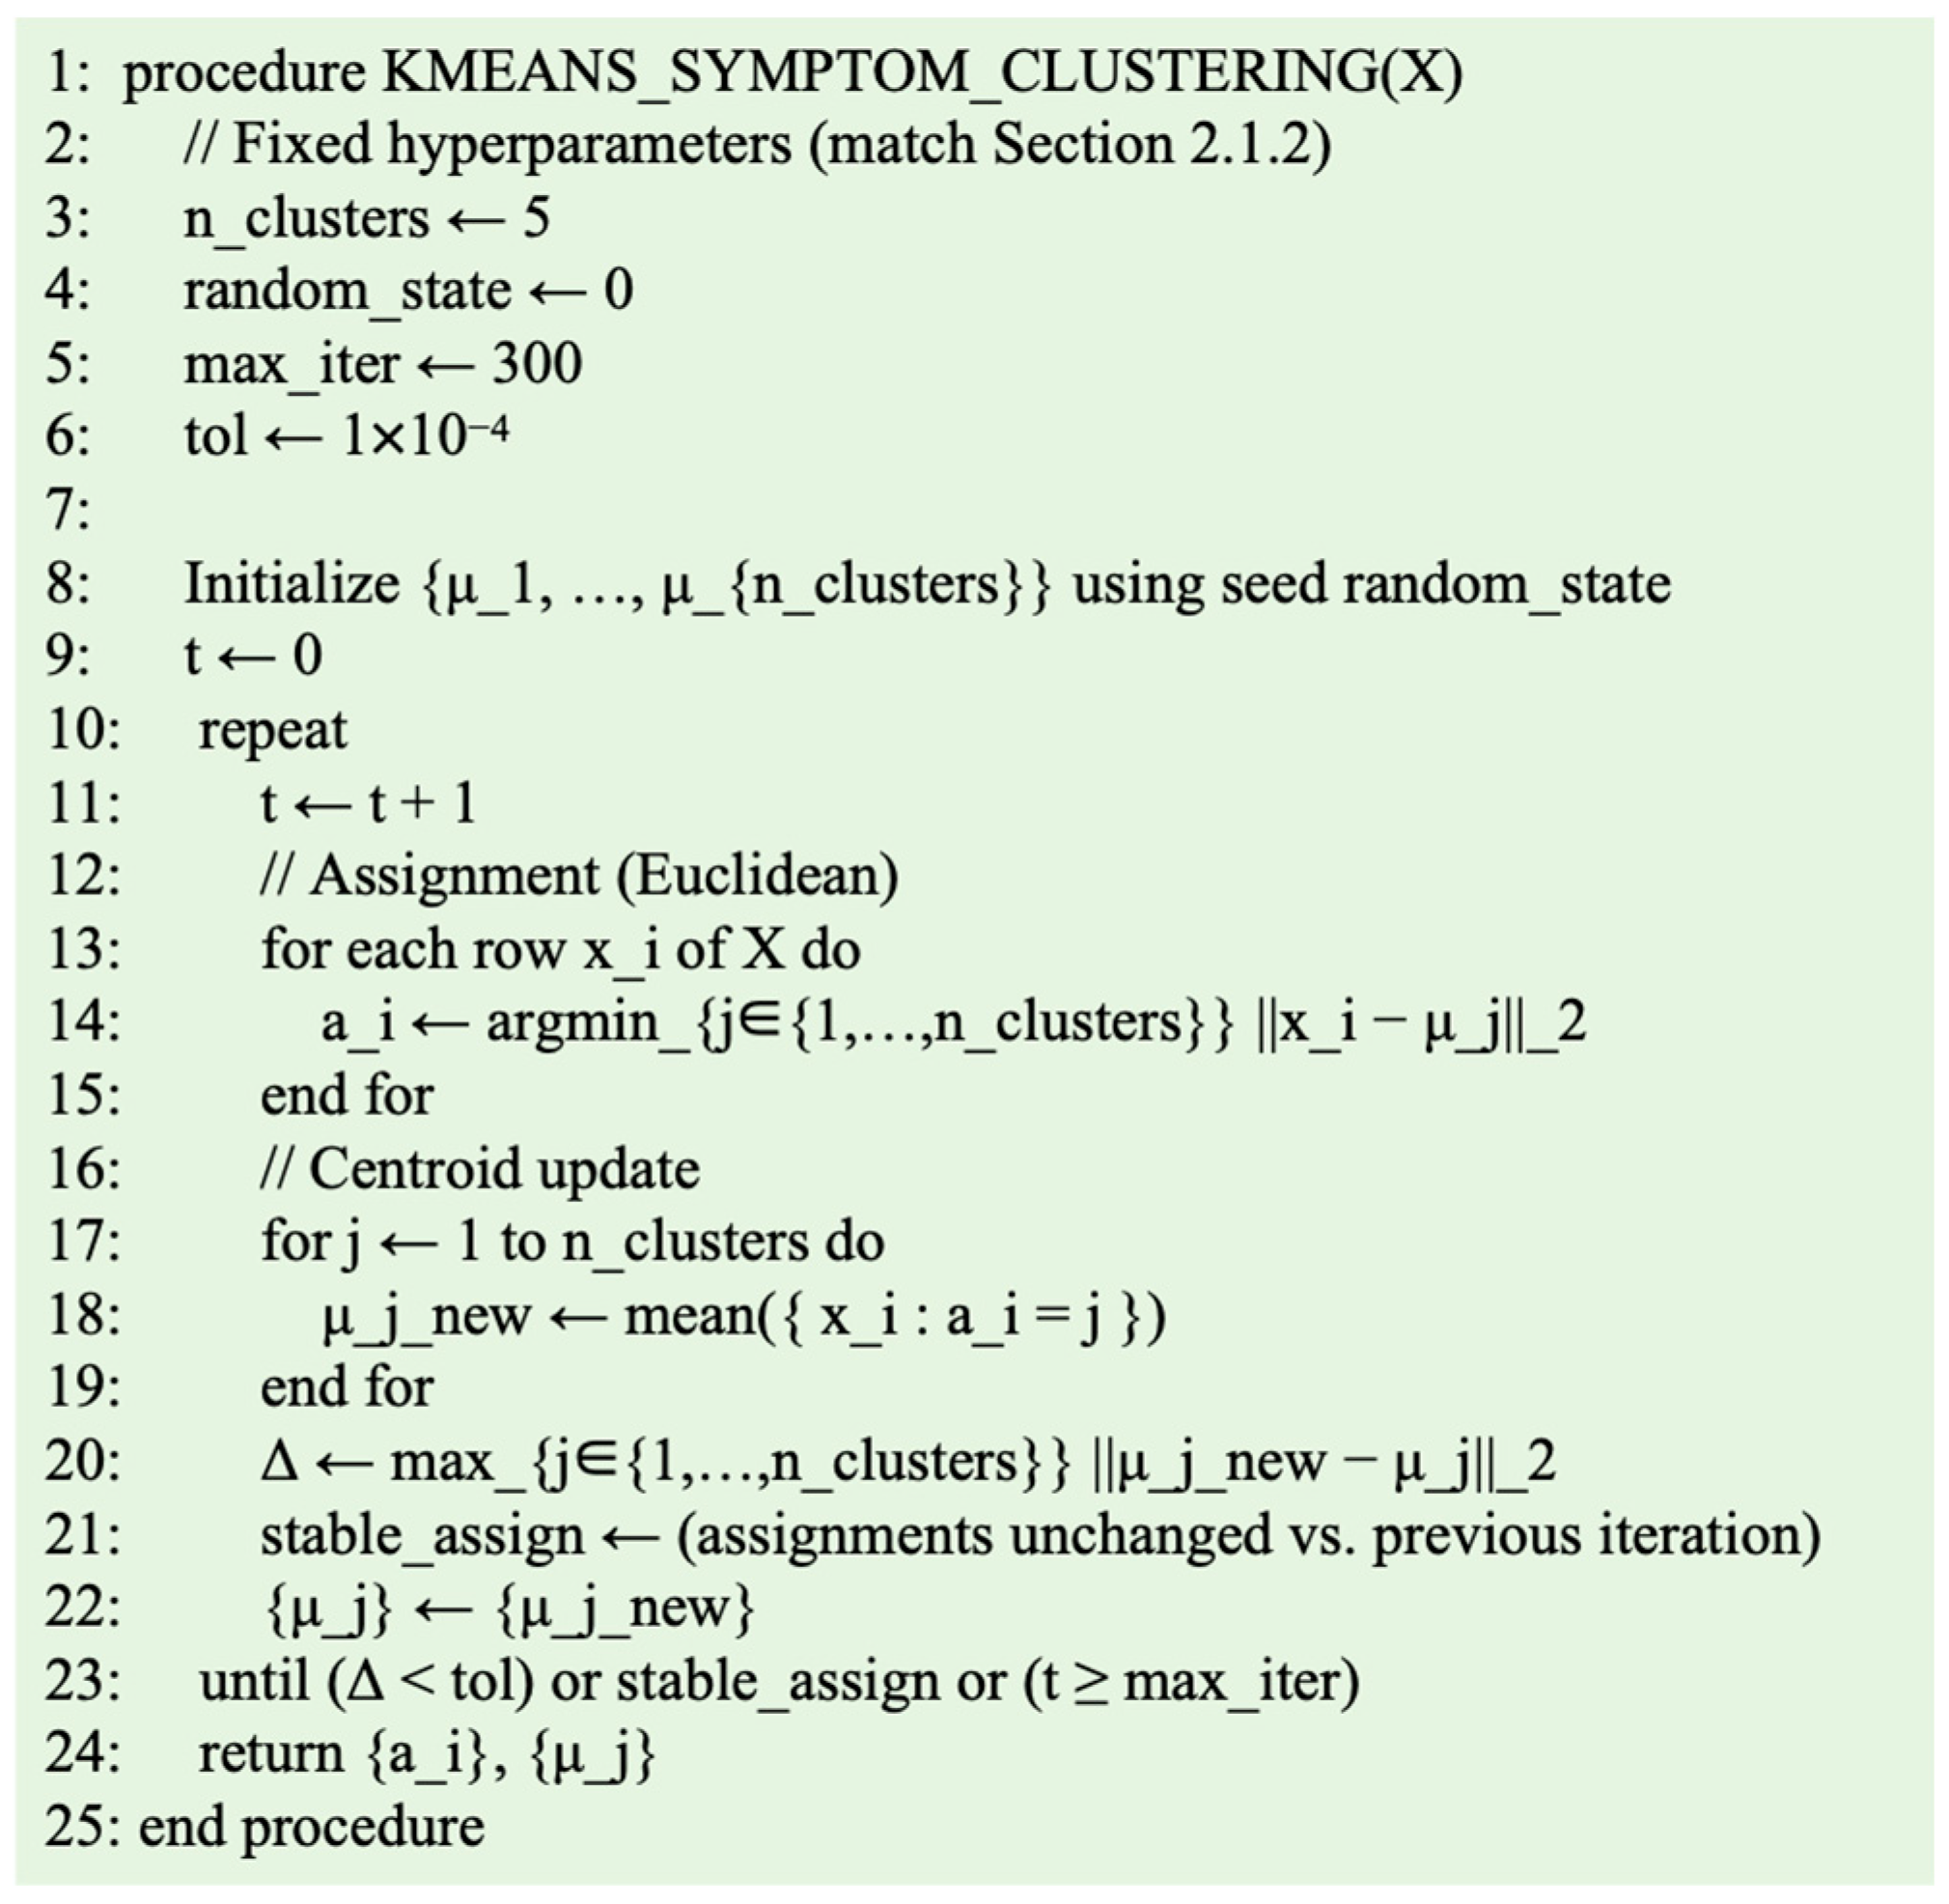
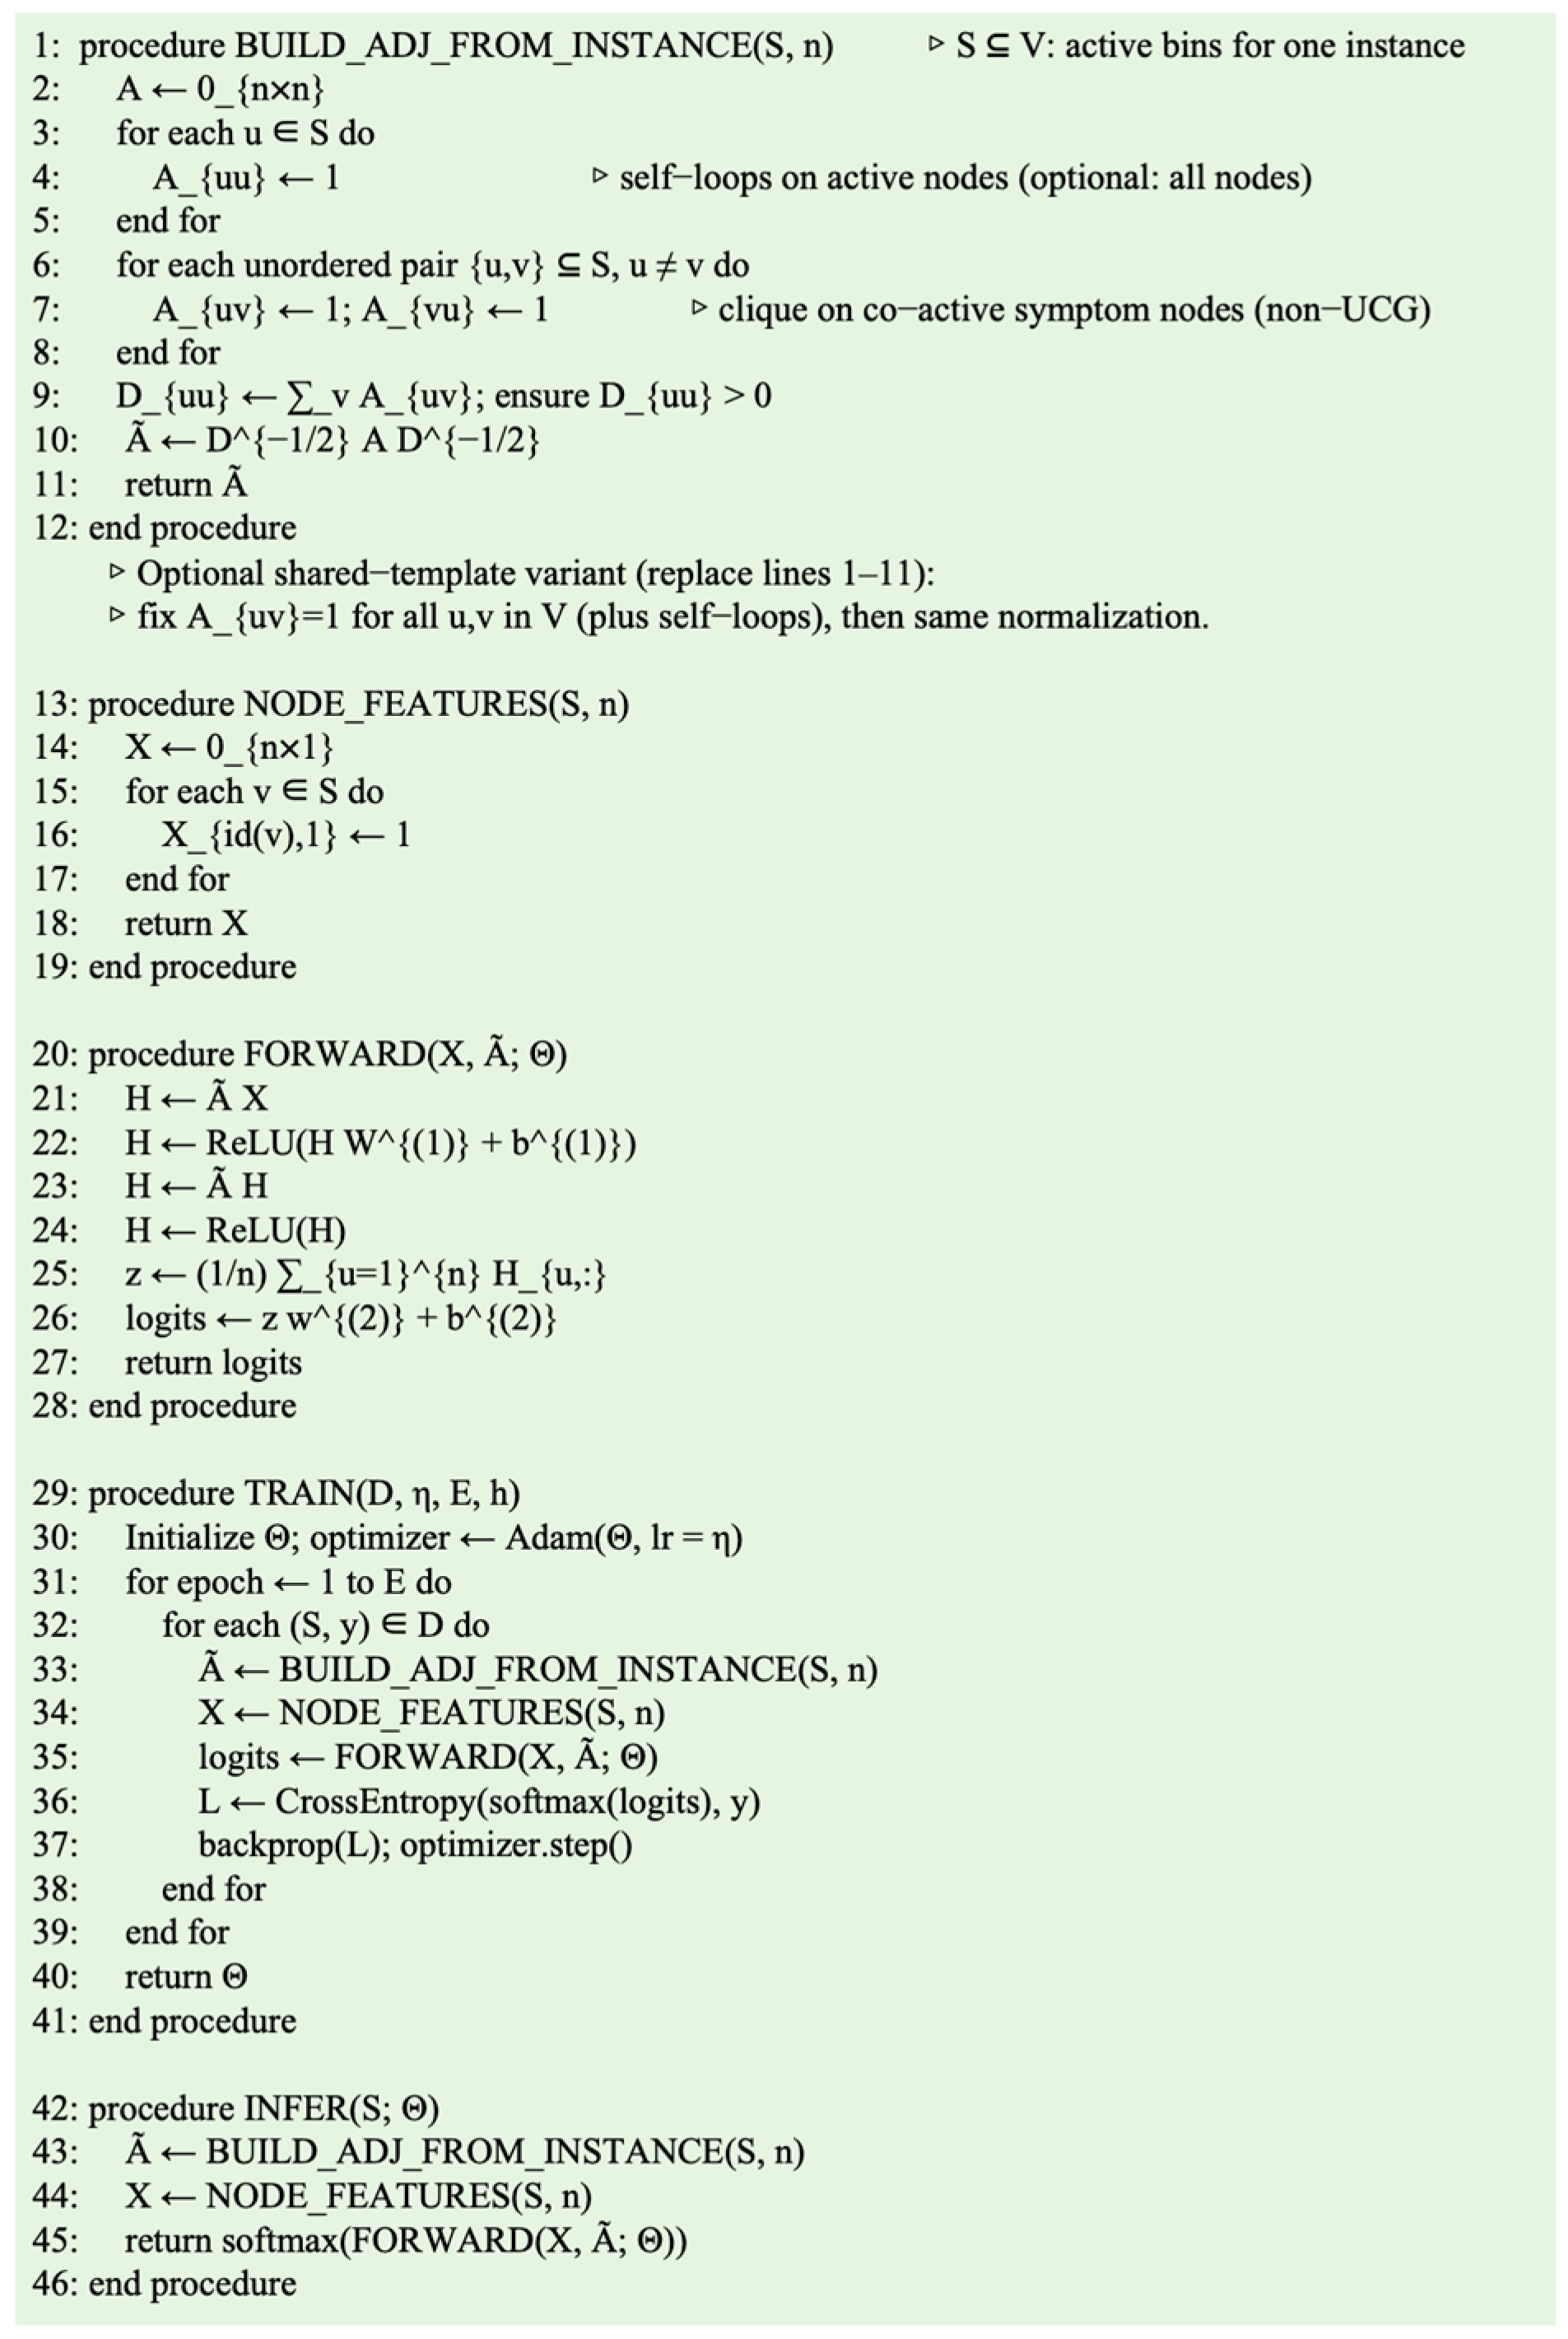
To validate the effectiveness of the auxiliary O&M decision-making module, this experiment employs ablation analysis, a systematic experimental technique that isolates the contributions of model components by sequentially removing or modifying them relative to a baseline, thereby assessing their individual impacts on overall performance [51,52]. Specifically, it compares the accuracy of four diagnostic strategies. The UCG organizes causal dependencies for structured retrieval. It is not a rule-complete semantic graph and is not used as a direct experiment group. The “Complete system” group which uses top K chains of thought proposed in this study integrates pruned chains-of-thought paths with processed system abnormal state information. These chains provide already-handled data endowed with inherent reasoning capabilities. The “With faults” group inputs all potential fault information alongside system abnormal state information. However, it lacks chains-of-thought paths. Thus, it increases the volume and complexity of information to be processed. The “With symptoms” group relies solely on raw symptom data. It omits chains-of-thought reasoning and system abnormal state information. The “With GNN” group trains a two-layer GCN-style classifier with one-dimensional binary node features over the same discretized symptom vocabulary, using the identical eight-class fault labels and stratified train–test folds as the other diagnostic strategies; for each instance, the degree-normalized adjacency is built from co-active symptom bins only. Optimization uses Adam with learning rate 10−2 for 120 epochs with cross-entropy loss. The corresponding pseudocode is provided in Figure A3.
Matching rate is assessed by comparing the highest-probability fault prediction from each strategy against the ground-truth labels, computed as the fraction of correct predictions among all test instances. For each group in Table 6, this study repeats the evaluation five times under independently sampled stratified train–test partitions and reports the mean matching rate to mitigate variability due to random splitting. As Table 6 summarizes, the “Complete system” configuration with GPT-4o improves fault matching by 41.4% and 33.5% over the “With faults” and “With symptoms” groups, respectively, and attains 100% matching accuracy on the held-out test split, substantially exceeding the “With GNN” configuration (46.5%), which suggests that graph-only side information contributes limited discriminative signals relative to the proposed UCG–chain prompting under the present evaluation. Smaller backbones such as QWEN3-8B exhibit markedly lower matching rates under the same row labels, indicating strong sensitivity to model scale, whereas high-capacity models show stable, consistently high performance when supplied with the complete structured inputs. These findings are restricted to the eight injected fault scenarios evaluated on the digital twin of an e-commerce promotional pricing distributed computing system.
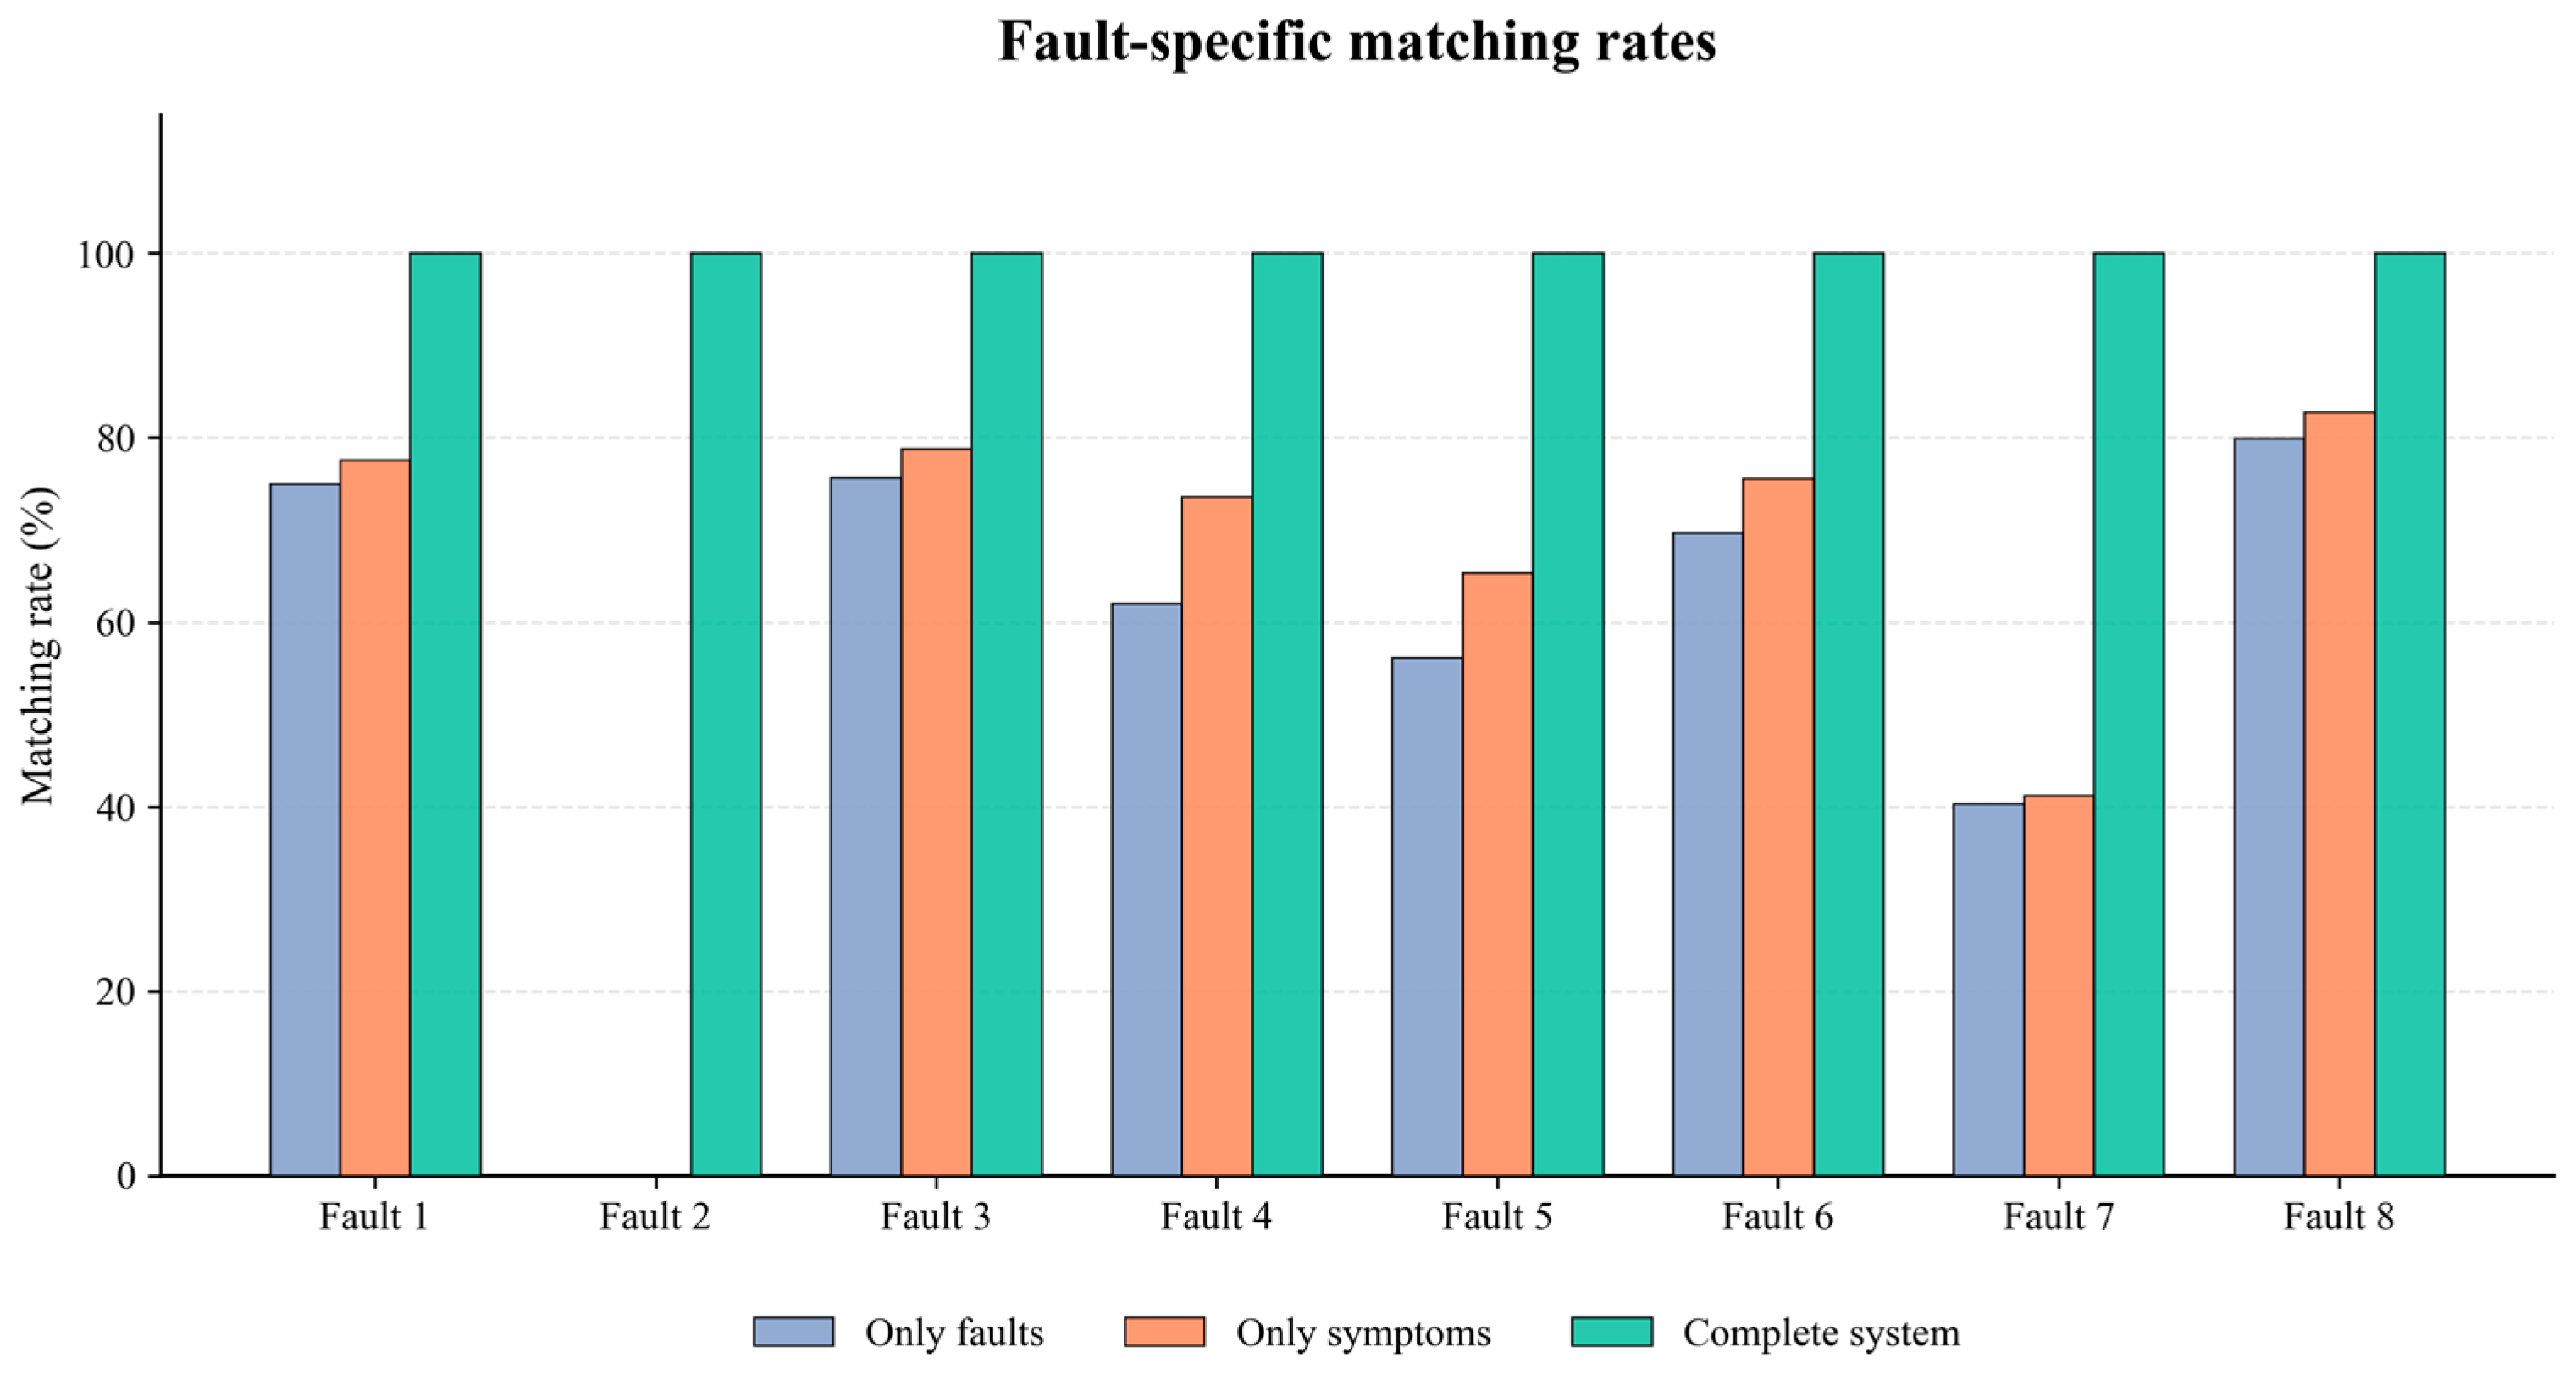
Furthermore, the detailed experiment based on GPT-4o conducts detailed matching rate evaluations across different fault groups, with results presented in Figure 11. The “Complete system” group demonstrates substantial diagnostic improvements across all fault categories, with the most significant enhancement observed in Fault 7, showing 59.7% improvement over the “With faults” approach and 58.8% over the “With symptoms” method. The minimum improvement is recorded in Fault 8, with 20.1% and 17.2% enhancements respectively. On average, the study achieves 32.6% improvement over the “With faults” method and 29.4% over the “With symptoms” strategy. Notably, for highly confounding complex faults such as Fault 2 and Fault 7, the proposed causal reasoning framework with multi-round interactive verification significantly enhances diagnostic reliability in concurrent multi-fault and incomplete observation scenarios, where single feature matching approaches fail to achieve accurate fault localization.

4. Discussion

4.1. The Advantages of Method

This study brings several significant advantages to distributed computing systems, effectively addressing the limitations of existing methods. It has the following three advantages:
  • Precision enhancement: This study demonstrates notable advantages in precision enhancement through its innovative integration of domain expertise and data-driven approaches. At the core of this approach is the construction of the UCG, which effectively combines domain expert knowledge with advanced data-driven algorithms to address the inherent limitations in knowledge completeness and generalization capabilities that have plagued traditional fault diagnosis methods. With the generated diagnostic reasoning chains-of-thought achieving retrieval hit rates exceeding 93% across a diverse set of fault types, and certain fault categories even approaching optimal performance levels.
  • Reliability improvement: This study demonstrates remarkable reliability performance in complex fault scenarios, particularly under conditions of concurrent multi-fault occurrences and incomplete observation environments. Experimental analysis further reveals that the employed strategy achieves substantial improvements in overall matching performance, with accuracy enhancements of approximately 41% and 34% compared to the “With faults” and “With symptoms” groups, respectively. Notably, the framework is capable of accurately diagnosing faults even in highly convoluted and complex fault situations.
  • Interpretability enhancement: This study significantly improves diagnostic process transparency through the synergistic integration of LLMs with knowledge graphs. The LLM-generated diagnostic results encompass not only the most probable fault identification but also provide detailed logical justifications, causal propagation pathways, and rationales for excluding alternative fault candidates.

4.2. Limitations and Future Research Directions

4.2.1. Limitation Evaluation on a Single Distributed Computing System

A central limitation of this work stems from the scarcity of large-scale, publicly available, and high-fidelity fault-diagnosis corpora for distributed computing systems. In practice, representative fault incidents are often fragmented across proprietary logs, partial observability, and inconsistent annotation, which constrains objective benchmarking, fair cross-method comparison, and rigorous assessment of generalization beyond the conditions captured in the curated evaluation material. Consequently, the reported results should be interpreted as evidence under a fixed evaluation protocol and label set, rather than as guarantees that transfer unchanged to arbitrary production deployments or heterogeneous system architectures. Future research should prioritize curating and releasing standardized datasets (broader fault categories, richer telemetry, and documented ground truth) to enable more definitive comparisons and community-wide progress.

4.2.2. Pre-Training and Fine-Tuning of Domain-Specific LLMs

The auxiliary operation and maintenance decision suggestion method proposed in this paper aims to achieve accurate diagnosis by integrating LLMs with reasoning chains-of-thought. However, current LLMs have not been trained specifically for fault diagnosis in distributed computing systems, thus sometimes failing to understand the causal relationships between faults and symptom variables, and lacking comprehension of domain-specific terminology. Errors in LLM responses during human–computer interaction can interfere with the user’s O&M decision-making process. Therefore, pre-training and fine-tuning a large language model tailored to the distributed computing systems domain can significantly enhance the model’s understanding of specialized terminology and complex causal logic in this field. Quantification of LLM output variability under repeated decoding, alongside domain-specific pre-training or fine-tuning, is reserved for subsequent work.

4.2.3. Explainability Techniques for LLMs in Distributed Computing Systems

The method proposed in this paper enhances the interpretability of fault diagnosis to a certain extent. However, the interpretability of full-process details remains deficient. Although the output results of large language models exhibit a degree of interpretability, the models themselves remain as black boxes, preventing the output and analysis of their decision-making processes. Future research is expected to develop more transparent and interpretable LLM architectures, enabling clear presentation and verification of the models’ internal reasoning processes and attribution logic, thereby further enhancing user trust in the intelligent diagnosis system.

4.2.4. Expand Baselines and O&M-Recommendation Assessment

The current protocol reports held-out fault matching and Table 6 ablations but does not yet include fairly matched non-graph baselines like RF and LSTM, all under the same labels and splits. O&M recommendations are likewise scored only indirectly through the fault-matching setup; actionability ratings, runbook-aligned executability checks, or timeline-based replay metrics remain to be added so that operational guidance is evaluated on outcomes, not on fault labels alone. These items constitute an immediate priority for the following study.

5. Conclusions

This study proposes an innovative fault diagnosis framework that organically integrates large language models with knowledge graphs to address the complex challenges faced in fault diagnosis within distributed computing systems. To overcome the limited generalization capability of traditional data-driven methods, the high construction costs of knowledge-driven methods, and the shortcomings of general LLMs in domain knowledge acquisition.
This study proposes constructing a UCG by fusing domain expert knowledge with data-driven algorithms. This effectively compensates for the deficiencies of traditional methods in knowledge completeness and generality, significantly enhancing the accuracy and reliability of fault diagnosis. The method introduces automatic generation of diagnostic reasoning chains-of-thought based on system states, dynamically retrieving and constructing relevant causal paths from the UCG according to runtime states and anomalous symptoms to form clear, interpretable reasoning chains. Experimental results showed that within the controlled condition, the approach consistently performs accurate fault identification across the eight studied fault scenarios, furnishing structured, high-fidelity inputs for LLM inference and improving O&M transparency and precision under the same controlled setting.
Furthermore, the proposed fault diagnosis and auxiliary operation and maintenance framework leverages the powerful capabilities of LLMs for fault diagnosis and auxiliary O&M decision-making, simulating expert diagnostic protocols to not only identify the most probable fault roots but also provide detailed diagnostic rationales, reasoning paths, tailored O&M recommendations, and executable reports. In terms of O&M diagnose accuracy, significantly outperforming baseline approaches that rely solely on fault information or symptom data, particularly in its robust performance when handling complex and rare fault scenarios. While the study has showcased notable advantages, there remains room for further exploration to enhance the methodology’s capabilities.

Author Contributions

Conceptualization, Y.G., J.Z. and Y.D.; methodology, Y.G. and J.Z.; software, Y.G.; validation, Y.G., J.Z. and Y.D.; formal analysis, Y.G.; investigation, Y.G.; resources, Y.G.; data curation, Y.G.; writing—original draft preparation, Y.G.; writing—review and editing, Y.G., J.Z. and Y.D.; visualization, Y.G.; supervision, Y.D.; project administration, Y.D. All authors have read and agreed to the published version of the manuscript.

Funding

This research received no external funding.

Data Availability Statement

The data supporting the conclusions of this study are available upon request from the corresponding author, as the source code cannot be publicly released due to confidentiality agreements.

Acknowledgments

During the preparation of this manuscript, the authors used generative AI tools (Gemini 2.5, ChatGPT-4o and Nano Banana Pro) for the purposes of English language polishing, grammar checking and generating initial ideas for figures. The authors have reviewed and edited the output and take full responsibility for the content of this publication. Additionally, ChatGPT-4o was employed as an experimental component in the fault diagnosis study, as detailed in the methodology section.

Conflicts of Interest

The authors declare no conflicts of interest.

Abbreviations

The following abbreviations are used in this manuscript:
cThe normalization factor
cjThe j-th cluster
dEuclidean distance
EAverage path length of all isolation trees
hThe path lengths of data
hrHit rate
iThe value of counter
JObjective function value
KNumber of filtered chains-of-thought which is 3
kPreset number of clusters which is 5
NThe number of abnormal symptom nodes
NUCG,iThe count of UCG nodes retrieved
nThe sampling size
XThe number of chains
xData point of cj
xcurrentCurrent metric value
xnormalMean historical value of metric
xmaxMaximum historical value of metric
xminMinimum historical value of metric
PSet of steady-state data points
QSet of history steady-state data points
pThe working pressure indicator of sets P
qThe working pressure indicator of sets Q
VolatilityVolatility of symptoms deviating from their normal values
sAnomaly score
ssubThe collection of abnormal symptom nodes
sactThe set of empirically identified abnormal symptom nodes
μjCentroid of the j-th cluster

Appendix A

Table A1. Representative fault diagnosis works.
Representative ApproachCore MechanismData AssumptionsInterpretability
Classical supervised learningLearn feature-to-fault mapping from labeled examples.Requires sufficient, representative labeled data.Moderate overall; deep models tend toward black-box behavior.
Unsupervised learningDiscover latent structure or anomalies without dense supervision.Weak labels or none.Structural patterns can be explained; semantic fault naming remains weak.
Knowledge-driven diagnosisEncode expert if–then logic or probabilistic graphical inference.Depends on curated expert knowledge and maintenance.High when rules or graphs are complete; brittle when coverage is incomplete.
Few-shot cross-domain learningMeta-learning plus optimization to relieve scarce target-domain samples.Labeled source domain; few target-domain samples.Moderate.
High-resolution time–frequency feature learningPhysically motivated time–frequency features followed by a classifier.Fault-related vibration or process signals.Strong at the feature level; less explicit on end-to-end decision logic.
GNNs on multivariate sensor graphsTrainable graph adjacency with GNN encoding of variable relations.Variable graph construction plus labels for training.Graph topology and neighborhoods provide partial explanations.
Recurrent GCN for sensor FDI&ARecurrent graph convolutions for detection, isolation, and accommodation of sensor faults.Sensing streams aligned with twin or network topology.Structure- and residual-based analyses are feasible.
Data-driven learningBayesian filtering on residuals plus open-set separation of known vs. unknown faults.Residual and operating-condition trajectories.Moderate; statistical summaries of residuals are inspectable.
LLM-assisted O&M/cloud incident RCALLMs read incidents, logs, and reports to attribute root causes in natural language.Unstructured incident text plus O&M corpora.Strong natural-language rationales; weaker guarantees on structured causal consistency.
LLM-based industrial fault diagnosis from sensor narrativesPrompting or light fine-tuning so LLMs consume textualized sensor context.Domain corpora and careful prompt design.Natural-language explanations; limited built-in graph-level structure.
Fine-tuning for LLM domain adaptationUpdate model parameters to fit target-domain language and tasks.High-cost curated annotations and compute for adaptation.Moderate; explanations depend on prompting and post hoc tools unless constrained.
Retrieval-Augmented Generation (RAG)Retrieve external documents or passages at inference to ground generations without full retraining.Quality and coverage of the external knowledge base dominate performance.Retrieved citations are traceable; flat retrieval still limits multi-hop relational reasoning.
Graph RAGEncode external or operational knowledge as a graph, then couple with LLM reasoning or generation.Requires building and maintaining a domain event/knowledge graph.High: explicit graph structure plus LLM-generated rationales.
AIOps/microservice RCAJoint use of logs, traces, metrics, and optionally LLMs for incident understanding and localization.Cloud-native observability stacks.Interpretability varies by pipeline stage and tooling; component-level clarity is uneven.

Appendix B

Figure A1. Data-driven edge augmentation pseudocode.
Electronics 15 02359 g0a1
Figure A2. K-means symptom hyperparameters and Lloyd refinement clustering pseudocode.
Electronics 15 02359 g0a2
Figure A3. GNN fault group pseudocode.
Electronics 15 02359 g0a3

Appendix C

Figure A4. Fault diagnosis example.
Electronics 15 02359 g0a4

References

  1. Van Steen, M.; Tanenbaum, A.S. A Brief Introduction to Distributed Systems. Computing 2016, 98, 967–1009. [Google Scholar] [CrossRef]
  2. Khole, A.; Thakar, A.; Kulkarni, A.; Jadhav, H.; Shende, S.; Karajkhede, V. A Compendium on Distributed Systems. arXiv 2023, arXiv:230203990. [Google Scholar] [CrossRef]
  3. Coulouris, G.; Dollimore, J.; Kindberg, T. Distributed Systems: Concepts and Design, 3rd ed.; Addison Wesley: Reading, MA, USA, 2001. [Google Scholar]
  4. Xingang, W. A Research Review of Distributed Computing System. In Recent Developments in Intelligent Computing, Communication and Devices; Springer: Berlin/Heidelberg, Germany, 2018; pp. 357–368. [Google Scholar]
  5. Adel, A.; Alani, N.H.; Jan, T.; Prasad, M. A Review of Major ICT Failures and Recovery Strategies: Strengthening Digital Resilience. Comput. Secur. 2025, 159, 104678. [Google Scholar] [CrossRef]
  6. Gorbenko, A.; Romanovsky, A.; Tarasyuk, O. Fault Tolerant Internet Computing: Benchmarking and Modelling Trade-Offs between Availability, Latency and Consistency. J. Netw. Comput. Appl. 2019, 146, 102412. [Google Scholar] [CrossRef]
  7. Costa, V.G.; Pedreira, C.E. Recent Advances in Decision Trees: An Updated Survey. Artif. Intell. Rev. 2023, 56, 4765–4800. [Google Scholar] [CrossRef]
  8. Rodriguez, E.; Otero, B.; Gutierrez, N.; Canal, R. A Survey of Deep Learning Techniques for Cybersecurity in Mobile Networks. IEEE Commun. Surv. Tutor. 2021, 23, 1920–1955. [Google Scholar] [CrossRef]
  9. Ren, Y.-S.; Ma, C.-Q.; Kong, X.-L.; Baltas, K.; Zureigat, Q. Past, Present, and Future of the Application of Machine Learning in Cryptocurrency Research. Res. Int. Bus. Financ. 2022, 63, 101799. [Google Scholar] [CrossRef]
  10. Fotopoulou, S. A Review of Unsupervised Learning in Astronomy. Astron. Comput. 2024, 48, 100851. [Google Scholar] [CrossRef]
  11. Ademujimi, T.; Prabhu, V. Fusion-Learning of Bayesian Network Models for Fault Diagnostics. Sensors 2021, 21, 7633. [Google Scholar] [CrossRef]
  12. Nan, C.; Khan, F.; Iqbal, M.T. Real-Time Fault Diagnosis Using Knowledge-Based Expert System. Process Saf. Environ. Prot. 2008, 86, 55–71. [Google Scholar]
  13. Lee, J.M.; Kim, J.H. An Integration of Heuristic and Model-Based Reasoning in Fault Diagnosis. Eng. Appl. Artif. Intell. 1993, 6, 345–356. [Google Scholar] [CrossRef]
  14. Zhao, H.; Liu, C.; Dang, X.; Xu, J.; Deng, W. Few-Shot Cross-Domain Fault Diagnosis of Transportation Motor Bearings Using MAML-GA. IEEE Trans. Transp. Electrif. 2025, 12, 1165–1174. [Google Scholar] [CrossRef]
  15. Deng, W.; Guan, H.; Zhao, H. Parameterized Iterative Time-Frequency-Multisqueezing Transform for Bearing Fault Diagnosis. IEEE Trans. Instrum. Meas. 2025, 74, 1–11. [Google Scholar]
  16. Kovalenko, A.; Pozdnyakov, V.; Makarov, I. Graph Neural Networks with Trainable Adjacency Matrices for Fault Diagnosis on Multivariate Sensor Data. IEEE Access 2024, 12, 152860–152872. [Google Scholar] [CrossRef]
  17. Darvishi, H.; Ciuonzo, D.; Rossi, P.S. Deep Recurrent Graph Convolutional Architecture for Sensor Fault Detection, Isolation, and Accommodation in Digital Twins. IEEE Sens. J. 2023, 23, 29877–29891. [Google Scholar] [CrossRef]
  18. Jung, D. Data-Driven Open-Set Fault Classification of Residual Data Using Bayesian Filtering. IEEE Trans. Control Syst. Technol. 2020, 28, 2045–2052. [Google Scholar] [CrossRef]
  19. Zhang, B.; Yin, C.; Liu, K.; Zhai, X.; Sun, Y.; Du, M. Research on the Construction of Geographic Knowledge Graph Integrating Natural Disaster Information. ISPRS Ann. Photogramm. Remote Sens. Spat. Inf. Sci. 2022, 10, 79–85. [Google Scholar] [CrossRef]
  20. Liu, S.; Zhou, Y.; Ying, L.; Tian, Y.; Zhang, J.; Zhou, S.; Cui, W.; Lin, Q.; Moscibroda, T.; Zhang, H.; et al. Rcinvestigator: Towards Better Investigation of Anomaly Root Causes in Cloud Computing Systems. arXiv 2024, arXiv:240515571. [Google Scholar] [CrossRef] [PubMed]
  21. Nikpour, H.; Aamodt, A. Fault Diagnosis under Uncertain Situations within a Bayesian Knowledge-Intensive Cbr System. Prog. Artif. Intell. 2021, 10, 245–258. [Google Scholar] [CrossRef]
  22. Chen, Y.; Xie, H.; Ma, M.; Kang, Y.; Gao, X.; Shi, L.; Cao, Y.; Gao, X.; Fan, H.; Wen, M.; et al. Automatic Root Cause Analysis via Large Language Models for Cloud Incidents. In Proceedings of the Nineteenth European Conference on Computer Systems; Association for Computing Machinery: New York, NY, USA, 2024; pp. 674–688. [Google Scholar]
  23. Lee, X.Y.; Vidyaratne, L.; Farahat, A.; Gupta, C. Exploring LLM-Based Frameworks for Fault Diagnosis. arXiv 2025, arXiv:250923113. [Google Scholar] [CrossRef]
  24. Yang, T.-L.; Liu, J.-S.; Tseng, Y.-H.; Jang, J.-S.R. Knowledge Retrieval Based on Generative AI. arXiv 2025, arXiv:250104635. [Google Scholar] [CrossRef]
  25. Zhang, J.; Zhang, C.; Lu, J.; Zhao, Y. Domain-Specific Large Language Models for Fault Diagnosis of Heating, Ventilation, and Air Conditioning Systems by Labeled-Data-Supervised Fine-Tuning. Appl. Energy 2025, 377, 124378. [Google Scholar] [CrossRef]
  26. Gao, Y.; Xiong, Y.; Gao, X.; Jia, K.; Pan, J.; Bi, Y.; Dai, Y.; Sun, J.; Wang, H.; Wang, H.; et al. Retrieval-Augmented Generation for Large Language Models: A Survey. arXiv 2023, arXiv:231210997. [Google Scholar]
  27. Asai, A.; Zhong, Z.; Chen, D.; Koh, P.W.; Zettlemoyer, L.; Hajishirzi, H.; Yih, W. Reliable, Adaptable, and Attributable Language Models with Retrieval. arXiv 2024, arXiv:240303187. [Google Scholar] [CrossRef]
  28. Chen, K.; Zhou, X.; Lin, Y.; Feng, S.; Shen, L.; Wu, P. A Survey on Privacy Risks and Protection in Large Language Models. J. King Saud Univ. Comput. Inf. Sci. 2025, 37, 163. [Google Scholar] [CrossRef]
  29. Delgaty, S.; LeBang, E. Boosting Domain Knowledge Understanding of LLMs through Fine-Tuning with a Novel KNN Algorithm. Res. Sq. 2024. [Google Scholar] [CrossRef]
  30. Roffo, G. Exploring Advanced Large Language Models with Llmsuite. arXiv 2024, arXiv:240712036. [Google Scholar] [CrossRef]
  31. Kuok, K.L.; Liu, H.H.; Lo, W.W. CrimeKGQA: A Crime Investigation System Based on Retrieval-Augmented Generation and Knowledge Graphs. Res. Sq. 2024. [Google Scholar] [CrossRef]
  32. Men, C.; Han, Y.; Wang, P.; Tao, J.; Huang, C.-G. The Interpretable Reasoning and Intelligent Decision-Making Based on Event Knowledge Graph with LLMs in Fault Diagnosis Scenarios. IEEE Trans. Instrum. Meas. 2025, 74, 1–16. [Google Scholar] [CrossRef]
  33. Zhang, L.; Jia, T.; Jia, M.; Wu, Y.; Liu, A.; Yang, Y.; Wu, Z.; Hu, X.; Yu, P.S.; Li, Y. A Survey of Aiops for Failure Management in the Era of Large Language Models. arXiv 2024, arXiv:240611213. [Google Scholar] [CrossRef]
  34. Wang, T.; Qi, G. A Comprehensive Survey on Root Cause Analysis in (Micro) Services: Methodologies, Challenges, and Trends. arXiv 2024, arXiv:240800803. [Google Scholar] [CrossRef]
  35. Pearl, J. Causality; Cambridge University Press: Cambridge, UK, 2009. [Google Scholar]
  36. Alanazi, H.; Alnaqeib, R.; Hmood, A.K.; Zaidan, M.; Al-Nabhani, Y. On the Module of Internet Banking System. arXiv 2010, arXiv:10054029. [Google Scholar] [CrossRef]
  37. Ntagengerwa, M.A.; Caltais, G.; Stoelinga, M. Fault Tree Synthesis from Knowledge Graphs. In Proceedings of the 2025 IEEE Annual Reliability and Maintainability Symposium-Europe (RAMS-Europe); IEEE: New York, NY, USA, 2025; pp. 1–7. [Google Scholar]
  38. Yu, P.; Zhang, H.; Jiang, X.; Zhou, Y.; Yan, X.; Zeng, Q.; Lin, Y. FLAM: Locating and Mitigating 5GC Network Failure with Knowledge Graphs in China Telecom’s Network. Res. Sq. 2023. [Google Scholar] [CrossRef]
  39. Saha, A.; Hoi, S.C. Mining Root Cause Knowledge from Cloud Service Incident Investigations for Aiops. In Proceedings of the 44th International Conference on Software Engineering: Software Engineering in Practice; Association for Computing Machinery: New York, NY, USA, 2022; pp. 197–206. [Google Scholar]
  40. Liang, X.; Zhang, Q.; Man, Y.; He, Z. Toward Sustainable Process Industry Based on Knowledge Graph: A Case Study of Papermaking Process Fault Diagnosis. Discov. Sustain. 2024, 5, 93. [Google Scholar] [CrossRef]
  41. Guo, B.; Wang, Y.; Pan, W.; Sun, Y. Fault Diagnosis Method for Hydro-Power Plants with Bi-LSTM Knowledge Graph Aided by Attention Scheme. J. Vibroengineering 2023, 25, 1629–1641. [Google Scholar] [CrossRef]
  42. Michau, G.; Fink, O. Unsupervised Fault Detection in Varying Operating Conditions. In Proceedings of the 2019 IEEE International Conference on Prognostics and Health Management (ICPHM); IEEE: New York, NY, USA, 2019; pp. 1–10. [Google Scholar]
  43. Kanungo, T.; Mount, D.M.; Netanyahu, N.S.; Piatko, C.D.; Silverman, R.; Wu, A.Y. An Efficient K-Means Clustering Algorithm: Analysis and Implementation. IEEE Trans. Pattern Anal. Mach. Intell. 2002, 24, 881–892. [Google Scholar] [CrossRef]
  44. Murali, V.; Yao, E.; Mathur, U.; Chandra, S. Scalable Statistical Root Cause Analysis on App Telemetry. In Proceedings of the 2021 IEEE/ACM 43rd International Conference on Software Engineering: Software Engineering in Practice (ICSE-SEIP); IEEE: New York, NY, USA, 2021; pp. 288–297. [Google Scholar]
  45. Janus, P.; Rzadca, K. Slo-Aware Colocation of Data Center Tasks Based on Instantaneous Processor Requirements. In Proceedings of the 2017 Symposium on Cloud Computing; Association for Computing Machinery: New York, NY, USA, 2017; pp. 256–268. [Google Scholar]
  46. Liu, J.; Jiang, Z.; Gu, J.; Huang, J.; Chen, Z.; Feng, C.; Yang, Z.; Yang, Y.; Lyu, M.R. Prism: Revealing Hidden Functional Clusters from Massive Instances in Cloud Systems. In Proceedings of the 2023 38th IEEE/ACM International Conference on Automated Software Engineering (ASE); IEEE: New York, NY, USA, 2023; pp. 268–280. [Google Scholar]
  47. Foorthuis, R. The Impact of Discretization Method on the Detection of Six Types of Anomalies in Datasets. arXiv 2020, arXiv:200812330. [Google Scholar] [CrossRef]
  48. Wang, D.; Chen, Z.; Fu, Y.; Liu, Y.; Chen, H. Disentangled Causal Graph Learning for Online Unsupervised Root Cause Analysis. arXiv 2023, arXiv:230510638. [Google Scholar] [CrossRef]
  49. Ma, H.; Ghojogh, B.; Samad, M.N.; Zheng, D.; Crowley, M. Isolation Mondrian Forest for Batch and Online Anomaly Detection. In Proceedings of the 2020 IEEE International Conference on Systems, Man, and Cybernetics (SMC); IEEE: New York, NY, USA, 2020; pp. 3051–3058. [Google Scholar]
  50. Stripling, E.; Baesens, B.; Chizi, B.; vanden Broucke, S. Isolation-Based Conditional Anomaly Detection on Mixed-Attribute Data to Uncover Workers’ Compensation Fraud. Decis. Support Syst. 2018, 111, 13–26. [Google Scholar] [CrossRef]
  51. Hou, J. Research on Fault Diagnosis and Root Cause Analysis Based on Full Stack Observability. arXiv 2025, arXiv:250912231. [Google Scholar] [CrossRef]
  52. Sheikholeslami, S.; Ghasemirahni, H.; Payberah, A.H.; Wang, T.; Dowling, J.; Vlassov, V. Utilizing Large Language Models for Ablation Studies in Machine Learning and Deep Learning. In Proceedings of the 5th Workshop on Machine Learning and Systems; Association for Computing Machinery: New York, NY, USA, 2025; pp. 230–237. [Google Scholar]
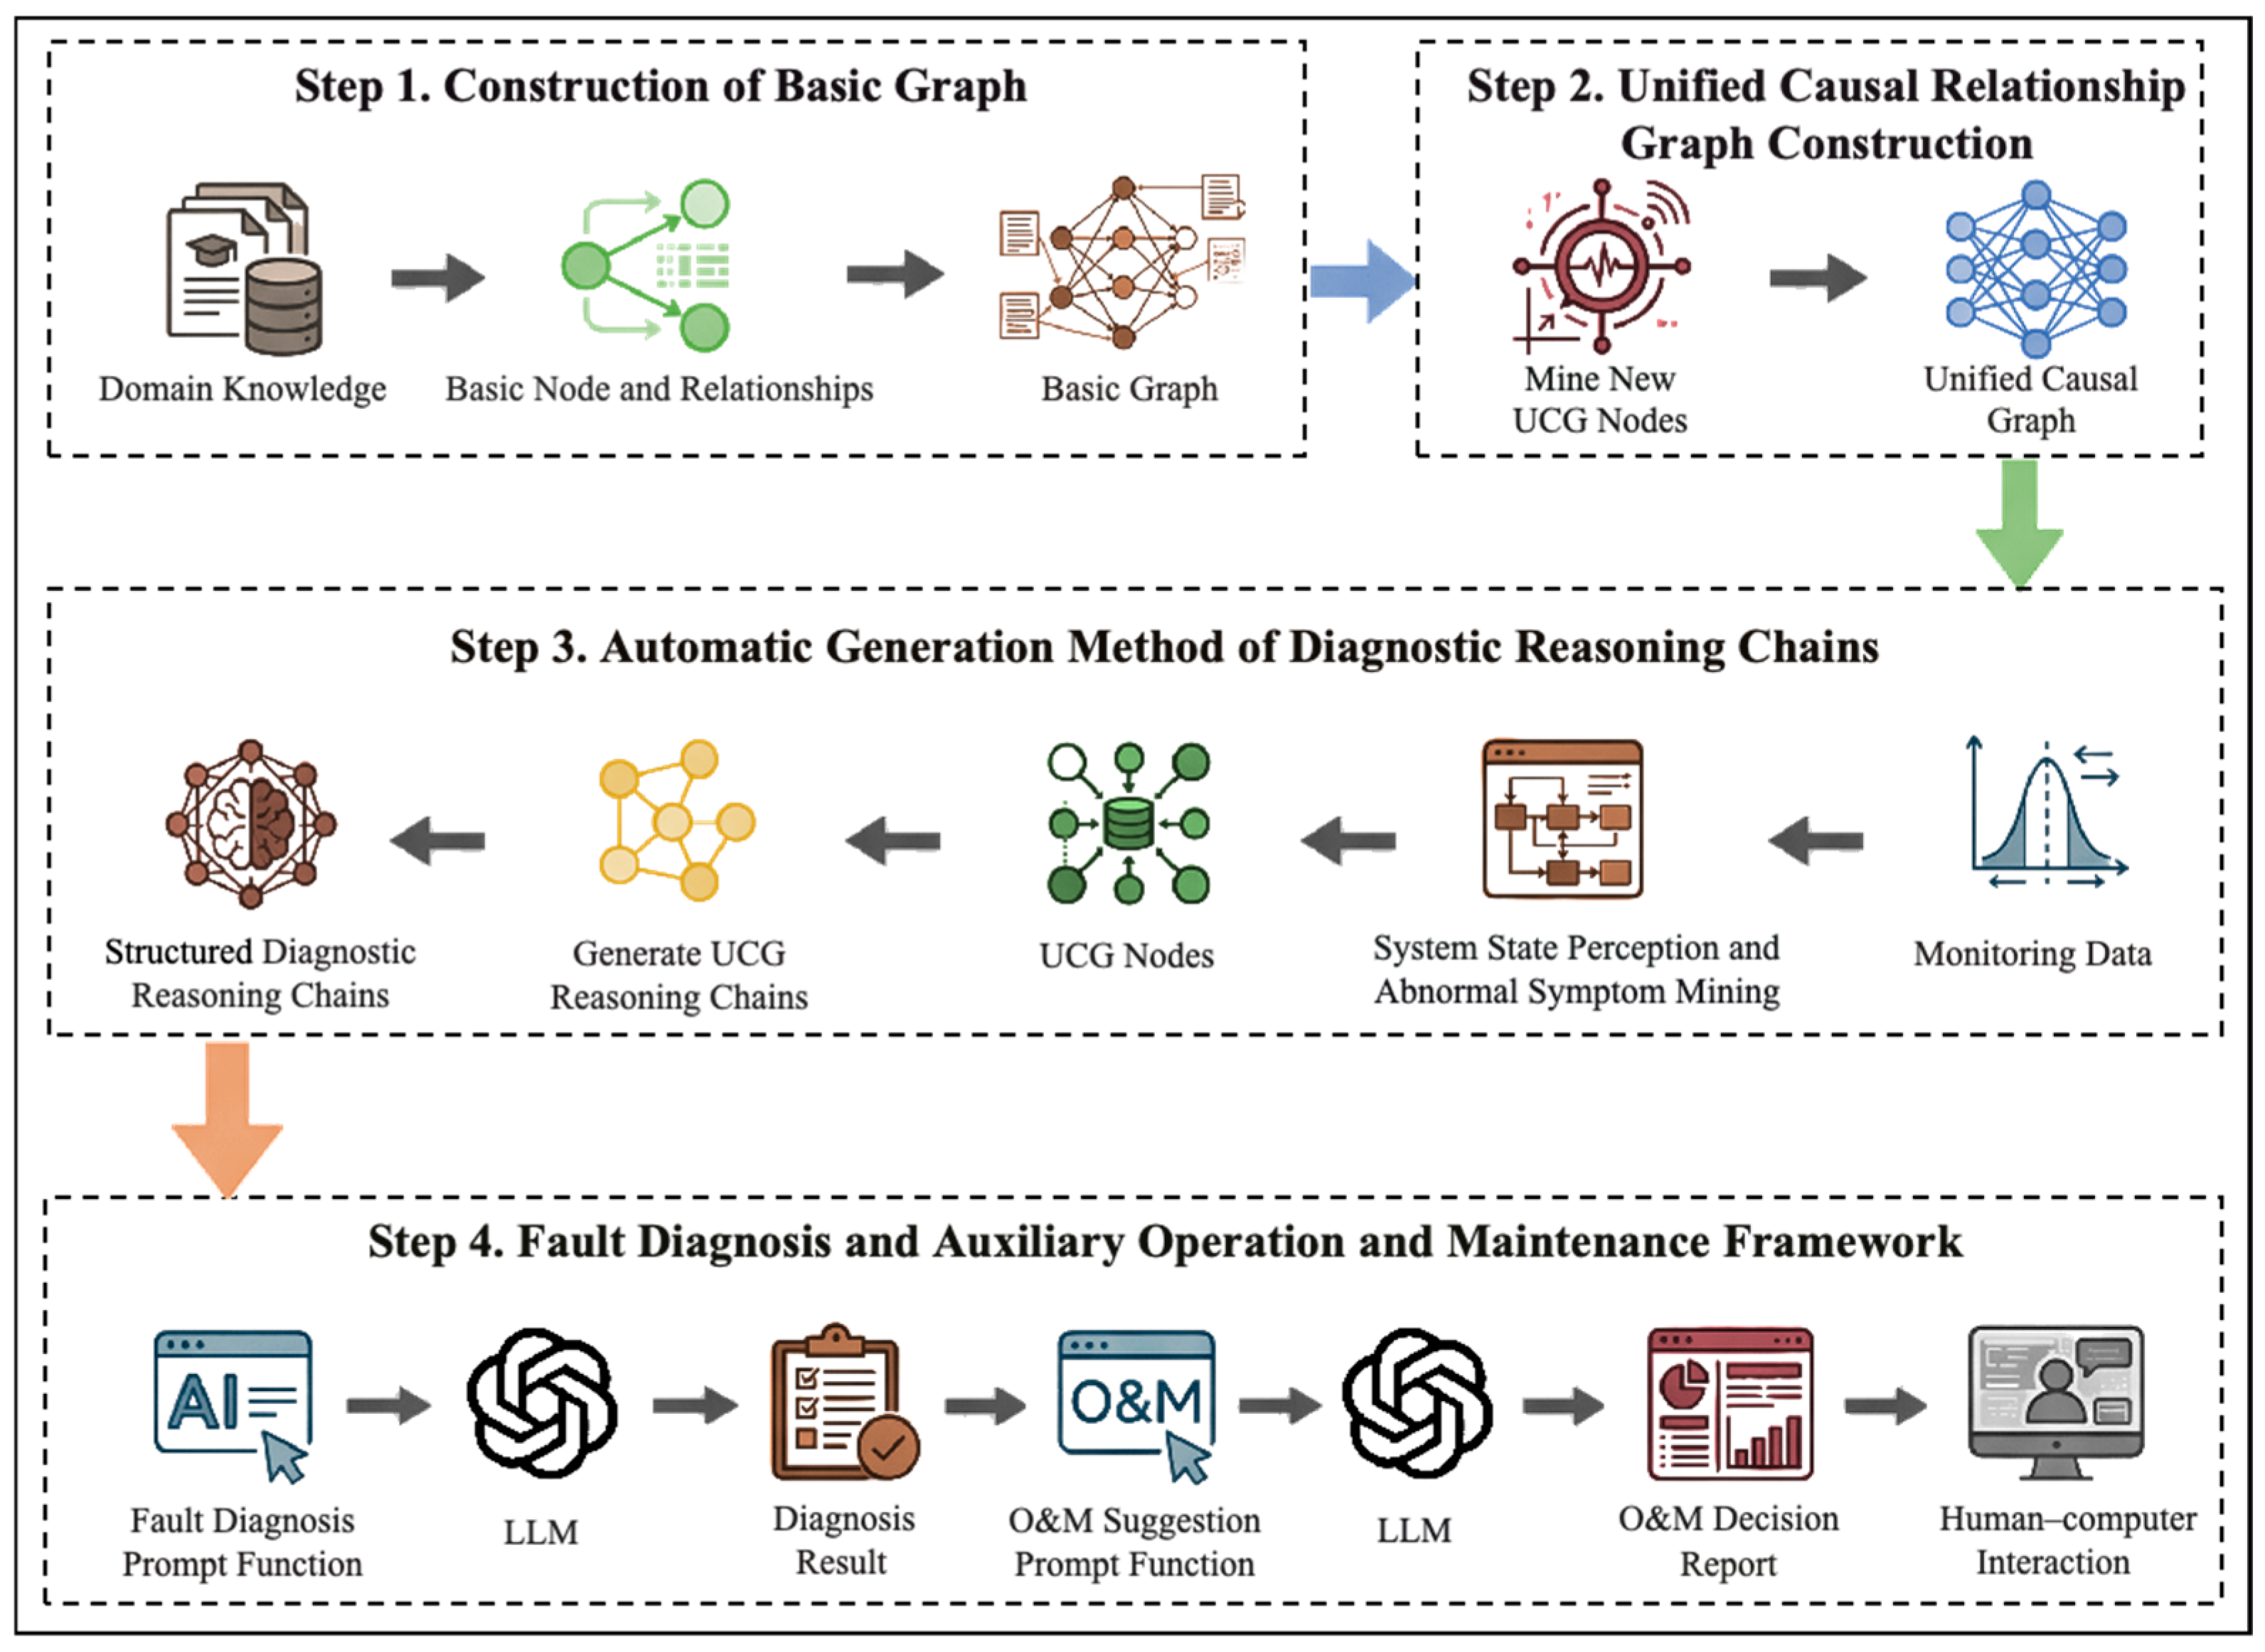
Figure 1. Flow chart of fault diagnosis and operation and maintenance diagnosis decision of distributed computing system.
Electronics 15 02359 g001
Figure 2. UCG construction flow.
Electronics 15 02359 g002
Figure 3. Automatic generation of diagnostic reasoning chain flows.
Electronics 15 02359 g003
Figure 4. Fault diagnosis prompt method.
Electronics 15 02359 g004
Figure 5. Auxiliary operation and maintenance decision suggestion prompt method.
Electronics 15 02359 g005
Figure 6. Example of auxiliary operation and maintenance decision report.
Electronics 15 02359 g006
Figure 7. Distributed computing system architecture diagram.
Electronics 15 02359 g007
Figure 8. UCG node relationship structure diagram.
Electronics 15 02359 g008
Figure 9. Example of chains of thought.
Electronics 15 02359 g009
Figure 10. Example of interactive fault diagnosis. (a) Illustration of a fault diagnosis execution example; (b) Example of generating an SRE report; (c) Example of intelligent human-computer interaction dialogue.
Electronics 15 02359 g010
Figure 11. Fault-specific matching rates based on GPT-4o.
Electronics 15 02359 g011
Table 1. Top K structured thought chain example table.
Fault NameFault DescriptionExample
Fault 1Redis cluster capacity not enough“node a—[fault 1] → node b
node a—[fault 1] → node c”
Fault 2Downstream service response error“node a—[fault 2] → node d
node b—[fault 2] → node e”
Fault 3Downstream service breakdown“node f—[fault 3] → node h
node g—[fault 3] → node h”
Table 2. Fault diagnosis prompt method slot table.
SlotDefinitionExample
[X1]Key components of a distributed computing system“Redis cluster CPU, service cluster CPU usage, service cluster io…”
[X2]Functional architecture and operational process of a distributed computing system“In phase 1, the main task is for the consumer to process data…”
[X3]Abnormal symptoms of a distributed computing system“Symptom 1: Service cluster CPU usage is higher than normal condition. Symptom 2…”
[X4]Diagnostic reasoning chains-of-thought“Fault 5: Downstream service response timeout
downstream service process latency is high → [fault 5 → downstream service response latency is normal…”
[X5]LLMs diagnosed fault name“Fault 1: Redis cluster capacity not enough”
[X6]Operation and maintenance methods for the current fault in distributed computing systems“1. Log in to the service console and identify the keys that trigger errors during Redis interactions…”
Table 3. Distributed computing system fault table.
Fault NameFault TypeDescription
Fault 1Redis errorRedis cluster capacity not enough
Fault 2Downstream errorDownstream service response error
Fault 3Downstream errorDownstream service breakdown
Fault 4Downstream errorDownstream service capacity not enough
Fault 5Downstream errorDownstream service response timeout
Fault 6Queue errorService cluster IO threads not enough
Fault 7Service errorService cluster instances not enough
Fault 8Service errorConsumer polling message threads not enough
Table 4. Distributed computing system key indicators table.
Metric NameUnitDescription
CPU_REPercentageRedis engine CPU usage
CPUPercentageCPU usage
IOPercentageNetwork usage
DISKPercentageDisk usage
MEMPercentageMemory usage
INSItemInstance count
RPSItem/SecondRequests per second
OHSecondInternal message queue processing latency
PDSecondExternal message queue processing latency
ERR_COUNTItemDownstream error count
UP_LTSecondDownstream processing latency
DS_LTSecondDownstream response latency
DS_CBItemDownstream circle break
OH_NUMItemInternal message number
PD_NUMItemExternal message number
Table 5. Chain of thought retrieval matching hit rate.
Fault NameHit Rate (%)
Fault 1100.00
Fault 2100.00
Fault 395.00
Fault 4100.00
Fault 594.29
Fault 6100.00
Fault 793.33
Fault 8100.00
Table 6. Overall matching rates.
Different GroupQWEN3-8BGPT-4oGPT-5.4
With GNN24.9%46.5%55.4%
With faults31.9%70.7%72.6%
With symptoms38.8%74.9%78.3%
Complete system44.6%100.0%100.0%
Disclaimer/Publisher’s Note: The statements, opinions and data contained in all publications are solely those of the individual author(s) and contributor(s) and not of MDPI and/or the editor(s). MDPI and/or the editor(s) disclaim responsibility for any injury to people or property resulting from any ideas, methods, instructions or products referred to in the content.