1. Introduction
In the context of natural hazards and large-scale emergencies, the circulation of false or misleading content poses substantive risks to public safety and crisis governance. Research across journalism and communication has shown that during high-uncertainty events, misleading claims, rumors, and strategic falsehoods can shape risk perceptions, distort collective sense-making, and undermine trust in institutions and news media [
1,
2,
3]. The convergent dynamics of platformized distribution, fragmented media trust, and increasingly accessible audiovisual manipulation tools further intensify the probability that misinformation and disinformation will scale rapidly during crises.
The València 2024 DANA (high-altitude isolated depression)—a cut-off low that produced torrential rainfall across eastern and southern Spain between 29 and 31 October 2024—offers a salient empirical setting to examine these dynamics. The event triggered catastrophic flooding, extensive material damage, and an intense public debate about causes, responsibility, and institutional response. In the immediate aftermath and subsequent weeks, a heterogeneous set of misleading claims proliferated across platforms, ranging from conspiracy narratives about weather modification to politically charged statements about government management and relief distribution. This combination of high media salience, polarization, and multichannel diffusion created fertile conditions for information disorder to thrive.
Previous studies have demonstrated that crisis and disaster contexts often catalyze rumor diffusion and false claims, exploiting both the affordances of digital platforms and audiences’ psychological predispositions [
4,
5,
6]. Building on this line of research, the present article adopts the established distinction between misinformation, disinformation, and malinformation [
1] and focuses on how these categories manifest during the 2024 València DANA. Despite extensive scholarship on crisis communication and digital misinformation, three persistent gaps remain.
First, platform ecologies during crises are increasingly cross-modal and cross-platform, with short-form video and multimodal memes playing a central role in diffusion. While prior work has mapped rumor spread on Twitter/X or Facebook, less is known about how content formats (text, image, video, multimodal composites) and migration routes interact across public feeds and encrypted or semi-private channels within a single event.
Second, narrative mechanisms—such as decontextualization, simplified causal attributions, and moral-emotional appeals—are frequently theorized but rarely quantified in relation to reach and engagement. During emergencies, these mechanisms may be especially consequential for attention capture and social transmission, yet comparative evidence remains limited.
Third, although the research and policy communities have advanced verification and prebunking strategies, there is still limited empirical understanding of which verification choices—timing, source credibility, format, and distribution channel—enhance corrective uptake and mitigate the spread of false claims, particularly in non-Anglophone contexts and under real-time crisis conditions.
This article addresses these gaps through a systematic content analysis of the 100 most viral false or misleading claims surrounding the 2024 València DANA, collected across major social platforms and messaging applications. The study classifies each claim by theme (e.g., causes, magnitude, institutional response, secondary hazards, aid and recovery), manipulation type (fabrication, manipulation, decontextualization, exaggeration/minimization, misunderstood satire), format (text, image, video, audio, multimodal), origin platform and secondary amplification channels, and narrative strategies (emotional appeal, simplified causality, polarization, false attribution, misuse of technical language). Estimated reach was also recorded, and verification responses were coded according to timing, source, format, and multichannel distribution.
Within the analyzed sample, the results suggest that information disorder around the València DANA was strongly associated with conspiracy framings of causation and institutional-performance narratives, while audiovisual formats, particularly short videos and images, showed higher observable reach than text-only items. Cross-platform migration patterns were also observed: public-facing feeds, especially Twitter/X and TikTok, frequently appeared as initial detection environments, while messaging apps such as WhatsApp functioned as documented secondary amplification channels. Narratively, decontextualization and moral-emotional cues emerged as recurrent replication mechanisms, consistent with theories of attention capture and social signaling in crisis communication. Verification strategies were evaluated observationally to identify whether early, format-matched, and source-neutral corrections were associated with stronger relative correction reach or engagement.
The contribution of this article is threefold. First, it provides an integrated, crisis-specific framework linking content typology, platform pathways, and narrative mechanisms to observed diffusion metrics. Second, it operationalizes comparative indicators of verification effectiveness (timing, source credibility, format fidelity, and multichannel syndication) to assess their relationship with relative reach. Third, by focusing on a non-Anglophone, highly mediatized European disaster, the analysis adds comparative breadth to a body of literature still dominated by Anglophone cases.
The manuscript is also positioned within the technological scope of crisis communication systems. The empirical focus on platform architectures, recommendation-driven visibility, multimodal content, automated monitoring, and verification workflows connects the study to the design and evaluation of digital infrastructures for emergency information management. From this perspective, the article does not only examine disinformation as a communicative phenomenon. It also analyzes how electronic communication platforms, data monitoring tools, audiovisual affordances, and cross-platform circulation shape the technical conditions under which false claims and corrective information become visible during crises.
More broadly, the findings contribute to debates on computational propaganda and information disorder in multimodal, recommendation-driven environments—where short-form video, soundtracks, and meme templates lower production costs and enable rapid imitation and scale. In crisis contexts, these affordances intersect with heightened uncertainty and affect, creating structural advantages for visually and emotionally engaging false claims. Understanding how those advantages are constructed—and which corrective strategies partially offset them—can help public agencies, newsrooms, platforms, and civil society actors design evidence-based preparedness and response protocols for future emergencies.
The remainder of this article reviews related work on disaster misinformation, platform affordances, and narrative mechanisms; details the sampling, coding, and reliability procedures; presents descriptive and comparative findings across typologies, formats, platforms, and narratives; evaluates verification strategies; and concludes with theoretical and practical implications alongside limitations and avenues for future research.
2. Theoretical Framework
2.1. Disinformation in Disaster and Emergency Contexts
Research on disinformation during disasters and emergencies has expanded considerably over the past decade, driven by a growing number of case studies and a growing awareness of its potential consequences. Ref. [
1] established a foundational taxonomy distinguishing between misinformation (false information shared without intent to harm), disinformation (false information shared with intent to harm), and malinformation (genuine information shared to cause harm) [
7]. This distinction is particularly relevant in disaster and emergency contexts, where the intentions of message producers may vary substantially.
Recent scholarship has documented the prevalence and impact of false and misleading information across a variety of natural disasters. Ref. [
4] analyzed rumor diffusion during Hurricane Sandy, identifying the factors shaping perceived credibility and diffusion patterns. Similarly, ref. [
5] examined the spread of disinformation during the 2019–2020 Australian bushfires, highlighting the centrality of conspiracy narratives in the public interpretation of the disaster. Organized social media disinformation campaigns have become a global phenomenon, further complicating the information environment during such events [
8]. More recently, ref. [
9] studied verification practices during the 2023 Turkey–Syria earthquakes, showing limited verification engagement from news agencies and official bodies, contrasted with more precise fact-checking by independent organizations.
Across this literature, several recurrent typologies of disinformation have been identified in crisis settings. Ref. [
10] distinguishes between (a) fully fabricated content, (b) manipulated content, (c) decontextualized content, (d) misleading content, and (e) satire or parody misinterpreted as factual. Complementarily, ref. [
11] proposes a thematic taxonomy specific to disasters: (a) disinformation about causes, (b) disinformation about magnitude, (c) disinformation about institutional response, (d) disinformation about secondary hazards, and (e) disinformation about aid and recovery. These typologies provide a conceptual foundation for analyzing the multiple forms that crisis-related disinformation may adopt.
2.2. Mechanisms of Virality and Operational Variables
The virality of disinformation on social platforms results from the interaction between message features, platform affordances, and crisis-specific conditions of uncertainty. For the purposes of this study, the theoretical framework focuses on mechanisms that can be directly connected to the coding scheme: emotional appeal, decontextualization, simplified causality, political polarization, false attribution, format, platform of origin, secondary amplification channels, and verification timing.
At the message level, emotional and moralized content tends to spread more widely because it captures attention and encourages social sharing [
12]. This mechanism is especially relevant during disasters, when uncertainty, fear, anger, and demands for accountability increase the salience of emotionally charged explanations [
6]. In the present study, this literature informs the coding of emotional appeal, political polarization, and simplified causality as narrative strategies. These categories capture how false or misleading claims reduce complex crisis dynamics to morally or politically resonant interpretations.
Decontextualization is another central mechanism in crisis-related disinformation. Rather than fabricating entirely new material, misleading actors often reuse genuine images, videos, data, or statements while altering their temporal, spatial, or causal context [
10]. This is particularly important in disaster settings, where dramatic visual material from previous events or other locations can be presented as current evidence. In this study, decontextualization is therefore coded both as a manipulation type and as a narrative strategy when the misleading effect depends on removing or altering contextual information.
At the platform level, disinformation diffusion depends on the affordances of each communication environment. The hybrid media system combines public feeds, algorithmic recommendations, private messaging, journalistic amplification, and interpersonal sharing [
13]. Platform architectures shape how content is discovered, evaluated, and redistributed. Twitter/X favors speed, hashtags, and public contestation. TikTok and other short-video platforms privilege audiovisual compression, algorithmic recommendation, and imitation. Facebook and Instagram combine visual circulation with group-based or follower-based diffusion. WhatsApp and Telegram facilitate interpersonal or group-based forwarding, although their visibility to external researchers is limited. These differences justify the distinction between platform of origin and secondary amplification channels in the coding scheme.
Finally, virality is shaped by the relation between false claims and corrective interventions. Previous research on misinformation correction highlights the importance of timely verification, source credibility, explanatory framing, and format adaptation [
3,
6,
14]. These dimensions are directly operationalized in this study through time to first verification, source-neutrality proxy, format matching, alternative explanation, multichannel dissemination, relative correction reach, and observable post-verification persistence. The theoretical framework is therefore aligned with the empirical variables used in the analysis rather than with broader psychological or media-effects concepts that are not measured directly.
2.3. Short Video and Encrypted Messaging in Hybrid Disinformation Ecologies
Recent research on misinformation has increasingly shifted from open social networks alone to mixed platform ecologies in which short video platforms, encrypted messaging applications, public feeds, and private groups interact. This shift is relevant for crisis communication because emergency-related falsehoods often move between highly visible spaces and low-visibility interpersonal channels. The same claim may appear first as a short video, later circulate as a screenshot, and subsequently re-emerge as a forwarded message or as a link shared in a group.
Short video platforms such as TikTok, Instagram Reels, and YouTube Shorts introduce distinctive conditions for misinformation diffusion. Their affordances combine audiovisual compression, algorithmic recommendation, platform-native editing tools, sound templates, captions, and rapid imitation. A recent scoping review of TikTok as an information space shows that algorithmic engagement shapes information discovery, evaluation, and sharing, while also indicating that TikTok research has expanded rapidly since 2020 [
15]. Empirical work on TikTok political content further shows that engagement is associated not only with popularity but also with partisan and toxic features, which are especially relevant in polarized contexts [
16].
These platforms also complicate verification because misleading content is often multimodal. Captions, on-screen text, voice-over, music, images, and editing patterns may jointly produce the misleading interpretation. Recent evidence indicates that captions alone may be insufficient for detecting problematic political content on TikTok, whereas transcripts and audio information improve classification [
16]. This supports the need to treat short videos as integrated audiovisual objects rather than as text-only claims. It also explains why format-matched verification may be more effective than corrections that translate a video-based falsehood into a purely textual debunk.
Encrypted and semi-private messaging environments present a different set of affordances. WhatsApp and Telegram facilitate rapid forwarding, group-based circulation, and the movement of images, videos, voice notes, and links among socially trusted contacts. Prior research on WhatsApp has shown that misinformation is difficult to observe at scale because of the private and encrypted nature of the platform [
17]. Recent work on WhatsApp group dynamics further emphasizes that exposure, belief, accidental sharing, and correction are shaped by group structure and interpersonal trust [
18]. These characteristics are particularly important during emergencies, when uncertainty and affective pressure increase reliance on trusted interpersonal networks.
Telegram occupies an intermediate position. It combines private or semi-private interaction with large public channels, broadcasting functions, and low levels of moderation. Recent network-oriented research shows that Telegram disinformation often depends on bridging channels that connect otherwise separated communities and help false or misleading narratives travel across clusters [
19]. This makes Telegram different from purely interpersonal messaging environments and closer to a hybrid infrastructure for both community formation and mass dissemination.
The mixed ecosystem literature also highlights the importance of cross-platform flows. Studies of encrypted messaging applications have identified circulation between WhatsApp, Telegram, and video platforms such as YouTube, suggesting that enclosed messaging spaces can function as testing grounds before narratives move into more visible public arenas [
20]. Policy-oriented research has similarly emphasized that messaging conversations frequently link to material hosted on public social media or the open web, which creates interdependence between private sharing and public visibility [
21].
Table 1 summarizes the main strands of recent research most relevant to the present study. This literature justifies the article’s analytical distinction between format, platform of origin, secondary amplification channels, and verification format. It also supports the decision to treat WhatsApp and Telegram with methodological caution, since their circulation dynamics are partly observable through public channels, fact-checking reports, screenshots, and externally documented forwards, but not through complete platform-level metrics.
This review is therefore not intended as a general account of all digital misinformation research. It is restricted to the platform and format mechanisms that are directly examined in the empirical analysis: short video diffusion, encrypted or semi-private amplification, multimodal verification, and cross-platform migration.
2.4. Verification and Counter-Disinformation Strategies
Information verification during disasters and emergencies has evolved substantially with the rise of specialized fact-checking organizations and the adoption of new verification techniques. These efforts represent a form of “confirmation journalism” aimed at countering disinformation in the post-truth era [
22]. Interventions can be conceptualized at three levels: regulation of technological platforms, incentivization of information providers, and empowerment of individuals [
2].
The effectiveness of verification strategies has been widely examined. A key challenge is the “continued influence effect”, where misinformation continues to shape thinking even after it has been corrected [
14]. To be effective, corrections should not only debunk the falsehood but also provide a compelling alternative explanation that fills the resulting cognitive gap. Research suggests that verification is most successful when it is timely, comes from sources perceived as neutral, and employs the same format as the original falsehood [
3,
6].
Despite these advances, significant limitations persist. Many verification efforts remain reactive, and official institutions often show limited commitment to systematic debunking. Furthermore, entrenched political or ideological identities can sustain the appeal of misleading narratives even after correction [
9]. These challenges highlight the need for cross-sectoral collaboration and for an evidence-based understanding of what makes verification effective in fast-moving, emotionally charged information environments.
2.5. Research Questions and Hypotheses
Based on the literature reviewed above, the research questions and hypotheses are derived from the mechanisms that are directly operationalized in the empirical analysis: typology, format, platform of origin, secondary amplification channels, narrative strategies, diffusion indicators, and verification characteristics. The study examines these dimensions in relation to the 100 verified viral false or misleading claims that circulated during the 2024 València DANA event.
2.5.1. Research Questions
Based on the theoretical discussion above, the study addresses the following research questions:
- RQ1.
What were the predominant typologies of disinformation circulating during the València DANA event?
- RQ2.
Through which platforms and formats did these pieces of disinformation primarily spread?
- RQ3.
Which narrative strategies were used to construct and reinforce the most viral misleading content?
- RQ4.
What diffusion patterns and contextual factors shaped the reach and amplification of these disinformation items?
- RQ5.
How can the observable effectiveness of fact-checking strategies deployed during the event be assessed?
2.5.2. Hypotheses
Drawing on the literature on crisis communication, platform affordances, narrative mechanisms, and verification dynamics reviewed above, the following hypotheses are proposed in this work:
- H1.
Misleading claims about institutional response and conspiracy narratives about the causes of the event will constitute the predominant typologies of disinformation.
- H2.
Visual content, particularly videos and images, will achieve higher levels of reach and virality than text-only content.
- H3.
Disinformation items will migrate systematically across platforms, with Twitter/X acting as the initial hub and WhatsApp functioning as a major secondary amplification channel.
- H4.
The dominant narrative strategies will involve decontextualization, political polarization, and emotional manipulation.
- H5.
Fact-checking interventions characterized by shorter time to verification, higher source-neutrality coding, format adaptation, alternative explanation, and multichannel dissemination will be associated with stronger observable correction reach or engagement within the analyzed sample.
3. Methodology
3.1. Research Design
This study adopts a mixed-method approach with a predominant quantitative orientation, based on a systematic content analysis of the 100 highest-ranked verified false or misleading claim clusters circulated during the 2024 València DANA event. Content analysis, defined by [
23] as a research technique for making replicable and valid inferences from data in their context, is particularly suited to examining the characteristics, strategies, and diffusion patterns of disinformation.
The methodological design comprised three sequential phases:
- 1.
Identification and selection phase: Collection and selection of the 100 most viral disinformation items according to predefined criteria.
- 2.
Coding and analysis phase: Systematic application of a categorization framework for content analysis.
- 3.
Interpretation phase: Statistical analysis of results and formulation of interpretative inferences.
This design combines the replicability and rigor of quantitative analysis with the interpretive depth required to understand the narrative strategies and visual mechanisms underlying disinformation.
To enhance transparency and replicability, the complete list of the 100 disinformation items analyzed in this study, together with their associated metadata (including platform of origin, date of circulation, thematic category, format, manipulation type, narrative strategies, and estimated reach), has been made publicly available in an external research repository. Due to space constraints, this material cannot be included in the article itself; however, open access to the dataset allows interested readers to examine individual cases in detail and facilitates reuse, verification, and future comparative research. The dataset is available via a persistent DOI reference [
24].
3.2. Sample and Selection Criteria
The sample consists of the 100 highest-ranked verified false or misleading claim clusters related to the 2024 València DANA, disseminated between 29 October and 30 November 2024. Selection followed four criteria:
- 1.
Temporal criterion: Items disseminated within the specified period.
- 2.
Virality criterion: Selection based on engagement metrics (interactions, views, shares) and cross-platform presence.
- 3.
Verification criterion: Items identified as false by at least two recognized fact-checking organizations (Maldita.es, Newtral, EFE Verifica, VerificaRTVE).
- 4.
Thematic relevance criterion: Items directly related to the 2024 València DANA event.
To identify these items, multiple data sources were used:
- (a)
Verification reports published by Spanish recognized fact-checking organizations (Maldita.es, Newtral, EFE Verifica, VerificaRTVE);
- (b)
Systematic social media monitoring through Brandwatch, X/TweetDeck, platform-native search functions, and manually archived URLs or screenshots from public social media spaces;
- (c)
Official institutional communications addressing disinformation;
- (d)
Media coverage of false claims related to the event.
The final sample includes content from several platforms: Twitter/X (n = 38), TikTok (n = 24), Facebook (n = 18), Instagram (n = 12), WhatsApp (n = 5), and Telegram (n = 3). This distribution refers to the platform on which the earliest identifiable public or externally documented occurrence of each claim was detected. It should not be interpreted as a representative estimate of the total volume of disinformation circulating on each platform. Rather, it reflects the distribution of the 100 verified viral claims retained under the sampling criteria described above. Many items subsequently migrated to other platforms, which is why platform of origin and secondary amplification channels are analyzed as distinct variables.
3.2.1. Data Monitoring and Preprocessing Protocol
To make the sampling procedure reproducible, a platform-specific monitoring protocol was applied before the final selection of the 100 disinformation items. Monitoring covered the period from 29 October to 30 November 2024 and combined automated queries, platform-native searches, fact-checking repositories, and manual verification of archived posts. The query strategy was built around Spanish and Valencian keywords related to the event and to recurrent misinformation narratives, including: DANA, gota fría, Valencia, València, riada, inundaciones, alerta, muertos, desaparecidos, ayudas, presas, pantanos, HAARP, chemtrails, Marruecos, and the names of the most affected municipalities. These terms were combined with event-related hashtags and with Boolean operators whenever the monitoring tool allowed advanced search.
Table 2 summarizes the monitoring procedure applied to each platform or channel, including access routes, query rules, sampling frequency, and cleaning criteria.
The cleaning process followed three sequential steps. First, all collected records were screened for thematic relevance, excluding posts that referred to unrelated floods, generic political commentary without a factual claim, or content not directly linked to the València DANA. Second, duplicate and near-duplicate records were consolidated at the claim level. This consolidation considered textual similarity, shared URLs, identical or near-identical images and videos, timestamps, and cross-platform reposting patterns. Third, each retained item was checked against the verification criterion: only claims identified as false or misleading by at least two recognized verification sources were included in the final database. When an item had been deleted by the time of coding, it was retained only if its content and metadata could be reconstructed from archived URLs, screenshots, fact-checking reports, or institutional documentation.
3.2.2. Digital Monitoring and Verification Workflow
To strengthen the technological transparency of the study, the data collection and verification process was organized as a digital monitoring workflow. The workflow included five sequential components: platform monitoring, content capture, claim clustering, verification linkage, and analytical coding. Although the study did not develop a new software platform, it systematized how existing digital tools and platform-native search functions can be combined to support crisis-related disinformation analysis.
The first component was platform monitoring. Public content was tracked through Brandwatch, X/TweetDeck, platform-native search functions, and manually archived URLs or screenshots. This layer was designed to detect emerging claims across public feeds, short video environments, public groups, and public Telegram channels. The second component was content capture. For each candidate item, the database retained the available metadata, including timestamp, URL or archived evidence, platform, format, visible engagement metrics, and available information about reposting or cross-platform circulation.
The third component was claim clustering. Since the same false or misleading claim could appear in different formats and platforms, candidate records were grouped at the claim level. This step made it possible to connect a TikTok video, a Twitter/X post, a Facebook screenshot, or a WhatsApp forwarded message when they expressed the same underlying factual assertion. The fourth component was verification linkage. Each claim cluster was connected to fact-checking reports, institutional debunks, or technical explanations that addressed the same assertion. This enabled the analysis of time to verification, format matching, source-neutrality proxy, alternative explanation, and relative correction reach.
The fifth component was analytical coding. Once claims were clustered and linked to verification evidence, each item was coded according to typology, manipulation type, format, platform of origin, secondary amplification channels, narrative strategies, propagation indicators, and verification characteristics. This workflow connects the social analysis of disinformation with the technological problem of crisis information management. It also identifies points at which future electronic systems could improve emergency response, including automated detection of repeated claims, multimodal similarity matching, cross-platform alerting, and verification content syndication.
3.2.3. Selection, Deduplication, and Ranking of the Final Sample
The unit of analysis was the false or misleading claim, not the individual post. This distinction was necessary because the same claim could appear several times across platforms, formats, accounts, and reposting chains. The sampling process therefore proceeded in four steps: candidate identification, eligibility screening, claim-level deduplication, and final ranking.
First, all candidate records identified through monitoring tools, platform-native searches, fact-checking repositories, institutional communications, and media reports were screened according to the temporal and thematic criteria of the study. Records were retained only if they referred directly to the 2024 València DANA and circulated between 29 October and 30 November 2024. Generic political commentary, opinion content without a checkable factual claim, unrelated disaster footage, and posts referring to other meteorological events were excluded.
Second, each candidate claim had to meet the verification criterion. Only claims identified as false or misleading by at least two recognized fact-checking or verification sources were eligible for inclusion. When the same claim was addressed by different recognized fact-checking organizations using slightly different wording, the underlying factual assertion was treated as the same claim. This procedure reduced the risk of including unverified rumors and ensured that the final sample consisted of externally validated cases of false or misleading information.
Third, duplicate and near-duplicate records were consolidated at the claim level. Exact duplicates were identified through identical URLs, repeated captions, reposts, forwarded screenshots, or the same video or image file. Near-duplicates were identified when different posts reproduced the same factual assertion with minor changes in wording, format, editing, or captioning. In these cases, all records were grouped into a single claim cluster. For each cluster, the database retained the earliest identifiable occurrence, the platform of origin, all secondary amplification channels, the highest-reach public occurrence, the content format, the manipulation type, the narrative strategies, and the available propagation metrics.
Fourth, the final ranking was produced at the claim level. Raw metrics were not directly aggregated across platforms because views, likes, comments, shares, reposts, and forwards do not represent equivalent forms of exposure or engagement. Therefore, public-platform records were first evaluated using the platform-normalized virality index described in the following methodological subsection. This decision follows standard recommendations for composite indicators, which emphasize the need to normalize heterogeneous indicators before aggregation and to make aggregation rules explicit [
25,
26]. For each claim cluster
c, the peak normalized virality score was defined as the highest virality index observed among its public-platform occurrences:
where
is the platform-normalized virality index of occurrence
i belonging to claim cluster
c. The primary ranking criterion was
. Cross-platform presence was used as a secondary criterion because recent research on information diffusion emphasizes that misinformation often migrates across platform environments rather than remaining confined to a single site [
27]. Cross-platform presence was measured as the number of distinct platforms or channels in which the same claim was detected:
Claims were ranked first by peak normalized virality and then, in case of similar visibility, by cross-platform presence. This procedure prioritizes claims that achieved unusually high visibility within at least one platform while also accounting for migration across platforms. It avoids treating heterogeneous platform metrics as directly interchangeable. The use of normalized scores and explicit aggregation rules also makes the ranking procedure more transparent and less dependent on the raw scale of any single platform metric [
25,
28,
29].
For WhatsApp and private or partly private Telegram circulation, no direct continuous reach metric was used. These cases were included only when there was external documentary evidence of circulation and when the claim met the verification criterion. If a claim circulated on WhatsApp or private Telegram but also had a measurable public-platform occurrence, the public occurrence was used for the normalized virality ranking, while WhatsApp and Telegram were coded as amplification channels. If the earliest trace was documented in a private or encrypted channel, the platform of origin was coded accordingly, but the case was not used for analyses requiring continuous propagation metrics.
The 100 highest-ranked eligible claim clusters constituted the final analytical sample. Therefore, the expression “100 most viral claims” refers to the 100 verified claim-level clusters with the highest combination of normalized public visibility and documented cross-platform circulation within the observable evidence base of the study.
3.3. Variables and Coding Scheme
A detailed categorization system was developed to guide the systematic content analysis.
Table 3 summarizes the variables employed.
In this coding scheme, platform of origin and secondary amplification channels were treated as analytically distinct variables. Platform of origin refers to the earliest identifiable public or externally documented occurrence of a claim. Secondary amplification channels refer to platforms, messaging applications, digital media, traditional media, or public figures that subsequently contributed to the circulation of the same claim. This distinction was maintained throughout the analysis to avoid conflating the point of first detection with later diffusion pathways.
3.4. Operationalization of Propagation Influence
Propagation influence was measured using both continuous indicators and ordinal reach categories. The ordinal categories reported in the descriptive tables were used to facilitate interpretation and to provide a compact overview of the sample. However, comparative analyses were based, whenever data availability allowed it, on continuous metrics extracted from the original platform records, archived posts, fact-checking reports, or monitoring tools. These metrics included views or impressions, likes or reactions, comments, shares or reposts, and the number of platforms on which the same claim was detected. This distinction is relevant because social media engagement is multidimensional, and platform metrics such as reach, impressions, reactions, comments, and shares capture different forms of visibility and user interaction [
30].
Because platforms differ substantially in the meaning and visibility of their metrics, raw values were not treated as directly equivalent across platforms. For instance, a passive view on TikTok is not analytically identical to a repost on Twitter/X or a forwarded message on WhatsApp. To reduce the influence of extreme outliers and right-skewed count distributions, continuous indicators were first transformed using
, where
x denotes the observed count for each metric. Logarithmic transformation is commonly used when count variables are highly skewed and when extreme values may dominate descriptive comparisons [
31].
A normalized virality index was then calculated for public-platform items with sufficient metric availability. The index follows standard recommendations for the construction of composite indicators, particularly the need to normalize heterogeneous indicators before aggregation and to make the aggregation procedure explicit [
25]. For each item
i, each available metric
m was converted into a percentile score within its platform of origin
p:
where
is the log-transformed value of metric
m for item
i on platform
p, and
is the number of items observed for that platform. This rank-based normalization is appropriate for heterogeneous and non-normally distributed indicators because it evaluates each observation relative to its reference set rather than assuming metric equivalence across platforms [
28,
29]. The normalized virality index was computed as the mean of the available percentile scores:
where
is the number of available metrics for item
i. Higher values indicate that an item performed better relative to other items detected on the same platform. This approach does not assume that views, reactions, comments, and shares have identical meanings across platforms. Instead, it evaluates whether an item was unusually visible or engaging within the metric environment of its own platform.
The ordinal reach variable was derived from the same underlying continuous indicators and was used only for descriptive presentation. Therefore, the categories low, medium, high, and very high should be interpreted as communicative summaries rather than as the primary measurement instrument. For encrypted or semi-private channels such as WhatsApp and, in some cases, Telegram, equivalent continuous metrics were not systematically available. These cases were therefore coded through externally documented evidence of circulation and were excluded from analyses requiring continuous reach indicators.
3.5. Operationalization of Verification Effectiveness
Verification effectiveness was operationalized through observable correction indicators rather than through direct measures of belief change or trust. The study did not include survey data, experimental exposure, or interviews with users. Therefore, concepts such as “effectiveness”, “impact”, and “trust” were translated into measurable proxies derived from the circulation of verification content and from the characteristics of the verification source.
For each false or misleading claim
c, the first indicator was time to verification. This was measured as the number of hours between the earliest identifiable occurrence of the false claim and the first available verification:
where
is the timestamp of the earliest identifiable public or externally documented occurrence of claim
c, and
is the timestamp of the first verification addressing the same claim. Lower values indicate faster correction.
The second indicator was relative correction reach. For public-platform cases with available metrics, the reach of the most visible verification item was compared with the peak reach of the corresponding false claim. Because platform metrics are highly skewed, both values were log-transformed:
where
is the highest observable reach of a verification item addressing claim
c, and
is the highest observable reach of the false claim. Values closer to 1 indicate that the correction approached the visibility of the falsehood. Values below 1 indicate that the correction circulated less widely than the false claim.
The third indicator was relative correction engagement. This compared observable engagement with the verification to observable engagement with the false claim. Engagement included likes or reactions, comments, shares, and reposts when available:
where
is the highest observable engagement of the verification and
is the highest observable engagement of the false claim. As with reach, this ratio was used only when comparable public-platform metrics were available.
The fourth indicator was observable post-verification persistence. This was measured as the proportion of detected occurrences of the same claim that appeared after the first verification within the observation window:
where
is the number of documented occurrences before the first verification and
is the number of documented occurrences after the first verification. This indicator should be interpreted cautiously because it measures observable persistence within the dataset, not total platform-level persistence.
Verification source characteristics were also coded. Source neutrality was not measured as user trust. Instead, it was treated as a proxy variable based on the institutional position of the verifier. Sources were coded as higher-neutrality when the correction came from independent recognized fact-checking organizations, technical agencies, scientific experts, or media organizations not directly implicated in the disputed claim. Sources were coded as lower-neutrality when the correction came from political actors, partisan accounts, or institutions directly involved in the controversy. This coding captures perceived independence as an observable attribute of the source, but it does not measure audience trust directly.
Format matching was coded as a binary variable indicating whether the verification used the same dominant format as the false claim. For example, a video-based correction responding to a viral video was coded as format-matched. Alternative explanation was also coded as a binary variable. A verification was coded as providing an alternative explanation when it not only denied the false claim but also explained what had actually happened, why the misleading interpretation was incorrect, or how the decontextualized material originated. Finally, multichannel dissemination was measured as the number of distinct platforms or channels through which the verification was distributed.
These indicators allow the study to compare verification strategies in observable terms. However, the analysis remains observational. The results should therefore be interpreted as associations between verification characteristics and correction visibility, engagement, or persistence. They should not be interpreted as causal estimates of belief change or as direct measurements of public trust.
3.6. Treatment of Encrypted and Partly Private Channels
Encrypted and partly private channels required a different analytical treatment from public social media platforms. WhatsApp does not provide externally observable metrics on views, forwards, group size, or total circulation. Therefore, the study did not estimate the actual propagation volume of WhatsApp messages. Instead, WhatsApp items were included only when there was external documentary evidence that the claim had circulated through the platform. Such evidence included fact-checking reports, institutional warnings, archived screenshots, voluntarily forwarded messages, or media reports explicitly identifying WhatsApp as a circulation channel.
Telegram was treated as a mixed environment. Public Telegram channels and groups sometimes provide observable indicators, such as views, timestamps, and channel membership. These metrics were recorded when available. However, Telegram circulation in private chats, private groups, or reposted screenshots was treated in the same way as WhatsApp circulation. In those cases, the study relied on external documentation rather than direct platform metrics.
To make this procedure explicit, each WhatsApp and private or partly private Telegram item was coded using a documentary evidence protocol. The protocol considered five indicators: (1) identification of the claim by at least two recognized fact-checking organizations; (2) availability of a screenshot, archived message, or forwarded example; (3) explicit mention of WhatsApp or Telegram circulation in a verification report, institutional communication, or media report; (4) detection of the same claim on at least one public platform; and (5) evidence of recurrence across more than one documentary source. Items were retained only when the verification criterion was met and when at least one additional indicator of platform circulation was available.
This procedure provides evidence of documented circulation, but it does not provide a statistically valid estimate of total propagation volume. For this reason, the study does not report confidence intervals or margins of error for WhatsApp and private Telegram circulation. Such margins would require a known sampling frame, observable exposure counts, or probabilistic access to message flows, none of which is available for encrypted private communication. The likely direction of error is underestimation, since unreported private forwards and deleted messages remain outside the observable evidence base.
Accordingly, WhatsApp and private or partly private Telegram items were excluded from analyses requiring continuous propagation metrics, including the platform-normalized virality index. They were retained in the qualitative and descriptive analysis because they document the migration of verified false claims into trusted interpersonal or group-based communication environments.
Table 4 summarizes how the study differentiated between WhatsApp, public Telegram spaces, and private or partly private Telegram circulation. The table specifies the type of observable evidence available in each case, the analytical treatment applied, and the level of uncertainty associated with each channel. This distinction is necessary because the same platform label may refer to different communication environments. For example, a public Telegram channel provides more observable information than a private Telegram group, whereas WhatsApp circulation can usually be documented only through external evidence.
3.7. Coding Procedure and Analysis
The coding process followed a systematic protocol to ensure reliability and validity of results:
- 1.
Codebook development: A detailed manual was created containing operational definitions and illustrative examples for each category.
- 2.
Coder training: Two independent researchers were trained in the coding protocol.
- 3.
Pilot test: An initial subsample was coded to assess the applicability of the system and refine the scheme.
- 4.
Independent coding: Both coders independently analyzed the entire sample.
- 5.
Inter-coder reliability: Cohen’s Kappa coefficients were calculated for each variable, ranging from 0.78 to 0.92, indicating substantial to almost perfect agreement [
32].
- 6.
Discrepancy resolution: Disagreements were discussed and resolved by consensus.
- 7.
Statistical analysis: Coded data were processed using PSPP software. Descriptive statistics were calculated for all variables. For diffusion-related comparisons, the analysis used both raw continuous indicators and the normalized virality index described above. The statistical strategy is detailed in the following subsection. Because of the limited sample size, the non-probabilistic sampling design, and the imbalance across platforms, inferential tests were used only as exploratory checks and were not interpreted as population-level evidence.
3.8. Statistical Analysis Strategy
The statistical analysis was primarily descriptive. This decision follows from the structure of the sample, which consists of the 100 highest-ranked verified false or misleading claims within the observable evidence base of the study. The sample was not designed as a probability sample of all disinformation circulating during the València DANA. Therefore, percentages, ratios, and comparative differences are interpreted as patterns within the analyzed sample rather than as population-level estimates.
Descriptive statistics were calculated for all categorical variables, including thematic typology, format, manipulation type, platform of origin, secondary amplification channels, narrative strategies, and verification characteristics. For continuous propagation indicators, the analysis used log-transformed metrics and the platform-normalized virality index described above. Medians, interquartile ranges, and relative differences were preferred over means when distributions were strongly skewed.
Exploratory inferential tests were used only as supplementary checks when the structure of the data allowed it. Associations between categorical variables were examined through contingency tables. Pearson’s chi-square test was used only when expected cell counts were sufficient. Fisher’s exact test was used when sparse cells made the chi-square approximation unreliable. Cramer’s
V was used as an effect-size indicator for categorical associations [
33].
For comparisons of continuous propagation indicators across formats or platform groups, non-parametric tests were preferred because the variables were skewed and the platform groups were unbalanced. Kruskal-Wallis tests were used for comparisons involving more than two groups. Mann-Whitney
U tests were used for pairwise exploratory comparisons when appropriate. Effect sizes were reported or interpreted alongside direction and magnitude, rather than relying only on statistical significance [
34].
For verification-related variables, exploratory comparisons examined whether format matching, source-neutrality coding, alternative explanation, and multichannel dissemination were associated with relative correction reach, relative correction engagement, or observable post-verification persistence. Spearman rank correlations were used to examine the relationship between time to verification and post-verification persistence. These analyses were interpreted as internal-sample associations and not as causal estimates.
Because of the small sample size, the imbalance across platforms, and the externally documented nature of some observations, the article does not use inferential tests to make strong claims about individual platforms, especially WhatsApp and Telegram. In the
Section 4, inferential language has therefore been softened. Expressions such as “support”, “significantly shaped”, or “proved more effective” have been replaced where necessary by more cautious formulations such as “are consistent with”, “were associated with”, or “showed higher values within the analyzed sample”.
3.9. Robustness Check for Platform Imbalance
Because the number of items differed substantially across platforms, the analysis was not designed to support strong inferential claims for each individual platform. This issue is especially relevant for WhatsApp (n = 5) and Telegram (n = 3), where the small number of retained items prevents statistically reliable platform-specific generalization. Accordingly, the platform-level findings are interpreted as descriptive patterns within the analyzed sample rather than as population-level estimates of disinformation activity on each platform.
To assess whether the main descriptive findings were driven by the overrepresentation of larger platform categories, a robustness check was conducted using a balanced subsample of the four main public-facing platforms: Twitter/X, TikTok, Facebook, and Instagram. Since Instagram was the smallest of these four groups (n = 12), random down-sampling was applied to Twitter/X, TikTok, and Facebook to create balanced platform subsets of 12 items each. WhatsApp and Telegram were excluded from this balancing procedure because their small cell sizes would have required reducing all platforms to three or five observations, which would have produced an analytically uninformative sample. Instead, these two channels were treated descriptively as secondary or semi-private amplification environments.
The robustness check compared the full sample with the balanced public-platform subsample in relation to the main variables of the study: thematic typology, format, manipulation type, and narrative strategy. The purpose was not to estimate platform-specific causal effects. Instead, the aim was to verify whether the core patterns reported in the article remained observable after reducing the influence of the largest platform category. These patterns include the predominance of audiovisual formats, the centrality of decontextualization, and the prominence of conspiracy and institutional-response narratives. The balanced analysis confirmed the same substantive tendencies, although the results are reported cautiously because of the limited sample size.
3.10. Methodological Limitations
Several limitations inherent to the adopted design should be acknowledged:
- 1.
Selection bias: Relying on verified disinformation items may bias the sample toward claims detected and debunked by fact-checking organizations, institutional sources, or public monitoring systems. This may overrepresent content circulating on open platforms, where detection and documentation are easier, and underrepresent false claims that remained confined to private groups, encrypted messaging applications, or ephemeral formats. As a result, the platform distribution reported in this study should be interpreted as the distribution of verified and externally traceable viral claims, not as a direct estimate of the total disinformation circulating across platforms.
- 2.
Encrypted platform observability: Actual propagation volume on WhatsApp and private Telegram spaces cannot be directly counted because these environments do not provide externally observable metrics on views, forwards, or total exposure. The study therefore does not estimate total circulation in these channels. It records only externally documented evidence of circulation, based on fact-checking reports, institutional warnings, archived screenshots, voluntarily forwarded examples, media reports, and visible Telegram metrics when available. No statistical margin of error is reported for these channels because there is no known sampling frame or probabilistic access to message flows.
- 3.
Volatility of digital content: Content deletions by users or platforms complicate longitudinal tracking of diffusion.
- 4.
Subjectivity in coding: Despite rigorous procedures, some degree of interpretative subjectivity may persist in identifying narrative strategies and qualitative dimensions.
- 5.
Scope of media ecosystems: Although the study focuses on the circulation of disinformation across major social media platforms and messaging applications, it does not examine other influential information ecosystems such as television, radio, or digital news outlets. These legacy media remain central actors in shaping public opinion and may also contribute to the dissemination or amplification of misleading narratives, whether intentionally or through structural biases in news production and opinion-driven formats. The exclusion of traditional media responds to the need for methodological coherence, as the analysis concentrates on platform-native dynamics of virality, user-driven dissemination, and multimodal affordances characteristic of social media environments. Nevertheless, this represents a delimitation of the study rather than a methodological shortcoming, as a fully comprehensive account of crisis-related disinformation would require integrating cross-media flows and interactions between institutional media and user-generated content, which falls beyond the scope of the present analysis.
- 6.
Temporal constraints: The proximity of the event allowed immediate data access but limited long-term perspective on the effects of disinformation.
- 7.
Platform imbalance: The distribution of items across platforms is uneven, with Twitter/X and TikTok accounting for a larger share of the sample than WhatsApp and Telegram. This imbalance reflects both the sampling strategy, which relies on verified and externally traceable claims, and the greater observability of public platforms compared with encrypted or semi-private environments. Consequently, comparisons across platforms should be interpreted descriptively and with caution. In particular, WhatsApp and Telegram are not used to draw statistically generalizable conclusions about platform dynamics, but rather to document their role as amplification spaces within the verified claims analyzed.
- 8.
Metric comparability: Platform metrics do not measure identical forms of exposure or engagement. A view, a repost, a reaction, and a forwarded message involve different levels of attention, intentionality, and traceability. Although the study uses log-transformed continuous indicators and a platform-normalized virality index to improve comparability, these procedures cannot fully eliminate measurement differences across platforms. For this reason, the ordinal reach categories are used only as descriptive summaries, and cross-platform comparisons are interpreted cautiously.
These limitations were considered during the research design, and mitigation strategies were implemented throughout the analytical process.
4. Results
4.1. General Characterization of False Claims
This section provides an overview of the analyzed sample before examining each dimension in greater detail.
Table 5 summarizes the distribution of the 100 verified viral claims by thematic typology, content format, manipulation type, platform of origin, and descriptive reach category.
As shown in
Table 5, the sample is characterized by a concentration of conspiracy and institutional-response narratives, a predominance of audiovisual formats, and a high proportion of decontextualized or manipulated genuine content. The platform figures in the table refer only to platform of origin, understood as the earliest identifiable public or externally documented occurrence of each claim. They should not be confused with secondary amplification channels, which are analyzed separately in
Section 4.3.1. The reach categories are also descriptive summaries. They confirm that the sample is composed of highly visible verified claims, with 70% of the items falling into the high or very high categories. However, comparative diffusion analysis relies on the continuous indicators and the normalized virality index described in the methodology.
4.2. Typology-Specific Analysis
4.2.1. Conspiracy Theories About Causes
Conspiratorial accounts of causation constitute the most prevalent category (28%) and show the highest average reach. These narratives attribute the meteorological phenomenon to artificial or deliberate causes, offering alternative explanations to natural drivers. Four prominent subtypes were identified:
- 1.
Weather manipulation via HAARP (High-Frequency Active Auroral Research Program) (43% of this category): The DANA is falsely linked to alleged HAARP-based climate warfare; items frequently reuse unusual atmospheric images or out-of-context technical graphics as “evidence.”
- 2.
Chemtrails and geoengineering (25%): The disaster is attributed to deliberate chemical dispersion from aircraft; contrails are presented as proof of atmospheric manipulation.
- 3.
Moroccan sabotage (18%): Claims are made that Morocco used weather-modification technologies to provoke the DANA as an attack on Spanish agriculture (notably València’s citrus sector); this xenophobic narrative was primarily amplified by far-right accounts.
- 4.
Deliberate destruction of dams/reservoirs (14%): False assertions are made that prior demolition of dams or reservoirs for ideological or environmental reasons exacerbated flooding, distorting information about the removal of obsolete small river barriers and presenting it as the destruction of major reservoirs.
Within this thematic subset, conspiracy narratives were most frequently detected on Twitter/X (54%) and, to a lesser extent, in documented Telegram circulation (21%). These percentages should be interpreted descriptively because the number of Telegram cases is small and partly dependent on externally observable evidence. The peak of documented circulation occurred between 48 and 72 h after the onset of the disaster.
4.2.2. Claims About Institutional Response
Disinformation about institutional action (22%) formed the second most frequent category, distorting, disputing, or fabricating information about the performance of administrations and agencies during the emergency. Four subtypes were identified:
- 1.
Information concealment (36%): Allegations that authorities hid the real magnitude of the disaster, especially regarding casualties and missing persons.
- 2.
Alert negligence (27%): False claims that alerts were not issued, or were delayed or insufficient, contradicting documented timelines by AEMET and Civil Protection.
- 3.
Discriminatory aid (23%): Assertions that specific areas or groups received preferential or discriminatory treatment in the distribution of aid and emergency resources.
- 4.
Corruption and fund diversion (14%): Accusations that funds earmarked for the emergency were diverted or that procurement favored allied firms.
These items exhibit strong ties to pre-existing political polarization and ideologically aligned narratives. Within this category, documented circulation was most frequently associated with Facebook (41%) and WhatsApp (32%). The WhatsApp figure should be read as evidence of externally documented circulation rather than as a direct measure of platform-level volume. Peak observable circulation occurred between days 3 and 7 after onset.
4.2.3. Claims About the Magnitude of the Disaster
Disinformation about magnitude (20%) presents two seemingly contradictory, yet equally problematic, trends:
- 1.
Exaggerations (65%): Inflated counts of casualties, missing persons, or material damage. During the first 24–48 h, messages circulated that raised fatalities into the hundreds or even thousands, whereas official figures were significantly lower.
- 2.
Minimizations (35%): Narratives downplaying severity, suggesting disproportionate media coverage or invoking historical comparisons; these often carried political motives aimed at reducing perceived responsibility of specific administrations.
Exaggerations were more prevalent within the first 24–48 h and circulated via messaging apps (WhatsApp, Telegram). Minimizations emerged later (from day 4 onward), predominantly on Twitter/X and hyper-partisan digital outlets.
4.2.4. Other Typologies
Although less frequent, the remaining categories display relevant features:
- 1.
Aid and solidarity (12%): False fundraising campaigns, content discrediting legitimate initiatives, and scams impersonating reputable organizations; these items are particularly harmful due to their potential to divert resources and erode trust in legitimate channels.
- 2.
Technical misinformation (10%): Erroneous information about hydraulic management, infrastructure, or meteorology; characterized by inappropriate technical jargon and out-of-context data or graphics to simulate scientific rigor.
- 3.
Economic and social impact (5%): Unfounded catastrophic forecasts, false claims about sector-specific impacts, and speculation about large-scale migration.
- 4.
Health and environment (3%): False alerts about water contamination, health risks, or environmental impacts, generating unnecessary alarm among affected populations.
4.3. Platforms and Formats
4.3.1. Platform Distribution
Platform-level patterns distinguish initial generation from secondary amplification.
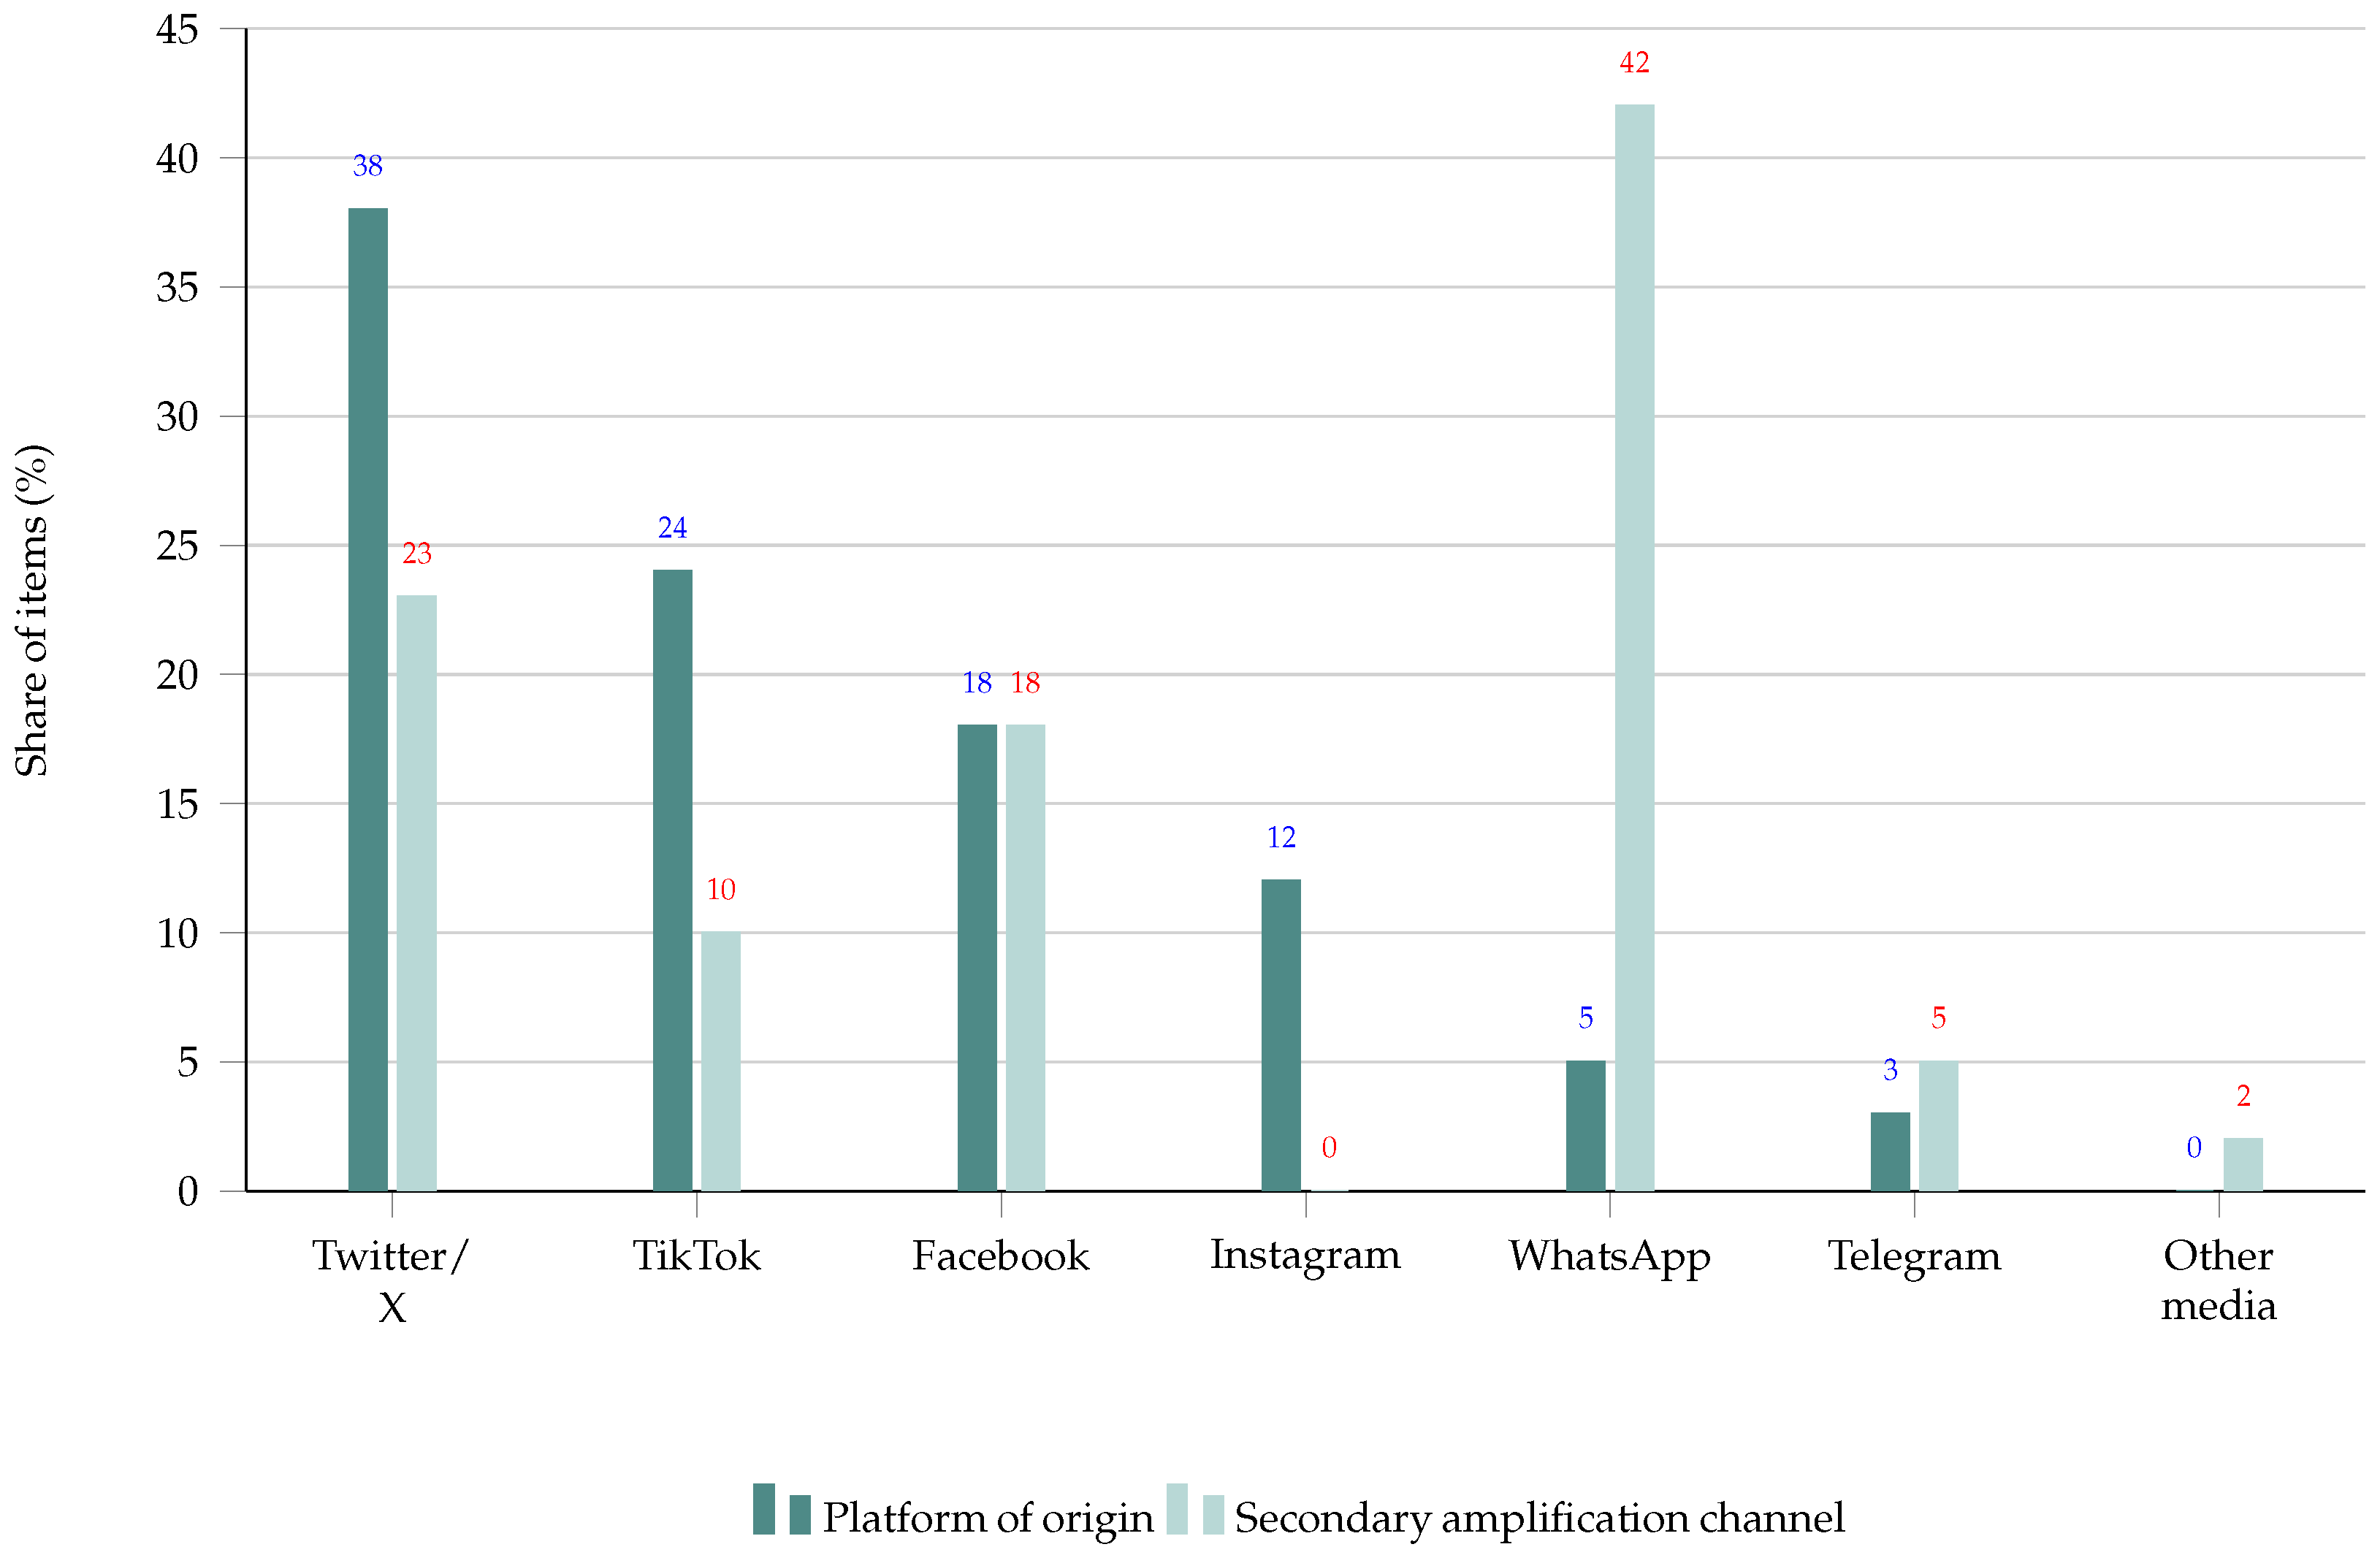
Figure 1 compares the two variables in a single chart. Twitter/X was the most frequent platform of origin (38%), followed by TikTok (24%), Facebook (18%), Instagram (12%), WhatsApp (5%), and Telegram (3%). By contrast, WhatsApp was the main secondary amplification channel (42%), followed by Twitter/X (23%), Facebook (18%), TikTok (10%), Telegram (5%), and other digital media (2%). This pattern is consistent with H3, which anticipated systematic cross-platform migration with Twitter/X as an initial hub and WhatsApp as a major amplification channel.
The two series in
Figure 1 refer to different analytical variables. Platform of origin denotes the earliest identifiable public or externally documented occurrence of each claim. Secondary amplification channels denote later circulation environments in which the same claim was detected after its initial appearance. The distinction is important because a platform may play a limited role as the first observable source of a claim while still functioning as a major amplification channel. This was particularly the case for WhatsApp in the analyzed sample.
The platform percentages shown in
Figure 1 should be interpreted as descriptive indicators of the verified viral claims included in the sample. They do not provide a representative measure of the total amount of disinformation circulating on each platform. This caution is especially relevant for WhatsApp and Telegram, where the number of cases is small and external observability is limited. In the case of WhatsApp, the study records whether a verified claim was externally documented as circulating through the platform, but it does not estimate the number of forwards, groups, users, or views. For Telegram, visible metrics from public channels were recorded when available. Private Telegram circulation was treated as documentary evidence rather than as measurable reach.
Overall, 78% of items migrated across platforms, adapting to the specific affordances of each environment and progressively expanding their reach.
Platform-specific patterns include:
- 1.
Twitter/X: Rapid propagation of rumors and decontextualized assertions; hashtags related to the emergency (e.g., #DANA, #València) functioned as diffusion conduits for both verified information and falsehoods.
- 2.
TikTok: Interest-based recommendations enabled viral spread among users without prior ties; audiovisual elements combined with emotive music heightened the impact of items about disaster magnitude.
- 3.
Facebook: Prioritization of close contacts and groups fostered information bubbles; private groups acted as amplification spaces with limited external oversight.
- 4.
Instagram: Especially effective for disseminating manipulated or decontextualized images; ephemeral stories impeded monitoring and verification.
- 5.
WhatsApp: Private, trusted settings lowered critical scrutiny of potentially false content; encryption complicated external monitoring; during the emergency the platform became a priority channel for both legitimate and false alerts and recommendations.
- 6.
Telegram: Thematic channels/groups—particularly those aligned with pre-existing conspiracies—operated as closed ecosystems reinforcing falsehoods; file-size limits facilitated circulation of lengthy documents and videos with an appearance of rigor.
4.3.2. Format Analysis
Audiovisual formats predominate: 42% videos and 31% images, compared with 10% text-only, 15% multimodal, and 2% audio items. To avoid relying exclusively on ordinal reach categories, format-level differences were examined using continuous indicators of visibility and engagement. These included views, interactions, shares or reposts, and the normalized virality index.
Descriptive comparisons by format show the following patterns within the analyzed sample:
- 1.
Videos showed higher average continuous reach than text-only items and static images. In the analyzed sample, their average reach was 2.3× that of text-only items and 1.7× that of static images.
- 2.
Multimodal content also showed higher engagement. It generated 38% more interactions than single-format items in the analyzed sample.
- 3.
Short videos (<60 s) accumulated 42% more views than longer videos, although this result should be interpreted descriptively because video length could not be experimentally isolated from platform effects, topic, or emotional framing.
These descriptive patterns are consistent with H2, which anticipated greater prevalence and reach for visual content. However, they should not be interpreted as population-level estimates of format effects. The dominance of audiovisual formats in the analyzed sample reflects evolving social media consumption preferences and the higher difficulty of verifying such content, particularly when decontextualized or manipulated.
4.4. Narrative Strategies
Analysis of the 100 most viral items reveals five predominant mechanisms, often combined within the same piece:
- 1.
Decontextualization (64%): Presenting genuine videos, images, or statements outside their original context; frequently effective with footage from prior disasters or different locations presented as current.
- 2.
Emotional manipulation (58%): Deliberate elicitation of strong affective responses (fear, indignation, hope) to reduce critical scrutiny; indignation-provoking items generated 47% more interactions than emotionally neutral content.
- 3.
False attribution (52%): Misassignment of statements, actions, or responsibilities to specific actors, often to discredit political opponents or institutions.
- 4.
Simplified causality (49%): Reducing complex phenomena to monocausal explanations, ignoring the inherent multicausality of natural disasters and their management.
- 5.
Political polarization (43%): Instrumentalizing the disaster to reinforce pre-existing partisan narratives, reframing technical or factual issues as ideological debates.
These findings are consistent with H4, which anticipated the prevalence of decontextualization, emotional manipulation, and political polarization. They also underscore the importance of false attribution and simplified causality as complementary mechanisms. Descriptively, the distribution of narrative strategies varied by platform and format. Decontextualization appeared frequently in visual formats on Instagram and TikTok. Emotional manipulation was especially visible in short-form videos with emotive music. Polarization was concentrated on Twitter/X and Facebook, where ideologically coherent communities amplified aligned content.
4.5. Verification and Countermeasures
Consistent with the statistical strategy described above, the verification results are presented as descriptive and exploratory associations within the analyzed sample.
Verification effectiveness was assessed using the operational indicators described in the methodology: time to verification, relative correction reach, relative correction engagement, source-neutrality proxy, format matching, alternative explanation, multichannel dissemination, and observable post-verification persistence. The results should therefore be interpreted as descriptive associations within the analyzed sample rather than as causal evidence of belief change.
Four verification characteristics were associated with higher correction visibility or engagement:
- 1.
Format matching: Corrections employing the same dominant format as the original falsehood showed higher relative correction reach. In the analyzed sample, format-matched corrections achieved 43% higher relative correction reach than corrections using a different format.
- 2.
Source-neutrality proxy: Verifications issued by independent recognized fact-checking organizations, technical agencies, scientific experts, or media organizations not directly implicated in the controversy showed higher relative correction engagement. These sources generated 37% higher relative correction engagement than sources coded as lower-neutrality. This indicator should not be interpreted as a direct measure of audience trust.
- 3.
Alternative explanation: Corrections combining a refutation with an explanatory account showed higher relative correction reach. In the analyzed sample, these corrections achieved 52% higher relative correction reach than denials that did not provide a substitute explanation.
- 4.
Multichannel dissemination: Corrections disseminated across more than one platform or channel achieved broader observable circulation. Their relative correction reach was, on average, 64% higher than that of single-channel corrections.
Time to verification also mattered descriptively. Earlier corrections tended to show lower observable post-verification persistence of the false claim, although this association should be interpreted cautiously because the study cannot observe all private circulation. Overall, these results partially support H5. They indicate that timing, source independence, explanatory framing, format alignment, and multichannel dissemination are associated with stronger observable correction performance within the analyzed sample.
Verification Actors
The distribution of verification efforts was uneven:
- 1.
Specialized fact-checking organizations (Maldita.es, Newtral, EFE Verifica, VerificaRTVE): Responsible for 58% of analyzed verifications; methods were rigorous but reach was comparatively limited.
- 2.
Traditional media: Contributed 24% of verifications, reaching broader audiences but often with less methodological depth.
- 3.
Official institutions: Accounted for 12%, focusing on refuting claims about their own actions or specific technical issues.
- 4.
Collaborative citizen initiatives: Contributed 6%, with limited reach but useful technical expertise in specific domains.
Collaborative verification was associated with broader observable diffusion within the analyzed sample. Joint verifications by recognized fact-checking organizations and traditional media achieved 47% higher correction reach than independent efforts, although this result should be interpreted as a descriptive association rather than as causal evidence of effectiveness.
5. Discussion
The findings of this study reveal the multidimensional complexity of disinformation during the 2024 València DANA, underscoring how crisis contexts intensify the convergence of emotional, technological, and political dynamics. Accordingly, the patterns identified in this study should be interpreted as reflecting social media–specific dynamics of crisis disinformation, rather than the full informational environment surrounding the València DANA, which also includes traditional and hybrid media systems not covered by the present analysis. Conspiracy theories about the causes of the disaster (28%) and misleading claims regarding institutional responses (22%) emerged as the most prevalent categories. These patterns align with [
11], which emphasized the tendency to seek simplified explanations for complex phenomena and to question institutional performance under conditions of uncertainty. The predominance of such narratives illustrates both the cognitive drive to make sense of traumatic events and the political instrumentalization of disasters in polarized environments. The proliferation of these false claims contributes to citizens’ growing distrust in traditional news media, echoing the concerns raised by [
35].
The sampling strategy also shapes the observed platform distribution. Since the final sample is restricted to claims verified by fact-checking organizations or other external verification sources, it is likely to overrepresent falsehoods circulating in open and more easily monitorable environments, such as Twitter/X, TikTok, Facebook, and Instagram. By contrast, claims that circulated mainly through WhatsApp or private Telegram groups are less likely to appear in the dataset unless they were forwarded to recognized fact-checking organizations, documented through screenshots, reported by institutions, or subsequently migrated to public platforms. This means that the relatively small number of WhatsApp and Telegram origin cases should not be interpreted as evidence of marginal relevance. Rather, it reflects the limited observability of encrypted or semi-private communication and the detection priorities of verification ecosystems.
The dominance of audiovisual formats (73%) mirrors the observations of [
10] regarding the superior persuasive power of visual content in the diffusion of falsehoods. This predominance may be explained by the capacity of images and videos to elicit emotional engagement, the increasing sophistication of manipulation tools, and the greater difficulty of verifying such content. The cross-platform migration patterns observed in the analyzed sample, with Twitter/X as the most frequent initial detection environment (38%) and WhatsApp as the principal documented secondary amplification channel (42%), are consistent with the “cross-media cascade” effect identified by [
36]. This adaptive migration complicates containment efforts, as verification strategies must be tailored to the affordances and cultures of each digital environment.
The narrative mechanisms that dominated—decontextualization, emotional manipulation, false attribution, simplified causality, and political polarization—demonstrate the sophistication with which disinformation exploits cognitive and emotional vulnerabilities. As ref. [
6] suggests, such mechanisms intensify during crises when populations experience heightened emotional stress and cognitive overload. The analysis of verification outcomes, meanwhile, aligns with the findings of [
3], which highlights the importance of timing, source credibility, explanatory framing, and format alignment. In this study, these dimensions were operationalized through observable indicators such as time to verification, relative correction reach, relative correction engagement, format matching, source-neutrality proxy, and post-verification persistence. Nevertheless, the persistent disparity between the reach of falsehoods and that of their corrections—verifications attaining on average 38% less reach—underscores structural limitations in the current fact-checking ecosystem.
When compared with prior research on disaster-related disinformation, both continuities and shifts emerge. In terms of typologies, parallels can be drawn with earlier cases such as Hurricane Katrina (2005), where rumors about institutional negligence and conspiracy theories about infrastructure manipulation proliferated [
37]. However, the 2024 València DANA shows a higher degree of narrative sophistication, incorporating technological (HAARP, geoengineering) and geopolitical (alleged Moroccan sabotage) motifs that reflect contemporary anxieties. Dissemination channels have also evolved markedly. Whereas the 2011 Japan tsunami saw disinformation circulate mainly through traditional media and blogs [
38], and Hurricane Sandy (2012) was dominated by Twitter and Facebook [
4], the València case suggests, within the verified viral claims analyzed here, a more diversified observable ecosystem in which instant messaging apps and short-form video platforms such as TikTok played relevant roles. This diversification complicates monitoring and verification strategies.
In terms of actors and motivations, the València DANA displays a greater degree of politicization than other recent disasters, such as the 2019–2020 Australian bushfires, where economic and conspiratorial motives predominated [
5]. Spain’s polarized political environment shaped the narratives that circulated, with partisan actors playing a visibly amplifying role. Verification practices during the València event also exhibit notable progress compared with prior crises, such as Hurricane Irma (2017), when responses were largely reactive and uncoordinated [
39]. The collaboration among recognized fact-checking organizations, institutions, and traditional media represents a meaningful advance, even as limitations remain in scope and overall effectiveness.
These findings also have implications for the design of digital infrastructures in crisis communication. First, the prominence of audiovisual formats suggests that monitoring systems should not rely only on text-based keyword detection. They should incorporate multimodal analysis, including image matching, video frame comparison, audio transcription, and on-screen text extraction. Second, the observed separation between platform of origin and secondary amplification channels indicates that crisis monitoring systems should be cross-platform by design. A false claim may originate in a public feed but acquire social relevance after circulation through messaging applications or group-based environments. Third, the results suggest that verification workflows should be interoperable across institutional, journalistic, and platform environments. This would allow corrections to be adapted to different formats and redistributed through multiple channels without losing traceability.
From the perspective of electronic communication systems, the study therefore points to the need for crisis information architectures that combine automated monitoring with human expert validation. Automated systems can support early detection, clustering of repeated claims, and identification of visual or textual recirculation. Human verification remains necessary to interpret context, assess factual accuracy, and produce credible explanations. The integration of both layers is particularly important in fast-moving emergencies, where misleading audiovisual content can circulate more quickly than conventional fact-checking responses.
Beyond their empirical contribution, these findings hold relevant implications for crisis communication management. The rapid emergence of misleading narratives within hours of the event highlights the necessity of pre-established verification resources and protocols that can be activated immediately in emergency contexts. The results suggest that institutions with dedicated teams and predefined procedures may have been better positioned to respond quickly to disinformation, although the study does not directly measure institutional effectiveness. The success of proactive communication strategies—such as those employed by AEMET [
40], which issued preventive explanations to pre-empt potential rumors—demonstrates the importance of anticipating misinformation themes and addressing them before alternative narratives take hold. Likewise, the adaptive migration of content across platforms underlines the need for multichannel verification strategies to ensure that accurate information reaches audiences wherever they consume it. The higher relative correction reach associated with format-matched corrections further indicates that verification content should be adapted to the specific characteristics of each medium and platform. Intersectoral collaboration appeared especially valuable within the analyzed sample: partnerships among traditional media, institutions, citizen communities, and recognized fact-checking organizations enhanced the reach and perceived credibility of corrections. At the same time, the persistence of emotionally and identity-driven narratives suggests the need for strategies that address not only informational accuracy but also the psychological and affective dimensions underlying belief formation and sharing. Finally, the differential vulnerability of population segments underscores the importance of sustained programs in media and information literacy aimed at strengthening critical capacities across society.
As with any empirical investigation, this study has limitations that delimit the scope of the findings. The sample is restricted to verified and externally traceable false or misleading claims, which may overrepresent content circulating on open platforms and underrepresent rumors confined to private or encrypted environments. Platform metrics remain only partial proxies for exposure, engagement, or influence, and they are not directly equivalent across platforms. The volatility of digital content, including deletion and moderation, also constrains longitudinal tracking. Finally, contextual specificity must be acknowledged: the findings are shaped by features of the Spanish media system, local cultural dynamics, and political polarization. Future research should therefore examine disaster-related disinformation across diverse methodological approaches, cultural settings, and political environments, while incorporating larger samples, longitudinal designs, and mixed-method approaches capable of capturing both public-platform traces and less visible private circulation.
6. Conclusions
This study advances understanding of how disinformation emerges, circulates, and is countered in the context of large-scale emergencies. More specifically, it examines a delimited segment of the information disorder ecosystem: the 100 highest-ranked verified false or misleading claims surrounding the 2024 València DANA. The findings should therefore be interpreted as patterns observed among verified viral claims, rather than as a comprehensive representation of all information flows, rumors, or misleading narratives that circulated during the event. By examining this sample, the analysis highlights the complex and multidimensional nature of information disorder during crises, spanning diverse typologies, strategies, and formats.
Within the analyzed sample, conspiracy narratives about the causes of the event (28%) and misleading claims about institutional response (22%) were the most prevalent, partially confirming the first hypothesis made in this work. Their dominance suggests both the human drive to seek simplified causal explanations for complex phenomena and the political instrumentalization of disaster in a polarized communicative environment. However, these results refer to verified viral claims and should not be generalized to all public or private communication about the disaster.
Audiovisual formats clearly dominated the analyzed disinformation landscape, achieving higher observable reach within the sample than textual content and showing patterns consistent with the second hypothesis made in this work. The prevalence of such formats reflects evolving patterns of media consumption and the growing challenges of verifying manipulated or decontextualized visual content. Platform analysis identified Twitter/X as the main source of initial disinformation (38%) and WhatsApp as the leading secondary amplification channel (42%). Nearly four in five items migrated across multiple platforms, adapting to the specific affordances of each environment and progressively amplifying their visibility. These patterns partially confirm the third hypothesis made in this work and underscore the structural complexity of the contemporary media ecosystem, where containment of falsehoods requires cross-platform awareness and coordination. At the same time, these platform findings should be interpreted cautiously because platform observability is uneven, especially for encrypted or semi-private channels such as WhatsApp and Telegram.
Narratively, the verified viral claims analyzed in this study were driven by recurrent mechanisms: decontextualization (64%), emotional manipulation (58%), false attribution (52%), simplified causality (49%), and political polarization (43%). These findings are consistent with the fourth hypothesis made in this work and reveal the cognitive and affective vulnerabilities that such strategies exploit, especially under crisis-induced uncertainty. Verification effectiveness, meanwhile, was assessed through observable correction indicators rather than direct measures of belief change. Within the analyzed sample, early intervention, format matching, higher source-neutrality coding, multichannel dissemination, and the inclusion of alternative explanations were associated with stronger correction visibility or engagement. These findings partially support the fifth hypothesis made in this work. Yet the persistent disparity between the reach of falsehoods and that of their verifications suggests structural asymmetries that continue to disadvantage corrective efforts in today’s media ecology.
The findings carry significant implications for both theory and practice. Theoretically, they suggest the need for integrated models that account for the informational, social, emotional, and technological dimensions of disinformation, as well as its contextual and temporal specificities. Practically, they emphasize the importance of anticipatory preparedness, proactive communication, format adaptation, multichannel strategies, intersectoral collaboration, psychosocial awareness, and media literacy as critical components of societal resilience to information disorder during crises. These implications are especially relevant for highly visible and platform-mediated disinformation, although further evidence is needed to assess their applicability to less visible or fully private communication environments.
The study’s limitations delimit the scope of these conclusions. The sample is restricted to verified false or misleading claims, which may overrepresent content detected by recognized fact-checking organizations and public monitoring systems. It may underrepresent rumors that circulated only in private groups, content that was deleted before documentation, or misleading narratives that were not selected for verification. Difficulties in reach estimation within closed platforms, content volatility, and contextual specificity indicate that the conclusions should be interpreted with caution. Future research would benefit from comparative analyses across different cultural and political settings, longitudinal studies tracing the evolution of crisis-related narratives, assessments of media literacy interventions in mitigating misinformation, and focused inquiries into the dynamics of closed or encrypted messaging environments. Larger samples and mixed-method approaches combining platform data, interviews, surveys, and collaboration with recognized fact-checking organizations or public agencies could also improve understanding of how verified corrections are received by different audiences.
Ultimately, understanding the anatomy of disinformation during disasters such as the 2024 València DANA is essential for building more resilient information ecosystems. As natural hazards and digital communication continue to intersect, developing evidence-based strategies that integrate technological, institutional, and civic responses will be crucial to sustaining trust, accuracy, and collective sense-making in the face of future crises. However, the conclusions of this study should be understood as evidence from a delimited sample of verified viral claims rather than as a comprehensive map of the full information ecosystem surrounding the disaster.



 ,
,