Article

MV-UNet: MambaVision U-Net for Breast Cancer Ultrasound Image Segmentation

1
Guangxi Key Laboratory Multimedia Communications and Network Technology, School of Computer, Electronics and Information, Guangxi University, Nanning 530004, China
2
School of Oncology, Guangxi Medical University, Nanning 530021, China
*
Author to whom correspondence should be addressed.
Electronics 2026, 15(11), 2274; https://doi.org/10.3390/electronics15112274
Submission received: 12 April 2026 / Revised: 16 May 2026 / Accepted: 20 May 2026 / Published: 25 May 2026
(This article belongs to the Section Artificial Intelligence)

Abstract

To address the problems of blurred lesion boundaries, noise interference, and the lack of lightweight design in segmentation models for breast ultrasound images, this paper proposes a lightweight, high-real-time segmentation model, MV-UNet, based on Mamba architecture. The model employs an improved MambaVision encoder paired with a UNetMamba decoder. This architecture, augmented by a Local Supervision Module (LSM) during training, effectively integrates global context with local details while maintaining linear computational complexity, thereby enhancing boundary delineation capability. The experimental results on the BUSI_WHU dataset show that the MV-UNet achieves 90.51% in mIoU, 90.85% in Recall, and 4.59 pixels in ASSD, surpassing most of the existing advanced models in multiple metrics. At the same time, the number of parameters is only 14.7% of the EMGANet, and the inference speed is increased by 3.2 times. Furthermore, an independent benchmark test on the BUSI dataset demonstrates the model’s practical efficiency, achieving an ASSD of 14.94 pixels while maintaining its clear advantages in model lightness and inference speed. In summary, the excellent balance between segmentation accuracy and model efficiency achieved by MV-UNet provides a novel and effective approach for breast ultrasound image segmentation.

1. Introduction

Globally, mammary carcinoma stands as the leading malignant tumor in the female population, where accurate diagnosis at an early stage plays a critical role in optimizing clinical outcomes [1]. Owing to its non-invasive nature, real-time capability, and absence of ionizing radiation, ultrasound imaging serves as a pivotal modality in the screening of breast carcinoma [2]. However, breast ultrasound images are generally plagued by speckle noise, acoustic shadow artifacts, and tissue heterogeneity, with lesion boundaries often appearing blurry and morphologically variable, which poses severe challenges for clinicians to make accurate diagnoses [2,3,4]. The ultrasound images of breast cancer are shown in Figure 1.
In recent years, convolutional neural networks (CNNs) represented by U-Net have achieved remarkable results in lesion segmentation tasks through the encoder–decoder structure and skip connections [4,5,6,7]. Nevertheless, the inherent limitation of local receptive fields in CNNs makes it difficult to effectively capture global contextual information, leading to low segmentation accuracy and poor robustness of the model when confronted with complex tissue backgrounds and artifact interference in breast ultrasound images. Although the introduction of multi-scale fusion and attention mechanisms can enhance the ability of global feature modeling [8,9], their capacity to model long-range dependencies is still limited, which makes it hard to meet the stringent clinical requirements for high-precision segmentation. Therefore, the Transformer architecture has realized global contextual modeling by virtue of the self-attention mechanism, giving rise to representative works such as TransUNet [9] and EH-Former [10]. However, the computational complexity of the self-attention mechanism in such methods increases quadratically with the input resolution, resulting in a huge number of model parameters and slow inference speed, which makes real-time inference and deployment difficult to achieve. To improve computational efficiency, the selective state space model (Mamba) [11] has shown significant advantages in long-sequence modeling tasks by virtue of its selective scanning mechanism with linear complexity, and has rapidly become a research hotspot in the field of computer vision. However, existing pure visual Mamba architectures [12,13,14,15] still have obvious deficiencies in capturing local detailed textures of images [16]. In the field of medical image segmentation, most Mamba-related studies remain at the level of single module replacement [17], failing to realize the deep fusion of the encoder–decoder path, and even lacking special optimization designs for the blurry boundary characteristics of breast ultrasound images. Clearly, this cannot give full play to the potential of Mamba in medical image segmentation.
To address the above problems, this paper proposes a lightweight and high-real-time segmentation model, named MambaVision U-Net (MV-UNet), aimed at exploring a promising balance. Based on the U-Net architecture, this model deeply integrates the advantages of Mamba and CNN. The encoder adopts the improved MambaVision [18], which efficiently fuses global contextual information with linear complexity, thus enabling the network to learn feature information by connecting contextual information more efficiently and in depth. The decoder introduces the MSD [19] to further improve the network segmentation efficiency and make the model more lightweight. In view of the blurry and variable boundaries of malignant cases in breast ultrasound images, a Local Supervised Module (LSM) [19] that is only used during training is further introduced to perform local supervision and improve the model’s ability to segment complex breast cancer boundaries. MV-UNet is evaluated on the public dataset BUSI_WHU [20], and an independent benchmark test is conducted on the external dataset BUSI [21], with comparisons made against a variety of advanced methods. The experimental results demonstrate that the proposed algorithm not only maintains superior segmentation performance but also greatly improves segmentation efficiency, demonstrating a favorable balance between segmentation performance and efficiency. In addition, ablation experiments are carried out on each introduced module, which proves the effectiveness of the proposed algorithm modules in the segmentation task of breast ultrasound images.
The primary contributions of this paper are as follows:
  • Proposes a new deep Mamba-integrated hybrid segmentation paradigm, MV-UNet. A key contribution of this work is the novel end-to-end deep integration of the two advanced architectures, improved MambaVision and UNetMamba, constructing a deeply collaborative encoder–decoder deep Mamba model. This design achieves an excellent balance between segmentation accuracy and model efficiency on public datasets.
  • By utilizing the linear computational complexity of Mamba, the number of model parameters is only 14.7% of that of the existing advanced models, and the inference speed is increased by 3.2 times, leading to improved computational performance.
  • A plug-and-play LSM is introduced to improve the boundary segmentation accuracy without increasing the inference cost.
  • Evaluations on the public BUSI_WHU and BUSI datasets demonstrate that the model achieves an excellent balance between segmentation accuracy and efficiency. Furthermore, experiments with five distinct random seeds on BUSI_WHU provide preliminary evidence for the model’s robustness. This work offers a new perspective and a feasible solution for the design of medical image segmentation models that pursue the synergistic optimization of high accuracy and high efficiency.

2. Related Work

Convolutional Neural Networks (CNNs) are the technical cornerstone of medical image segmentation due to their excellent local feature extraction capability. The encoder–decoder architecture represented by U-Net achieves efficient fusion of shallow and deep features through skip connections, which has yielded remarkable results in breast ultrasound image segmentation and spawned numerous improved models. For instance, HCTNet [4] attempts to integrate CNN and Transformer architectures to enhance the ability of global context modeling; GLFNet [5] proposes a global-local feature fusion strategy to further improve segmentation accuracy; AAU-Net [6] introduces an adaptive attention mechanism to strengthen the model’s perception and segmentation capability for lesion boundaries. However, the inherent limitation of local receptive fields in CNNs makes it difficult to fully model the long-range dependencies in images. Although subsequent studies have optimized the global feature modeling capability by introducing multi-scale fusion [8] and attention mechanisms [9], their ability to integrate global contextual information is still significantly limited when processing breast ultrasound images with complex tissue backgrounds, acoustic shadow artifacts, and blurry lesions with variable morphologies, which thus restricts the further improvement of segmentation performance.
Relying on its core self-attention mechanism, the Transformer architecture can establish global correlations between various regions of an image and realize effective modeling of global contextual information. This characteristic has made it rapidly applied in the field of medical image segmentation, giving rise to representative works such as TransUNet [9] and EH-Former [10]. Among them, EMGANet [20] has achieved excellent performance in breast ultrasound image segmentation by constructing a Multi-Scale Group-Mix Attention Block (MGM Block) with a self-attention mechanism. However, the computational complexity of the self-attention operation in this model increases quadratically with the input resolution, imposing substantial computational and memory burdens, thereby limiting its practicality in resource-constrained scenarios.
The Selective State Space Model (Mamba) [11] has shown great potential in long-sequence modeling tasks by virtue of its selective scanning mechanism with linear computational complexity, and has been rapidly extended to the field of computer vision. In visual tasks, pure visual Mamba architectures such as VMamba [22] have verified the application feasibility of this model in the visual field; in the direction of image segmentation, Swin-UMamba [23] has pioneered the exploration of the application value of Mamba in medical image segmentation. Aiming at the segmentation task of high-resolution remote sensing images, UNetMamba [19] innovatively proposes a Mamba Segmentation Decoder (MSD) with Visual State Space (VSS) blocks as the core, and designs a Local Supervised Module (LSM) only used in the training phase, achieving a good balance between segmentation efficiency and accuracy. As reported in [24], the MSD module has been migrated and applied to the crop disease segmentation task and obtains good results, which fully confirms the cross-domain application potential of UNetMamba. At the same time, MambaVision [18] proposes a hybrid backbone network integrating Mamba and Transformer, which achieves the state-of-the-art (SOTA) performance in both accuracy and throughput for image classification tasks. However, existing related studies still have obvious limitations: on the one hand, pure visual Mamba architectures have inherent limitations in capturing local details and texture features of images [16]; on the other hand, in the field of medical image segmentation, most studies remain at the level of replacing a single component in traditional CNN or Transformer architectures with Mamba modules [17], failing to realize the deep fusion and targeted optimization of the encoder–decoder path. In particular, there is a lack of dedicated Mamba architecture design for the unique challenges of breast ultrasound images, such as blurry boundaries and significant noise interference, which makes it difficult to give full play to the technical advantages of Mamba.
Therefore, this study proposes the MV-UNet model, which aims to deeply integrate the improved MambaVision encoder with the UNetMamba decoder through an innovative design of deep encoder–decoder path Mamba integration, and introduces the LSM, only used in the training phase, to strengthen the model’s ability to predict local details, thus simultaneously solving the accuracy and efficiency problems in breast ultrasound image segmentation.

3. Methods

3.1. Overall Architecture

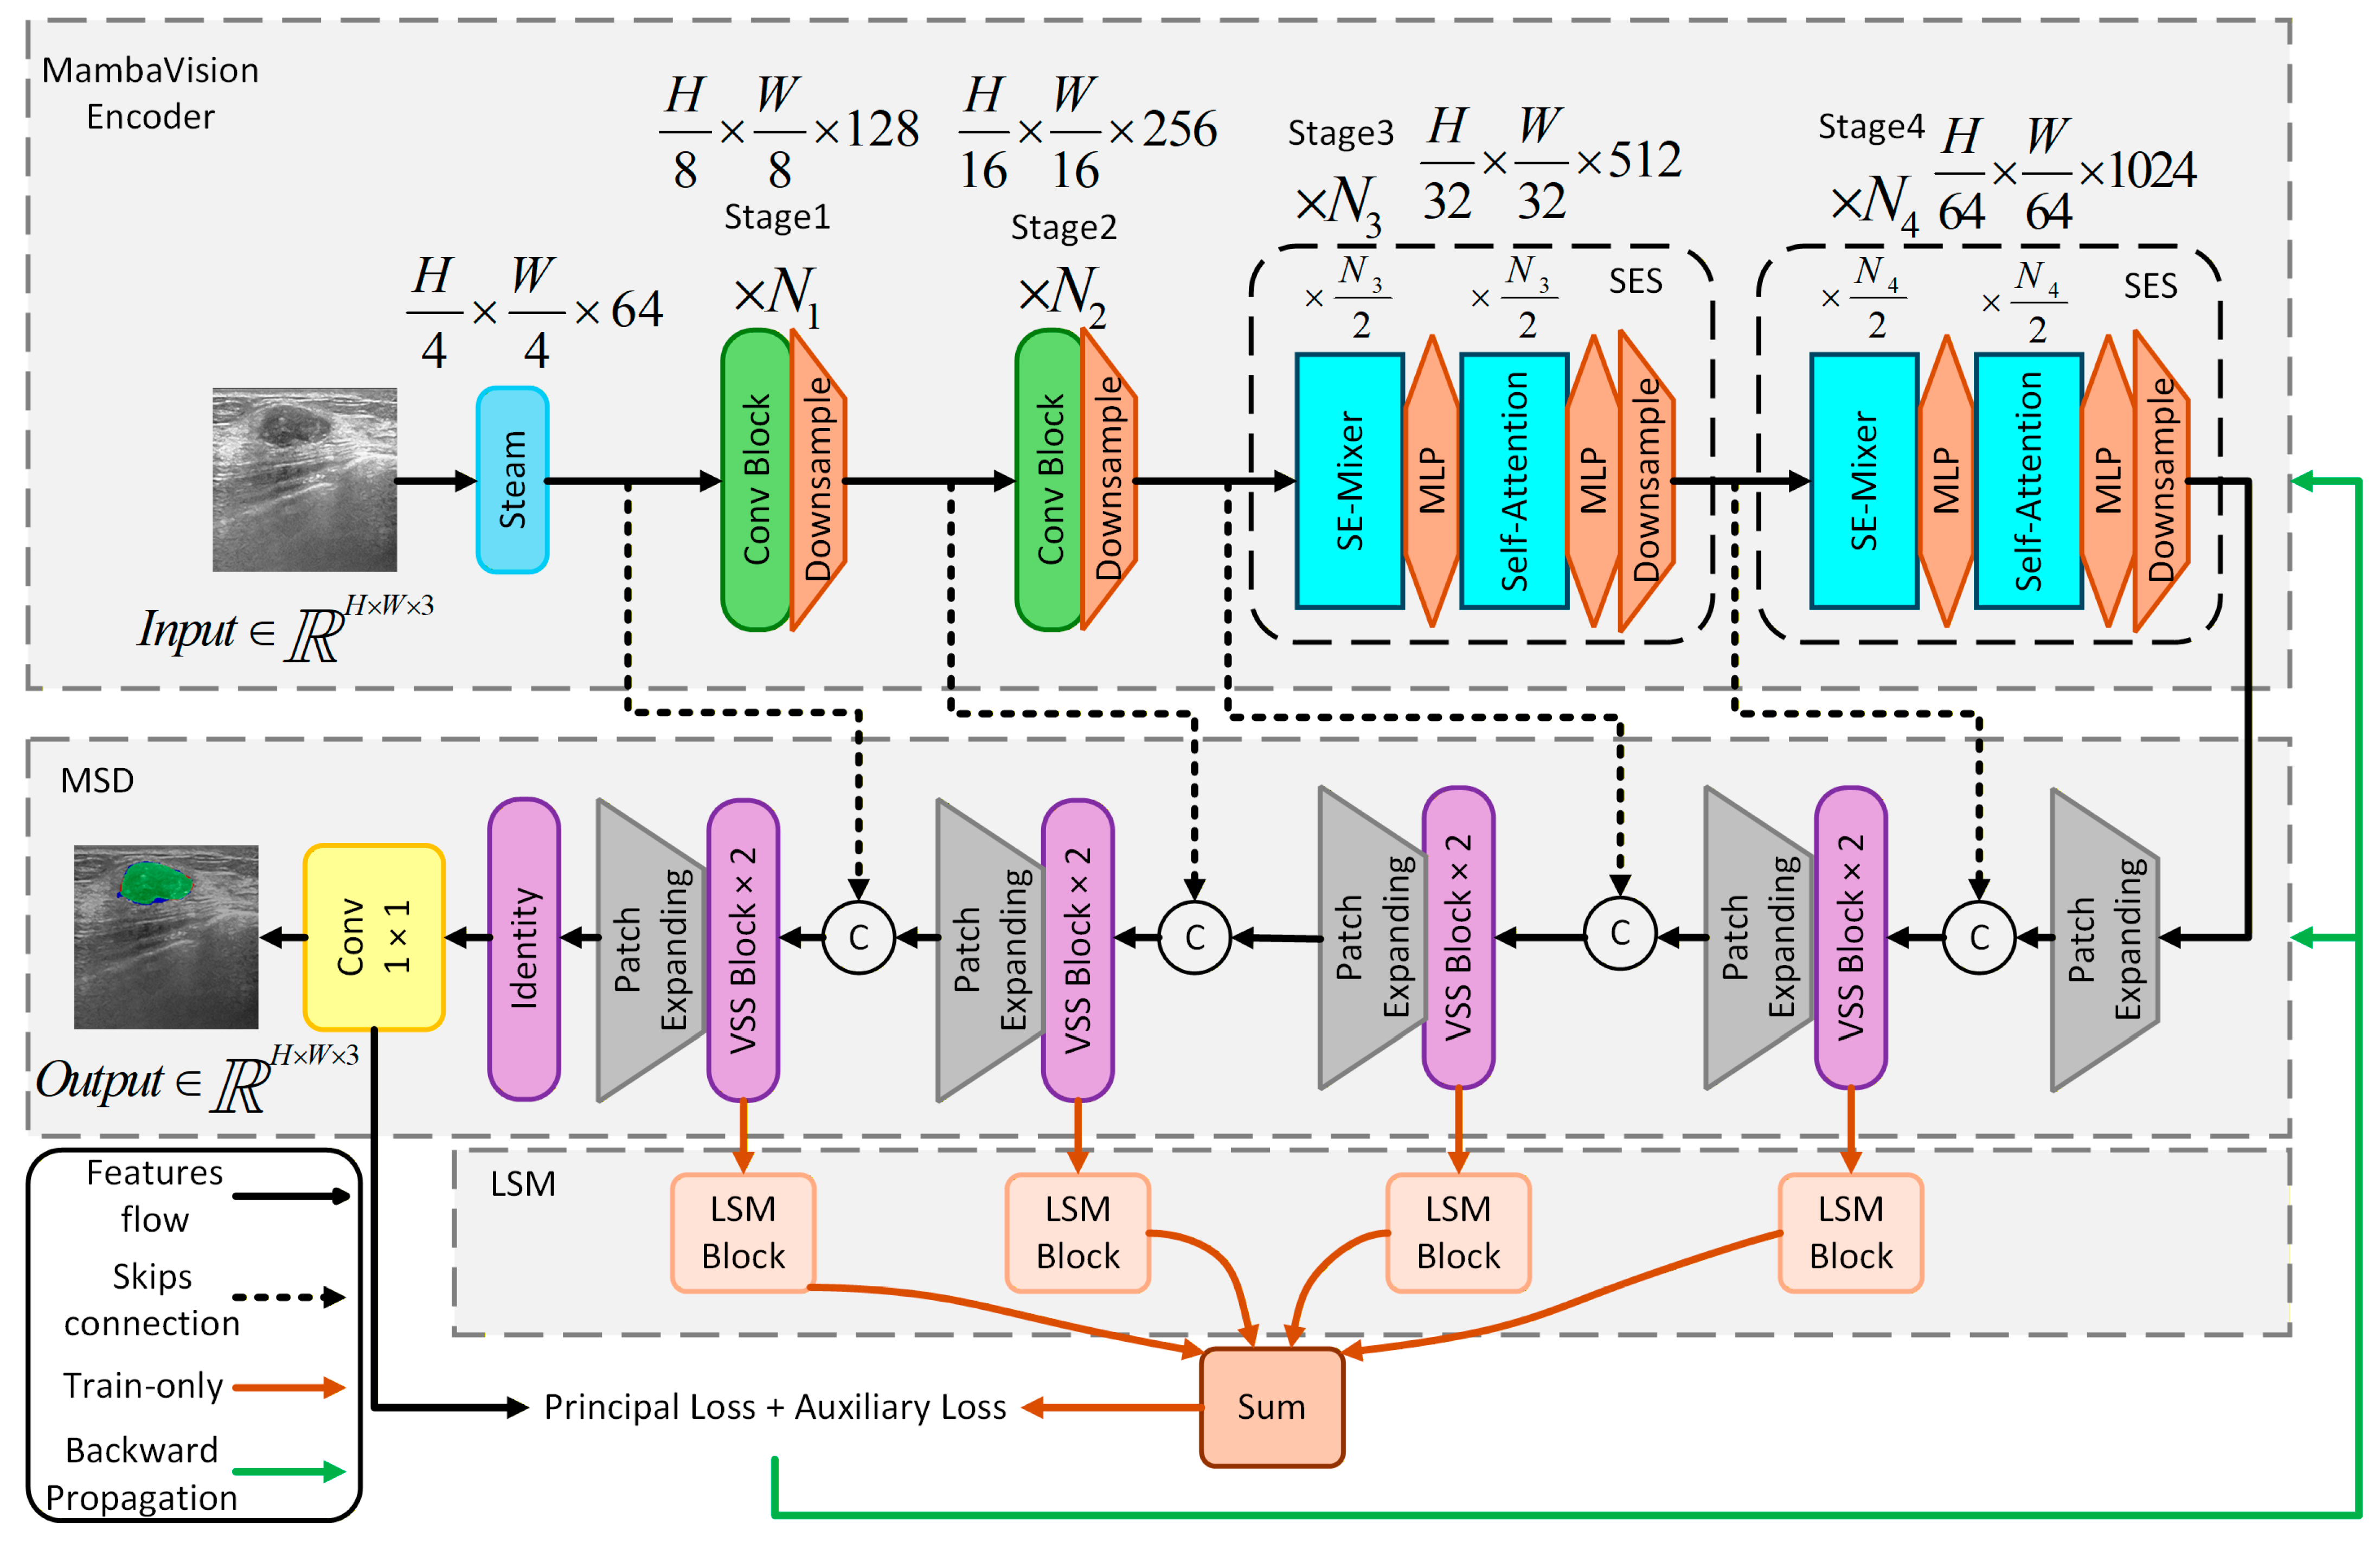
The overall architecture of the proposed algorithm is illustrated in Figure 2. MV-UNet follows the classic U-Net architecture, mainly consisting of an improved MambaVision encoder, a Mamba segmentation decoder (MSD), and a Locally Supervised Module (LSM), with the LSM enhancing the model’s ability to perceive local details.
The encoder of MV-UNet adopts the improved MambaVision encoder. An input image first undergoes processing through a Stem layer, which compresses its spatial dimensions (width and height) to a quarter of the original size and expands the number of channels to 64. Subsequently, the feature map sequentially passes through four stages, with the number of layers in each stage denoted as N 1 , N 2 , N 3 , N 4 , configured as 3, 3, 12, 5, respectively, with reference to the MambaVision-L2 model [18]. Among them, Stage 1 and Stage 2 are composed of Convolutional Block (Conv Block) for efficiently extracting local features at high resolution; Stage 3 and Stage 4 employ SE-MambaVision Stage (SES) modules to fuse global contextual information in deep features with linear complexity. After each stage, a downsampling layer is applied to halve the spatial dimensions and double the number of channels of the feature map.
The decoder is the MSD, whose core function is to gradually recover image details and generate accurate segmentation maps. The decoder comprises five components: the first four components each consist of a Patch Expanding operation and two cascaded Visual State Space Blocks (VSS Blocks); the last component is composed of a Patch Expanding operation and an Identity layer. The specific process is as follows: each component of the MSD first performs a Patch Expanding operation on the input features to upsample the feature map to a higher resolution; then it splices and fuses with the skip connection features from the corresponding layer of the encoder, and halves the feature dimension through a dimension adjustment operation to meet the requirements of subsequent processing; next, the fused and dimension-reduced features are input into the VSS Blocks for refinement to fully capture global contextual information. After gradual upsampling, cross-level feature fusion, dimension optimization, and refined feature extraction through the five components, the target segmentation prediction results are finally output through a 1 × 1 convolution head.
In addition, to address the limitation of the Mamba architecture in predicting breast malignant lesions with blurry and variable boundaries [16], this paper introduces an LSM that is only activated during the training phase. During training, the LSM receives the features output by the first four components of the MSD, extracts multi-scale local details through parallel convolution branches, and generates auxiliary segmentation prediction maps through upsampling. The auxiliary loss generated by the LSM and the main loss jointly guide model training through weighted fusion, effectively improving the model’s ability to learn local semantic information and lesion boundary information without increasing the computational overhead during the inference phase.

3.2. Improved MambaVision Encoder

3.2.1. Convolutional Block (Conv Block)

The core of the Conv Block is a double convolution block structure with residual connections. Given the input features X i n p u t B × C × H × W (where B , C , H , and W denote the batch size, number of channels, height, and width), the module performs transformation processing on the features through two 3 × 3 convolution kernels C o n v 3 × 3 . During this process, Batch Normalization (BN) and GELU activation functions are embedded to generate output features Y C o n v B × C × H × W , which are then added to the original input features through residual connections to complete feature enhancement. The corresponding formulation is as follows:
Z C o n v 1 = G E L U ( B N ( C o n v 3 × 3 ( X i n p u t ) ) ) Z C o n v 2 = B N ( C o n v 3 × 3 ( Z C o n v 1 ) ) Y C o n v = X i n p u t + Z C o n v 2 ,
where Z C o n v 1 denotes the intermediate output after the first C o n v 3 × 3 , BN, and GELU, whereas Z C o n v 2 represents the intermediate output obtained after the second C o n v 3 × 3 and normalization steps.

3.2.2. SE-MambaVision Stage (SES)

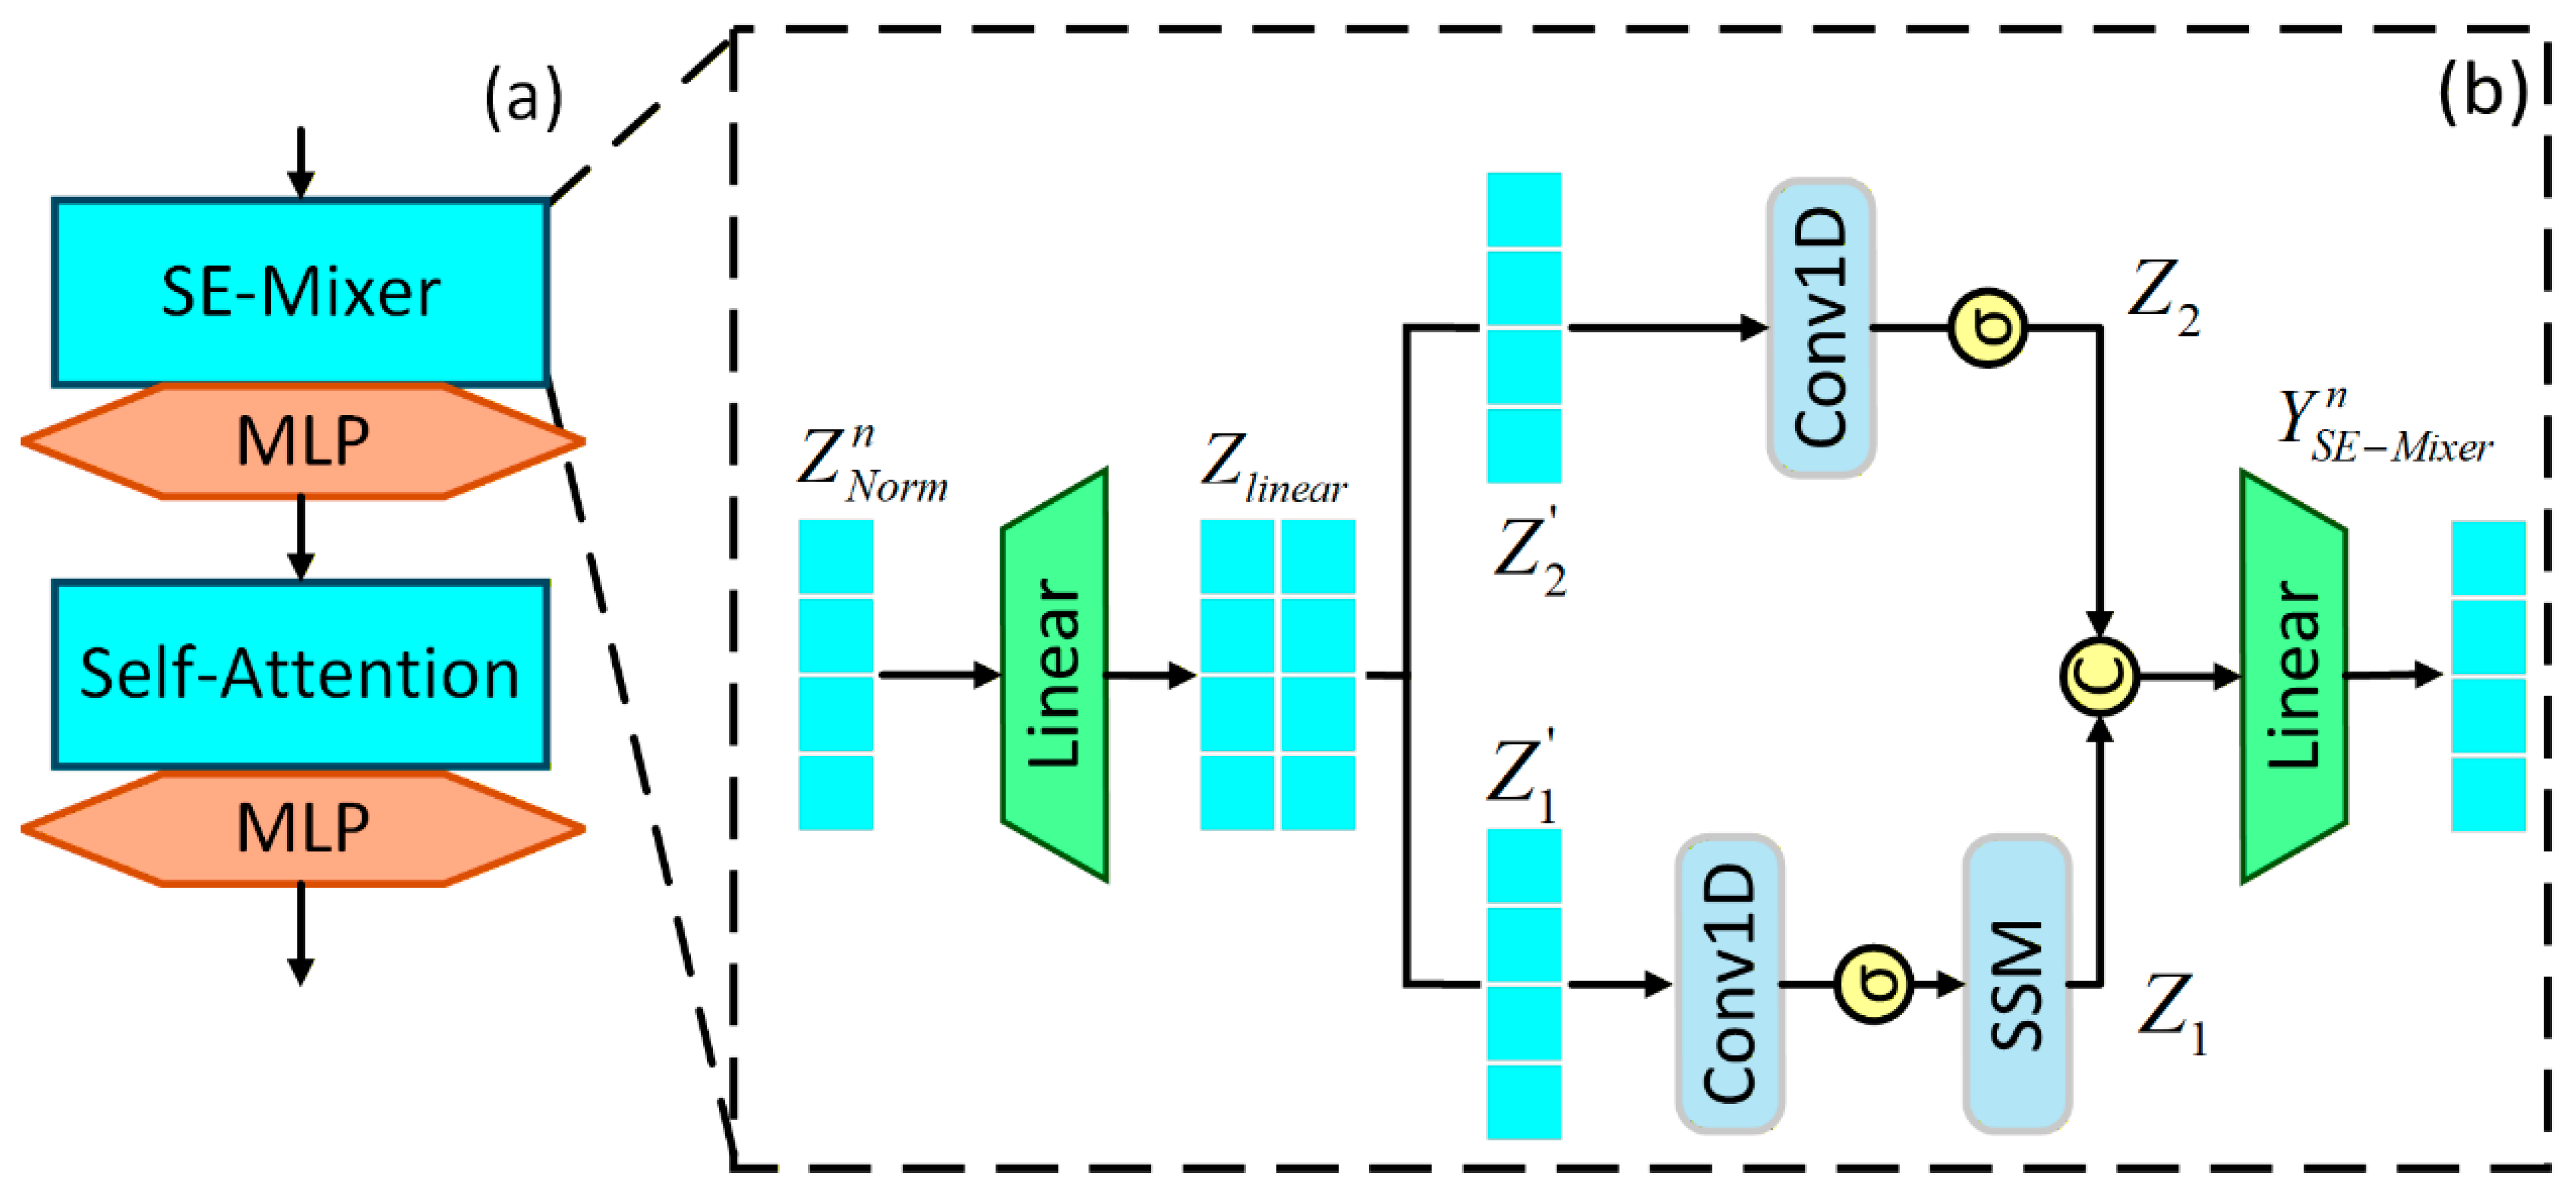
The SES module serves as the core component for advanced feature transformation in the deep layers of the encoder. As illustrated in Figure 3.
An SES block consists of Layer Normalization ( N o r m ), a token mixing module ( M i x e r ), and a Multilayer Perceptron ( M L P ), integrated into the architecture via residual connections. Specifically, given the output of the (n − 1)-th layer, X M i x e r n 1 , the computation of the n-th layer’s output, X M i x e r n , follows these steps:
  • The input X M i x e r n 1 is first normalized by N o r m , yielding an intermediate feature Z N o r m n .
  • The normalized features are then processed by the M i x e r , yielding an output Z M i x e r n .
  • The output of the Mixer is combined with the original input X M i x e r n 1 via a residual connection, yielding the intermediate feature Z M i x e r n .
  • Z M i x e r n subsequently passes through N o r m , followed by the M L P .
  • The output of the M L P is finally combined with Z M i x e r n through another residual connection to produce the final output of this layer, X M i x e r n .
This process can be formally expressed as
Z N o r m n = N o r m ( X M i x e r n 1 ) Z M i x e r n = M i x e r ( Z N o r m n ) + X M i x e r n 1 , X M i x e r n = M L P ( N o r m ( Z M i x e r n ) ) + Z M i x e r n ,
If the Mixer employs Mamba exclusively, it would be constrained by two inherent limitations of the original Mamba’s autoregressive formulation: firstly, it imposes an unnatural sequential order assumption on images, leading to inefficient processing; secondly, its step-by-step processing mechanism restricts the model’s ability to capture and utilize the complete global context in a single forward pass. This is incompatible with the requirements of breast ultrasound image segmentation, which demands effective global information integration and processing efficiency.
Therefore, drawing on the optimal design strategy of MambaVision [18], the SES adopts a hybrid architecture: the first N / 2 layers employ an improved Single Expansion Mamba Mixer (SE-Mixer) followed by an MLP to efficiently model long-range dependencies; the latter N / 2 layers employ Multi-Head Self-Attention (MHSA) followed by an MLP to achieve dense interaction between features. This design enhances segmentation accuracy while preserving computational efficiency.
The MambaVision Mixer in the original MambaVision first splits the input features and then independently performs linear expansion within each branch, a process that introduces additional computational overhead. To address this, we designed the SE-Mixer. It adopts a strategy of first performing a unified linear expansion, followed by branch-split processing, thereby reducing computational redundancy. Its structure is shown in Figure 3b. The specific workflow is as follows: given an input feature Z N r o m n T × C , it is first projected to double the embedding dimension via a linear layer, yielding Z T × 2 C . Subsequently, Z is split evenly along the channel dimension into two branches. Branch one, Z 1 T × C , captures long-range dependencies through Mamba’s selective scan ( S c a n ) operation. Branch two, Z 2 T × C , compensates for local spatial information via a convolution and a SiLU activation function. The outputs of the two branches are concatenated and then projected back to the original dimension C via a linear layer, finally producing the output Y S E M i x e r n T × C . The process is formulated as:
Z = L i n e a r ( C , 2 C ) ( X M i x e r n 1 ) , Z 1 , Z 2 = C h u n k ( 2 ) ( Z ) , Z 1 = S c a n ( σ ( C o n v 1 D ( Z 1 ) ) , Z 2 = σ ( C o n v 1 D ( Z 2 ) ) , Y S E M i x e r n = L i n e a r ( 2 C , C ) ( C o n c a t ( Z 1 , Z 2 ) ) ,
where L i n e a r ( C , 2 C ) ( · ) denotes a linear projection layer that expands the input dimension from C to 2 C and L i n e a r ( 2 C , C ) ( · ) represents a linear project layer that compresses the input dimension from 2 C back to C . Furthermore, C h u n k n u m is the operation of splitting evenly into n u m parts along the channel dimension, S c a n represents the core selective scanning mechanism of Mamba and C o n v 1 D denotes a 1D convolution operation.

3.2.3. Architectural Adaptation Modifications

To integrate the improved MambaVision encoder into the MV-UNet architecture, we performed two adaptation modifications: First, we removed the original model’s terminal global average pooling layer and classification linear layer, as these components are designed for classification tasks and are unnecessary for an encoder. Second, we preserved the feature maps output at the end of each of the four stages. After downsampling, these features are transmitted to the corresponding decoder levels via skip connections, providing multi-scale feature support for the reconstruction of lesion details.

3.3. Mamba Segmentation Decoder (MSD)

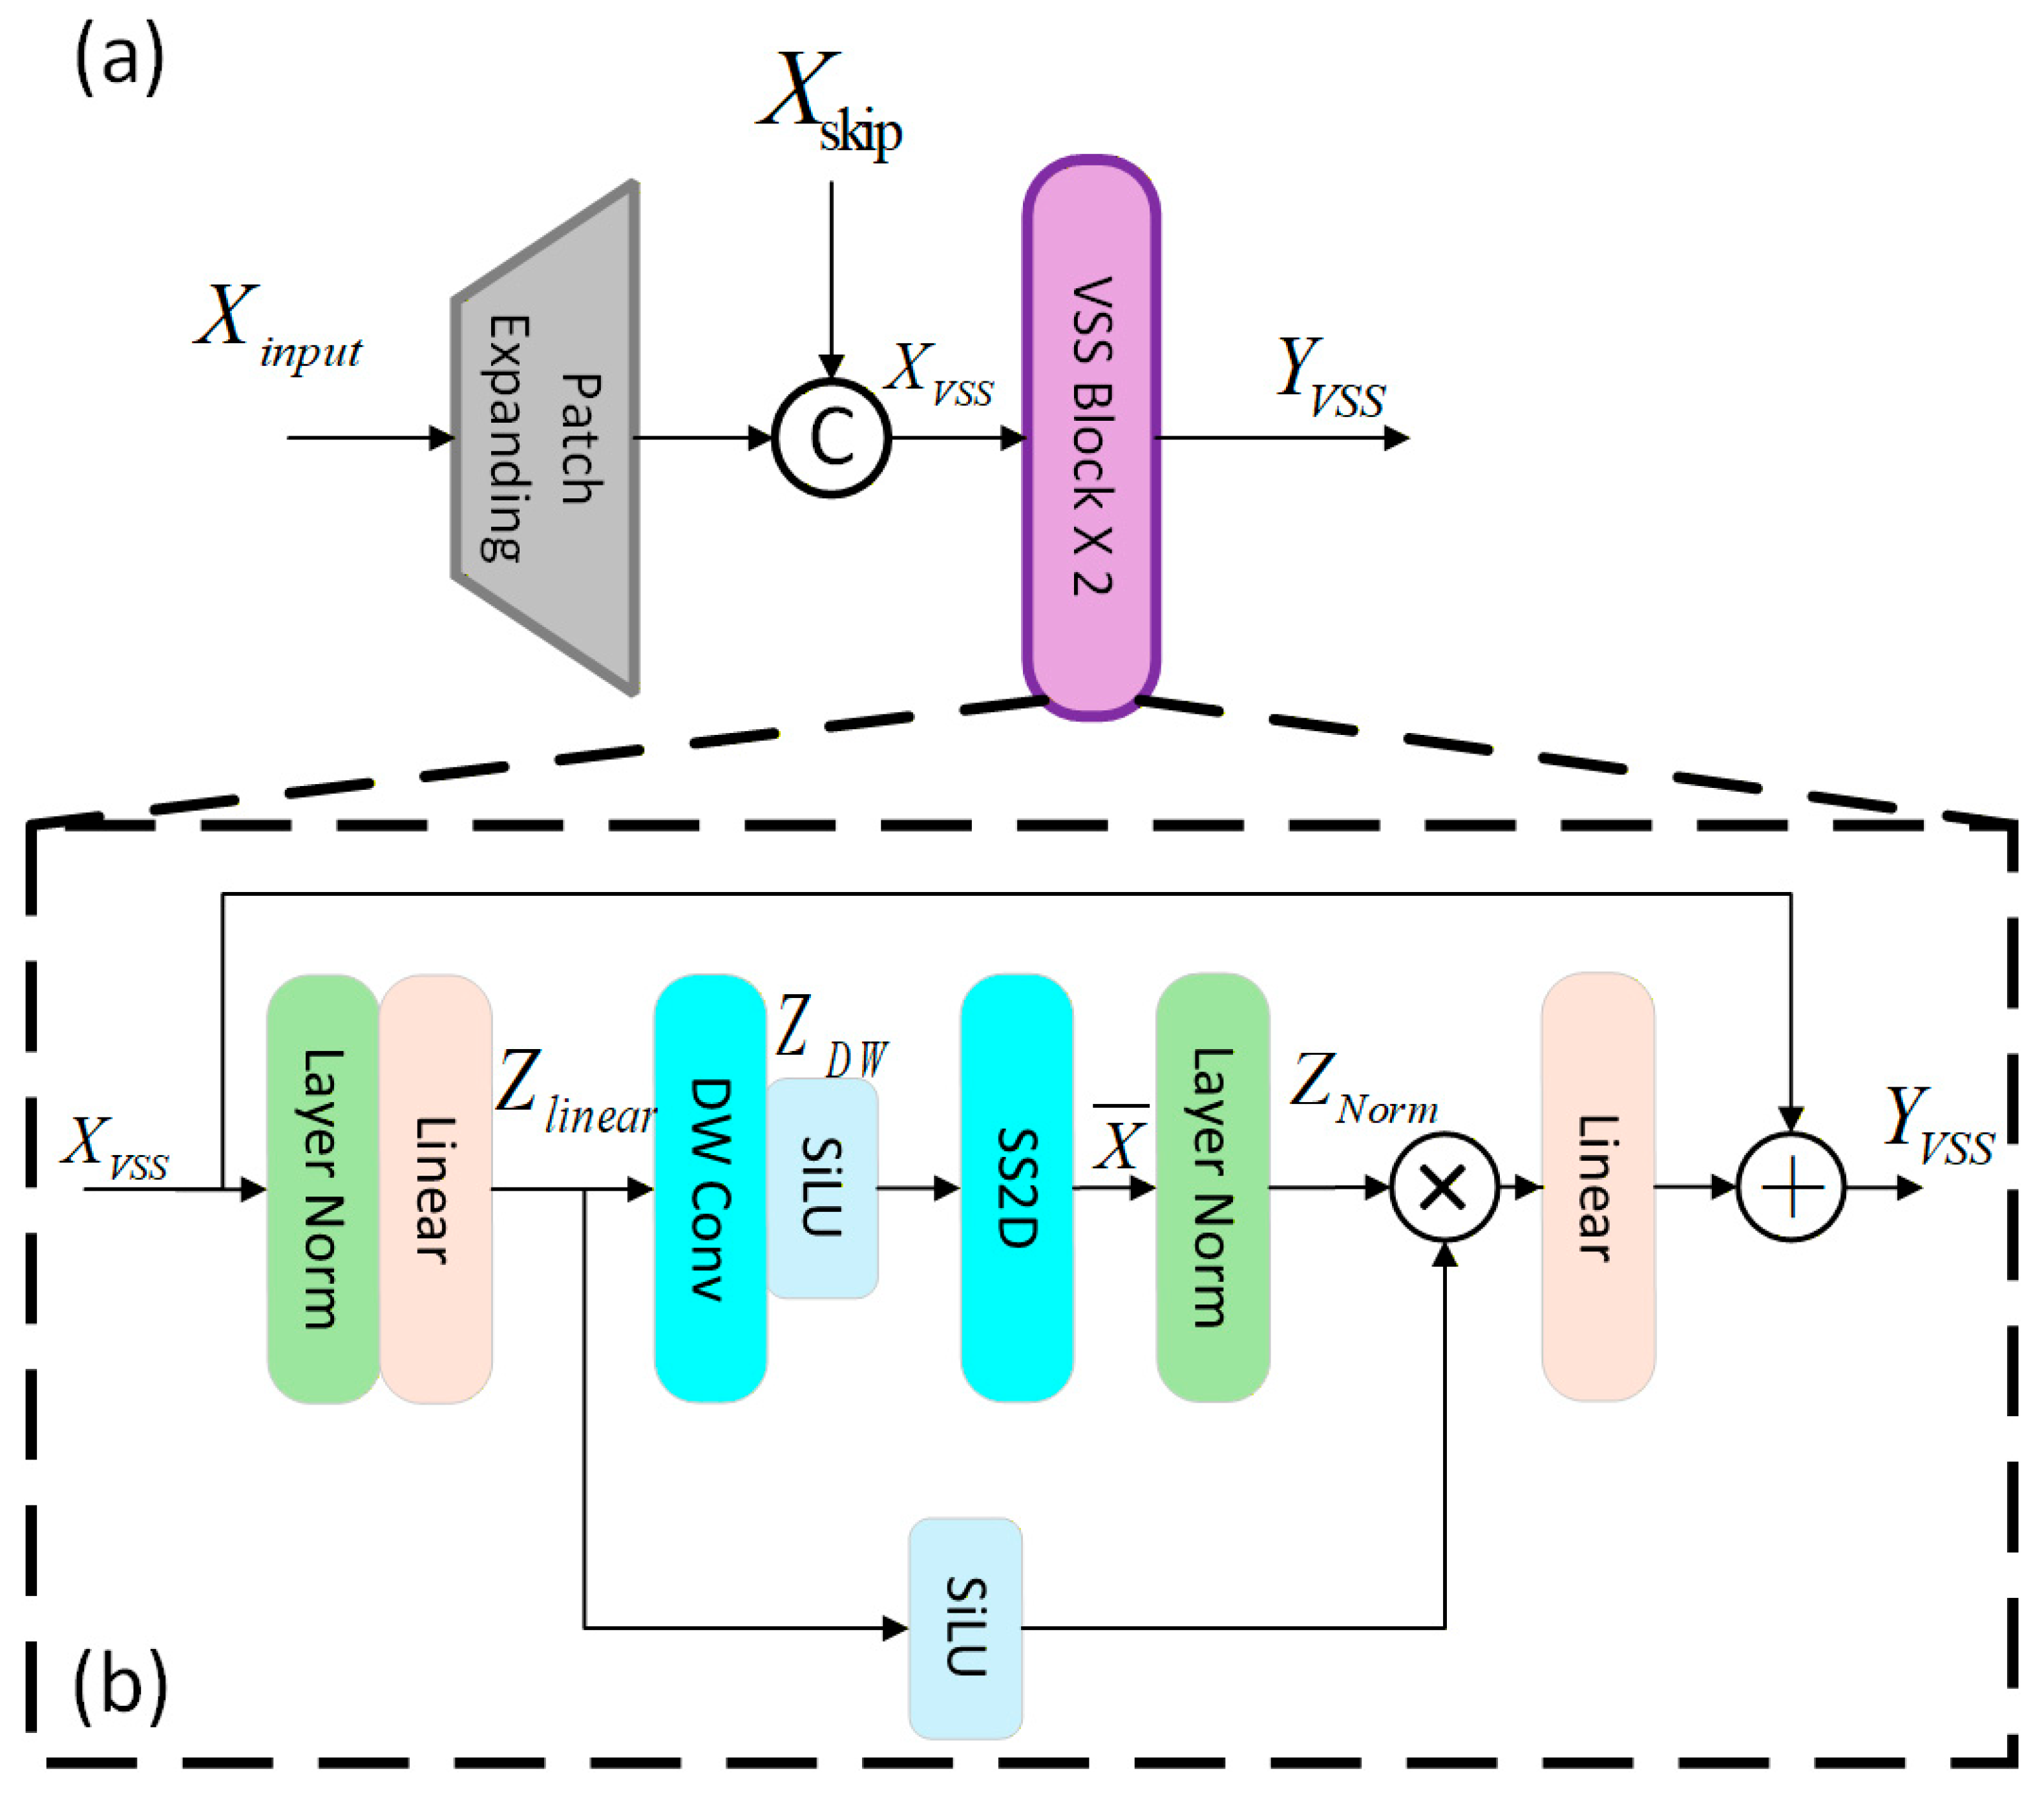
The MSD is responsible for upsampling the deep semantic features extracted by the encoder and reconstructing them into a high-resolution segmentation map. Its core component is the VSS Block, the structure of which is illustrated in Figure 4.

3.3.1. VSS Block

At each decoding component, the input feature X i n p u t undergoes an initial upsample via a Patch Expanding operation. Specifically, the input to the first (bottom-most) component is the final output feature from the encoder. For each of the subsequent four components, the input is the output feature from the immediately preceding decoding component. The upsampled feature is then concatenated with the corresponding skip-connection feature X s k i p from the encoder. This concatenated result passes through a linear projection layer ( B a c k D i m ) or channel dimension adjustment, yielding the feature X V S S , which is then fed into two cascaded VSS Blocks for refinement. The process is formulated as:
X V S S = B a c k D i m ( C o n c a t ( X s k i p , P a t c h E x p ( X i n p u t ) ) )
The processing flow of a VSS module is as follows: After applying Layer Normalization ( L a y e r N o r m ) to the input, the feature flow splits into two branches. Branch one undergoes linear embedding ( L i n e a r E m b e d ) to obtain Z L i n e a r , which is then processed by a 3 × 3 depthwise convolution ( D W C o n v ) and a SiLU activation function to output Z D W :
Z L i n e a r = L i n e a r E m b e d ( L a y e r N o r m ( X V S S ) ) Z D W = S i L U ( D W C o n v ( Z L i n e a r ) )
Subsequently, the 2D Selective Scan (SS2D) module [11] scans Z D W in four directions, decoding semantic information under a global receptive field with linear complexity:
X d = S c a n E x p ( Z L i n e a r , d ) , d { 1 , 2 , 3 , 4 } X d ¯ = S 6 ( X d ) , d { 1 , 2 , 3 , 4 } X ¯ = S c a n M e r g e ( X 1 ¯ , X 2 ¯ , X 3 ¯ , X 4 ¯ ) Z N o r m = L a y e r N o r m ( X ¯ )
where S c a n E x p and S c a n M e r g e are the expansion and merging operations from VMamba [22], and S 6 represents the selective scan state space model of Mamba [11]. The variable d { 1 , 2 , 3 , 4 } corresponds to four distinct scanning directions: left-to-right, right-to-left, top-to-bottom, and bottom-to-top, respectively. The output Z L i n e a r of the second branch is processed by a linear layer followed by a SiLU activation function. This result is then element-wise multiplied by the output from branch one. Finally, the result is added to the module’s input via a residual connection, producing the output Y V S S :
Y V S S = X V S S + Z N o r m S i L U ( Z L i n e a r )

3.3.2. Architectural Adaptation Modification

To ensure full compatibility between the MSD and the improved MambaVision encoder, we expanded the original four-layer MSD to five layers. This modification enables it to receive features from all five scales of the encoder, including the Stem layer output and the outputs of the four stages, via skip connections. This achieves more sufficient multi-scale information fusion and enhances the capability for reconstructing lesion details. The effectiveness of this architectural adaptation is quantitatively validated in our ablation studies. Specifically, within the U-Net encoder + UNetMamba decoder + LSM framework, upgrading the MSD from the four-layer version Ours-part1_4 to the five-layer version Ours-part1_5 leads to a performance gain of 0.26% in mIoU, from 89.94% to 90.20%; a 1.49% increase in Recall, from 89.25% to 90.74%; and a 0.46% improvement in the Kappa coefficient, from 88.27% to 88.73%. These results (the complete quantitative data are presented later in Table 7) confirm that the five-layer decoder contributes to improved segmentation accuracy through enhanced multi-scale feature integration.

3.4. Local Supervision Module (LSM)

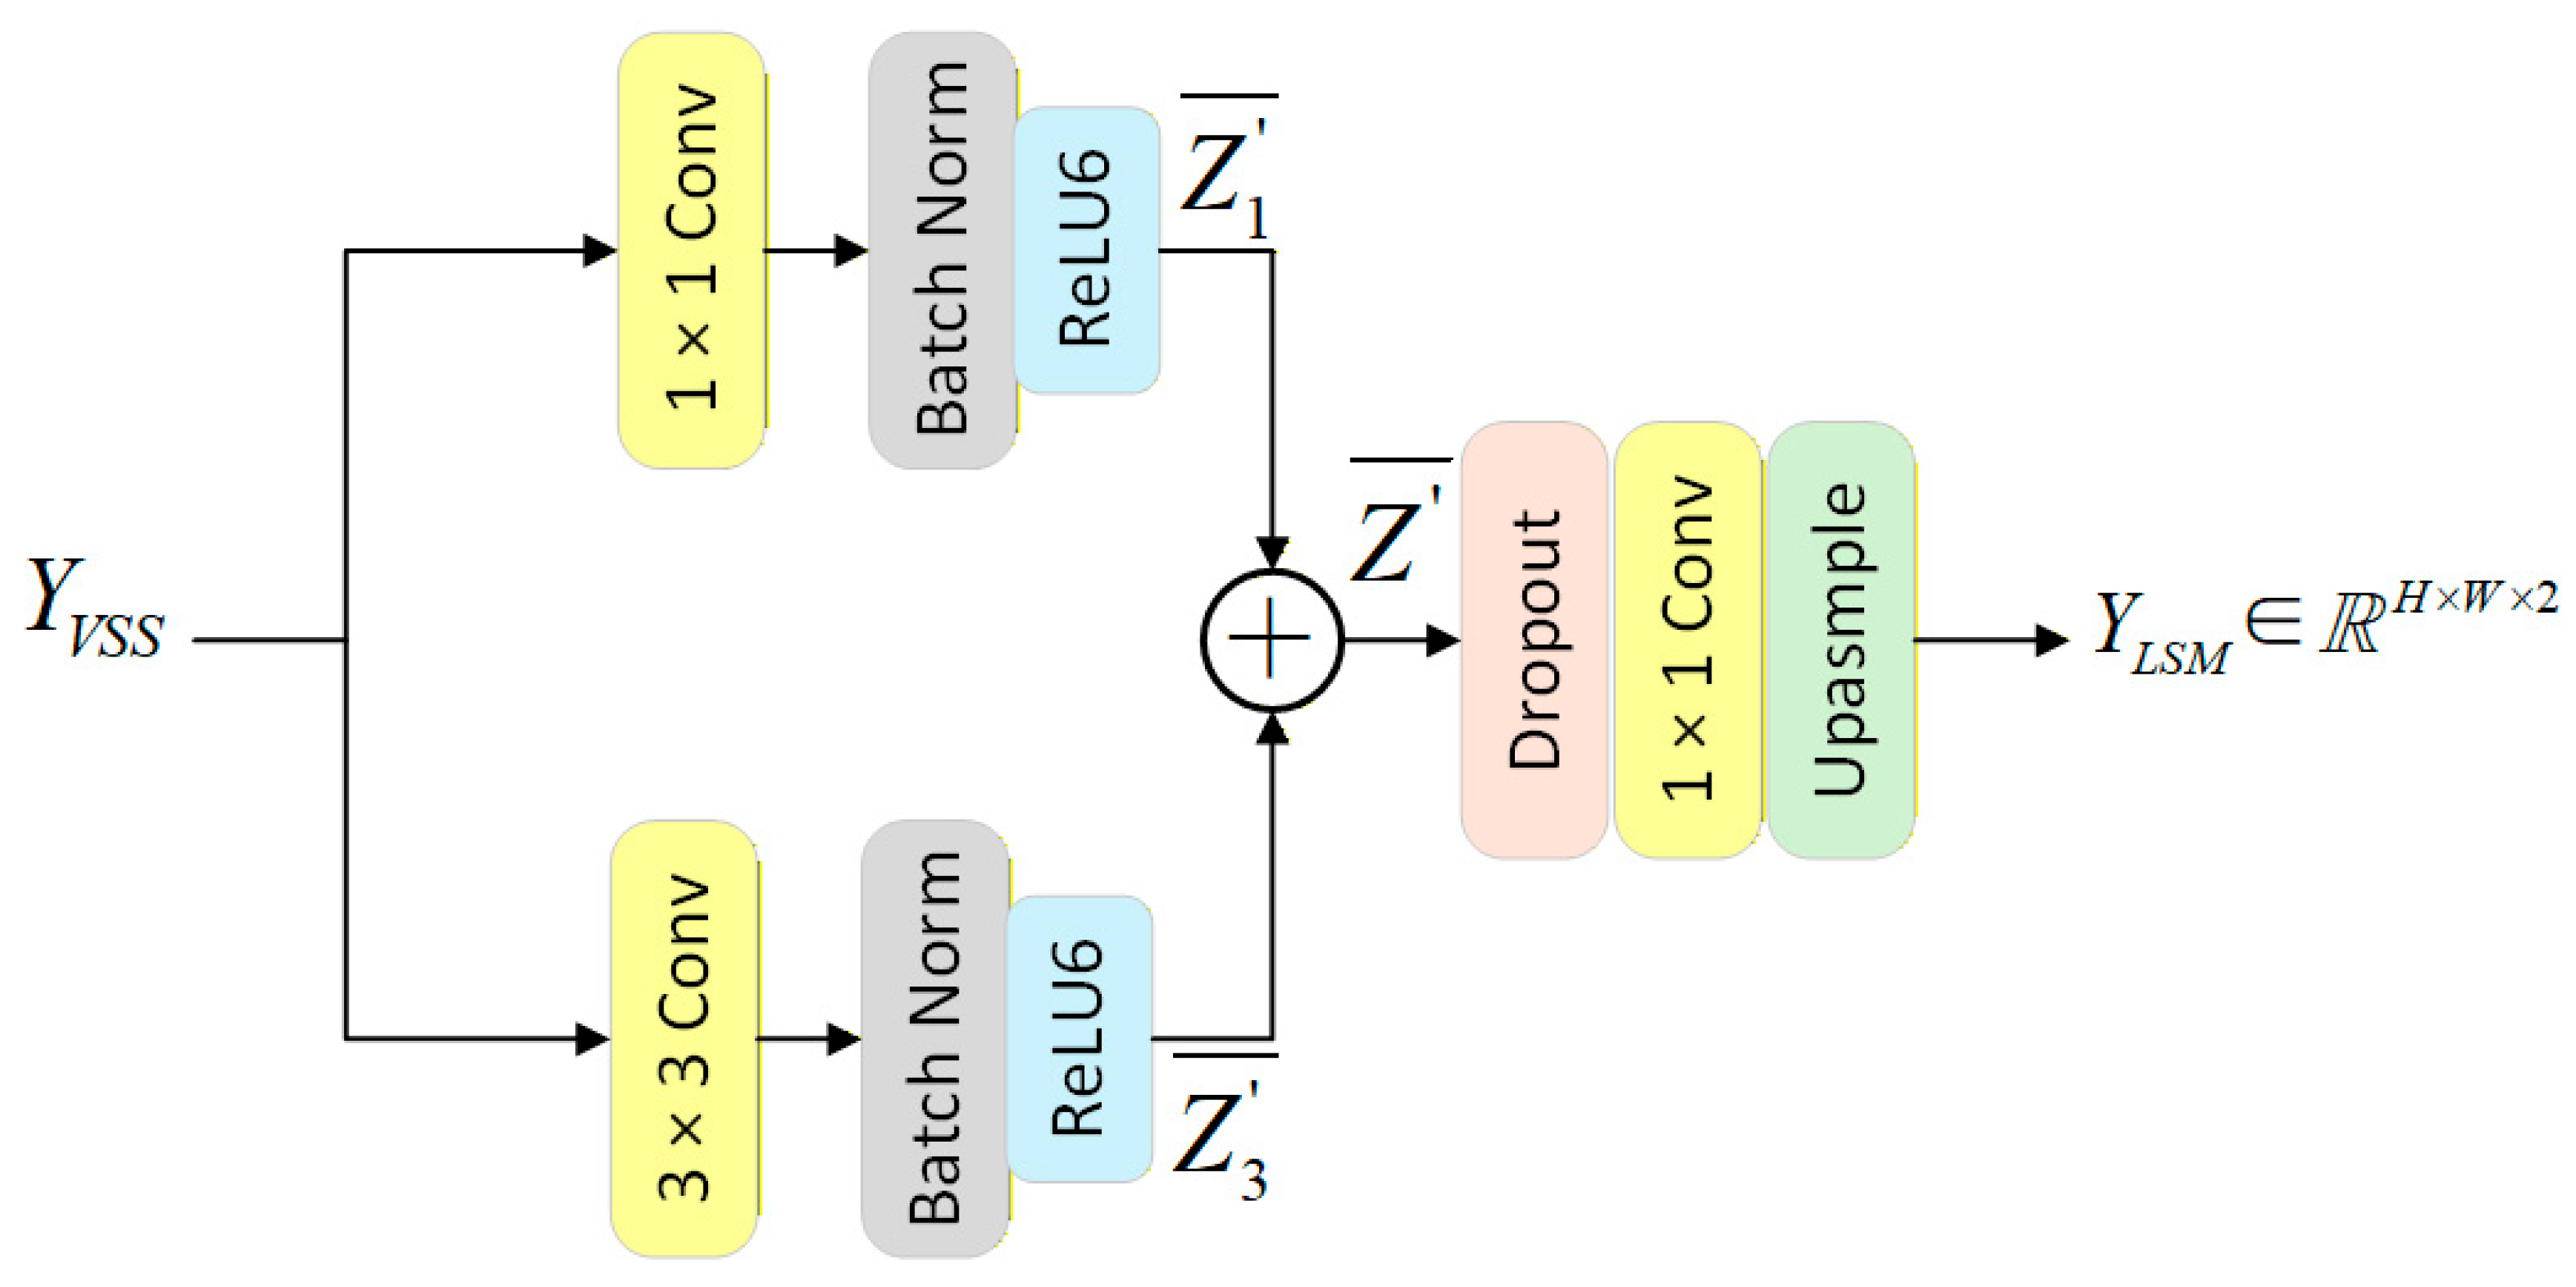
The LSM is designed to enhance the model’s perception of local details. As illustrated in Figure 5.
The LSM takes the intermediate feature maps output by the MSD as its input. It employs two parallel convolutional branches—with kernel sizes of 1 × 1 and 3 × 3 , respectively—to extract multi-scale local features. Each branch is followed by Batch Normalization and a ReLU6 activation function:
Z i ¯ = Re L U ( B a t c h N o r m ( C o n v i ( Y V S S ) ) ) , i { 1 , 3 }
where the i { 1 , 3 } in the Z i ¯ denotes the convolutional kernel sizes of 1 × 1 and 3 × 3 . The outputs from the two branches are fused via element-wise addition:
Z ¯ = Z 1 ¯ + Z 3 ¯
The fused features then pass through a Dropout layer and a 1 × 1 convolutional layer. Finally, they are upsampled to the original input image resolution to generate an auxiliary segmentation prediction, Y L S M . This auxiliary output guides the learning of intermediate features via an auxiliary loss function, encouraging the model to capture more discriminative local details without incurring any computational overhead during inference.
Y L S M = U p s a m p l e ( C o n v 1 ( D r o p o u t ( Z ¯ ) ) )

3.5. Loss Function

The total loss function of MV-UNet is composed of the main loss L p and auxiliary loss L a weighted by a factor α , where the weight factor is set to 0.4, which is the optimal setting with reference to UNetMamba [19]:
L = L P + α L a = ( L d i c e + L c e ) + α L c e
Among them, the main loss L p adopts a combination of Dice loss L d i c e and Cross Entropy loss L c e to balance category imbalance and pixel classification accuracy:
L d i c e = 1 2 N n = 1 N k = 1 K y ^ k ( n ) y k ( n ) y ^ k ( n ) + y k ( n )
L c e = 1 N n = 1 N k = 1 K y ^ k ( n ) log y k ( n )
N is the number of samples, K is the number of categories, y ^ k ( n ) is the one-hot encoding of the true label of sample n in category k, and y k ( n ) is the confidence that sample n belongs to category k; the auxiliary loss adopts cross-entropy loss to strengthen the local supervision effect of LSM.

4. Experimental Results and Analysis

4.1. Dataset

Model performance was evaluated on the public BUSI_WHU dataset [20]. Additionally, to establish a comparable performance benchmark on another independent dataset, MV-UNet was also fully evaluated on the BUSI dataset [21] following an identical experimental pipeline (independent data split, training, validation, and testing). The BUSI_WHU dataset, collected from Renmin Hospital of Wuhan University, comprises 927 breast ultrasound images, including 560 benign and 367 malignant cases. The BUSI dataset, acquired from Baheya Hospital in Cairo, Egypt, consists of 780 images: 210 benign, 437 malignant, and 133 normal cases.
In this study, normal cases in the BUSI dataset were treated as a sub-category of benign, specifically by setting their segmentation masks to all-background (i.e., all-zero matrices). For both datasets, while preserving the original proportion of benign and malignant cases, the data were partitioned into training, validation, and test sets in a 3:1:1 ratio using a random seed of 42. Consequently, the BUSI_WHU dataset was divided into 556 training, 185 validation, and 186 test images, while the BUSI dataset was divided into 468 training, 156 validation, and 156 test images.

4.2. Evaluation Metrics

A comprehensive set of multidimensional metrics is employed to evaluate segmentation performance, encompassing regional overlap, boundary accuracy, and classification consistency. Given the severe class imbalance between foreground (lesion) and background pixels in breast ultrasound image segmentation tasks, the OA can be misleading due to the dominance of background pixels. Therefore, we prioritize metrics that are more robust and discriminative under class imbalance: Regional overlap is primarily assessed by the mIoU, indicating the match between the segmented and ground truth regions; Boundary accuracy is measured by the ASSD, gauging the contour alignment; Classification consistency is revealed by Precision and Recall, which illustrate the model’s trade-off in identifying positive and negative samples. OA and the Kappa coefficient are also provided as supplementary references to ensure a comprehensive evaluation:
Precision: The proportion of true positive samples among all samples predicted as positive.
Recall: The proportion of true positive samples correctly predicted among all actual positive samples.
Mean Intersection over Union (mIoU): This metric globally aggregates the pixel-wise predictions and ground truth labels across all images in the test set. It calculates the IoU for both the foreground (lesion) and background classes and then takes the average. It serves as a core metric for evaluating regional overlap.
Average Symmetric Surface Distance (ASSD) [25]: The average of the shortest distances from points on the predicted boundary to the ground truth boundary and vice versa. It is used to assess boundary segmentation accuracy.
Overall Accuracy (OA): The proportion of correctly classified pixels among all pixels.
Kappa Coefficient: The degree of agreement between predictions and ground truth, excluding random agreement.
The formulas for these metrics are defined as follows:
P r e c i s i o n = T P T P + F P
R e c a l l = T P T P + F N
m I o U = 1 2 ( T P T P + F P + F N + T N T N + F P + F N )
A S S D = 1 G + P ( x 1 G d ( x 1 , P ) + x 2 P d ( x 2 , G ) )
O A = T P + T N T P + T N + F P + F N
K appa = O A P e 1 P e
where T P , T N , F P and F N denote True Positive, True Negative, False Positive, and False Negative; P e is the probability of random agreement; G is the set of ground truth boundary points, and P is the set of predicted boundary points. G and P denote the sizes of the ground truth and predicted boundary point sets, respectively. d ( x 1 , P ) is the shortest distance from point x 1 to set P and d ( x 2 , G ) is the shortest distance from point x 2 to set G .

4.3. Implementation Details

All input images are resized to 256 × 256 pixels. The selection of this specific size is aimed at balancing computational efficiency with the preservation of critical features. On one hand, using the original high-resolution images would result in an extremely long sequence when flattened, imposing a significant computational and memory burden on the Mamba or Transformer architectures, thereby affecting both training and inference efficiency. On the other hand, excessively compressing the images (e.g., to 128 × 128 or smaller) would lead to the loss of fine-grained details crucial for accurate segmentation, such as lesion boundary textures and micro-calcifications, ultimately degrading model performance. Thus, 256 × 256 is identified as a suitable compromise that maintains efficient long-sequence modeling while retaining sufficient spatial details.
To improve the model’s generalization capability and prevent overfitting, an online (on-the-fly) data augmentation strategy is employed during the training phase. Specifically, in each training iteration, we use the torchvision.transforms library to randomly apply one or more of the following transformations to each input image. The probability and key parameters for each transformation are listed in Table 1. Since the augmentations are applied stochastically and in real-time, a static, pre-computed augmented dataset with a fixed size is not generated. Instead, the model is exposed to continually varied and unique image transformations throughout the training process.
To ensure the rigor of the comparison, the training and model selection in this study follow a stratified strategy for evaluating the potential of heterogeneous architectures. For CNN- and Transformer-based baseline models (e.g., EMGANet), we strictly adhered to the optimal configurations reported in their original publications [20] to ensure reproducibility, thereby establishing a reliable performance benchmark. For the proposed MV-UNet and the referenced emerging Mamba-based architectures, we independently determined their optimal learning rates via grid search and employed validation mIoU for model selection to reveal their design potential fully. This strategy ensures that all models operate under their respective optimal conditions, enabling a fair comparison of their performance ceilings. The training configuration is shown in Table 2.
The experimental environment is shown in Table 3.

4.4. Qualitative Analysis

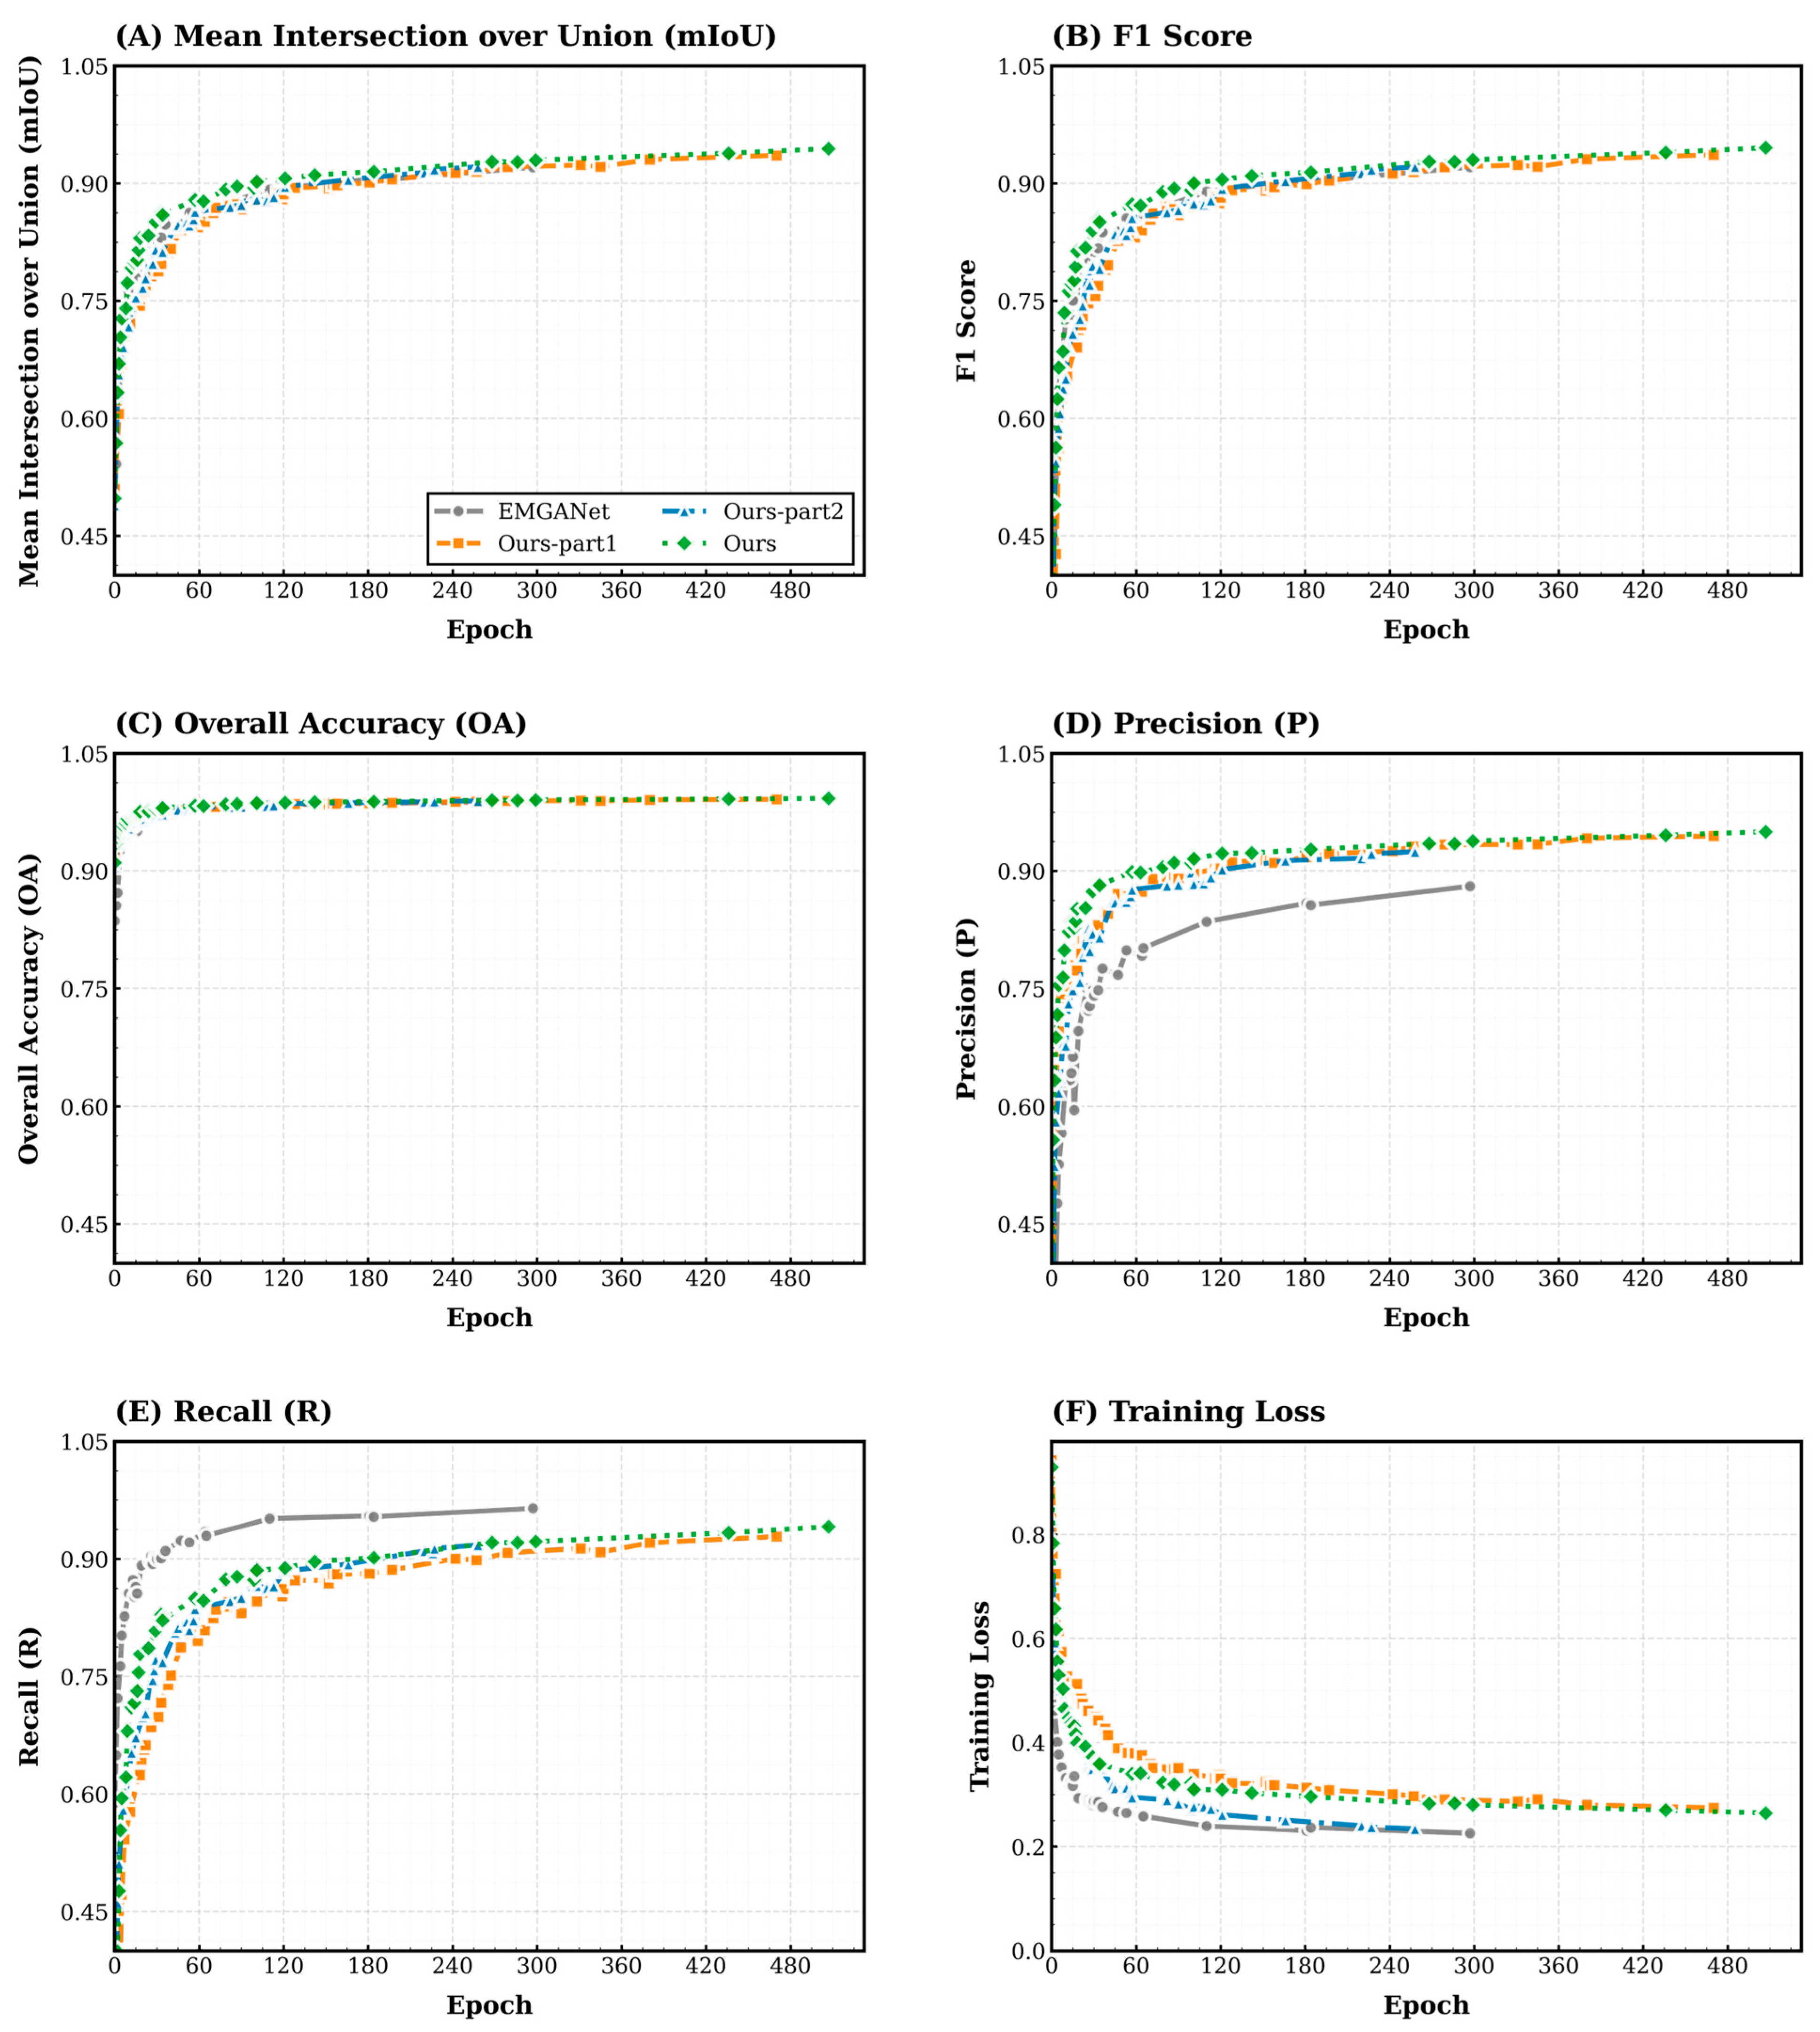
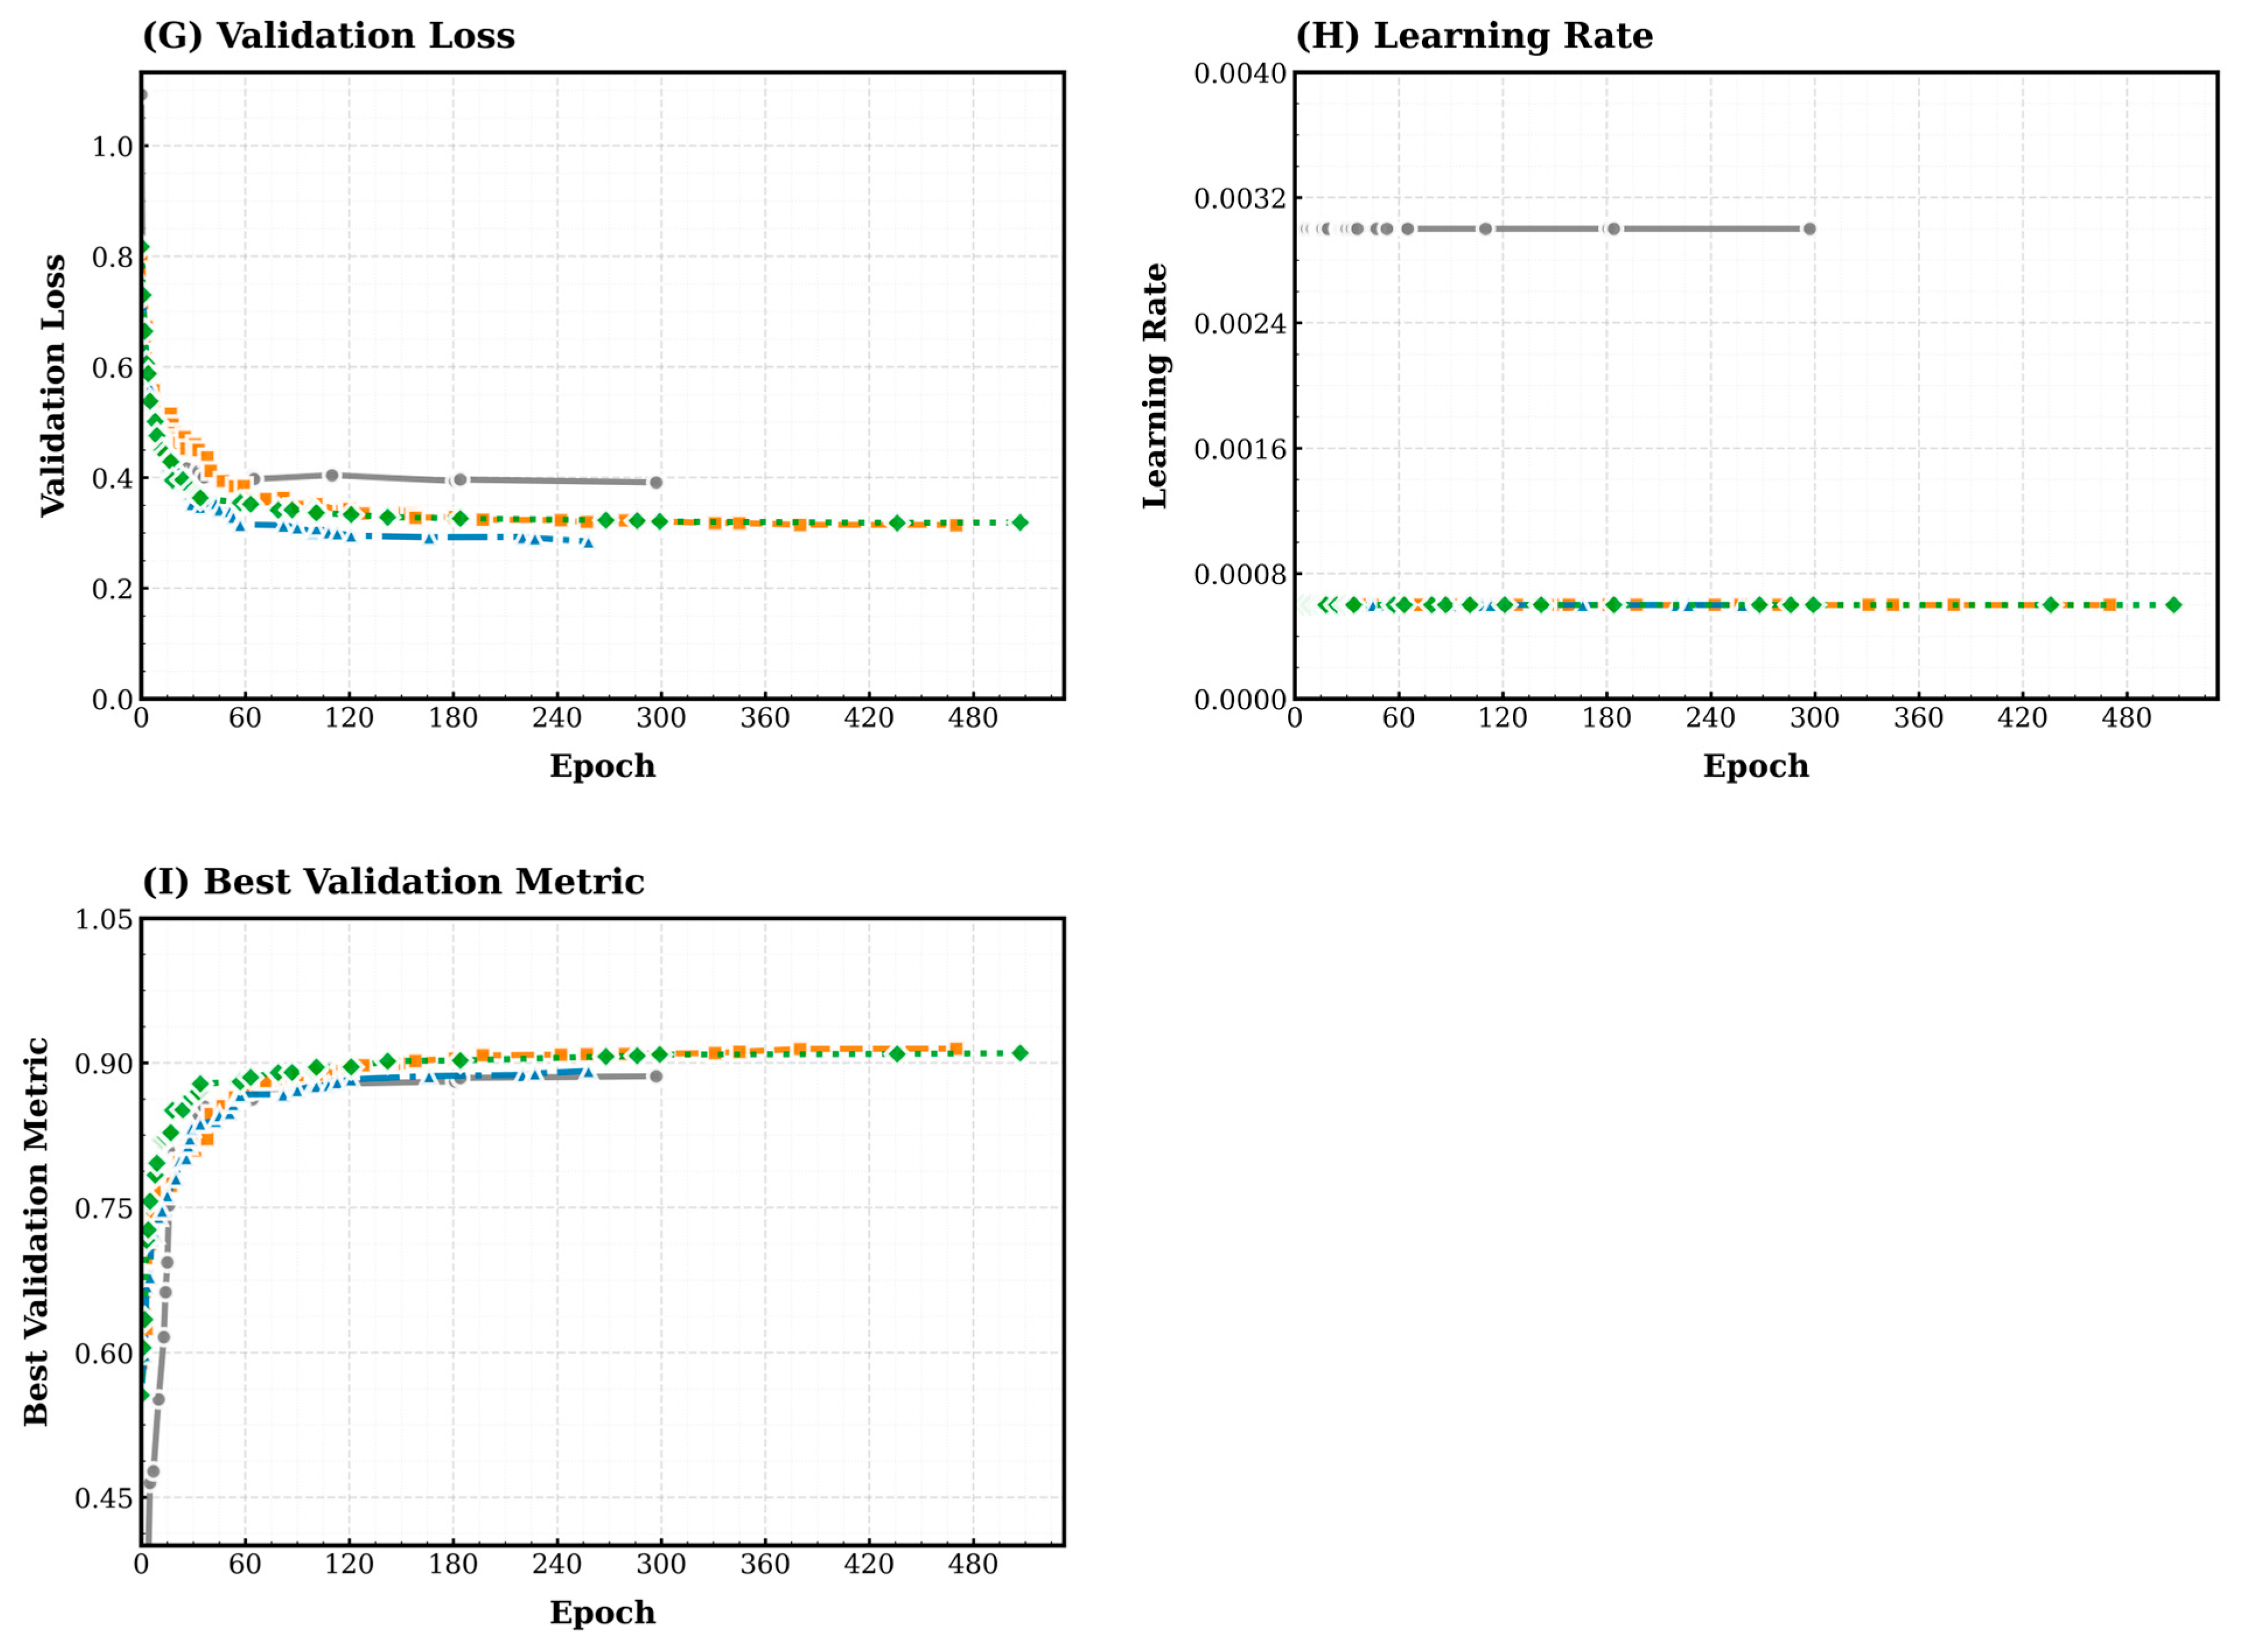
Figure 6 presents a comparison of the training processes between MV-UNet and EMGANet. The training curves (e.g., mIoU, F1-score, OA) for MV-UNet show a smoother upward trend with smaller fluctuations, indicating superior training stability. Although EMGANet, with its shallower architecture, converged slightly faster, MV-UNet surpassed it in performance during the later stages of training. The validation mIoU of MV-UNet reached a higher and more stable plateau, demonstrating its superior feature learning capability. The gradual and stable decline in both training and validation loss curves further confirms the absence of overfitting and validates the soundness of the training strategy.
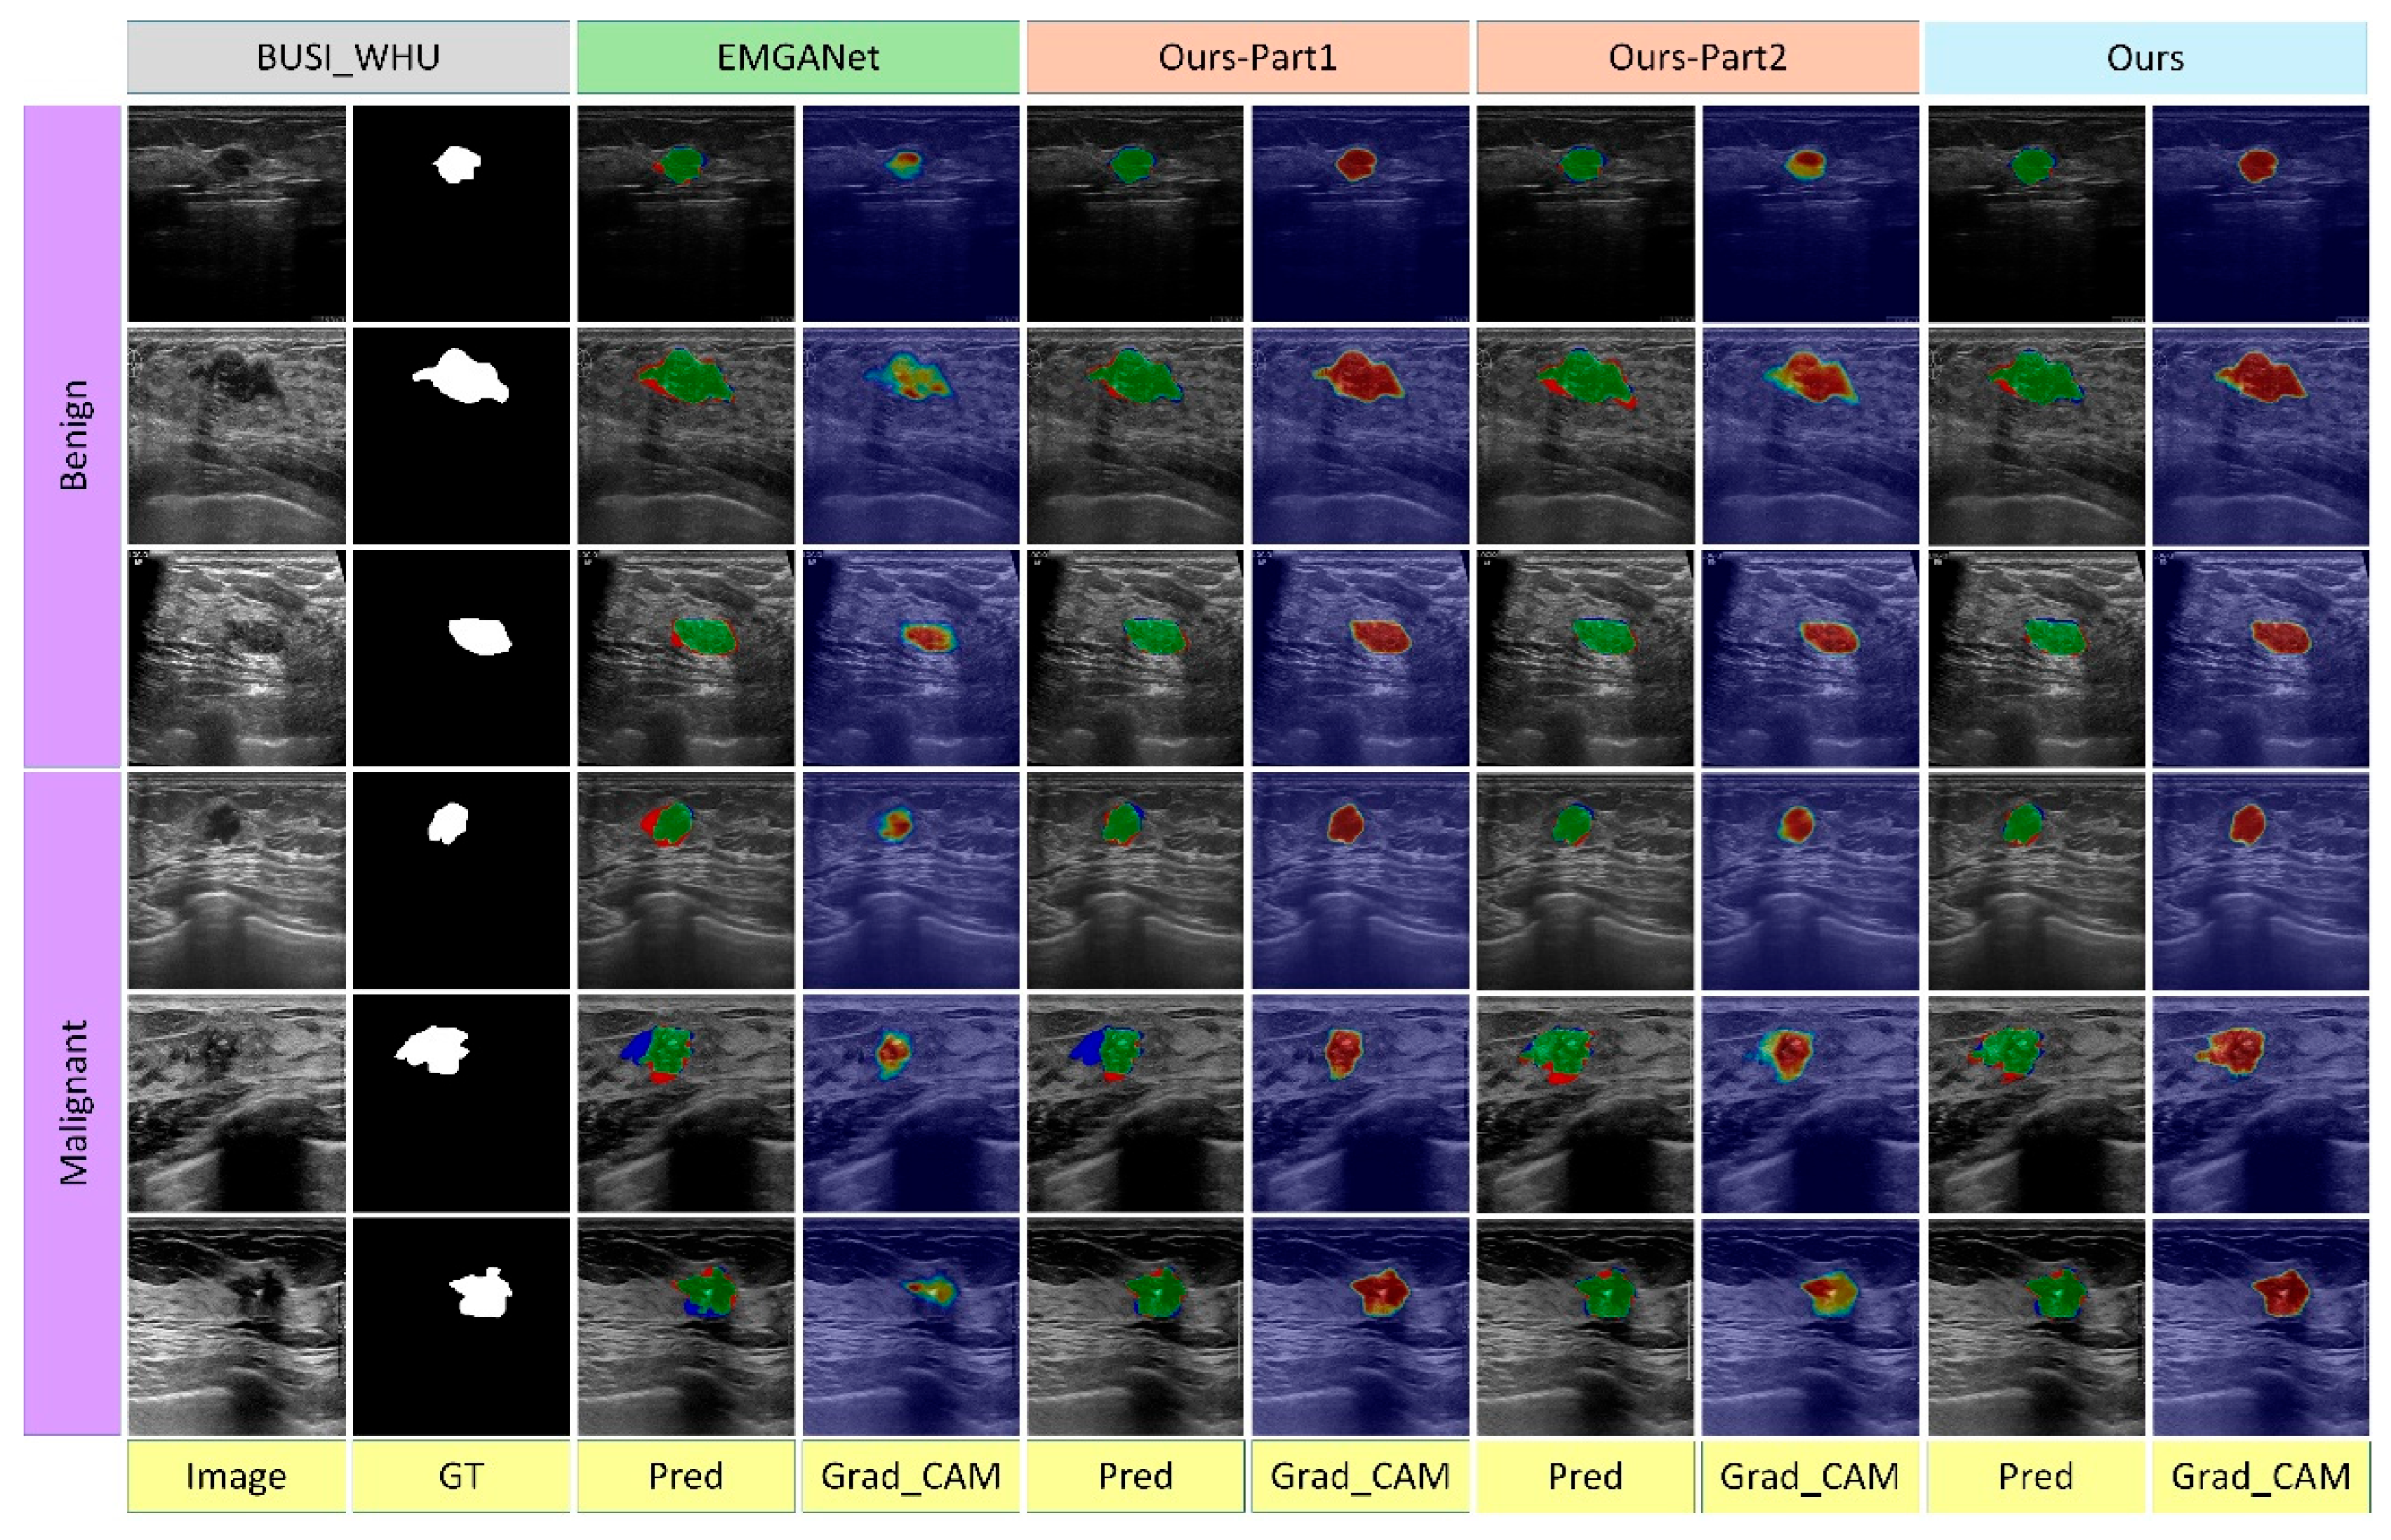
Figure 7 displays segmentation results and Grad-CAM attention heatmaps for several challenging cases. For cases with blurry boundaries, irregular shapes, and significant noise interference, MV-UNet’s predictions (green true positive areas) align more closely with the ground truth (GT) compared to EMGANet, exhibiting significantly fewer false positive (red) and false negative (blue) regions:
Boundary Handling: MV-UNet produces smoother and more continuous lesion boundaries, reducing the jagged protrusions often seen in EMGANet’s results.
Noise Robustness: For images of poor quality with extremely blurry boundaries, MV-UNet effectively avoids false positives in surrounding tissues.
Complex Shape Segmentation: For infiltrating malignant tumors, MV-UNet accurately captures the main structure and fine protrusions, resulting in fewer missed regions.
Grad-CAM heatmaps are a post hoc visual explanatory tool. They generate saliency maps by computing the gradient of the output with respect to the feature maps of a specific network layer (here, the final upsampling layer), visualizing the image regions the model decision relies on. This can be regarded as an indirect indication of the model’s spatial focusing tendency, but it is not a precise measurement of its internal attention mechanism. In this study, the generated Grad-CAM heatmaps (where a color gradient from dark blue to red indicates increasing gradient response intensity) show that MV-UNet’s high gradient response regions form a larger and more concentrated area of high activation within the lesion. In contrast, the response pattern of EMGANet appears more dispersed. This difference in gradient response patterns may be associated with the distinct architectural designs of the models. The SE-Mixer module in MV-UNet helps capture global semantic features through efficient long-range dependency modeling, while the training-phase local supervision from the LSM may guide the model to focus on boundary details. This observed concentration of gradient response in the lesion region is consistent with the model’s superior boundary accuracy, suggesting that the model’s focus aligns with diagnostically relevant areas.

4.5. Quantitative Analysis

Quantitative comparison results between MV-UNet and 12 state-of-the-art segmentation models on the BUSI_WHU test set are presented in Table 4. Given the severe class imbalance in breast lesion segmentation, region-based overlap (mIoU) and boundary accuracy (ASSD) are prioritized as the core evaluation metrics. Under these metrics, MV-UNet demonstrates competitive or superior performance, achieving an mIoU of 90.51%, an ASSD of 4.59 pixels, and an OA of 98.87%. Compared to the current strongest baseline model, EMGANet (which has an mIoU of 90.32% and an ASSD of 6.10 pixels), MV-UNet attains a comparable mIoU and achieves significantly better boundary accuracy (a lower ASSD). This suggests that MV-UNet may possess an enhanced capability for segmenting blurry lesions, particularly in boundary delineation. It should be noted that EMGANet achieves a slightly higher Recall (91.95%), while MV-UNet’s Recall is 90.85%. EMGANet exhibits higher Recall but is accompanied by lower Precision (88.57%) and a higher ASSD, which may indicate that its Group-Mix Attention mechanism tends to produce more inclusive regional predictions. In contrast, assisted by its LSM, MV-UNet achieves a more balanced trade-off between Precision (90.10%) and Recall, contributing to its overall more robust segmentation performance.
To quantify the performance difference in mIoU between MV-UNet and EMGANet, a paired Wilcoxon signed-rank test was performed in the test set (sample size n = 186). The pairing unit for this test was a single image, i.e., comparing the mIoU values obtained by the two models on the same image; the reported mIoU metric is the average of the results from all images. The results show that the difference in mIoU between the two models did not reach the conventional threshold for statistical significance (test statistic W = 7867.0000, p = 0.2598), but a medium effect size was observed (r = 0.392). No correction for multiple comparisons was used, as this was the primary planned comparison for the core metric.
A comprehensive analysis indicates that MV-UNet achieves an excellent balance between segmentation accuracy and model efficiency. In terms of the core regional metric (mIoU), its performance (90.51%) is on par with the current strongest baseline, EMGANet (90.32%) (p = 0.2598, r = 0.392). Simultaneously, in terms of boundary accuracy (ASSD), MV-UNet (4.59 pixels) significantly outperforms EMGANet (6.10 pixels). More importantly, while achieving the aforementioned accuracy, MV-UNet realizes an order-of-magnitude optimization in model complexity and inference speed (parameter count is only 14.7%, and inference speed is increased by 3.2 times). Therefore, MV-UNet achieves a superior balance between accuracy and efficiency.
To further evaluate the sensitivity of the model’s performance to the randomness of data partitioning, we conducted five independent repeated experiments using five distinct random seeds (42, 43, 44, 45, and 46) while maintaining the same data split ratio (train: validation: test = 3:1:1). The mean and standard deviation of the core metrics from these five runs are reported within parentheses in Table 3 (e.g., mIoU is 90.57% ± 0.67%). The standard deviations for all key metrics remain at a low level across different data splits. This indicates that MV-UNet’s performance is stable across different data subsets, preliminarily reflecting a certain degree of robustness in the model.
The comprehensive comparison of model efficiency is shown in Table 5. Compared to the current best-performing but extremely large model EMGANet, MV-UNet, which employs a deep Mamba integration design, achieves a substantial advantage in model lightweighting. Although its performance on some core segmentation metrics is very close to EMGANet (e.g., mIoU: 90.51% compared to 90.32%), MV-UNet’s total number of parameters (48.73 M) and model size (185.90 MB) are only 14.7% of EMGANet’s, while its inference speed (32.10 FPS) is increased by 3.2 times, and GPU memory usage is reduced by approximately 72.5%. This demonstrates that MV-UNet achieves an order-of-magnitude improvement in efficiency with minimal loss of accuracy.
Compared to the lightweight model UNetMamba, which is specifically designed for efficiency, MV-UNet presents a different design trade-off. UNetMamba demonstrates superior performance in several efficiency metrics, such as model size (98.38 MB vs. 185.90 MB), total parameter count (25.79 M vs. 48.73 M), inference speed (FPS 49.96 vs. 32.1), and computational cost (GFLOPs 8.73 vs. 30.16). However, MV-UNet holds a slight advantage in CPU memory usage (295.97 MB vs. 373.21 MB) and GPU memory consumption (765.42 MB vs. 941.29 MB). More importantly, as shown in Table 4, MV-UNet achieves improvements across multiple core segmentation metrics on the BUSI_WHU dataset: mIoU (90.51% vs. 90.16%), Recall (90.85% vs. 90.14%), Precision (90.10% vs. 89.46%), the auxiliary metric Kappa (89.19% vs. 88.62%), and OA (98.87% vs. 98.77%) all show a certain degree of enhancement, while boundary accuracy (ASSD) remains on par with UNetMamba (4.59 pixels). These results indicate that, through the synergistic design of deep Mamba integration and the LSM, MV-UNet allocates more computational resources towards improving segmentation accuracy. Consequently, by making acceptable compromises in absolute efficiency metrics, the model achieves widespread improvements in segmentation performance, attaining an excellent balance between segmentation accuracy and model efficiency.
Compared to another lightweight hybrid architecture, Swin-UMamba, MV-UNet exhibits distinct characteristics in the trade-off between accuracy and efficiency. In terms of efficiency, MV-UNet has lower total parameters, model size, and computational cost (30.16 GFLOPs) compared to Swin-UMamba (87.87 GFLOPs), while achieving similar inference speeds (32.10 FPS vs. 32.23 FPS). Regarding accuracy, on the BUSI_WHU dataset, MV-UNet achieves higher values on several core segmentation metrics, such as mIoU (90.51% vs. 90.25%) and ASSD (4.59 pixels vs. 4.91 pixels). Overall, the design of MV-UNet not only demonstrates superior performance on key accuracy metrics but also maintains more favorable computational efficiency.
The performance results from independent training and testing on the BUSI dataset are shown in Table 6. MV-UNet leads in boundary accuracy (ASSD: 14.94 pixels) and OA (96.63%), demonstrating a certain level of generalization capability. However, its mIoU (76.23%) is slightly lower than that of EMGANet (81.37%). Considering the known issues of annotation inconsistency in this dataset [30,31], this reveals an inherent limitation of the proposed model’s core mechanism: the LSM employed by MV-UNet applies strong local supervision to features via an auxiliary loss. This makes its performance highly dependent on pixel-level annotation consistency. When faced with conflicting labels, the sensitive gradient signals can interfere with feature learning, thereby affecting mIoU. In contrast, modules like the MGM Blocks in EMGANet perform adaptive global aggregation based on feature similarity, making their decisions more reliant on the image context itself, thus possessing stronger robustness to local annotation noise. This indicates that the paradigm of deep Mamba integration, combined with local deep supervision, while pursuing high accuracy and efficiency, imposes higher requirements on the quality of training data.
This chapter employs systematic ablation studies to validate the contribution of each deeply integrated core component within MV-UNet. The core of this work lies in the realization of end-to-end deep integration of the improved MambaVision encoder, the MSD, and the LSM. Since the improved MambaVision encoder can output feature maps at five different scales (including the Stem layer and the subsequent four stages), the MSD was correspondingly expanded to five layers to achieve sufficient multi-scale information fusion. Considering that the effectiveness of key sub-modules within MambaVision (such as MHSA in the MambaVision Mixer) has been validated in the original literature [18], and the independent role of the LSM has been discussed in UNetMamba [19], this study does not repeat the isolation experiments for these already-validated sub-modules. Instead, it focuses on evaluating the synergistic effects among components within this novel hybrid paradigm. For this purpose, we designed the following progressive comparative experiments (key results are shown in Table 5 and Table 7):
Ours-part1 (U-Net encoder + MSD + LSM): To validate the gain from decoder depth extension, we constructed both four-layer (Ours-part1_4) and five-layer (Ours-part1_5) versions. The results show that expanding from four to five layers improved the model’s performance in metrics such as Kappa (increased by 0.46%), Recall (increased by 0.49%), and mIoU (increased by 0.26%), although Precision and ASSD slightly decreased by 0.62% and 0.13 pixels, respectively. This verifies that the five-layer decoder enhances model performance through more sufficient multi-scale feature fusion. Ultimately, compared to the baseline U-Net, Ours-part1_5 improved mIoU from 89.39% to 90.20% and optimized ASSD from 5.69 pixels to 5.12 pixels, indicating that introducing MSD and LSM contributes to enhanced feature reconstruction and boundary learning.
Ours-part2 (improved MambaVision encoder + U-Net decoder): Its performance (mIoU 88.45%), while better than the U-Net baseline, is lower than that of Ours-part1, suggesting that the MambaVision encoder requires synergistic design with a dedicated decoder (MSD).
Ours-part3 (improved MambaVision encoder + MSD (without LSM)): This is the complete model with the LSM removed. Compared to the full model MV-UNet, its mIoU decreased from 90.51% to 89.37%, and ASSD increased from 4.59 pixels to 5.49 pixels, indicating the important role of the LSM in achieving optimal boundary accuracy within the integrated framework.
Ours-part4 (Complete model, but with SE-Mixer reverted to the original MambaVision Mixer): Its accuracy (mIoU 90.46%) is largely comparable to the full model, but efficiency metrics (e.g., GFLOPs, parameter count) show a slight increase, suggesting that the workflow optimization of the Mixer (SE-Mixer) provides minor improvements in storage and computational efficiency while maintaining accuracy.
To more rigorously assess whether performance improvements primarily stem from parameter count increase, we constructed a comparison group with comparable parameter counts by adjusting the number of feature channels (Table 5). The enhanced variant 1 (Ours-part1_5_dim, 49.47 M) and variants with different degrees of Mamba integration (Ours-part2: 42.70 M, Ours-part3: 45.25 M, Ours-part4: 49.32 M, MV-UNet: 48.73 M) have small differences in parameter count. Furthermore, the variant Ours-part5 (37.42 M), constructed by reducing the number of channels, has a parameter count highly comparable to the base version Ours-part1_5 (37.11 M), but its computational cost (GFLOPs 23.12) is significantly lower than that of Ours-part1_5 (GFLOPs 30.00), a reduction of approximately 6.88 GFLOPs. Under comparable parameter budgets, the full model MV-UNet (48.73 M, 30.16 GFLOPs) performs better in multiple accuracy metrics than Ours-part1_5_dim (49.47 M, 42.70 GFLOPs), which has a higher computational cost, while the accuracy of partially integrated variants (Ours-part2, Ours-part3) is relatively lower. These results indicate that the observed performance of MV-UNet and its variants is closely related to its adopted deep integration architecture design (such as five-layer encoder–decoder alignment, Mamba component synergy), rather than being primarily due to parameter expansion. This series of designs provides the possibility for the model to achieve a better accuracy-efficiency trade-off under comparable or even fewer computational resources.

5. Conclusions and Limitations

This paper proposes MV-UNet, an efficient semantic segmentation model designed for breast cancer ultrasound images. The model employs an improved MambaVision as the encoder, coupled with the Mamba-based MSD and a dedicated training-phase LSM, achieving efficient integration of global context and local details. Experimental results on the two publicly available breast ultrasound datasets, BUSI_WHU and BUSI, demonstrate that MV-UNet achieves the optimal segmentation performance on the BUSI_WHU dataset, with metrics such as mIoU reaching 90.51% and ASSD as low as 4.59 pixels. Concurrently, the model’s parameter count is only 14.7% of the EMGANet, achieving a good balance between segmentation accuracy and inference efficiency.
However, this study has several limitations.
First, regarding datasets and clinical validation. The conclusions of this study are primarily drawn from retrospective, publicly available datasets of limited scale. A comprehensive assessment of the technical effectiveness of MV-UNet requires several pending validations, including, but not limited to, evaluating the integration of its outputs into clinical workflows and its value in assisting clinician interpretations (including analyses of inter-observer variability).
Second, regarding the validation of model robustness. Although experiments with five independent random seeds on the BUSI_WHU dataset provide preliminary evidence for the stability of the model’s performance, more rigorous validation strategies (e.g., K-fold cross-validation) have not been conducted. Therefore, conclusions regarding its robustness require further confirmation under broader conditions.
Third, regarding the depth of the ablation studies. While this study has verified the necessity of core components such as the improved MambaVision encoder, MSD, LSM, and SE-Mixer, the validation of more fine-grained interactions between sub-modules within the encoder and the analysis of the impact of controlled variable model variants with comparable parameter budgets remain insufficient.
Fourth, regarding model generalizability and data dependency. It should be noted that on the independent BUSI dataset, although MV-UNet’s ASSD metric is superior, its mIoU, Precision, and Recall are all lower than those of EMGANet. This suggests that under domain shift, the model may produce prediction masks with higher boundary consistency but slightly less complete regional filling. Concurrently, potential differences in annotation standards and consistency between different datasets may also affect the model’s performance in cross-dataset evaluations.
Fifth, regarding the experimental design. This study is potentially subject to patient-level data leakage. To ensure comparability with the baseline study (EMGANet), we followed the practice in its original publication [20] and performed a random split at the image level, rather than a patient-wise split, on the BUSI_WHU and BUSI datasets. This means that different images from the same patient could have been allocated to both the training and test sets, which may lead to an over-optimistic evaluation of the model’s performance.
Therefore, future research will focus on the following directions: First, conducting prospective, multi-center validation to systematically evaluate the model’s performance, generalization boundaries, and failure modes in real-world settings. A patient-wise split strategy will be employed to address the inherent limitation of the image-level split used in this study (which was adopted to align with the baseline method), enabling a more rigorous evaluation and establishing stronger clinical credibility. Second, designing more comprehensive ablation studies and robustness validation schemes. Third, building upon the existing lightweight design, further investigate advanced compression and acceleration techniques (e.g., quantization, knowledge distillation), aiming to lay the groundwork for highly efficient inference in potentially resource-constrained scenarios and to explore its potential applicability.

Author Contributions

Conceptualization, J.L. (Jiayi Lin); Methodology, J.L. (Jiayi Lin); Validation, C.C., X.W. and J.L. (Jiayi Lin); Formal Analysis, L.L.; Investigation, J.L. (Jinze Liu) and B.Y.; Resources, J.L. (Jinze Liu); Data Curation, C.C.; Writing—Original Draft Preparation, J.L. (Jiayi Lin); Writing—Review & Editing, L.L. and J.L. (Jinze Liu); Visualization, J.L. (Jiayi Lin) and B.Y.; Supervision, J.Z.; Project Administration, J.Z.; Funding Acquisition, J.Z. All authors have read and agreed to the published version of the manuscript.

Funding

This research was funded by the Guangxi University Innovation and Entrepreneurship Training Program (grant number S202510593280) and supported by the Guangxi Science and Technology Base and Talent Special Project (grant number AD25069071)

Institutional Review Board Statement

Not applicable.

Informed Consent Statement

Not applicable.

Data Availability Statement

Publicly available datasets were analyzed in this study. The data of BUSI_WHU can be found here: https://data.mendeley.com/datasets/k6cpmwybk3/3 (accessed on 21 January 2026). And the data of BUSI can be found here: https://www.sciencedirect.com/science/article/pii/S2352340919312181 (accessed on 21 January 2026). The code for our model will be made available upon publication.

Conflicts of Interest

The authors declare no conflicts of interest.

Abbreviations

The following abbreviations are used in this manuscript:
CNNConvolutional Neural Network
mIoUmean Intersection over Union
MSDMamba segmentation decoder
LSMLocal Supervision Module
VSSVisual State Space
SESSE-MambaVision Stage
SE-MixerSingle Expansion Mamba Mixer
ASSDAverage Symmetric Surface Distance
MLPMultilayer Perceptron
MHSAMulti-Head Self-Attention
S6Selective Scan State Space Model

References

  1. Liu, M.; Hu, L.; Tang, Y.; Wang, C.; He, Y.; Zeng, C. A deep learning method for breast cancer classification in the pathology images. IEEE J. Biomed. Health Inform. 2022, 26, 5025–5032. [Google Scholar] [CrossRef]
  2. Xue, C.; Zhu, L.; Fu, H.; Hu, X.; Li, X.; Zhang, H.; Heng, P. Global guidance network for breast lesion segmentation in ultrasound images. Med. Image Anal. 2021, 70, 101989. [Google Scholar] [CrossRef] [PubMed]
  3. Huang, R.; Lin, M.; Dou, H.; Lin, Z.; Ying, Q.; Jia, X.; Xu, W.; Mei, Z.; Yang, X.; Dong, Y.; et al. Boundary-rendering network for breast lesion segmentation in ultrasound images. Med. Image Anal. 2022, 80, 102478. [Google Scholar] [CrossRef]
  4. He, Q.; Yang, Q.; Xie, M. HCTNet: A hybrid CNN-transformer network for breast ultrasound image segmentation. Comput. Biol. Med. 2023, 155, 106629. [Google Scholar] [CrossRef]
  5. Sun, S.; Fu, C.; Xu, S.; Wen, Y.; Ma, T. GLFNet: Global-local fusion network for the segmentation in ultrasound images. Comput. Biol. Med. 2024, 171, 108103. [Google Scholar] [CrossRef] [PubMed]
  6. Chen, G.; Li, L.; Dai, Y.; Zhang, J.; Yap, M.H. AAU-net: An adaptive attention U-net for breast lesions segmentation in ultrasound images. IEEE Trans. Med. Imaging 2022, 42, 1289–1300. [Google Scholar] [CrossRef]
  7. Iqbal, A.; Sharif, M. MDA-Net: Multiscale dual attention-based network for breast lesion segmentation using ultrasound images. J. King Saud Univ.-Comput. Inf. Sci. 2022, 34, 7283–7299. [Google Scholar] [CrossRef]
  8. Ruan, J.; Xie, M.; Gao, J.; Liu, T.; Fu, Y. Ege-unet: An efficient group enhanced unet for skin lesion segmentation. In Proceedings of the International Conference on Medical Image Computing and Computer-Assisted Intervention; Springer Nature: Cham, Switzerland, 2023; pp. 481–490. [Google Scholar]
  9. Chen, J.; Mei, J.; Li, X.; Lu, Y.; Yu, Q.; Wei, Q.; Luo, X.; Xie, Y.; Adeli, E.; Wang, Y.; et al. TransUNet: Rethinking the U-Net architecture design for medical image segmentation through the lens of transformers. Med. Image Anal. 2024, 97, 103280. [Google Scholar] [CrossRef]
  10. Qu, X.; Zhou, J.; Jiang, J.; Wang, W.; Wang, H.; Wang, S.; Tang, W.; Lin, X. EH-former: Regional easy-hard-aware transformer for breast lesion segmentation in ultrasound images. Inf. Fusion 2024, 109, 102430. [Google Scholar] [CrossRef]
  11. Gu, A.; Dao, T. Mamba: Linear-time sequence modeling with selective state spaces. arXiv 2023, arXiv:2312.00752. [Google Scholar]
  12. Ma, J.; Li, F.; Wang, B. U-mamba: Enhancing long-range dependency for biomedical image segmentation. arXiv 2024, arXiv:2401.04722. [Google Scholar]
  13. Ruan, J.; Li, J.; Xiang, S. Vm-unet: Vision mamba unet for medical image segmentation. ACM Trans. Multimed. Comput. Commun. Appl. 2024. [Google Scholar] [CrossRef]
  14. Wang, Z.; Zheng, J.Q.; Zhang, Y.; Cui, G.; Li, L. Mamba-unet: Unet-like pure visual mamba for medical image segmentation. arXiv 2024, arXiv:2402.05079. [Google Scholar]
  15. Xing, Z.; Ye, T.; Yang, Y.; Liu, G.; Zhu, L. Segmamba: Long-range sequential modeling mamba for 3d medical image segmentation. arXiv 2024, arXiv:2401.13560. [Google Scholar]
  16. Xie, B.; Yan, Y.; Agam, G. MM-UNet: Meta Mamba UNet for Medical Image Segmentation. arXiv 2025, arXiv:2503.17540. [Google Scholar] [CrossRef]
  17. Chen, Y.; Liu, Z.; He, X. MambaVesselNet: A hybrid CNN-Mamba architecture for 3D cerebrovascular segmentation. In Proceedings of the 6th ACM International Conference on Multimedia in Asia; Association for Computing Machinery: New York, NY, USA, 2024; pp. 1–7. [Google Scholar]
  18. Hatamizadeh, A.; Kautz, J. Mambavision: A hybrid mamba-transformer vision backbone. In Proceedings of the Computer Vision and Pattern Recognition Conference, Nashville, TN, USA, 10–17 June 2025; pp. 25261–25270. [Google Scholar]
  19. Zhu, E.; Chen, Z.; Wang, D.; Shi, H.; Liu, X.; Wang, L. Unetmamba: An efficient unet-like mamba for semantic segmentation of high-resolution remote sensing images. IEEE Geosci. Remote Sens. Lett. 2024, 22, 6001205. [Google Scholar] [CrossRef]
  20. Huang, J.; Mao, Y.; Deng, J.; Ye, Z.; Zhang, Y.; Zhang, J. Emganet: Edge-aware multi-scale group-mix attention network for breast cancer ultrasound image segmentation. IEEE J. Biomed. Health Inform. 2025, 29, 5631–5641. [Google Scholar] [CrossRef] [PubMed]
  21. Al-Dhabyani, W.; Gomaa, M.; Khaled, H.; Fahmy, A. Dataset of breast ultrasound images. Data Brief 2020, 28, 104863. [Google Scholar] [CrossRef] [PubMed]
  22. Liu, Y.; Tian, Y.; Zhao, Y.; Yu, H.; Xie, L.; Wang, Y.; Ye, Q.; Jiao, J.; Liu, Y. Vmamba: Visual state space model. Adv. Neural Inf. Process. Syst. 2024, 37, 103031–103063. [Google Scholar]
  23. Liu, J.; Yang, H.; Zhou, H.Y.; Xi, Y.; Yu, L.; Li, C.; Liang, Y.; Shi, G.; Yu, Y.; Zhang, H.; et al. Swin-umamba: Mamba-based unet with imagenet-based pretraining. In International Conference on Medical Image Computing and Computer-Assisted Intervention; Springer Nature: Cham, Switzerland, 2024; pp. 615–625. [Google Scholar]
  24. Wang, X.; Zhang, T.; Shao, Y.; Zhang, Y. Crop Disease Detection Based on Unetmamba with Hierarchical Feature Fusion. In Proceedings of the 2025 IEEE 8th International Conference on Signal Processing and Machine Learning (SPML); IEEE: Piscataway, NJ, USA, 2025; pp. 124–129. [Google Scholar]
  25. Pang, H.; Wu, Y.; Qi, S.; Li, C.; Shen, J.; Yue, Y.; Qian, W.; Wu, J. A fully automatic segmentation pipeline of pulmonary lobes before and after lobectomy from computed tomography images. Comput. Biol. Med. 2022, 147, 105792. [Google Scholar] [CrossRef] [PubMed]
  26. Badrinarayanan, V.; Kendall, A.; Cipolla, R. Segnet: A deep convolutional encoder-decoder architecture for image segmentation. IEEE Trans. Pattern Anal. Mach. Intell. 2017, 39, 2481–2495. [Google Scholar] [CrossRef]
  27. Doc, Y.Z.; Doc, S.W. DualA-Net: A generalizable and adaptive network with dual-branch encoder for medical image segmentation. Comput. Methods Programs Biomed. 2024, 243, 107877. [Google Scholar]
  28. Tang, F.; Ding, J.; Wang, L.; Xian, M.; Ning, C. Multi-level global context cross consistency model for semi-supervised ultrasound image segmentation with diffusion model. arXiv 2023, arXiv:2305.09447. [Google Scholar]
  29. Li, Z.; Zheng, Y.; Shan, D.; Yang, S.; Li, Q.; Wang, B. Scribformer: Transformer makes cnn work better for scribble-based medical image segmentation. IEEE Trans. Med. Imaging 2024, 43, 2254–2265. [Google Scholar] [CrossRef]
  30. Carrilero-Mardones, M.; Parras-Jurado, M.; Nogales, A.; Perez-Martin, J.; Diez, F.J. Deep learning for describing breast ultrasound images with BI-RADS terms. J. Imaging Inform. Med. 2024, 37, 2940–2954. [Google Scholar] [CrossRef] [PubMed]
  31. Cao, Z.; Yang, G.; Chen, Q.; Chen, X.; Lv, F. Breast tumor classification through learning from noisy labeled ultrasound images. Med. Phys. 2020, 47, 1048–1057. [Google Scholar] [CrossRef] [PubMed]
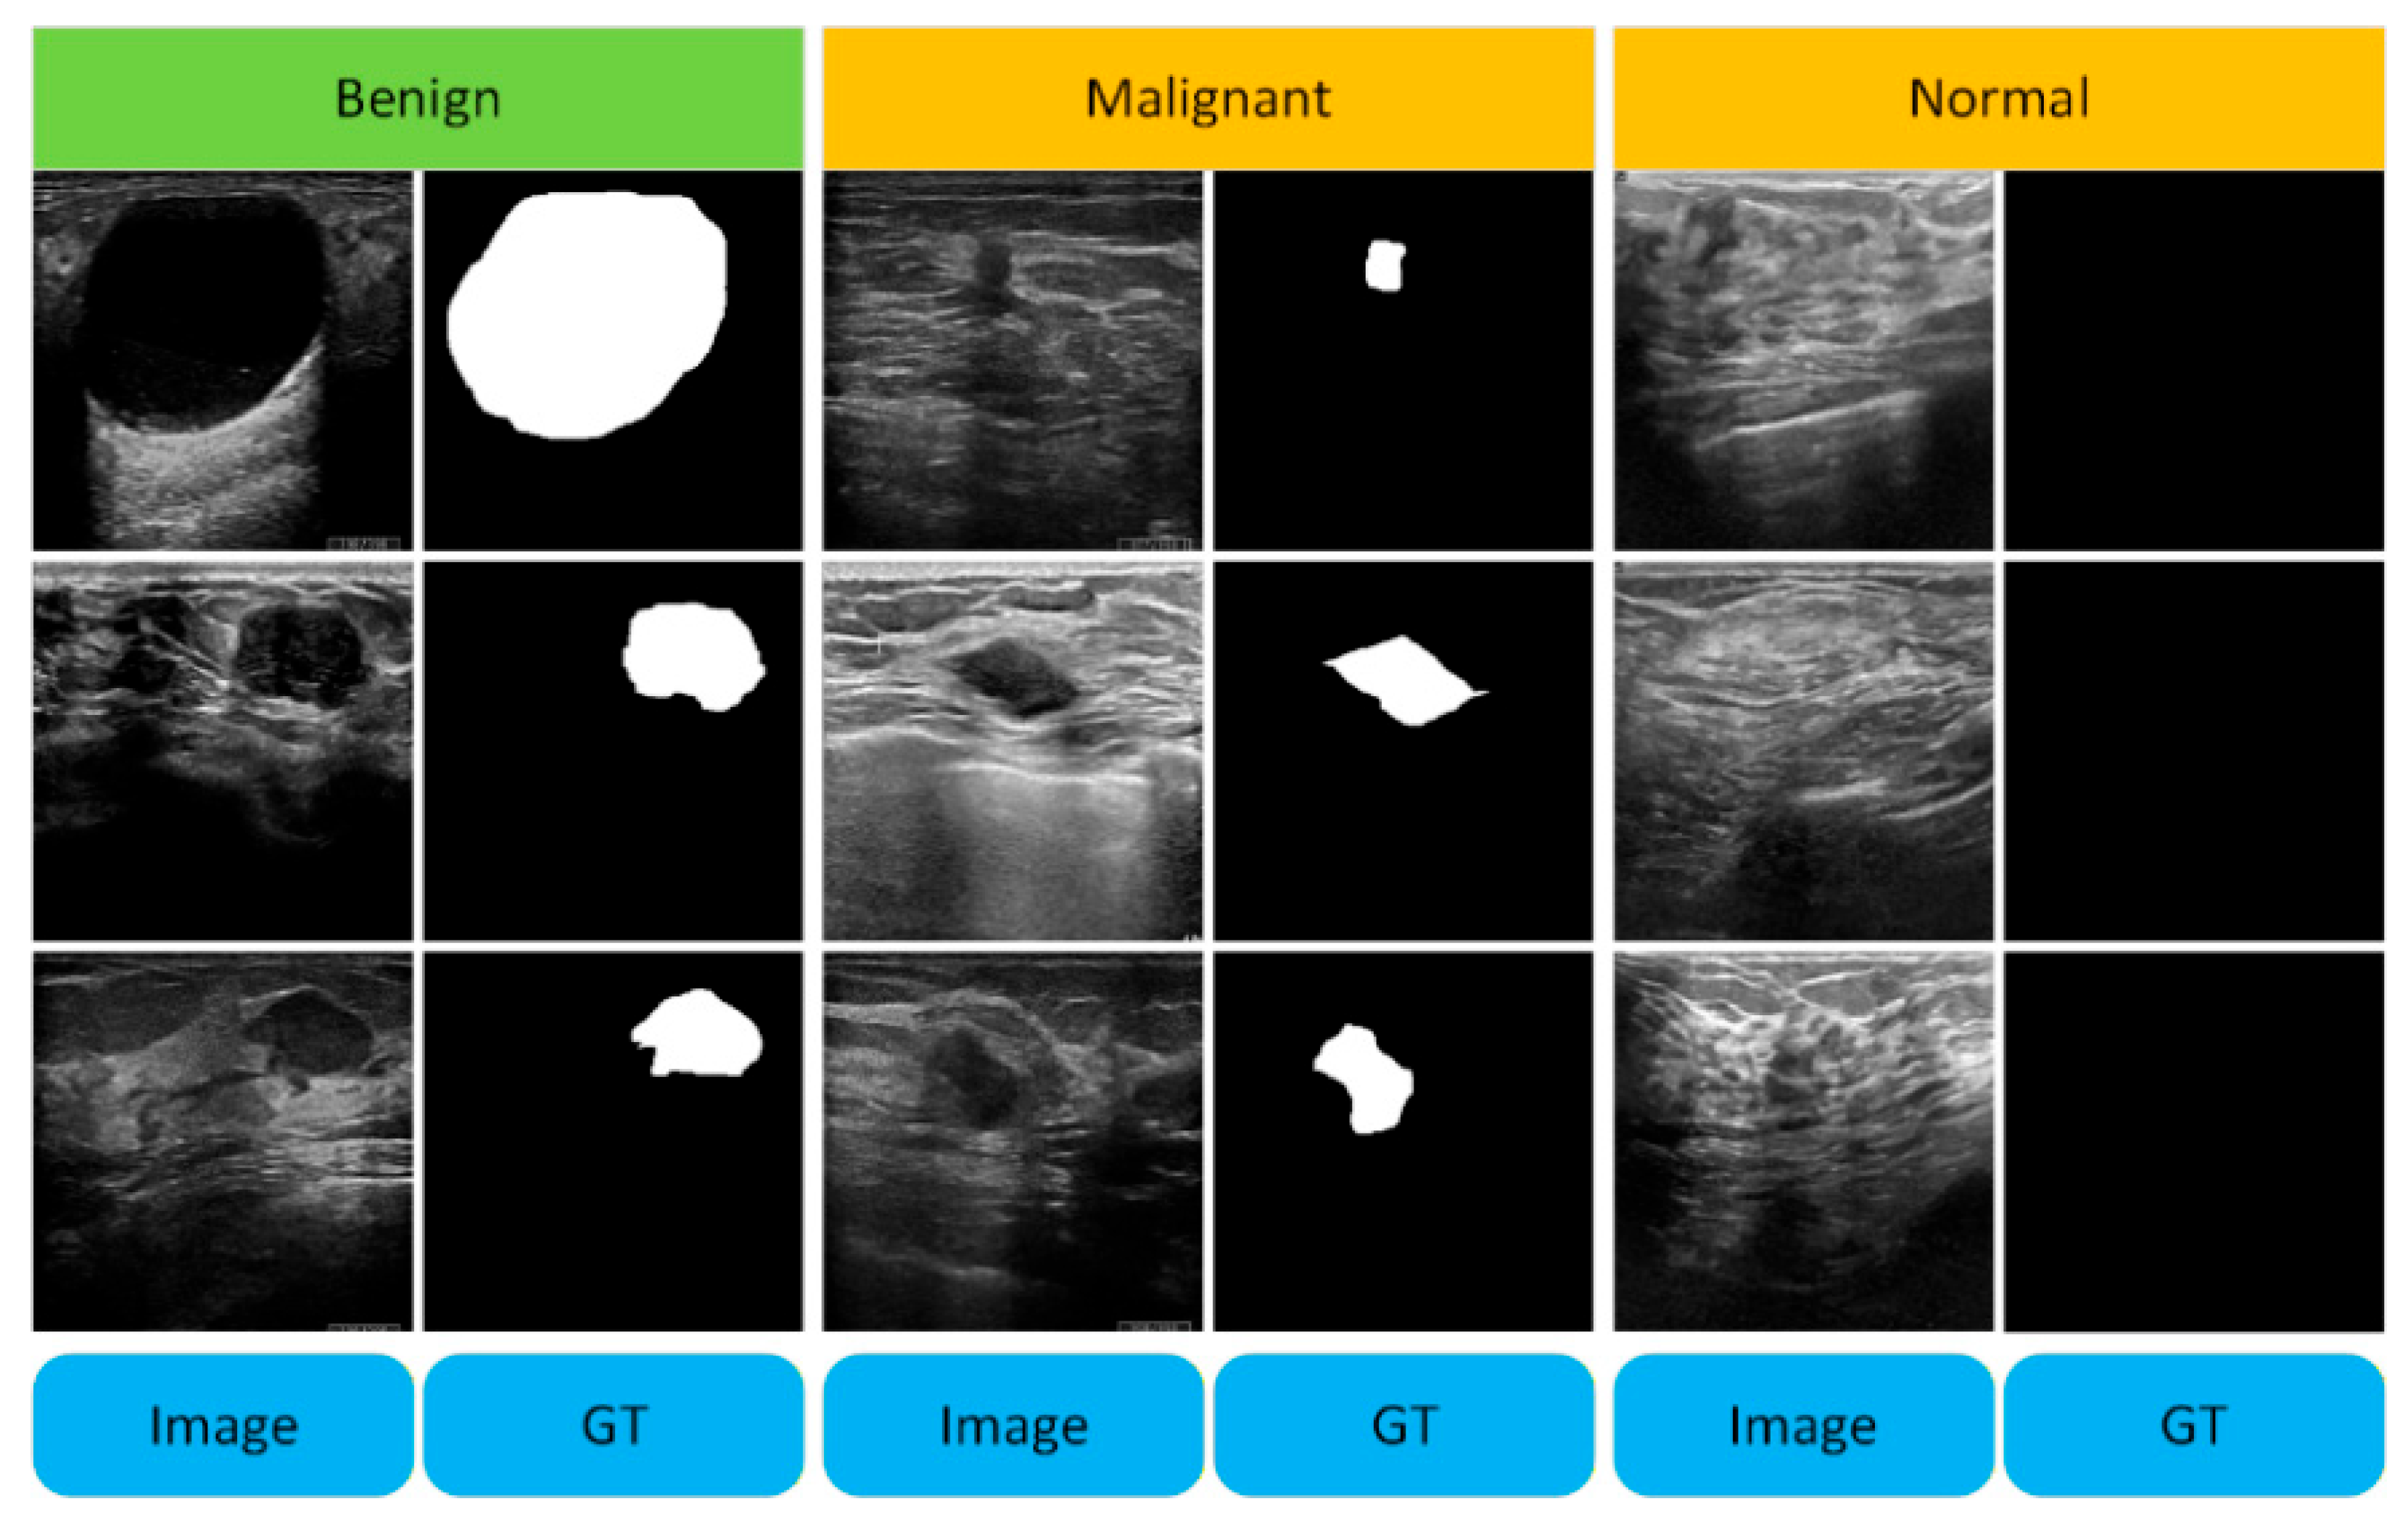
Figure 1. An intuitive example image of breast cancer ultrasound images, along with their ground truth mask (GT).
Electronics 15 02274 g001
Figure 2. Architecture of the proposed MV-UNet. The green area in the Output represents the predicted mask generated by the segmentation model.
Electronics 15 02274 g002
Figure 3. The architecture of SES. (a) is the architecture of SES, and (b) is the architecture of SE-Mixer.
Electronics 15 02274 g003
Figure 4. A component of MSD. (a) is a component of MSD, and (b) is the architecture of the VSS Block.
Electronics 15 02274 g004
Figure 5. The architecture of LSM.
Electronics 15 02274 g005
Figure 6. Training-related indicators. (AE) are core metrics on the training set, (F,G) are loss curves, (H) is the learning rate schedule, and (I) is the optimal validation mIoU.
Electronics 15 02274 g006aElectronics 15 02274 g006b
Figure 7. The segmentation capability of the model. ‘Image’ is the original ultrasound image, ‘GT’ is the ground truth mask, and ‘Pred’ is the model prediction mask. In ‘Pred’, semi-transparent green indicates TP, red indicates FP, and blue indicates FN. Darker colors in the heatmap indicate higher model attention.
Electronics 15 02274 g007
Table 1. Configuration of Data Augmentation Strategies.
Augmentation OperationParameters ProbabilityNotes and Implementation Details
Random Horizontal FlipProbability: 50%The image is flipped left-right along the vertical axis.
Random Vertical FlipProbability: 50%The image is flipped up-down along the horizontal axis.
Random RotationProbability: 75%
Angles: {90°, 180°, 270°}
Randomly selects one of the three fixed angles for rotation.
Random Gaussian BlurProbability: 50%
Blur radius (σ): Sampled uniformly from [0, 1]
This intensity transformation is applied only to the input image; the corresponding ground truth segmentation mask remains unchanged. Blur is implemented using a Gaussian kernel.
Table 2. Training configuration.
ParameterSetting/Value
Batch Size4
Epochs1000
random seed123
OptimizerAdamW
Weight Decay0.001
pretrained weightsUnused
Learning-rate scheduleCosine Annealing (no warm-up)
Thresholding StrategyArgmax
Preprocessing NormalizationMean = [0.485, 0.456, 0.406]
Standard Deviation = [0.229, 0.224, 0.225]
Learning Rate for MV-UNet, UNetMamba, and Swin-UMamba (via grid search)6 × 10⁻⁴
Learning Rate for EMGANet and other modelsAs per its original publication, 3 × 10 3
Model Selection Criterion (MV-UNet, UNetMamba, and Swin-UMamba)Highest mIoU on the validation set
Model Selection Criterion (EMGANet and other models)As per its original publication, the highest F1-score on the validation set
Table 3. Experimental Environment Configuration.
ComponentSpecification/Version
Operating SystemLinux Ubuntu 22.04
CUDA Version11.8
Python Version3.10.19
Deep Learning FrameworkPyTorch 2.0.1 + cu11
CPUIntel Xeon Silver 4210R
GPUNVIDIA RTX A5000 (24 GB GDDR6 VRAM, 8192 CUDA Cores)
Table 4. On the BUSI_WHU dataset, a comparison of the performance of different segmentation methods. The red color represents the best result, the blue color represents the second-best result, and the green color represents the third-best result. The values in parentheses for MV-UNet are the results of five independent random seed tests, presented in the format of mean ± standard deviation.
MethodsKappa
(%)
Precision
(%)
Recall
(%)
mIoU
(%)
ASSD
(pixel)
OA
(%)
U-Net201588.3392.7585.8089.395.6998.48
SegNet2017 [26]89.1892.9787.1090.106.3798.59
TransUnet2021 [9]86.8392.2083.6988.1711.1498.30
MDA-Net2022 [7]82.2389.9177.8184.595.2997.76
DualA-Net2023 [27]88.5592.0686.8189.586.3598.50
EGEUNet2023 [8]87.8692.1785.4989.016.7398.42
MGCC2023 [28]89.2292.7487.3890.145.3998.59
EH-Former2024 [10]89.4192.9587.5190.295.5398.61
ScribFormer2024 [29]89.1991.1188.8490.115.9098.56
EMGANet2025 [20]89.4588.5791.9590.326.1098.56
UNetMamba2025 [19]88.6289.4690.4790.164.5998.77
Swin-UMamba2024 [23]88.8990.3590.1490.254.9198.71
MV-UNet (Ours)89.19
(89.34 ± 0.80)
90.10
(90.06 ± 0.44)
90.85
(91.11 ± 0.79)
90.51
(90.57 ± 0.61)
4.59
(4.73 ± 0.39)
98.87
(98.89 ± 0.12)
Table 5. Comparison of model efficiency for different segmentation methods. Red represents the optimal result.
MethodsModel Size (MB)Total Parameters (M)FPS (Frames per s)CPU Memory Usage (MB)GPU Memory Usage (MB)GFLOPsLatency
(ms)
EMGANet2025 [20]1264.32331.439.9122.532784.2768.08101.01
UNetMamba2025 [19]98.3825.7949.96373.21941.298.7320.02
Swin-UMamba2024 [23]239.759.8932.23243.24733.1087.8731.03
Ours-part1_5141.5737.1173.80301942.8532.0013.55
Ours-part1_5_dim197.749.4724.53338.481271.3642.7040.77
Ours-part2162.8942.7044.63345.76447.3329.2822.41
Ours-part3181.345.2532.1290.88648.1628.8131.15
Ours-part4188.1549.3231.9296.94767.6730.7031.35
Ours-part5142.7437.4230.2335.68628.7723.1233.11
MV-UNet (Ours)185.9048.7332.1295.97765.4230.1631.15
Table 6. Performance benchmark on the BUSI dataset. The red color represents the best result, the blue color represents the second-best result, and the green color represents the third-best result.
MethodsKappa
(%)
Precision
(%)
Recall
(%)
mIoU
(%)
ASSD
(pixel)
OA
(%)
U-Net201574.4080.8372.8178.8820.5895.96
SegNet2017 [26]73.6780.4171.9378.3824.0795.86
TransUnet2021 [9]72.5878.0272.1677.6433.0795.62
MDA-Net2022 [7]68.7173.6769.3975.1119.8194.96
DualA-Net2023 [27]65.3265.6071.9372.9135.1294.02
EGEUNet2023 [8]72.9278.5472.2777.8724.0795.69
MGCC2023 [28]74.3578.2875.0678.8323.8995.84
EH-Former2024 [10]73.9979.4673.3078.5924.4995.85
ScribFormer2024 [29]68.7169.8473.5075.0626.6794.71
EMGANet2025 [20]78.0376.9283.5881.3718.2796.23
UNetMamba2025 [19]67.7665.1363.9575.5821.5396.67
MV-UNet (Ours)72.7966.0965.3576.2314.9496.63
Table 7. The result of ablation experiments.
MethodsKappa
(%)
Precision
(%)
Recall
(%)
mIoU
(%)
ASSD
(pixel)
OA
(%)
U-Net2015 (Baseline)88.3392.7585.8089.395.6998.48
Ours-part1_4 (U-Net encoder + 4 layers of MSD and LSM)88.2789.9889.2589.944.9998.76
Ours-part1_5 (U-Net encoder + 5 layers of MSD and LSM)88.7389.3690.7490.205.1298.76
Ours-part1_5_dim (change dim 64 → 74)88.5288.7489.9390.365.2498.78
Ours-part2 (improved MambaVision encoder + U-Net decoder)85.7487.6387.5188.456.3398.58
Ours-part3 (improved MambaVision encoder + MSD (without LSM))87.5288.5689.5389.375.4998.74
Ours-part4 (Complete model with MambaVision Mixer)89.2090.0890.8290.464.6198.88
Ours-part5 (Complete model, change dim 64 → 56)88.8189.7490.7790.324.8398.81
Ours (Complete model)89.1990.1090.8590.514.5998.87
Disclaimer/Publisher’s Note: The statements, opinions and data contained in all publications are solely those of the individual author(s) and contributor(s) and not of MDPI and/or the editor(s). MDPI and/or the editor(s) disclaim responsibility for any injury to people or property resulting from any ideas, methods, instructions or products referred to in the content.