1. Introduction
With the rapid development of China’s economy and the continuous optimization of its energy structure, Ultra-High Voltage Direct Current (Ultra-HVDC, UHVDC) transmission technology, as a crucial means for large-scale long-distance clean energy transmission, has been widely applied in China’s power system. In recent years, driven by the construction of renewable energy bases for hydropower, wind power, and photovoltaics in the western region, a pattern of multiple UHVDC feeds into large receiving-end power grids has gradually formed. Receiving-end regions face a complex operational environment characterized by parallel UHVDC lines and strong AC-DC coupling. Optimizing the transmission power of multiple DC links under system strength constraints to ensure the safe and stable operation of large receiving-end grids has become a key challenge in current power system planning and dispatching.
On the one hand, UHVDC transmission offers significant advantages of large capacity, long distance, and low losses, effectively enabling the optimal allocation of energy resources between Eastern and Western China. However, following the large-scale centralized integration of UHVDC systems into the receiving-end AC grid, the operational characteristics of the receiving-end grid undergo fundamental changes. Firstly, the short circuit ratio (SCR) of the receiving-end AC system directly affects the transmission capacity and safety margin of the DC system. When the SCR is low, the operation of the DC converter station is susceptible to disturbances from the AC system, significantly reducing system stability and potentially triggering severe faults like commutation failure or blocking. Engineering practices show that the strength of the receiving-end AC system has become a bottleneck limiting the increase in DC transmission capacity. Quantitatively analyzing the constraint relationship between the short circuit ratio and DC transmission power is a theoretical prerequisite for the safe operation and capacity expansion of DC systems.
On the other hand, with the parallel operation of multiple UHVDC systems in receiving-end regions, frequency and voltage stability issues in the AC-DC system are becoming increasingly prominent. After multiple DC lines are connected to the same power grid, the reactive power demand and frequency regulation capability of the receiving-end system face severe challenges. Especially when faults occur or operational modes change in the receiving-end system, the coupling effect between DC systems can intensify transient instability, manifested by decreased voltage stiffness at converter buses, large frequency fluctuations, and DC commutation failures. These issues not only affect the safe and stable operation of the power system but can also lead to extensive load loss, potentially triggering regional grid collapse in severe cases. Therefore, studying how to optimize DC power allocation in multi-infeed receiving-end systems to enhance frequency and voltage stability holds significant theoretical and practical value.
Extensive in-depth research has been conducted on the safe and stable operation of DC transmission systems, primarily focusing on system strength quantification, commutation failure mitigation, frequency stability analysis, and multi-DC coordinated optimization.
In terms of system strength assessment, the short circuit ratio (SCR) is a classic indicator for single-infeed DC systems. For multi-infeed scenarios, the CIGRE Working Group clarified the relationship between the multi-infeed interaction factor (MIIF) and system strength [
1], and Rahimi et al. proposed the multi-infeed short circuit ratio (MISCR) [
2]. Li et al. further proposed the transient multi-infeed short circuit ratio (TMSCR) by introducing transient power to correct traditional indices [
3], and derived an analytical expression for the critical short circuit ratio (CSCR) under flexible control from the voltage stability Jacobian matrix [
4].
For hybrid Voltage Source Converter (VSC) and Line Commutated Converter (LCC) infeed scenarios, Zuo et al. proposed a calculation method for the multi-infeed short circuit ratio in incompletely partitioned scenarios [
5]. Regarding commutation failure and voltage stability, Guo et al. established a small-signal dynamic model of hybrid multi-infeed systems, revealing the influence mechanism of controller parameters in weak AC systems [
6]. Feng et al. proposed the Subsynchronous Oscillation Impact Factor (SOIF), revealing the mechanism by which subsynchronous oscillation causes commutation failure [
7]. Rahimi et al. systematically analyzed the propagation patterns of commutation failures in multi-infeed systems [
2]. Yu et al. proposed an LCC-HVDC control modification method considering dynamic reactive power balance [
8], while Wang et al. studied the support characteristics of VSC-HVDC for multi-infeed systems and proposed a short circuit ratio calculation method based on operational impedance [
9].
In terms of frequency stability, Ancha et al. proposed a decentralized frequency and DC voltage deviation control method for Multi-Terminal Direct Current (MTDC) grids suitable for high renewable penetration scenarios [
10]. Jagadesan et al. studied AI-enhanced frequency control strategies in integrated power systems containing wind and solar power [
11]. Zhong et al. proposed a frequency emergency control strategy coordinating multiple resources for “double-high” sending-end power grids [
12].
Regarding multi-DC power optimization dispatching, Jiang et al. proposed a quasi-steady-state emergency load-shedding strategy for HVDC receiving-end systems [
13]. However, most existing optimization models handle frequency and voltage constraints separately, lacking research that integrates system strength, frequency response, and voltage stiffness into a unified optimization framework. Especially in multi-infeed receiving-end grids, achieving economically optimal power allocation while satisfying multiple stability constraints remains a critical issue to be solved.
In existing research, scholars have primarily focused on the safe operational boundaries of single or a few DC systems, proposing various optimization methods for DC control strategies, AC-DC coordination, and reactive power compensation at the receiving end. For example, measures such as increasing AC system strength, deploying dynamic reactive power compensation devices (e.g., synchronous condensers, STATCOM), and employing high-performance control and protection systems can enhance receiving-end stability to a certain extent [
14,
15,
16,
17,
18,
19,
20,
21,
22,
23,
24]. Furthermore, a recent study [
25] further explores the regulation potential of power electronic converters in power optimization, providing a useful reference for this research. However, with the large-scale integration of multiple DC systems, traditional parameter enhancement and local compensation methods struggle to meet the coordinated optimization needs of the entire system. The frequency response capability and voltage support capability of the receiving-end grid are closely related to the power allocation of DC systems. Simple single-point optimization can no longer satisfy the high complexity constraints of coordinated operation of multiple DC systems. Therefore, there is an urgent need to establish a comprehensive multi-DC power transmission optimization model from a system-level perspective, incorporating multiple constraints such as system strength, frequency, and voltage stability into a unified framework to find the optimal DC power transmission scheme.
This paper conducts systematic theoretical analysis and method research on UHVDC multi-infeed receiving-end grids under system strength constraints. The main innovations of this paper are as follows:
The quantitative constraint relationship between system strength and DC transmission limits is revealed. The paper clarifies the distinct restrictive mechanisms of rectifier-side and inverter-side system strength on DC transmission limits, identifying that the short circuit ratio on the weaker side constitutes the primary bottleneck.
Linear constraint models are constructed for frequency stability and voltage stiffness. For fault scenarios such as DC blocking and commutation failure, it establishes linearized formulations of frequency stability constraints and voltage stiffness constraints.
A multi-DC power optimization model under system strength constraints is established. System strength is incorporated as a core constraint into the multi-DC power optimization framework. The effectiveness of the proposed method in enhancing system dynamic response and safety margins is validated.
In conclusion, the optimization of UHVDC multi-infeed receiving-end grid transmission power under system strength constraints is a crucial topic for the safe, stable, and sustainable development of current power systems. Combining theoretical analysis with engineering validation, this paper proposes a practical multi-DC power optimization method, providing a theoretical basis and technical support for the safe and economical operation of multi-DC receiving-end grids.
2. Influence of System Strength on Conventional DC Transmission Power
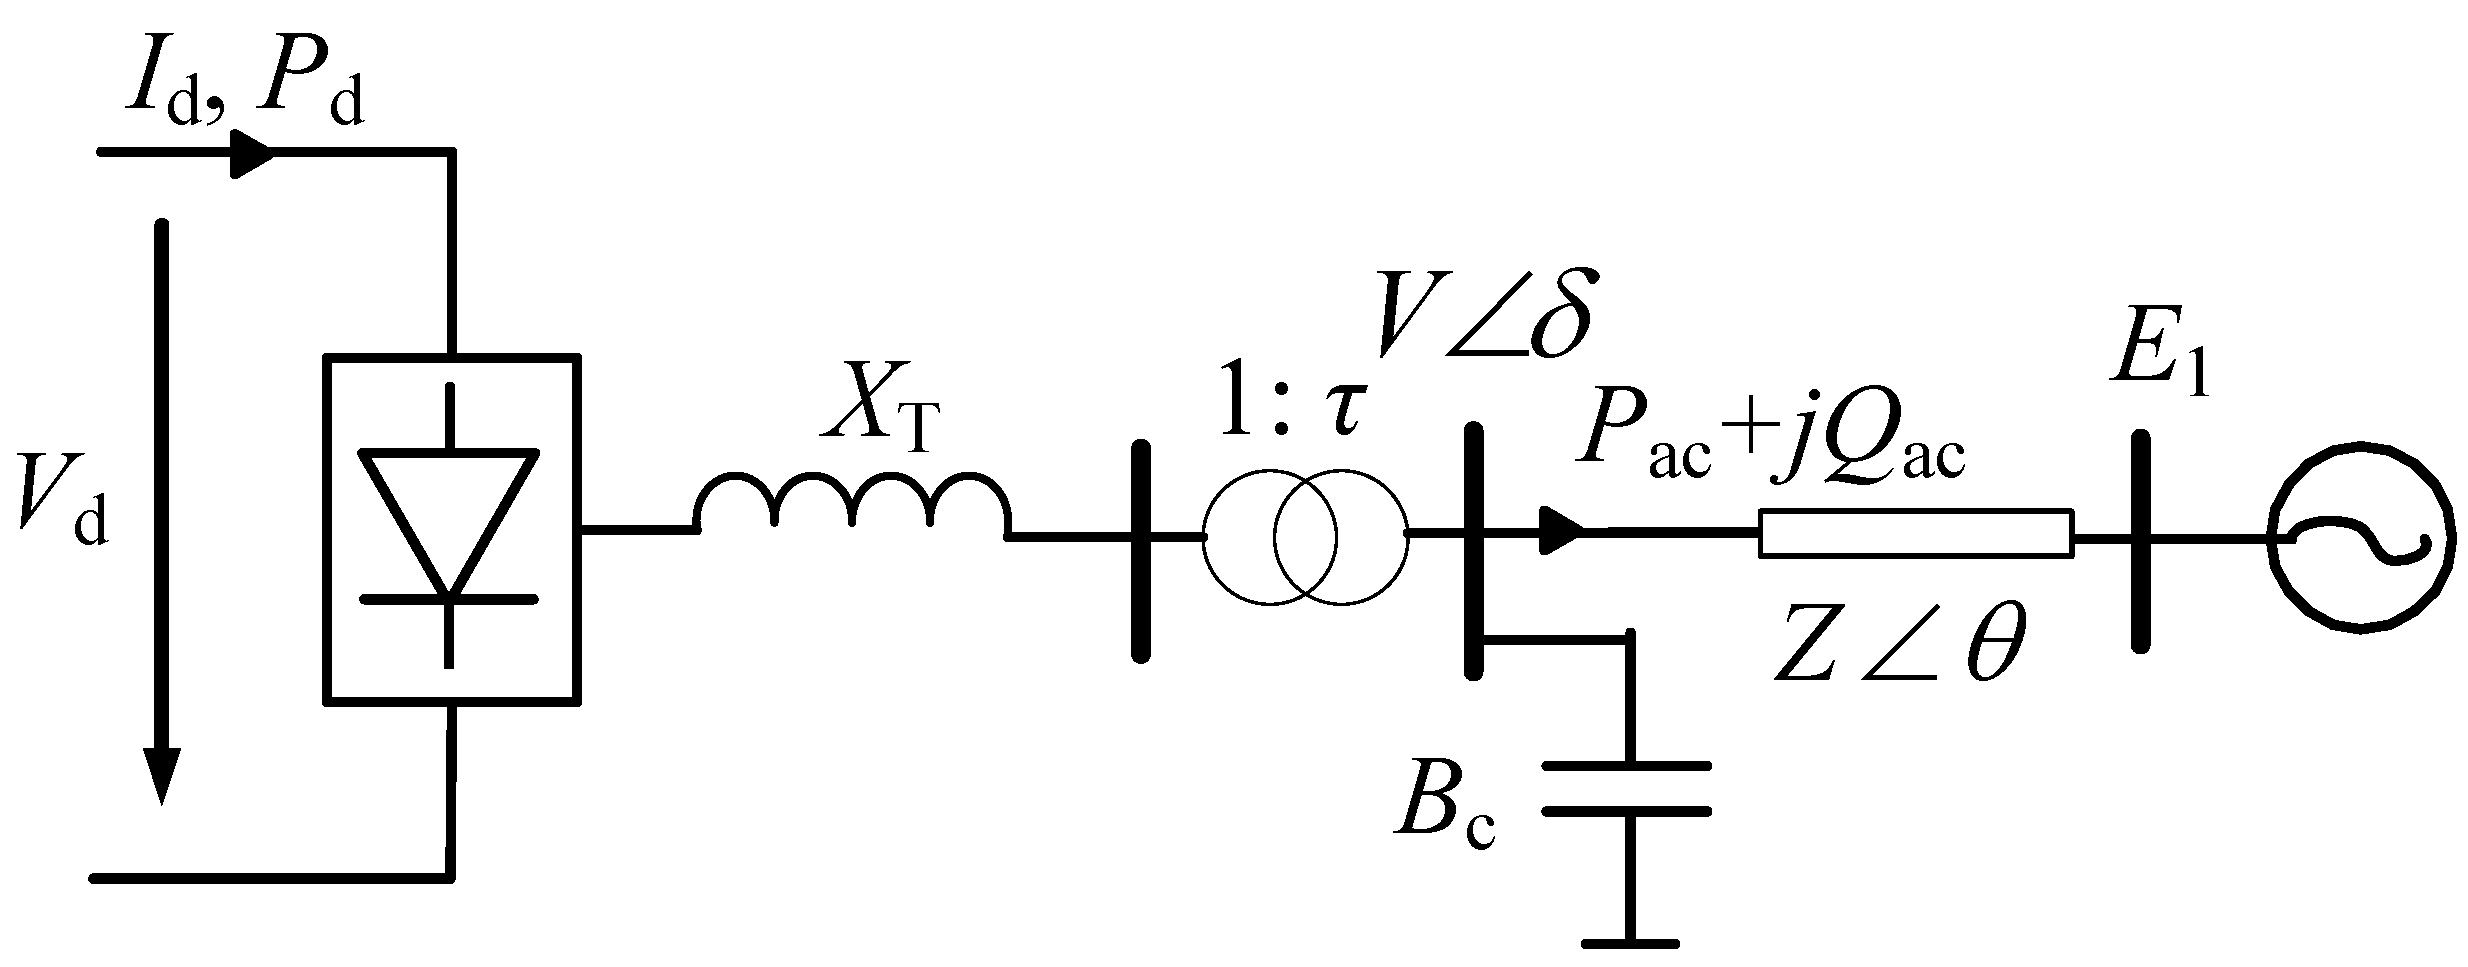
To study the influence of system strength on conventional DC transmission power, a single-infeed AC-DC system model is first established, as shown in
Figure 1.
In the figure, are DC voltage and current; is the AC bus voltage of the converter station; are DC active power; are AC active and reactive power; is the leakage reactance of the converter transformer; is the equivalent admittance of AC filters and reactive power compensation capacitors; is the equivalent impedance of the AC system; τ is the converter transformer tap; and is the equivalent potential of the AC system.
If, in the model system of
Figure 1, the base power and base voltage of the DC system are taken as the rated DC power
and rated DC voltage
, the base voltage of the AC system is taken as its rated voltage, and the base power of the AC system equals that of the DC system. Thus, the characteristics of the entire model system can be described by Equations (1)–(9):
where
is the reactive power consumption of DC converter, γ is the extinction angle, μ is the commutation angle, and C and K are constants related to converter transformer parameters and DC system base values. The expression for C is:
where
and
are the capacity and short circuit ratio of the converter transformer.
The variables in the above equations are classified as follows: (1) converter station equipment parameters, including , , C, K, , and τ; (2) receiving-end system parameters, including and θ; and (3) operating state variables, including γ, μ, , , , , , δ, , , , and . If the change in the transformer tap and the switching of the compensation capacitor are not considered, the converter station equipment parameters can be considered fixed. Once the operation mode of the receiving-end AC system is determined, the receiving-end system parameters are also fixed. Among the operating state variables, the equivalent potential is also assumed to be fixed. In this case, there are 11 operating state variables in total, but there are nine constraint equations, so only two state variables are independent. That is, once any two of these variables are determined, the remaining variables are determined accordingly.
According to different analysis purposes, different choices can be made for the two independent variables. In the following analysis, γ and
are chosen as the independent variables. When γ takes a fixed value and the magnitude of
is changed, the curves of the remaining variables that vary with
can be obtained. Next, we examine the law of how
varies with
. To do this, we first assume the converter station equipment parameters and the receiving-end system parameters. Generally, the range of variations for the converter transformer parameters are:
The range of variations for the reactive power compensation capacity are:
The corresponding C value is 1.53. Additionally, we take:
The receiving-end system parameters are first taken as , the SCR is three, and the system impedance is considered as purely inductive.
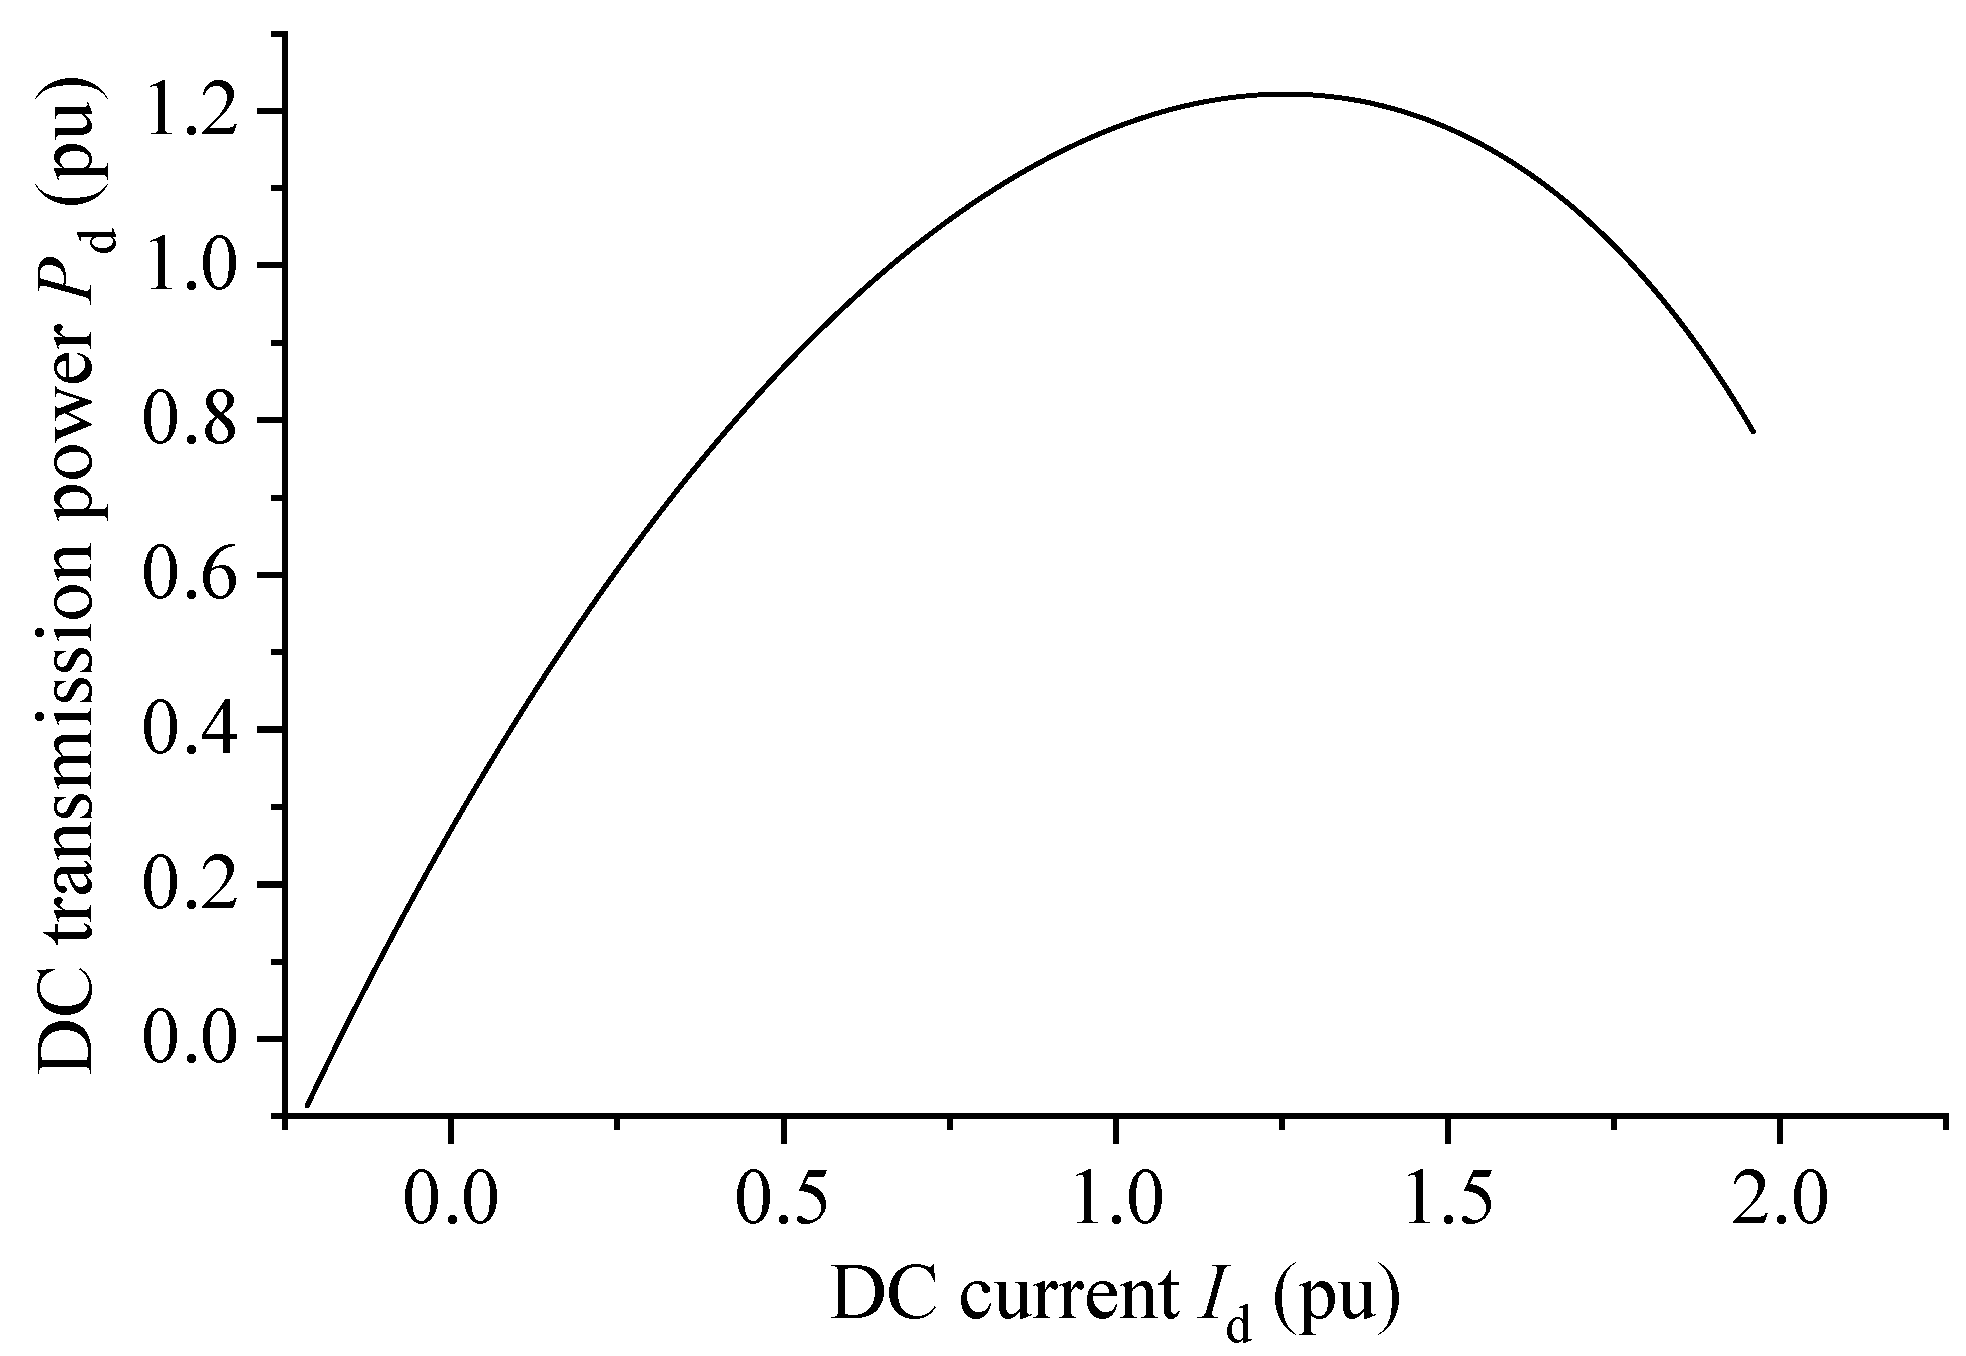
By changing the DC current
, the curve of DC transmission power
versus
can be obtained, as shown qualitatively in
Figure 2.
If the rated operating point lies to the right of the maximum transmittable power point, the system is prone to instability. If it lies to the left, the system can operate stably. Therefore, if the system’s short circuit ratio results in a zero derivative of power with regard to current, the system is at a critical stable state. This short circuit ratio is termed the critical short circuit ratio (CSCR). Based on the properties of the CSCR, it must satisfy the following equation:
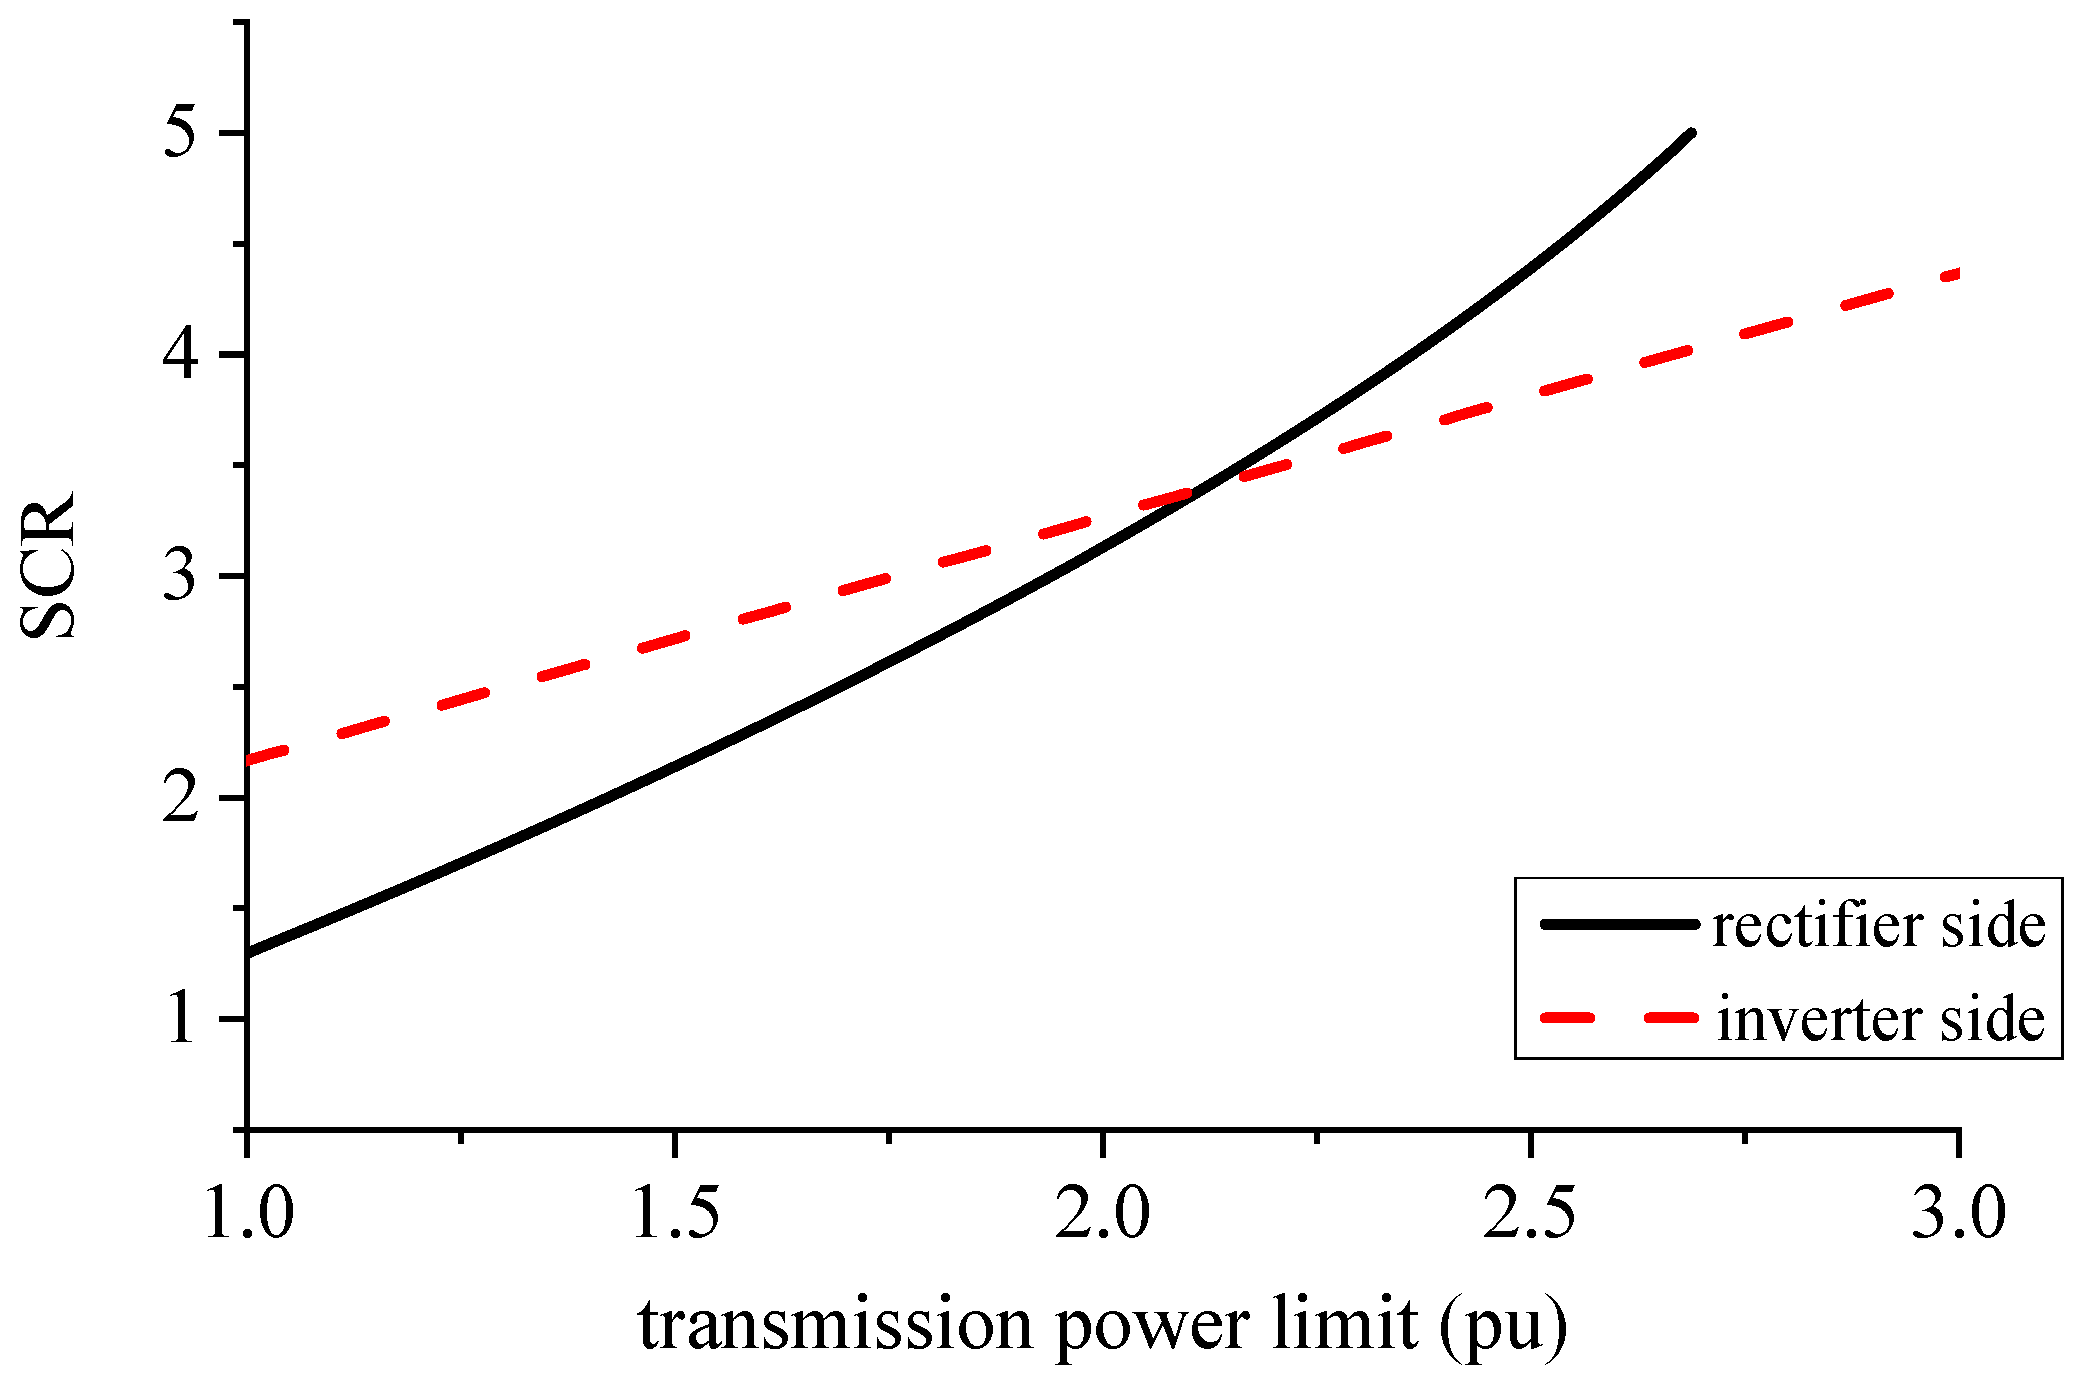
According to Equation (19), the qualitative relationship between the transmission power limits of the DC system at the rectifier and inverter sides and the corresponding short circuit ratios at those ends can be derived, as shown in
Figure 3.
As seen in
Figure 3, the two curves must have an intersection point. For the same DC system, generally speaking, the rectifier side transmits power while the inverter side receives power, requiring a state of supply–demand balance, i.e., the same transmission power limit exists. The above analysis shows that there exists a short circuit ratio value where, when the short circuit ratios on both sides are less than this value, the system’s transmission power limit is constrained by the inverter side; conversely, when the short circuit ratios on both sides are greater than this value, the system’s transmission power limit is constrained by the rectifier side. Consequently, the transmission power limit corresponding to this short circuit ratio can be obtained. If the power to be transmitted by the system is less than this value, the inverter side short circuit ratio determines the system’s transmission capacity; if the power to be transmitted by the system exceeds this value, the rectifier side short circuit ratio determines the system’s transmission capacity. The short circuit ratio corresponding to the intersection point between the curve of the rectifier side short circuit ratio and its corresponding transmission power limit and the curve of the inverter side short circuit ratio and its corresponding transmission power limit is defined as the turn short circuit ratio, denoted as TSCR; the corresponding transmission power limit is defined as the transmission power turning point, denoted as
Pm,T.
According to Equation (19) and the power balance condition, the short circuit ratio curves for the rectifier side and the inverter side are constructed. By solving these two curves simultaneously using a numerical iteration method, the numerical solution at their intersection point, i.e., (Pm,T, TSCR), is obtained. The TSCR is relatively sensitive to variations in the converter transformer leakage reactance and the compensation capacitor susceptance.
In practical engineering, the delay trigger angle αN of the rectifier station under rated operating conditions may be slightly higher than 20°, and the resulting rectifier side transmission power limit curve will be slightly higher than the curve presented above, so the resulting turn short circuit ratio and transmission power turning point will also increase accordingly.
When the transmission capacity of the sending-end system is stronger than that of the receiving-end system, such as in the process of increasing the transmission power of the DC system, the sending-end system has not yet reached its transmission power limit; however, the receiving-end system, due to the constraints of system strength, no longer allows the transmission power to continue increasing. At this time, the receiving-end system determines the transmission capacity of the entire AC-DC system. Similarly, when the maximum power that the sending-end system can transmit is less than the transmission power limit of the receiving-end system—although the inverter-side AC system is strong enough to withstand larger DC power—the active power transmitted by the DC system is constrained from the supply side due to the strength limitation of the sending-end system, meaning that the demand of the receiving-end system for transmitting maximum power cannot be met. That is to say, at this time, the transmission capacity of the entire AC-DC system is mainly limited by the strength of the sending-end system. Therefore, the maximum transmission power of the DC system is affected by both the short circuit ratio of the rectifier-side AC system and the short circuit ratio of the inverter-side AC system.
If the short circuit ratios of the AC systems at both converter stations are less than the turn short circuit ratio (TSCR), even if the short circuit ratio of the rectifier-side AC system is less than that of the inverter-side AC system within a certain range, the DC system transmission power limit is still limited by the strength of the inverter-side system. When the short circuit ratios of the AC systems at both converter stations are greater than the turn short circuit ratio (TSCR), even if the short circuit ratio of the rectifier-side AC system is greater than that of the inverter-side AC system within a certain range, the entire DC system transmission capacity is still completely determined by the rectifier side. If the short circuit ratio of the AC system at one converter station is less than the TSCR, and the short circuit ratio of the AC system at the other converter station is greater than the TSCR, then the DC system transmission power limit is determined by the side with the smaller short circuit ratio.
3. Multi-Infeed DC Transmission Power Optimization Method
This section proposes a day-ahead power optimization method for multiple DC links considering the stability constraints of the receiving-end grid, providing a reference and solution for the operation of multi-infeed DC systems, and mitigating threats to the security and stability of the receiving-end grid caused by DC blocking or commutation failure. The following first introduces the frequency and voltage stability constraints for multi-infeed receiving-end grids, then establishes the day-ahead power optimization model for multiple DC links, and finally verifies the correctness of the proposed method through simulation calculations in
Section 4.
3.1. Influence of Frequency Stability on Transmission Power
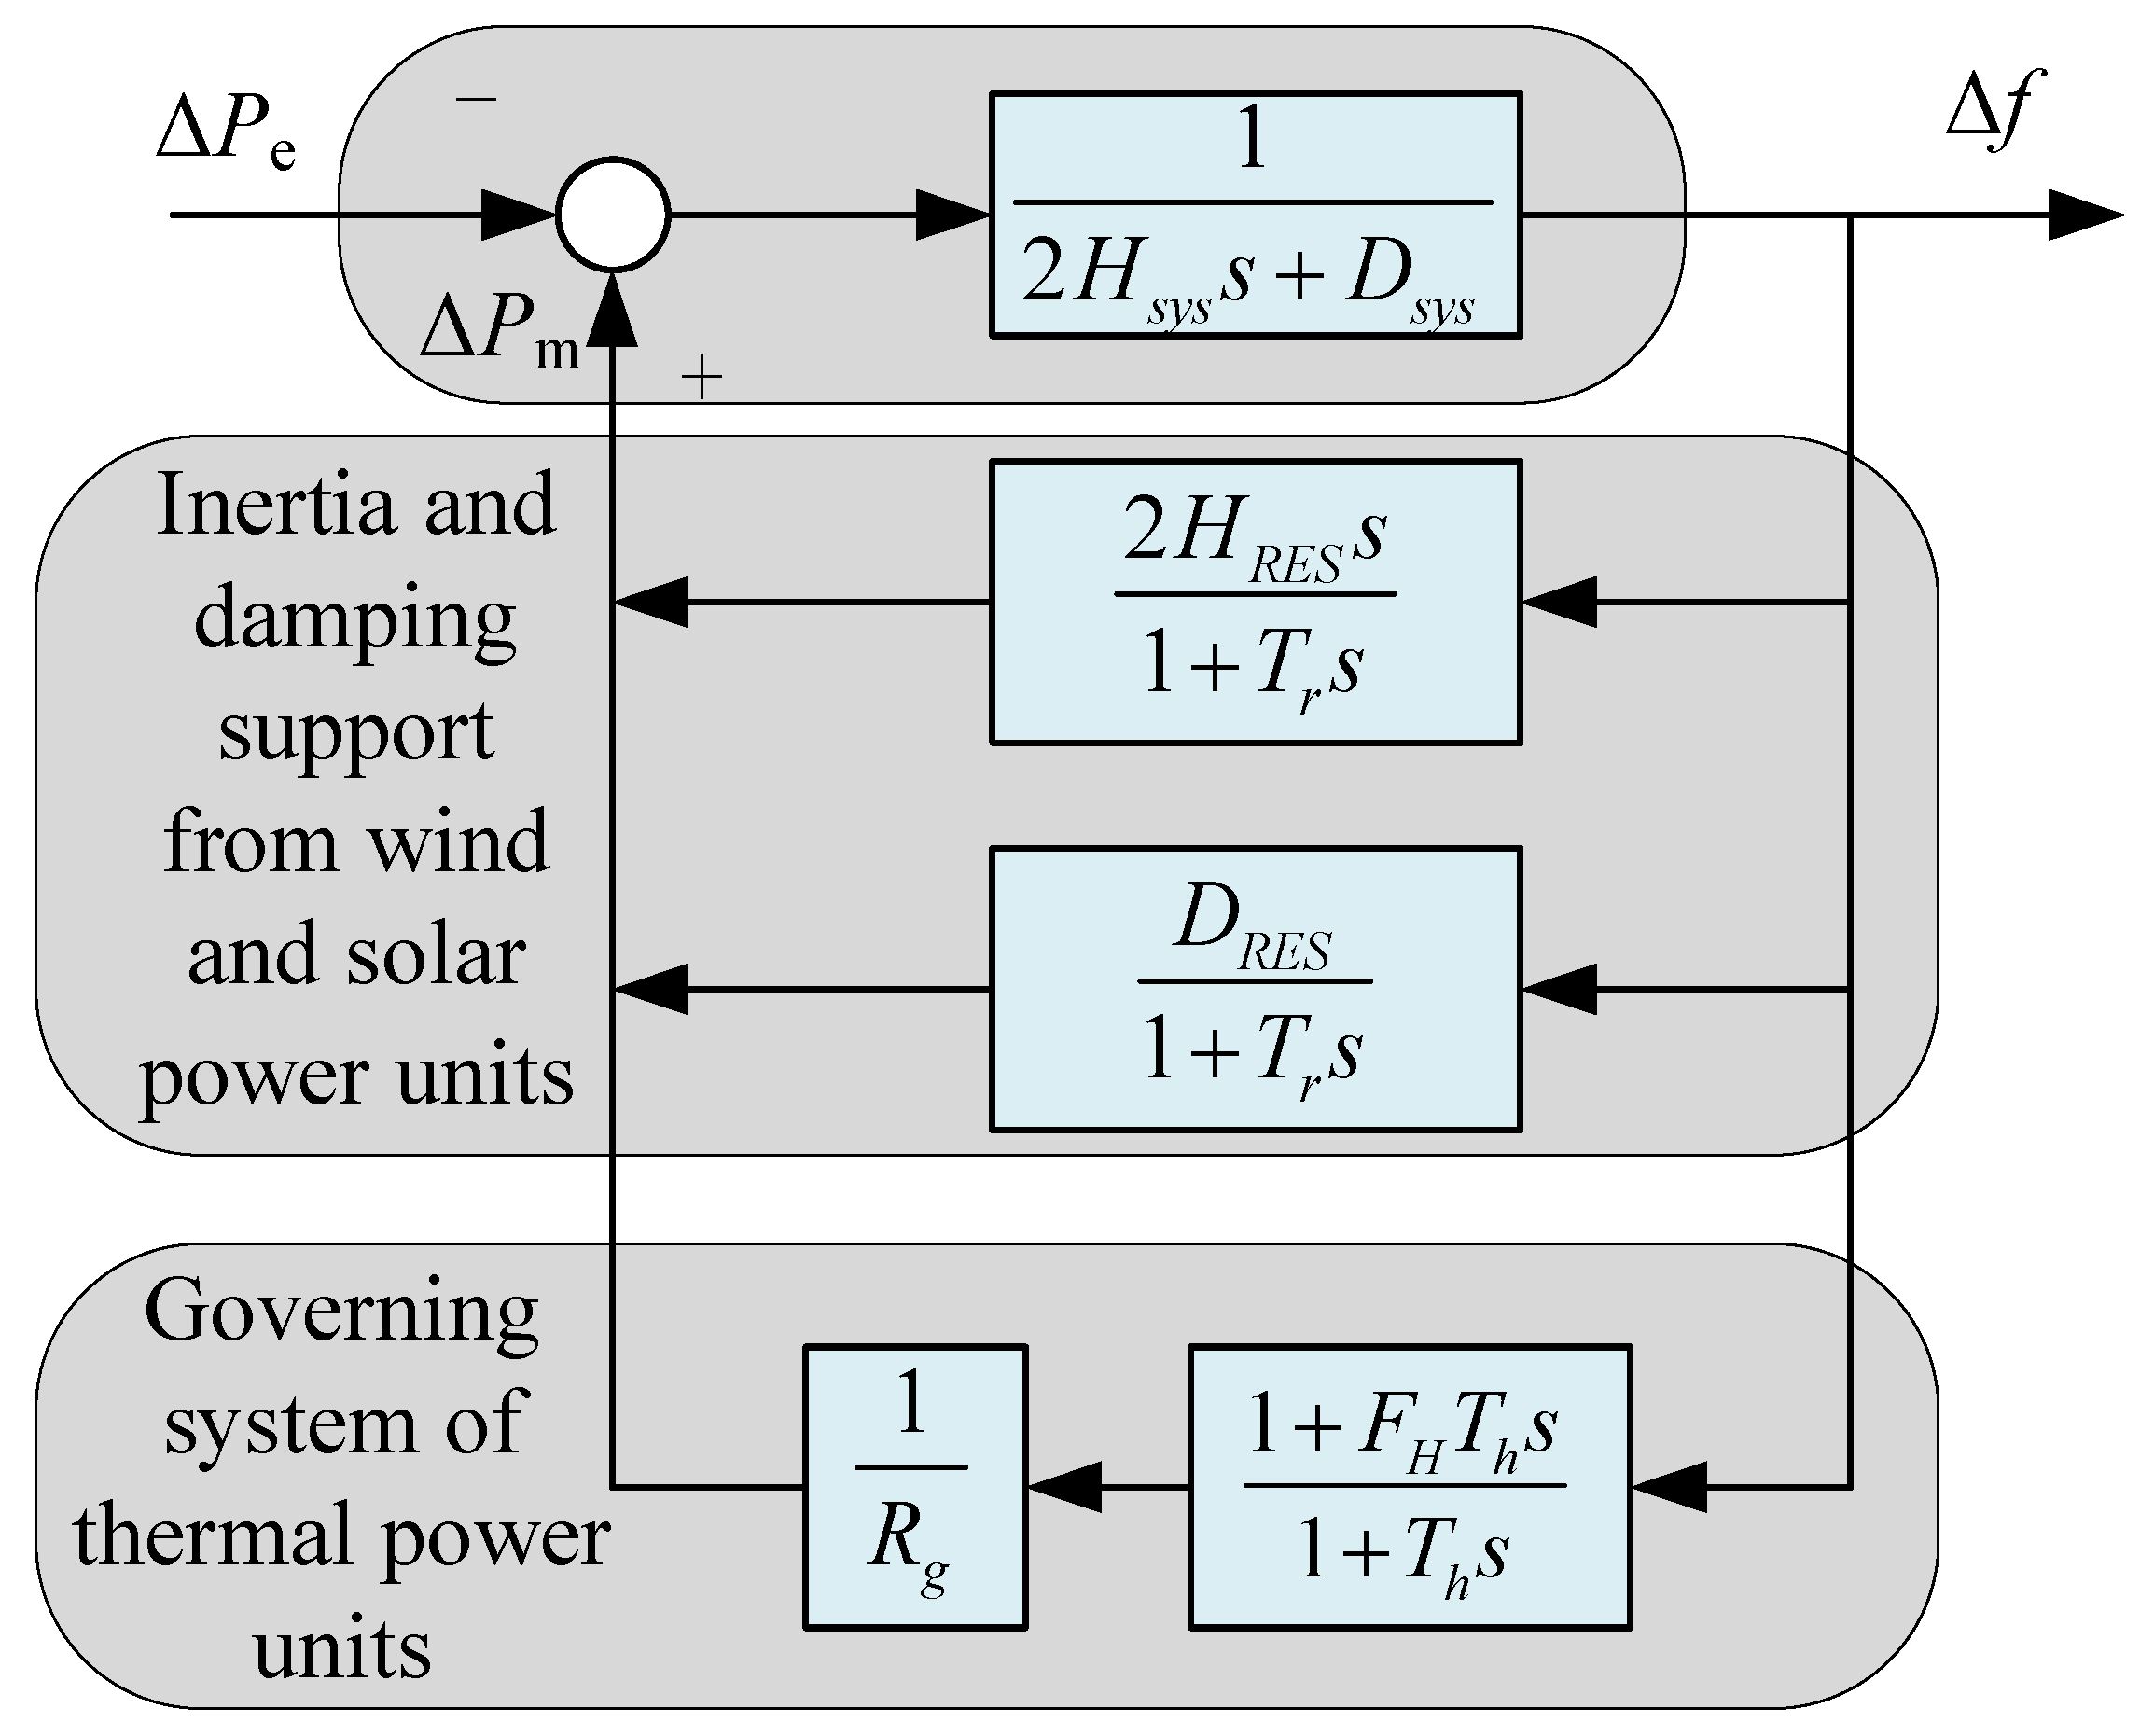
In a power grid containing renewable energy units, its primary frequency regulation model can be equivalent to the simplified model shown in
Figure 4. In
Figure 4, assuming a uniform grid frequency and homogeneous thermal units, the primary frequency regulation effect of all hydro and thermal units is equivalent to a simple model of a single steam turbine with a droop coefficient. The contribution of wind and solar units to primary frequency regulation can generally be categorized into inertia support and damping support. Therefore, the primary frequency regulation characteristics of a grid with renewable units can be represented by the simplified model in
Figure 4.
In the figure, Hsys and Dsys are the system’s equivalent inertia and damping coefficients, respectively; HRES and DRES are the magnitude of support inertia and damping provided by wind and solar units, respectively; Tr is the action time constant of wind and solar units; Th is the steam turbine reheat time constant; FH is the proportion of the steam turbine high-pressure boiler; ΔPe is the electromagnetic power disturbance; ΔPm is the mechanical power change; Δf is the frequency deviation; and Rg is the droop coefficient.
Ignoring the action delay of renewable units (i.e.,
Tr = 0), the transfer function of the simplified model in
Figure 4 is:
where
If the renewable energy response delay Tr ≠ 0 is taken into account, the order of the frequency response model increases and the frequency expression becomes more complex. The computational accuracy improves, but the computation time also increases. Simulation results show that for typical values of Tr, the maximum allowable DC power needs to be further reduced by approximately 5%. For day-ahead power optimization, such an error can be absorbed through conservative design and does not significantly affect the optimized power allocation results.
For the transfer function in Equation (20), the time-domain response expression under a step disturbance is:
where
The time and value at which the frequency deviation reaches its peak (nadir) are:
According to security and stability guidelines, the system should meet security and stability requirements for any N − 1 contingency without additional measures. When a single-pole block occurs in the largest DC system in the grid, the maximum frequency deviation should not exceed a threshold:
where
is the single-pole transmission power of the largest DC system in the grid.
Combining Equations (24) and (25) yields the constraint imposed by frequency stability on the single-pole transmission power of the largest DC system:
3.2. Influence of Voltage Stability on Transmission Power
According to Reference [
26], the voltage support strength at any point in the grid is defined as the ability to maintain the voltage magnitude at the connection point close to the no-load voltage, characterized by the voltage stiffness
Kvtg using the ratio of voltage magnitudes before and after device connection:
where
Kvtg represents the voltage stiffness,
Usys is the node voltage magnitude after device connection, and
Usys0 is the node voltage magnitude before device connection.
After a short circuit fault, multiple DC links in a multi-infeed receiving-end grid often experience simultaneous commutation failures. After fault clearance, each DC link begins to recover from commutation failure, absorbing a large amount of reactive power. If the voltage stiffness of the converter buses is insufficient during recovery, it can cause successive commutation failures, leading to prolonged power deficits and threatening system stability. To characterize the minimum voltage stiffness requirement during the commutation failure recovery process of DC systems, a method for calculating voltage stiffness related to transient voltage stability is provided below.
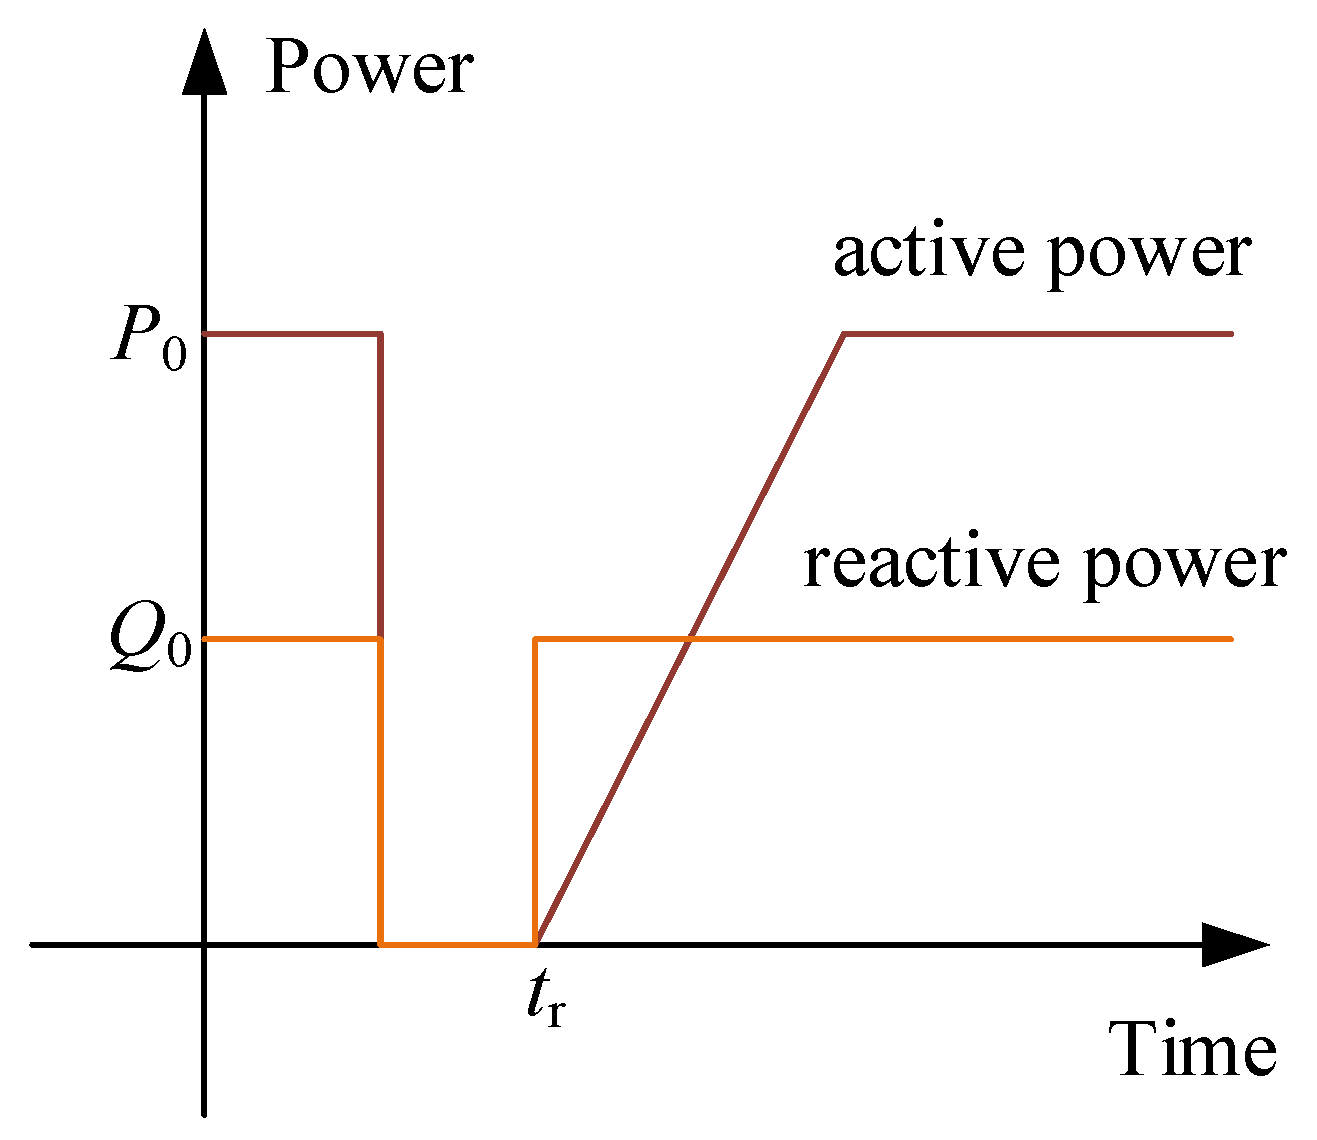
During commutation failure, both active and reactive power of the LCC can be considered zero. When LCC starts to recover from commutation failure, generally, the recovery speed of reactive power is much faster than that of active power. That is, reactive power recovers first, followed by active power at a certain rate. For simplicity, the commutation failure and recovery process of LCC can be simplified as shown in
Figure 5.
In this simplification, the moment when one DC system’s commutation failure has the greatest impact on the voltage stiffness of other DC systems is at the instant recovery begins, i.e., time
tr in the figure. From an active power perspective, the DC system acts as a source, and its output power helps increase the voltage stiffness of other DC systems. From a reactive power perspective, the DC system acts as a load, and the reactive power it absorbs decreases the voltage stiffness of other DC systems. Therefore, at time
tr, the DC system’s reactive power has recovered while active power is still zero, causing the most significant negative impact on the voltage stiffness of others. The reactive power absorbed by the DC system at time
tr can be approximated as proportional to the active power command value:
where
Qtr is the reactive power absorbed by the DC system at time
tr;
P0 and
Q0 are the initial active and reactive power; and
is the commanded active power output of the DC system at time
tr.
According to Equation (28), if the power command of a DC system is less than its rated power, the reactive power it needs to absorb decreases proportionally, requiring less reactive support from the AC system, thus reducing its impact on other DC systems.
Combined with the voltage-reactive power sensitivity, the voltage drop at DC
i caused by the connection/recovery of other DCs can be expressed as:
where
γij represents the voltage drop at DC
i caused by the recovery of DC
j, and
VRPSij (voltage-reactive power sensitivity) is defined as:
where Δ
Ui is the change in voltage magnitude at node
i, and Δ
Qj is the change in reactive power at node
j.
VRPSij can be obtained from the power-voltage Jacobian matrix, and the specific calculation method is detailed in Reference [
27]. Under different operating conditions, the variation in VRPS is less than 5%. The error between the linearized constraint and the actual non-linear voltage characteristics is within 0.01 p.u., which has a negligible impact on the optimization results.
Assuming there are
m DC systems experiencing simultaneous commutation failure, the voltage stiffness expression considering the influence of other DC systems can be written as:
where
represents the voltage stiffness at the converter bus of DC
i when considering the impact of commutation failures of other DCs;
U0i is the normal voltage magnitude of DC
i under steady-state operation; and
Utri is the voltage magnitude at the converter bus of DC
i after fault clearance, assuming all DC systems experiencing commutation failure do not recover. To obtain
Utri, a simulated three-phase metallic short circuit fault can be applied at the converter bus of DC
i for 100 ms and then cleared while keeping the DC in commutation failure (non-recovering).
Substituting Equation (28) into (31), the voltage stiffness constraint for each DC can be expressed in terms of the active power command values of each DC system:
where
Kc is the critical voltage stiffness value.
From the above equation, the voltage stiffness constraint is simplified into a linear constraint concerning the active power command values of each DC system.
3.3. Day-Ahead Power Optimization Model for Multiple DC Links
The purpose of multi-DC power optimization is to find a DC power transmission scheme that meets load demand, ensures system frequency and voltage stability, and minimizes operational costs. The specific implementation involves establishing frequency stability constraints using a primary frequency regulation model to avoid frequency instability risks due to DC blocking, establishing voltage stability constraints using voltage stiffness to avoid voltage stability issues caused by mismatches between unit commitment and DC operation modes, and constructing an optimization model with the objective of minimizing AC system operating costs while meeting DC expected power as much as possible. Therefore, the optimization objective can be expressed as follows:
where
nd is the number of DC systems; Δ
Pdit is the deviation between the power of DC
i at time
t and its expected transmission power; and
μi is the penalty factor for not meeting the power expectation of DC
i.
The penalty factor μi represents the unit economic cost of power deviation for the DC i. In engineering practice, its value can be determined based on the transmission contract priority and the importance of the power supply area of each DC link. The stability constraints are treated as hard constraints to ensure the security bottom line, while the penalty term in the objective function reflects economic efficiency. In this paper, constant values of μi are adopted for simplicity in day-ahead scheduling. However, the proposed framework can be readily extended to allow μi to vary across time intervals (e.g., increasing the penalty during peak hours) to reflect time-dependent economic differences.
System operational constraints include:
where
Pdui and
Pdli are the upper and lower power limits of DC
i at time
t, respectively.
- 2.
Frequency Stability Constraint
Based on Equation (26), the frequency stability constraint can be rewritten as:
where
Dequt is the equivalent damping coefficient of the AC system at time
t;
Rgt is the equivalent droop coefficient of the AC system at time
t;
ζt is the damping ratio of the AC system’s primary frequency regulation at time
t;
ωnt is the oscillation frequency of the AC system’s primary frequency regulation at time
t; and
tNadirt is the time of the frequency nadir occurrence in primary frequency regulation at time
t.
- 3.
Voltage Stability Constraint
Based on Equation (32), the voltage stability constraint can be rewritten as:
where
Pbi and
Qbi are the rated active power and rated reactive power of DC
i, respectively.
The SCR, voltage stiffness, and other indicators used in this paper are widely accepted in the field of multi-infeed DC systems and have been validated in reports by international organizations such as CIGRE, as well as in numerous papers in this area. For extremely weak systems (SCR < 2) or hybrid systems containing a large number of VSCs, some indicators may require modification. However, this paper focuses on typical LCC-HVDC systems, and the proposed method remains representative.
4. Discussion
The Chinese Zhejiang Power Grid currently has three DC links: Binjin, Lingshao, and Baihetan–Zhejiang (Baizhe). Engineering data collected during the operation of the Zhejiang Power Grid indicates that the Summer Low-Load and Flood Low-Load operation modes exhibit poorer voltage and frequency stability compared to other modes. Therefore, the Summer Low-Load operation mode from 2025 is taken as an example for DC power optimization.
Pre-simulation results demonstrate that under the 2025 Summer Low-Load operation mode, the frequency drop exceeds 0.5 Hz during a bipolar block, indicating poor frequency characteristics. Thus, the primary goal of power optimization is to further enhance frequency stability to mitigate the frequency drop during DC blocking. Additionally, under this operation mode, the voltage recovery time exceeds 800 ms, indicating poor voltage recovery characteristics. Therefore, power optimization must also consider improving system voltage recovery characteristics.
According to data provided by Zhejiang Electric Power Company, before power optimization, the power levels of the DC links were as follows: Binjin DC: 8000 MW, Lingshao DC: 5500 MW, Baizhe DC: 8000 MW.
Based on the optimization model proposed in Equations (33)–(36), the transmission power of each DC link is optimized, resulting in the following optimized power levels: Binjin DC, 7740 MW; Lingshao DC, 7010 MW; and Baizhe DC, 6750 MW.
4.1. Voltage Stability Analysis Before and After Optimization
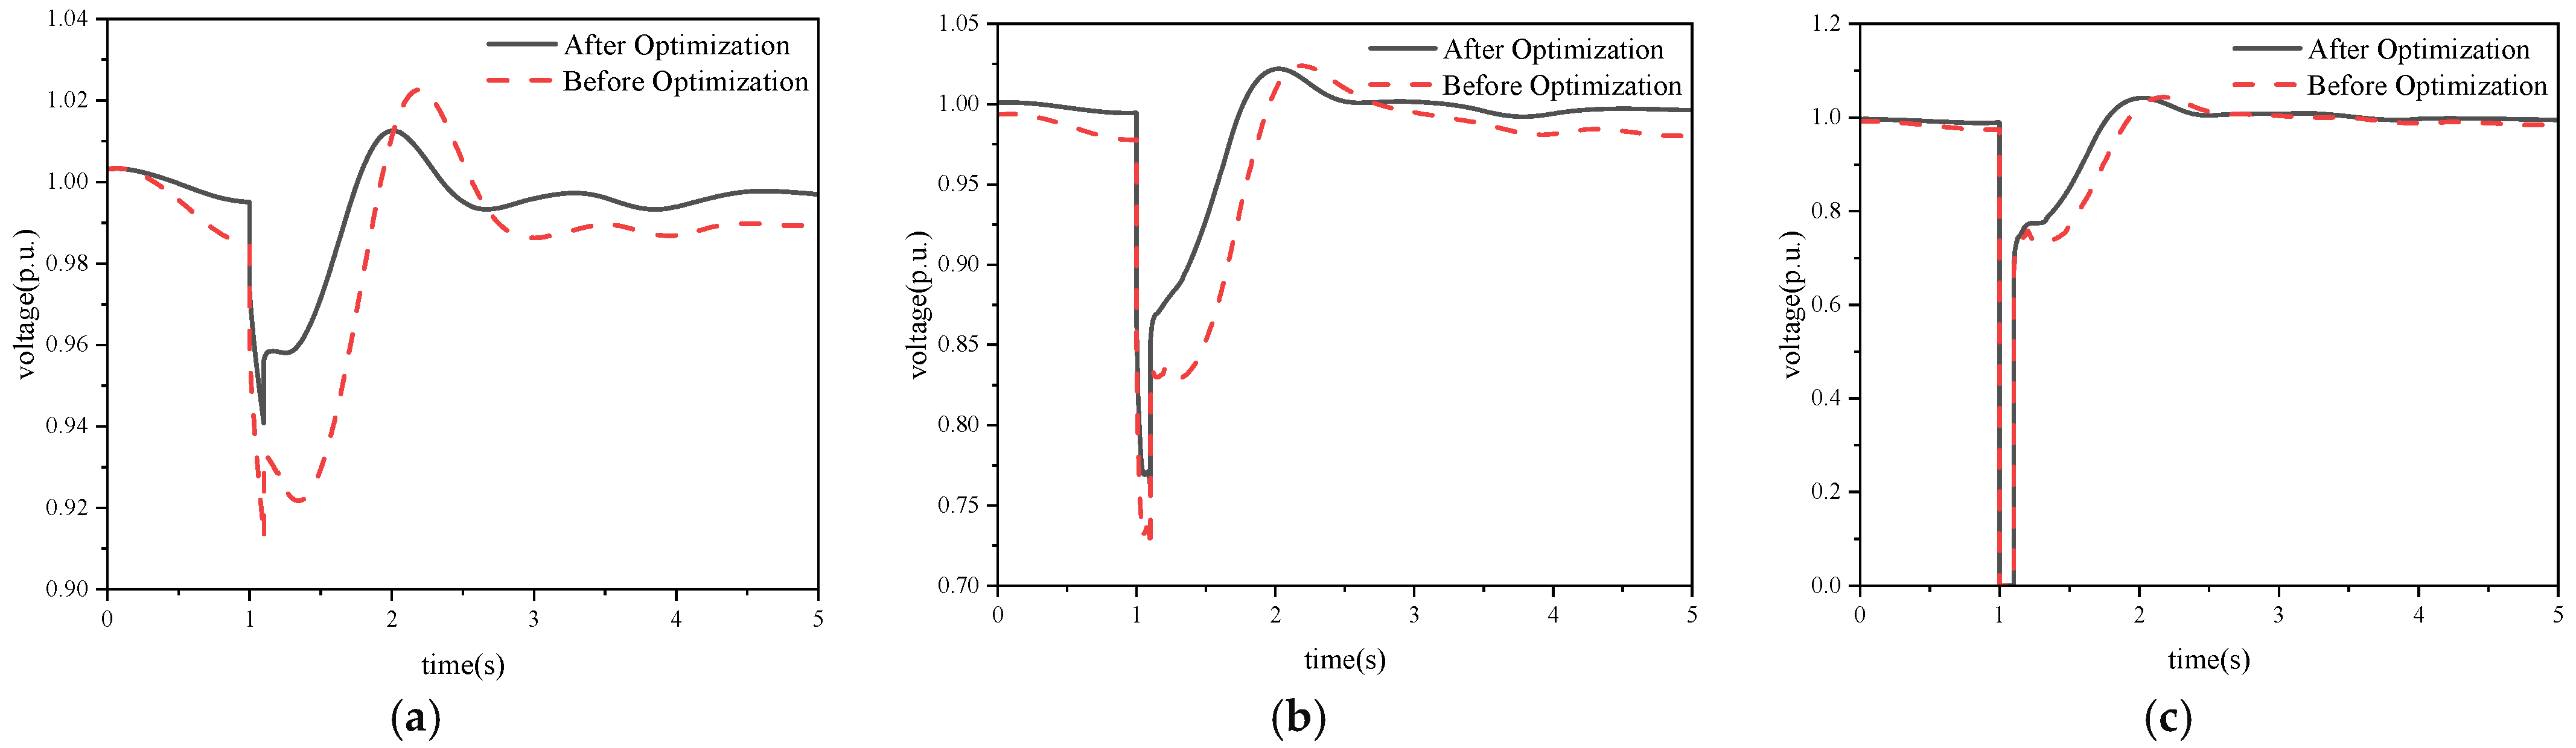
This subsection studies the voltage stability characteristics of the three DC links in the Zhejiang Power Grid under N − 1 or N − 2 faults on the inverter side of Binjin DC, Lingshao DC, and Baihetan–Zhejiang DC during the 2025 Summer Low-Load operation mode. Faults are applied at t = 1.0 s and cleared at t = 1.1 s. The converter buses Jinhua_525 (Binjin), Shaoxing_525 (Lingshao), and Zhebei_525 (Baizhe) are selected as the monitored buses for voltage stability analysis.
First, the voltage stiffness at each DC inverter-side bus within the Zhejiang province under the optimized 2025 Summer Low-Load mode is calculated using Equation (27) to evaluate the theoretical voltage stability. The specific results are shown in
Table 1. It can be observed that, after optimization, the voltage stiffness at each DC inverter-side bus in the 2025 Summer Low-Load mode is relatively high, indicating theoretically high voltage stability for these buses.
4.2. Comparison of Voltage and Power Recovery Waveforms Before and After Optimization
Taking the N − 1 or N − 2 faults at the inverter-side bus of the Baihetan-Zhejiang DC as an example for simulation verification, we consider the following.
Regarding N − 1 faults at the Zhebei_525 bus (Baizhe DC inverter side), a three-phase short circuit occurs at Zhebei_525. After 100 ms, the stability control device clears the two lines of the faulty circuit from Zhebei_525 to ZheRenhe_525. The simulation results are shown in the
Figure 6 and
Figure 7:
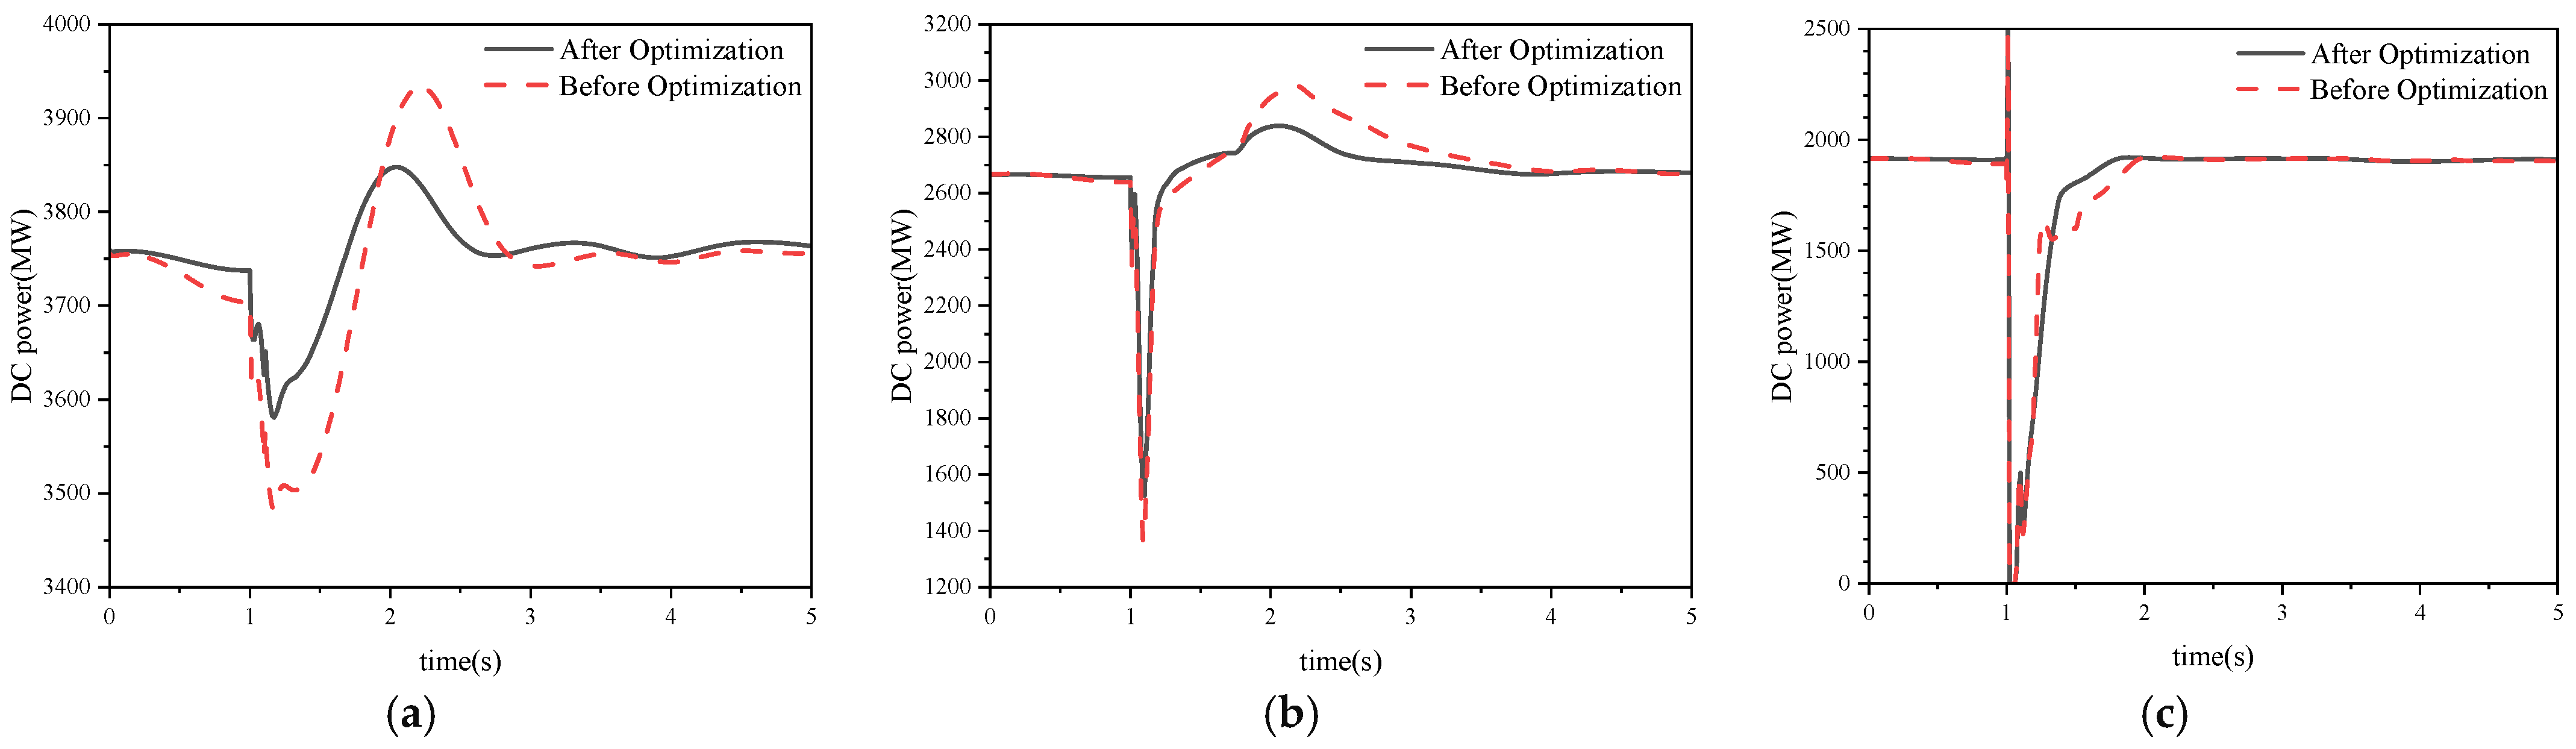
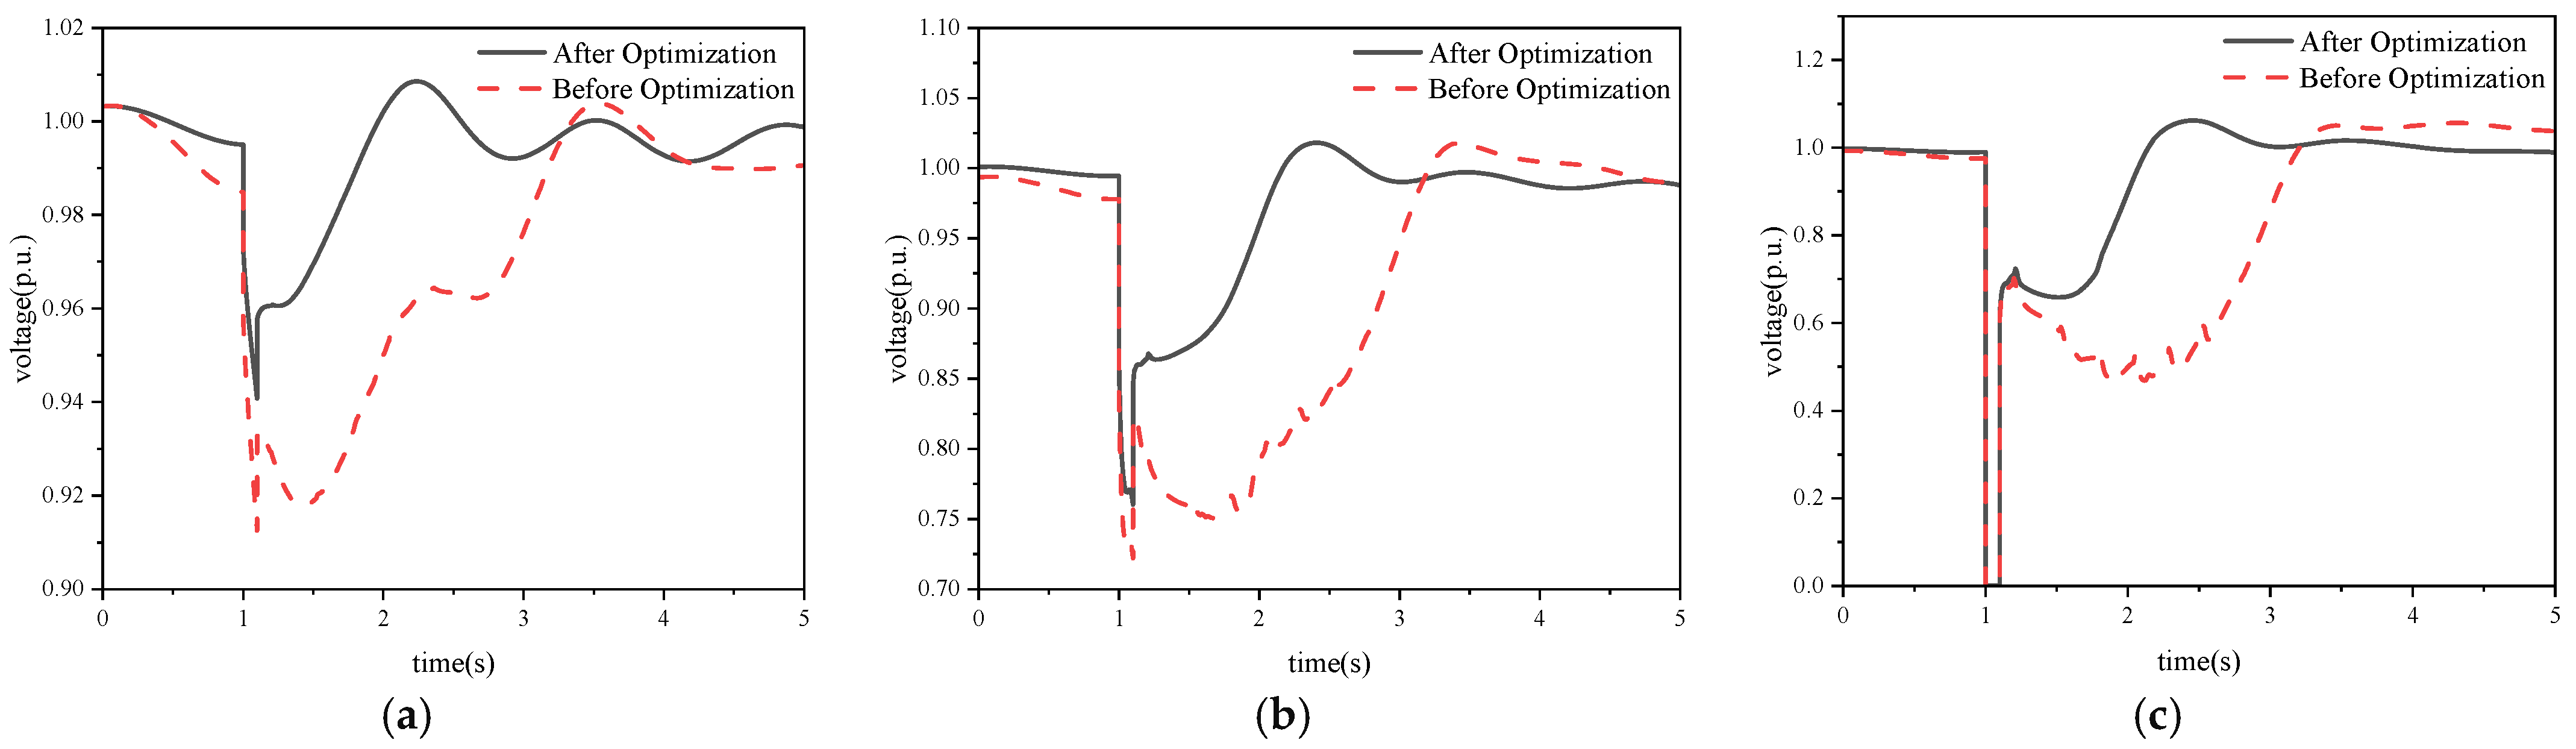
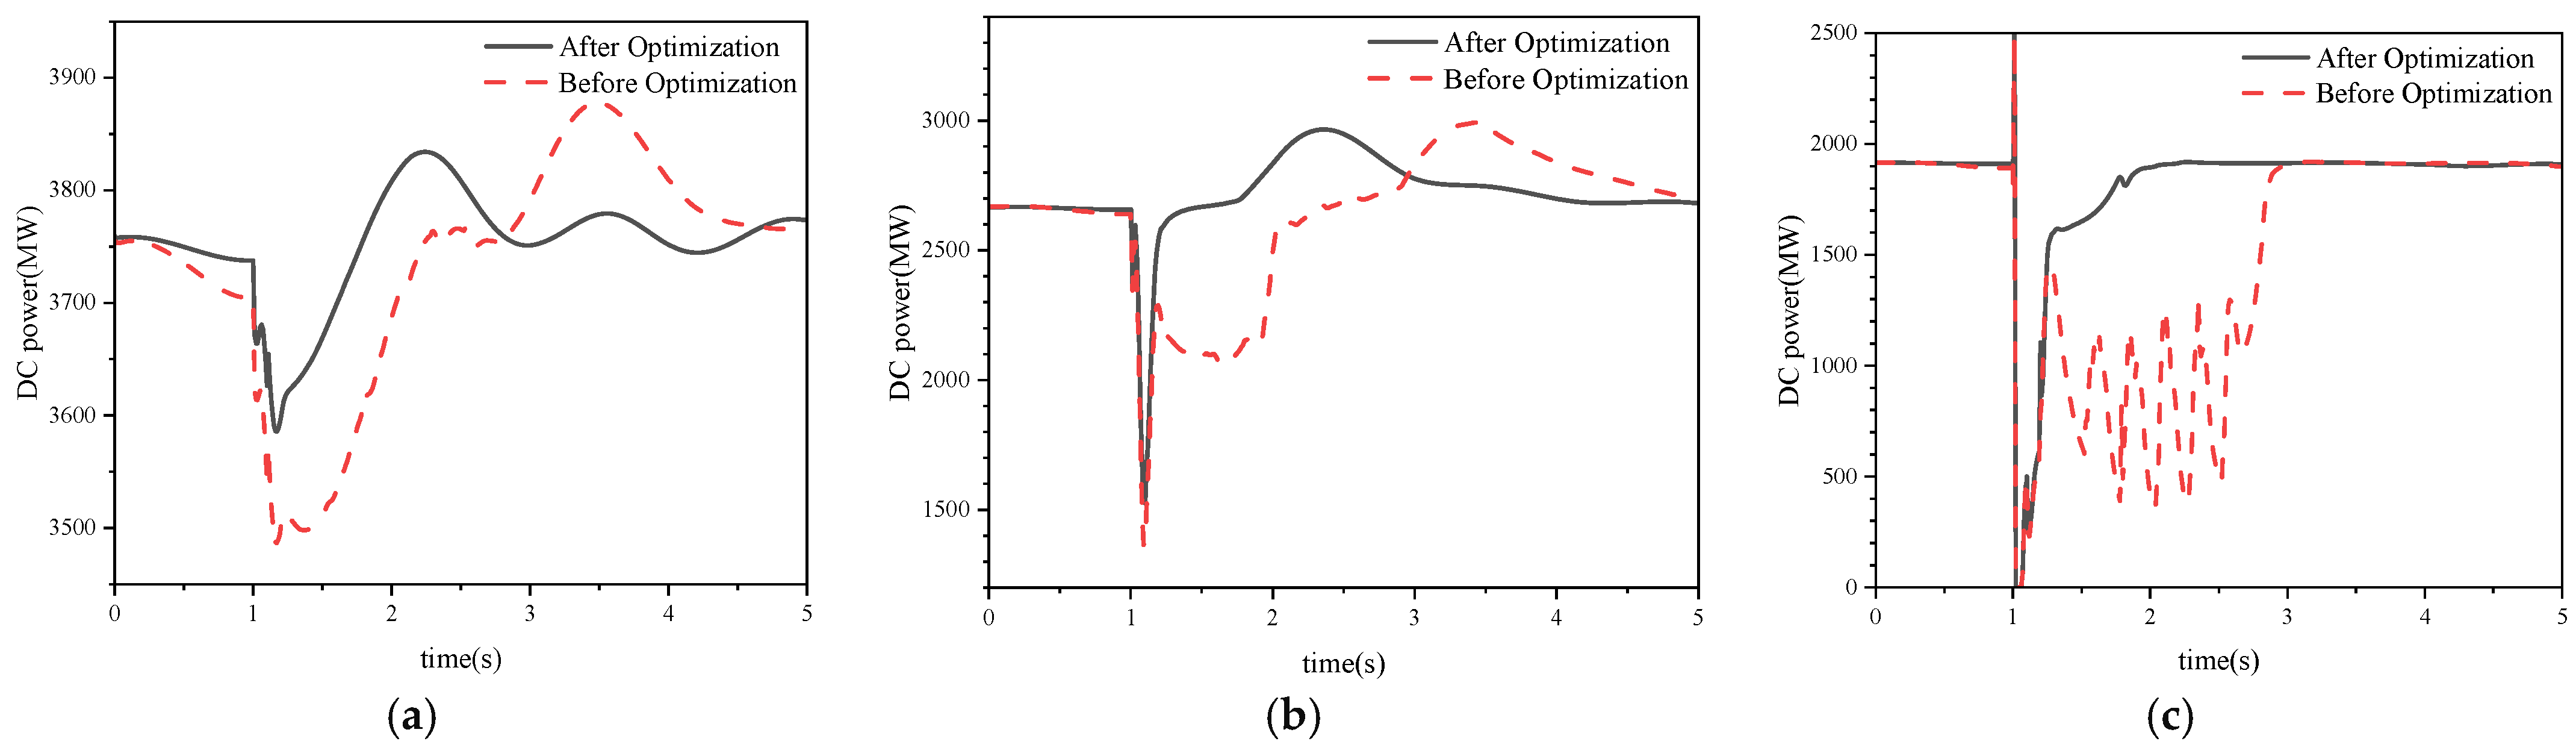
The figures show that immediately after fault clearing, the voltage level at Zhebei_525 recovers to 0.8 p.u., takes about 600 ms to rise, and returns to the normal range. About 800 ms after fault recovery, DC power recovers to 1.0 p.u., indicating relatively slow power recovery speed. Compared to pre-optimization results, the voltage level immediately after fault clearing and the recovery speed of DC power have both been improved to some extent.
Regarding N − 2 faults at the Zhebei_525 bus (Baizhe DC inverter side), a three-phase short circuit occurs at Zhebei_525. After 100 ms, the stability control device clears the two lines of the faulty circuit from Zhebei_525 to ZheRenhe_525. The simulation results are shown in the
Figure 8 and
Figure 9:
The figures show that immediately after fault clearing, the voltage level at Zhebei_525 recovers to 0.77 p.u., takes about 1050 ms to rise, and then returns to the normal range. About 820 ms after fault recovery, DC power recovers to 1.0 p.u., indicating relatively fast power recovery speed. Compared to pre-optimization results, the voltage level immediately after fault clearing and the recovery speed of DC power have both been significantly improved.
Similar operations are performed for the other two DC links. The calculated results for the 2025 Summer Low-Load operation mode are summarized in
Table 2.
Table 2 shows that for an AC fault on the receiving end of the Baizhe DC, the voltage and DC power recovery characteristics are the poorest, followed by Binjin DC, while Lingshao DC exhibits the best recovery characteristics. Compared to pre-optimization results, the voltage level immediately after fault clearing and the recovery speed of DC power for Binjin DC and Baizhe DC have both improved, demonstrating the significant effectiveness of the power optimization. The recovery speed of Lingshao DC remains essentially unchanged.
To verify the robustness of the optimization method proposed in this paper, the electrical distance between the fault location and the DC inverter-side bus was also varied, and the impact of different fault locations on the optimization method was briefly tested. The results show that the optimized voltage and power recovery characteristics are improved under different fault scenarios, and the degree of improvement is closely related to the electrical distance of the fault location, with the most significant improvement observed for faults near the inverter-side area.
4.3. Frequency Stability Analysis Before and After Optimization
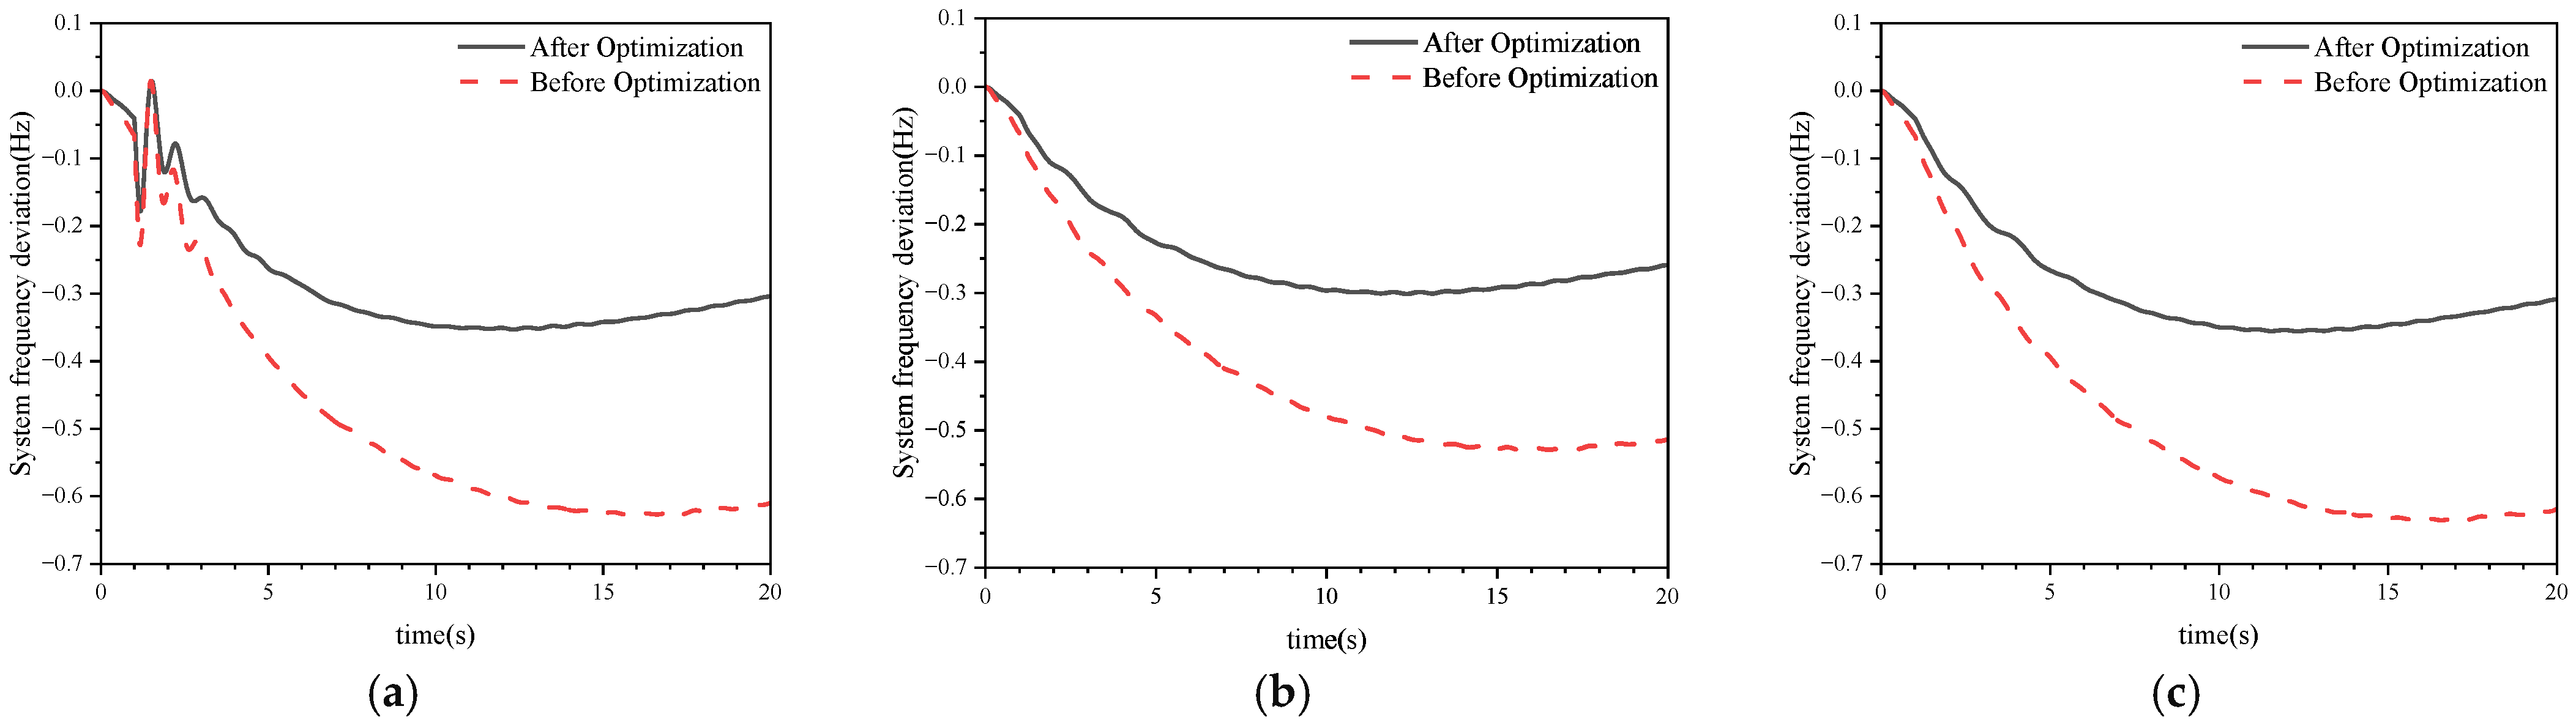
Single-pole blocks are applied to Binjin DC, Lingshao DC, and Baizhe DC. The system frequency response curves for these DC blocking faults are analyzed.
Binjin DC experiences a single-pole block at t = 1.0 s, resulting in a power loss of 3870 MW. The system frequency response curve is shown in
Figure 10a. It can be seen that the system frequency decreases by a maximum of 0.35 Hz. Compared to pre-optimization results, the frequency response characteristic of the system during a single-pole block of Binjin DC has improved.
Lingshao DC experiences a single-pole block at t = 1.0 s, resulting in a power loss of 3505 MW. The system frequency response curve is shown in
Figure 10b. It can be seen that the system frequency decreases by a maximum of 0.29 Hz. Compared to pre-optimization results, the frequency response characteristic of the system during a single-pole block of Lingshao DC has slightly decreased.
Baizhe DC experiences a single-pole block at t = 1.0 s, resulting in a power loss of 3375 MW. The system frequency response curve is shown in
Figure 10c. It can be seen that the system frequency decreases by a maximum of 0.34 Hz. Compared to pre-optimization results, the frequency response characteristic of the system during a single-pole block of Baizhe DC has significantly improved.
Based on the comprehensive results above, the overall system frequency response characteristic has improved after power optimization, indicating that the method proposed in this paper effectively enhances system frequency characteristics.
To verify the sensitivity of the optimization results to the selection of key system parameters, further analysis can be conducted by varying the frequency deviation threshold and the SCR level in the optimization conditions. The results show that when the frequency threshold is tightened to 0.4 Hz, some DC links require further power adjustments; when the SCR is reduced by 10%, the voltage stiffness constraint becomes the primary limitation. Overall, the optimization results are relatively sensitive to variations in the SCR, but insensitive to changes in the frequency threshold within the range of 0.45–0.55 Hz.