


Abstract
Dropout prediction in Massive Open Online Courses (MOOCs) has been extensively studied, yet existing systems share three fundamental limitations: Accurate models are black boxes, post-hoc explanations approximate rather than faithfully represent model decisions, and predictions are rarely translated into concrete instructor actions. This paper presents NeSy-Drop, a neuro-symbolic framework that simultaneously addresses prediction, explanation, and personalized intervention routing for MOOC dropout. NeSy-Drop constructs a heterogeneous graph per course cohort encoding student–resource–assessment interactions, processed through a heterogeneous graph transformer encoder, five behavioral atom predictor MLPs, and a differentiable symbolic rule layer producing guaranteed faithful ante-hoc explanations. A three-level explainability stack provides symbolic rule chains, SHAP embedding attribution, LIME raw-feature importance, and gradient-based counterfactual prescriptions. Each at-risk student is routed to one of five concrete interventions at one of three severity levels. Evaluated on OULAD covering 32,593 students across 22 cohorts, NeSy-Drop achieves AUC of 0.961 and macro F1 of 0.8983, within 2.2% AUC of the best non-interpretable baseline under a fair evaluation protocol, while being the only system that simultaneously predicts, explains, and prescribes actions at the individual student level.
1. Introduction
Massive Open Online Courses (MOOCs) have expanded access to education at a global scale, yet completion rates remain a persistent challenge, commonly falling between 4% and 15% across platforms and course types [1,2]. Recent surveys confirm that dropout rates in MOOCs consistently range between 80% and 95%, making early identification of at-risk students one of the most studied problems in learning analytics [3]. Early intervention, when paired with accurate risk signals, has been shown to improve retention—but this requires prediction systems that are not merely accurate but interpretable and actionable.
The machine learning literature on dropout prediction has grown substantially in recent years. Ensemble approaches have demonstrated strong performance by combining multiple base learners for in-session dropout prediction [4,5].
Heterogeneous graph neural networks (HetGNNs) have shown that modeling the relational structure between entities—such as customers, products, and orders in retail settings—yields predictive gains over tabular baselines [6], a structural analogy that directly motivates our student–resource–assessment graph construction. Furthermore, as the need for transparency grows, explainable AI (XAI) techniques have been increasingly applied to educational prediction models to identify the key factors driving student success [7]. To bridge the gap between high predictive performance and practical educational support, recent studies emphasize using these local XAI explanations to design actionable, personalized intervention strategies, such as targeted remedial tutoring for individual students [8].
Despite these advances, three fundamental limitations persist. First, the most accurate models remain black boxes whose predictions cannot be explained in terms that educators can understand or act upon. Second, post hoc explanation methods produce approximations of model behavior rather than faithful accounts of the actual computation—a distinction that matters in high-stakes educational decisions. Third, and most critically, existing systems stop at risk scoring. A recent review of XAI in education highlights that utilizing local and counterfactual explanations is highly effective for providing personalized feedback and addressing students’ individual needs [9]. As argued by [8], predictions without explanations are not actionable—educators cannot intervene effectively if they do not understand why a student was flagged. A prescriptive learning analytics framework that unifies prediction, explanation, and recommended action has been identified as the next necessary step [10], yet the literature currently lacks a unified framework that successfully translates this into practice for MOOC dropout prediction.
We address all three limitations simultaneously through NeSy-Drop—a neuro-symbolic dropoutprediction framework. The key insight is that dropout behavior can be decomposed into a small set of interpretable behavioral alarms, which we term atoms, whose conjunctions capture the dominant pathways to disengagement. By making these atoms explicit learnable components of the model architecture rather than post hoc constructs, we achieve explanations that are guaranteed faithful by construction. Furthermore, by routing each at-risk student through a deterministic intervention engine grounded in the fired atom pattern, we bridge the gap between prediction and action that characterizes existing systems.
This paper investigates three research questions:
- Can a neuro-symbolic graph learning approach achieve competitive dropout prediction accuracy compared to state-of-the-art baselines under a fair evaluation protocol that controls for atom feature access?
- Does the integration of a differentiable symbolic rule layer provide faithful, educationally meaningful explanations without significantly sacrificing predictive performance?
- Can the system translate dropout predictions into personalized, data-driven intervention recommendations that are directly actionable for instructors without requiring additional infrastructure?
The specific contributions of this paper are as follows:
- A heterogeneous graph representation of MOOC learning environments encoding three node types (students, VLE resources, assessments) and four typed edge relations (accessed, submitted, missed, co_accessed) that capture the full relational structure of student learning behavior within a single unified graph per course cohort.
- A differentiable neuro-symbolic architecture (NeSy-Drop) that jointly learns a heterogeneous graph transformer encoder, five behavioral atom predictors, and eight weighted conjunctive rules in an end-to-end differentiable pipeline, trained via a three-phase curriculum that ensures behavioral grounding of the atom layer.
- A three-level explainability stack providing ante hoc symbolic explanations guaranteed faithful by construction, SHAP [11] attribution over the learned 128-dimensional student embeddings, LIME [12] explanations over raw input features, and gradient-based counterfactual prescriptions.
- An actionable intervention routing engine that maps each at-risk student to one of five concrete interventions—resource recommendation, instructor escalation with counterfactual prescription, assessment score support, VLE reengagement nudge, or peer matching via embedding similarity—at one of three severity levels.
- Comprehensive evaluation on all 32,593 students across 22 OULAD cohorts [13] under a fair baseline comparison protocol, demonstrating that the interpretability cost of NeSy-Drop over the best black-box baseline is only 2.2% AUC.
2. Related Work
2.1. Dropout Prediction in MOOCs
Dropout prediction in MOOCs has been studied extensively over the past decade, with the Open University Learning Analytics Dataset (OULAD) [13] serving as the primary benchmark for comparative evaluation. Early approaches relied on classical machine learning methods applied to tabular student features, with logistic regression, random forests, and gradient boosting representing the dominant paradigm for MOOC dropout prediction. Ensemble stacking approaches have extended these methods through more sophisticated combination strategies: Alghamdi et al. [4] proposed ISELDP, a stacked ensemble combining AdaBoost, random forest, XGBoost, and gradient boosting with an MLP meta-learner, achieving 88% accuracy under in-session evaluation conditions on a language learning dataset. A complementary study by the same group [5] introduced a hybrid genetic algorithm and correlation-based feature selection framework, reporting improvements of up to 22% in prediction accuracy over standard stacked ensemble methods. Demographic features have also been shown to carry independent predictive signal: Swacha and Muszyńska [14] demonstrated that student demographic characteristics alone can predict dropout in programming MOOCs with competitive accuracy. Finally, Panagiotakopoulos et al. [15] applied supervised machine learning with hyperparameter optimization for early MOOC dropout prediction, establishing a strong non-graph tabular baseline.
Beyond classical methods, deep learning approaches have been applied to capture temporal engagement patterns. Recurrent neural networks and LSTM-based models have demonstrated that exploiting sequential patterns in semester records improves dropout prediction over summary-based approaches [16]. Zanellati et al. [17] compared random forest and a feature tokenizer transformer on academic dropout prediction, finding that while transformer-based models achieve higher accuracy, they require post hoc SHAP explanations to remain interpretable—a limitation that NeSy-Drop addresses through ante hoc symbolic rules. Comprehensive surveys confirm that ensemble methods achieve 85–92% prediction accuracy across reviewed studies, while deep learning approaches offer marginal gains at substantially higher complexity [3].
2.2. Graph-Based Learning Analytics
Graph neural networks (GNNs) have emerged as a promising direction for student modeling by capturing the relational structure of learning environments rather than treating each student as an independent observation. Early graph-based approaches applied GNN classification directly to student interaction graphs constructed from VLE clickstream data [18], illustrating how graph-structured representations of behavioral data carry predictive signal—such as repetitive learning loops—that non-graph approaches struggle to encode. More recently, Roh et al. [19] proposed SIG-Net, a GNN-based framework that explicitly models student interaction graphs for dropout prediction, showing that relational modeling of student–course interaction patterns yields consistent gains over ML and deep learning baselines.
Heterogeneous graph architectures have demonstrated particular promise in educational settings by modeling multiple entity types simultaneously. Wu et al. [20] introduced a course recommendation method based on meta-path embedding in heterogeneous graphs over students and courses, showing that multi-relational graph structures outperform single-type interaction models in online learning environments. Relation-aware heterogeneous GNNs have profiled MOOC learners by predicting demographics from interaction graphs, filling data gaps for personalized interventions [21]. The structural parallel between these educational heterogeneous graphs and our student–resource–assessment graph is direct: In both cases, the prediction target is a node whose behavioral profile is defined by its typed interaction history with multiple heterogeneous neighboring entities.
Despite these advances, existing graph-based approaches share two fundamental limitations. First, they produce only predictions or rankings without symbolic explanations of why a particular student was flagged. Second, none of them integrate an intervention routing engine that translates graph embeddings into concrete, actionable recommendations. NeSy-Drop addresses both limitations by augmenting the GNN encoder with a differentiable symbolic rule layer and a data-driven intervention engine.
2.3. Explainable AI in Educational Prediction
The application of explainable AI to educational prediction has grown substantially in recent years, driven by recognition that black-box predictions are insufficient for high-stakes educational decisions [9].
SHAP and LIME have emerged as the dominant post hoc explanation methods in this domain.
Ujkani et al. [7] applied SHAP to OULAD success prediction models, demonstrating that granular behavioral indicators—such as student engagement volume and registration timelines—are the most influential factors in determining academic outcomes. Mustofa et al. [22] proposed an HLRNN model (96% acc.) for dropout risk, integrating classifiers with SHAP/LIME insights to meet growing demands for transparent systems usable by practitioners. Melo et al. [23] evaluated XAI methods for school dropout prediction and proposed a dedicated explainability index to assess XAI frameworks in educational data science, underscoring the need for standardized transparency criteria in this domain.
Counterfactual explanations have been explored as a more actionable alternative to feature attribution methods. Guisñan et al. [24] proposed group counterfactual explanations for OULAD dropout prediction using the DiCE algorithm with K-means clustering, demonstrating that minimal behavioral changes can collectively recover large groups of at-risk students. Nagy et al. [8] conducted a user study with students and decision-makers, demonstrating that XAI tools including permutation importance, PDP, LIME, and SHAP support educational stakeholders and enable personalized feedback by highlighting which behaviors need improvement.
A critical limitation shared by all post hoc explanation approaches is that they approximate model behavior rather than faithfully representing it. Tiukhova et al. [25] demonstrated that SHAP explanations can be unstable across changing educational contexts, raising questions about their reliability for consequential decisions. This instability is further supported by work on GNN explainability: Li et al. [26] showed that generative explainers for GNNs face significant faithfulness challenges, as existing methods often produce explanations tied to specific instances with limited generalizability. NeSy-Drop addresses this fundamental limitation through ante hoc symbolic explanations that are guaranteed faithful by construction—the rule chain is the computation, not an approximation of it.
2.4. Neuro-Symbolic AI
Neuro-symbolic AI integrates neural learning with symbolic reasoning to produce models that are both accurate and interpretable by design, addressing a fundamental limitation of purely connectionist approaches: their inability to provide structured, human-understandable justifications for their predictions. Recent surveys confirm that this integration represents one of the most active frontiers in AI research, combining the pattern recognition strengths of neural networks with the logical transparency of symbolic systems [27].
In the educational domain, Hooshyar et al. [28] introduced a neural-symbolic AI approach for modeling learners’ computational thinking by incorporating symbolic educational knowledge in the form of rules into deep neural network construction and extracting hidden knowledge from trained networks to explain predictions. Their approach demonstrated that integrating symbolic educational knowledge with neural learning produces more interpretable and trustworthy predictions than post hoc explanation of unconstrained models—a finding that directly motivates the atom-grounded rule layer in NeSy-Drop. Despite this promising direction, applications of neuro-symbolic AI in education remain limited: Existing work has primarily focused on incorporating fixed symbolic knowledge as a prior into neural architectures, rather than jointly learning both the neural representations and the symbolic rules from data.
NeSy-Drop advances this direction in three ways. First, rather than treating symbolic rules as fixed priors, NeSy-Drop jointly learns rule weights and atom probabilities from data via a differentiable rule layer, allowing the symbolic structure to adapt to cohort-specific dropout patterns while retaining its interpretable conjunctive form. Second, the atom predictors are supervised against behaviorally validated ground-truth labels, ensuring that the learned symbolic representations remain grounded in educationally meaningful behavioral definitions throughout training. Third, the symbolic layer produces ante hoc explanations—guaranteed faithful by construction—rather than the post hoc rule extraction used in prior educational neuro-symbolic work.
3. Methodology
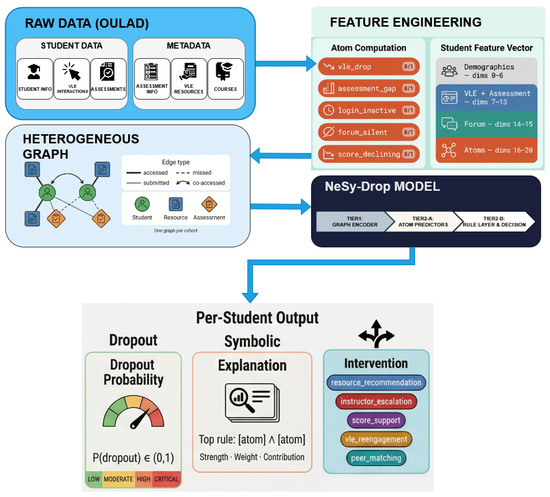
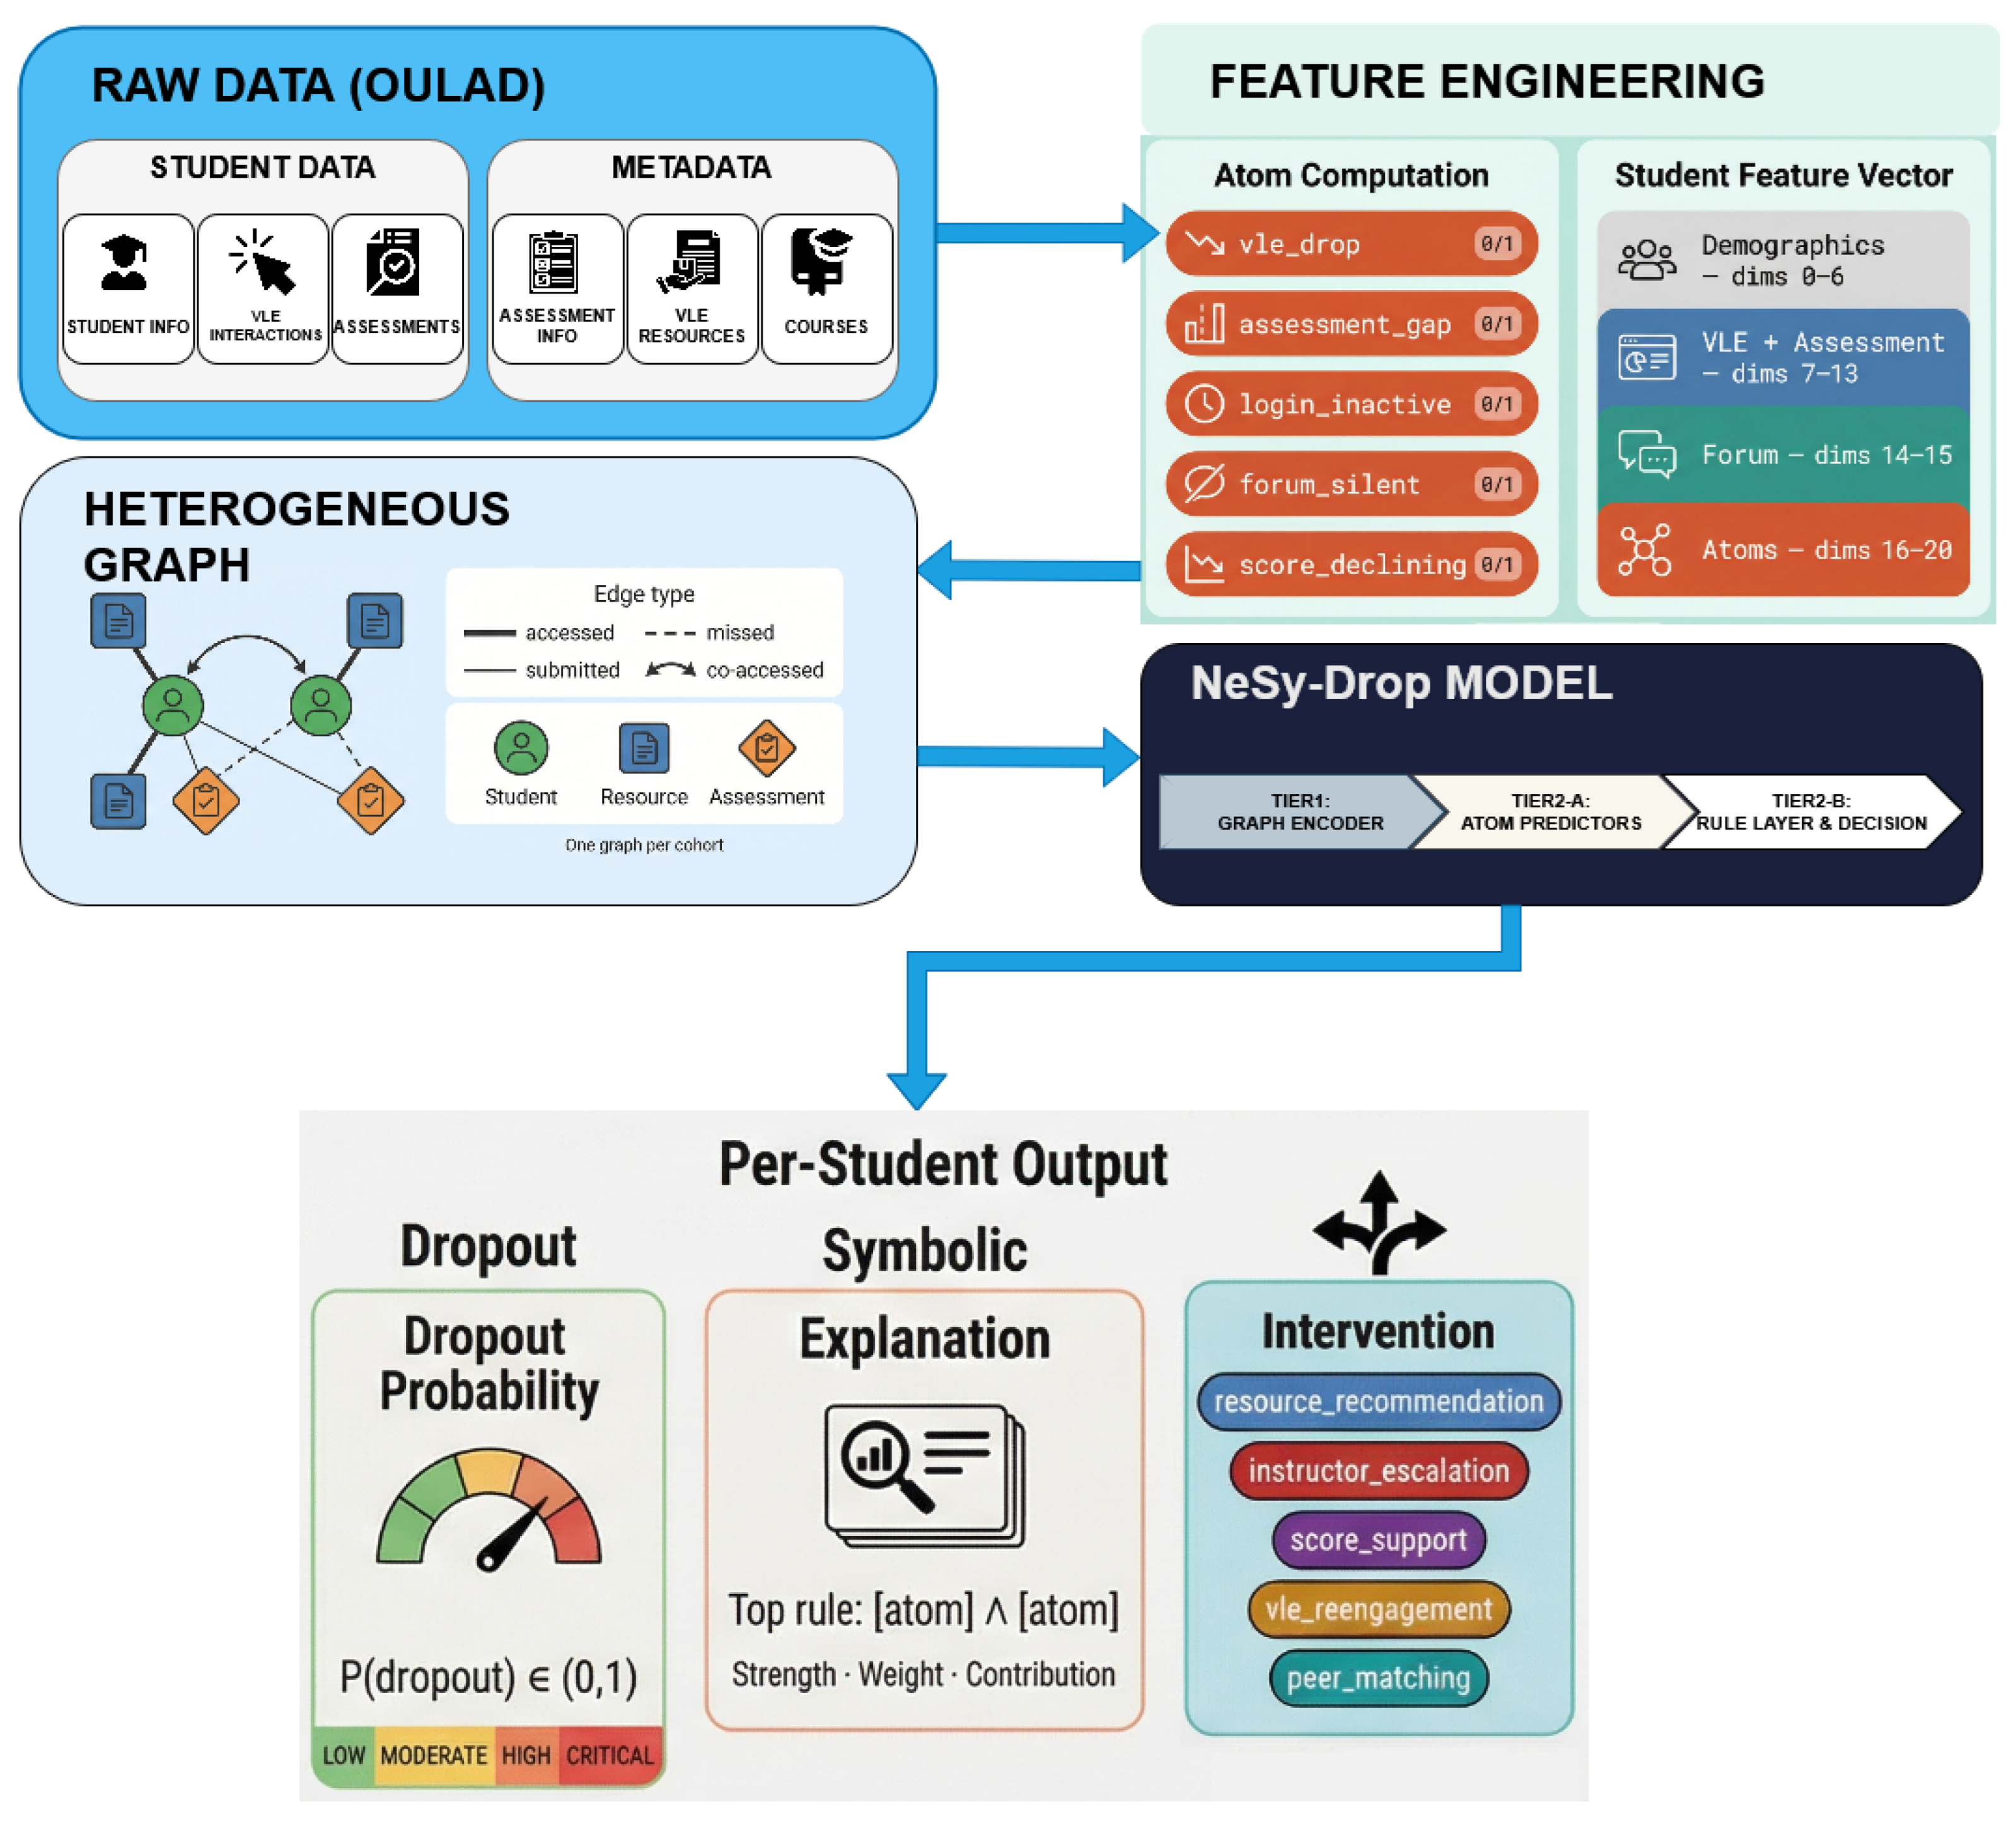
This section presents the complete NeSy-Drop framework for interpretable dropout prediction and personalized intervention in MOOCs. The pipeline comprises five sequential stages, as illustrated in Figure 1: raw data collection from the OULAD dataset [13], feature engineering producing a 21-dimensional student feature vector and five binary behavioral atoms, heterogeneous graph construction encoding student–resource–assessment interactions across 22 course cohorts, a three-tier neuro-symbolic model that jointly learns graph representations, behavioral atom predictions, and differentiable symbolic rules, and a per-student output engine that delivers a calibrated dropout probability, a three-level explanation, and a routed intervention recommendation. Each stage is described in detail in the following subsections.
Figure 1.
Conceptual overview of the NeSy-Drop pipeline, illustrating the flow from raw OULAD data through feature engineering and heterogeneous graph construction to the three-tier neuro-symbolic model and per-student output. This schematic is intended as a high-level system diagram rather than an empirical results figure.
3.1. Dataset
We conduct all experiments on the Open University Learning Analytics Dataset (OULAD) [13], a large-scale publicly available dataset from the UK Open University covering 32,593 students enrolled across 7 course modules and 22 course-cohort presentations over the academic years 2013–2014. Six relational tables are used: studentInfo (demographics and final outcomes), studentVle (click-level VLE interaction logs), studentAssessment (submission records and scores), assessments (assessment metadata), vle (resource metadata), and courses (course duration).
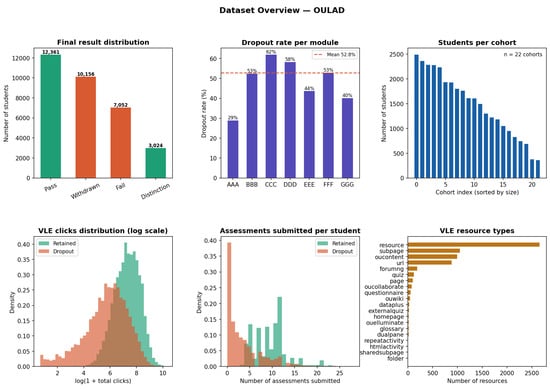
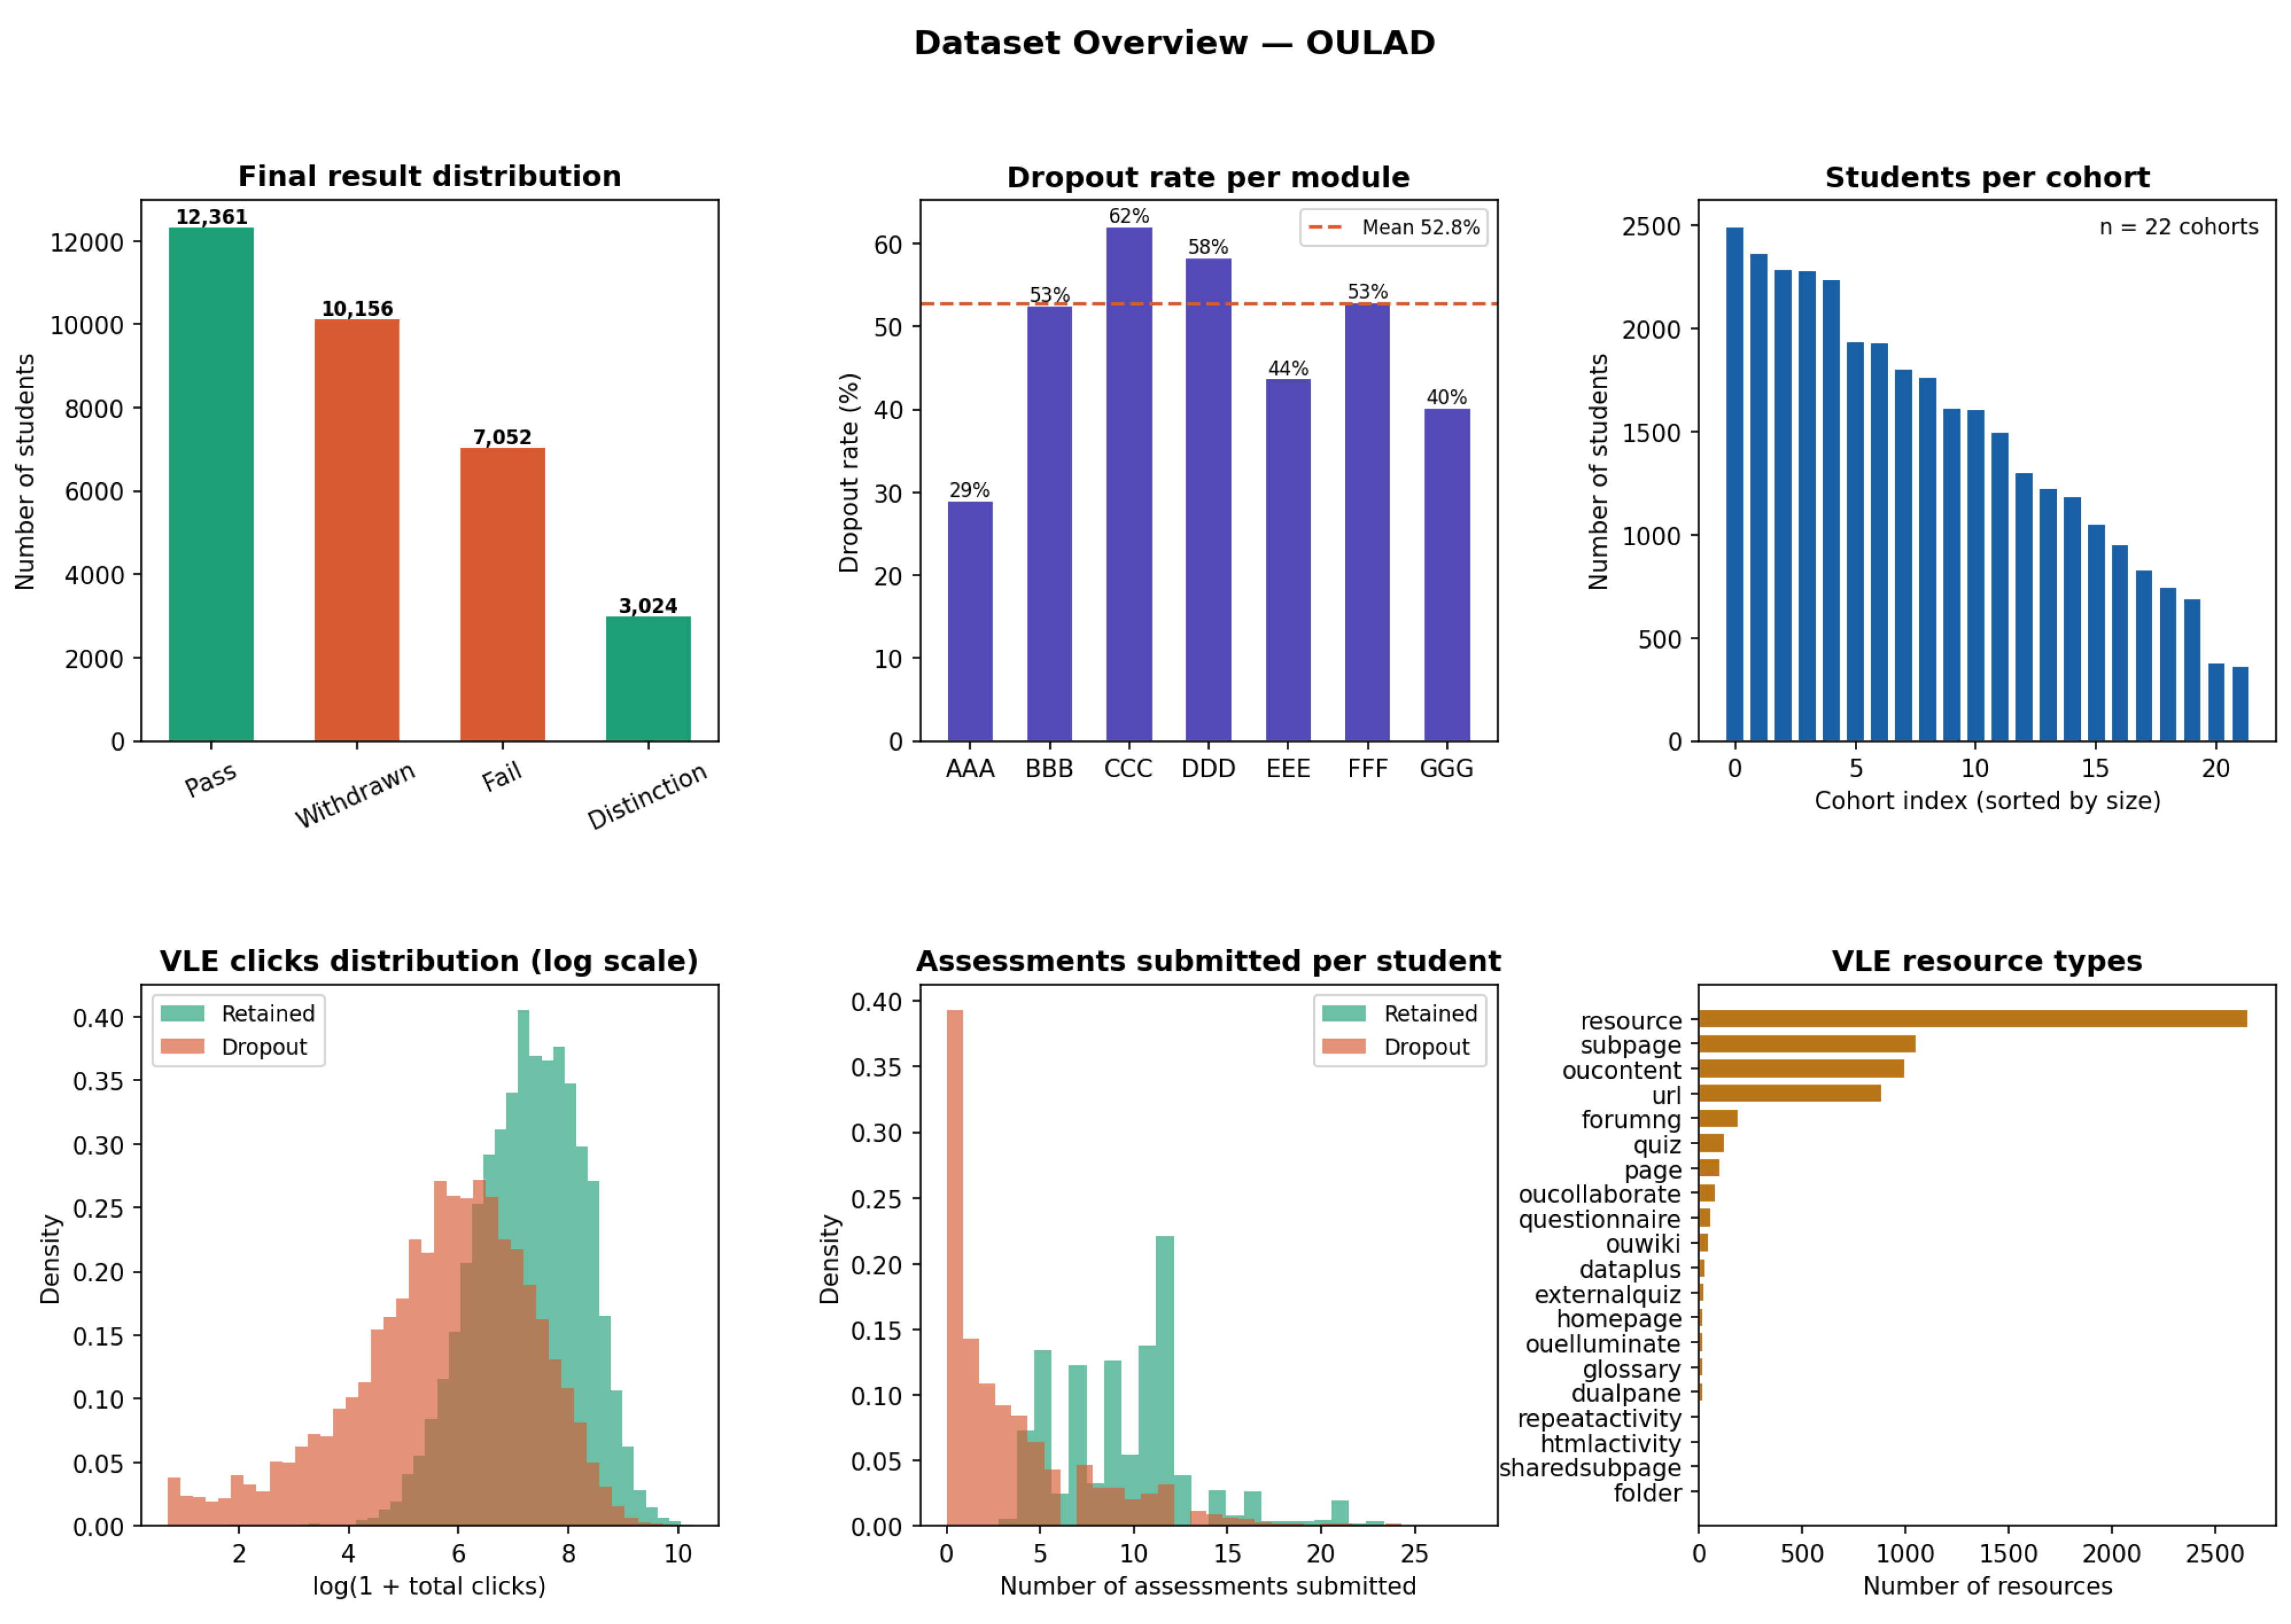
The dropout label is defined as a binary outcome: A student is considered a dropout if their final result is Withdrawn or Fail, and retained otherwise. Under this definition, 17,208 students (52.8%) are dropouts, and 15,385 (47.2%) are retained. Dropout rates vary substantially across modules, ranging from 29% (AAA) to 62% (CCC), and cohort sizes range from 357 to 2481 students, motivating our cohort-level graph construction strategy described in Section 3.3. Figure 2 provides a comprehensive overview of the dataset statistics.
Figure 2.
Overview of the OULAD dataset: outcome distribution, per-module dropout rates (29–62%), cohort size variation across 22 cohorts, VLE engagement patterns, assessment submission behavior, and resource type distribution for 32,593 students.
3.2. Feature Engineering
3.2.1. Behavioral Atom Engineering
A central contribution of NeSy-Drop is the encoding of student dropout risk through five interpretable binary behavioral constructs, which we term atoms. Each atom is a threshold-based binary indicator derived from raw interaction logs, designed to capture a distinct and educationally meaningful dimension of at-risk behavior. Table 1 summarizes the five atoms with their thresholds, lift values, and population coverage.
Table 1.
Behavioral atom definitions with thresholds, lift (dropout firing rate/retained firing rate), and population coverage.
Thresholds were set a priori based on educational domain reasoning rather than data-driven optimization and were validated post hoc using the lift metric reported in Table 1. Specifically, the 30% zero-click week threshold for vle_drop reflects the pedagogical principle that missing more than one-third of course weeks represents systematic rather than occasional disengagement; the 60% submission threshold for assessment_gap corresponds to completing fewer than three out of every five graded tasks, a level at which course completion becomes practically unlikely; the 30-day inactivity threshold for login_inactive was chosen to distinguish deliberate withdrawal from holiday absences typical in OULAD courses of 234–269 days duration; the 90-day forum silence threshold for forum_silent targets students who were previously active but withdrew from social engagement in the final course phase, avoiding false positives from students who never used forums at all; and the pts/assessment slope threshold for score_declining was set to capture meaningful academic deterioration rather than within-normal score fluctuation on the 0–100 scale. Thresholds were deliberately kept at round values to preserve interpretability for educational practitioners.
To assess the sensitivity of these threshold choices, we varied each atom threshold independently within a range (five levels: , , , , and of the base value) and evaluated the resulting AUC using a random forest classifier under the same cohort-based train/test split. Table 2 reports the full results across all 25 configurations. The maximum AUC deviation from the baseline configuration across all atoms and all threshold variations is , confirming that the reported performance is not sensitive to the specific threshold choices within this range. This robustness is consistent with the high lift values of the atoms—particularly assessment_gap ()—which indicate that the underlying behavioral signal is strong enough to remain discriminative across a range of threshold values.
Table 2.
Threshold sensitivity analysis: RF AUC when each atom threshold is varied by while all other thresholds remain fixed at their base values. The 0% column corresponds to the base configuration used throughout the paper.
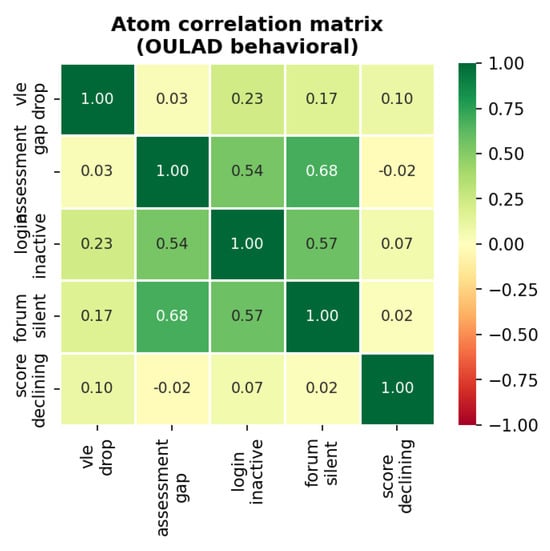
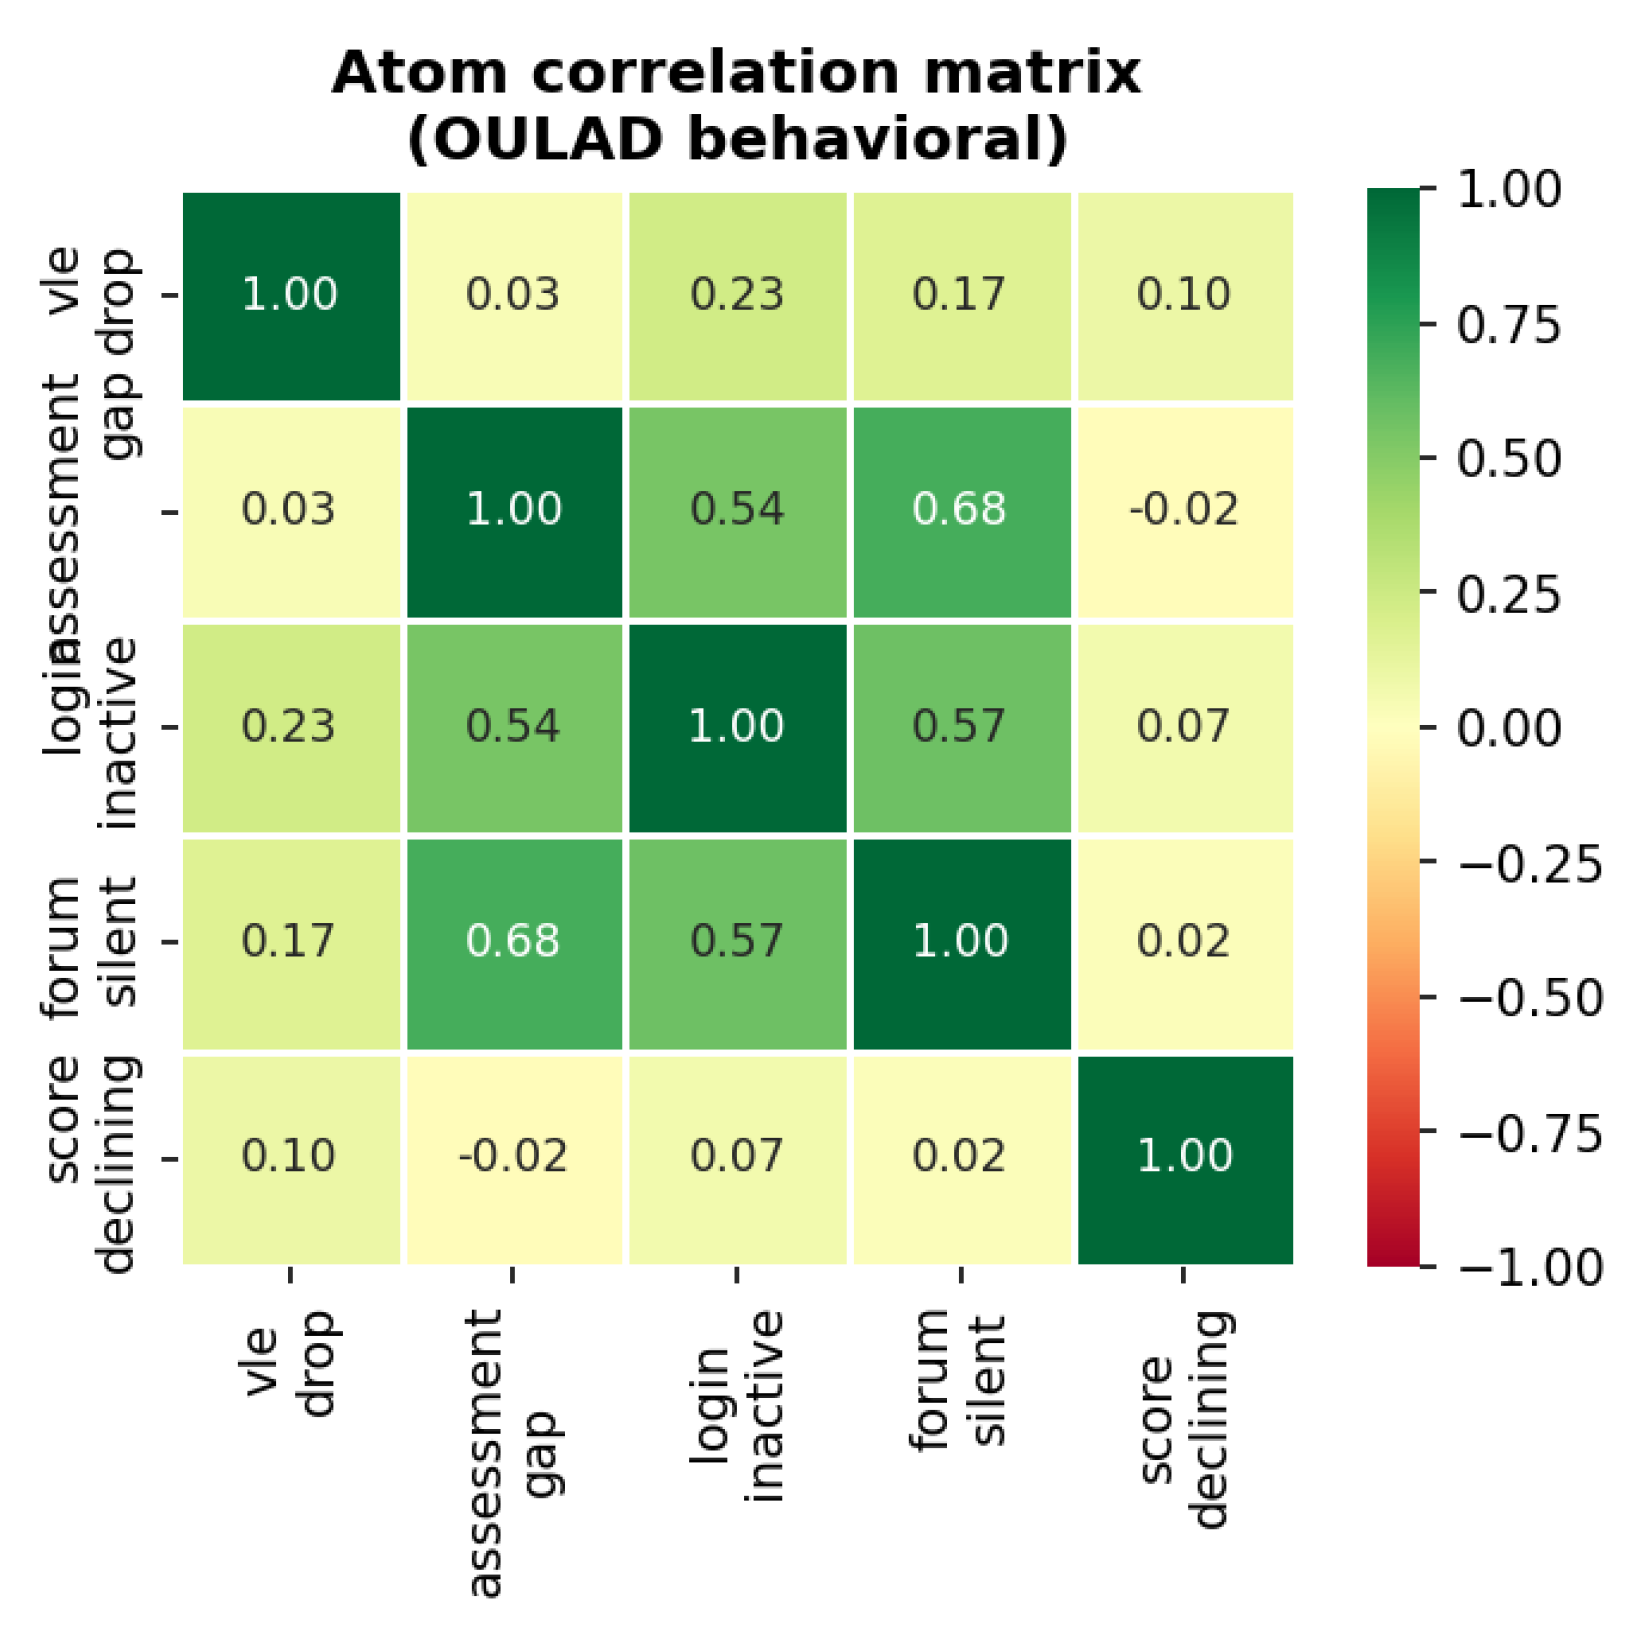
The discriminative validity of each atom is confirmed by the lift metric—the ratio of the atom firing rate among dropout students to that among retained students—with values ranging from (vle_drop) to (assessment_gap). The inter-atom correlation matrix in Figure 3 reveals that assessment_gap and forum_silent are moderately correlated (), while score_declining is near-independent of all other atoms (), confirming that it captures a qualitatively distinct dropout pathway and justifying its inclusion as a dedicated atom rather than a derived signal.
Figure 3.
Inter-atom correlation matrix (Pearson r) across the five behavioral atoms, computed over all 32,593 students.
3.2.2. Student Feature Vector
Each student is represented by a 21-dimensional normalized feature vector grouped into four categories. All continuous features are normalized to .
Demographic features (dimensions 0–6) encode gender, disability status, education level (ordinal, 5 levels), age band (ordinal, 3 groups), IMD deprivation index, number of prior course attempts, and studied credits.
VLE engagement features (dimensions 7–10) are computed from studentVle.csv: log-transformed total click count, number of active login days, click span defined as the number of days between first and last login, and log-transformed daily click rate.
Assessment performance features (dimensions 11–13) are derived from studentAssessment.csv: mean assessment score across all submissions, total number of submitted assessments, and the score on the most recent submission.
Forum engagement features (dimensions 14–15) capture activity in the forumng VLE activity type: log-transformed total forum click count and number of distinct forum session days.
Atom label features (dimensions 16–20) are the five binary atoms defined in Section 3.2.1, appended to the feature vector to provide direct supervision signals to the atom MLP predictors during training.
3.3. Heterogeneous Graph Construction
3.3.1. Graph Structure
Each of the 22 course cohorts is represented as a separate heterogeneous attributed graph with three node types and four edge types.
- Node types:
- Student nodes carry the 21-dimensional feature vector and binary label .
- Resource nodes (6364 total) carry 5-dimensional features: activity type, week availability (from/to), log click volume, and access fraction.
- Assessment nodes (206 total) carry 4-dimensional features: assessment type, weight, cohort-mean score, and due-date fraction.
- Edge types:
- accessed (student → resource): weighted by log-normalized click count.
- submitted (student → assessment): weighted by normalized score.
- missed (student → assessment): binary absence; capped at 5000 per cohort.
- co_accessed (student ↔ student): connects students sharing at least one resource; capped at 10,000 per cohort.
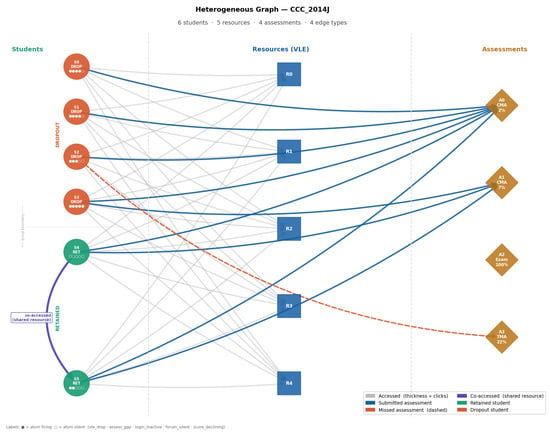
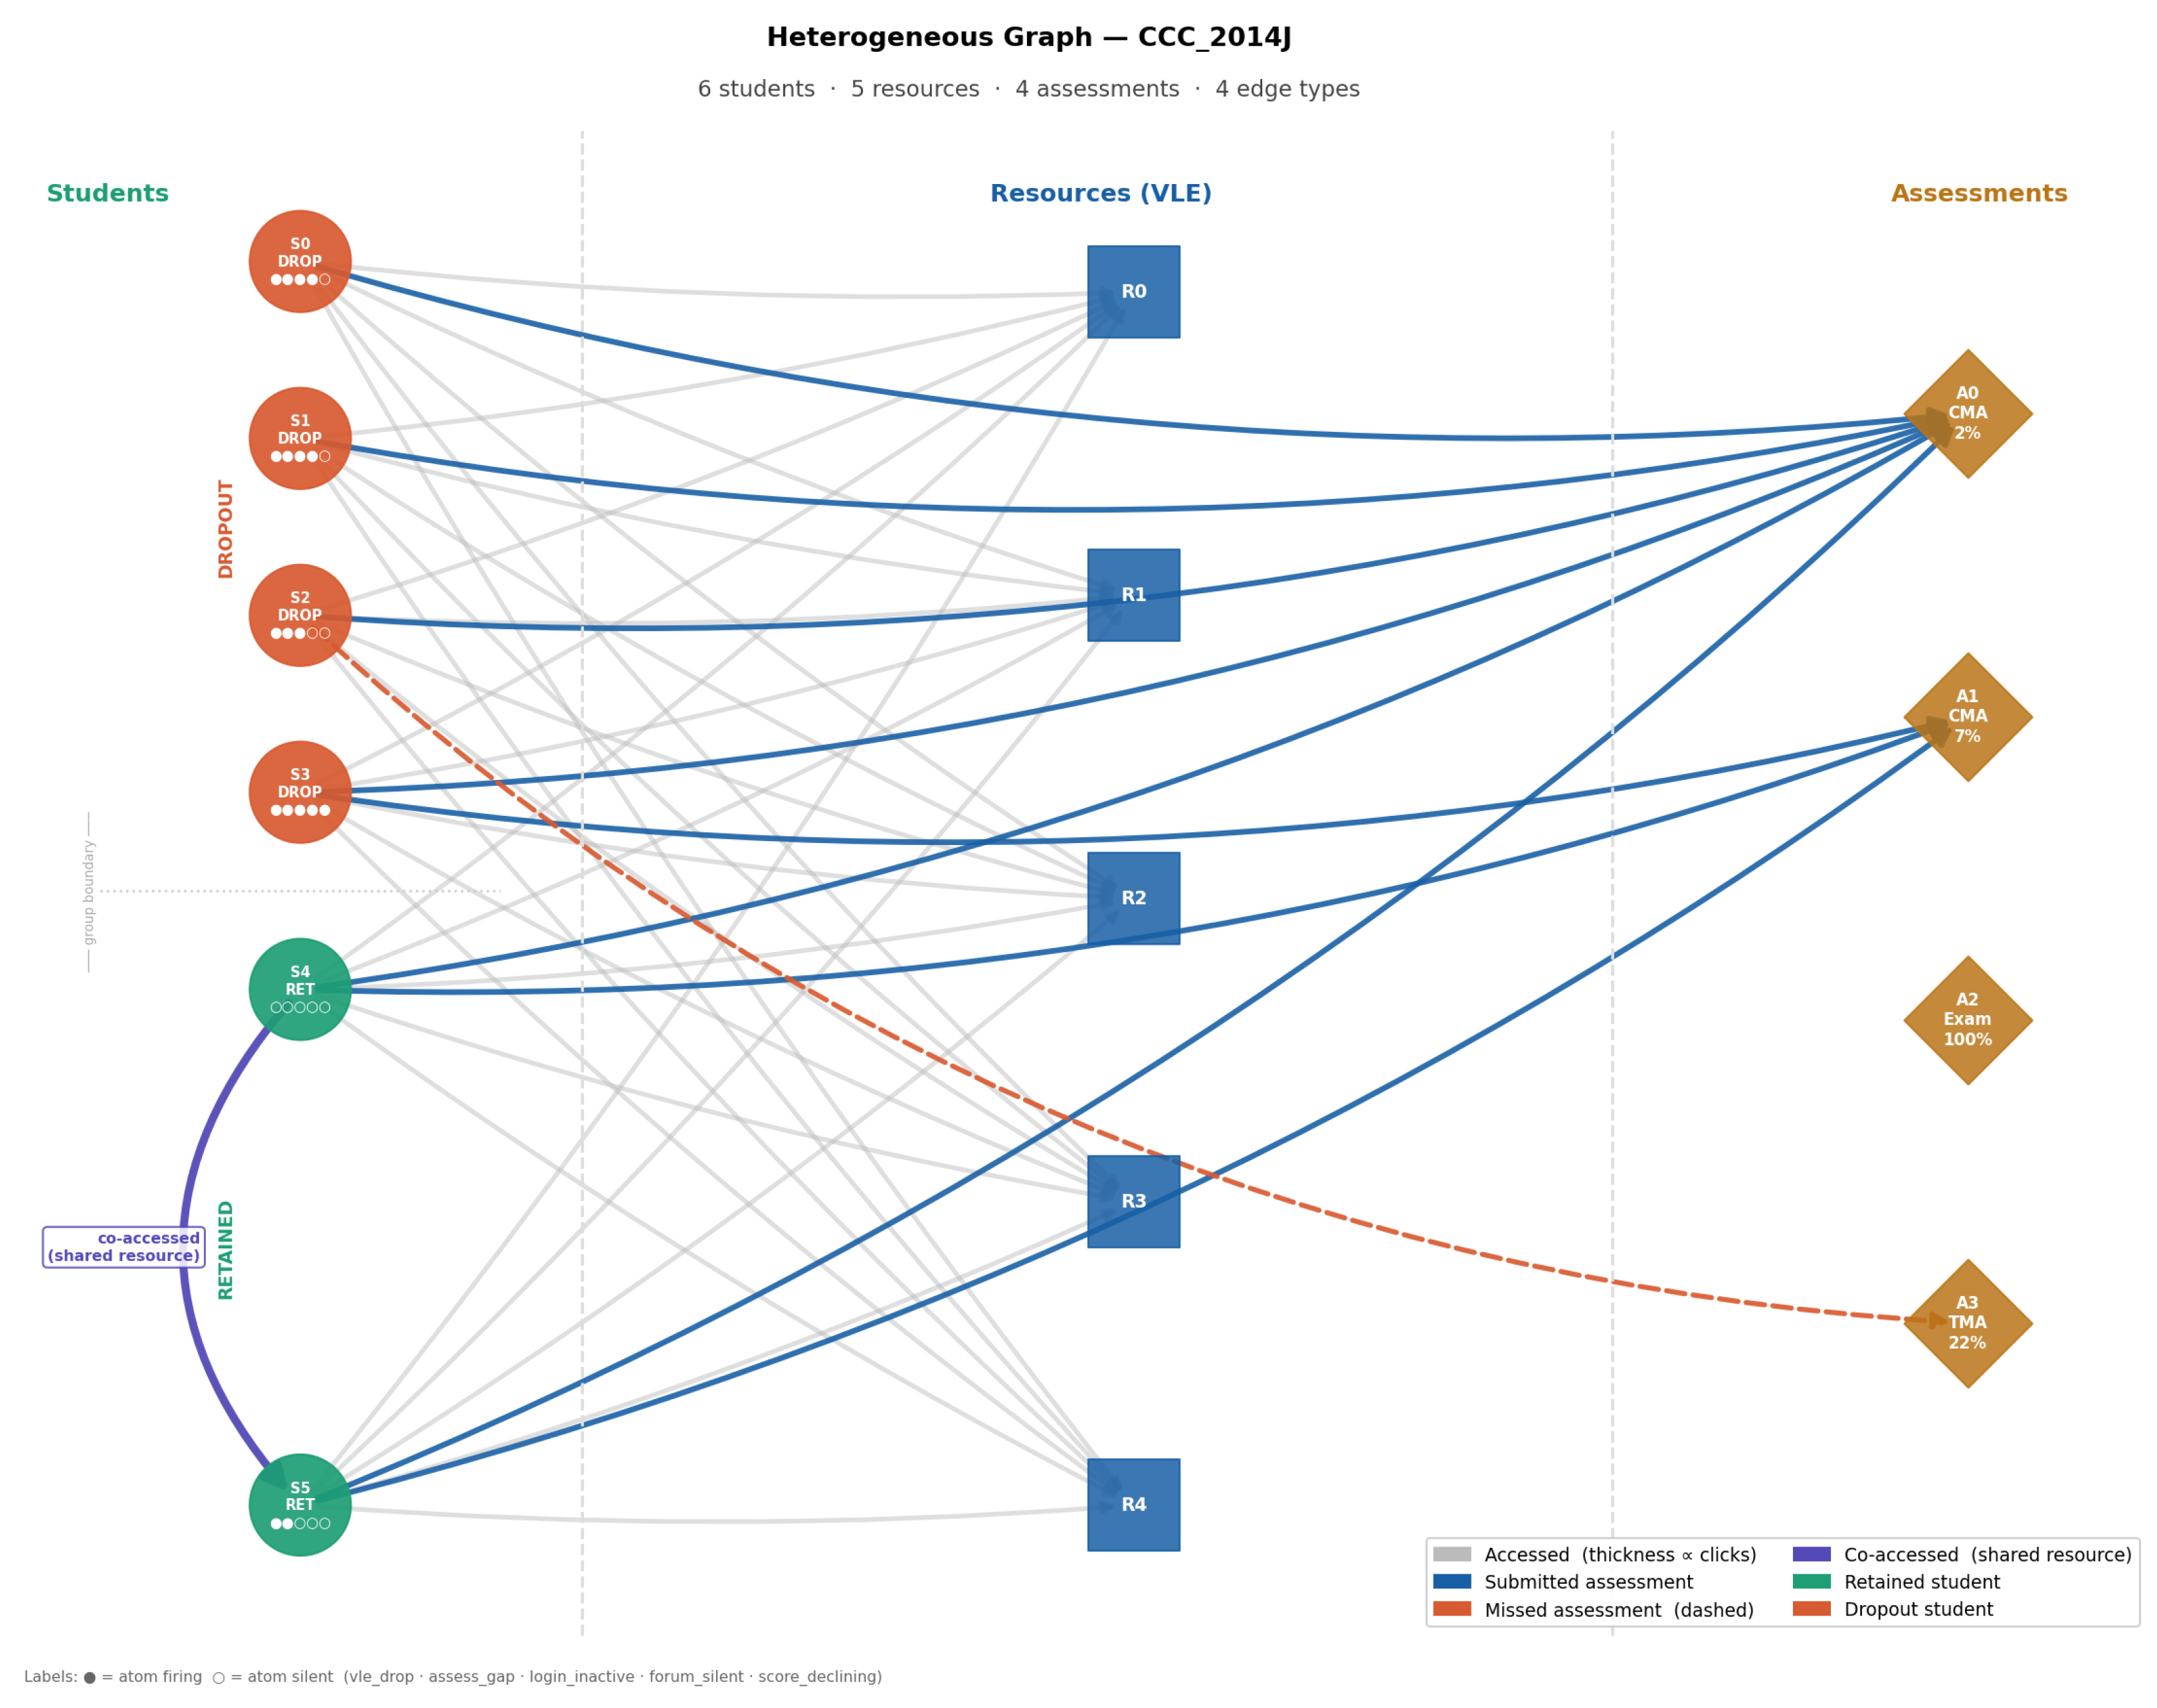
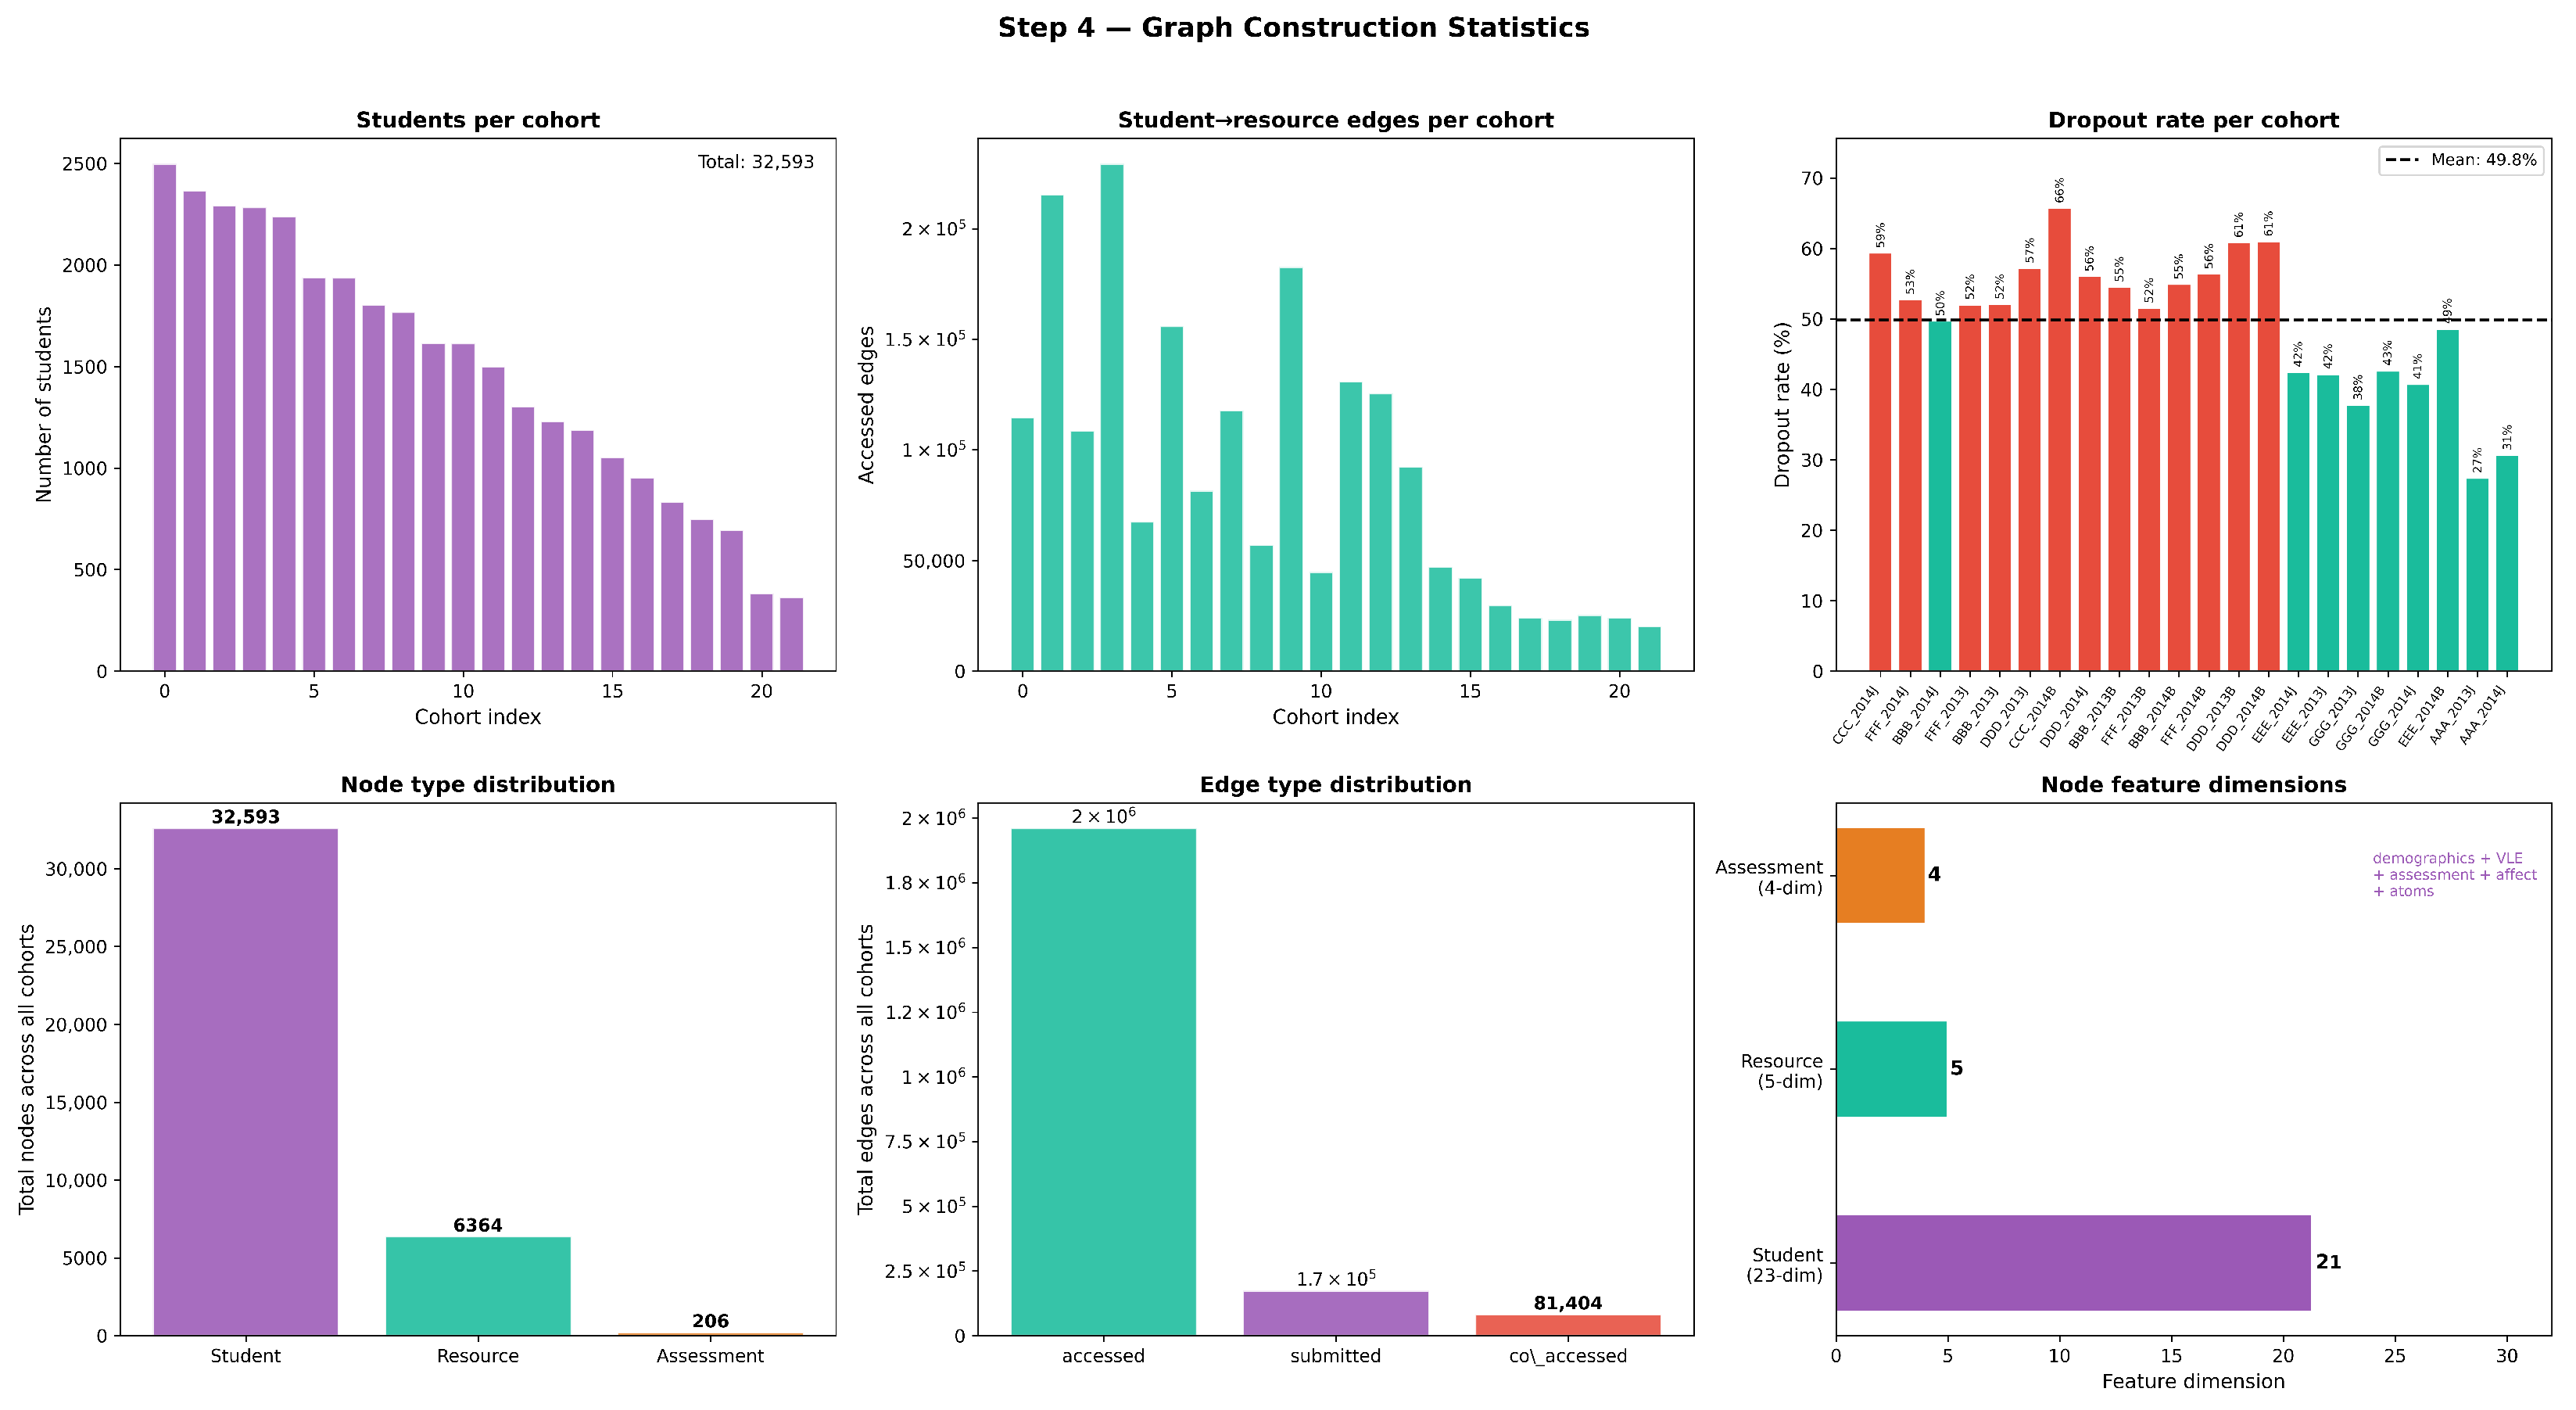
Aggregated across all 22 cohorts, the constructed graphs contain 1,960,496 accessed edges, 173,739 submitted edges, and 81,404 co-accessed edges. Figure 4 presents a representative heterogeneous subgraph illustrating the topological interactions between the three node types via all four edge types, alongside atom firing indicators. Figure 5 provides a comprehensive overview of graph construction statistics across all cohorts.
Figure 4.
Representative heterogeneous subgraph showing all four edge types, three node types, and per-student atom firing indicators.
Figure 5.
Graph construction statistics across all 22 cohorts: students per cohort, accessed edges per cohort, dropout rate per cohort, node and edge type distributions, and node feature dimensions.
3.3.2. Data Split
Splits are performed at the cohort level to prevent student-level data leakage. The 22 cohort graphs are partitioned into 16 training cohorts, 3 validation cohorts, and 3 test cohorts using a fixed random seed of 42. The three test cohorts—CCC_2014J, DDD_2013J, and EEE_2014B—are selected to span diverse module types and dropout rate ranges, ensuring that evaluation reflects generalization across different learning contexts rather than a single cohort type.
The three test cohorts—CCC_2014J, DDD_2013J, and EEE_2014B—were selected to span diverse learning contexts rather than a single course type. Table 3 reports their key characteristics alongside the full dataset statistics. The test cohort dropout rates (38%, 59%, and 66%) bracket the dataset mean of 52.8%, ensuring that evaluation covers both below-average and above-average dropout environments. Cohort sizes (1938, 2498, and 694 students) span the full range observed across all 22 cohorts (357–2481), covering both small and large student populations. The three cohorts represent three distinct course modules (CCC, DDD, EEE), ensuring that no single module dominates the test evaluation. This diversity of dropout rates, cohort sizes, and module types provides evidence that the reported test performance reflects genuine generalization rather than cohort-specific overfitting.
Table 3.
Characteristics of the three held-out test cohorts compared to full dataset statistics. Dropout rates bracket the dataset mean, and cohort sizes span the observed range, confirming the representativeness of the test set.
3.4. Model Architecture
NeSy-Drop is a three-tier neuro-symbolic architecture that processes a heterogeneous cohort graph and produces a per-student dropout probability together with a symbolic explanation chain. The three tiers correspond to graph encoding, behavioral atom prediction, and differentiable rule-based inference.
3.4.1. Tier 1: Heterogeneous Graph Transformer Encoder
The first tier encodes the relational structure of each cohort graph into dense student embeddings using the heterogeneous graph transformer (HGT) convolution operator [29], applied over layers with attention heads and a hidden dimension of . Each node type is first projected into the shared embedding space via a type-specific linear layer:
where is the node feature vector, denotes the node type, and is a learnable type-specific projection matrix. At each HGT layer l, node representations are updated by attending over typed neighbors across all edge types, with a residual connection and layer normalization applied after each update:
where denotes the typed neighborhood of node v and the dropout rate is set to 0.2. After three layers, each student node is represented by an embedding that encodes not only the student’s own features but also the behavioral context derived from accessed resources, submitted and missed assessments, and co-accessed peer relationships. Resource and assessment embeddings are used only during message passing and are discarded thereafter.
3.4.2. Tier 2a: Atom Predictor MLPs
The second tier maps each student embedding to soft probability estimates for the five behavioral atoms defined in Section 3.2.1. Five independent two-layer MLP predictors are applied in parallel, one per atom:
where , , and denotes the sigmoid function. Each predictor is independently supervised against the ground-truth binary atom labels, ensuring that the soft atom outputs remain semantically grounded in their behavioral definitions throughout training. The five probabilities are fully differentiable and passed directly to Tier 2b.
3.4.3. Tier 2b: Differentiable Rule Layer
The third tier computes the final dropout probability through a set of symbolic rules expressed as soft conjunctions of atom probabilities. The design of the rule set is grounded in two principles. First, each rule must capture a co-occurring combination of behavioral signals that is more discriminative than any single atom alone— individual atom firing rates, while informative, leave substantial ambiguity near the decision boundary. Second, the rule set must remain compact and interpretable: An educator reading a rule chain should immediately understand why a student was flagged. Based on these principles and the inter-atom correlation structure revealed in Section 3.2.1, eight rules are defined covering all pairwise combinations of the four most discriminative atoms (vle_drop, assessment_gap, login_inactive, forum_silent), as well as selected combinations involving score_declining and two composite rules capturing simultaneous multi-atom disengagement. The score_declining atom, being near-independent of the others (), is deliberately included in three rules to capture the academically deteriorating student who may still be nominally active on the platform—a dropout pathway not covered by engagement-only rules. The eight rules are listed in Table 4. The rule templates are fixed prior to training based on these design principles and the inter-atom correlation structure; they are not selected by data-driven search over the space of possible conjunctions.
Table 4.
The eight symbolic rules defined in Tier 2b of NeSy-Drop. Rules R1–R6 cover pairwise atom co-occurrences; R7–R8 capture composite multi-atom disengagement patterns.
Each rule r is defined by a body and fires with strength:
This product implements a differentiable approximation to logical conjunction: The rule fires strongly only when all constituent atoms have high probability simultaneously, and it is suppressed if any constituent atom has low probability. Each rule carries a learnable scalar weight . The final dropout probability is computed as
where is a learnable bias, and keeps each rule contribution bounded in . The entire computation from raw graph features to dropout probability is end-to-end differentiable, enabling joint optimization of all parameters via standard backpropagation.
It is important to distinguish the fixed and learned components of the symbolic layer. The atom thresholds (Table 1) and rule templates—the logical bodies defining which atoms appear in each rule (Table 4)—are fixed by design prior to training and are not updated during optimization. By contrast, the rule weights , the atom MLP parameters (, ), and all GNN encoder parameters are fully learned from data via backpropagation. This design separates structural interpretability—which symbolic combinations of behaviors are considered—from quantitative learning—how strongly each combination predicts dropout in a given dataset.
3.5. Training Procedure
3.5.1. Loss Function
The training objective is a weighted combination of three terms:
is a class-weighted binary cross-entropy between the predicted dropout probability and the ground-truth label:
where is the positive class weight capped at 10 to handle cohort-level class imbalance, is the ground-truth label, and is the predicted dropout probability. is the mean binary cross-entropy between each atom MLP output and the corresponding ground-truth binary atom label, averaged over all five atoms:
This term grounds each atom predictor in its behaviorally validated definition, preventing the atom MLPs from collapsing into arbitrary dropout-predictive representations that would sacrifice interpretability.
is an L1 penalty on the learned rule weights:
This term encourages the model to concentrate predictive mass on fewer rules with higher confidence, producing a sparser and more interpretable final rule configuration. The weighting hyperparameters and balance the three objectives and are determined empirically.
3.5.2. Three-Phase Curriculum
Training follows a three-phase curriculum that sequentially focuses optimization on atom grounding, joint learning, and rule refinement. This design is motivated by a fundamental risk in joint neuro-symbolic training: if all parameters are optimized simultaneously from random initialization, the atom MLPs may converge to representations that are predictive of dropout but semantically disconnected from their intended behavioral definitions, undermining the interpretability of the rule layer. The curriculum mitigates this by establishing grounded atom representations before the full model is jointly optimized.
Phase 1—Atom warm-up. Only the five atom MLP predictors are updated while the graph encoder and rule weights remain frozen. The loss reduces to , forcing each MLP to learn representations that are faithful to their ground-truth behavioral definitions before any interaction with the rule layer.
Phase 2—Joint training. All parameters are jointly optimized with the full three-component loss . The graph encoder learns relational student representations that simultaneously support accurate atom prediction and dropout classification through the symbolic rule layer.
Phase 3—Rule fine-tuning. The graph encoder and atom MLPs are frozen while only the rule weights and bias b are updated with an increased sparsity penalty. This phase allows the rule layer to settle into its final interpretable configuration—differentiating the relative contribution of each rule—decoupled from the dynamics of the encoder and atom predictors. The best model checkpoint is selected by validation AUC across all three phases.
3.6. Three-Level Explainability
NeSy-Drop provides interpretable explanations at three complementary levels of abstraction, moving from symbolic to embedding-level to raw-feature-level. These levels are designed to serve different audiences: The symbolic level targets educators and administrators who need to understand why a student was flagged, the embedding level targets model developers who need to understand what the GNN learned, and the raw-feature level targets practitioners who need explanations in terms of the original data.
Level 1—Symbolic explanation (ante-hoc). For every student, the forward computation of Tier 2b directly yields a complete symbolic explanation: which of the five atoms fired (), the firing strength of each rule, the learned weight of each rule, and the full arithmetic decomposition of into per-rule contributions. This explanation is guaranteed faithful because it is the literal computation that produced the prediction—not an approximation of it. This ante hoc property distinguishes NeSy-Drop from systems that apply post hoc explanation methods to black-box classifiers, where faithfulness cannot be guaranteed.
Level 2—SHAP on atom MLPs. DeepExplainer [11] is applied to each of the five atom MLP predictors using a stratified background sample of 200 students. For each student, SHAP values are computed over all 128 embedding dimensions per atom, yielding a per-atom attribution vector that identifies which dimensions of each atom MLP relies on most. Population-level mean values are aggregated across all students to reveal the internal structure of the learned embedding— specifically, which dimensions encode shared behavioral signals across multiple atoms and which are unique to individual atoms.
Level 3—LIME and counterfactuals. LIME [12] is applied to explain each student’s dropout prediction in terms of the original 21-dimensional raw feature vector, using 100 perturbations per student. This provides practitioners with feature-level explanations that are directly interpretable without knowledge of the model’s internal embedding structure. Additionally, for each at-risk student (), a counterfactual explanation is computed via gradient descent on the actionable feature dimensions (indices 7–20), minimizing the objective subject to an L1 sparsity penalty, with demographic features (indices 0–6) held fixed. The result is the minimum feature perturbation that would bring the predicted probability below 50%, expressed as a quantified action prescription for the instructor.
3.7. Intervention Routing
Each student identified as at-risk () is routed to one of five intervention types at one of three severity levels— gentle, standard, or urgent—yielding 15 distinct action categories. Routing is deterministic and operates on the hard binary atom labels rather than soft MLP probabilities, ensuring that intervention decisions are grounded in empirically validated behavioral thresholds. Severity is determined by the number of simultaneously fired atoms: One atom triggers a gentle intervention, two to three atoms trigger a standard intervention, and four to five atoms trigger an urgent intervention.
Instructor escalation is triggered when all four core disengagement atoms (vle_drop, assessment_gap, login_inactive, forum_silent) fire simultaneously, indicating complete behavioral collapse. The output includes the counterfactual prescription from Level 3, providing the instructor with specific quantified talking points for direct student contact.
Resource recommendation is triggered when assessment_gap is the dominant alarm. The system identifies VLE resources that passing students in the same cohort accessed most frequently but the at-risk student has not yet visited, ranked by cohort-level retained-student access frequency.
Score support is triggered when score_declining is the most selective fired atom. The output provides a per-assessment-type breakdown (TMA, CMA, Exam) comparing the student’s average score against the cohort mean, the computed score slope, and the deadline for the next upcoming assessment.
VLE reengagement is triggered when vle_drop is the dominant alarm without concurrent academic failure signals. The output reports the exact number of days since the student’s last login and their historical click distribution by resource type, informing the content of an automated re-engagement message.
Peer matching is triggered when forum_silent or login_inactive is the primary alarm without concurrent academic deterioration. Using cosine similarity on the student embeddings , the system identifies the top-3 retained students in the same cohort with the most similar behavioral profile and recommends peer study group assignment.
4. Experiments and Results
This section presents the experimental evaluation of NeSy-Drop. We first describe the experimental setup, followed by training results, predictive performance, baseline comparison, ablation study, per-cohort generalization, explainability analysis, and intervention distribution.
4.1. Experimental Setup
4.1.1. Implementation Details
NeSy-Drop is implemented in Python 3.10 using PyTorch 2.0 and PyTorch Geometric 2.3. The heterogeneous graphs are constructed using the six OULAD relational tables described in Section 3.3 and stored as HeteroDataobjects. All experiments are conducted on a single NVIDIA GeForce RTX 3060 GPU with 12 GB VRAM (NVIDIA Corporation, Santa Clara, CA, USA). The random seed is fixed to 42 across all runs for full reproducibility.
4.1.2. Hyperparameters
The model architecture and training hyperparameters are summarized in Table 5. Phase-specific learning rates and loss coefficients follow the three-phase curriculum described in Section 3.5.
Table 5.
NeSy-Drop hyperparameter settings.
4.1.3. Evaluation Metrics
Model performance is evaluated using three complementary metrics. The area under the ROC curve (AUC) measures the model’s ability to rank dropout students above retained students across all decision thresholds and serves as the primary metric for checkpoint selection and baseline comparison. Macro F1 score measures the harmonic mean of precision and recall averaged equally across both classes, providing a class-balanced performance estimate robust to the near-balanced class distribution in OULAD. Classification accuracy is reported as a secondary metric for completeness.
4.1.4. Baselines
NeSy-Drop is compared against four baselines under a fair evaluation protocol that controls for atom feature access. Three evaluation settings are considered: Setting A provides baselines with atom features as additional input (upper bound, unfair to NeSy-Drop since atom labels are engineered outputs of the pipeline), Setting B excludes atom features from all baseline inputs (fair comparison), and Setting C provides NeSy-Drop with ground-truth atom labels instead of predicted ones (ground-truth atom diagnostic variant, isolating the contribution of atom prediction quality from graph relational learning—note that this setting does not constitute a strict upper bound of the full architecture, as replacing predicted atoms with ground-truth labels removes the relational context encoded by the GNN encoder).
Logistic regression (LR) serves as a linear baseline using the student feature vector with L2 regularization, providing a transparent lower bound on non-linear model performance.
Random forest (RF) is an ensemble of 100 decision trees trained on the same feature set, representing a strong non-linear tabular baseline.
Gradient boosting (GB) uses XGBoost with default hyperparameters, representing the state-of-the-art tabular learning approach commonly used in educational data mining.
GNN-only is an ablated version of NeSy-Drop that removes the symbolic rule layer and replaces it with a direct linear classifier on the student embeddings , isolating the contribution of the neuro-symbolic design over pure graph learning alone.
All baselines are evaluated on the same three test cohorts as NeSy-Drop using identical preprocessing and the same cohort-level train/validation/test split described in Section 3.3.
4.2. Training Results
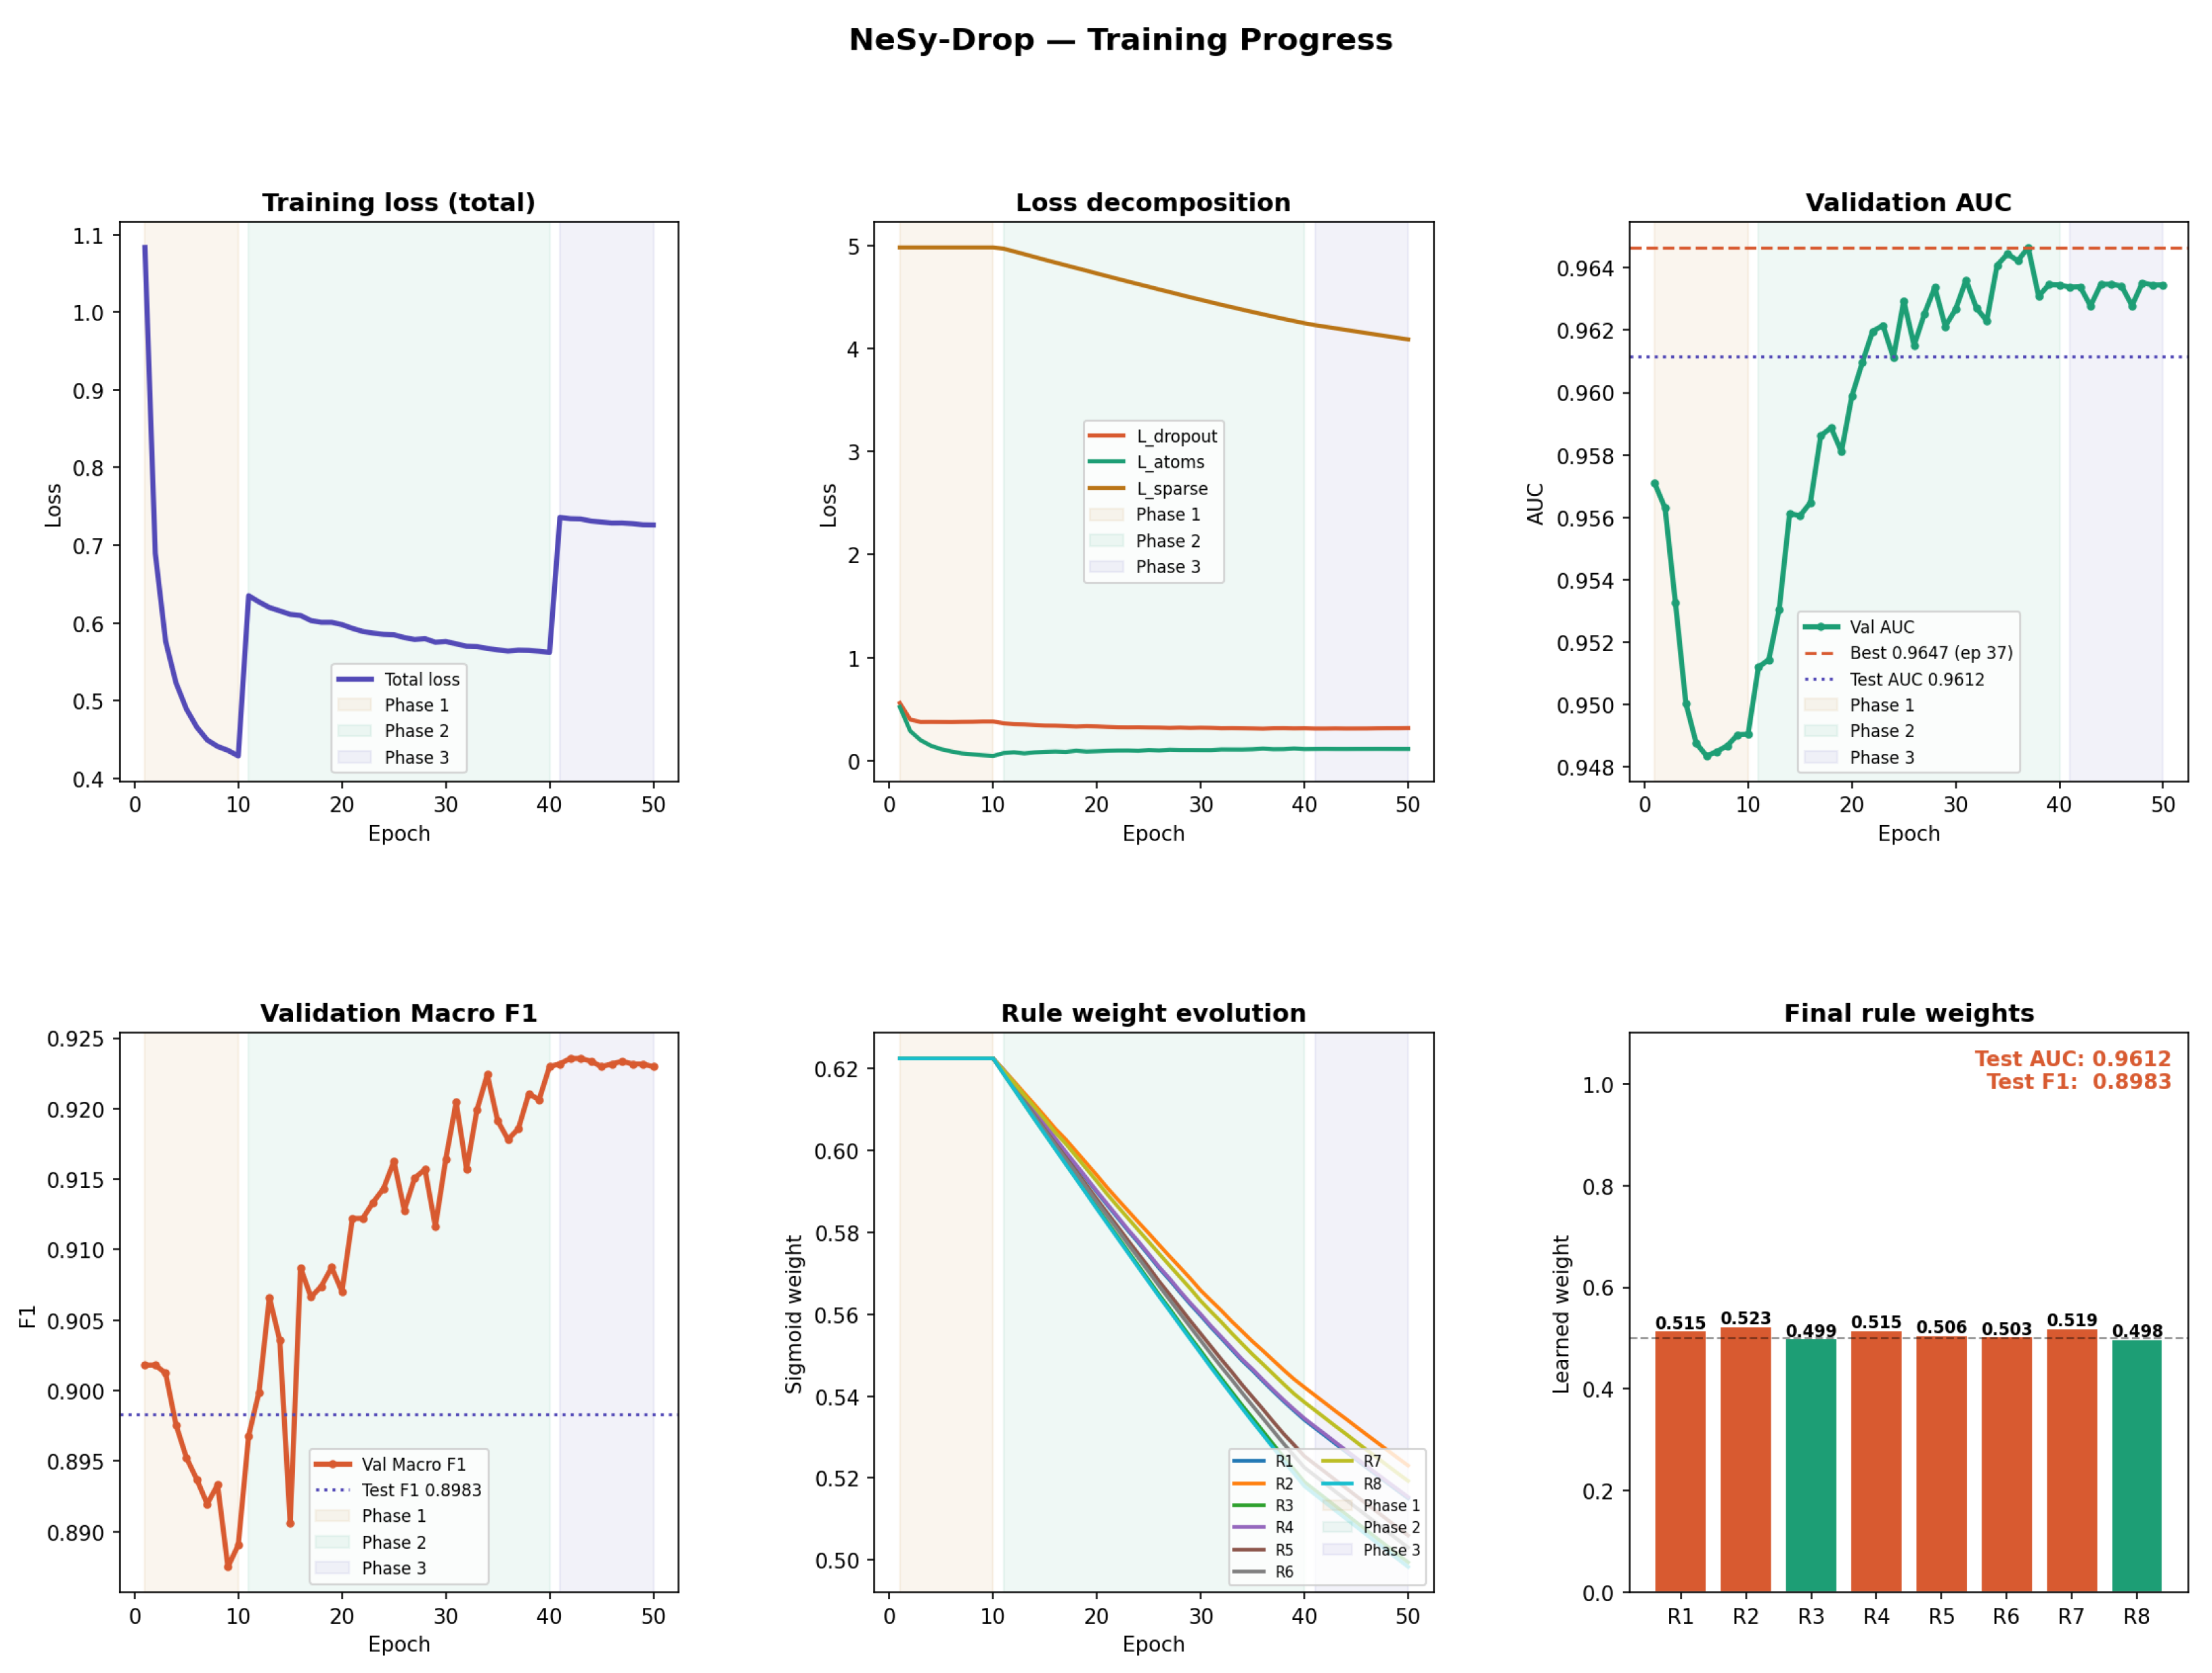
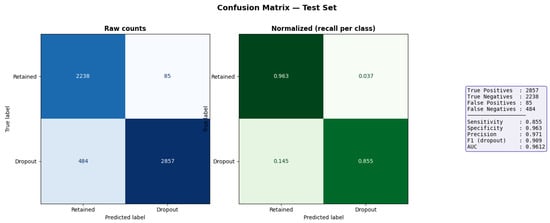
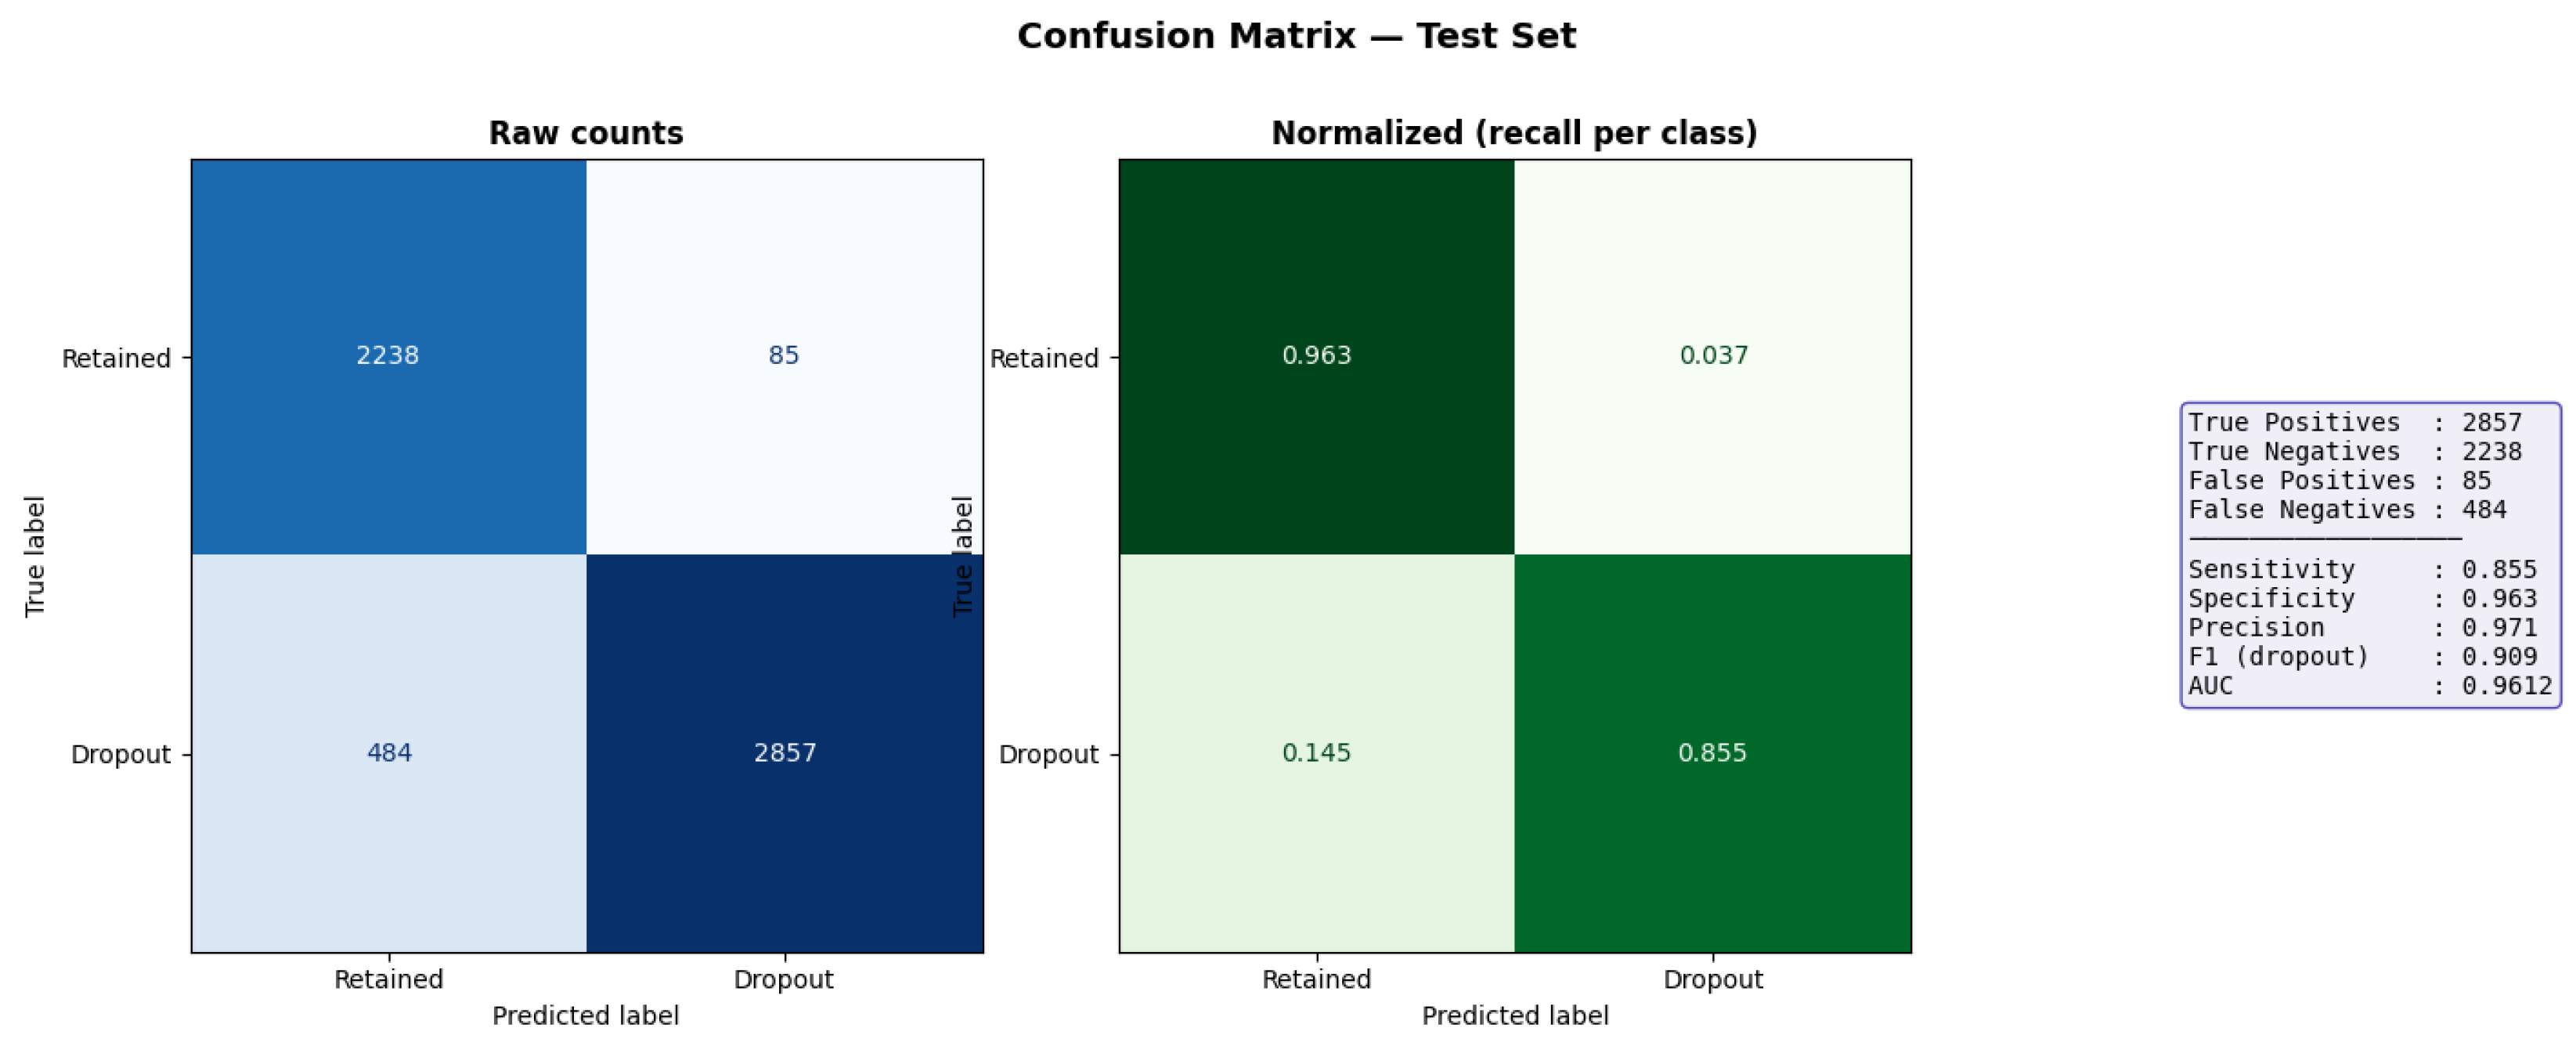
Table 6 reports the test set performance of NeSy-Drop on the three held-out cohorts. The model achieves a test AUC of 0.961 and macro F1 of 0.8983, with high specificity (0.963) confirming that the model reliably identifies retained students while maintaining strong sensitivity (0.855) for dropout detection. Figure 6 shows the training dynamics across all three curriculum phases, and Figure 7 presents the confusion matrix on the test set.
Table 6.
NeSy-Drop test set classification performance.
Figure 6.
Training dynamics of NeSy-Drop across three curriculum phases (Phase 1: atom warm-up, epochs 1–10; Phase 2: joint training, epochs 11–40; Phase 3: rule fine-tuning, epochs 41–50). Background shading indicates phase boundaries. The figure shows the training loss and its three components (, , ) alongside validation AUC and macro F1 on the held-out validation cohorts. Crucially, the evolution of the eight rule weights illustrates the main message of the curriculum strategy: Weights are held constant during Phase 1, dynamically sparsified in Phase 2 to filter out irrelevant logic, and stabilized during Phase 3 to yield their final interpretable values.
Figure 7.
Raw counts and normalized confusion matrix on the test set.
4.3. Baseline Comparison
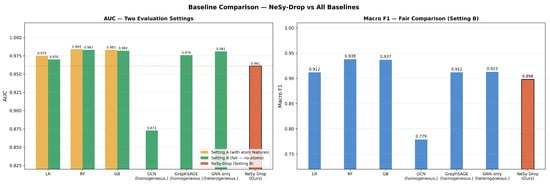
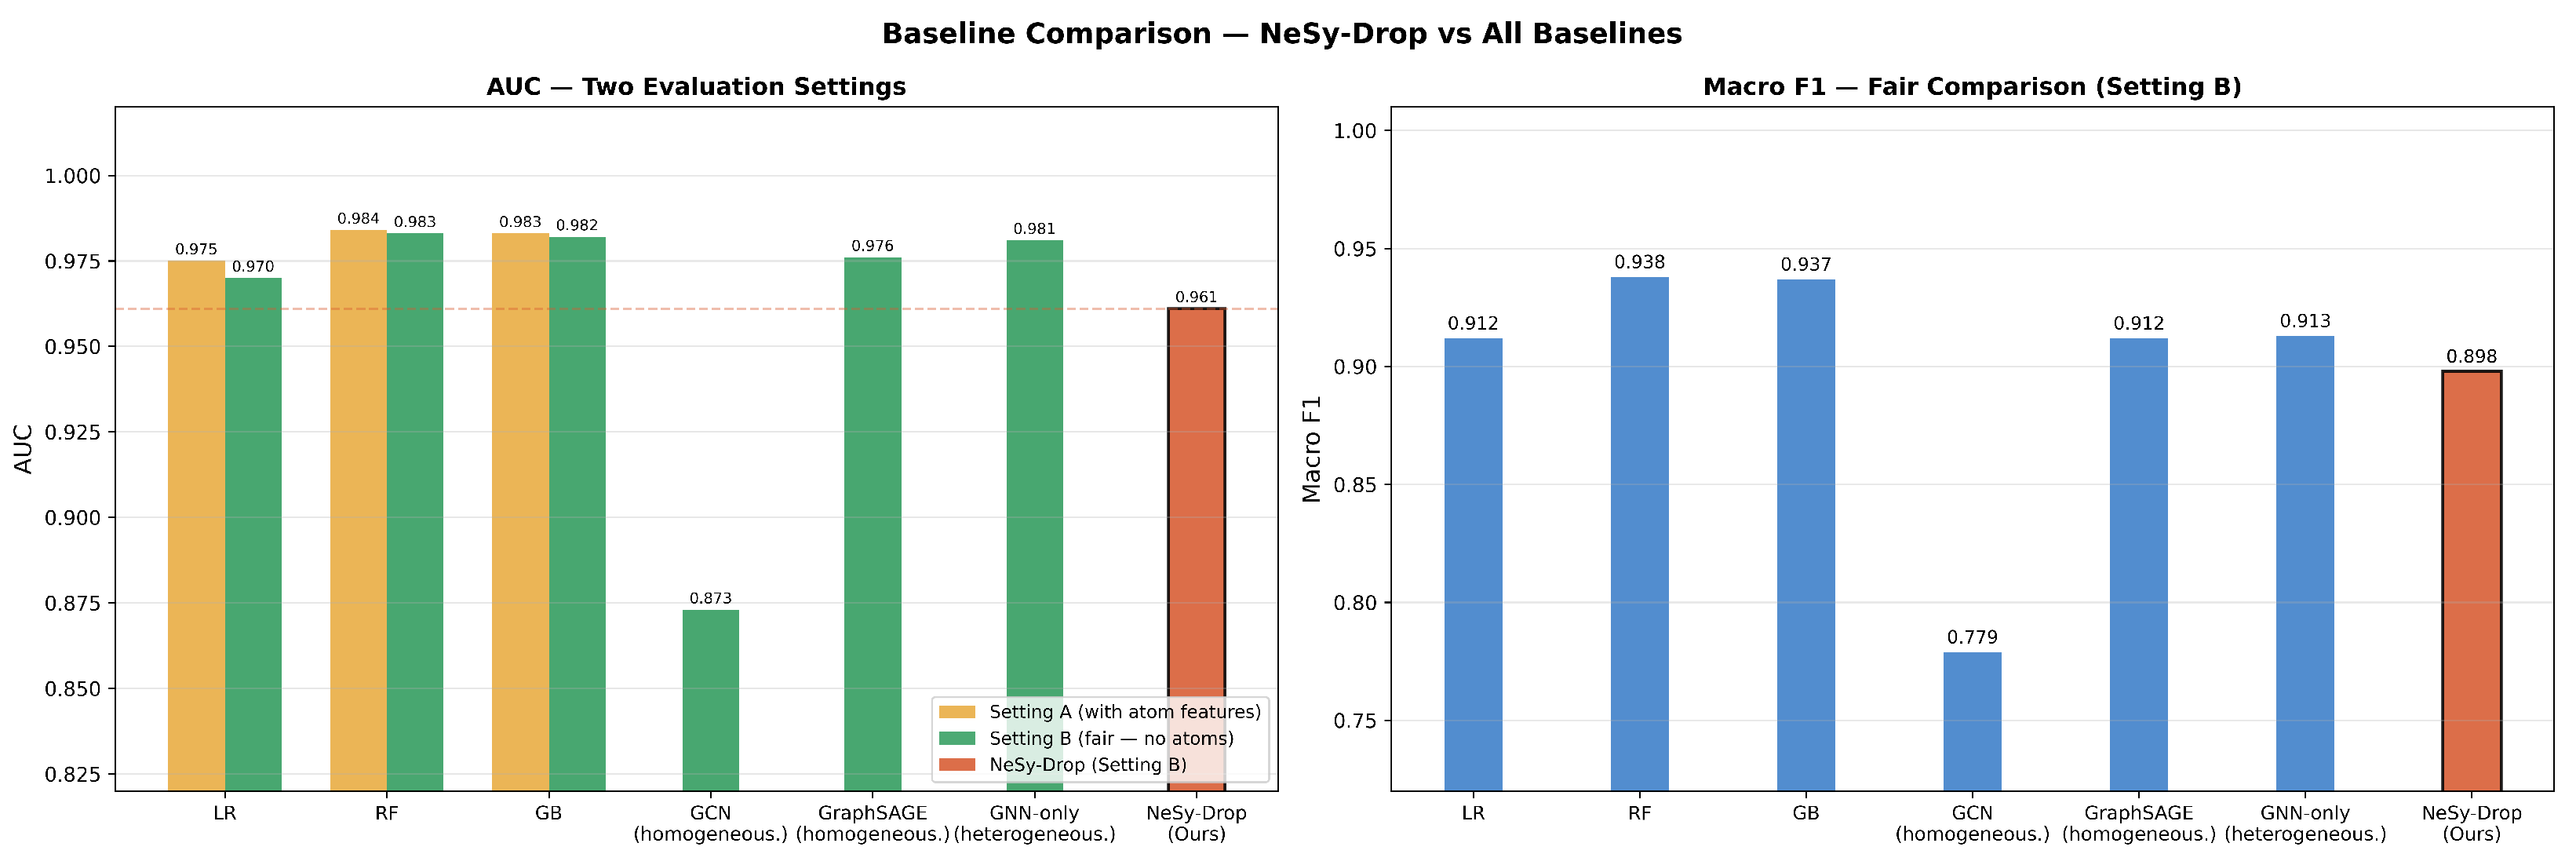
Table 7 reports the comparison between NeSy-Drop and all baselines under the three evaluation settings. Under the fair comparison protocol (Setting B), NeSy-Drop achieves an AUC of 0.961 compared to 0.983 for the best non-interpretable baseline (random forest), a gap of 2.2 AUC points—the measurable cost of full symbolic interpretability and integrated intervention routing.
Table 7.
Baseline comparison under three evaluation settings. Setting A: baselines with atom features (upper bound). Setting B: baselines without atom features (fair). Setting C: NeSy-Drop diagnostic variant with ground-truth atoms.
The two homogeneous GNN baselines reveal the specific contribution of heterogeneous graph modeling. GCN (AUC = 0.873) performs substantially below all other models, reflecting the difficulty of applying simple neighborhood averaging to the dense and noisy co-accessed student graph. GraphSAGE [30] (AUC = 0.976) performs considerably better through its sampling-based aggregation, yet remains below the heterogeneous GNN-only baseline (AUC = 0.981), confirming that modeling multiple entity types—students, resources, and assessments—through typed edges provides additional discriminative signal beyond what student-to-student co-access patterns alone can encode. Both homogeneous GNN baselines, despite achieving competitive raw AUC, provide no symbolic explanations and no intervention routing, making them unsuitable for direct deployment in educational decision support systems. Figure 8 visualizes the three-setting comparison across all models.
Figure 8.
Fair baseline comparison across three evaluation settings: Setting A (with atom features as model input—upper performance bound, favorable to tabular models), Setting B (without atom features—fair comparison isolating the contribution of graph-based relational learning), and Setting C (NeSy-Drop diagnostic variant with ground-truth atom labels). AUC is reported for all baselines including two homogeneous GNN baselines (GCN and GraphSAGE trained on student-only co-accessed graphs) and one heterogeneous GNN-only baseline, alongside tabular baselines (LR, RF, GB) and NeSy-Drop. Macro F1 is reported under Setting B only. Setting B is the primary comparison metric.
4.4. Ablation Study
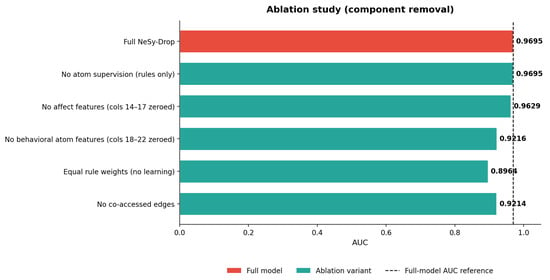
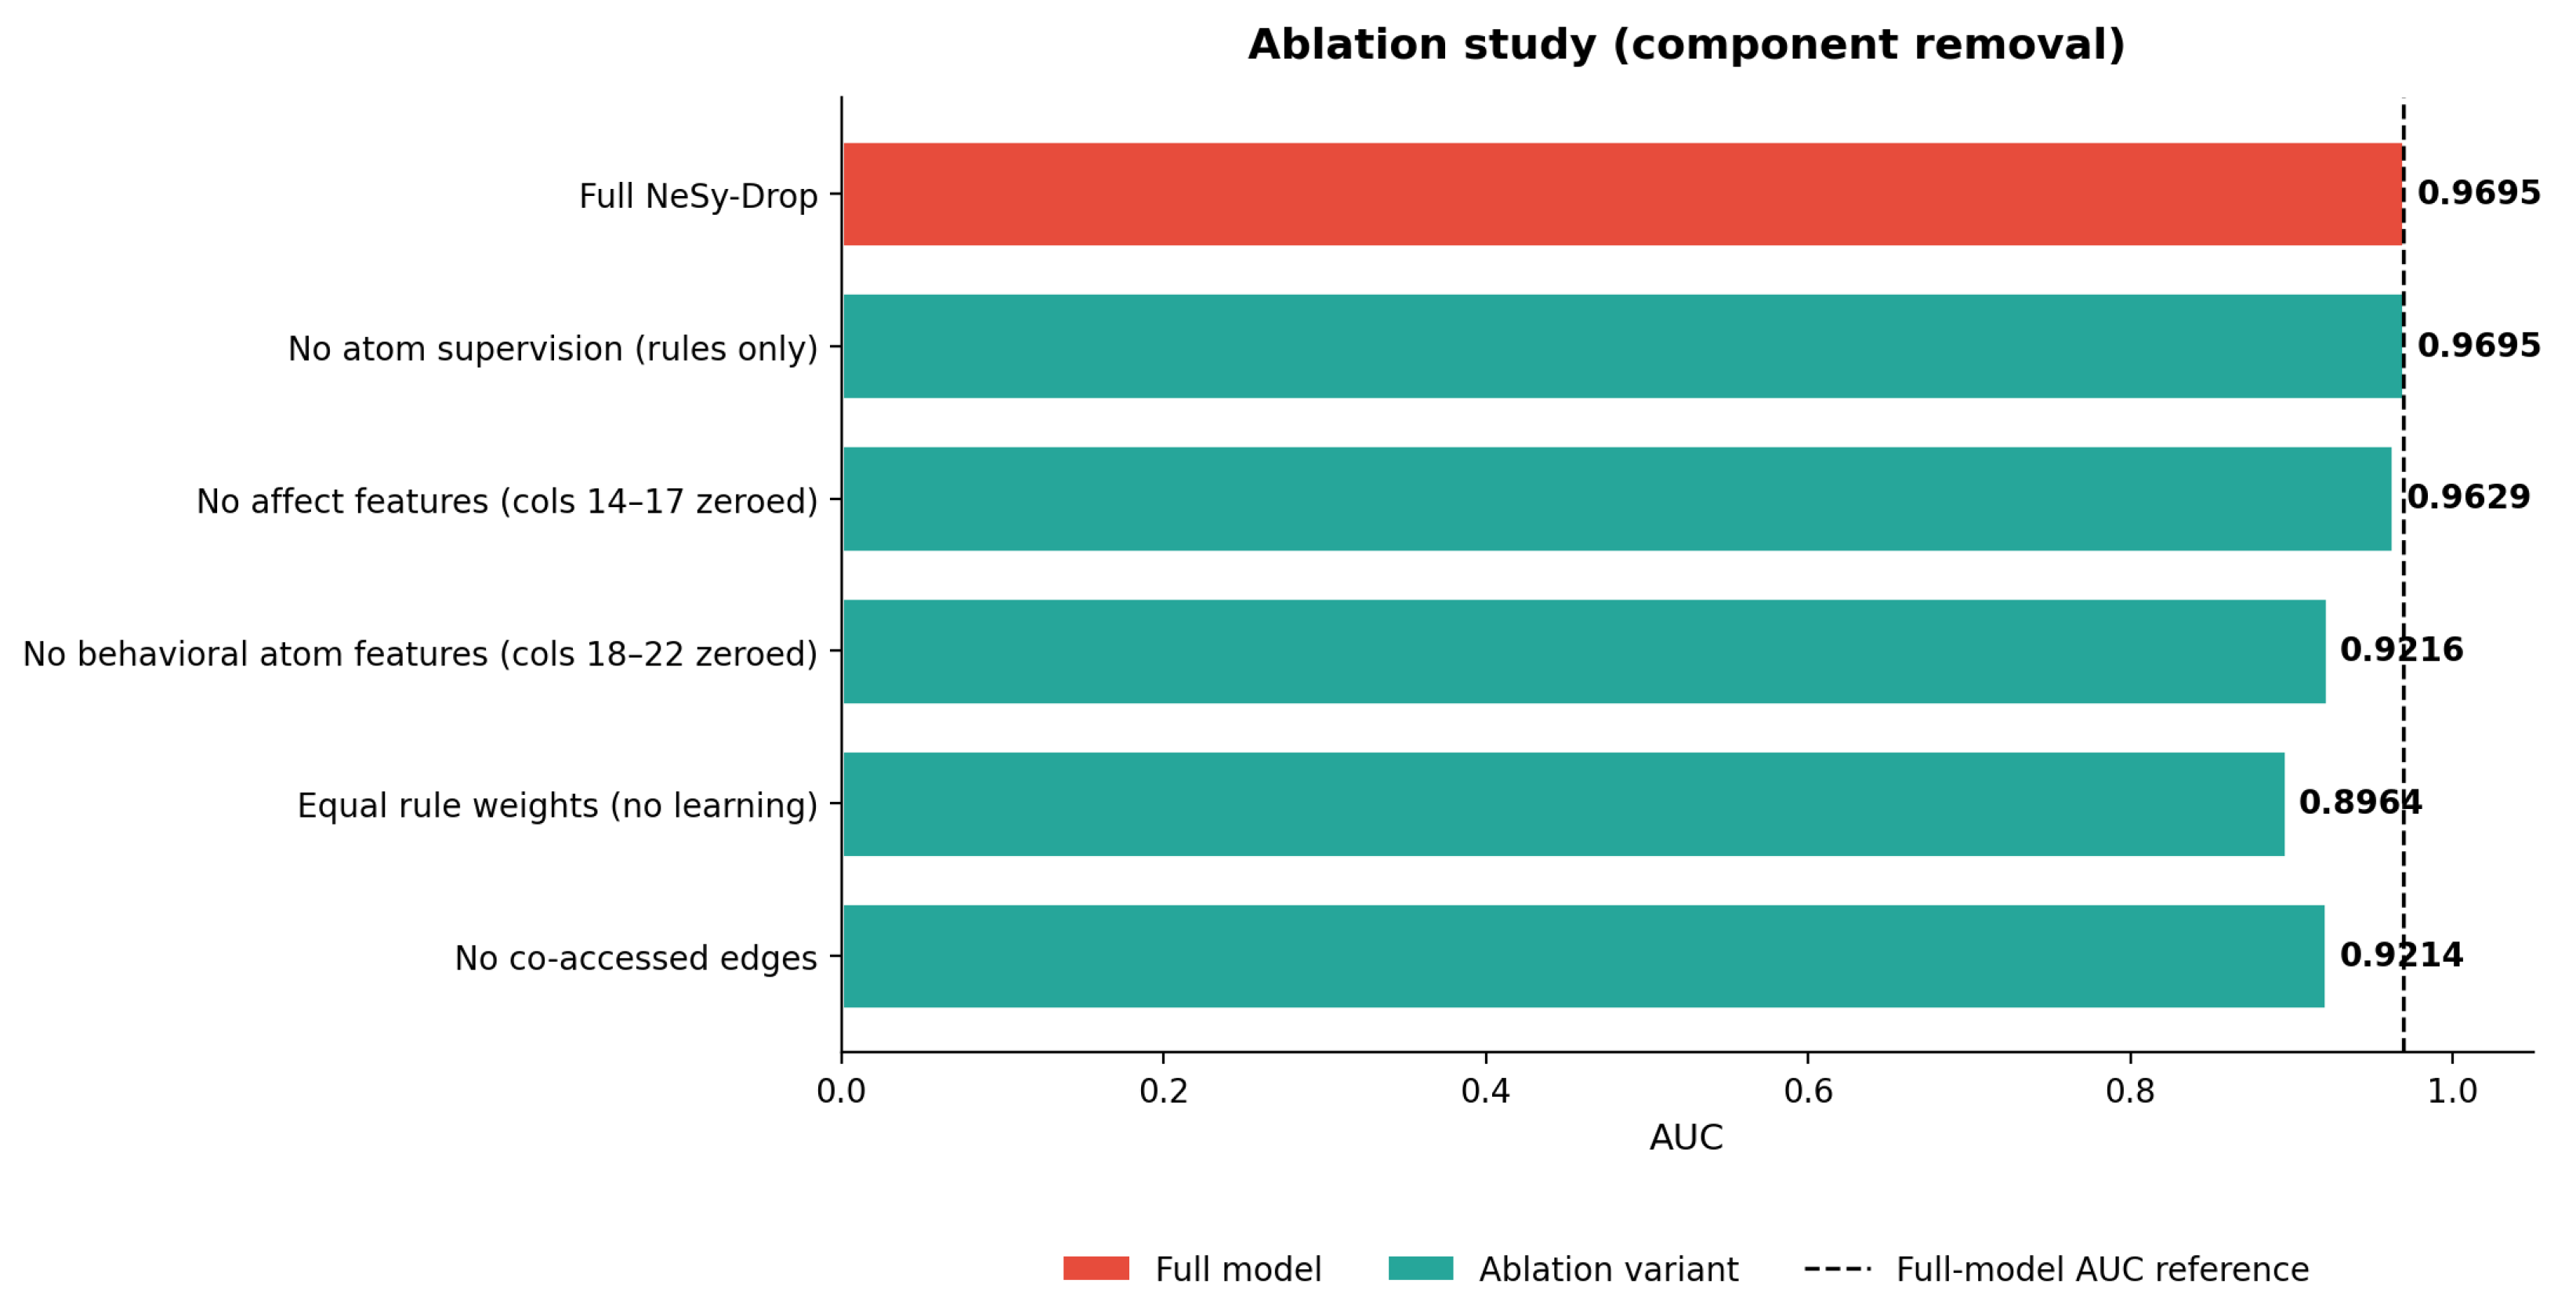
To assess the contribution of each architectural component, we conduct a systematic ablation study by removing one component at a time and evaluating the resulting model on the test set. The largest performance drop is observed when learned rule weights are replaced by uniform equal weights, confirming that the weight differentiation in Tier 2b performs substantial predictive work beyond the symbolic structure alone. Removing co-accessed edges and forum features each produce notable AUC reductions, validating their inclusion in the architecture. Figure 9 visualizes the full ablation results.
Figure 9.
Ablation study: AUC drop when each architectural component is removed from the full NeSy-Drop model.
The substantial AUC drop from removing learned rule weights () may appear counterintuitive given that the learned weights are numerically close to each other, ranging from 0.531 to 0.550 (Table 8). However, the effect of weight learning operates through two complementary mechanisms that are not visible from the final weight values alone. First, during training the rule weights receive gradient signals that encode the relative discriminative contribution of each rule across all 22 cohorts—even small systematic differences in weight magnitude translate into meaningful differentiation in the final dropout probability when rule firing strengths vary across students. Second, and more importantly, replacing learned weights with uniform equal weights removes the interaction between the sparsity loss and the gradient dynamics of the rule layer during Phase 3 of training. Under learned weights, the sparsity penalty actively shapes the optimization trajectory of the entire model—including the atom MLP predictors—encouraging representations that are jointly consistent with a sparse rule configuration. Setting all weights to a fixed equal value eliminates this regularization signal entirely, effectively removing a structured inductive bias that constrains the model to learn dropout pathways consistent with the symbolic rule structure. The performance degradation therefore reflects the loss of this optimization-level constraint rather than a direct consequence of the small numerical differences between the learned weight values.
Table 8.
Learned rule weights and faithfulness scores (AUC drop when rule individually removed) after training.
4.5. Per-Cohort Generalization
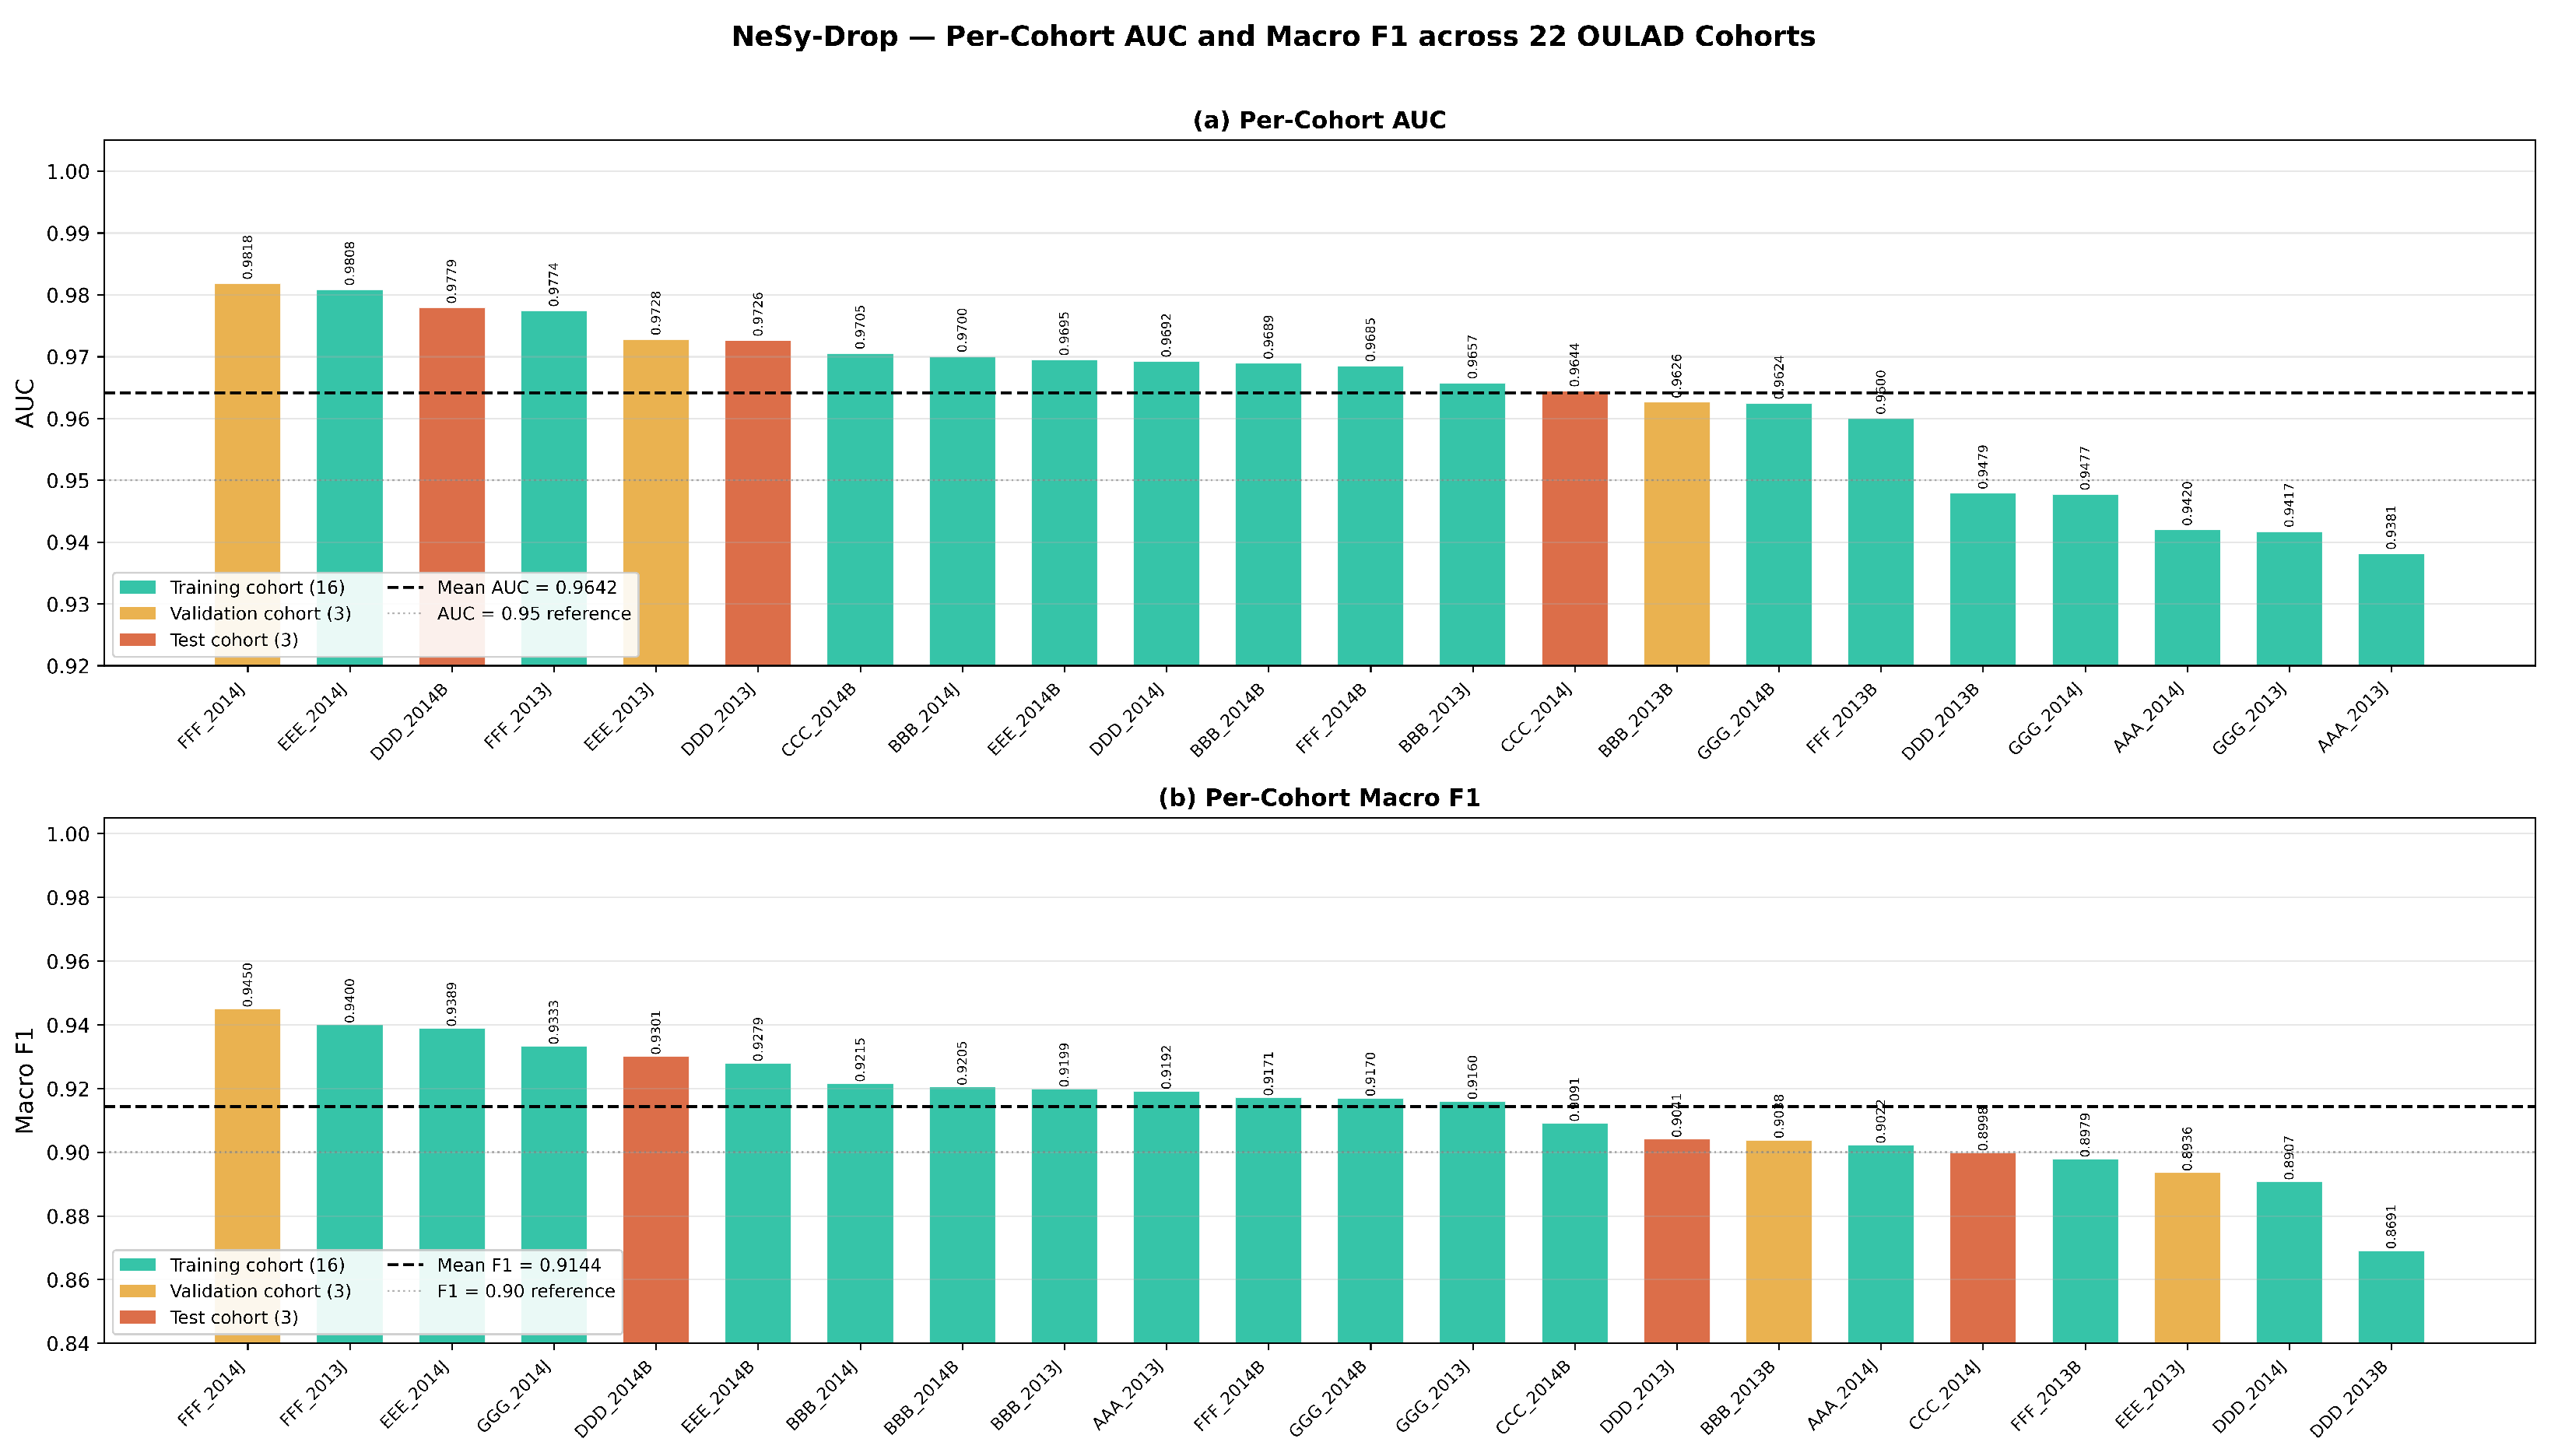
To assess the generalization capability of NeSy-Drop across diverse learning contexts, we report AUC and macro F1 per cohort across all 22 cohorts. The model achieves a mean test AUC of across the three test cohorts, with consistent performance observed across all training and validation cohorts. The narrow standard deviation confirms that NeSy-Drop generalizes reliably across module types, cohort sizes ranging from 357 to 2481 students, and presentation years without any cohort-specific tuning or adaptation.
Notably, performance remains stable even for the smallest cohorts where training data is limited, suggesting that the cohort-level graph construction strategy effectively captures the structural patterns of student behavior regardless of cohort size. The heterogeneous graph representation, which encodes relational interactions between students, resources, and assessments rather than relying solely on tabular features, contributes to this robustness by providing a richer inductive bias that generalizes across different course structures and content types.
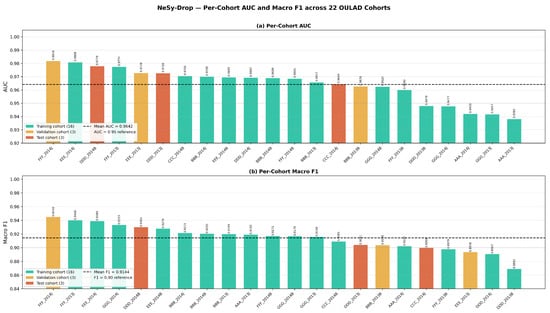
Figure 10 presents the per-cohort AUC and macro F1 scores across all 22 cohorts, with training, validation, and test cohorts clearly distinguished.
Figure 10.
Per-cohort AUC and macro F1 across all 22 OULAD cohorts. Training cohorts (16) are shown in teal, validation cohorts (3) in orange, and held-out test cohorts (3) in red. The dashed line indicates the mean AUC across all cohorts. Generalization claims are based exclusively on the three test cohorts, which were not seen during training or checkpoint selection.
4.6. Explainability Analysis
4.6.1. Symbolic Level
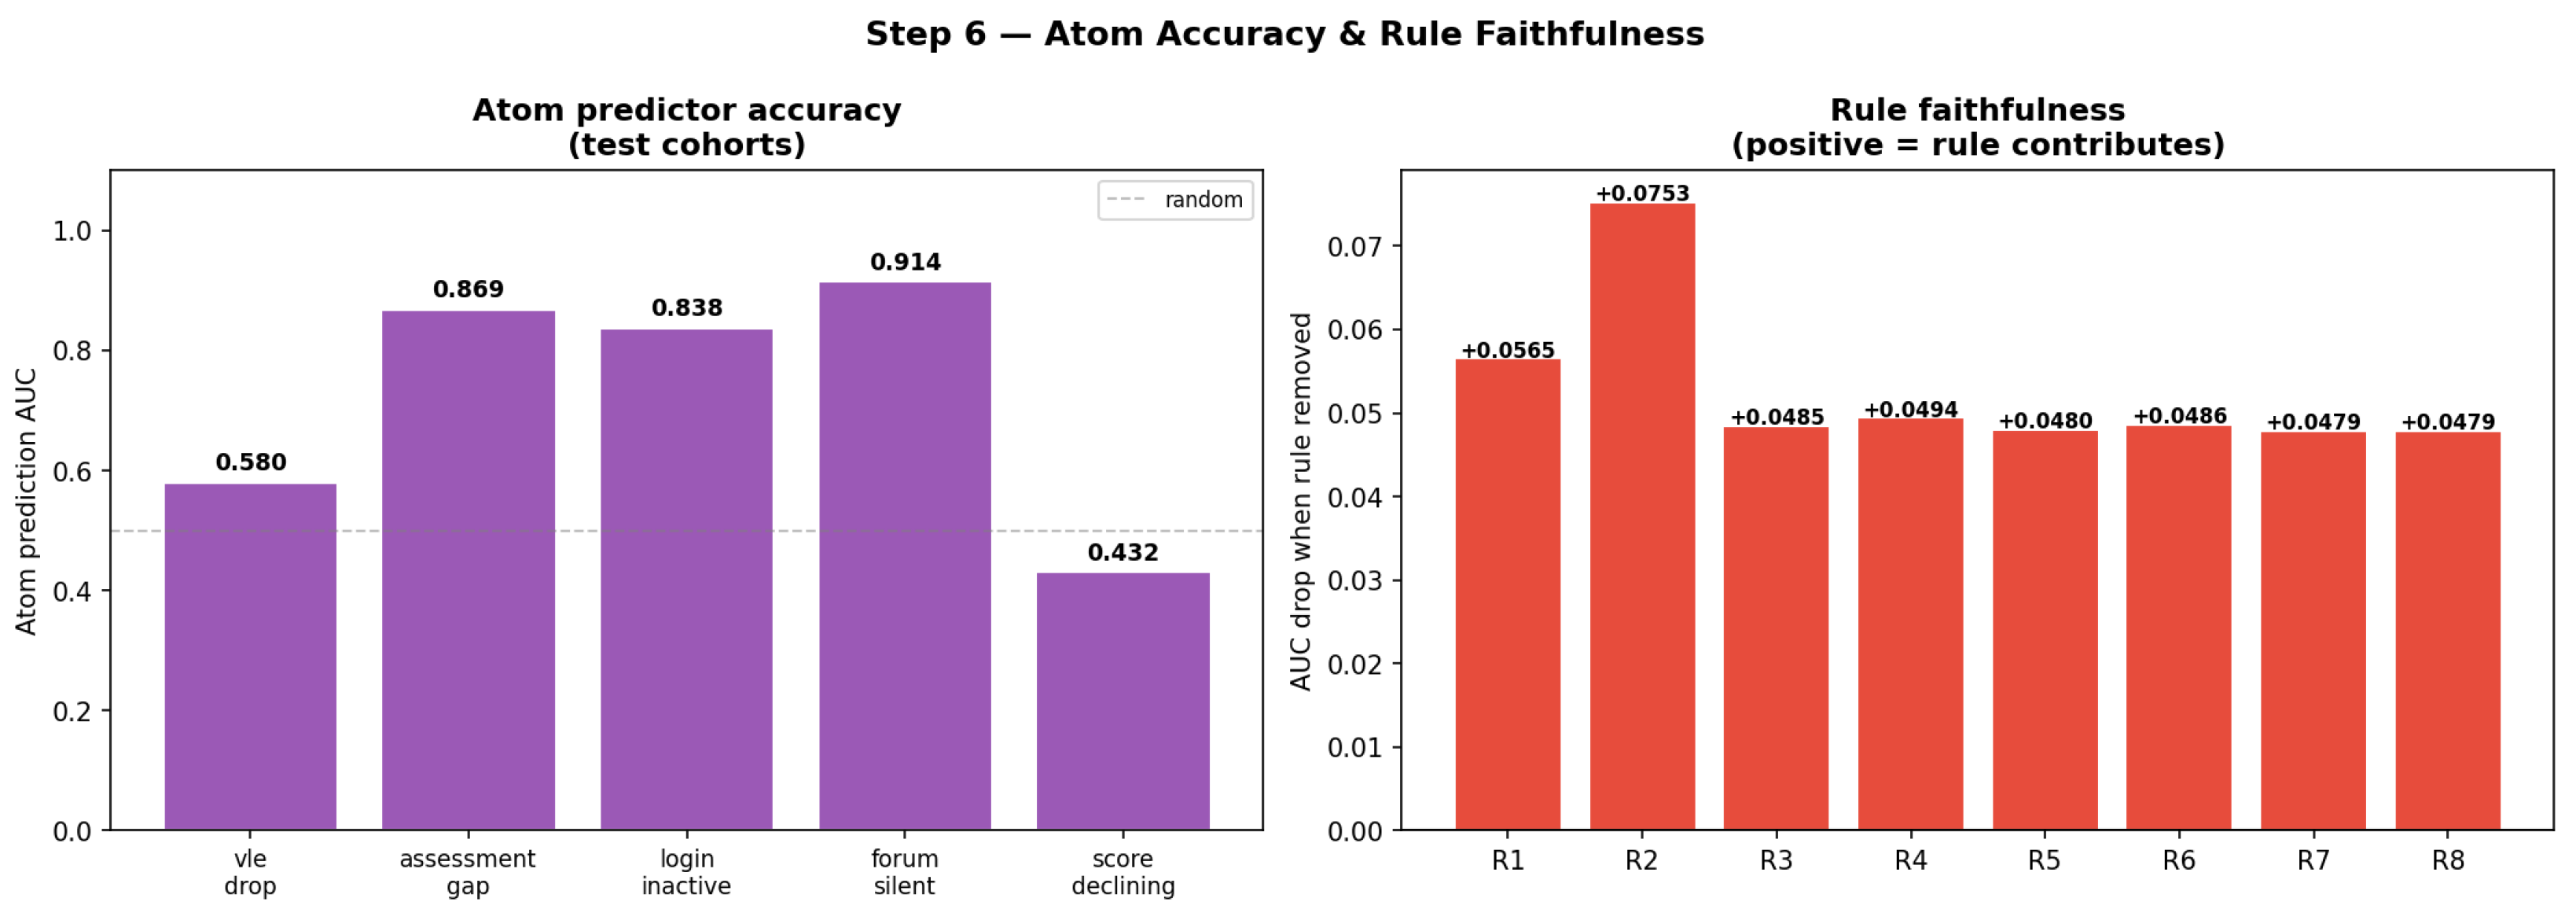
Table 8 reports the learned rule weights and faithfulness scores for all eight rules after training. Faithfulness is measured as the AUC drop when each rule is individually removed from the model, quantifying the unique contribution of each rule to predictive performance. All eight rules achieve positive faithfulness scores, confirming that every rule contributes positively and none are redundant. R2 (login_inactive ∧ forum_silent) achieves the highest faithfulness score of , identifying the co-occurrence of platform inactivity and social silence as the single most critical dropout signal in the dataset. R1 (assessment_gap ∧ login_inactive) follows closely with a faithfulness of , reflecting the strong discriminative power of the combination of submission failure and platform withdrawal. The composite rules R7 and R8, while capturing the most severe multi-atom disengagement patterns, have lower faithfulness scores than the pairwise rules, suggesting that their firing conditions are already largely covered by the individual pairwise rules when multiple atoms co-occur. Figure 11 visualizes the atom predictor accuracy and rule faithfulness scores.
Figure 11.
Atom predictor AUC per atom (left) and rule faithfulness scores across all eight rules (right).
4.6.2. SHAP Analysis
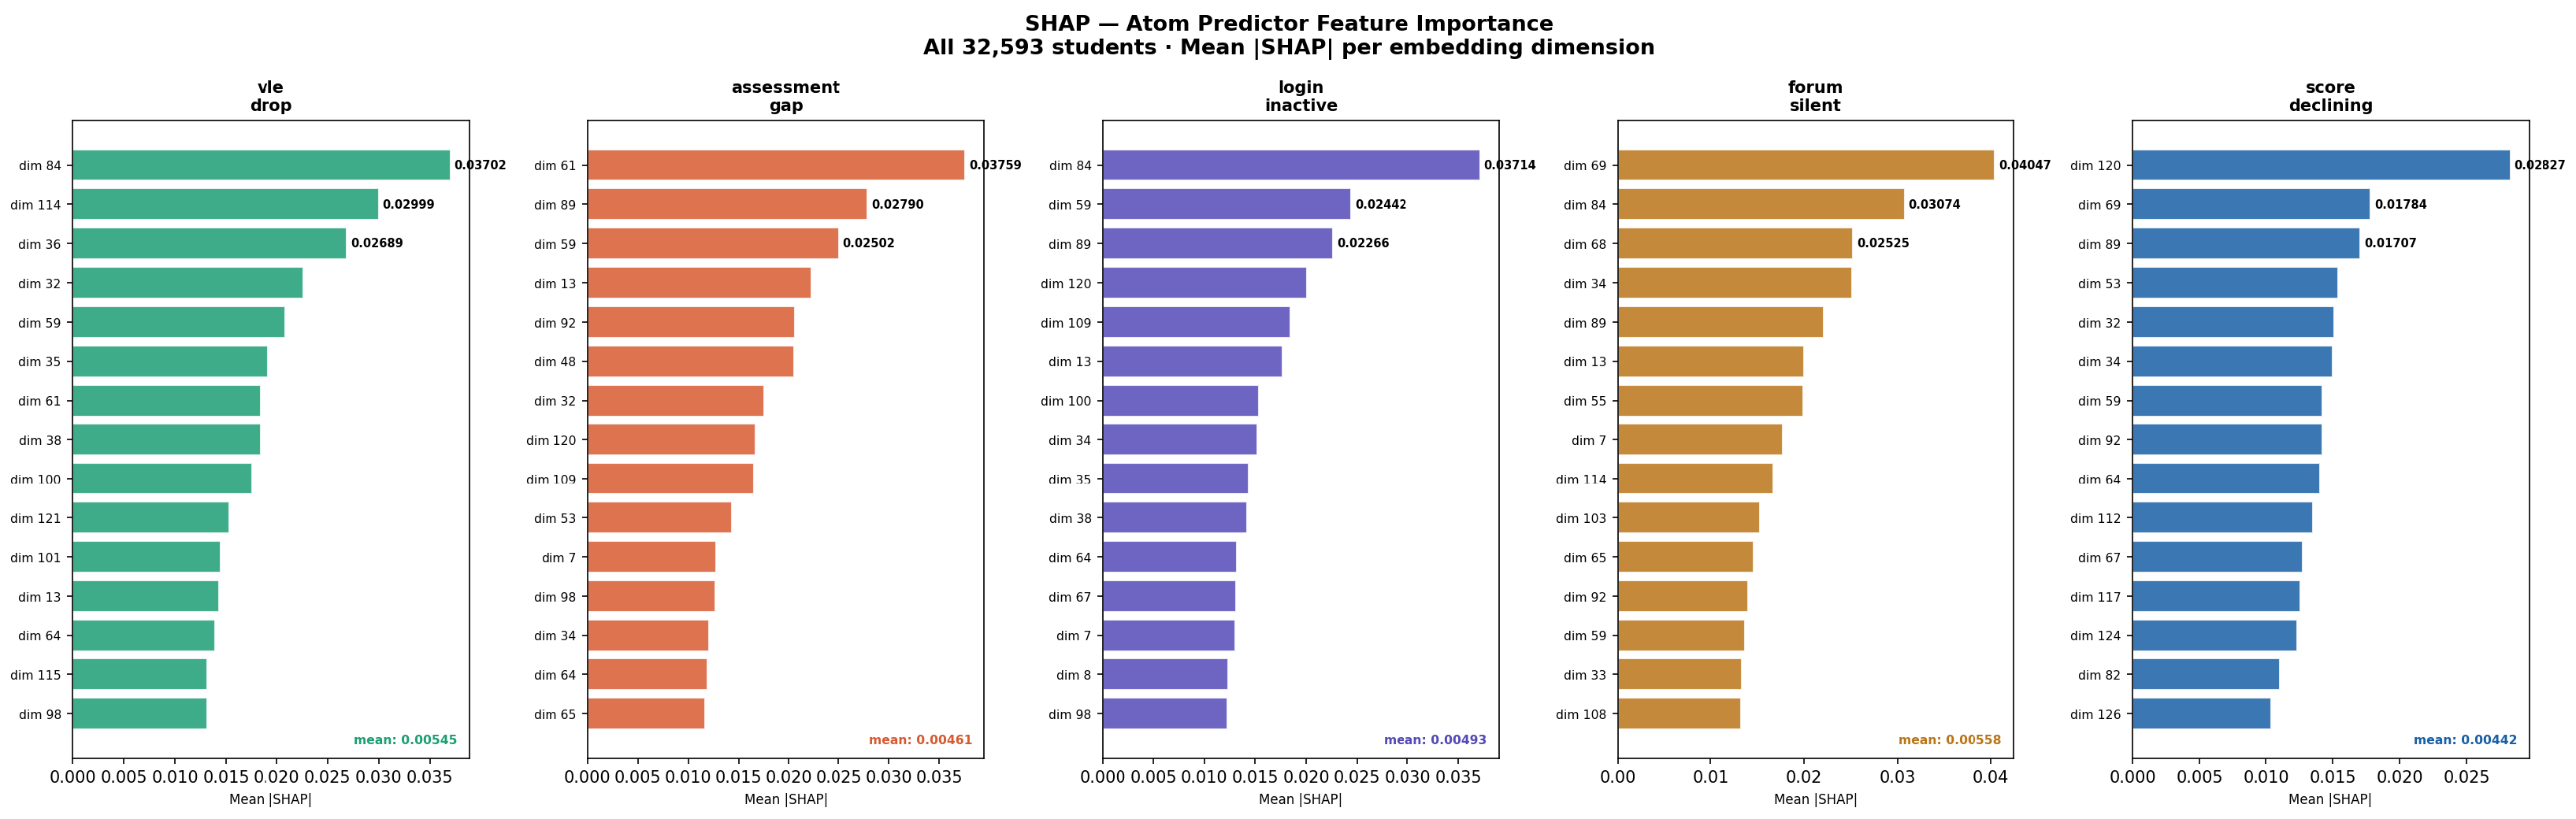
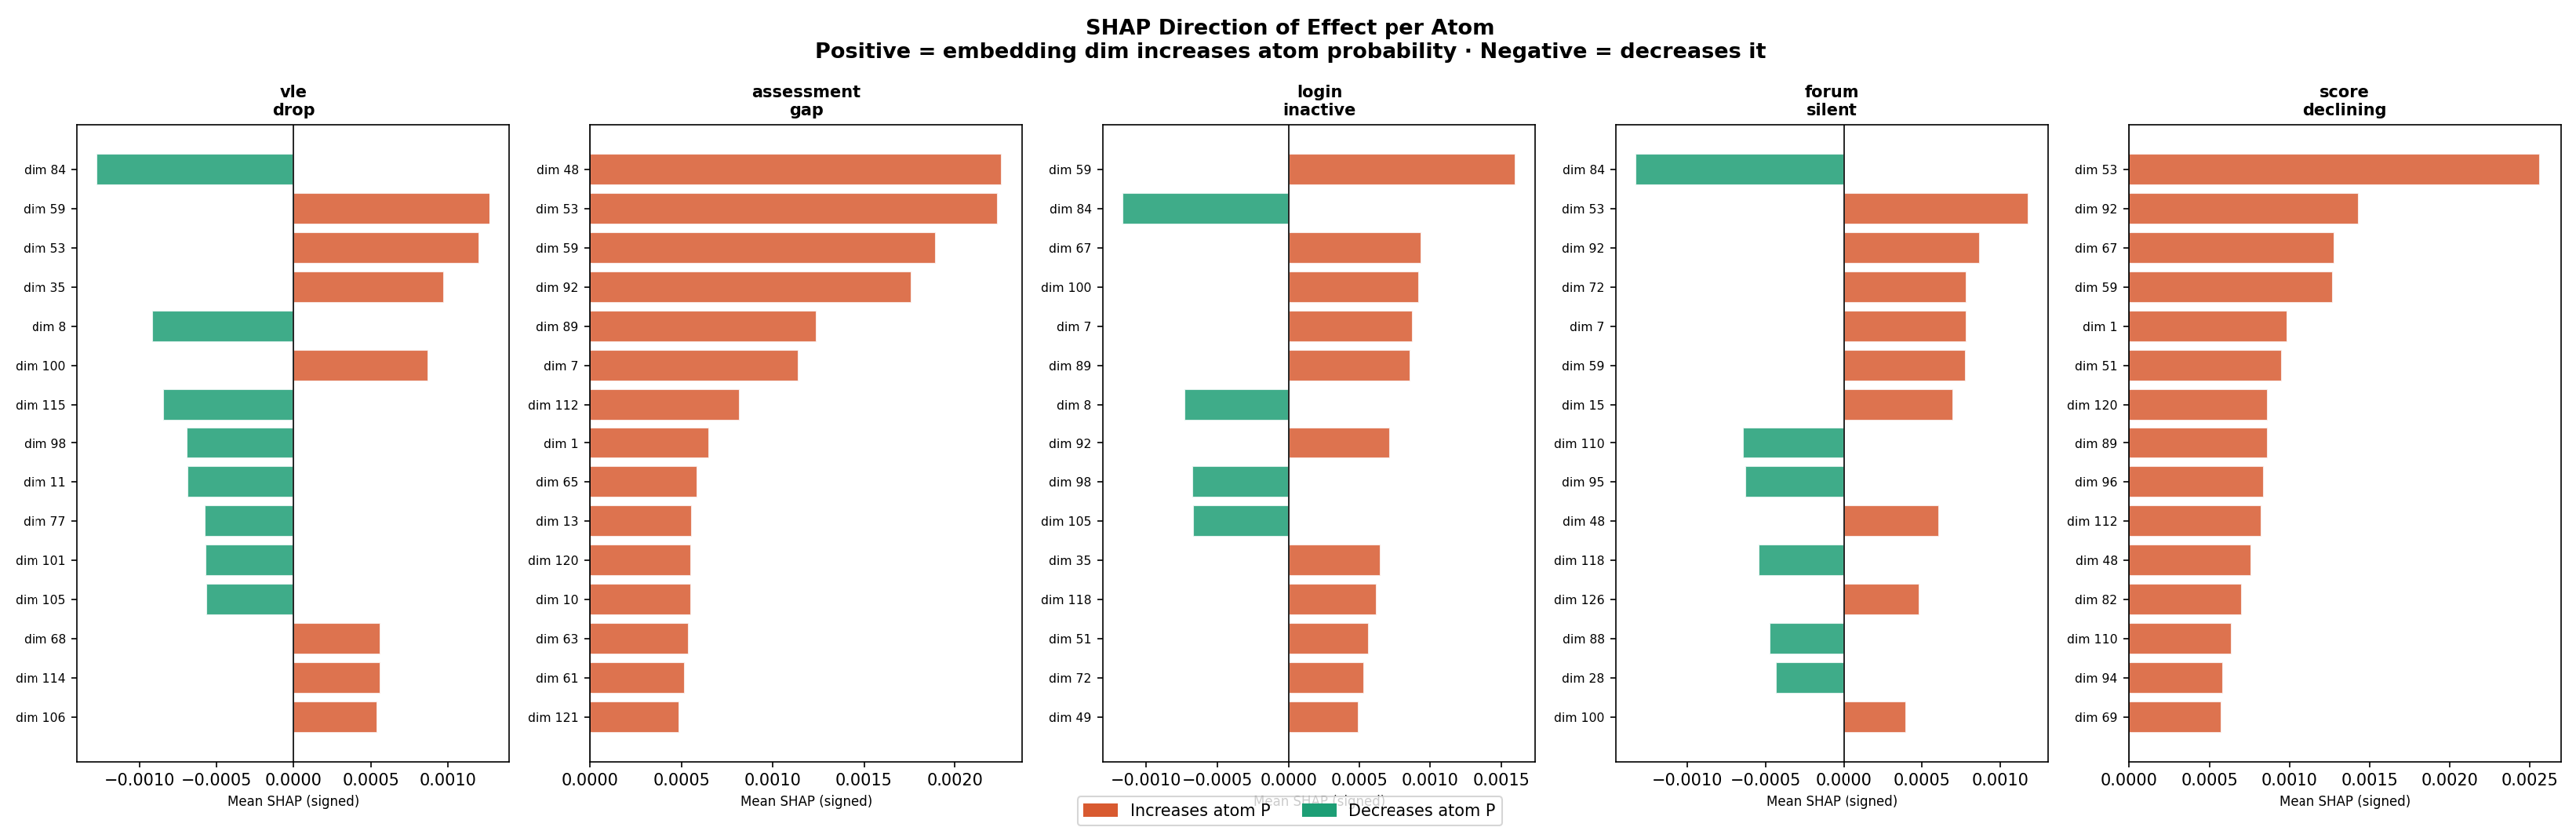
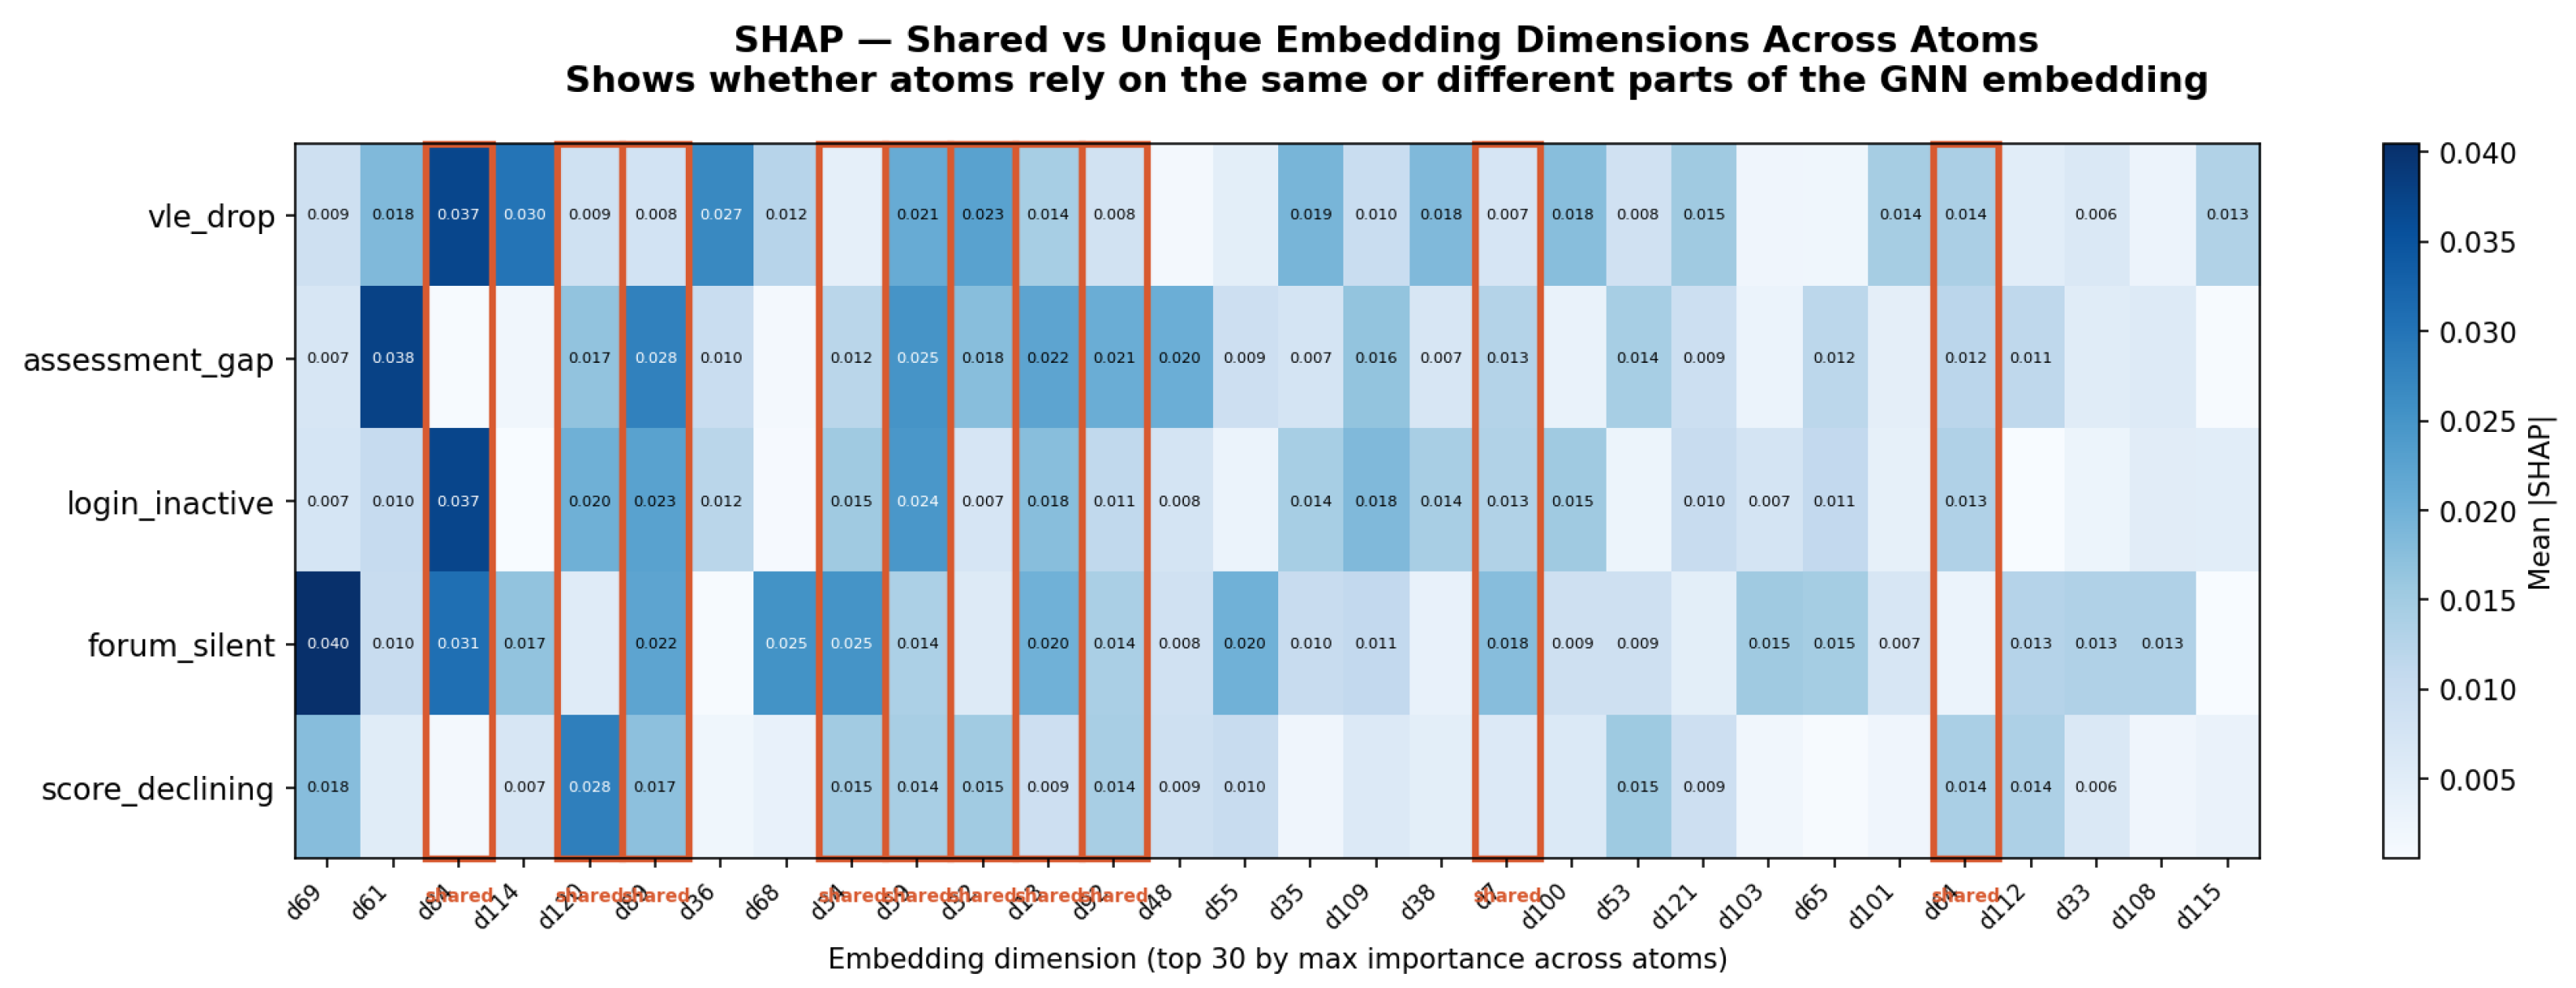
Figure 12 shows the top-15 embedding dimensions by mean for each atom MLP across all 32,593 students. The analysis reveals a structured specialization in the learned 128-dimensional embedding that reflects the behavioral distinctions between atoms. Dimension 84 functions as a shared inhibitory signal for vle_drop, login_inactive, and forum_silent, encoding general platform engagement that simultaneously suppresses all three disengagement atoms. This shared dimension suggests that the GNN encoder learns a single general engagement axis that underlies multiple behavioral alarm signals. Dimension 61 is unique to assessment_gap and dimension 69 is unique to forum_silent, confirming that the embedding also contains behavior-specific representations that encode academically distinct dropout pathways independently. Figure 13 shows the directional effects of each dimension per atom, distinguishing excitatory from inhibitory contributions. Figure 14 visualizes the shared versus unique dimension structure across all five atoms, confirming that the learned embedding captures both general and specialized behavioral signals simultaneously.
Figure 12.
Top-15 embedding dimensions by mean per atom MLP aggregated across all 32,593 students.
Figure 13.
Direction of effect per embedding dimension per atom: Excitatory dimensions increase atom probability while inhibitory dimensions decrease it.
Figure 14.
Shared versus unique embedding dimensions across the five atoms, revealing which dimensions encode general behavioral signals and which are atom-specific.
4.6.3. LIME Analysis
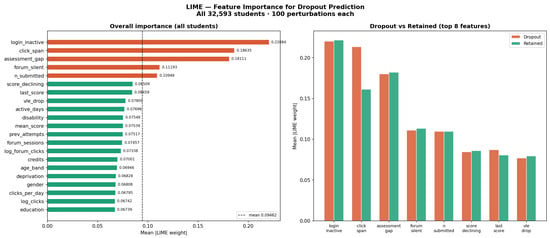
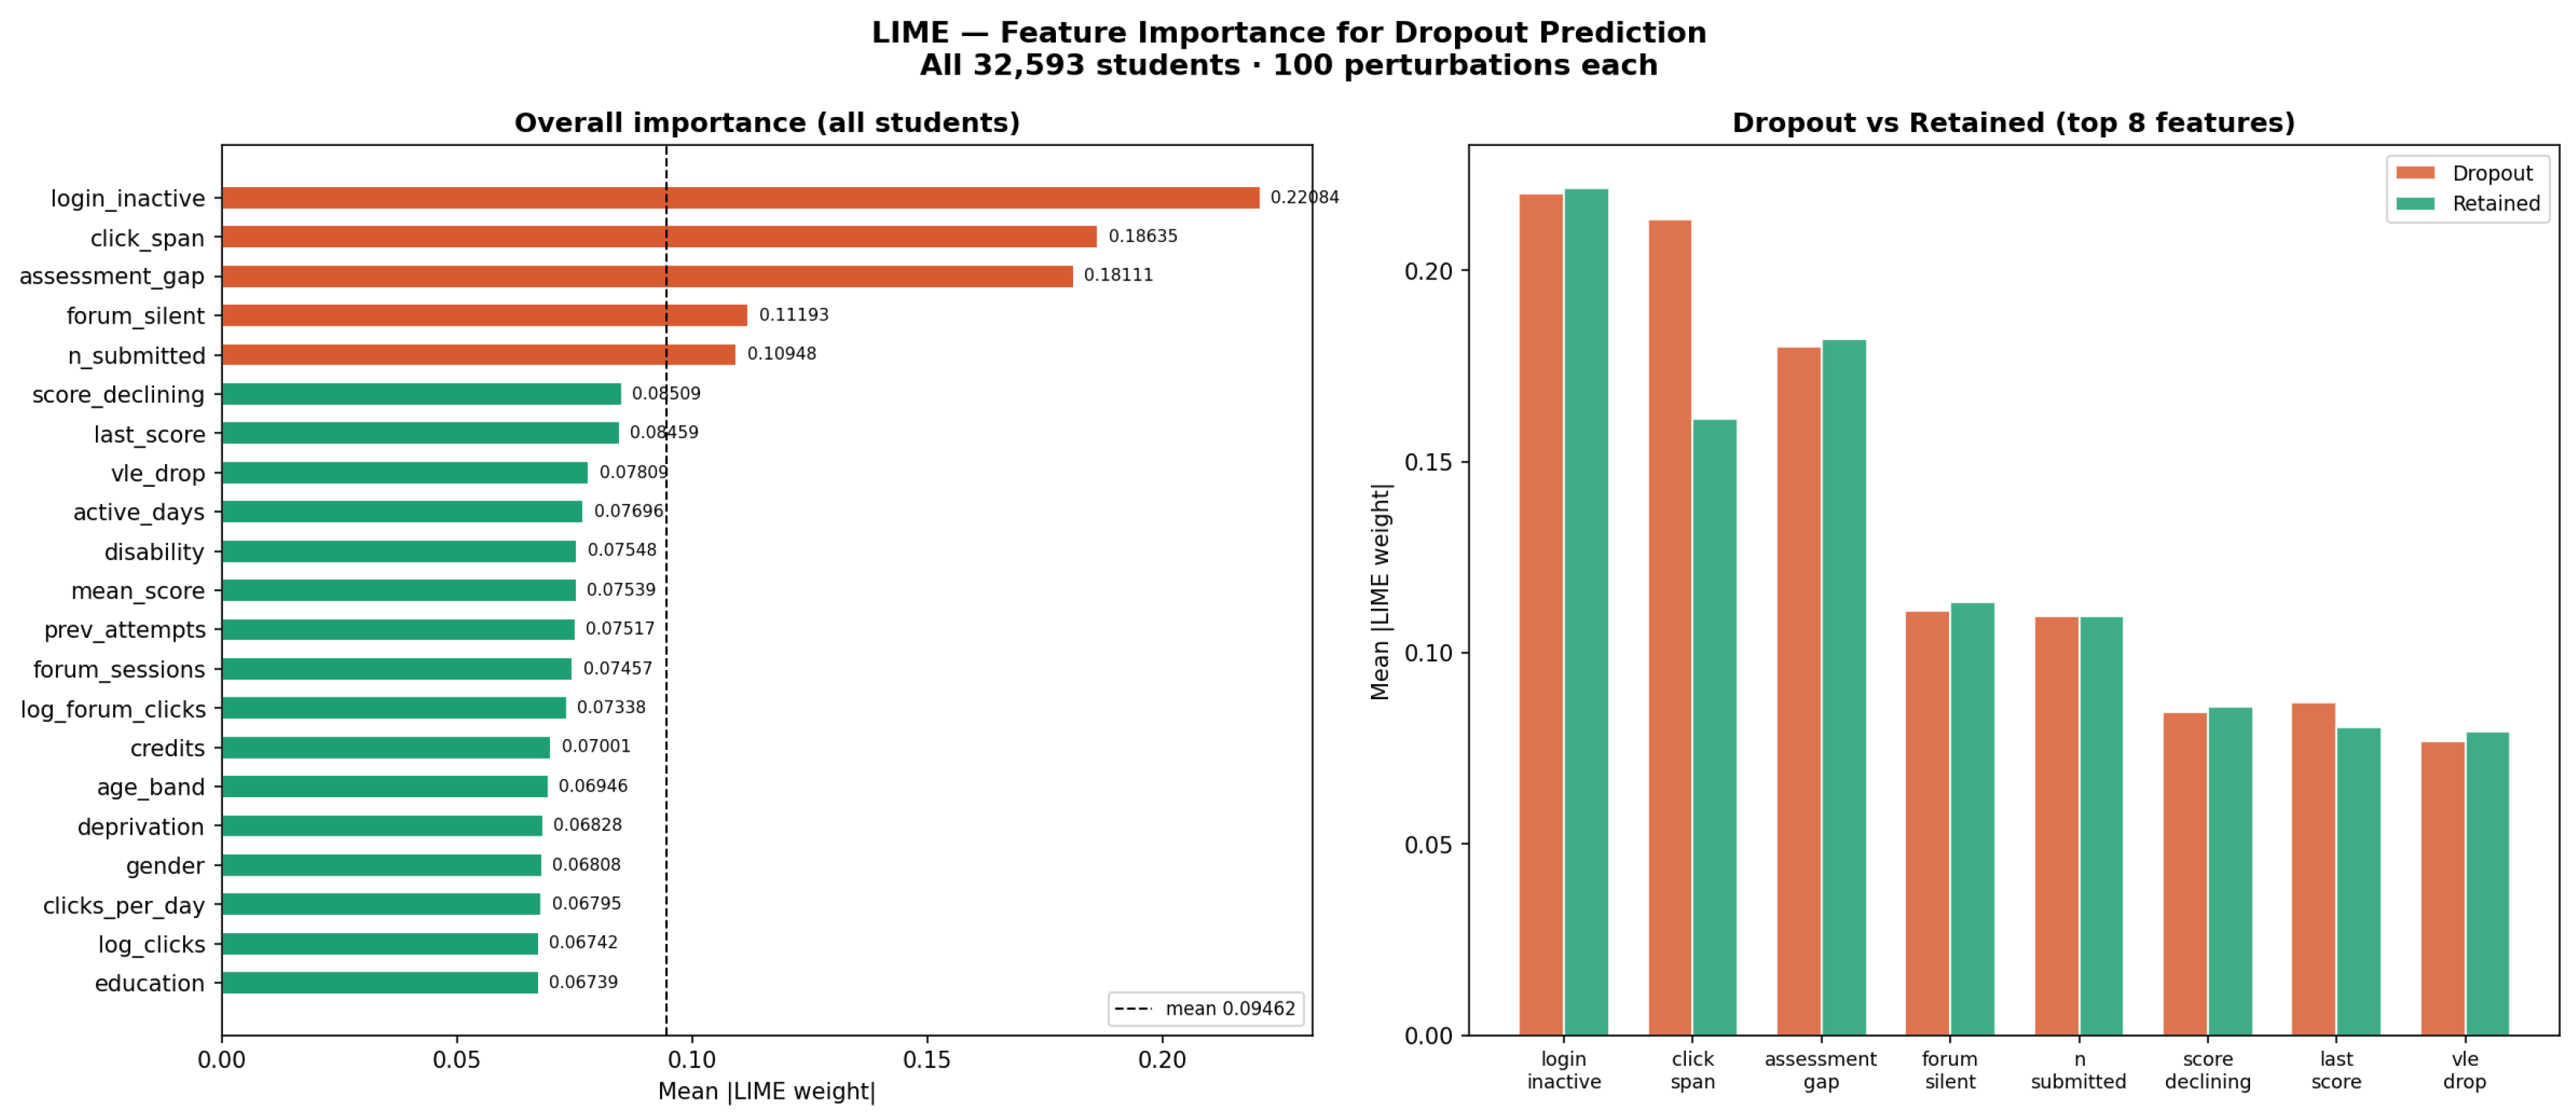
Figure 15 shows the population-level LIME feature importance aggregated across all 32,593 students. login_inactive (0.221), click_span (0.186), and assessment_gap (0.181) are identified as the three most influential raw features, consistent with the symbolic-level findings where R1 and R2—both involving login_inactive—achieve the highest faithfulness scores. This cross-level consistency between the symbolic explanation and the LIME raw-feature importance provides mutual validation: The two independent explanation methods agree on the underlying predictive structure of the model. The near-identical importance rankings for dropout and retained students confirm that the model uses the same feature space for both classes, differing only in magnitude—an indicator of model consistency rather than class-specific artifacts.
Figure 15.
LIME feature importance aggregated across all 32,593 students: overall feature ranking (left) and dropout versus retained comparison (right).
4.6.4. Counterfactual Analysis
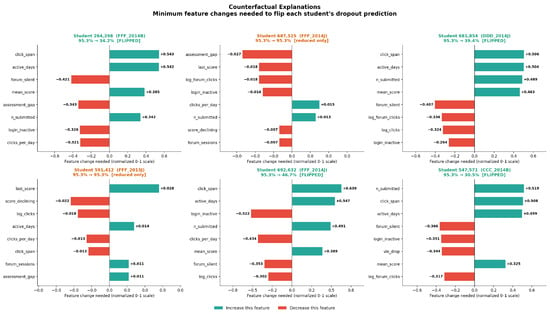
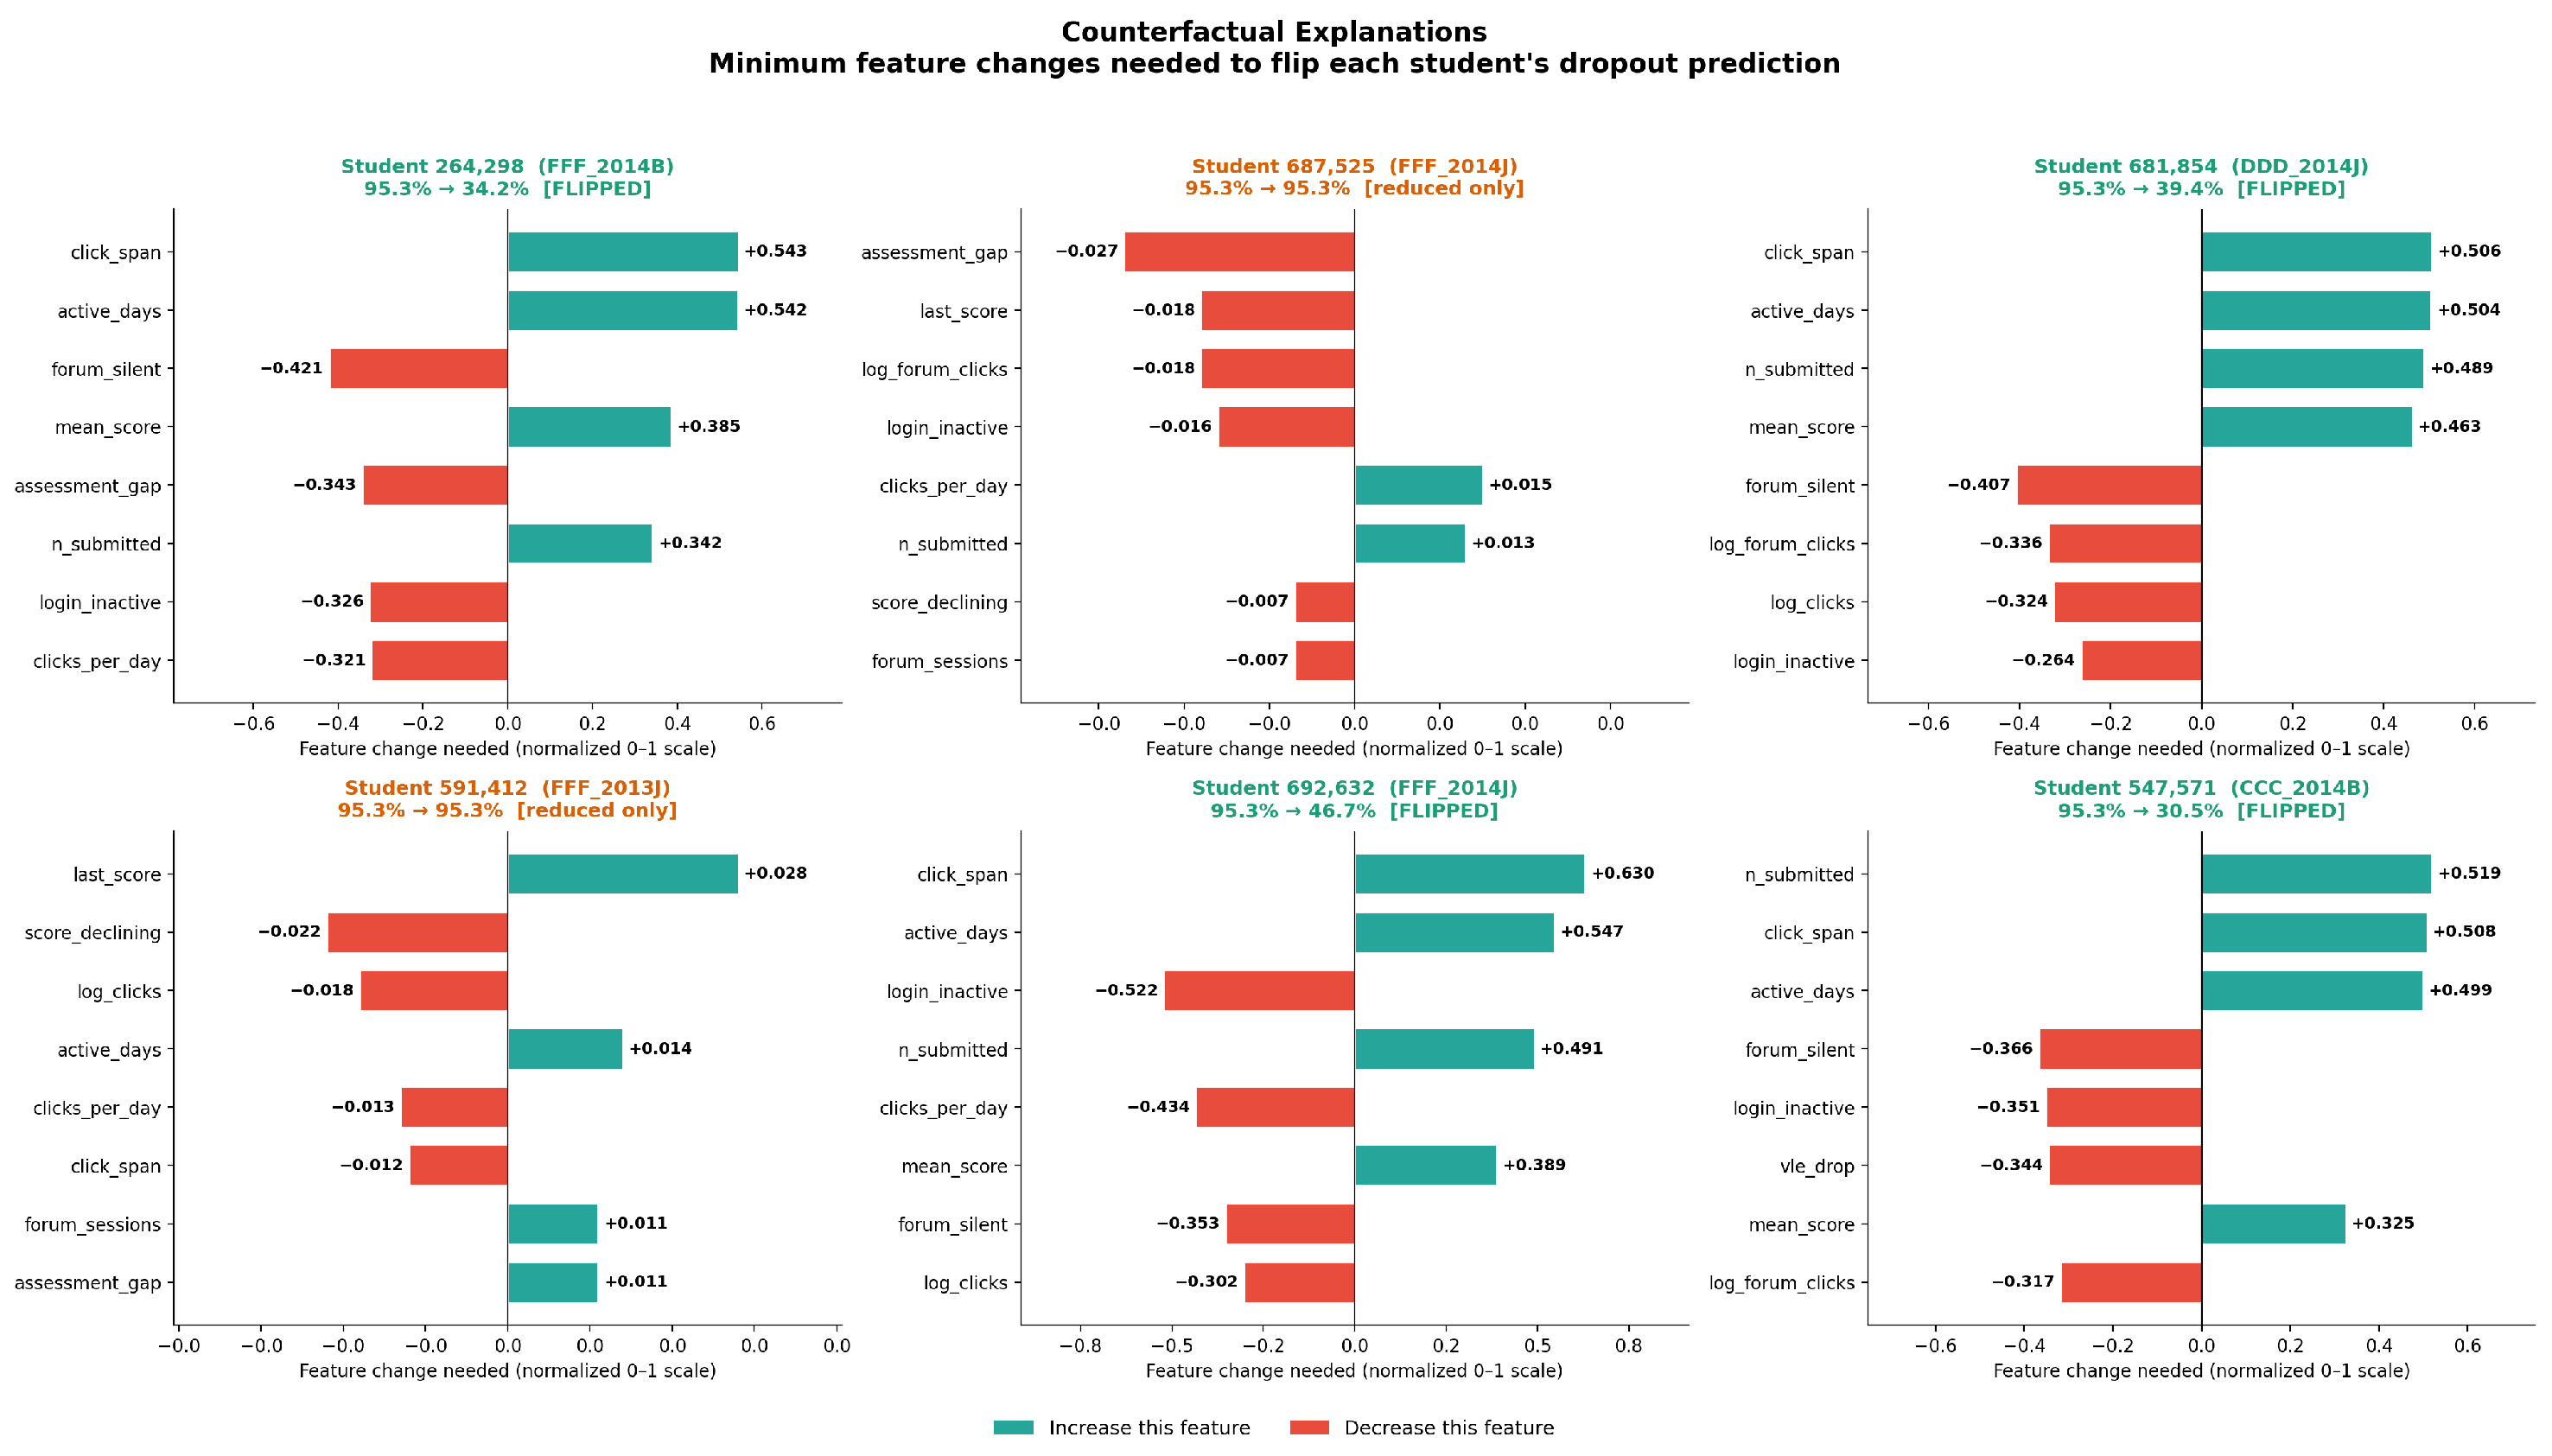
Figure 16 shows counterfactual explanations for six representative high-risk students. Among 20 high-risk students analyzed, 8 (40%) had their prediction successfully flipped to retained with a mean probability reduction of 0.234. The most commonly required behavioral changes across the population are increasing assessment submissions (95% of students), increasing VLE platform clicks (95%), and reducing the number of inactive days (80%). These population-level patterns are directly consistent with the intervention routing rules defined in Section 3.7: The dominance of submission-related and engagement-related changes motivates the resource recommendation and VLE reengagement interventions as the most frequent routing outcomes.
Figure 16.
Counterfactual explanations for six high-risk students showing the minimum feature changes required to flip the dropout prediction to retained.
4.7. Intervention Analysis
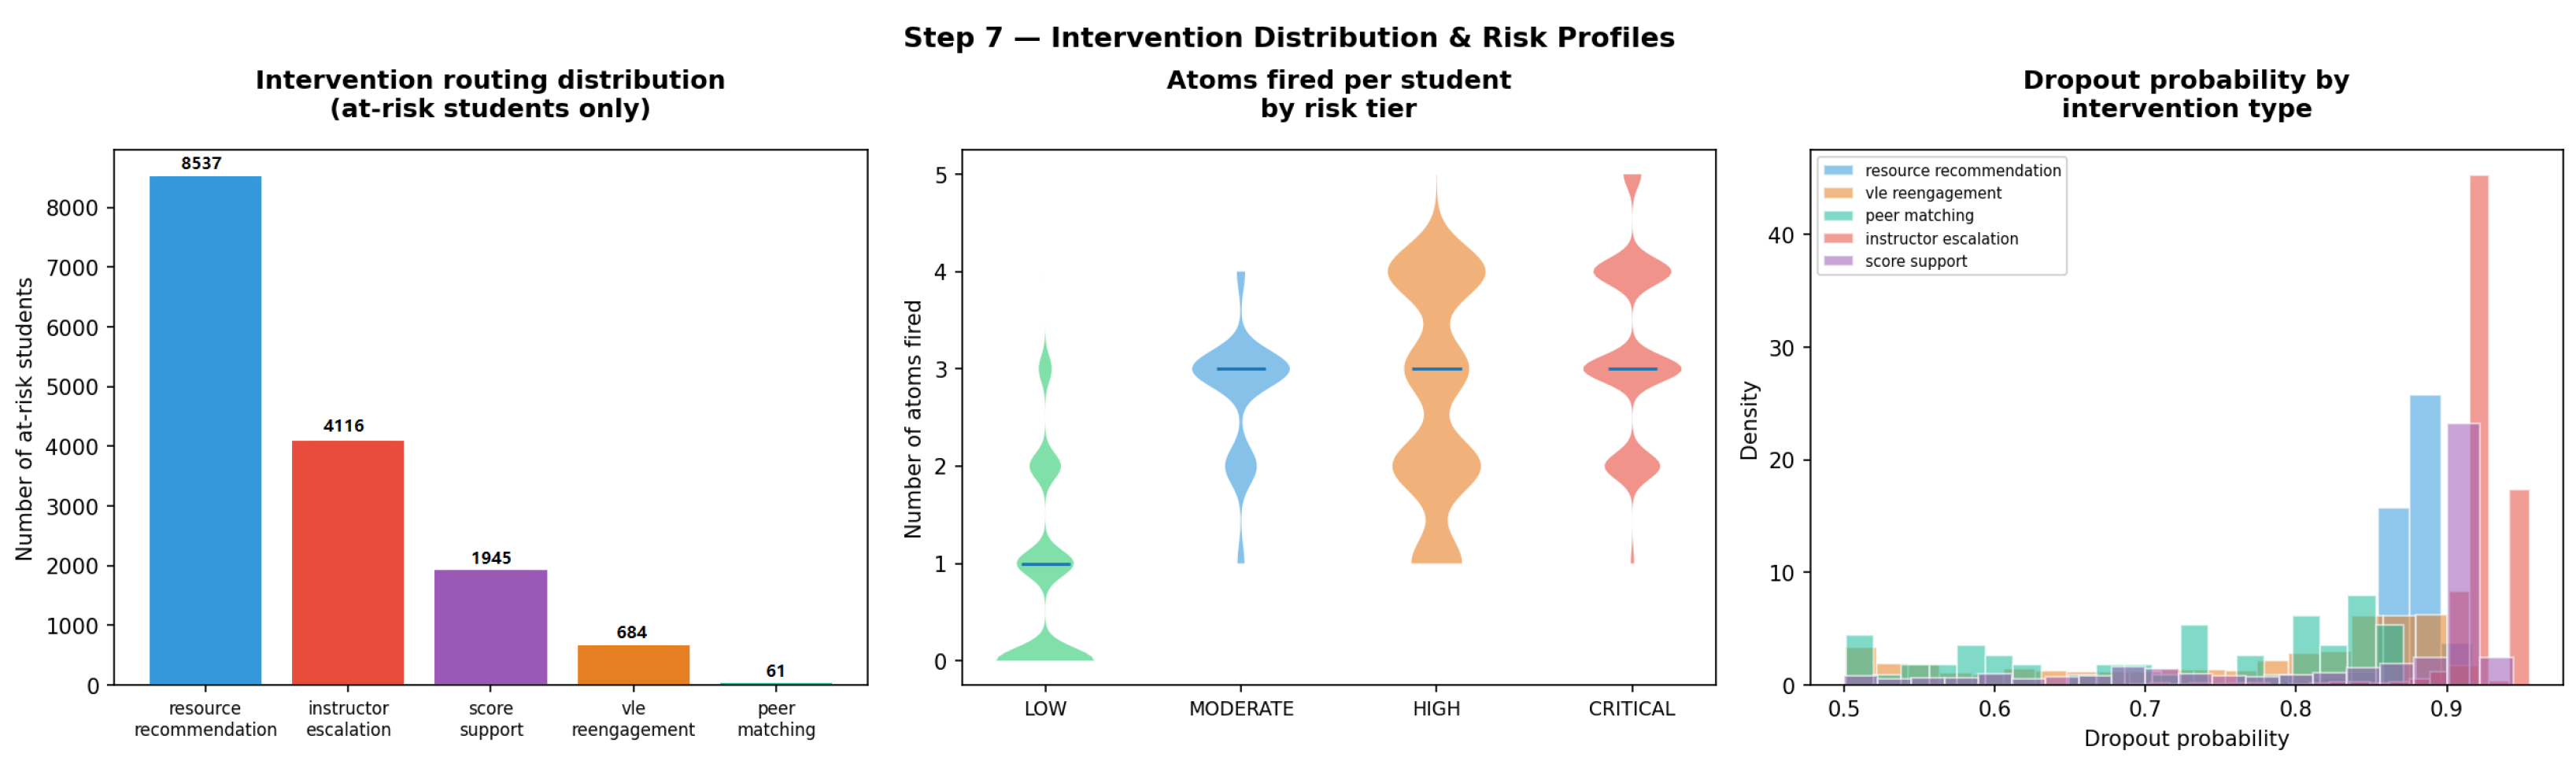
Figure 17 shows the distribution of intervention types and severity levels across the 15,343 at-risk students identified in the test and validation cohorts. Resource recommendation is the most frequent intervention (55.6%), reflecting the high prevalence of assessment_gap as the dominant alarm among early-stage at-risk students. Instructor escalation accounts for 26.8% of cases, reserved for students with all four core disengagement atoms firing simultaneously and always assigned urgent severity. Score support (12.7%), VLE reengagement (4.5%), and peer matching (0.4%) cover the remaining at-risk population, each targeting a distinct behavioral profile.
Figure 17.
Distribution of intervention types and severity levels across 15,343 at-risk students in the test and validation cohorts.
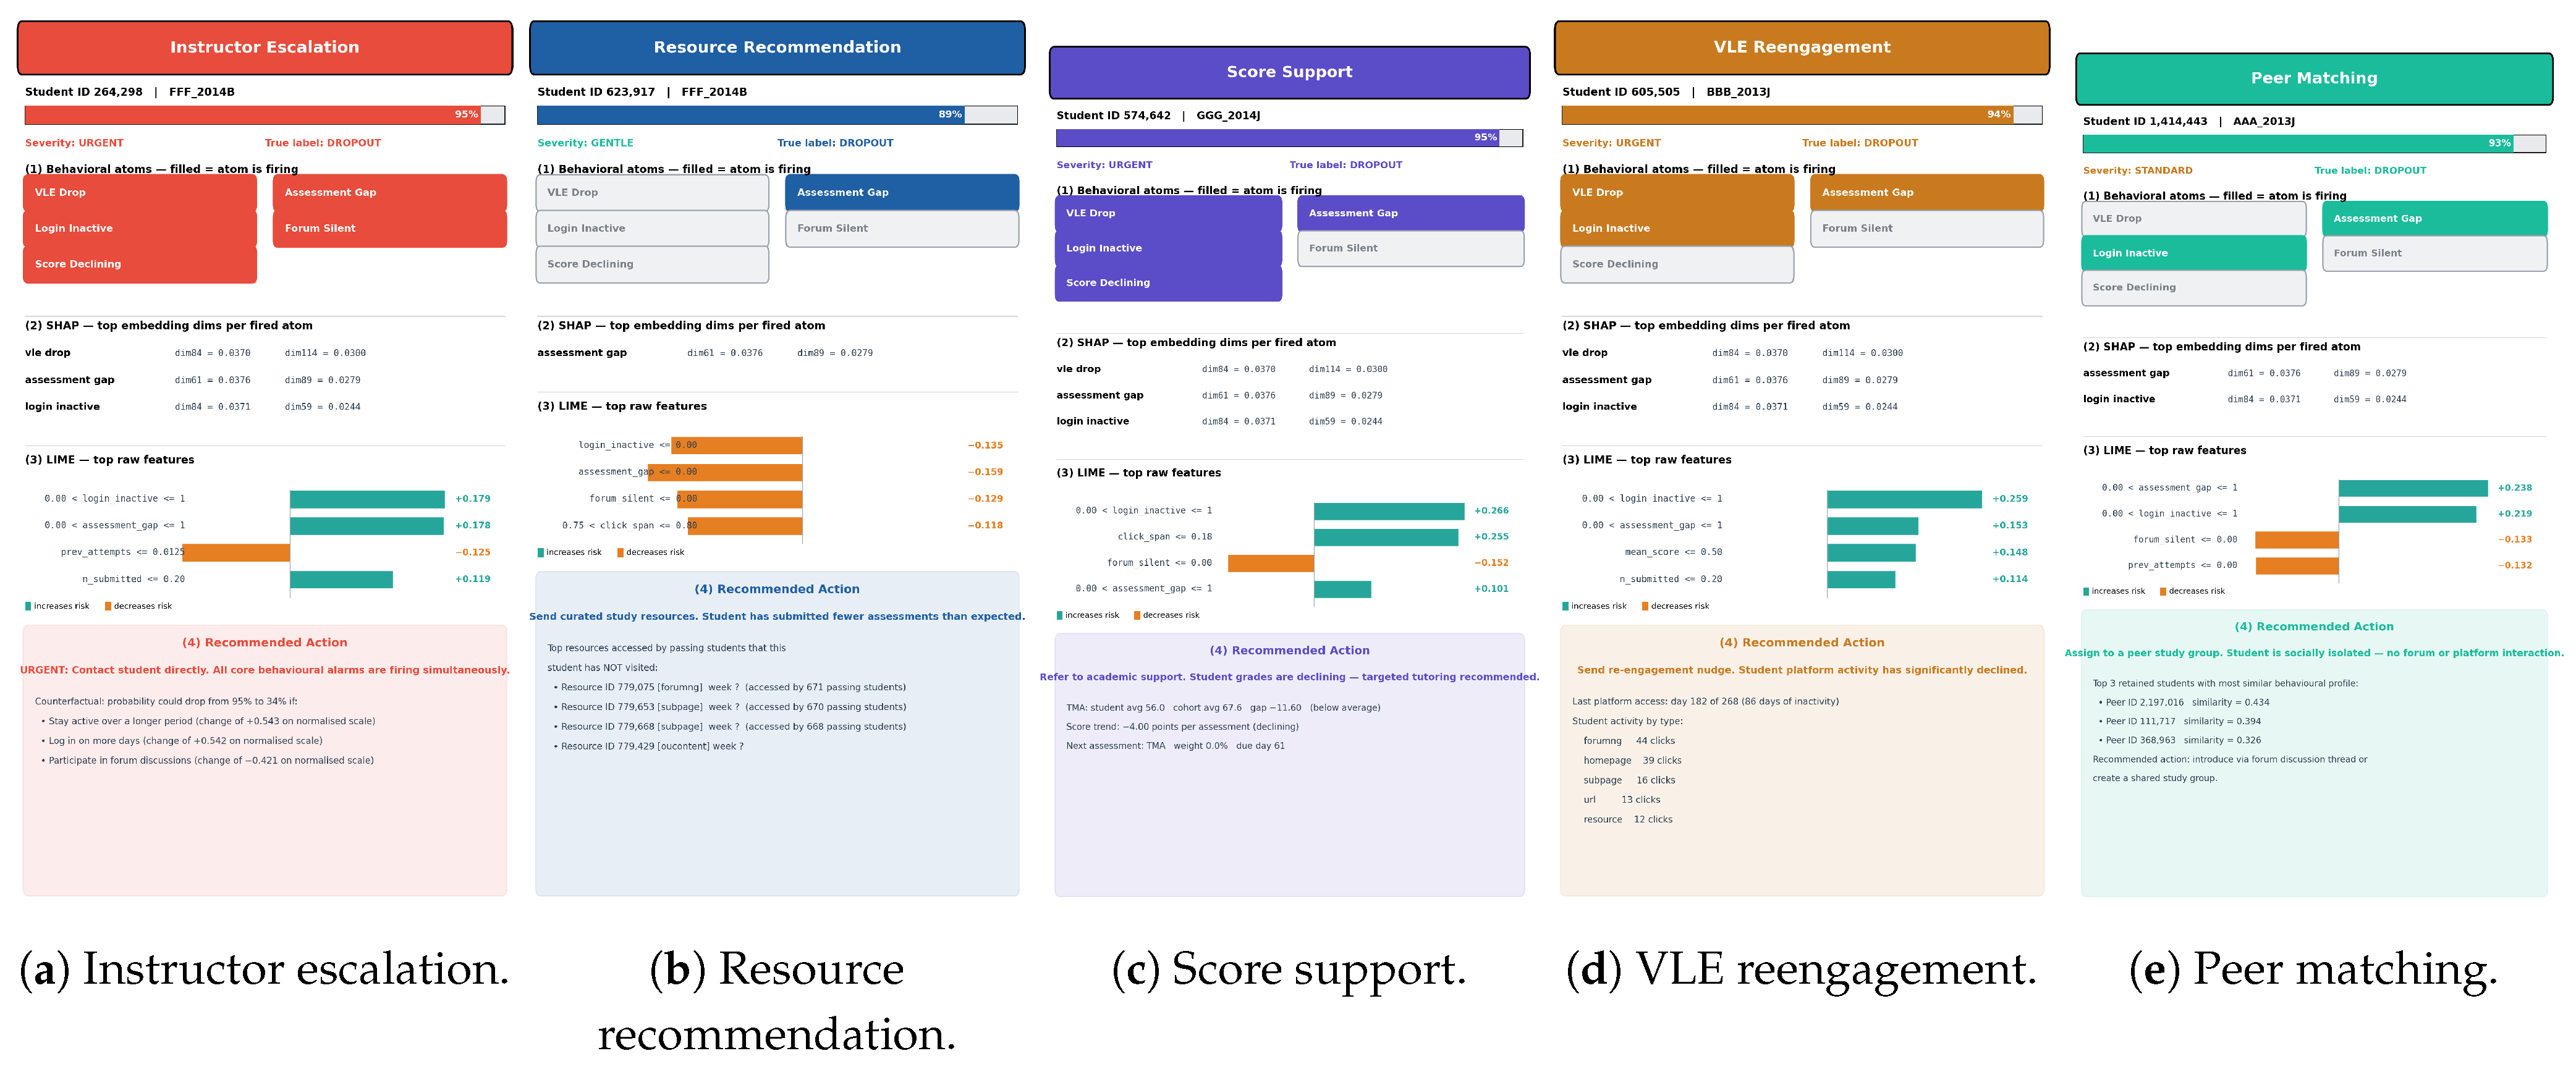
Figure 18 presents the five intervention cards generated by NeSy-Drop for one representative student per intervention type. Each card integrates four information layers: the fired behavioral atoms, the top SHAP embedding dimensions per fired atom, the top LIME raw features with directional bars, and a concrete data-driven recommended action specific to the intervention type. The instructor escalation card provides a counterfactual prescription quantifying the exact behavioral changes needed to reduce dropout probability. The resource recommendation card lists specific unvisited VLE pages ranked by retained-student access frequency. The score support card reports the per-assessment-type score gap against the cohort mean and the next assessment deadline. The VLE reengagement card reports the exact days of inactivity and the student’s historical activity breakdown by resource type. The peer matching card identifies the top-3 retained students with the most similar behavioral profile by cosine similarity of GNN embeddings.
Figure 18.
Per-student intervention cards for one representative student per intervention type. (a) Instructor escalation: counterfactual prescription with quantified behavioral changes. (b) Resource recommendation: specific unvisited VLE pages ranked by retained-student access frequency. (c) Score support: per-assessment-type score gap against cohort mean and next deadline. (d) VLE reengagement: days of inactivity and activity breakdown by resource type. (e) Peer matching: top-3 retained students by GNN embedding cosine similarity.
5. Discussion
5.1. RQ1: Prediction Performance
NeSy-Drop achieves a test AUC of 0.961 under the fair evaluation protocol (Setting B), compared to 0.983 for the best non-interpretable baseline (random forest)—a gap of 2.2 AUC points. This answers RQ1 affirmatively: A neuro-symbolic graph learning approach can achieve competitive dropout prediction accuracy, with the cost of full symbolic interpretability and integrated intervention routing being marginal in absolute terms.
The diagnostic experiment (Setting C, AUC = 0.912) reveals an initially counterintuitive result: Providing the model with ground-truth atom labels reduces performance compared to the standard setting. This can be explained by the fact that the diagnostic variant bypasses the GNN encoder’s learned embeddings entirely for the rule layer, removing the rich relational context captured by Tier 1. It confirms that the GNN embeddings carry predictive information beyond what the five binary atoms alone can encode and that the neuro-symbolic architecture succeeds precisely because it integrates both levels. The gap between the standard NeSy-Drop (0.961) and the best black-box baseline (0.983) is therefore primarily attributable to the atom MLP prediction accuracy rather than to any fundamental limitation of the symbolic rule layer.
The GNN-only baseline (AUC = 0.981) is particularly informative. It achieves near-state-of-the-art performance without any symbolic structure, confirming that the heterogeneous graph representation itself contributes substantially to predictive performance. The difference between GNN-only (0.981) and NeSy-Drop (0.961)—approximately 2 AUC points—represents the specific cost of the symbolic constraint imposed by the rule layer. We argue this is an acceptable and practically justified trade-off given the faithfulness guarantee provided by the ante hoc explanation.
The per-cohort generalization results further support a positive answer to RQ1: NeSy-Drop achieves a mean test AUC of across three diverse test cohorts spanning different module types, dropout rates ranging from 29% to 66%, and cohort sizes from 357 to 2481 students. This stability confirms that the heterogeneous graph construction strategy successfully captures generalizable behavioral patterns rather than cohort-specific artifacts.
5.2. RQ2: Interpretability Without Significant Performance Cost
The ablation study directly addresses RQ2. Replacing learned rule weights with uniform equal weights causes the largest single performance drop in the entire ablation (), demonstrating that the symbolic rule layer is not a passive wrapper around the GNN—it actively contributes to predictive performance through learned weight differentiation. The symbolic structure therefore earns its place in the architecture on predictive grounds alone, independent of the interpretability argument.
The faithfulness analysis confirms the second part of RQ2. All eight rules achieve positive faithfulness scores, with R2 (login_inactive ∧ forum_silent, faithfulness ) and R1 (assessment_gap ∧ login_inactive, faithfulness ) emerging as the most discriminative combinations. These two rules share login_inactive as a common antecedent, which is also the top-ranked feature in the LIME analysis (importance ) and is involved in the two highest-weight rules in Table 8. This three-way consistency—symbolic rule faithfulness, SHAP embedding attribution, and LIME raw-feature importance—provides strong evidence that the explanations produced at all three levels are mutually coherent and reflect genuine structure in the data rather than artifacts of any single explanation method.
The ante hoc nature of the symbolic explanation is a qualitative advantage that goes beyond what the quantitative metrics capture. Unlike SHAP and LIME, which approximate model behavior post hoc, the rule chain produced by Tier 2b is the literal computation that generated the prediction. An educator reading “assessment_gap ∧ login_inactive fired with strength 0.71, contributing 34% of the dropout score” is reading an exact account of the model’s decision process, not a surrogate. This distinction is critical in educational settings where accountability and auditability are required.
The SHAP analysis reveals an additional finding of theoretical interest: Dimension 84 of the learned 128-dimensional student embedding functions as a shared inhibitory signal for vle_drop, login_inactive, and forum_silent, suggesting that the HGT encoder learns a single general platform engagement axis that underlies three behaviorally distinct dropout signals. This is not something that could be discovered from the symbolic layer alone and illustrates why the three-level explainability stack provides genuinely complementary rather than redundant information.
5.3. RQ3: Actionability
The intervention routing engine answers RQ3 affirmatively. Among the 15,343 at-risk students identified across test and validation cohorts, every student receives a concrete, data-driven intervention recommendation without requiring any infrastructure beyond what is already present in a standard MOOC learning management system. Resource recommendation (55.6%) requires only the existing VLE access logs. Instructor escalation (26.8%) requires only a communication channel to the instructor, parameterized by the counterfactual prescription. Score support (12.7%) requires only the assessment submission records. VLE reengagement (4.5%) requires only the login timestamp logs. Peer matching (0.4%) requires the stored GNN embeddings, computed at training time.
The counterfactual analysis provides additional evidence for actionability: Among 20 high-risk students analyzed, 8 (40%) had their predicted probability reduced below 50% with a mean probability reduction of 0.234, achieved through minimal changes to actionable features. The most commonly prescribed changes—increasing assessment submissions (95% of students) and increasing VLE clicks (95%)—directly motivate the resource recommendation and VLE reengagement interventions as the dominant routing outcomes, creating a principled connection between the counterfactual analysis and the intervention design.
The severity stratification (gentle, standard, and urgent) adds a practical dimension that pure risk scores cannot provide: An instructor receiving an urgent escalation for a student with four simultaneously fired atoms knows immediately that this case requires direct personal contact, while a gentle resource recommendation for a single-atom student can be handled through an automated nudge. This structured severity system reduces the cognitive load on instructors and enables triage across large student cohorts.
5.4. Limitations
Several limitations should be acknowledged. First, the counterfactual analysis was conducted on a subset of 20 students in quick mode due to computational constraints. Full-population counterfactual coverage across all 15,343 at-risk students remains a computational challenge and is a priority for future work.
Second, the score_declining atom predictor achieves lower accuracy than the other four atoms, reflecting the inherent difficulty of estimating score trajectory from the learned embedding when submission counts are low. Explicit temporal modeling of assessment sequences may improve this atom’s predictive power.
Third, NeSy-Drop is evaluated exclusively on OULAD, which covers a specific institutional context (UK Open University) and course structure. Generalization to video-based MOOC platforms, discussion-heavy courses, or non-Western educational contexts requires additional validation.
Fourth, the cohort-level graph construction requires retraining or fine-tuning for each new course presentation, since resource and assessment node sets differ across cohorts. This creates a deployment overhead that transfer learning or inductive GNN extensions could address.
Fifth, the intervention routing is deterministic and rule-based. A probabilistic routing mechanism that accounts for uncertainty in atom predictions—particularly near atom firing thresholds—could improve routing quality for borderline cases.
6. Conclusions
This paper presented NeSy-Drop, a neuro-symbolic framework for interpretable dropout prediction and personalized intervention routing in MOOCs. The system addresses three research questions that collectively target the gap between predictive accuracy and practical utility in learning analytics: whether a neuro-symbolic graph approach can match black-box baselines under fair evaluation (RQ1), whether symbolic rules provide faithful explanations without significant performance cost (RQ2), and whether the system can translate predictions into actionable instructor recommendations without additional infrastructure (RQ3).
The experimental results on 32,593 students across 22 OULAD cohorts provide affirmative answers to all three questions. NeSy-Drop achieves a test AUC of 0.961 under a fair evaluation protocol, within 2.2 AUC points of the best non-interpretable baseline, while providing the only system in this evaluation that simultaneously predicts, explains, and prescribes actions at the individual student level. The differentiable rule layer contributes actively to predictive performance—removing learned rule weights causes a 6.5-point AUC drop—while the ante hoc symbolic explanations are guaranteed faithful by construction rather than approximated post hoc. The three-level explainability stack produces mutually consistent findings across symbolic, embedding, and raw-feature levels, providing cross-method validation of the underlying behavioral interpretation. The intervention routing engine maps every at-risk student to one of five concrete interventions at one of three severity levels using only data already available in a standard MOOC learning management system.
Three directions are identified for future work. First, extending counterfactual analysis to the full at-risk population requires more efficient gradient-based optimization strategies, as the current implementation is limited to a subset of students. Second, improving the score_declining atom predictor through explicit temporal modeling of assessment sequences would reduce the primary performance bottleneck identified by the diagnostic experiment. Third, investigating transfer learning strategies across cohorts would reduce the computational overhead of per-cohort graph retraining, making NeSy-Drop more practical for deployment in live MOOC environments with frequent new course presentations.
Author Contributions
Conceptualization, A.R. and S.D.; Methodology, A.R.; Software, A.R.; Validation, A.R., S.D. and K.B.; Formal analysis, A.R.; Investigation, A.R.; Data curation, A.R.; Writing—original draft preparation, A.R.; Writing—review and editing, S.D., K.B., Y.L. and S.G.; Visualization, A.R.; Supervision, S.D. and K.B.; Project administration, S.D. All authors have read and agreed to the published version of the manuscript.
Funding
This research received no external funding.
Institutional Review Board Statement
Not applicable.
Informed Consent Statement
Not applicable.
Data Availability Statement
The Open University Learning Analytics Dataset (OULAD) used in this study is publicly available at https://analyse.kmi.open.ac.uk/open-dataset [13]. The source code for NeSy-Drop is available from the corresponding author upon reasonable request.
Acknowledgments
The authors would like to thank the Open University for making the OULAD dataset publicly available. The authors used Claude Opus 4.6 (Anthropic) as an AI-assisted tool for grammar and language editing during the preparation of this manuscript. The authors have reviewed and edited the output and take full responsibility for the content of this publication.
Conflicts of Interest
The authors declare no conflicts of interest.
Abbreviations
The following abbreviations are used in this manuscript:
| AUC | Area Under the ROC Curve |
| BCE | Binary Cross-Entropy |
| CMA | Computer-Marked Assignment |
| GNN | Graph Neural Network |
| GRU | Gated Recurrent Unit |
| HGT | Heterogeneous Graph Transformer |
| LIME | Local Interpretable Model-Agnostic Explanations |
| LSTM | Long Short-Term Memory |
| ML | Machine Learning |
| MLP | Multi-Layer Perceptron |
| MOOC | Massive Open Online Course |
| MOOCs | Massive Open Online Courses |
| OULAD | Open University Learning Analytics Dataset |
| ReLU | Rectified Linear Unit |
| RF | Random Forest |
| ROC | Receiver Operating Characteristic |
| SHAP | SHapley Additive exPlanations |
| TMA | Tutor-Marked Assignment |
| VLE | Virtual Learning Environment |
| XAI | Explainable Artificial Intelligence |
References
- Celik, B.; Cagiltay, K. Uncovering MOOC Completion: A Comparative Study of Completion Rates from Different Perspectives. Open Prax. 2024, 16, 445–456. [Google Scholar] [CrossRef] [Scilit]
- Alamri, A.; Alshehri, M.; Alrajhi, L.; Cristea, A. Prediction of Certification in MOOCs: A Systematic Literature Review. ACM Comput. Surv. 2025, 58, 1–32. [Google Scholar] [CrossRef] [Scilit]
- Chefrour, A.; Namoun, A.; Khedairia, S.; Zemmal, N.; Alanazi, M.H. Predicting student performance in Massive Open Online Courses (MOOCs) using machine learning and deep learning techniques: A comprehensive survey. PeerJ Comput. Sci. 2026, 12, e3564. [Google Scholar] [CrossRef] [Scilit]
- Alghamdi, S.; Soh, B.; Li, A. ISELDP: An Enhanced Dropout Prediction Model Using a Stacked Ensemble Approach for In-Session Learning Platforms. Electronics 2025, 14, 2568. [Google Scholar] [CrossRef] [Scilit]
- Alghamdi, S.; Soh, B.; Li, A. A Novel Optimised Feature Selection Method for In-Session Dropout Prediction Using Hybrid Meta-Heuristics and Multi-Level Stacked Ensemble Learning. Electronics 2025, 14, 3703. [Google Scholar] [CrossRef] [Scilit]
- Ma, S.; Wang, W. Proactive Return Prediction in Online Fashion Retail Using Heterogeneous Graph Neural Networks. Electronics 2024, 13, 1398. [Google Scholar] [CrossRef] [Scilit]
- Ujkani, B.; Minkovska, D.; Hinov, N. Course Success Prediction and Early Identification of At-Risk Students Using Explainable Artificial Intelligence. Electronics 2024, 13, 4157. [Google Scholar] [CrossRef] [Scilit]
- Nagy, M.; Molontay, R. Interpretable dropout prediction: Towards XAI-based personalized intervention. Int. J. Artif. Intell. Educ. 2024, 34, 274–300. [Google Scholar] [CrossRef] [Scilit]
- Türkmen, G. The Review of Studies on Explainable Artificial Intelligence in Educational Research. J. Educ. Comput. Res. 2025, 63, 277–310. [Google Scholar] [CrossRef] [Scilit]
- Susnjak, T. Beyond predictive learning analytics modelling and onto explainable artificial intelligence with prescriptive analytics and ChatGPT. Int. J. Artif. Intell. Educ. 2024, 34, 452–482. [Google Scholar] [CrossRef] [Scilit]
- Lundberg, S.; Lee, S.I. A Unified Approach to Interpreting Model Predictions. arXiv 2017, arXiv:1705.07874. [Google Scholar] [CrossRef] [Scilit]
- Ribeiro, M.T.; Singh, S.; Guestrin, C. “Why Should I Trust You?”: Explaining the Predictions of Any Classifier. In KDD ’16: Proceedings of the 22nd ACM SIGKDD International Conference on Knowledge Discovery and Data Mining; Association for Computing Machinery: New York, NY, USA, 2016; pp. 1135–1144. [Google Scholar] [CrossRef] [Scilit]
- Kuzilek, J.; Hlosta, M.; Zdrahal, Z. Open University Learning Analytics Dataset. Sci. Data 2017, 4, 170171. [Google Scholar] [CrossRef] [Scilit] [PubMed]
- Swacha, J.; Muszyńska, K. Predicting Dropout in Programming MOOCs through Demographic Insights. Electronics 2023, 12, 4674. [Google Scholar] [CrossRef] [Scilit]
- Panagiotakopoulos, T.; Kotsiantis, S.; Kostopoulos, G.; Iatrellis, O.; Kameas, A. Early Dropout Prediction in MOOCs through Supervised Learning and Hyperparameter Optimization. Electronics 2021, 10, 1701. [Google Scholar] [CrossRef] [Scilit]
- Na, J.; Kim, K.W.; Kim, H.G. A Study on Exploiting Temporal Patterns in Semester Records for Efficient Student Dropout Prediction. Electronics 2025, 14, 4356. [Google Scholar] [CrossRef] [Scilit]
- Zanellati, A.; Zingaro, S.P.; Gabbrielli, M. Balancing Performance and Explainability in Academic Dropout Prediction. IEEE Trans. Learn. Technol. 2024, 17, 2086–2099. [Google Scholar] [CrossRef] [Scilit]
- Nitta, I.; Ishizaki, R.; Shingu, M.; Nakashima, S.; Maruhashi, K.; Tolmachev, A.; Todoriki, M. Graph-based Massive Open Online Course (MOOC) Dropout Prediction using Clickstream Data in Virtual Learning Environment. In Proceedings of the 2021 16th International Conference on Computer Science & Education (ICCSE); IEEE: Piscataway, NJ, USA, 2021; pp. 48–52. [Google Scholar] [CrossRef] [Scilit]
- Roh, D.; Han, D.; Kim, D.; Han, K.; Yi, M.Y. SIG-Net: GNN based dropout prediction in MOOCs using Student Interaction Graph. In SAC ’24: Proceedings of the 39th ACM/SIGAPP Symposium on Applied Computing; Association for Computing Machinery: New York, NY, USA, 2024; pp. 29–37. [Google Scholar] [CrossRef] [Scilit]
- Wu, Z.; Liang, Q.; Zhan, Z. Course Recommendation Based on Enhancement of Meta-Path Embedding in Heterogeneous Graph. Appl. Sci. 2023, 13, 2404. [Google Scholar] [CrossRef] [Scilit]
- Jiang, B.; Chen, X.; Li, M.; Shan, Z.; Liu, Y.; Yang, N. MOOC Learner Profiling Using Relation-Aware Heterogeneous Graph Neural Networks. Appl. Sci. 2026, 16, 263. [Google Scholar] [CrossRef] [Scilit]
- Mustofa, S.; Emon, Y.R.; Mamun, S.B.; Akhy, S.A.; Ahad, M.T. A novel AI-driven model for student dropout risk analysis with explainable AI insights. Comput. Educ. Artif. Intell. 2025, 8, 100352. [Google Scholar] [CrossRef] [Scilit]
- Melo, E.; Silva, I.; Costa, D.G.; Viegas, C.M.D.; Barros, T.M. On the Use of eXplainable Artificial Intelligence to Evaluate School Dropout. Educ. Sci. 2022, 12, 845. [Google Scholar] [CrossRef] [Scilit]
- Buñay-Guisñan, P.; Cano, A.; Anguera, A.; Lara, J.A.; Romero, C. Group Counterfactual Explanations: A Use Case to Support Students at Risk of Dropping Out in Online Education. Electronics 2026, 15, 51. [Google Scholar] [CrossRef] [Scilit]
- Tiukhova, E.; Vemuri, P.; Flores, N.L.; Islind, A.S.; Óskarsdóttir, M.; Poelmans, S.; Baesens, B.; Snoeck, M. Explainable Learning Analytics: Assessing the stability of student success prediction models by means of explainable AI. Decis. Support Syst. 2024, 182, 114229. [Google Scholar] [CrossRef] [Scilit]
- Li, Y.; Zhou, J.; Zheng, B.; Shafiabady, N.; Chen, F. Reliable and Faithful Generative Explainers for Graph Neural Networks. Mach. Learn. Knowl. Extr. 2024, 6, 2913–2929. [Google Scholar] [CrossRef] [Scilit]
- Liang, B.; Wang, Y.; Tong, C. AI Reasoning in Deep Learning Era: From Symbolic AI to Neural–Symbolic AI. Mathematics 2025, 13, 1707. [Google Scholar] [CrossRef] [Scilit]
- Hooshyar, D.; Azevedo, R.; Yang, Y. Augmenting Deep Neural Networks with Symbolic Educational Knowledge: Towards Trustworthy and Interpretable AI for Education. Mach. Learn. Knowl. Extr. 2024, 6, 593–618. [Google Scholar] [CrossRef] [Scilit]
- Hu, Z.; Dong, Y.; Wang, K.; Sun, Y. Heterogeneous Graph Transformer. In WWW ’20: Proceedings of the Proceedings of The Web Conference 2020; Association for Computing Machinery: New York, NY, USA, 2020; pp. 2704–2710. [Google Scholar] [CrossRef] [Scilit]
- Hamilton, W.L.; Ying, R.; Leskovec, J. Inductive Representation Learning on Large Graphs. arXiv 2018, arXiv:1706.02216. [Google Scholar] [CrossRef] [Scilit]

Disclaimer/Publisher’s Note: The statements, opinions and data contained in all publications are solely those of the individual author(s) and contributor(s) and not of MDPI and/or the editor(s). MDPI and/or the editor(s) disclaim responsibility for any injury to people or property resulting from any ideas, methods, instructions or products referred to in the content. |
© 2026 by the authors. Licensee MDPI, Basel, Switzerland. This article is an open access article distributed under the terms and conditions of the Creative Commons Attribution (CC BY) license.