Article

Electrochemical Synergistic Investigation for the Degradation Failure and Management of Lithium-Ion Pouch Cells Under Different Pre-Torque Boundaries


1
Cooperative Innovation Center of Unconventional Oil and Gas, Yangtze University (Ministry of Education & Hubei Province), Wuhan 430100, China
2
College of Automotive and Energy Engineering, Tongji University, Shanghai 201804, China
*
Authors to whom correspondence should be addressed.
Electronics 2026, 15(10), 2123; https://doi.org/10.3390/electronics15102123
Submission received: 22 April 2026 / Revised: 12 May 2026 / Accepted: 12 May 2026 / Published: 15 May 2026

Abstract

Lithium-ion pouch cells exhibit significant irreversible expansion during long-term cycling, which determines overall performance and induces degradation failure without an appropriate mechanical fixture. However, the synergistic mechanism of mechanical pre-torque and battery state on battery electrochemical performance is unclear. To address this issue, this study reveals the electrochemical characteristic evolution of commercial lithium-ion pouch cells during cycling degradation, under varying mechanical pre-torques (0 N·m, 0.5 N·m, 1 N·m, and 1.5 N·m) and at different states of charge (SOCs, 0%, 25%, 50%, 75%, and 100%). Results indicate that moderate pressure (0.5 N·m) optimizes the electrode–electrolyte contact, reducing solid–electrolyte interphase resistance (RSEI), ohmic resistance (RO), charge transfer resistance (Rct), and Warburg coefficient (W) by over 55%, 60%, 30% and 20%, respectively, compared with the free state. High pressure (1.5 N·m) induces impedance rebound due to pore compression, with the increment ranging from 20% to 40%. Furthermore, synergistic impact analysis proves that pressure alters impedance sensitivity to SOC, with changing rates amplifying from <5% per SOC unit under low pressure to 10–15% under high pressure, particularly exacerbating interface passivation at low SOC and side reactions at high SOC. Moreover, a Gaussian process regression (GPR) based adaptive SOC estimation model is developed, incorporating impedance features and pressure paths, achieving a root mean square error of 2.1% and enhancing accuracy by 10–15% over conventional methods in high-pressure scenarios. This study provides guidance for the next-generation pouch cell module design and management.

1. Introduction

Lithium-ion batteries (LIBs), with their superiorities of energy density and cycle life, play an indispensable role in clean energy industrial applications such as electric vehicles, portable electronics, and energy storage systems [1,2,3]. However, the all-lifespan performance of LIBs is significantly affected by complex external mechanical pre-torque conditions in real applications [4,5]. Moreover, the electrochemical mechanism for the degradation failure of LIBs under complex mechanical preload constraints is still unclear, which further affects battery state estimation [6,7]. Therefore, it is necessary to investigate the impact of mechanical pre-torque on battery degradation and state estimation, providing guidance for the next-generation battery management systems [8,9].
Existing studies indicate that moderate pressure can enhance the interface contact between the electrode and electrolyte, thereby reducing ion transport resistance and optimizing overall impedance characteristics, which positively contributes to improving battery performance [10,11]. However, when pressure exceeds a reasonable range, it may lead to issues such as structural deformation of electrode materials, pore closure, or abnormal lithium deposition, significantly increasing battery impedance and consequently affecting the accuracy of state of charge (SOC) estimation [12]. Therefore, a comprehensive investigation into the synergistic effects of mechanical pre-torque on battery impedance and SOC estimation is crucial for elucidating the underlying mechanisms, which further holds significant importance for optimizing battery management systems and enhancing operational reliability in practical applications [13,14,15].
Mechanical pressure affects the electrochemical performance of LIBs by regulating internal physical structures and chemical processes in multiple dimensions, with its mechanisms primarily involving four interconnected core links: the electrode–electrolyte interface, ionic transport through the separator, active material microstructure, and lithium deposition behavior [16]. Fundamentally, mechanical pre-torque alters the physical contact topology at the electrode–electrolyte interface. Under moderate compressive stresses, pressure-induced consolidation reduces interfacial voids and dead zones, thereby decreasing contact resistance [17,18]. This phenomenon is particularly pronounced at high SOC values, where electrode expansion already improves interfacial intimacy [19], and the pressure-enhanced contact further facilitates more uniform current distribution across the electrode surface, mitigating localized overpotentials that would otherwise drive heterogeneous lithium plating. However, this beneficial regime is bounded by the mechanical compliance of the constituent materials; excessive pressure above the compressive yield strength of electrodes or separators induces irreversible plastic deformation, creating new failure modes [20].
As a microporous membrane that prevents electrode contact while enabling ionic conduction, the separator exhibits highly pressure-sensitive transport characteristics, which constitute another crucial mechanism by which pre-torque regulates battery performance [21,22]. Under compression, separator thickness reduces while tortuosity increases, creating competing effects on ionic resistance. It was demonstrated that polyethylene-based separators exhibit more significant sensitivity to compressive stress than ceramic-coated or polyimide variants [23]. Specifically, optimal pressure ranges can actually enhance ionic conductivity by improving electrolyte wetting and reducing interfacial gaps, but pressures exceeding 3 MPa cause pore collapse, geometric tortuosity escalation, and severe impedance rise [24], with the relationship between pressure and ionic resistance following a non-monotonic curve: initial resistance decrease due to improved contact, followed by rapid increase beyond critical pressure thresholds where separator porosity degrades [25]. In tandem with the responses of the interface and separator, active material particles undergo complex stress–strain responses under external compression, which further modulate the electrochemical behavior of batteries. The porous electrode architecture, typically with 30–50% porosity, exhibits initial elastic deformation followed by yield and densification under pre-torque, and this mechanical compaction directly impacts ionic diffusion pathways within the electrode matrix [26]. Compressive stress can advantageously maintain particle–particle contact, preventing capacity fade from particle isolation [13]. In addition, it simultaneously increases the risk of particle fracture and fresh surface exposure, and such fracture events generate new solid–electrolyte interphase (SEI) formation, consuming active lithium and increasing interfacial resistance [27,28]. Recent studies utilized in situ swelling analyzers combined with EIS and have further demonstrated that pressure gradients during cycling correlate with impedance evolution, particularly at high SOC, where electrode expansion is maximal [29].
Notably, excessive mechanical pre-torque can trigger abnormal lithium deposition, one of the most deleterious consequences that leads to battery failure, which is closely associated with the aforementioned changes in interface, separator, and active material [30]. High mechanical pre-torque accelerates lithium metal growth by two primary mechanisms: increased localized current density at compressed interface asperities, and reduced pore space that limits lithium ion diffusion away from the interface. Pre-torque induced plating manifests as dendritic structures that penetrate separator pores (exacerbated by the separator pore collapse caused by excessive pressure), creating micro-shorts and catastrophic failure pathways. Moreover, real-time pressure monitoring during charging has shown a correlation between internal pressure spikes and lithium plating onset, suggesting that dynamic pressure management could serve as an early warning system for such hazardous reactions [31,32].
Given the established mechanism of mechanical pre-torque’s effects on the core components and key electrochemical reactions of the battery, a series of targeted investigations was implemented to quantify these influences and clarify their inherent interdependencies. Du et al. [33] revealed an increase in charge transfer resistance and ion pore resistance, while the electrode–electrolyte interface and electrolyte resistance decreased. They also indicated that the nonlinear relationship between pressure and SOC depends on electrode materials, ion stoichiometry, and current density. Leonard et al. [34] found that constant pressure can increase discharge power by up to 4%, reduce discharge impedance by about 2.5%, and demonstrated that constant pressure reduces pressure variations during charge–discharge processes, improving battery performance. Li et al. [35] conducted EIS tests under different SOCs and rest times, finding that the impedance spectrum radius decreases as SOC increases to 90% and then slightly increases. Equivalent circuit model (ECM) analysis showed that Rct significantly decreases before SOC 90% and then slightly rises, reflecting changes in electrochemical reaction kinetics. The ohmic resistance RO slightly increases with SOC but remains relatively stable. Zhang et al. [36] used Gaussian process regression (GPR) models to analyze EIS spectra and found that low-frequency impedance features at 17.8 Hz and 2.16 Hz are highly correlated with capacity estimation, reflecting changes in interface characteristics. Kurzweil et al. [37] discovered that the impedance–SOC relationships for different lithium-ion cathode materials (such as LFP and NMC) vary due to changes in the slope of voltage–capacity curves, with LFP cathode-based batteries showing smaller impedance changes in flat voltage regions. Moreover, recent studies investigated the effects of mechanical pressure on the lifespan, expansion, and porosity of full cells with microscale silicon anodes and NCA cathodes, showing that moderate pressure reduces expansion and improves impedance stability, but excessive pre-torque leads to pore closure, amplifying charge transfer impedance and thus affecting SOC accuracy [38]. Cortada et al. [39] summarized the factors of mechanical pre-torque on internal changes in lithium-ion batteries, including pressure-induced electrode deformation and SEI film instability, which nonlinearly amplify impedance at high SOC, emphasizing the need to consider aging paths for SOC assessment interference. Meanwhile, Laufen et al. [24] explored the correlations between voltage, strain, and impedance with pressure in high-nickel ternary lithium-ion pouch cells, finding that impedance rises sharply at low SOC with increasing pressure and exhibits a U-shaped change at high SOC, directly impacting the reliability of SOC estimation algorithms.
Despite the above advances, which provided a solid foundation for the understanding of mechanical pre-torque of LIBs, specific studies on LIB impedance changing mechanism under different mechanical pre-torque-based cycling paths remain limited, particularly the joint effects of different mechanical pre-torque-based cycling paths and SOC on impedance evolution have not been fully revealed, leaving a gap in understanding their synergistic effects. To address this issue and establish a quantitative link between mechanical pre-torque-based cycling paths, SOCs, and LIB impedance evolution, this study experimentally investigates the impedance characteristics of LIBs during the cycling paths, under different mechanical pre-torques, and unlocks the impedance evolution under different SOCs.

2. Methodology

2.1. Battery Sample

Due to the diversity of crystal structures in cathode materials, pouch cells with different cathode systems exhibit varying mechanical pre-torque evolution characteristics, which may lead to differences in mechanical performance [40]. This study selects a commercial pouch cell with the LiNi0.6Mn0.2Co0.2O2 (NCM622) cathode as the research objective; detailed information is listed in Table 1. There are double-sided coated cathode and anode pieces inside the battery cell, assembled through a stacking process. The cathode and anode current collectors utilize aluminum foil and copper foil, respectively. The separator is a polypropylene/polyethylene/polypropylene (PP/PE/PP) three-layer composite membrane. The electrolyte selects a mixed solvent of LiPF6 salt with ethylene carbonate (EC), ethyl methyl carbonate (EMC), and diethyl carbonate (DEC). To guarantee the reliability, all the battery cells are purchased from the same production batch and selected through clustering analysis, minimizing the fluctuations under identical experimental operations, with nearly consistent degradation characteristics and impedance spectra.
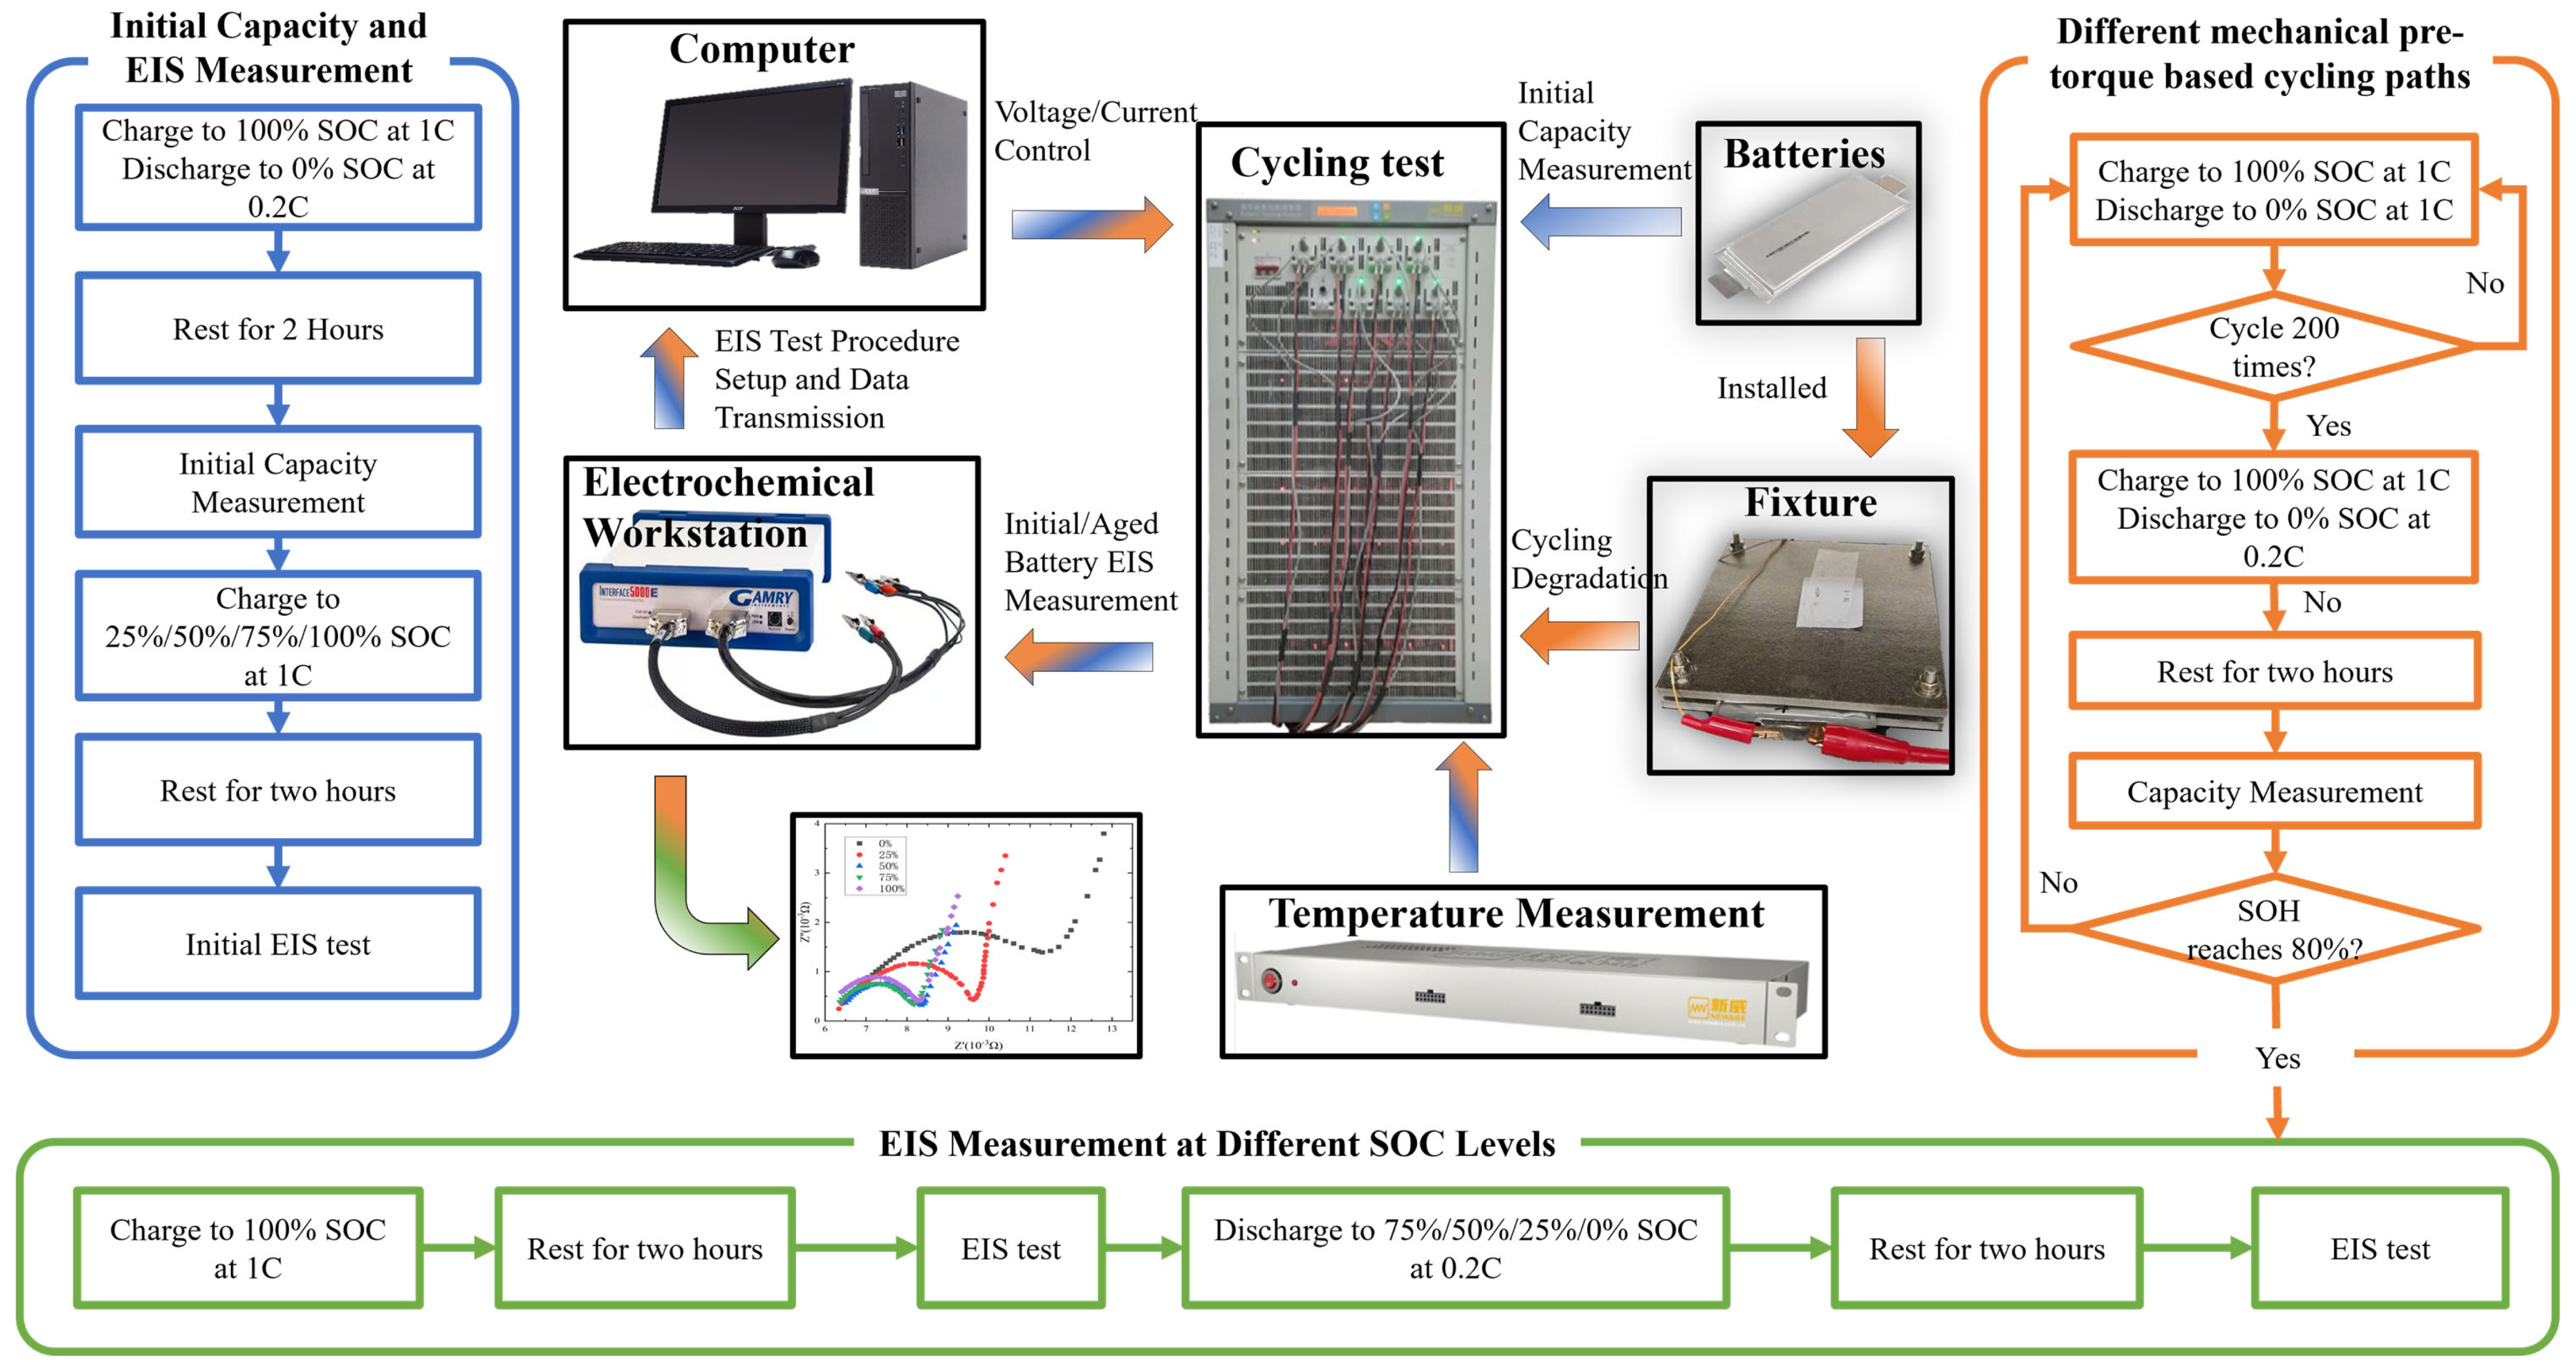
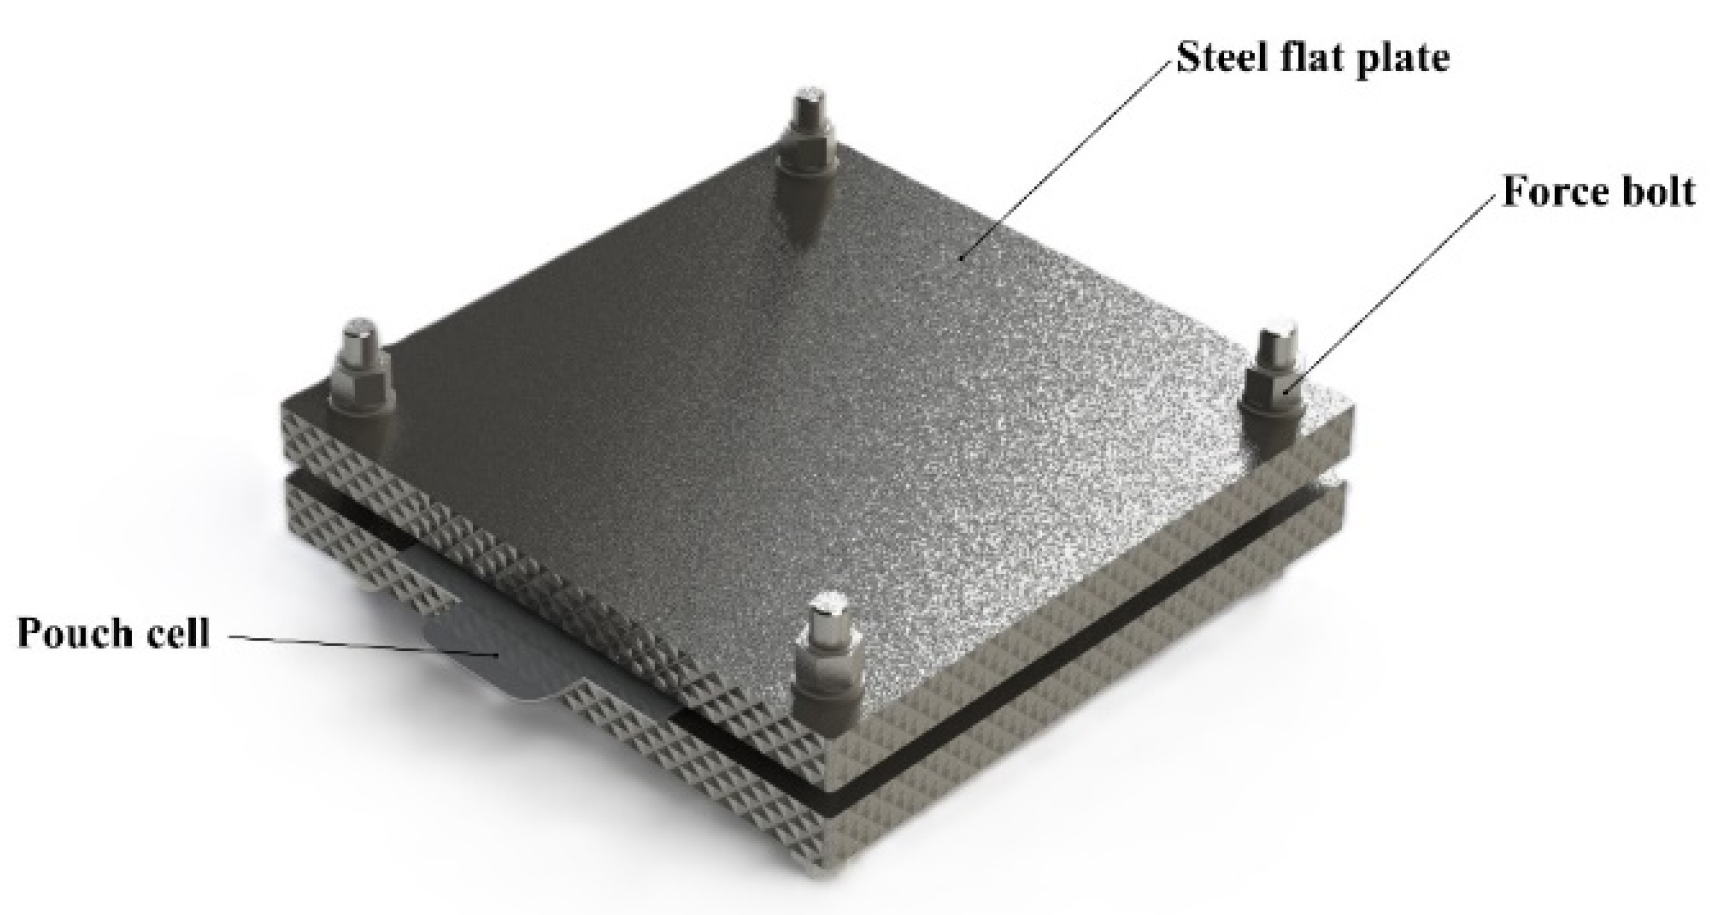
As demonstrated in Figure 1, this study designs a mechanical fixture, installing each cell between two rigid steel plates for uniform load distribution. All the tests are conducted under the ambient temperature of 25 °C. The large-area steel plates increase the heat exchange rate, and all the experiments are carried out at limited current rates, thereby maintaining nearly constant temperature and uniformity between the battery and the environment. The nuts and bolts are utilized to clamp the assembly for uniform mechanical pre-torque until the torque reaches 0.5 N·m, 1 N·m, and 1.5 N·m, respectively.

2.2. Accelerated Degradation Tests

The accelerated degradation test procedure is depicted in Figure 2. Before the cycling test, all the battery samples are initially calibrated to guarantee cell consistency. The battery cells are first charged to 4.2 V using constant current–constant voltage (CC-CV) mode at 10 A, with the constant voltage phase continuing until the current drops to 0.5 A. Subsequently, they are discharged at a constant current of 2 A to 2.75 V, and the discharging capacity is recorded. The above steps are repeated three times, and the average discharging capacity is calculated as the initial capacity. After the initial capacity measurement, the battery cells are charged again to 25%/50%/75%/100% of the initial capacity (2.5/5/7.5/10 Ah) utilizing 1C CC-CV mode, and after resting for two hours to reach a stable state, EIS tests are conducted to evaluate the initial impedance characteristics.
The accelerated degradation tests are conducted in a temperature-controlled chamber under a constant ambient temperature of 25 °C, utilizing the Neware BTS4005V-20A battery testing equipment (Shenzhen, China) to execute the cycles. The cycling protocol is as follows:
(1)
Charge at a constant current (1C, 10 A) to 4.2 V;
(2)
Charge at a constant voltage (CV, 4.2 V) until the current drops to 0.05C (0.5 A);
(3)
Discharge at a constant current (1C, 10 A) to 2.75 V.
After every 200 cycles, a capacity measurement will be conducted to monitor SOH:
(a)
Capacity measurement: Fully charge the battery cell utilizing the above CC-CV protocol, then discharge at 0.2C (2 A) to 2.75 V, for capacity measurement. Repeat the procedure three times and calculate the average value as the current capacity.
(b)
State of health (SOH) calculation: SOH is defined as the ratio of the current capacity to the initial capacity, which is calculated by Equation (1):
S O H = Q C u r r e n t Q I n i t i a l 100 %
where QCurrent and QInitial represent the current and initial capacity of the battery cell, respectively.
When the measured capacity drops to 80% of the initial capacity, the degradation test is terminated.
When SOH reaches 80%, the battery cell will be set to different SOC levels for subsequent EIS measurements. The specific SOC levels are 0%, 25%, 50%, 75%, and 100%. The definition is described as follows:
(a)
A 100% SOC: Utilizing the CC-CV protocol to fully charge the battery cell to the current capacity. After charging, resting for two hours to reach a stable state, and then measuring electrochemical impedance spectroscopy (EIS) at 100% SOC.
(b)
Other SOC levels: Discharging the 100% SOC cell sample at a constant current of 0.2C, to reach the required SOC level.
After discharging to the target SOC, resting for two hours to reach a stable state, then conduct EIS measurement at the corresponding SOC level. EIS measurements are conducted utilizing the Gamry electrochemical workstation Interface 5000E (Warminster, PA, USA). Detailed parameters are listed as follows:
  • Frequency range: 6 kHz to 0.05 Hz.
  • AC signal amplitude: 5 mV.
  • Measurements at the open-circuit voltage corresponding to each SOC.
One battery under each mechanical pressure level is tested at five SOC states: 0%, 25%, 50%, 75%, and 100%.

3. Results and Discussion

3.1. EIS Analysis

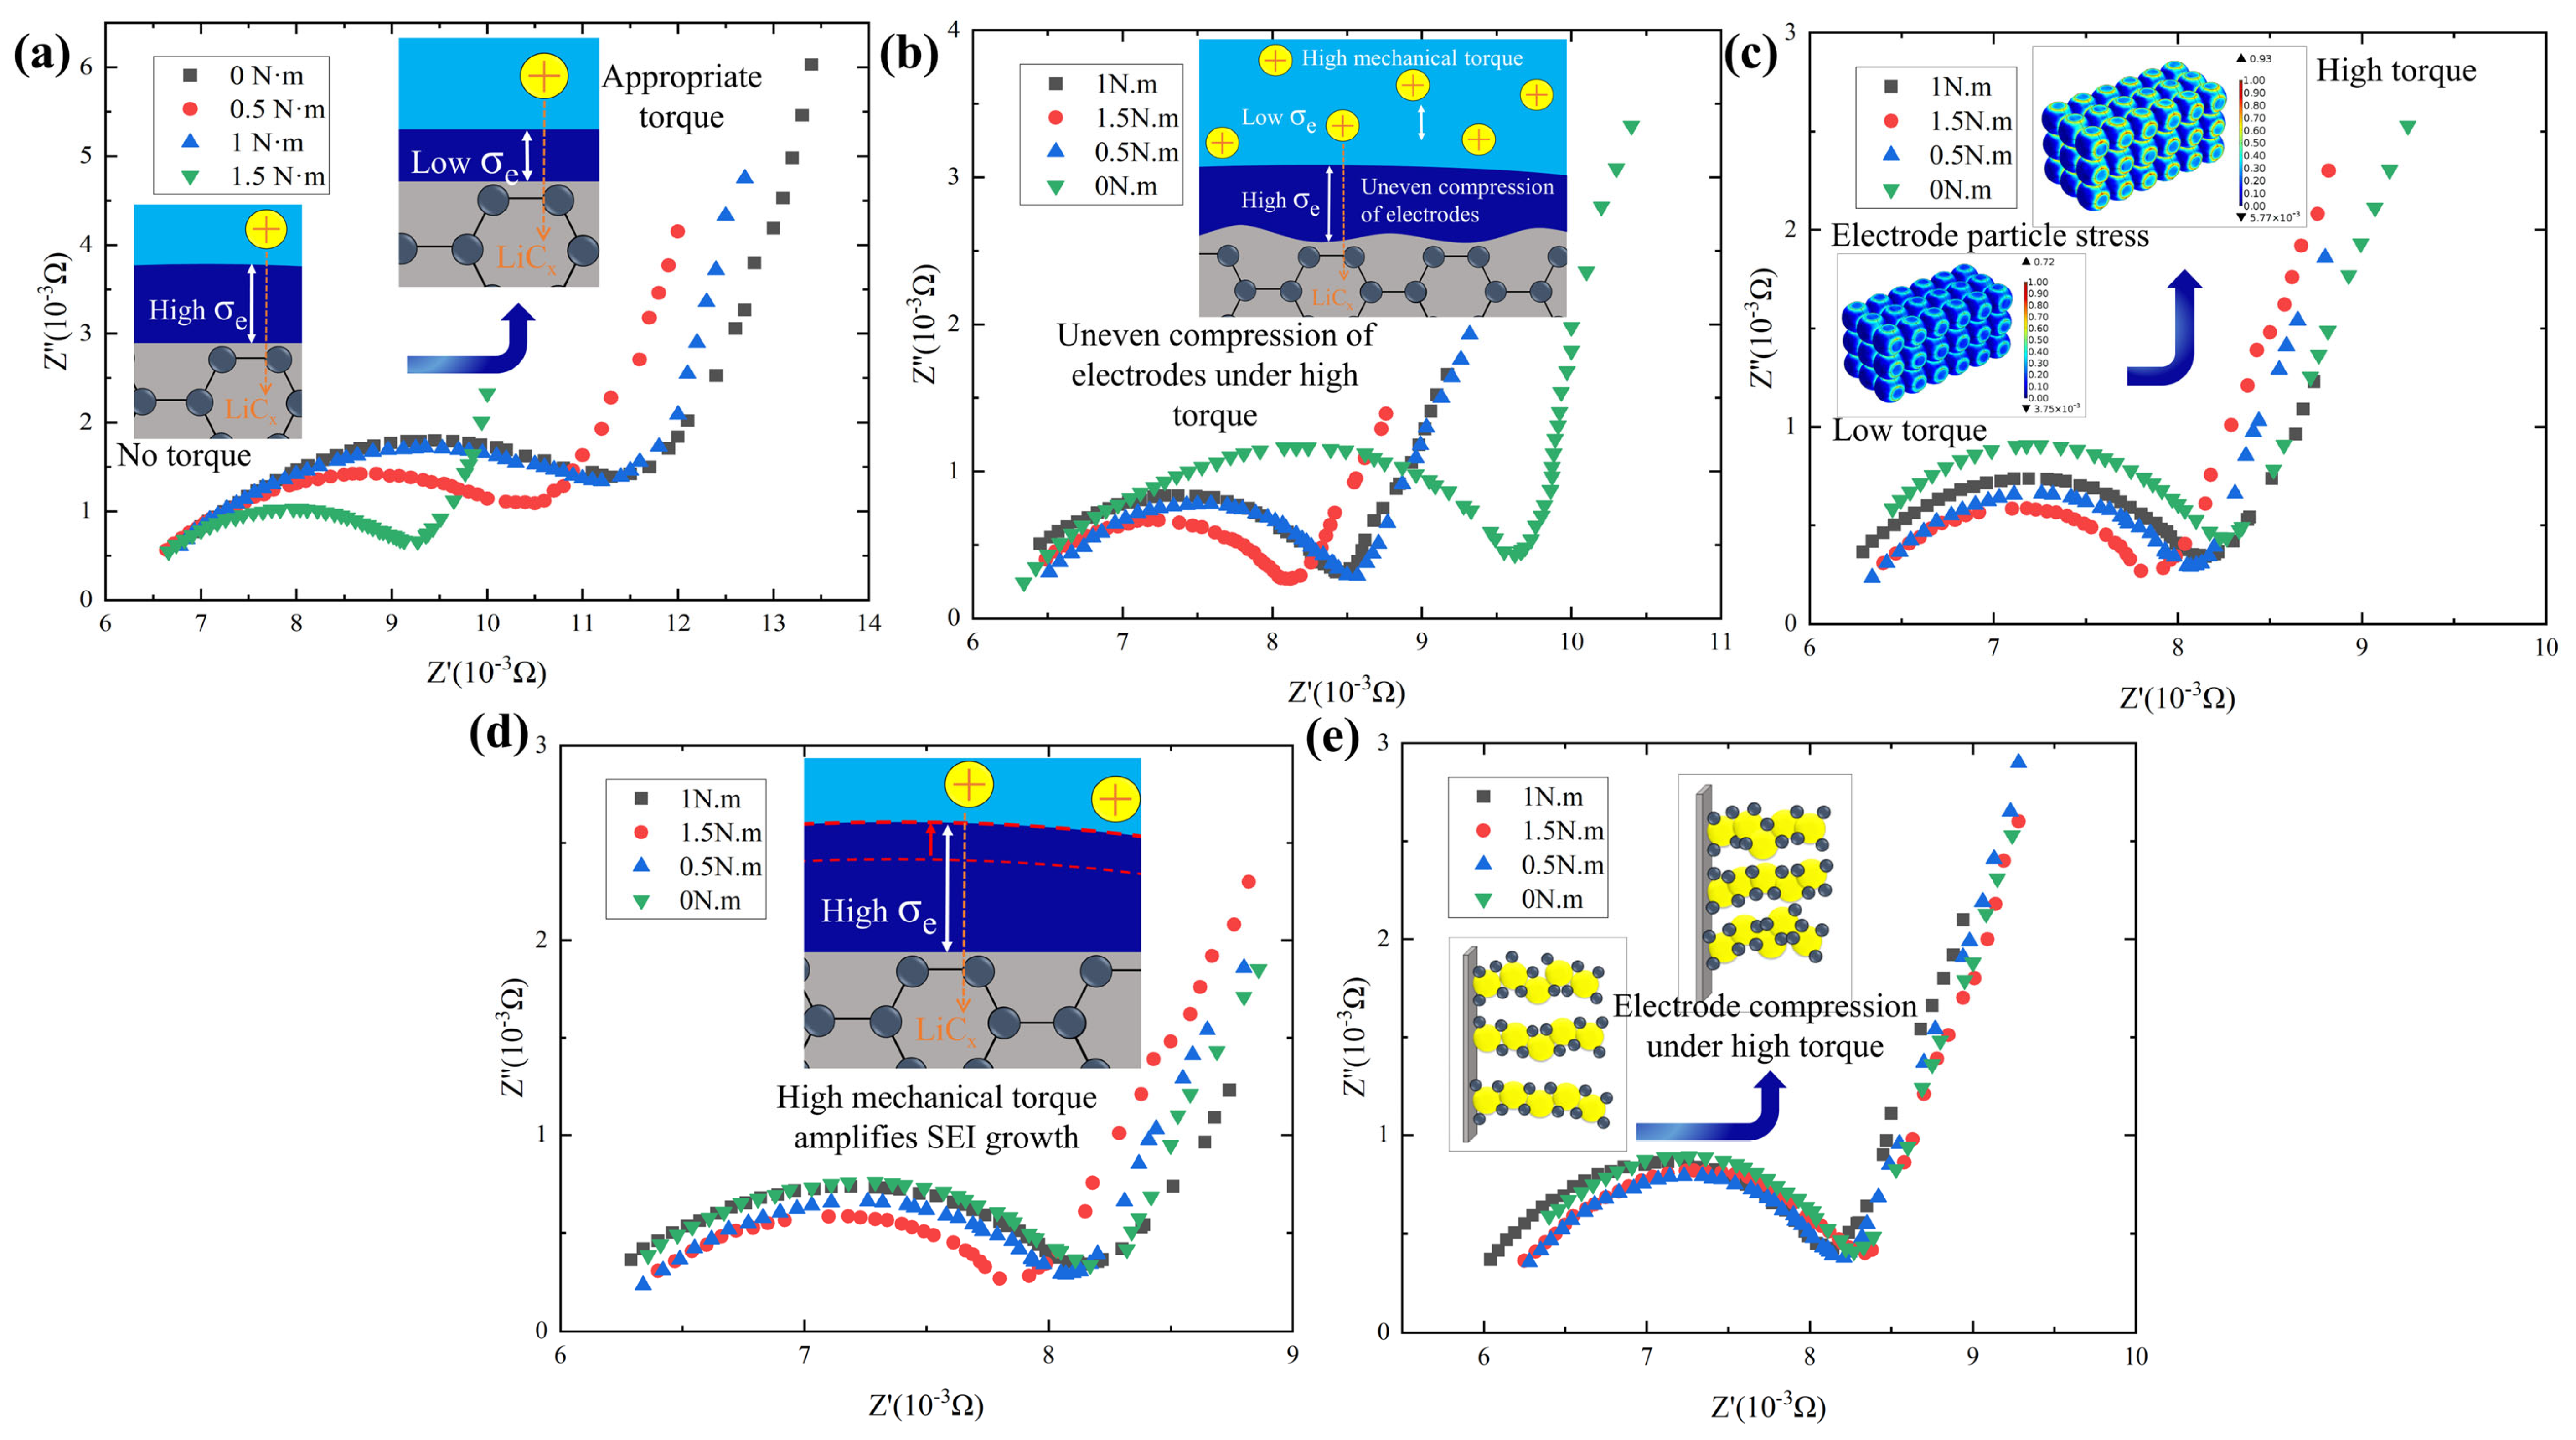
After cycling degradation to 80% SOH, EIS spectra of the battery cells are measured and presented in Nyquist plots. Figure 3 demonstrates the EIS curves under different mechanical pre-torques at the same SOC, which includes the plausible interpretations for the electrochemical impedance spectroscopy evolution mechanism. These curves reveal the significant impact of different mechanical pre-torque-based cycling paths on the impedance spectra, including the high-frequency intercept corresponding to ohmic impedance, the semicircle diameter corresponding to interface impedance, the low-frequency slant slope corresponding to the diffusion process, and the overall curve morphology representing changes in electrochemical kinetics.
At 0% SOC, the Nyquist plot displays a larger semicircle diameter and a steeper low-frequency slant, indicating higher overall impedance and diffusion resistance. Under mechanical pre-torque below 0 N·m, the curve starts at a lower real-axis intercept with a medium semicircular diameter, reflecting baseline interface impedance. As mechanical pre-torque increases to 0.5 N·m, the curve shifts downward overall, and the high-frequency semicircle contracts slightly, indicating that moderate mechanical pre-torque optimizes electrode–electrolyte contact and reduces SEI film and ohmic impedance. However, when the mechanical pre-torque reaches 1.5 N·m, the mid-frequency semicircle expands significantly, and the low-frequency slant slope decreases, suggesting hindered charge transfer processes and extended diffusion paths. Beyond 1.5 N·m, the curve shifts upward markedly due to ion migration barriers caused by pore compression under high pressure.
At 25% SOC, the low-frequency slant slope and the overall impedance decrease. Under 0 N·m mechanical pre-torque, the curve starts at a low intercept, improving interface characteristics. Under 0.5 N·m, the curve contracts further, and the high-frequency semicircle shrinks, indicating that moderate mechanical pre-torque enhances ion transport efficiency. When the mechanical pre-torque rises to 1.5 N·m, the mid-frequency semicircle expands, and the low-frequency slant steepens, with charge transfer and diffusion beginning to be hindered. Under 1.5 N·m, the curve shifts upward, with impedance growth due to lithium-ion migration limitations caused by uneven electrode compression under high mechanical pre-torque, consistent with the nonlinear mechanical pre-torque effects at low SOC reported in [10].
At 50% SOC, the Nyquist plot presents the most compact form, with the smallest semicircle diameter and a low-frequency slant close to the ideal 45°, indicating optimal electrochemical kinetics. Under 0 N·m mechanical pre-torque, the curve is smooth with low impedance. As the mechanical pre-torque reaches 0.5 N·m, the high-frequency intercept decreases slightly, indicating optimized electrode–electrolyte contact. Under 1.5 N·m, the impedance increases by 20%, and the curve slightly distorts, possibly due to more significant electrode particle stress under high mechanical pre-torque.
At 75% SOC, the Nyquist plot semicircle begins to rise, with the mid-low frequency region expanding, indicating high SOC. Notably, from 1 N·m to 1.5 N·m, the impedance increases by 25%, and the semicircle deforms, indicating that high mechanical pre-torque amplifies SEI film growth.
At 100% SOC, the impedance fluctuates, especially under 1 N·m and 1.5 N·m, with significant semicircle expansion, a vertical slant, and peak impedance values, which is consistent with the electrode compression under high mechanical pre-torque.
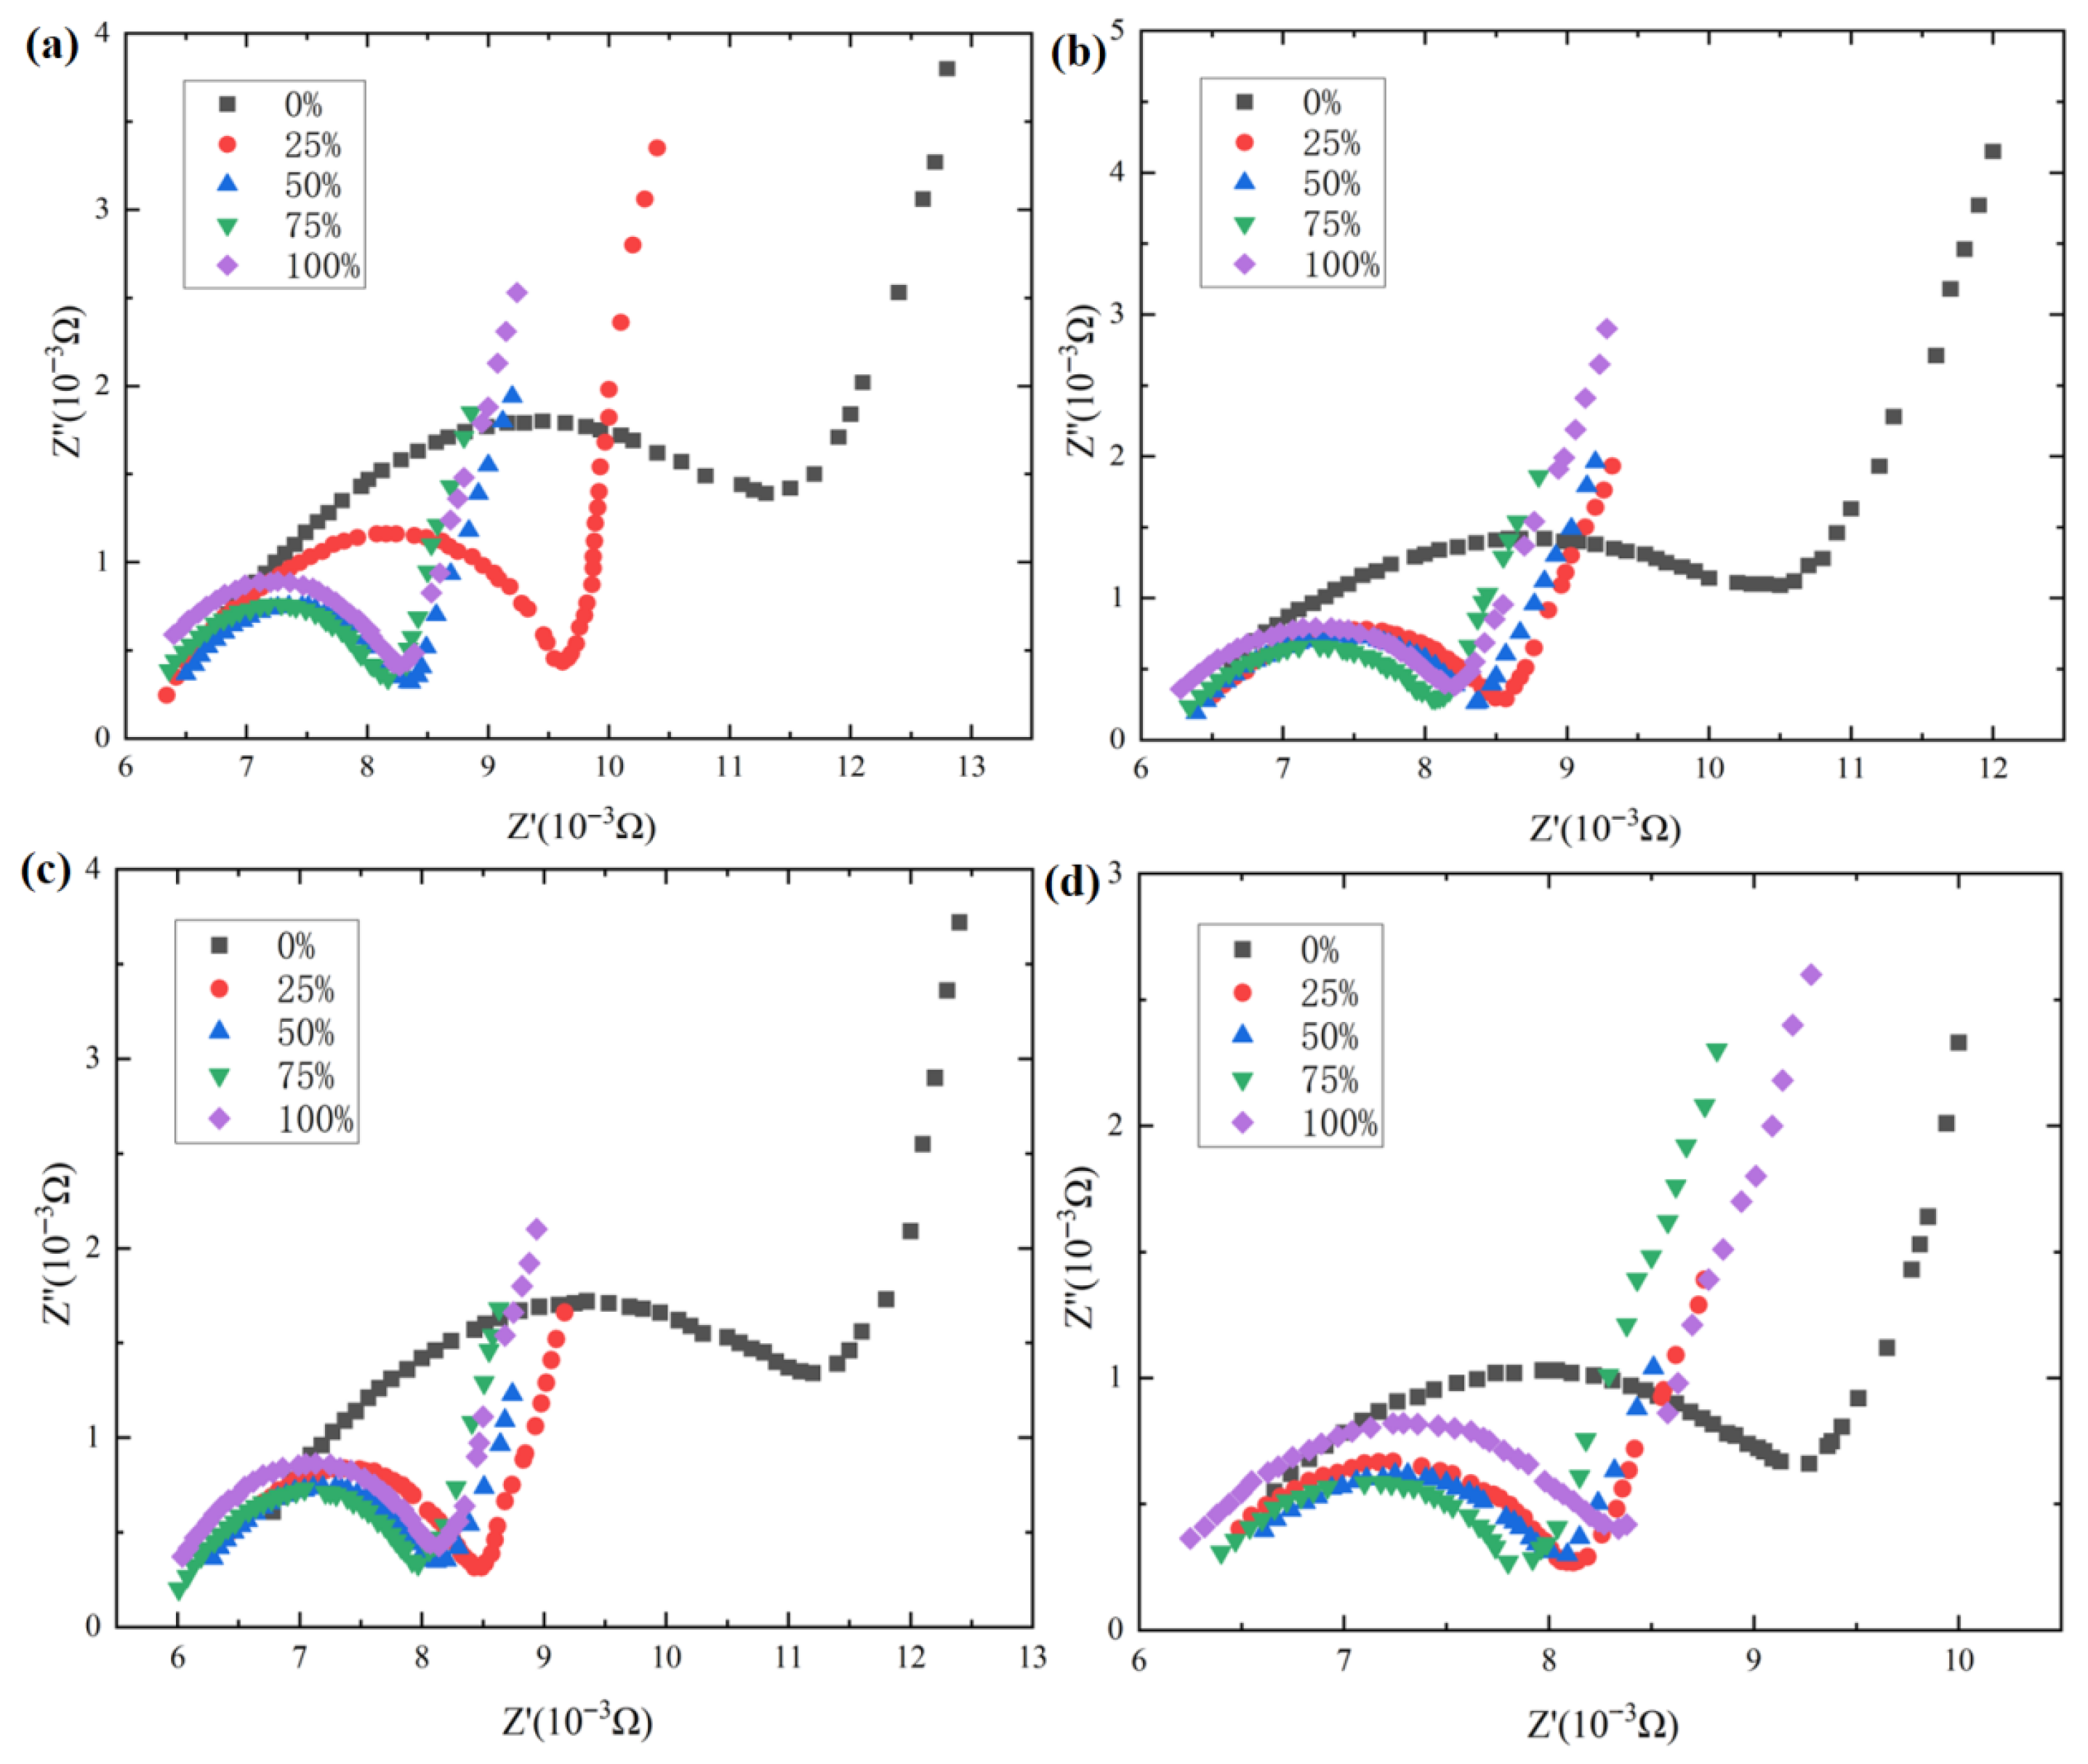
On the contrary, the EIS curves under the same mechanical pre-torque but different SOCs are shown in Figure 4, which reveal the dynamic impact of SOC on the impedance spectrum.
Under the degradation path without mechanical pre-torque (0 N·m), the Nyquist plot exhibits a typical U-shaped trend as SOC changes: At low SOC (0%), the high-frequency semicircle diameter is larger, with noticeable expansion in the mid-frequency region, reflecting higher SEI film and charge transfer impedance-possibly due to interface passivation under low lithium concentration. The low-frequency slant is close to 60° with a steeper slope, indicating dominant diffusion resistance. In comparison, at 25% SOC, the curve contracts slightly, with a stable high-frequency intercept, indicating that the increase in SOC begins to optimize ion transport while still retaining low SOC features. At medium SOC, the curve is most compact, with the smallest semicircle diameter and a low-frequency section close to the ideal 45° slant, indicating optimal electrochemical balance and efficient diffusion. This physically suggests uniform lithium-ion concentration gradients that promote reaction kinetics. Entering 75% SOC, the semicircle diameter slightly increases, and the mid-frequency region slightly deforms into a non-ideal arc, implying accelerated SEI film growth at high SOC. At 100% SOC, the curve shifts upward, the semicircle diameter rebounds, the low-frequency slant steepens, and the overall impedance increases by 20%, related to electrode saturation and side reactions.
Under a mechanical pre-torque of 0.5 N·m, the Nyquist plot exhibits a more compact U-shaped trend as SOC changes: At low SOC (0%), the high-frequency semicircle diameter is medium, with smaller expansion in the mid-frequency region, indicating that moderate mechanical pre-torque alleviates interface passivation under low lithium concentration. The low-frequency slant slope is moderate, indicating reduced diffusion resistance. In comparison, at 25% SOC, the curve further contracts, with a slight decrease in the high-frequency intercept, indicating that higher SOC optimizes ion transport and reduces residual effects from lower SOC. At 50% SOC, the curve is most optimized, with the smallest semicircular diameter and a low-frequency section near 45°, suggesting enhanced electrochemical balance and efficient diffusion. This corresponds to mechanical pre-torque -improved contact, which promotes uniform concentration gradients. At 75% SOC, the semicircular diameter increases slightly, with mild mid-frequency deformation, which is consistent with moderate SEI growth at high SOC. At 100% SOC, the curve offset is limited, the semicircle rebounds slightly, and the overall impedance increases by 15%, related to saturation reactions but with noticeable pressure buffering.
Under a mechanical pre-torque of 1 N·m, the Nyquist plot exhibits a gentle U-shaped trend as SOC changes. Notably, at 50% SOC, the curve is highly compact, with the smallest semicircle diameter and an ideal 45° low-frequency section, indicating optimal kinetic balance. This physical effect suggests the synergy between mechanical pre-torque and medium SOC, promoting uniform diffusion.
Under a mechanical pre-torque of 1.5 N·m, the Nyquist plot exhibits a distorted U-shaped trend as SOC changes: At low SOC (0%), the high-frequency semicircle diameter is larger, with an expansion in the mid-frequency region, indicating that high mechanical pre-torque exacerbates passivation under low lithium concentration. The low-frequency slant slope is steep, indicating amplified diffusion resistance. In comparison, at 25% SOC, the curve contraction is limited, with an increased high-frequency intercept, suggesting that the increase in SOC alleviates high pressure but that high mechanical pre-torque still interferes with ion transport. At 50% SOC, the curve is relatively compact, with a medium semicircle diameter and a gentle low-frequency section slope, indicating kinetic balance disturbed by high mechanical pre-torque. This is manifested as a slight increase in impedance, reduced charge transfer efficiency, and extended diffusion paths, thereby making the overall kinetics process less efficient than under low pressure. At 75% SOC, the semicircle diameter increases, and the mid-frequency region deforms into a non-ideal arc due to mechanical stress on the SEI film under high mechanical pre-torque, leading to cracks or deformation and promoting electrolyte decomposition to accelerate SEI growth. At 100% SOC, the curve shifts significantly, the semicircle rebounds, the low-frequency slant steepens, and the overall impedance increases by 30%. This is related to electrode material saturation (the cathode lithium-ion intercalation approaching a saturation), which leads to increased electrode structural stress and blocked ion diffusion channels, thereby amplifying impedance. High mechanical pre-torque further exacerbates this saturation effect by compressing electrode pores, thereby restricting lithium-ion migration.
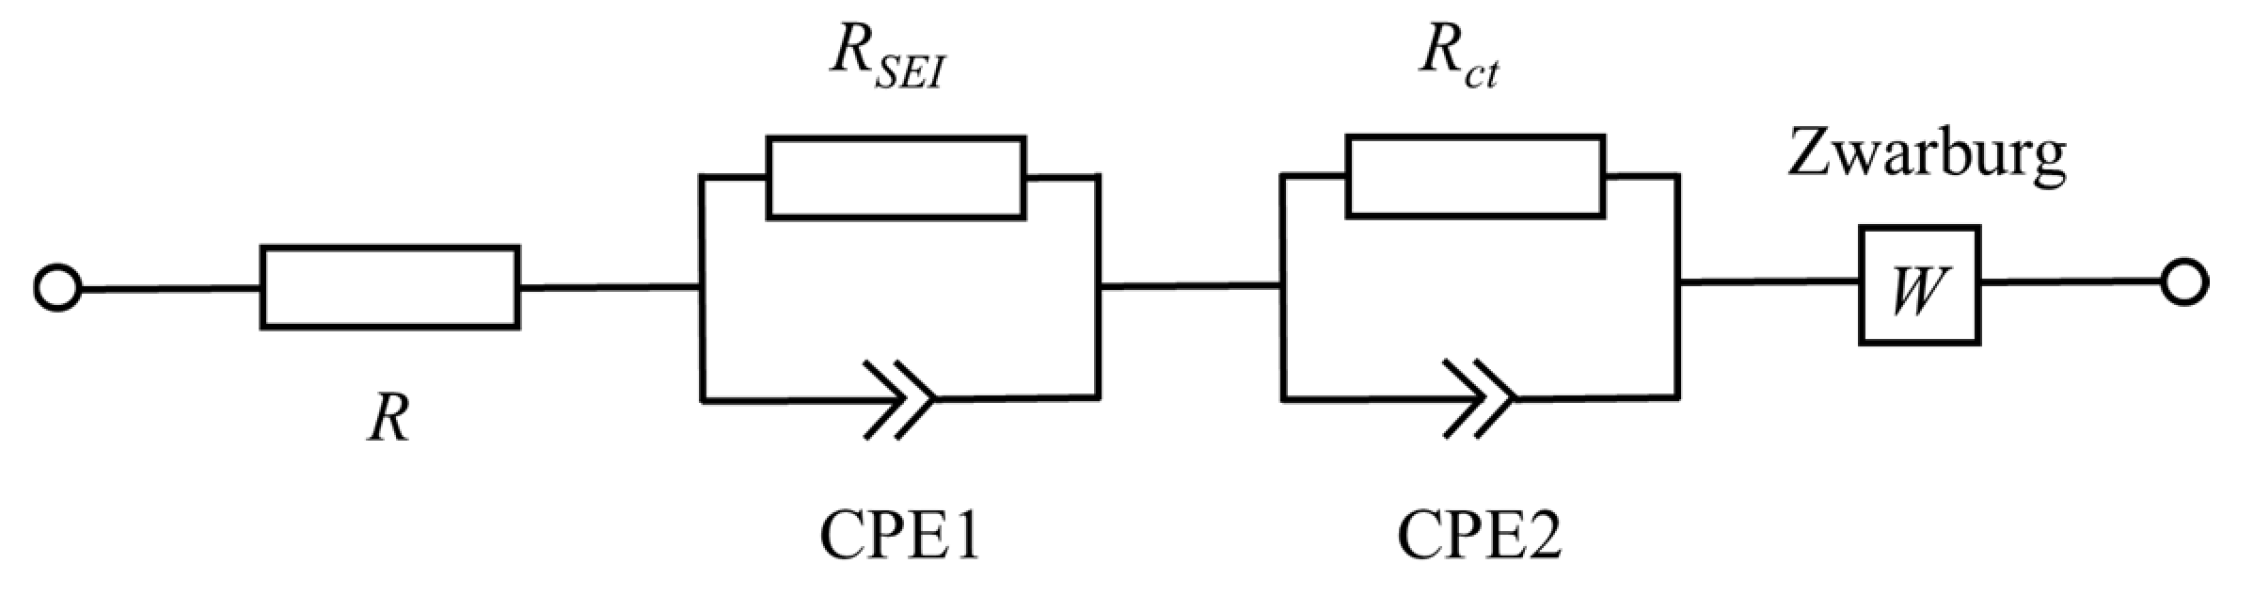
As shown in Figure 5, to quantitatively analyze the EIS data, an equivalent circuit model (ECM) is constructed. The first RC element is used to describe the SEI film impedance, the constant phase element CPE1 is utilized to describe the film capacitance considering the dispersion effect, and RSEI is defined to describe the SEI film resistance. The second RC element is utilized to describe the electrode interface impedance, the constant phase element CPE2 is used to describe the double-layer capacitance considering the dispersion effect, and Rct is the transfer resistance. A Weber impedance loop W is utilized to describe the diffusion impedance of lithium ions in electrode solid-phase materials. Resistance R is utilized to describe the electronic conductivity characteristics of solid-phase materials and the ionic conductivity characteristics of liquid-phase materials.
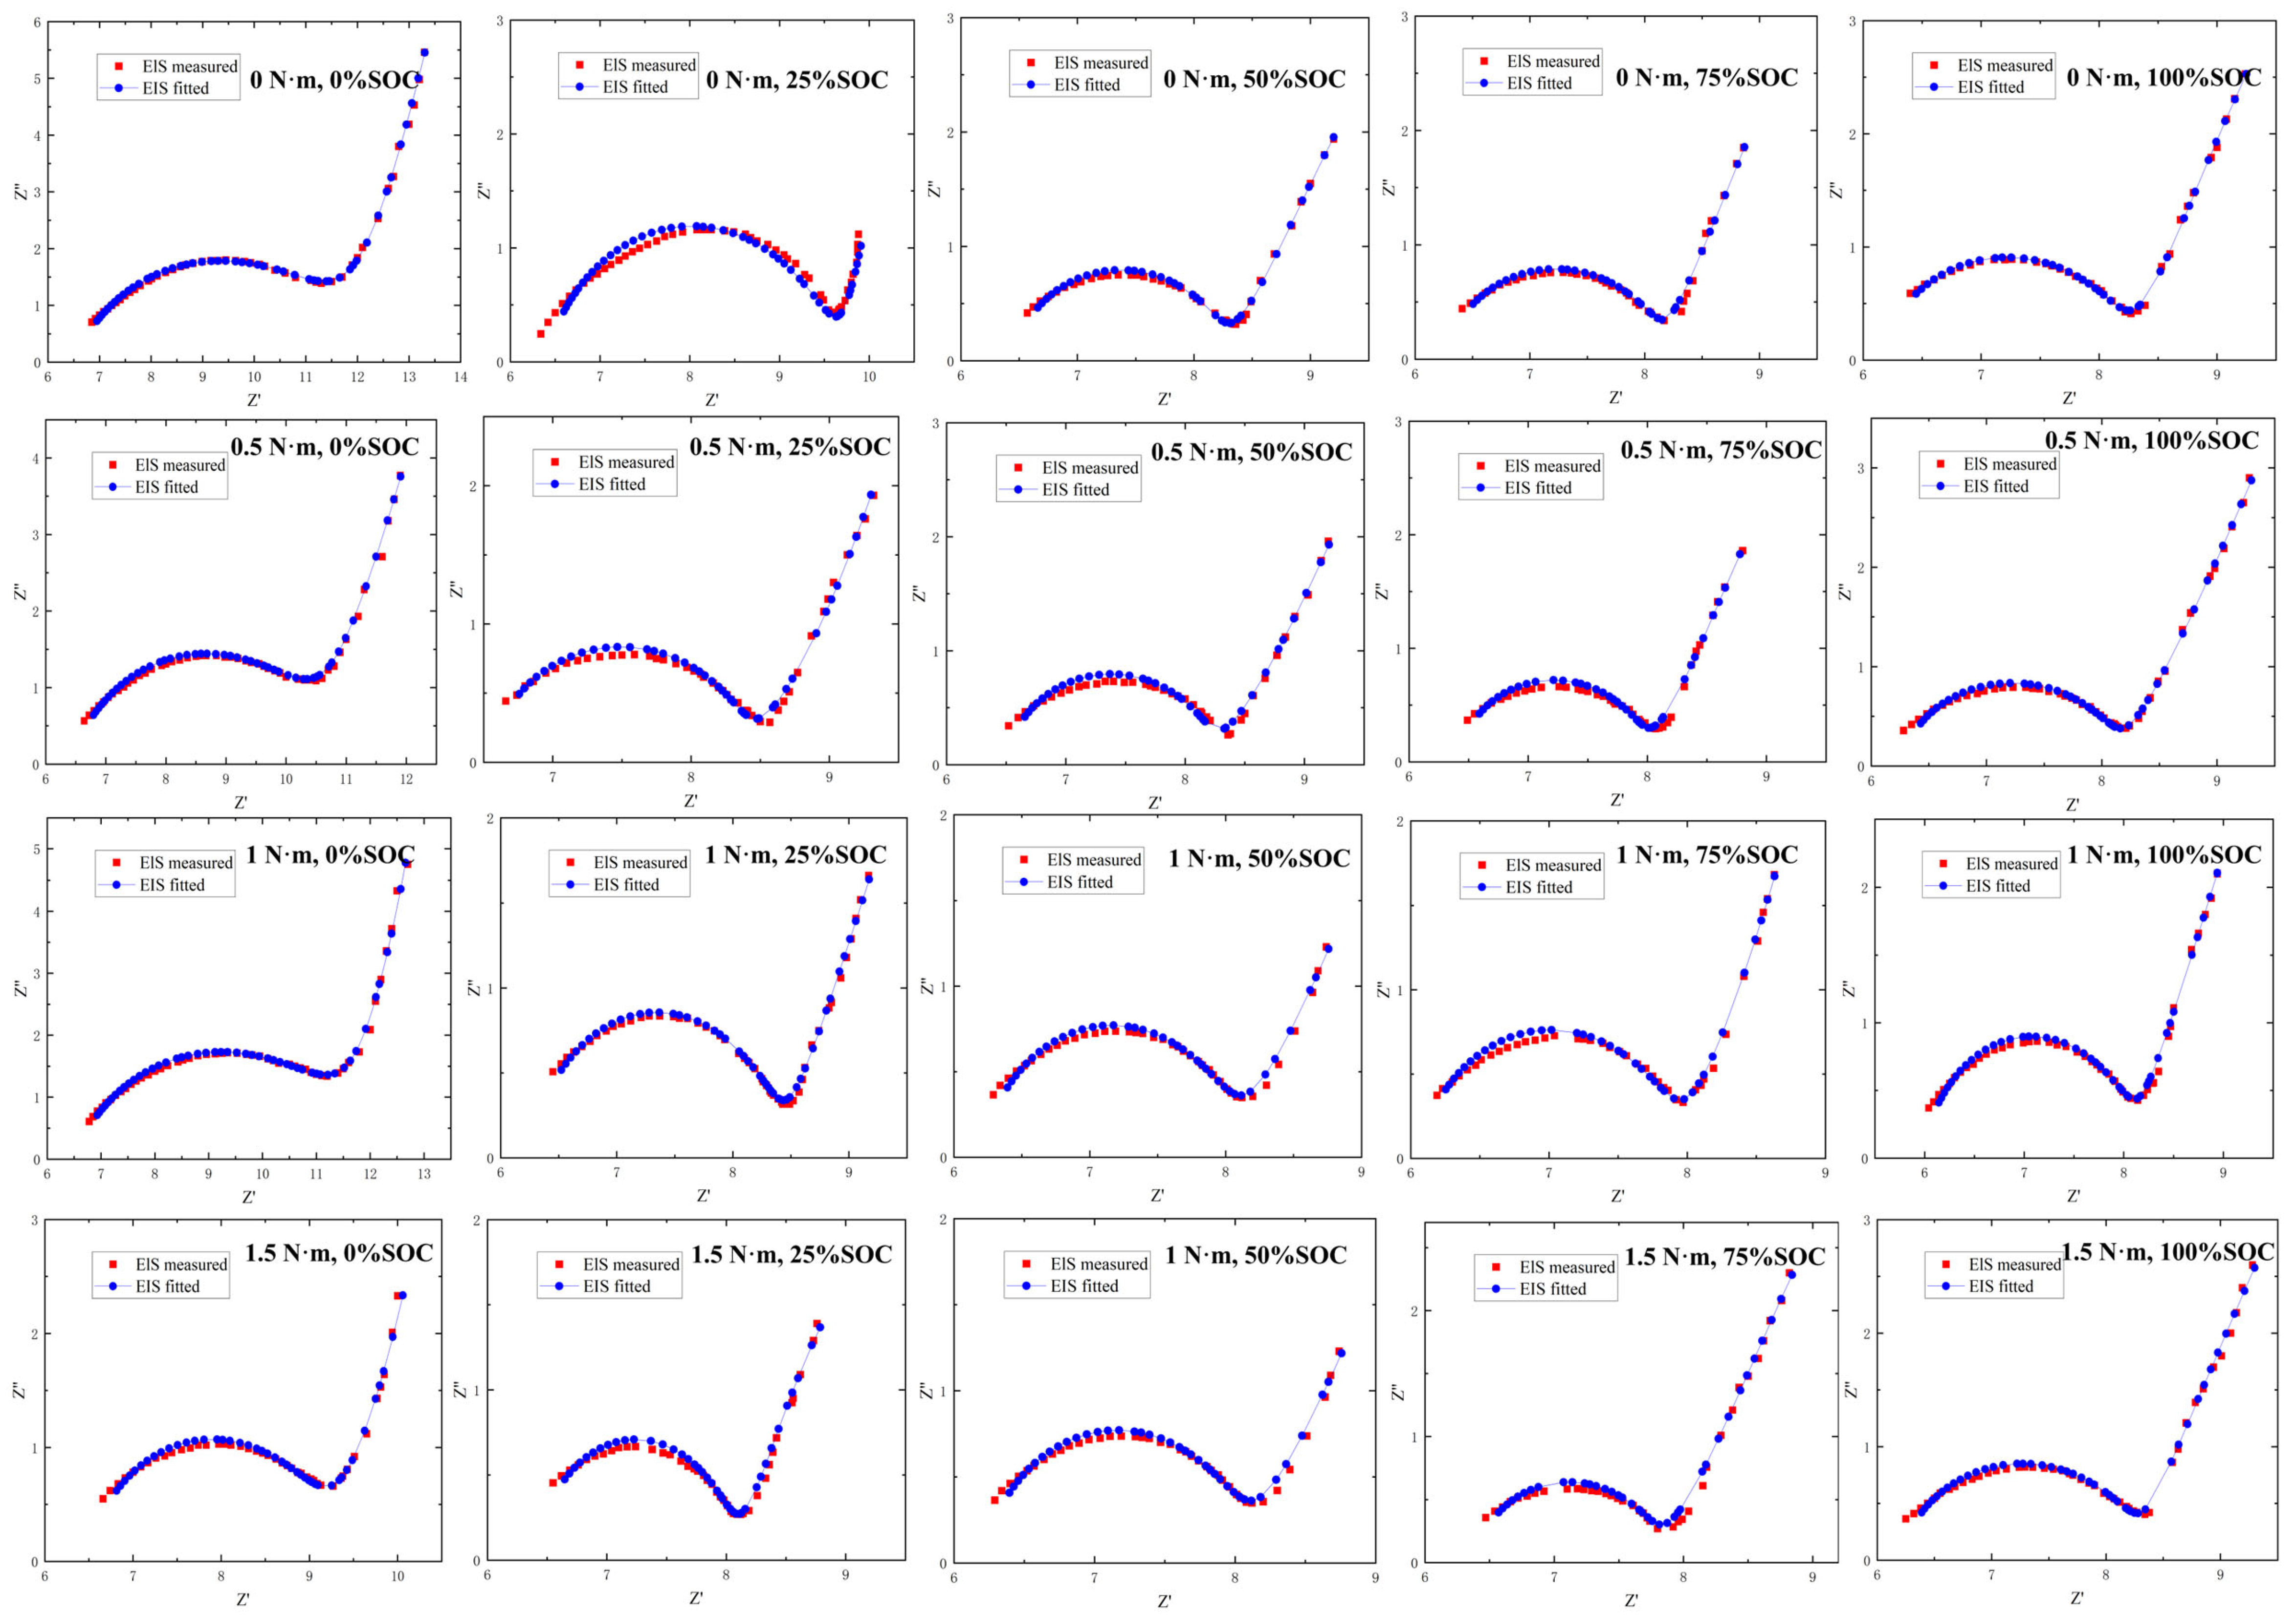
This model is based on a typical Randles circuit and aims to capture the electrochemical behavior of lithium-ion battery impedance spectra, including electron/ion transport, interface processes, and diffusion phenomena. The selection of this model is based on the typical characteristics of EIS spectra and ensures physical significance by minimizing fitting errors. ZSimpWin software is utilized in this study; nonlinear least-squares fitting is performed on all EIS spectra, with the fitting parameter χ2 value less than 0.01 and an average fitting error less than 10%, indicating a high degree of agreement between the model and experimental data and the ability to accurately decompose impedance contributions. The EIS fitting curves are demonstrated in Figure 6, where the solid lines represent the fitting results and the scatter points are experimental data covering spectra under different mechanical pre-torques and SOCs.
It can be observed that the model calculation results fit the experimental data well along the same trajectory, confirming the reliability of the equivalent circuit fitting model, which is applicable for describing the battery’s impedance characteristics.
However, the regression performance varies significantly across different operations: Under the combination of low mechanical pre-torque (such as 0 N·m) and medium SOC (50%), the fitting curve and experimental data overlap almost completely, with the deviation remaining within a narrow range. This indicates that the battery’s electrochemical process is relatively stable under these conditions, and that the model assumptions are highly consistent with the actual reaction mechanism. In contrast, when switching to the combination of high mechanical pre-torque (such as 1.5 N·m) and high SOC (100%), a noticeable deviation emerges between the fitting curve and the experimental data—the fluctuation amplitude of the scatter points increases significantly, and the steep rise phase of the curve is out of sync with the changing rhythm of the experimental data.
This phenomenon further indicates that mechanical pre-torque and SOC do not independently affect the battery’s electrochemical impedance characteristics. Instead, they exhibit a significant synergistic effect: High pressure compresses electrode pores and alters interface contact states, while at high SOC, the electrode’s lithium intercalation approaches saturation, and side reactions intensify. The superposition of these two factors complicates the battery’s internal electrochemical processes, which go beyond the “steady-state electrochemical process” assumption underlying the fitting model. Ultimately, this leads to a decrease in the model’s accuracy under such extreme operations.

3.2. Synergistic Effects of Mechanical Pre-Torque-Based Cycling Paths and SOCs

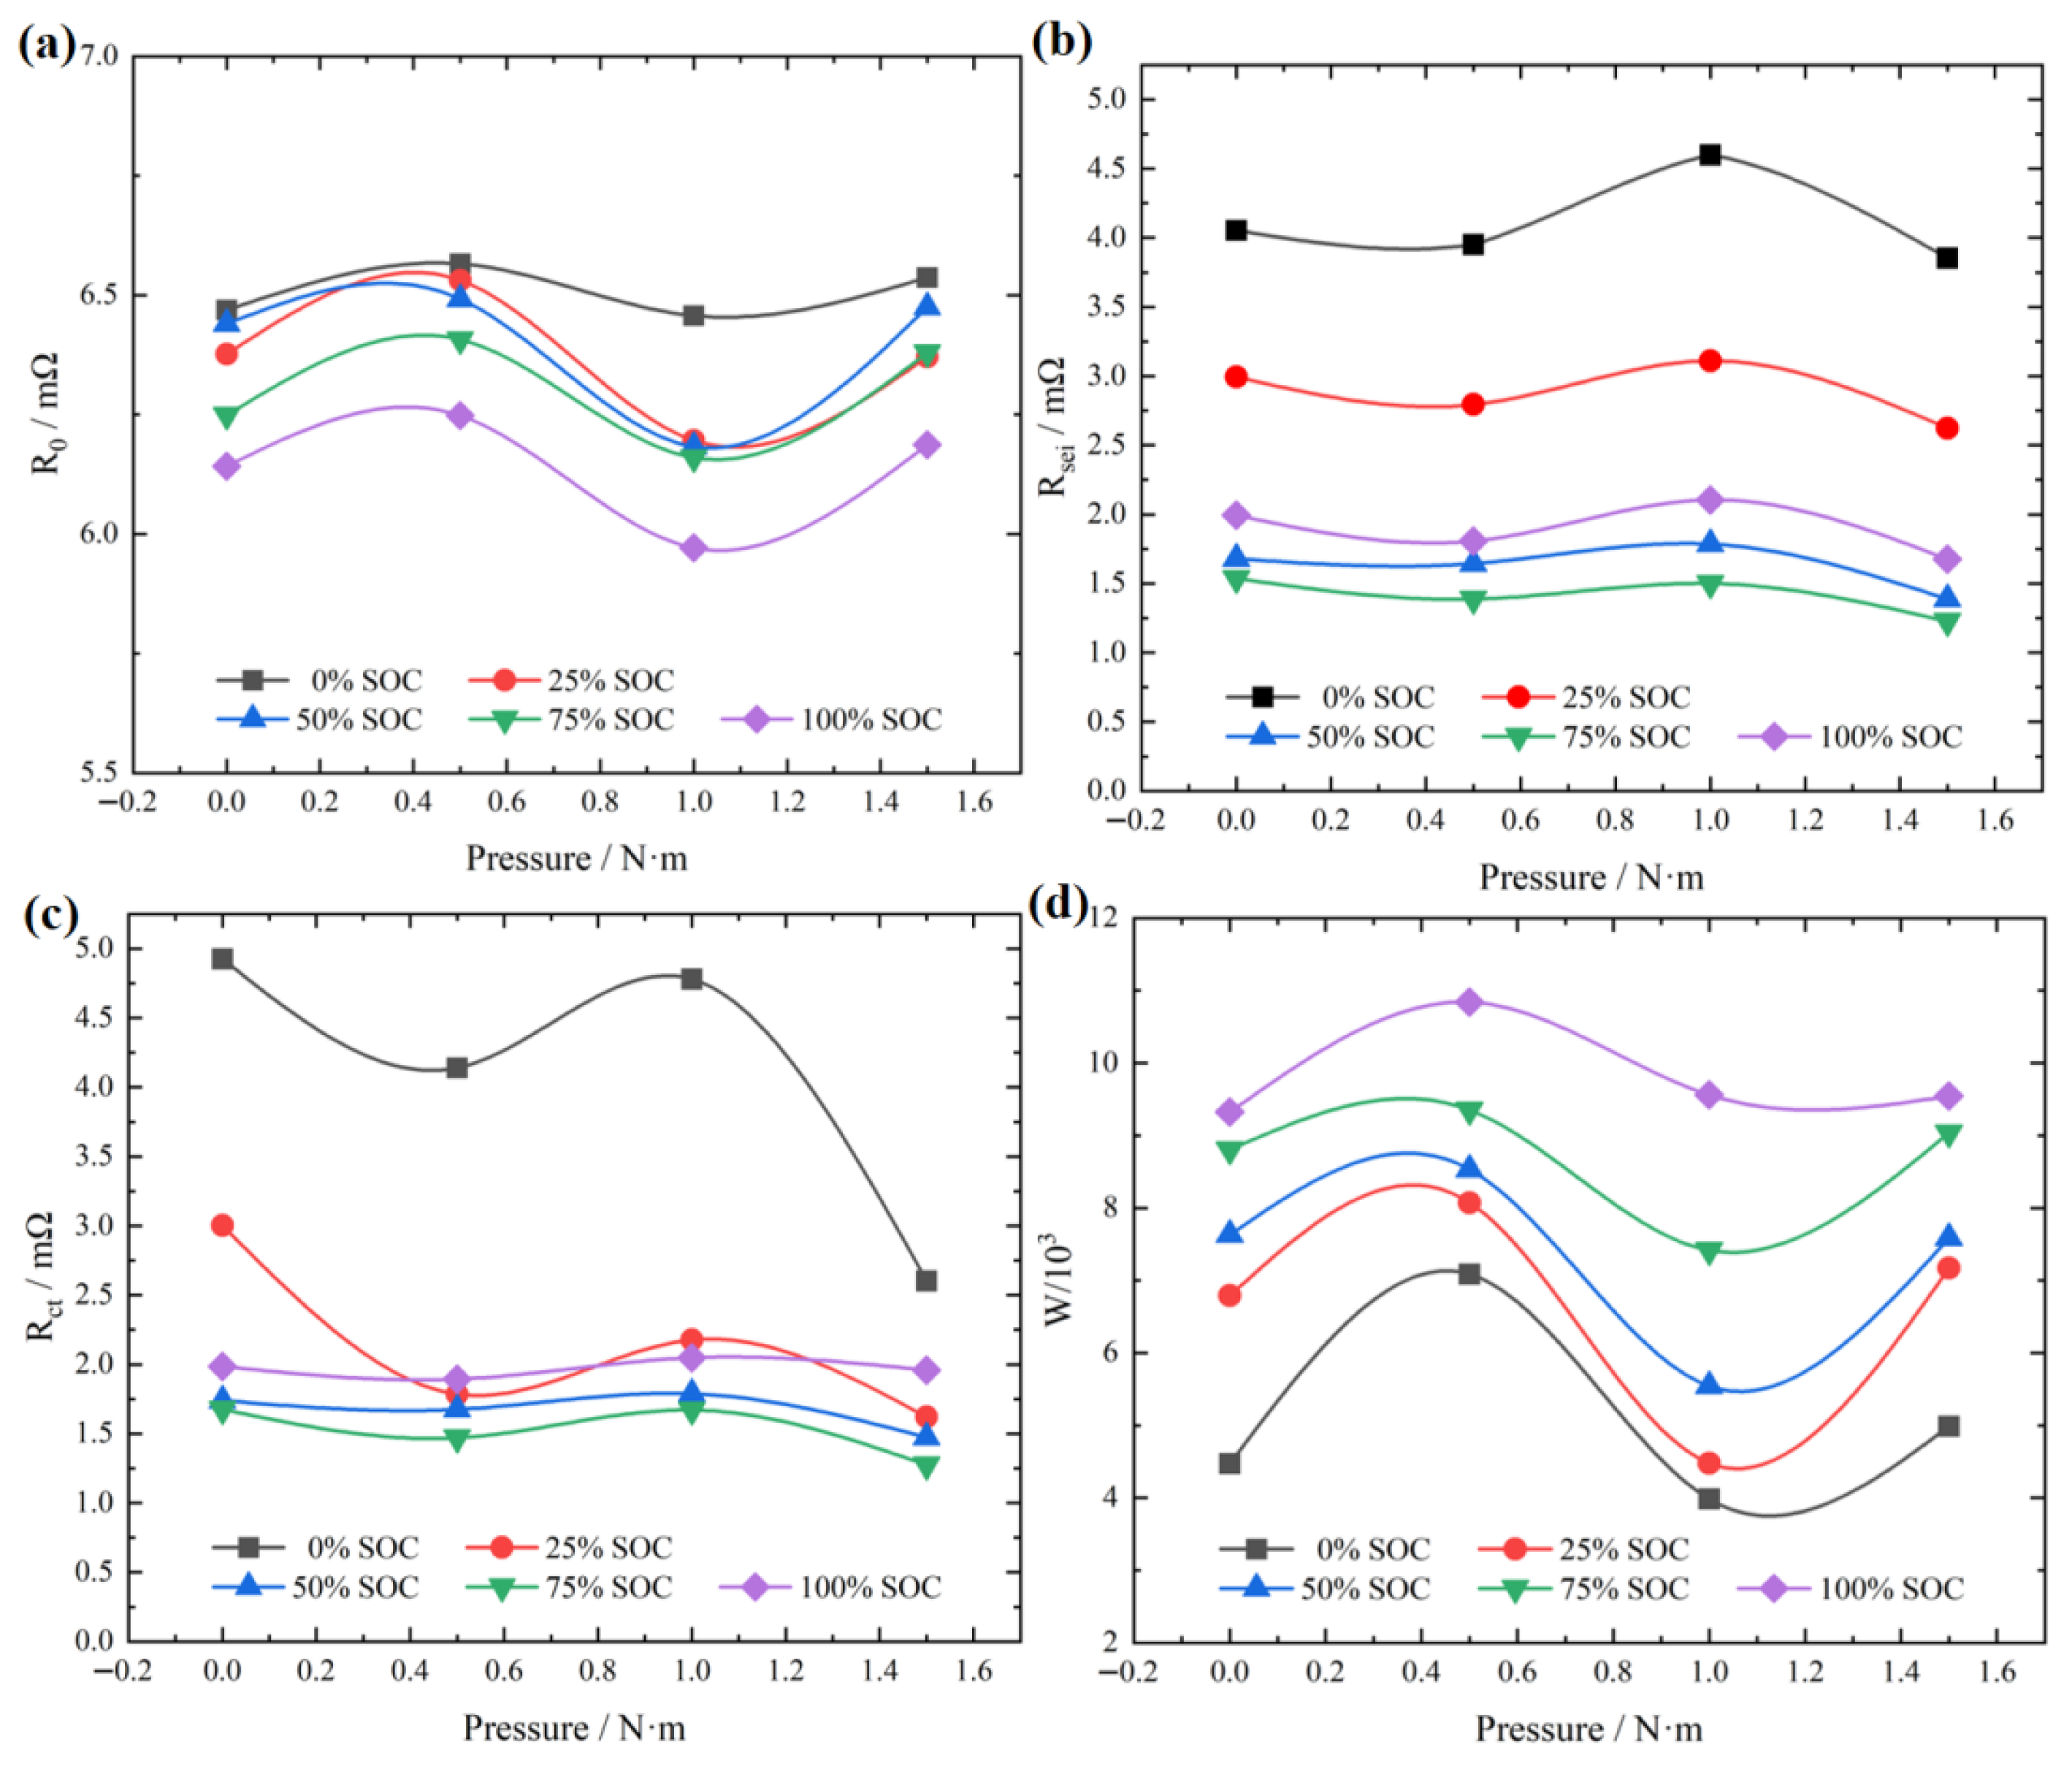
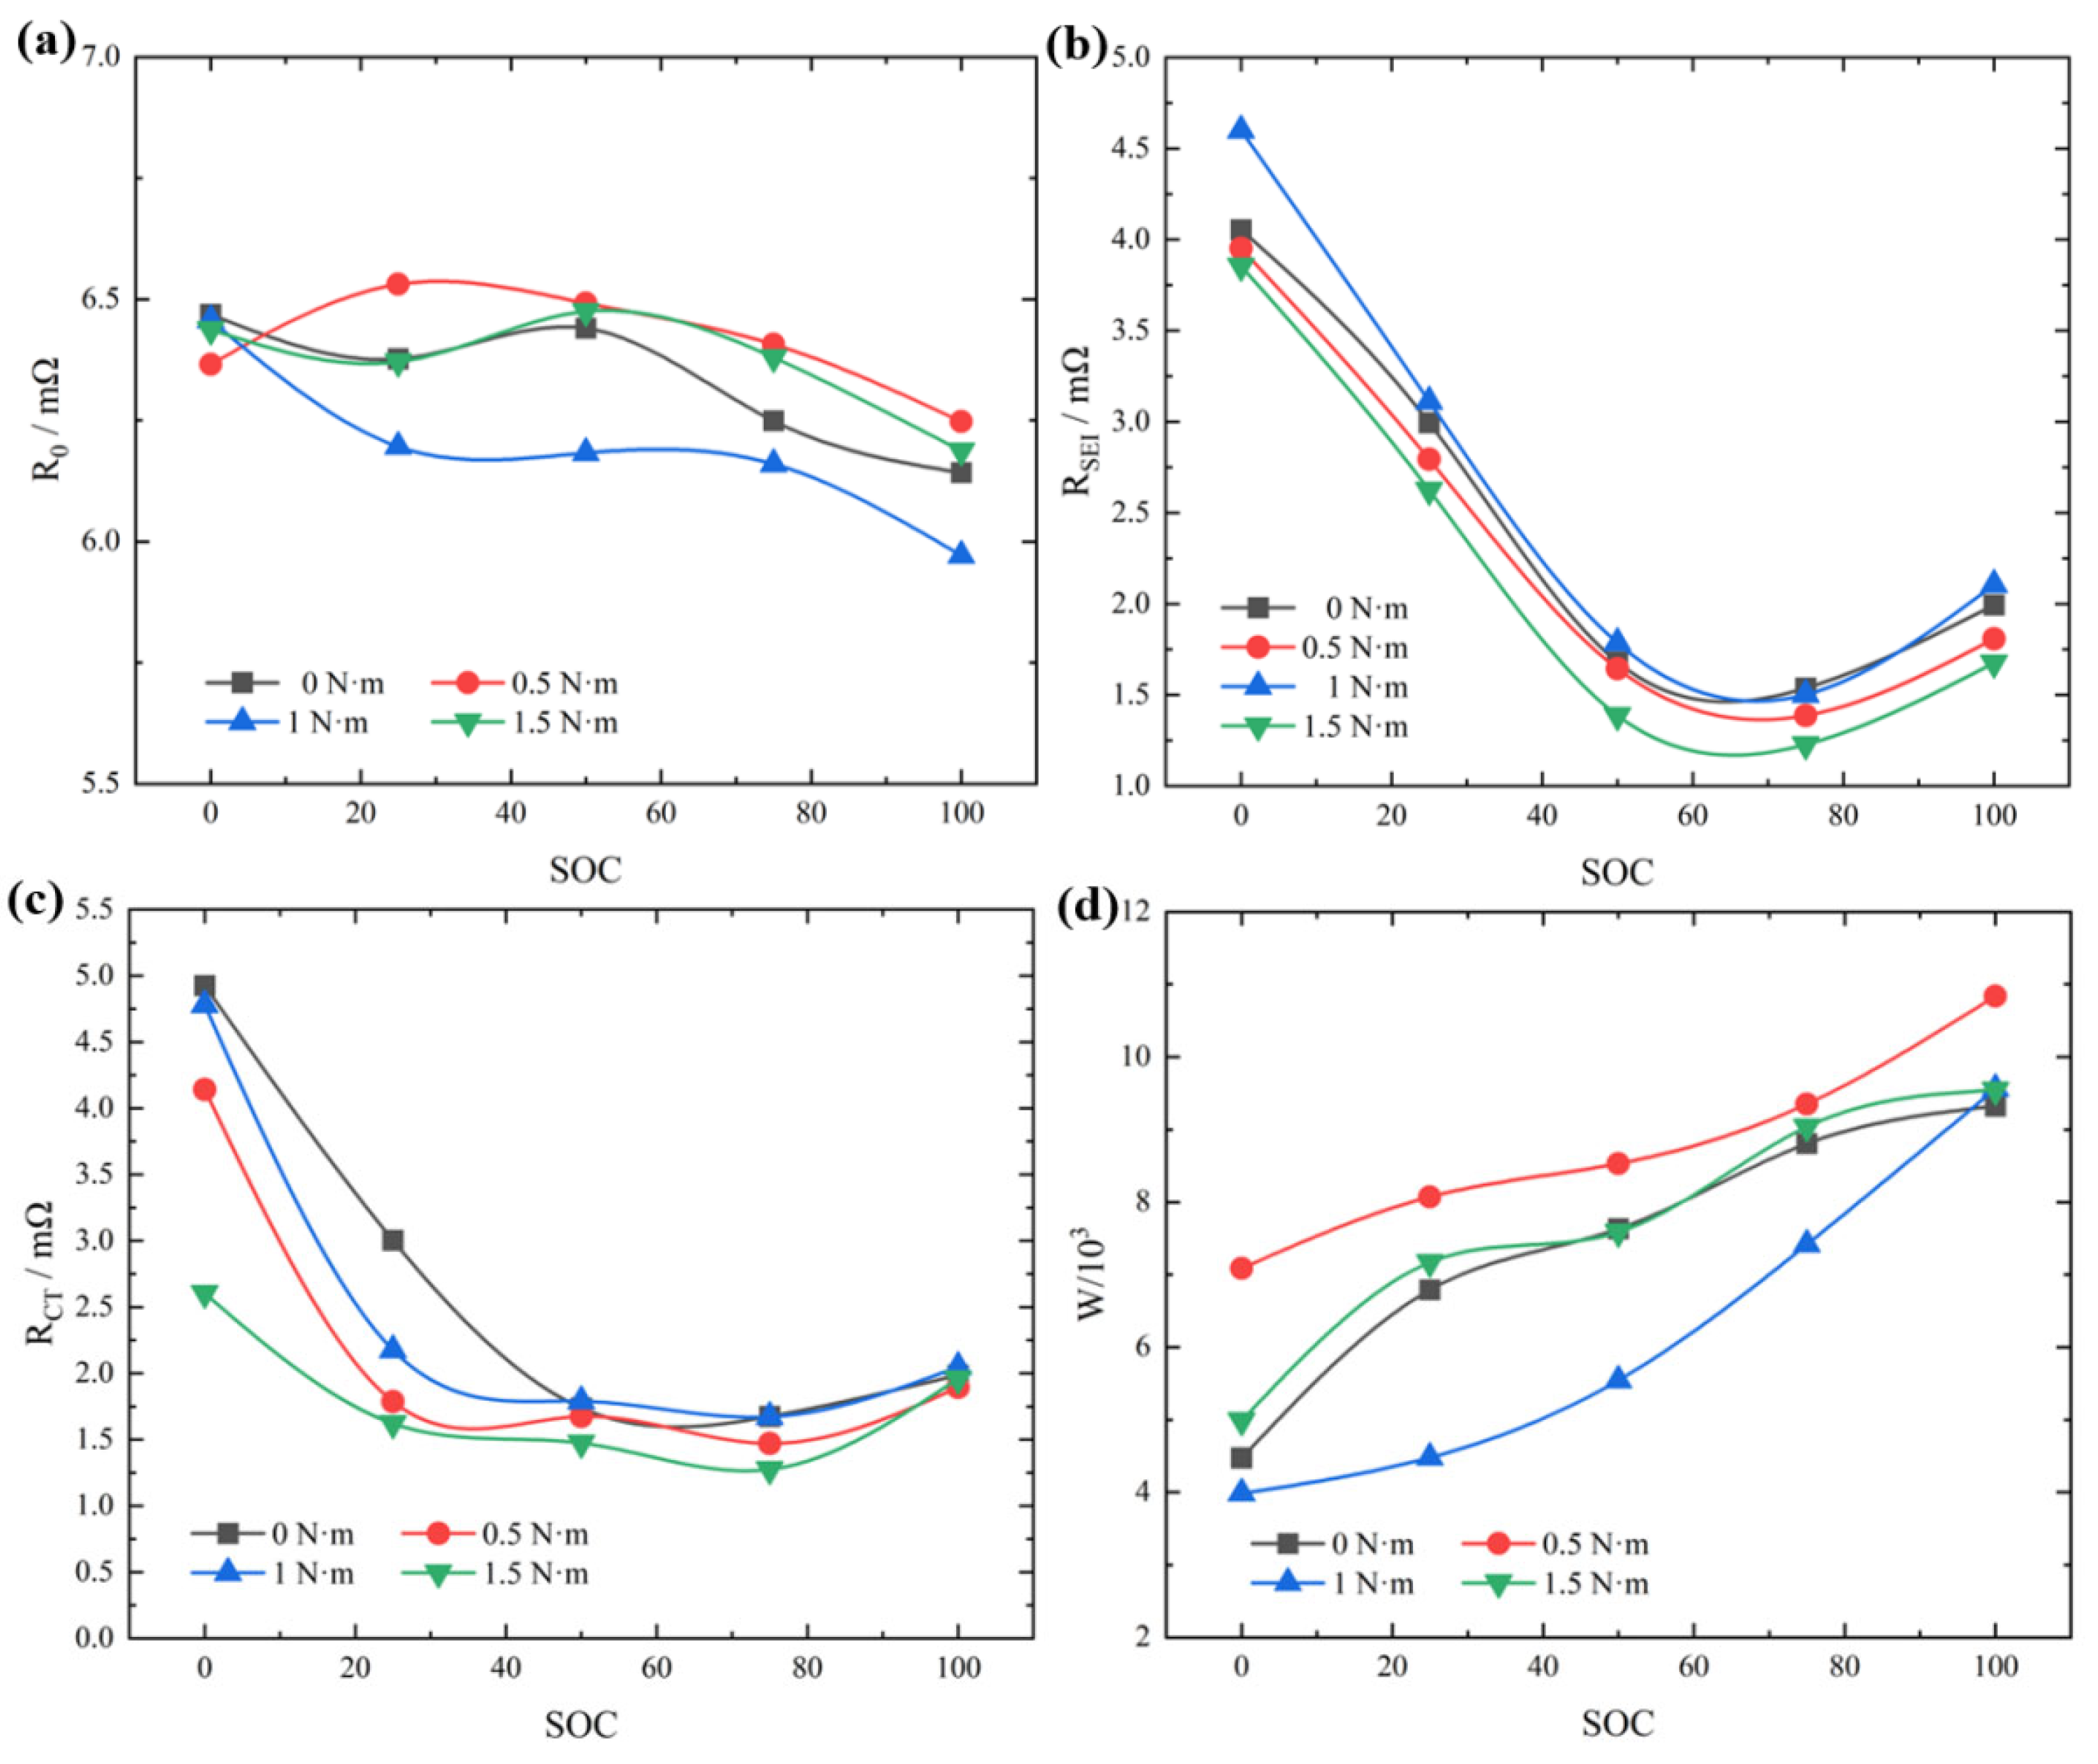
Figure 7 illustrates the impedance change curves for different mechanical pre-torque-based cycling paths at the same SOC, where RO, RSEI, Rct, and W vary with mechanical pre-torque. Figure 8 illustrates the impedance change curves at the same mechanical pressure for different SOCs, where each component varies with SOC. These curves reveal the synergistic effects from multiple angles, including quantitative trends, sensitivity analysis, and physical mechanisms: after mechanical pre-torque degradation, which changes the baseline level of impedance and regulates the rate of impedance change with SOC. Under low mechanical pre-torque, the SOC-induced impedance fluctuations are mild, with a change rate less than 5% per SOC unit, while under high pressure, the change rate amplifies to 10–15% per SOC unit, especially for Rct and W, indicating that high mechanical pre-torque-based cycling paths enhance the impedance sensitivity to SOC by amplifying interface reactions and diffusion unevenness through stress.
Specifically, from Figure 7, it can be observed that under different mechanical pre-torque-based cycling paths and SOCs, each impedance parameter exhibits similar regular changes: First, the SEI film resistance RSEI under all SOCs slightly decreases from 0 to 0.5 N·m, reaches the minimum between 0.5 and 1.0 N·m, and then slightly rises as the mechanical pre-torque continues to increase to 1.5 N·m.; the RSEI corresponding to the medium charge state, namely 75% SOC, is the lowest, while extreme states, namely 0% or 100% SOC, exhibit higher SEI film resistance. Second, the charge transfer resistance Rct also demonstrates a significant decrease at about 0.5 N·m, indicating optimized interface contact and the smoothest charge transfer at this point. Similar to SEI film resistance, as SOC increases from 0% to 75%, Rct gradually decreases, but shows a slight rise at 100% SOC, possibly due to surface passivation caused by excessive lithium insertion. The ohmic resistance Ro exhibits a typical “first rise then fall then rise” trend with mechanical pre-torque, reaching the lowest value in the 0.5 and 1.0 N·m interval, and is overall lowest with the smoothest fluctuation at 100% SOC. Finally, the Warburg impedance coefficient W shows a peak between 0.5 and 1 N·m, drops to a valley at about 1.0 N·m, and its magnitude increases stepwise as SOC rises, reflecting a significant increase in ion diffusion resistance at high SOC. Overall, when the clamping torque is controlled at 0.8 to 1.0 N·m and SOC is maintained in the 60–80% interval, each impedance indicator can be effectively reduced and kept stable, indicating that under this combination condition, the battery’s SEI film stability, interface electrochemical activity, and ion diffusion efficiency all reach optimal levels.
Figure 8 exhibits the regularity of each impedance parameter varying with SOC under four mechanical pre-torque-based cycling paths: First, the ohmic resistance Ro is slightly high at low SOC, namely 0%, gradually decreases and reaches the minimum as SOC rises to about 50%, and then slightly rebounds at higher SOC (higher than 75%). At the same time, as the mechanical pre-torque increases stepwise from 0 to 1.5 N·m, Ro decreases continuously across the entire SOC range, indicating that higher mechanical pre-torque-based cycling paths improve the conductive network connectivity between the electrode sheet and the current collector. Second, the SEI film resistance RSEI and charge transfer resistance Rct both exhibit noticeable “U-shaped” changes, rapidly decreasing from 0% to 75% SOC and reaching the lowest at intermediate SOC, then slightly rising at high SOC. As the pre-tightening torque increases, the overall values of these two impedances decrease significantly, indicating that appropriate contact pressure not only promotes the densification of the SEI film but also accelerates the electrochemical reaction kinetics at the interface. Finally, the Warburg diffusion impedance coefficient W increases continuously as SOC rises, reflecting intensified ion diffusion resistance during deep charging. However, a higher mechanical pre-torque can effectively suppress the rise in W across the entire SOC interval, especially during the high SOC stage.
The interaction dynamics between mechanical pre-torque-based cycling paths and SOC can be more deeply revealed by the combination of Figure 7 and Figure 8, quantifying the multi-level manifestations of synergistic effects. Specifically, under high mechanical pre-torque, such as 1.5 N·m, the increase amplitude of RSEI when SOC decreases from 75% to 0% is significantly amplified: Figure 7 shows that at 0% SOC, RSEI reaches a higher value of about 3.5 mΩ under 1.5 N·m, while Figure 8 confirms an increase of 40% from the lowest value of about 2 mΩ at 75% to 0%, far higher than the 20% change under low mechanical pre-torque 0 N·m from about 3 mΩ at 75% to about 3.6 mΩ at 0%. This amplification effect is physically consistent with the SEI film passivation and ion transport blockage at low SOC under high mechanical pre-torque, where mechanical pre-torque exacerbates the unevenness of lithium-ion concentration gradients, thereby increasing RSEI’s sensitivity to SOC by 20–25%. Similarly, under 1 N·m, Rct’s SOC sensitivity increases by 15%: In Figure 8, Rct rises steeply at low SOC 0–25% from the lowest value at 75% to extreme values, while Figure 7 confirms that at 50% SOC, Rct slightly rises from 1 N·m with an increase of 10%, implying that medium mechanical pre-torque has begun to alter the SOC dependency of interface processes, particularly at low SOC, where mechanical pre-torque induced contact optimization alleviates diffusion but amplifies mass transfer limitations.
Further analyzing the high SOC region, from the 100% SOC curve in Figure 7, all components show a noticeable micro-rising trend under high mechanical pre-torque, combined with the 1.5 N·m curve in Figure 8, RO rises from the lowest about 2 mΩ at 75% to 3 mΩ at 100% with an increase of 50%, far exceeding the mild rebound increase of 15% under low pressure, reflecting that high mechanical pre-torque-based cycling paths synergistically amplify charge transfer resistance at high SOC, exacerbating the change rate to 10%/SOC unit through side reactions. In contrast, under low pressure, such as 0.5 N·m, the cross shows that the impact of SOC changes on W is minimal with a micro-increase rate < 5% per unit in Figure 8, while Figure 7 confirms the lowest impedance at medium SOC, indicating that moderate mechanical pre-torque buffers SOC fluctuations and promotes overall stability. These multi-dimensional cross-quantitative amplifications, nonlinear trends, and mechanism interactions emphasize that mechanical pre-torque shifts the baseline and reshapes the shape and slope of the SOC-impedance curves, with the most significant synergistic degradation at the intersection of extreme SOC and high mechanical pre-torque.

4. Gaussian Process Regression-Based Adaptive SOC Estimation

The SOC assessment of lithium-ion batteries is a core function of the battery management system (BMS), directly affecting battery safety, efficiency, and lifespan. Conventional SOC estimation methods, such as the open-circuit voltage (OCV) method, the coulomb counting method, or Kalman filtering based on ECM, typically rely on a single parameter or ignore external factors, such as mechanical pre-torque, leading to reduced accuracy under complex operating conditions. The previous sections of this study revealed the synergistic effects of mechanical pre-torque-based cycling paths and impedance on SOC, and this nonlinear interaction provides a new approach to improving SOC accuracy. Specifically, by integrating changes in impedance components from EIS data, an adaptive model can be developed to dynamically correct SOC estimation.
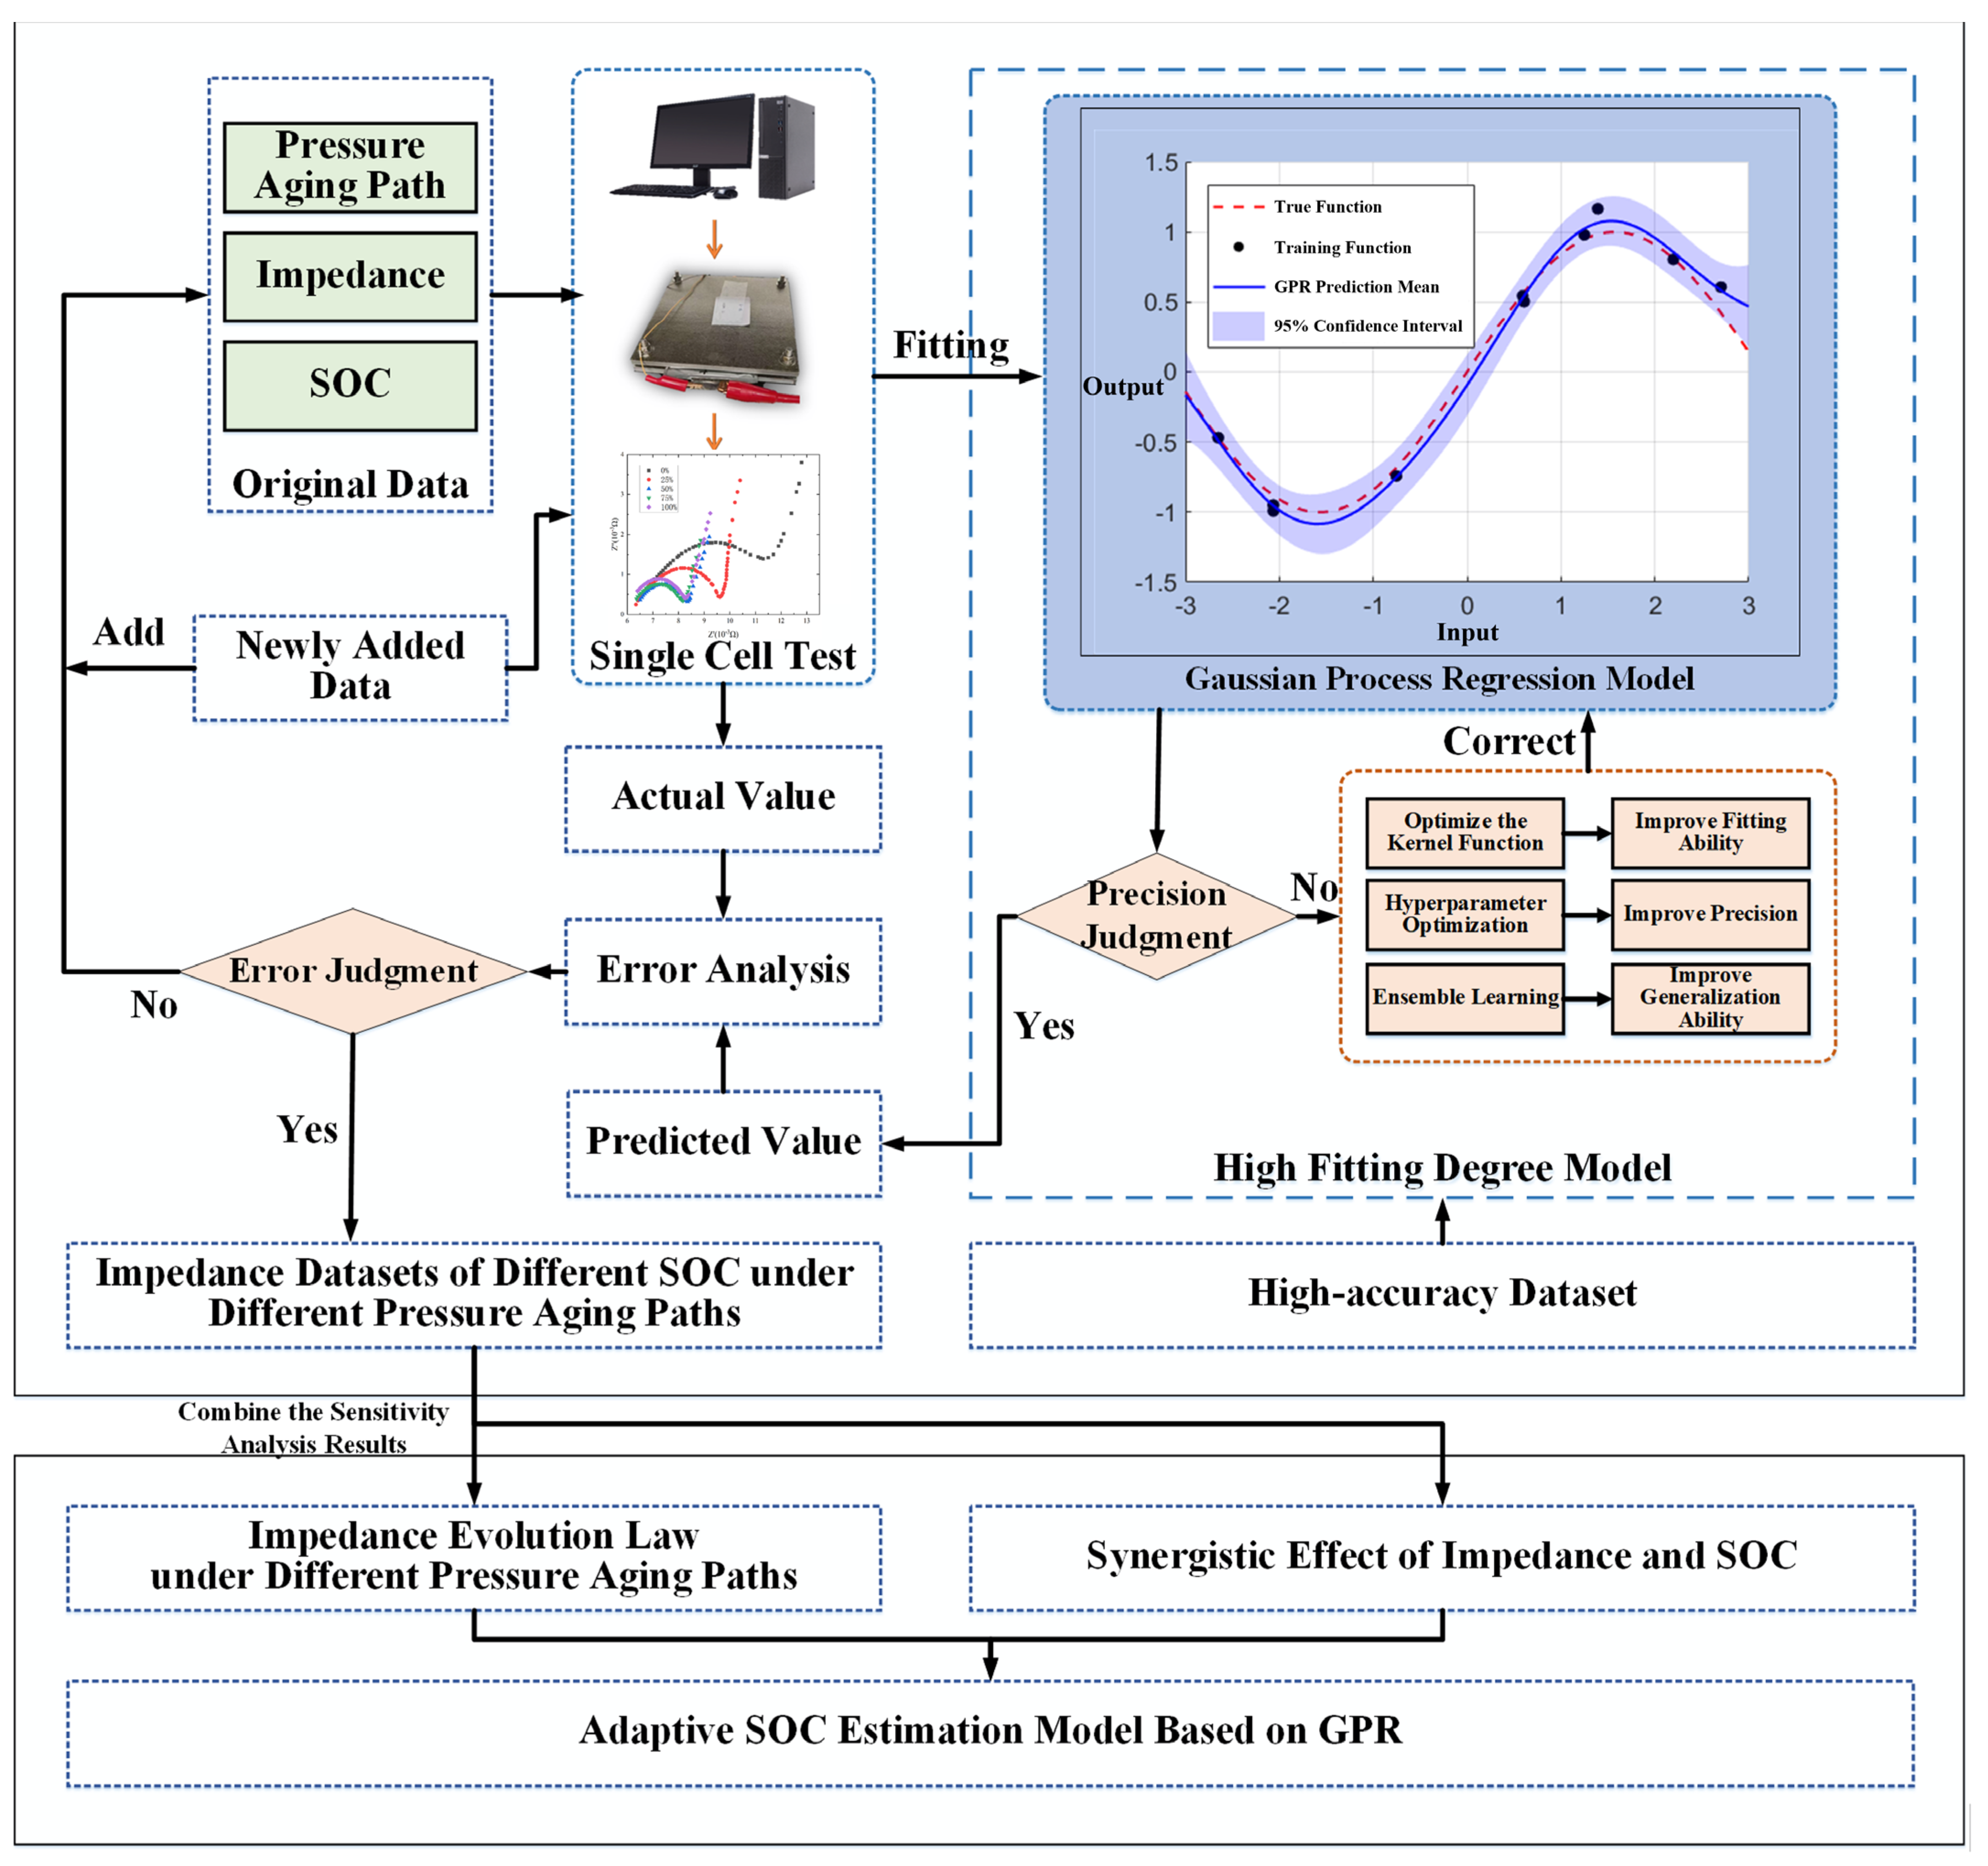
Gaussian process regression (GPR) is a non-parametric Bayesian machine learning method, particularly suitable for handling uncertainty and noisy data. It models input-output relationships by defining kernel functions that capture nonlinear patterns and provide confidence intervals. This section proposes a GPR-based adaptive SOC estimation model, utilizing SOC as the target variable, mechanical pre-torque-based cycling paths (characterized by impedance components), and real-time EIS features as inputs to enable dynamic correction. Based on the basic principles of GPR, its data fitting, dataset expansion, model prediction, and experimental validation processes are depicted in Figure 9.
As demonstrated in Figure 9, the specific steps for establishing the GPR-based adaptive SOC estimation model are as follows:
Based on the analysis results of the synergistic effects of impedance and SOC under different cycling paths, establish the GPR training set.
Use the GPR algorithm to fit the training data, assess the fit using root mean square error (RMSE), and revise the GPR model utilizing methods such as kernel function optimization, hyperparameter optimization, and ensemble learning until the fit is ≥95%.
Use the GPR model with high predictive performance to estimate SOC for different battery impedance values along the aging path, and verify the predictions experimentally. If the average error between the experimental values and predicted values is >5%, merge the newly added 20 sets of experimental data with the training data, and refit utilizing the GPR algorithm.
Repeat the above process until the average error between the experimental values and predicted values is <5%, and finally verify the accuracy of the prediction model.

4.1. Dataset Acquisition

The model is trained based on the experimental data of this study, namely the EIS impedance data of lithium-ion batteries during cyclic aging to 80% SOH under different mechanical pre-torques. Specifically, the training set includes impedance components (RO, RSEI, Rct, and W) and their corresponding mechanical pressures and SOC. To improve model reliability and provide support for subsequent verification, multiple impedance tests are conducted under the same experimental conditions, totaling 200 sets of data (four mechanical pre-torques × five SOCs × 10 times), with the ratio of training/testing dataset of 8:2.
The selection of mechanical pre-torques is 0 N·m, 0.5 N·m, 1 N·m, and 1.5 N·m; these values cover the complete range from no mechanical pre-torque control group to moderate pressure optimization zone and then to medium-high mechanical pre-torque cycling zone: 0 N·m as the baseline for comparing mechanical pre-torque effects. 0.5 N·m represents moderate pressure, which can improve electrode–electrolyte contact and reduce impedance. 1 N·m and 1.5 N·m simulate medium- to high-mechanical pre-torque scenarios, capable of capturing nonlinear degradation effects, such as impedance amplification and increased diffusion resistance, thereby ensuring the model’s generalization in practical applications. The selection of SOC levels is 0%, 25%, 50%, 75%, and 100%. These points are strategically distributed across the low, medium, and high SOC intervals, with 0% and 100% as extreme conditions, highlighting pressure-induced impedance fluctuations. The dataset includes a total of 25%, 50%, and 75% as intermediate values, to facilitate the capture of U-shaped or nonlinear change trends, ensuring the dataset fully covers SOC’s sensitivity to impedance. Data preprocessing includes normalization (Min-Max scaling) and noise filtering to satisfy GPR’s input requirements, ultimately building a balanced training set to support the model’s learning of mechanical pre-torque-SOC synergistic mechanisms.

4.2. Regression Method Screening

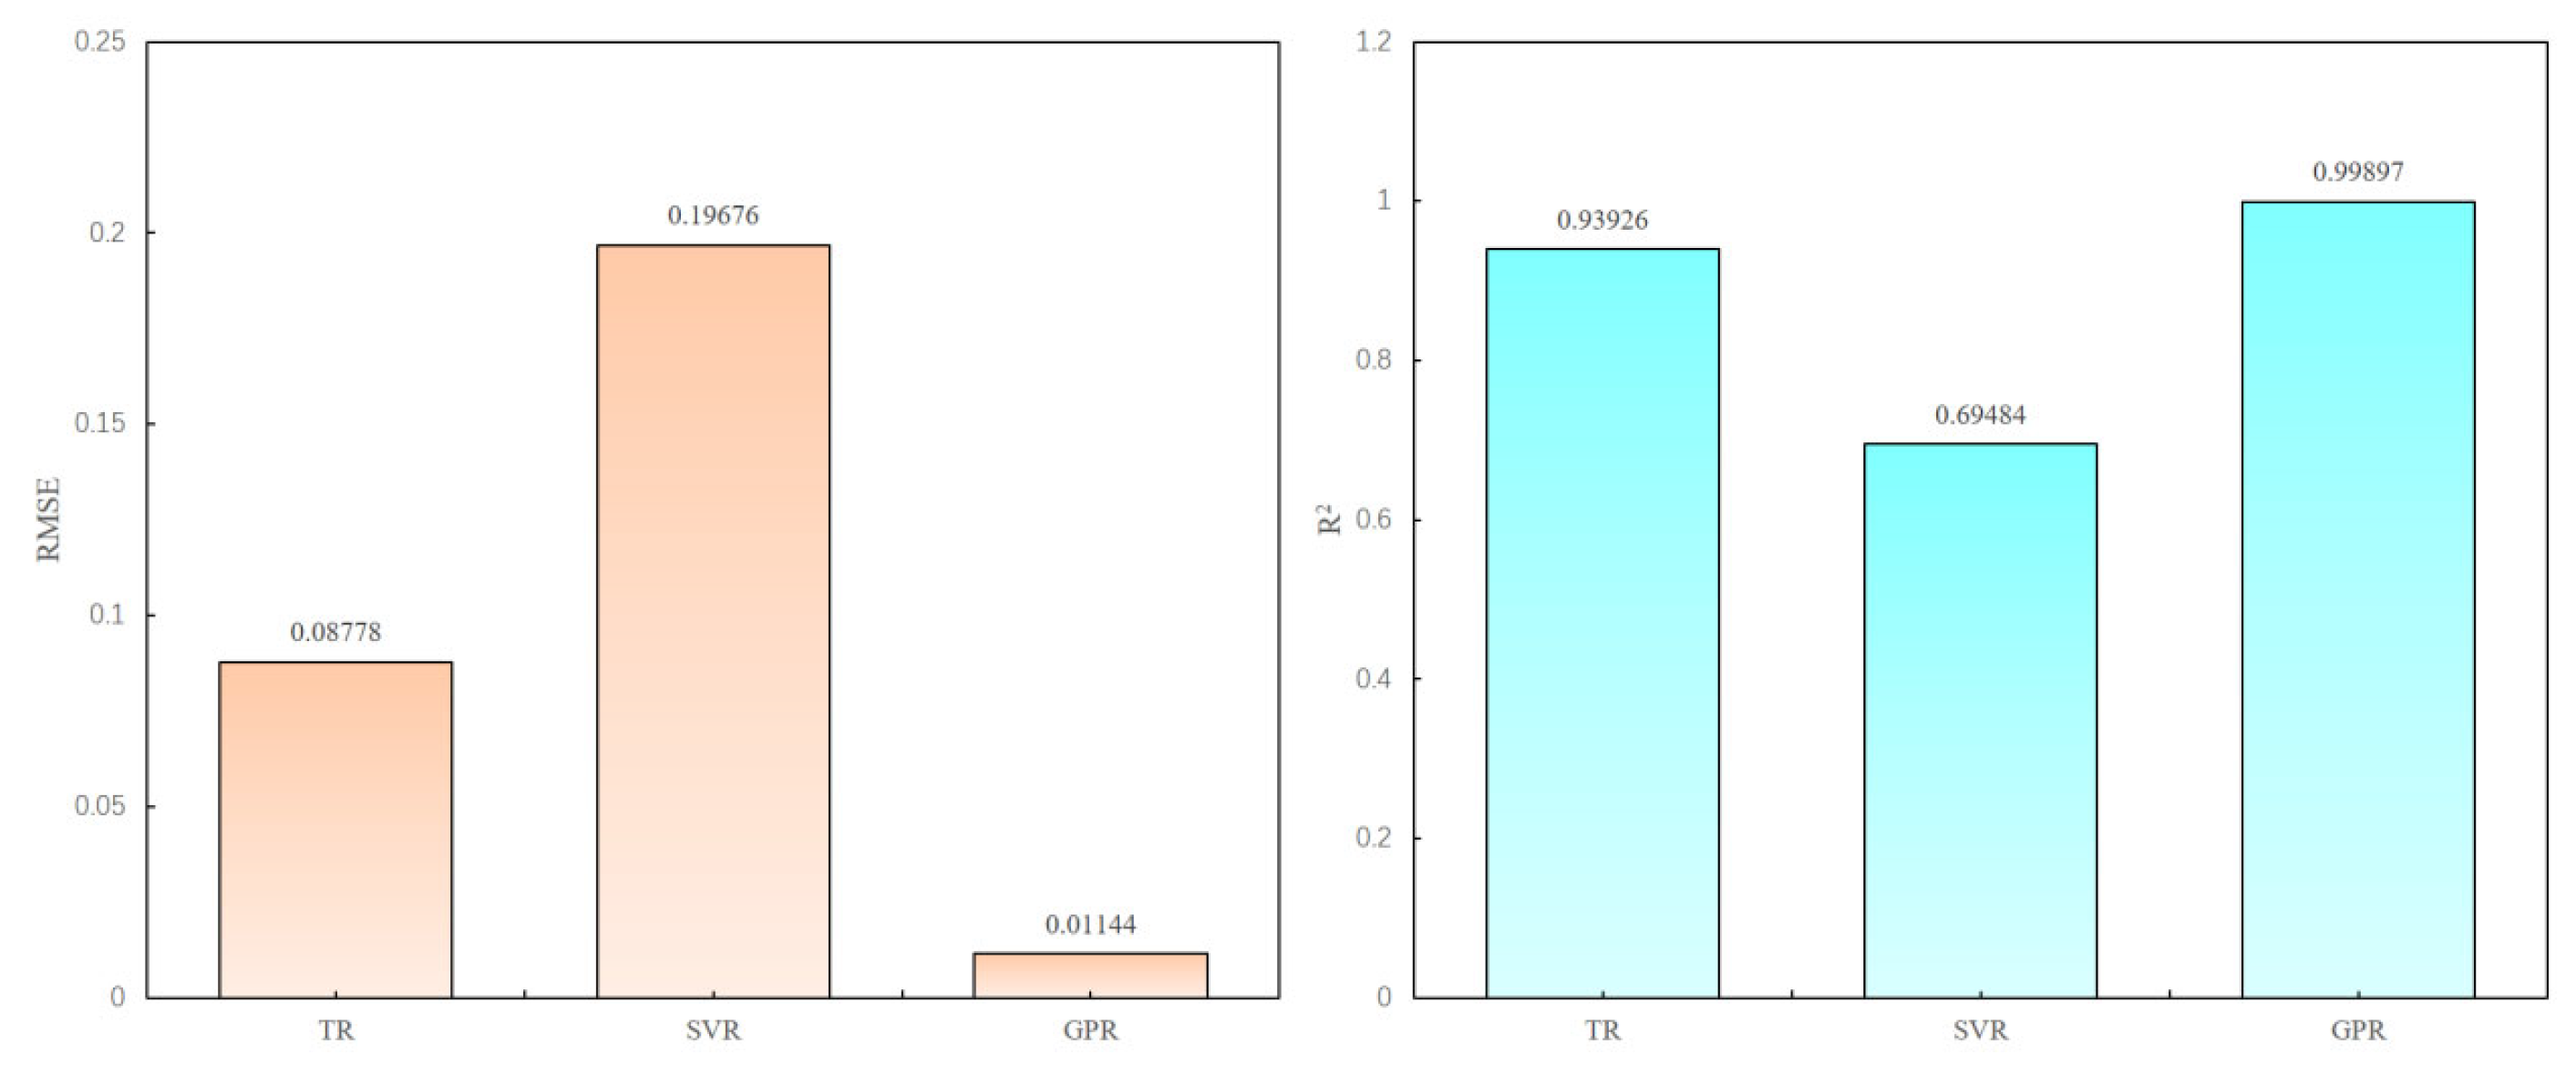
Prior to constructing the GPR model, it is necessary to screen regression methods. Given the current state of the art in regression techniques, for cases with small data volumes (typically fewer than 10,000 sets), regression methods can effectively fit the data and find optimal parameters. This study selects three common regression models: Tree-based Regression (TR), Support Vector Regression (SVR), and GPR. These three models are utilized to perform regression on the training dataset, and the root mean square error (RMSE) and coefficient of determination (R-squared, R2) are calculated; the results are shown in Figure 10.
As illustrated in Figure 10, during the initial modeling stage, the GPR model demonstrates superior prediction accuracy among the regression models, with its RMSE reduced by 51.2% compared to the SVR model and by 75.9% compared to the TR model, indicating that the GPR model, leveraging the Gaussian kernel function’s ability to characterize nonlinear mapping relationships in the input space, can more precisely capture the complex coupling between multiple variables, such as temperature and mechanical pre-torque, and battery current, demonstrating advantages in data trend fitting and local feature representation. Compared to the rigid mapping of tree regression and the local optimality of SVR, the GPR model provides more robust theoretical support for predictive modeling under small-sample conditions through the uncertainty estimation offered by the Bayesian inference framework.
The GPR model exhibits significant performance advantages. In terms of RMSE, GPR’s value is only 0.01144, substantially lower than 0.19676 for the SVR model and 0.08778 for the TR model. In terms of R2, GPR achieves 0.99897, far higher than 0.69484 for SVR and 0.93926 for TR. This indicates that the GPR model can more precisely capture the complex relationships among relevant variables and performs excellently in data fitting and other aspects. Compared to the rigid mapping of the TR model and the local optimality of the SVR model, it possesses superior performance, providing strong support for relevant predictive modeling.

4.3. Model Framework

The mathematical foundation of the GPR model is: given the training dataset D = (X, y), where X is the input feature matrix (including impedance components RO, RSEI, Rct, W, and mechanical pressure levels), and y is the corresponding SOC value. GPR assumes that the output y follows a Gaussian process:
y G P ( m ( X ) , k ( X , X ˙ ) )
where m ( X ) is the mean function (usually set to 0), and k ( X , X ) is the covariance kernel function. The RBF kernel is utilized:
k ( x , x ˙ ) = σ 2 exp ( x x ˙ 2 2 l 2 )
where σ is the signal variance, and l is the length scale, with hyperparameters optimized through maximum likelihood estimation.
The model is trained on 160 sets of EIS data from the experiments, ensuring generalization through cross-validation (k = 5). In the prediction phase, real-time EIS measurements are input, and GPR outputs SOC estimates and confidence intervals, enabling dynamic correction: if the pressure is high and SOC is low, the model increases the Rct weight to correct the underestimation error of the traditional OCV method.

4.4. Impedance Prediction Based on GPR Model

Based on the GPR model, SOC predictions are performed for different mechanical pre-torques and different EIS data. Since this model exhibits a high degree of data fitting, it indicates that it can be well applied to data prediction. In view of this, the same impedance testing method is adopted to charge batteries with different mechanical pre-torques of 0, 0.5, 1, and 1.5 N·m to arbitrary SOC, then perform EIS tests, and use the same method for data processing. To ensure data accuracy and reliability, five SOC impedance tests are conducted for each clamping force condition. Finally, the GPR model is used to predict the SOC for each data point, and the deviation between predicted and actual values is analyzed to assess the GPR model’s accuracy in SOC prediction. The specific prediction results are shown in Table 2.
From Table 2, the predicted results are quite close to the actual results. The errors for each data point are kept low, with most errors between 1 and 4%, and the deviation between predicted and true values is small, indicating that the predicted results are quite close to the actual results and possess certain accuracy and reliability.
The above results confirm that the GPR model can accurately predict the nonlinear relationships between SOC and parameters such as RO, RSEI, Rct, and W after EIS processing under different clamping force conditions, maintaining stable prediction accuracy across multiple parameter ranges. The characteristics verify the model’s reliability at the theoretical level and provide a quantitative basis for rapid estimation of relevant parameters and optimization in real applications.

5. Conclusions

This study systematically investigates the impedance characteristics of commercial lithium-ion pouch cells during cycling degradation to 80% SOH under different mechanical pre-torques, namely 0 N·m, 0.5 N·m, 1 N·m, and 1.5 N·m, and collects data at five SOC levels: 0%, 25%, 50%, 75%, and 100%. Through EIS measurements and equivalent circuit model fitting, the effects of mechanical pre-torque-based cycling paths on impedance components and their synergistic effects with SOC are revealed, and a GPR-based adaptive SOC estimation model is developed. The main conclusions are drawn as follows:
(1)
Effects of mechanical pre-torque on impedance components: Moderate mechanical pre-torque significantly reduces impedance components. For instance, under a 0.5 N·m torque load, RSEI decreases from 4.5 mΩ at 0 N·m to 2 mΩ, a reduction of over 55%; Ro decreases by 60%, Rct decreases by 30%, and the Warburg coefficient W decreases by 20%, reflecting optimized electrode–electrolyte contact and ion transport. High mechanical pre-torque, such as 1.5 N·m, leads to impedance rebound, with RSEI/Ro/Rct/W increasing by 25%/20%/40%/20% respectively, indicating that pore compression amplifies diffusion resistance.
(2)
Synergistic effect of mechanical pre-torque-based cycling path and SOC: Mechanical pre-torque alters the rate of impedance change with SOC, with a change rate < 5% per SOC unit under low mechanical pre-torque, amplified to 10–15% per SOC unit under high mechanical pre-torque. For instance, under 1.5 N·m, when SOC decreases from 75% to 0%, RSEI increases by 40%, far higher than 20% under 0 N·m torque load, and Rct increases by 15%, indicating that high mechanical pre-torque amplifies interface passivation at low SOC. At high SOC (namely 100%), Rct increases by 50%, with a prominently negative synergistic effect.
(3)
Performance of GPR-based adaptive SOC estimation model: The model utilizes impedance components and mechanical pre-torque interaction features to achieve dynamic correction, with RMSE of 2.1%, superior to the traditional ECM-KF method’s 4.5%. Under high mechanical pre-torque (2 N·m), as SOC decreases from 50% to 0%, the error reduces to 1.5%, while the uncorrected error is 6%, with overall accuracy improved by 10–15%. Validation errors are controlled between 1 and 4%, with Rct and W contributing the most (Shapley values of 0.35 and 0.28), indicating that the model captures mechanical pre-torque-SOC synergy and improves SOC assessment reliability.
This study provides a theoretical foundation for optimizing battery impedance and precise SOC estimation under high mechanical pre-torque. Future work can be extended to multiple SOH points and dynamic pressure scenarios to further verify the model’s application potential in actual BMSs.

Author Contributions

Conceptualization, S.C.; Methodology, L.Q. and S.C.; Software, L.Q.; Validation, L.Q., L.X. and W.Z.; Formal analysis, L.Q. and L.X.; Investigation, L.Q., L.X., W.Z. and W.X.; Resources, L.Q., C.X. and S.C.; Data curation, L.Q. and W.Y.; Writing—original draft, L.Q.; Writing—review & editing, S.C.; Visualization, L.Q.; Supervision, C.X. and S.C.; Funding acquisition, L.Q. and S.C. All authors have read and agreed to the published version of the manuscript.

Funding

This work is financially supported by the National Natural Science Foundation of China (Grant No. 52506266, 52204001), the Postdoctoral Fellowship Program of CPSF (No. GZB20240538), and Shanghai Super Postdoctoral Incentive Program (No. 2024546), campaign for Key Research and Development in Hubei Province (Grant 2021BAA053), and the Jinan ‘20 New Universities’ Introduction Innovation Team Project (No. 2021GXRC075).

Data Availability Statement

The original contributions presented in this study are included in the article. Further inquiries can be directed to the corresponding authors.

Conflicts of Interest

The authors declare no conflict of interest.

References

  1. Zhang, J.; Long, T.; Sun, X.; He, L.; Yang, J.; Wang, J.; Wang, Z.; Huang, Y.; Zhang, L.; Zhang, Y. Mechanism investigation on microstructure degradation and thermal runaway propagation of batteries undergoing high-rate cycling process. J. Energy Chem. 2026, 113, 1013–1029. [Google Scholar] [CrossRef]
  2. Cheng, W.; Zhao, M.; Lai, Y.; Wang, X.; Liu, H.; Xiao, P.; Mo, G.; Liu, B.; Liu, Y. Recent advances in battery characterization using in situ XAFS, SAXS, XRD, and their combining techniques: From single scale to multiscale structure detection. Exploration 2024, 4, 20230056. [Google Scholar] [CrossRef]
  3. Hou, Y.; Chen, Z.; Zhang, R.; Cui, H.; Yang, Q.; Zhi, C. Recent advances and interfacial challenges in solid-state electrolytes for rechargeable Li-air batteries. Exploration 2023, 3, 20220051. [Google Scholar] [CrossRef] [PubMed]
  4. He, Y.; Wang, L.; Wang, A.; Zhang, B.; Pham, H.; Park, J.; He, X. Insight into uniform filming of LiF-rich interphase via synergistic adsorption for high-performance lithium metal anode. Exploration 2024, 4, 20230114. [Google Scholar] [CrossRef]
  5. He, C.; Xiao, L.; Zhang, J.; Wang, Z.; Wang, J.; Wang, L.; Zhang, L.; Wang, W.; Huang, Y.; Ouyang, D.; et al. Mechanistic insights and risk evaluation of thermal runaway in lithium-ion batteries under coupled temperature-rate conditions. Chem. Eng. J. 2026, 532, 174210. [Google Scholar] [CrossRef]
  6. Chen, S.; Wei, X.; Wu, H.; Chen, K.; Zhang, G.; Wang, X.; Zhu, J.; Feng, X.; Dai, H.; Ouyang, M.; et al. Multi-functional thermal barrier suppresses battery thermal runaway propagation and degradation. Renew. Sustain. Energy Rev. 2025, 223, 116056. [Google Scholar] [CrossRef]
  7. Chen, Y.; Li, Y.; Wang, J.; Lu, L.; Wang, H.; Li, M.; Xu, W.; Shi, C.; Li, C. Characterization of Breakdown Arcs Induced by Venting Particles Generated by Thermal Runaway of Large-Capacity Ternary Lithium-Ion Batteries. Electronics 2024, 13, 3168. [Google Scholar] [CrossRef]
  8. Yi, Y.; Xia, C.; Shi, L.; Meng, L.; Chi, Q.; Qian, L.; Ma, T.; Chen, S. Lithium-ion battery expansion mechanism and Gaussian process regression based state of charge estimation with expansion characteristics. Energy 2024, 292, 130541. [Google Scholar] [CrossRef]
  9. Fan, X.; Yang, X.; Hou, F. Integrated Mixed Attention U-Net Mechanisms with Multi-Stage Division Strategy Customized for Accurate Estimation of Lithium-Ion Battery State of Health. Electronics 2024, 13, 3244. [Google Scholar] [CrossRef]
  10. Sedina, M.; Šimek, A.; Báňa, J.; Kazda, T. A short review of the effect of external pressure on the batteries. Monatshefte Fur. Chem. 2024, 155, 221–226. [Google Scholar] [CrossRef]
  11. Zhang, Z.; Li, X.; Yang, H.; Fu, K.; Chen, Y.; Gong, L.; Tan, P. Extending the Cycling Life of Lithium-Ion Batteries with Silicon/Graphite Composite Anodes by Automatic External Stress Regulation. Energy Fuels 2024, 38, 8317–8325. [Google Scholar] [CrossRef]
  12. Li, R.; Li, W.; Singh, A.; Ren, D.; Hou, Z.; Ouyang, M. Effect of external pressure and internal stress on battery performance and lifespan. Energy Storage Mater. 2022, 52, 395–429. [Google Scholar] [CrossRef]
  13. Qian, L.; Zhang, W.; Fei, G.; Xia, C.; Yi, Y.; Ma, T.; Chen, S. All-Lifespan Dynamic Thermal Management: Thermal-Economic Efficient Immersion Cooling Addresses the Overheating Issue of Degraded Lithium-Ion Battery System Under Ultra-Fast Charging. J. Electrochem. Soc. 2026, 173, 030507. [Google Scholar] [CrossRef]
  14. Zhu, Z.; Zhang, L.; Wu, H.; Chen, S.; Wei, X.; Dai, H. Wavelet Packet Energy Proportion-Based Early Warning for the Failure of Lithium-Ion Batteries. IEEE Trans. Transp. Electrif. 2025, 11, 2219–2229. [Google Scholar] [CrossRef]
  15. Qian, L.; Xiao, W.; Fei, G.; Xia, C.; Yi, Y.; Ma, T.; Chen, S. Immersion cooling control for ununiform degraded lithium-ion batteries under fast charging. J. Energy Storage 2026, 153, 120820. [Google Scholar] [CrossRef]
  16. Li, J.; Luo, Z.; Wang, J.; Kumar, P.; Zhang, S.; Hao, X.; Zhu, X.; Meng, W.; Qiu, J.; Ming, H.; et al. Mechanistic Insights Into the Electrochemical and Thermal Safety Degradation of Lithium Titanate Batteries Under Constant Voltage Overcharge Conditions. Chain 2025, 2, 321–337. [Google Scholar] [CrossRef]
  17. Cai, X.; Zhang, C.; Chen, Z.; Zhang, L.; Sauer, D.; Li, W. Characterization and quantification of multi-field coupling in lithium-ion batteries under mechanical constraints. J. Energy Chem. 2024, 95, 364–379. [Google Scholar] [CrossRef]
  18. Chahbaz, A.; Luo, Y.; Stahl, G.; Ditler, H.; Jaumann, T.; Glinka, M.; Lingen, C.; Sauer, D.; Li, W. Pressure-Induced Capacity Recovery and Performance Enhancements in LTO/NMC-LCO Batteries. Adv. Funct. Mater. 2025, 35, 2419229. [Google Scholar] [CrossRef]
  19. Illig, J.; Schmidt, J.; Weiss, M.; Weber, A.; Ivers-Tiffée, E. Understanding the impedance spectrum of 18650 LiFePO4-cells. J. Power Sources 2013, 239, 670–679. [Google Scholar] [CrossRef]
  20. Müller, V.; Scurtu, R.; Memm, M.; Danzer, M.; Wohlfahrt-Mehrens, M. Study of the influence of mechanical pressure on the performance and aging of Lithium-ion battery cells. J. Power Sources 2019, 440, 227148. [Google Scholar] [CrossRef]
  21. Rojaee, R.; Shahbazian-Yassar, R. Two-Dimensional Materials to Address the Lithium Battery Challenges. ACS Nano 2020, 14, 2628–2658. [Google Scholar] [CrossRef]
  22. Wang, Z.; Xu, D.; Wu, C.; Zhan, Z.; Li, C.; Xu, P.; Chen, Z.; Sun, Y.; Akoto, J.; Alotaibi, N.; et al. Understanding and Mitigating Interfacial Constraints in Solid-State Electrolyte Systems. Chain 2025, 2, 272–292. [Google Scholar] [CrossRef]
  23. Schomburg, F.; Heidrich, B.; Wennemar, S.; Drees, R.; Roth, T.; Kurrat, M.; Heimes, H.; Jossen, A.; Winter, M.; Cheong, J.Y.; et al. Lithium-ion battery cell formation: Status and future directions towards a knowledge-based process design. Energy Environ. Sci. 2024, 17, 2686–2733. [Google Scholar] [CrossRef]
  24. Laufen, H.; Berg, S.; Engeser, J.; Strautmann, M.; Koprivc, A.; Rahe, C.; Figgemeier, E.; Sauer, D. Correlation between Voltage, Strain, and Impedance as a Function of Pressure of a Nickel-Rich NMC Lithium-Ion Pouch Cell. Adv. Mater. Technol. 2024, 9, 2301965. [Google Scholar] [CrossRef]
  25. Shen, R.; Niu, S.; Zhu, G.; Wu, K.; Zheng, H. Mechanical behavior analysis of high power commercial lithium-ion batteries. Chin. J. Chem. Eng. 2023, 58, 315–322. [Google Scholar] [CrossRef]
  26. Sun, S.; Rui, B.; Tan, X.; Bahuguna, S.; Zhou, J.; Xu, J. Effects of electrolyte, state of charge, and strain rate on the mechanical properties of lithium-ion battery electrodes and separators. J. Mater. Chem. A 2025, 13, 20673–20687. [Google Scholar] [CrossRef]
  27. Landesfeind, J.; Hattendorff, J.; Ehrl, A.; Wall, W.; Gasteiger, H. Tortuosity Determination of Battery Electrodes and Separators by Impedance Spectroscopy. J. Electrochem. Soc. 2016, 163, A1373–A1387. [Google Scholar] [CrossRef]
  28. Wang, J.; Liao, L.; Li, Y.; Zhao, J.; Shi, F.; Yan, K.; Pei, A.; Chen, G.; Li, G.; Lu, Z.; et al. Shell-Protective Secondary Silicon Nanostructures as Pressure-Resistant High-Volumetric-Capacity Anodes for Lithium-Ion Batteries. Nano Lett. 2018, 18, 7060–7065. [Google Scholar] [CrossRef] [PubMed]
  29. Zhang, J.; Kang, B.; Luo, Q.; Zou, S. Effects of Pressure Evolution on the Decrease in the Capacity of Lithium-Ion Batteries. Int. J. Electrochem. Sci. 2020, 15, 8422–8436. [Google Scholar] [CrossRef]
  30. Huang, W.X.; Ye, Y.; Chen, H.; Vilá, R.; Xiang, A.; Wang, H.; Liu, F.; Yu, Z.; Xu, J.; Zhang, Z.; et al. Onboard early detection and mitigation of lithium plating in fast-charging batteries. Nat. Commun. 2022, 13, 7091. [Google Scholar] [CrossRef]
  31. Chen, S.; Zhao, L.; Chen, K.; Wu, H.; Yuan, H.; Tang, W.; Huang, R.; Wei, X.; Dai, H. Mitigating “Remaining fire”-“Re-burn”: Multi-dimensional dynamic thermal runaway evolution mechanism and suppression for commercial lithium-ion batteries from gas perspective. Energy Storage Mater. 2025, 81, 104520. [Google Scholar]
  32. Yi, Y.; Xia, C.; Feng, C.; Zhang, W.; Fu, C.; Qian, L.; Chen, S. Digital twin-long short-term memory (LSTM) neural network based real-time temperature prediction and degradation model analysis for lithium-ion battery. J. Energy Storage 2023, 64, 107203. [Google Scholar] [CrossRef]
  33. Du, X.; Hu, Y.; Choe, S.; Garrick, T.; Fernandez, M. Characterization and analysis of the effect of pressure on the performance of a large format NMC/C lithium-ion battery. J. Power Sources 2023, 573, 233117. [Google Scholar] [CrossRef]
  34. Leonard, A.; Planden, B.; Lukow, K.; Morrey, D. Investigation of constant stack pressure on lithium-ion battery performance. J. Energy Storage 2023, 72, 108422. [Google Scholar] [CrossRef]
  35. Li, Q.; Yi, D.; Dang, G.; Zhao, H.; Lu, T.; Wang, Q.; Lai, C.; Xie, J. Electrochemical Impedance Spectrum (EIS) Variation of Lithium-Ion Batteries Due to Resting Times in the Charging Processes. World Electr. Veh. J. 2023, 14, 321. [Google Scholar] [CrossRef]
  36. Zhang, Y.; Tang, Q.; Zhang, Y.; Wang, J.; Stimming, U.; Lee, A. Identifying degradation patterns of lithium ion batteries from impedance spectroscopy using machine learning. Nat. Commun. 2020, 11, 1706. [Google Scholar] [CrossRef]
  37. Kurzweil, P.; Scheuerpflug, W. State-of-Charge Monitoring and Battery Diagnosis of Different Lithium Ion Chemistries Using Impedance Spectroscopy. Batteries 2021, 7, 17. [Google Scholar]
  38. Friedrich, S.; Stojecevic, S.; Rapp, P.; Helmer, S.; Bock, M.; Durdel, A.; Gasteiger, H.; Jossen, A. Effect of Mechanical Pressure on Lifetime, Expansion, and Porosity of Silicon-Dominant Anodes in Laboratory Lithium-Ion Cells. J. Electrochem. Soc. 2024, 171, 050540. [Google Scholar] [CrossRef]
  39. Cortada-Torbellino, M.; Elvira, D.; Aroudi, A.; Valderrama-Blavi, H. Review of Lithium-Ion Battery Internal Changes Due to Mechanical Loading. Batteries 2024, 10, 258. [Google Scholar] [CrossRef]
  40. Stallard, J.C.; Wheatcroft, L.; Booth, S.; Boston, R.; Corr, S.; Volder, M.; Inkson, D.; Fleck, N. Mechanical properties of cathode materials for lithium-ion batteries. Joule 2022, 6, 984–1007. [Google Scholar] [CrossRef]
Figure 1. Schematic diagram of battery fixture.
Electronics 15 02123 g001
Figure 2. Schematic diagram of the accelerated degradation test procedure.
Electronics 15 02123 g002
Figure 3. EIS curves of different mechanical pre-torques at the same SOC, (ae) 0%, 25%, 50%, 75%, and 100% SOC.
Electronics 15 02123 g003
Figure 4. EIS curves at different SOCs (ad). Mechanical torque at 0 N·m, 0.5 N·m, 1 N·m, and 1.5 N·m.
Electronics 15 02123 g004
Figure 5. Schematic diagram of the equivalent circuit model.
Electronics 15 02123 g005
Figure 6. Schematic diagram of EIS fitting under different mechanical pre-torques and SOCs.
Electronics 15 02123 g006
Figure 7. Impedance variation with different mechanical pre-torques at the same SOC. (a) Ohmic impedance curve; (b) SEI film impedance curve; (c) charge transfer impedance curve; (d) Weber impedance coefficient curve.
Electronics 15 02123 g007
Figure 8. Impedance variation with different SOCs at the same mechanical pre-torque. (a) Ohmic impedance curve; (b) SEI film impedance curve; (c) charge transfer impedance curve; (d) Weber impedance coefficient curve.
Electronics 15 02123 g008
Figure 9. Schematic diagram of the GPR-based adaptive SOC estimation procedure.
Electronics 15 02123 g009
Figure 10. Training accuracy of three models.
Electronics 15 02123 g010
Table 1. Detailed information on the battery sample.
ItemsInformation
AnodeGraphite
CathodeLiNi0.6Mn0.2Co0.2O2
Nominal voltage (V)3.7
Max Voltage (V)4.25
Cut-off Voltage (V)2.75
Nominal capacity (Ah)10
Mass (kg)0.34
Dimensions (mm3)246 × 112 × 6.7
Operational temperature (°C)−20–50
Table 2. GPR prediction results.
Preload
Force
(N·m)
R0RSEIRCTWTrue Value
of SOC
Predicted Value
of SOC
Error (%)
106.42 × 10−44.65 × 10−44.72 × 10−43.98 × 1030.170.1752.94
206.58 × 10−44.79 × 10−44.86 × 10−44.05 × 1030.340.3322.35
306.25 × 10−44.50 × 10−44.58 × 10−43.89 × 1030.670.6821.79
406.37 × 10−44.68 × 10−44.75 × 10−43.94 × 1030.820.8513.78
506.50 × 10−44.62 × 10−44.70 × 10−43.91 × 1030.430.4153.49
60.56.45 × 10−42.82 × 10−42.57 × 10−44.92 × 1030.210.2162.86
70.56.60 × 10−42.90 × 10−42.65 × 10−45.08 × 1030.560.5491.96
80.56.28 × 10−42.75 × 10−42.52 × 10−44.85 × 1030.730.7083.01
90.56.38 × 10−42.85 × 10−42.60 × 10−44.95 × 1030.090.0911.11
100.56.55 × 10−42.92 × 10−42.67 × 10−45.12 × 1030.910.8892.31
1116.40 × 10−44.02 × 10−44.10 × 10−47.05 × 1030.330.3413.03
1216.55 × 10−44.15 × 10−44.23 × 10−47.22 × 1030.610.6323.28
1316.22 × 10−43.95 × 10−44.03 × 10−46.92 × 1030.880.8473.75
1416.35 × 10−44.08 × 10−44.16 × 10−47.13 × 1030.140.1464.29
1516.48 × 10−44.12 × 10−44.20 × 10−47.18 × 1030.470.4514.04
161.56.48 × 10−44.93 × 10−44.91 × 10−44.48 × 1040.290.3013.45
171.56.62 × 10−45.05 × 10−45.03 × 10−44.58 × 1040.770.7482.86
181.56.30 × 10−44.82 × 10−44.80 × 10−44.36 × 1040.530.5143.02
191.56.42 × 10−44.90 × 10−44.88 × 10−44.45 × 1040.050.0491.40
201.56.57 × 10−45.02 × 10−45.00 × 10−44.55 × 1040.940.9024.04
Disclaimer/Publisher’s Note: The statements, opinions and data contained in all publications are solely those of the individual author(s) and contributor(s) and not of MDPI and/or the editor(s). MDPI and/or the editor(s) disclaim responsibility for any injury to people or property resulting from any ideas, methods, instructions or products referred to in the content.