Article

Graph Sampling Contrastive Self-Supervised Graph Neural Network for Network Traffic Anomaly Detection

1
School of Computer Science and Software Engineering, Southwest Petroleum University, Chengdu 610500, China
2
School of Electronic Information and Artificial Intelligence, Leshan Normal University, Leshan 614000, China
3
Intelligent Network Security Detection and Evaluation Laboratory, Leshan Normal University, Leshan 614000, China
*
Author to whom correspondence should be addressed.
Electronics 2026, 15(10), 2119; https://doi.org/10.3390/electronics15102119
Submission received: 17 April 2026 / Revised: 7 May 2026 / Accepted: 11 May 2026 / Published: 15 May 2026
(This article belongs to the Special Issue AI in Cybersecurity, 3rd Edition)

Abstract

With the increasing scale and complexity of network traffic, anomaly detection faces significant challenges, particularly under the scarcity of labeled data in real-world environments. Although graph neural networks (GNNs) effectively model relational structures, most existing approaches rely on supervised learning, limiting their applicability in weakly labeled or unlabeled scenarios. To address these limitations, this paper proposes a self-supervised graph neural network framework, termed EGSCA, for network traffic anomaly detection. The framework employs a GNN to jointly model node and edge information, enabling the learning of discriminative representations. On this basis, a graph contrastive learning strategy is designed, where diverse subgraphs are generated via breadth-first search (BFS) to effectively capture local structural patterns. Meanwhile, a hybrid contrastive loss based on Wasserstein distance and Gromov–Wasserstein distance is introduced to achieve collaborative optimization between feature-space alignment and structural consistency under unlabeled conditions. Experimental results on multiple benchmark datasets demonstrate that the proposed method achieves competitive performance. Notably, it achieves the best results on datasets NF-BoT-IoT and NF-BoT-IoT-v2, with average improvements of approximately 3.2% in F1-score and 1.7% in DR over the strongest baseline. Further analysis indicates that the model yields more pronounced performance gains in scenarios with high class separability.

1. Introduction

With the rapid growth in the scale and complexity of network traffic, cybersecurity threats have become increasingly sophisticated, posing significant challenges to anomaly detection systems. Network intrusion detection, as a core component of proactive defense, aims to accurately identify malicious behaviors from massive traffic data. However, traditional rule-based methods struggle to cope with evolving and unknown attack patterns due to their reliance on predefined signatures and expert knowledge. Recent deep learning approaches improve detection performance by learning complex patterns, but they still suffer from high computational cost, limited interpretability, and strong dependence on labeled data, restricting real-world deployment.
In recent years, the field of anomaly detection has achieved significant progress through diverse technical approaches, improving both detection performance and robustness from multiple perspectives. For instance, to address the security issues of deep learning models in complex environments, an adversarial attack detection method based on Bidirectional Consistency Discrimination (BCD) has been proposed [1]. This method employs a BiLSTM-KAN model to perform forward prediction and backward reconstruction on time-series samples, and detects anomalies by computing the norm of the consistency residual matrix, thereby effectively enhancing the model’s ability to identify adversarial perturbations. In addition, another line of work combines density-based clustering (DBSCAN) with the Isolation Forest mechanism and utilizes the Raccoon Optimization Algorithm for automatic hyperparameter tuning, resulting in a hybrid density-driven anomaly detection framework (HDBIF-CO) [2]. This framework aims to overcome the limitations of traditional methods in early attack detection, such as low efficiency, difficulty in handling uneven density distributions, and challenges in parameter tuning, achieving higher sensitivity and stability under complex data distributions. These methods expand the boundaries of anomaly detection research from the perspectives of adversarial robustness and distribution modeling, indicating a clear trend toward multi-mechanism integration and robust modeling. However, they still exhibit certain limitations in modeling structural dependencies and unsupervised representation learning. In particular, their performance can be further improved in scenarios involving complex network interaction modeling.
Graph neural networks (GNNs) have recently attracted extensive attention in network intrusion detection due to their capability to model relational dependencies among network entities. By representing network traffic as graph-structured data, communication relationships can be explicitly encoded, enabling models to capture both local interactions and global structural patterns. This enables joint modeling of attribute features (e.g., statistical properties of flows) and structural features (e.g., connectivity patterns), improving detection accuracy. Despite these advantages, most existing GNN-based methods rely heavily on supervised or semi-supervised learning paradigms, where large volumes of labeled data are required for effective training. In real-world scenarios, obtaining high-quality labeled data is costly and often infeasible due to the continuous generation of large-scale and high-dimensional network traffic data. Consequently, this reliance on labeled data significantly limits the scalability and adaptability of existing approaches, particularly when dealing with unknown, zero-day, or evolving attack types. Moreover, existing GNN-based methods exhibit three key limitations: (1) insufficient modeling of edge information and higher-order structural dependencies; (2) weak alignment between feature space and structural information; and (3) degraded representation quality in fully unlabeled settings.
In summary, current approaches suffer from a combination of limitations: strong dependence on labeled data, inadequate joint modeling of feature and structural information, and limited robustness under complex and imbalanced network scenarios. These gaps hinder their effectiveness in real-world intrusion detection, particularly under fully unlabeled and dynamically evolving environments.
Problem Formulation: given a network traffic dataset represented as a graph G = ( V , E ) , where nodes V denote traffic entities and edges E represent interactions, the objective is to learn a mapping function f ( · ) that produces discriminative node representations without relying on labeled data. The learned embeddings should preserve both feature attributes and structural dependencies, enabling accurate identification of anomalous patterns under imbalanced and complex multi-class scenarios.
To alleviate these issues, self-supervised learning has emerged as a promising direction, enabling models to learn informative representations by leveraging intrinsic data properties without explicit annotations. In the context of graph data, self-supervised strategies—particularly contrastive learning—have shown strong potential by constructing positive and negative samples through graph augmentations. However, existing graph self-supervised methods still face several challenges, including the design of effective augmentation strategies, the preservation of structural semantics, and the alignment between feature space and topology.
Based on the above observations, integrating self-supervised learning with graph neural networks has emerged as a promising research direction, enabling models to learn meaningful representations directly from data without explicit annotations. In this paper, we focus on network traffic anomaly detection under fully unlabeled conditions using self-supervised GNNs, and propose a unified framework. The proposed framework effectively integrates feature and structural information to learn high-quality graph representations, while maintaining high efficiency and robustness in complex network environments. Table 1 summarizes the key advantages of the proposed EGSCA framework over existing methods. First, it operates in a fully label-free manner and is naturally compatible with edge-centric traffic data representations, making it more suitable for real-world network environments where annotations are scarce. Second, by integrating self-supervised learning with graph neural networks, EGSCA effectively addresses the limitation of insufficient joint modeling of feature and structural information in conventional self-supervised settings. Finally, the proposed method demonstrates strong robustness on extremely imbalanced datasets in binary classification tasks, while also showing clear advantages in modeling complex attack patterns in multi-class scenarios.
The main contributions of this study are summarized as follows:
  • A self-supervised GNN framework (EGSCA) for network traffic anomaly detection is proposed, which integrates a novel encoder (EGSC) to alleviate reliance on labeled data and improve applicability in large-scale and dynamic environments;
  • A novel self-supervised GNN encoder, termed EGSC, is proposed. By integrating self-supervised learning strategies with graph neural networks, the encoder effectively addresses the limitation of insufficient joint modeling of feature and structural information under self-supervised settings;
  • A generative graph contrastive learning strategy is designed, where diverse subgraph samples are constructed via a breadth-first search (BFS) mechanism, enabling effective capture of local structural patterns in network traffic graphs;
  • A hybrid contrastive loss is introduced by integrating Wasserstein distance and Gromov–Wasserstein distance, which jointly enforces feature distribution alignment and topological structure consistency, thereby enhancing representation quality under unlabeled conditions;
  • An improved GNN architecture with joint modeling of node and edge features is developed, along with an attribute-based auxiliary self-supervised task, to strengthen representation discriminability, robustness, and generalization capability.
The remainder of this paper is organized as follows. Section 2 reviews the related work. Section 3 presents the proposed anomaly detection method in detail, including data preprocessing and model construction procedures. Section 4 reports the experimental results and evaluates the performance of the model. Finally, Section 5 concludes this paper and discusses future research directions.

2. Related Work

The proposed EGSCA framework focuses on network traffic anomaly detection under unsupervised settings based on self-supervised graph representation learning. To clarify the positioning and novelty of this work within existing research, related studies are systematically reviewed from two closely related perspectives. First, graph neural network-based intrusion detection methods are examined, with particular emphasis on their evolution and limitations in terms of graph construction strategies, edge feature modeling, and label dependency. Second, the application of self-supervised learning in intrusion detection is analyzed, especially focusing on different paradigms such as graph contrastive learning and masked autoencoding, along with their technical routes, key challenges, and limitations in modeling feature distribution alignment and structural similarity. Through this twofold review, the strong dependence of existing methods on labeled data and their limited adaptability in unlabeled scenarios are revealed, while the insufficiency of current self-supervised approaches in jointly modeling feature distributions and topological structures is highlighted, thereby naturally motivating the design of the EGSCA framework.

2.1. GNN-Based Network Intrusion Detection

Traditional network intrusion detection methods primarily rely on rule-based feature matching or conventional machine learning algorithms, such as random forests, support vector machines, and decision trees. These approaches typically treat each network flow or session as an independent sample, thereby overlooking the inherent structural dependencies among network entities. However, modern cyber attacks—such as distributed denial-of-service (DDoS), lateral movement, botnets, and command-and-control communications—often manifest as coordinated behaviors across multiple entities, naturally exhibiting graph-structured characteristics in their propagation patterns and attack paths. In recent years, graph neural networks have been widely applied to network intrusion detection due to their capability to capture structural dependencies among network entities. By modeling network flows as graphs, nodes typically represent hosts or flows, while edges describe communication relationships. This formulation enables GNNs to aggregate both local and global contextual information, significantly improving detection performance.
Zhong et al. [3] conducted a comprehensive survey of GNN-based intrusion detection systems, reviewing over 100 studies from the perspectives of graph construction, model architecture, learning paradigms, and deployment scenarios. Their analysis highlighted key challenges, including dynamic graph updates, large-scale graph sampling, and dependence on labeled data. Similarly, Alshehri et al. [4] evaluated 28 GNN-based malicious traffic detection approaches (2020–2025) across diverse environments, including IoT, enterprise networks, software-defined networks, and vehicular networks, demonstrating that GNNs significantly outperform traditional feature-based methods in capturing multi-step attacks and lateral movement behaviors.
From the perspective of graph construction, existing approaches can be broadly categorized into flow-level graphs and host-level communication graphs. In flow-level methods, each network flow (e.g., a five-tuple consisting of source IP, source port, destination IP, destination port, and protocol) is modeled as a node, with features including duration, packet counts, byte volumes, and flags. Edges are established based on temporal proximity or shared attributes.
In terms of flow-level graph construction, the GNN-IDS framework proposed by Sun et al. [5] leverages graph convolutional networks to perform neighborhood aggregation, and superior performance has been achieved compared with GCN and GAT on the CIC-IDS2017 dataset. However, GCN follows a transductive learning paradigm, in which the complete graph structure is required to be known prior to training, thereby limiting its applicability in dynamic networks with unseen nodes. Building upon this, Li et al. [6] further introduced an edge-enhanced EE-GraphSAGE model, in which node features are initialized via aggregation of neighboring edge attributes, and both node and edge features are jointly incorporated during message passing. Residual connections are introduced to preserve original edge attributes and mitigate over-smoothing. As a result, F1-scores of 99.41%, 98.66%, and 99.78% have been reported on CICIoT2023, Edge-IIoT, and BoT-IoT datasets, respectively. Similarly, Tran et al. [7] proposed FN-GNN, in which a hybrid graph model combining GCN and SAGEConv is designed. In this approach, graph nodes are initialized using flow feature data, while edges are constructed based on IP relationships, and its effectiveness has been validated on the CICIDS-2017 and UNSW-NB15 datasets. Furthermore, Lin et al. [8] proposed the E-GRACL method, where residual connections and global context modeling are incorporated into GraphSAGE [9], leading to further improvements in IoT intrusion detection performance. Sagar et al. [10] addressed the limitations of traditional centralized anomaly detection methods in scalability and privacy preservation by proposing a federated adversarial learning framework, GNN-FedGAN. Specifically, a GNN-based discriminator is introduced to model the structural characteristics of IoT attack graphs, thereby enhancing the detection capability for complex attack patterns. As network traffic becomes increasingly complex, it is generally observed that single-modality feature extraction is insufficient to fully capture the complete patterns of attack behaviors. To overcome this limitation, Farrukh et al. [11] proposed the XG-NID framework, in which flow-level and packet-level data are integrated into a heterogeneous graph for the first time. A heterogeneous graph neural network is employed to perform graph-level classification, enabling real-time inference and achieving an F1-score of 97% in multi-class classification tasks. In addition, Ma et al. [12] proposed XMF-GNN, where a cross-modal attention fusion mechanism is adopted to construct a dual-modality heterogeneous graph representation based on flow and packet data. The importance weights across modalities are dynamically learned, resulting in F1-scores of 0.977 and 0.985 on multi-class classification tasks over the CIC-IDS2017 and CIC-IoT2023 datasets, respectively.
Alternatively, host-level communication graphs model IP addresses or devices as nodes, with edges representing communication events. This formulation naturally captures communication patterns and community structures. For instance, Li et al. [13] proposed a malicious host detection system based on a relation-enhanced graph convolutional network (RE-GCN). In this system, host communication graphs are constructed through temporal slicing, and sample imbalance is alleviated via random undersampling. A relation-edge graph convolutional network is further designed, in which features are directly aggregated and learned on edges. By leveraging edge information for node classification, the limitations of traditional GNNs in handling edge attributes are effectively mitigated, thereby improving classification precision. In the context of host intrusion detection based on system provenance graphs, Furthermore, Luša et al. [14] proposed TE-G-SAGE, in which the SHAP-based explainability method is integrated with a temporal-aware and edge-aware GNN. Built upon the GraphSAGE [9] architecture, an interpretable inductive intrusion detection model is developed. By transforming flow data from the NF-UNSW-NB15-v3 dataset into temporal communication graphs, superior recall performance has been achieved in temporal evaluation settings.
Notably, many early GNN-based methods focus primarily on node features while neglecting the rich semantic information contained in edges. In network traffic, edges correspond to communication behaviors and encode critical attributes such as protocol types, port numbers, TCP flags, packet counts, and byte volumes. To address this limitation, Lo et al. [15] proposed E-GraphSAGE, which integrates both node and edge features through an edge-aware aggregation mechanism, significantly improving detection accuracy for DDoS and scanning attacks in IoT datasets.
Despite these advances, most GNN-based methods rely heavily on supervised learning and require large-scale labeled datasets. Their performance heavily depends on the availability and quality of labeled data. In real-world scenarios, such assumptions are often unrealistic, limiting their scalability and adaptability. In real-world scenarios, labeling massive volumes of traffic is prohibitively expensive and often infeasible, particularly for emerging or unknown attack types. Moreover, the dynamic nature of network environments renders labeled data quickly outdated. This strong reliance on labeled data significantly limits the generalization and practical deployment of supervised GNN models, motivating a shift toward self-supervised and unsupervised approaches.

2.2. Self-Supervised Learning on Graphs

To reduce reliance on labeled data, self-supervised learning has been increasingly explored in graph representation learning. Typical approaches include contrastive learning, where models are trained to distinguish between positive and negative samples generated through graph augmentations. Methods such as Deep Graph Infomax and Graph Contrastive Learning have demonstrated strong capability in learning informative node and graph representations.
Self-supervised learning aims to exploit intrinsic supervisory signals from unlabeled data through the design of auxiliary tasks, and has achieved remarkable success in computer vision and natural language processing. In graph representation learning, graph contrastive learning has emerged as a dominant paradigm, where different augmented views of the same graph are constructed, and representations are learned by maximizing agreement between positive pairs while minimizing agreement between negative pairs. Representative methods include GraphCL [16], GCA [17], and GRACE [18]. GraphCL systematically investigates four graph augmentation strategies, while GCA introduces adaptive augmentation based on structural importance, and GRACE designs node-level contrastive objectives that achieve competitive performance with supervised methods.
In the context of network intrusion detection, several self-supervised GNN frameworks have been proposed. Guerra et al. [19] introduced GraphIDS, which encodes each network flow and its local topology into a graph and employs a Transformer-based masked autoencoder to reconstruct node embeddings, using reconstruction error as an anomaly score. This method achieves up to 99.98% PR-AUC and 99.61% macro F1-score on multiple NetFlow benchmarks without requiring labeled data. Caville et al. [20] proposed Anomal-E, a self-supervised network intrusion detection system based on graph neural networks. Unlike existing methods that rely on node features, Anomal-E aggregates edge features through an improved E-GraphSAGE [15] to generate edge embeddings and introduces DGI [21] (Deep Graph Infomax) to maximize local and global mutual information, thereby effectively addressing the issue of insufficient utilization of edge information in traditional methods. By learning graph embeddings of network flows in a self-supervised manner, the method can better adapt to unknown attack types and significantly reduce the dependence on large-scale labeled data. For IoT environments, SSTD [22] adopts a cosine-similarity-based contrastive learning strategy, significantly improving detection rates for unknown attacks. However, from the perspective of loss design, most existing methods rely on InfoNCE-based objectives, which focus on cosine similarity in feature space but fail to capture global distribution differences and structural alignment. Similarly, Anomal-EFD [23] is a self-supervised dynamic anomaly detection model designed for IoT networks, which leverages a random sliding window and gradient aggregation mechanism to capture both short-term and long-term temporal dynamics. Furthermore, it incorporates a multi-head attention-based neighbor aggregation and a contrastive self-supervised objective to achieve robust node-level anomaly detection under dynamic network structures. In cloud–edge collaborative settings, SSGMHAN [24] employs structure-aware graph contrastive learning to construct positive and negative pairs, learns from large-scale unlabeled traffic, and generates representations that are robust to structural perturbations. It also integrates structure-aware contrastive learning with a multi-head node–edge attention mechanism to dynamically emphasize attack-relevant nodes and edges, producing more expressive embeddings. Xu et al. [25] designed a graph attention mechanism-based encoder for the multi-classification problem of network traffic. They construct positive sample pairs by subgraph sampling on the original nodes and generating interpolated graphs, and introduce a structured contrastive loss function that considers edge features and local topology. In the multi-classification task on NF-CSE-CIC-IDS2018-v2, their method achieves a weighted average F1-score exceeding 0.97.
Nevertheless, a critical challenge in graph contrastive learning lies in designing effective and semantically consistent augmentation strategies. Common operations such as edge removal or feature masking may distort important attack patterns in network traffic. To mitigate this, augmentation-free methods such as HEC-GAD [26] have been proposed. This method avoids graph augmentation to prevent anomaly distortion, samples multi-view subgraphs from higher-order neighbors, and combines intra-view node-subgraph and inter-view subgraph-subgraph contrastive learning with reconstruction error for effective anomaly detection. TCL-GAD [27] introduces global information via a hierarchical Transformer and a multi-level contrastive learning framework, achieving superior detection performance and efficiency across diverse datasets.
In addition to contrastive learning, generative self-supervised methods, such as masked graph autoencoders (e.g., GraphMAE [28]), have also been explored. These methods reconstruct masked node or edge features to learn representations, although they often require careful tuning and may exhibit lower sensitivity to anomalies compared to contrastive approaches.
In summary, although existing self-supervised methods have demonstrated considerable potential, several key challenges remain, including how to jointly model feature distributions and topological structures, design semantically consistent contrastive objectives, and develop effective subgraph sampling strategies tailored to network traffic. Furthermore, most existing graph self-supervised approaches primarily focus on feature-level consistency, while failing to adequately capture structural similarities across graphs or subgraphs. Based on this, current research suffers from two main limitations: (1) graph neural network-based methods exhibit a strong dependence on labeled data; and (2) in self-supervised settings, the joint modeling of feature and structural information remains insufficient. To address these issues, this paper proposes the EGSCA framework, which integrates generative graph contrastive learning with hybrid structure–feature alignment into a unified framework, thereby enabling robust anomaly detection under unlabeled conditions.


3. The Proposed Model: EGSCA

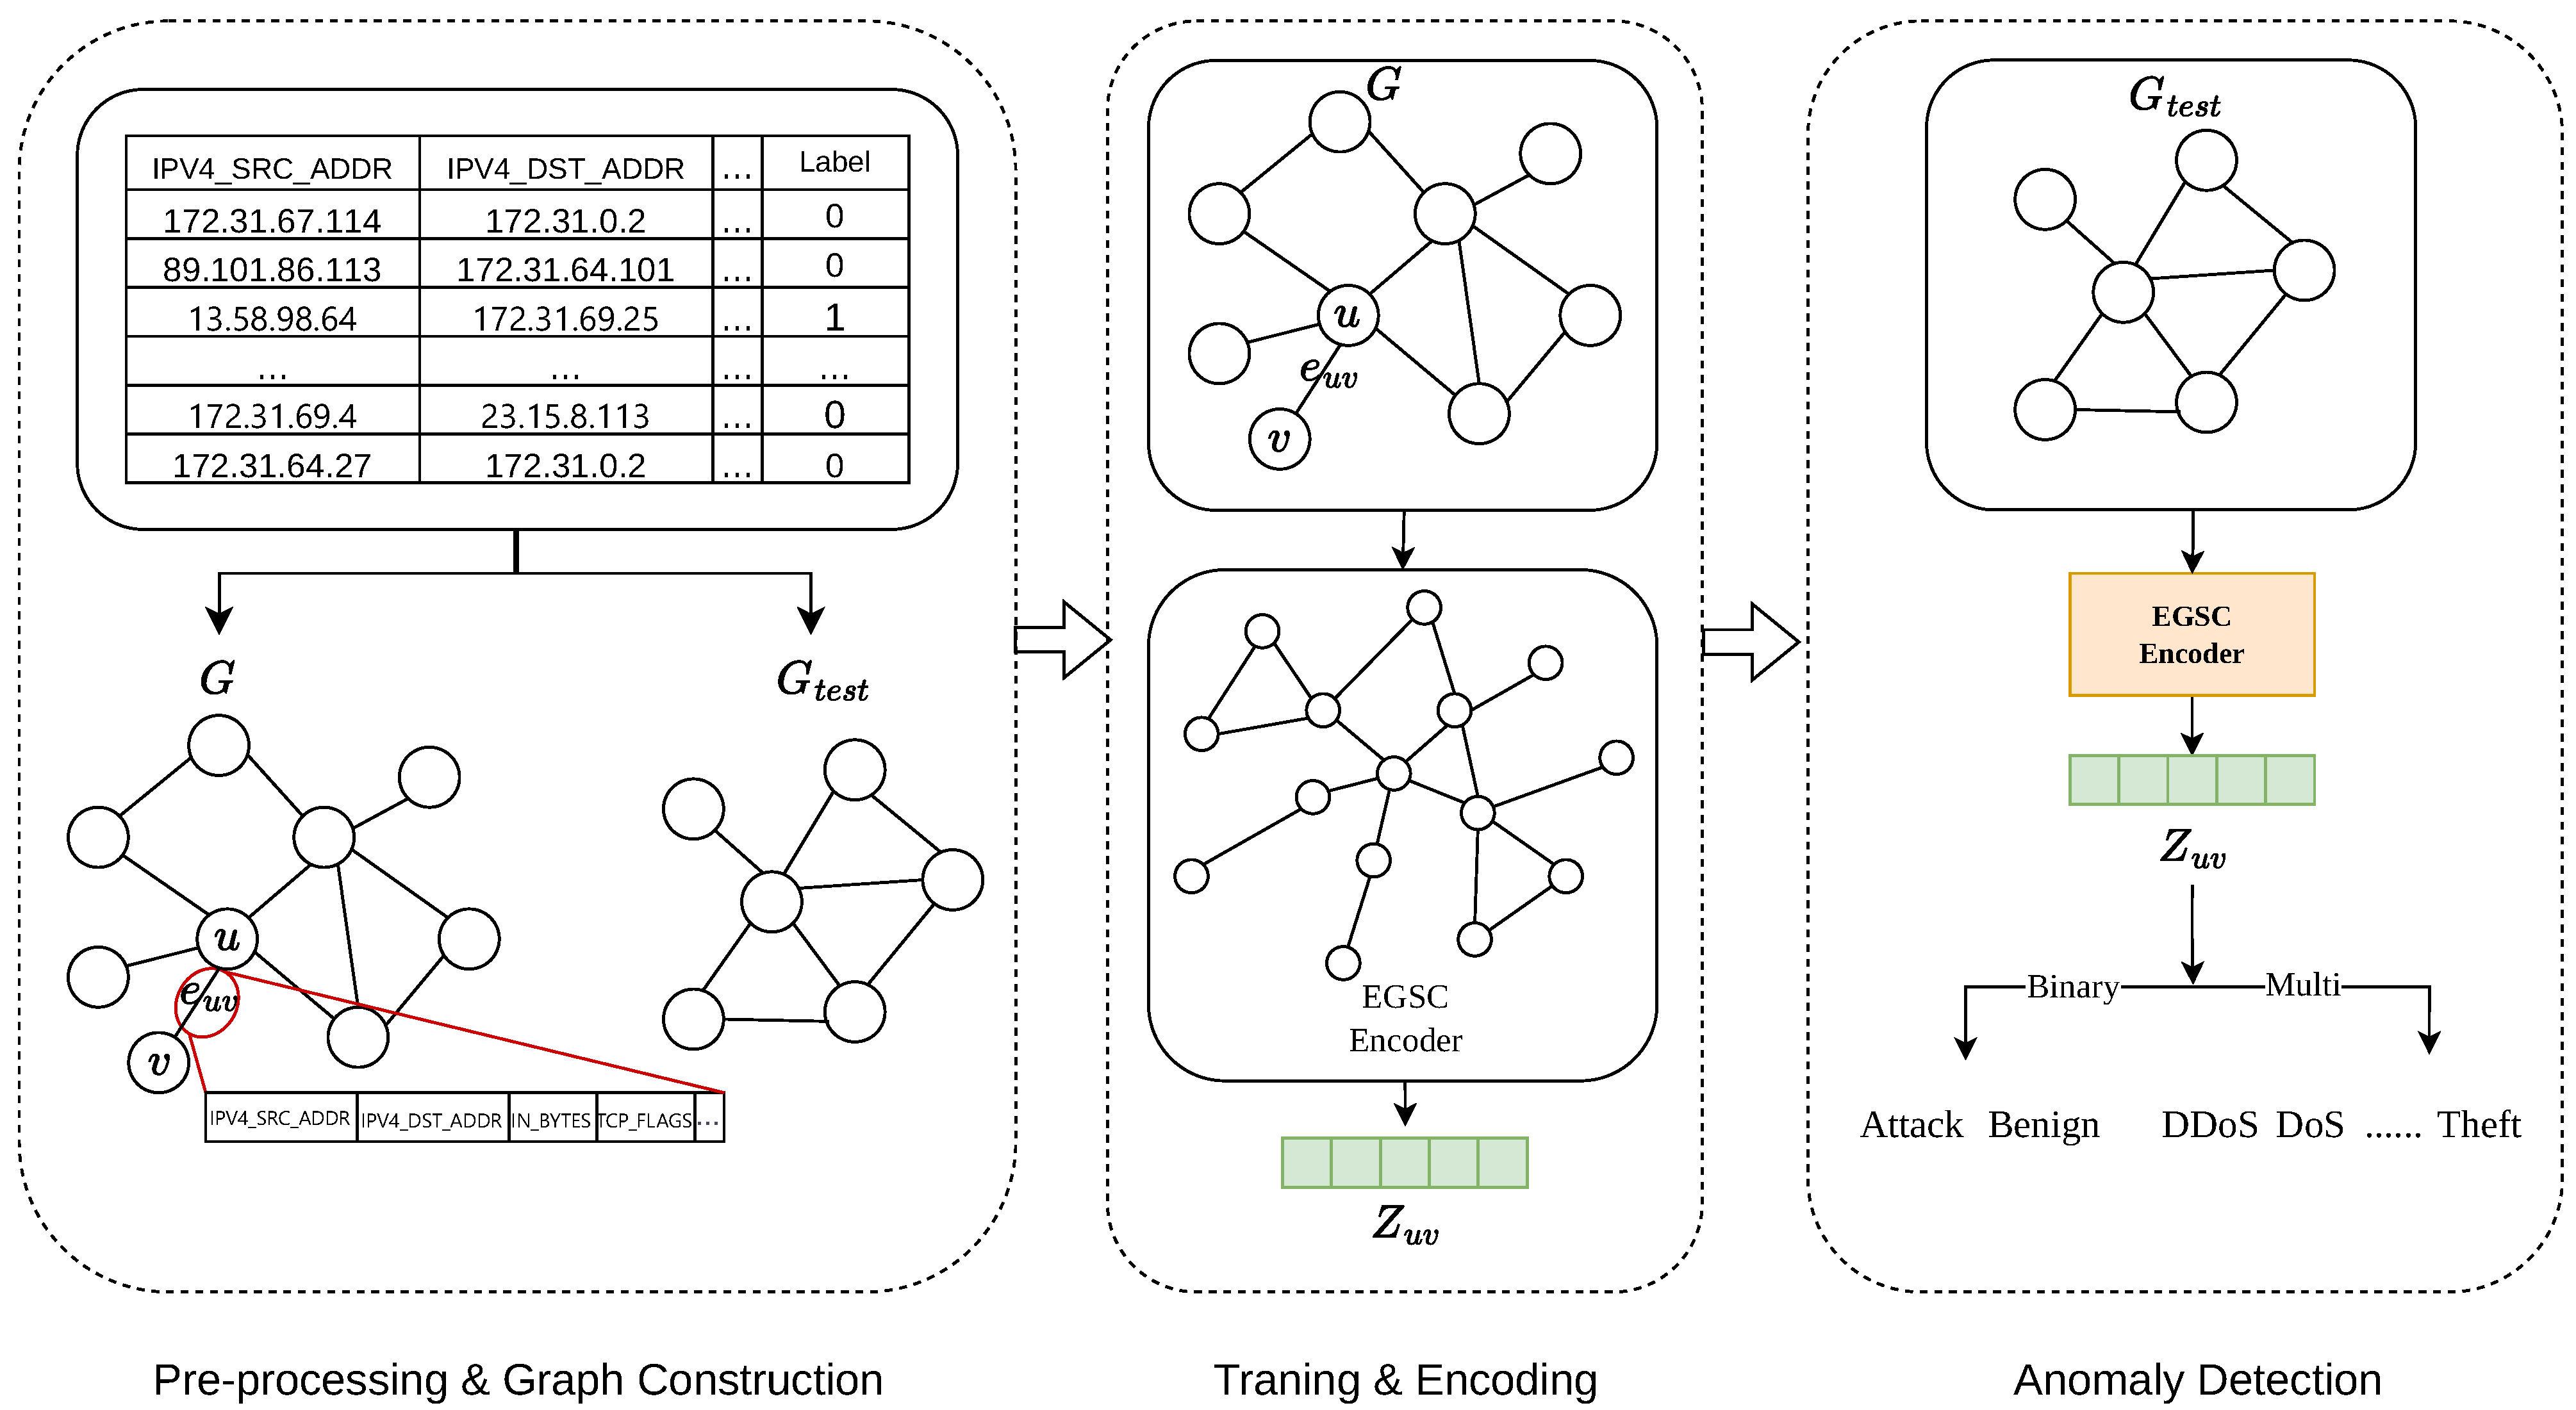
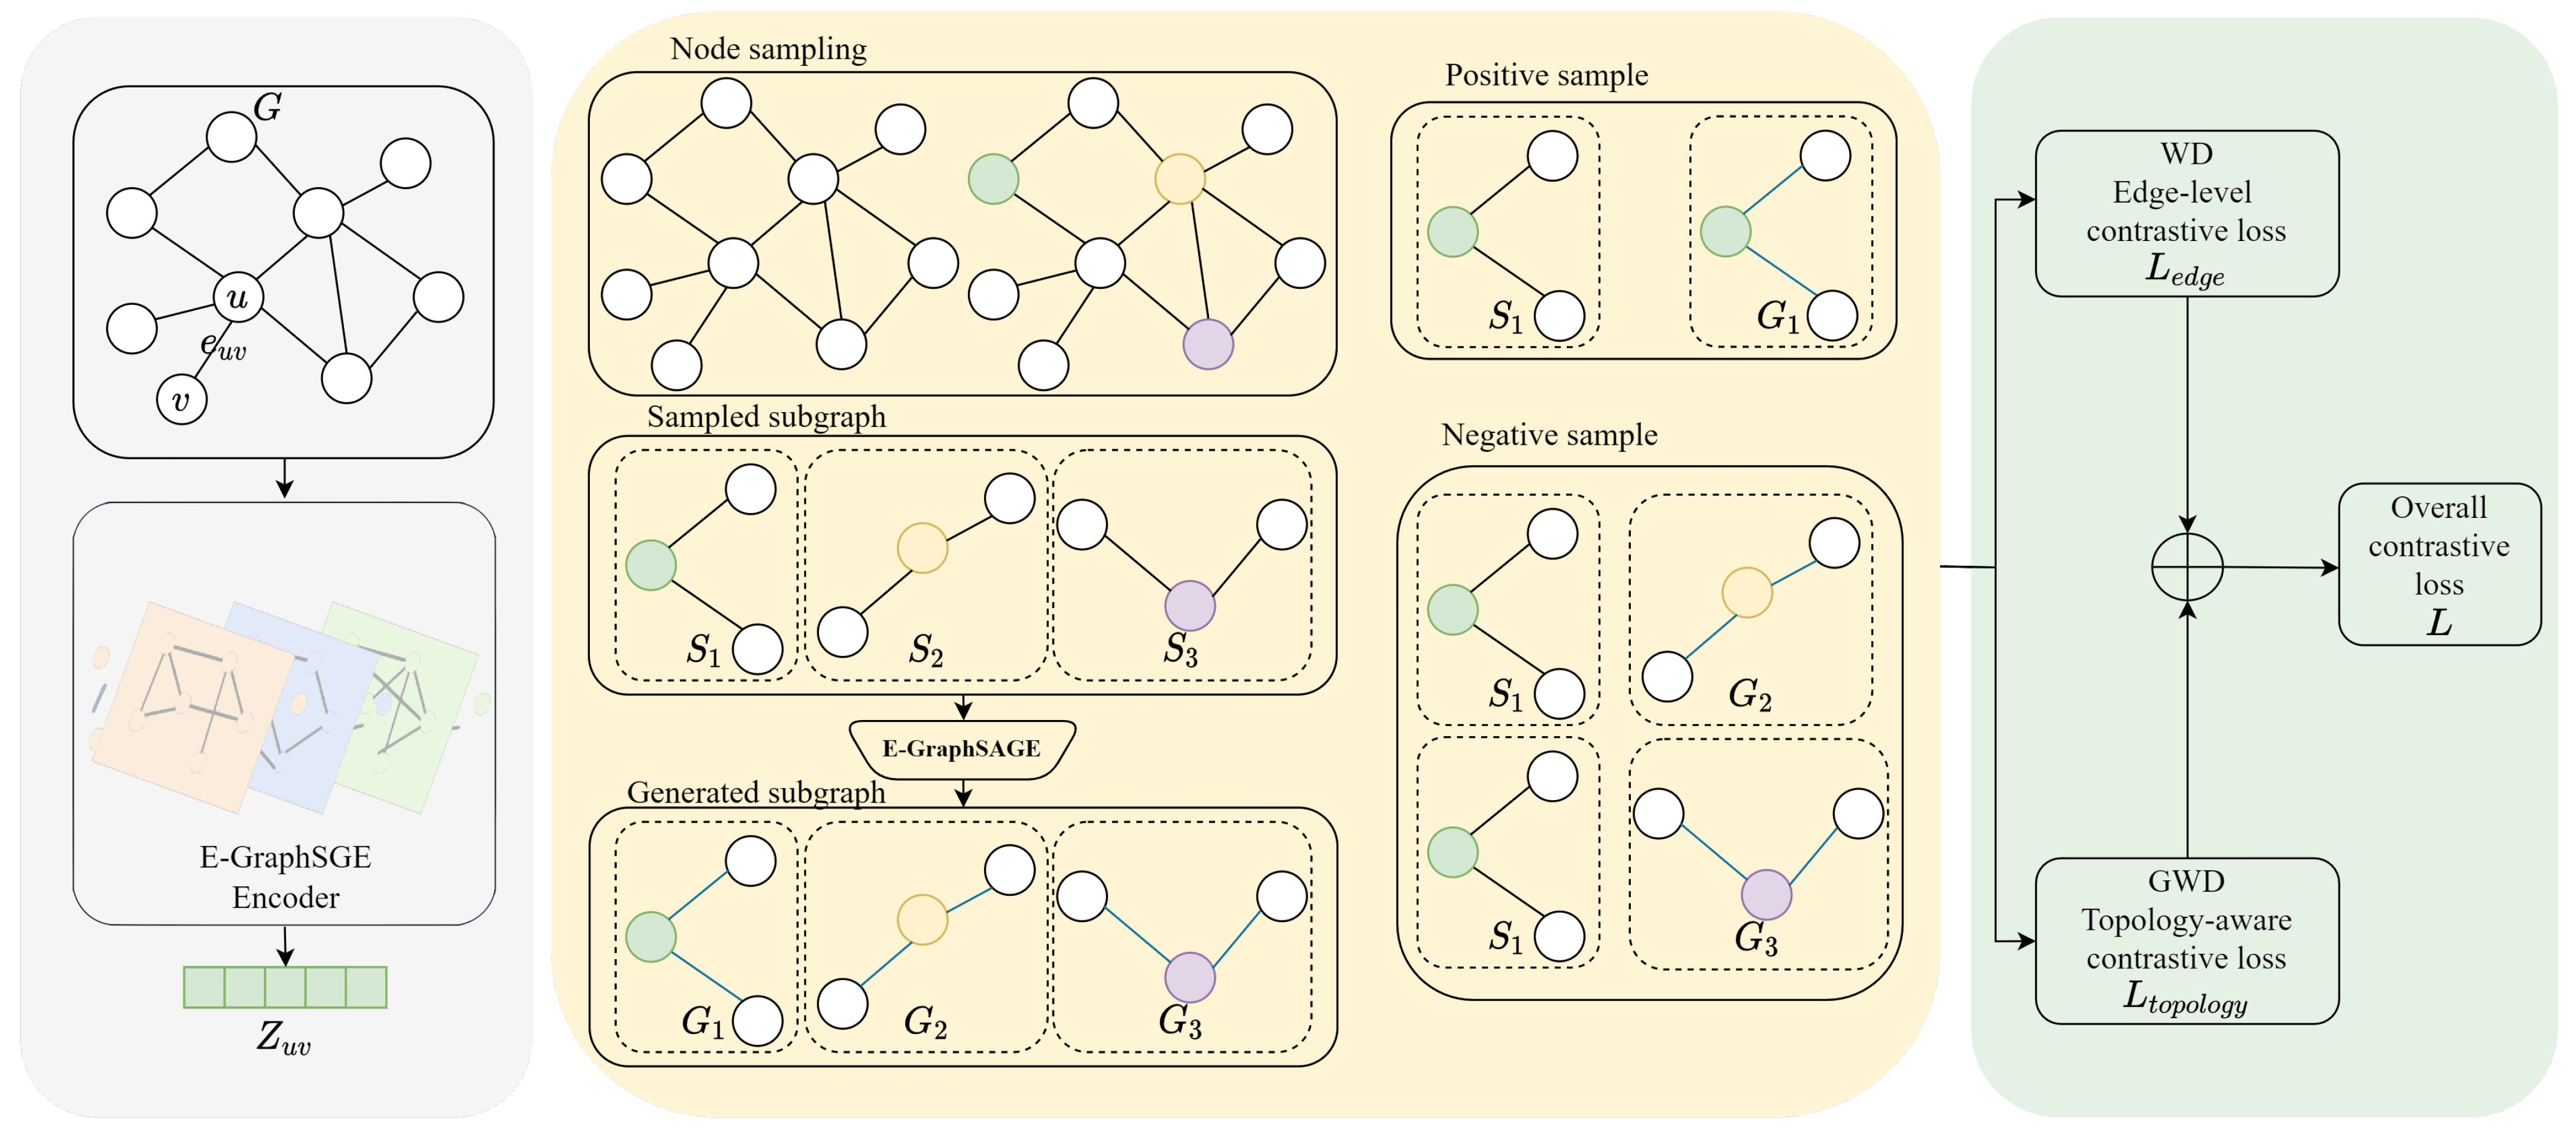
The proposed model is formulated as a self-supervised graph representation learning approach for anomalous network traffic detection, and its overall architecture is illustrated in Figure 1. The framework is composed of three principal modules, namely network data graph construction, a self-supervised GNN encoder, and anomaly detection. Initially, NetFlow traffic data are transformed into a graph-structured representation, wherein raw flow records are mapped into graph entities. Subsequently, the constructed graph data are fed into a self-supervised GNN encoder, termed EGSC, for representation learning. The architecture of the EGSC encoder is depicted in Figure 2. This encoding module adopts a graph neural network architecture capable of directly operating on both node and edge features, thereby enabling the generation of expressive embeddings. At this stage, salient structural patterns are extracted from the original traffic attributes by the GNN model, which is expected to enhance the overall representation capacity. More specifically, for each node in the graph, a corresponding local subgraph is constructed via a graph sampling strategy, upon which feature interpolation is performed to generate positive subgraph samples. Subsequently, intrinsic topological relationships within the network traffic graph are captured through a subgraph-level contrastive learning mechanism. Finally, the learned edge representations are utilized for model fine-tuning and downstream classification tasks. The GSC workflow diagram is constructed with inspiration from the GSC workflow diagram presented in [25,29], with appropriate adaptations for the proposed method.

3.1. Pre-Processing and Graph Generation

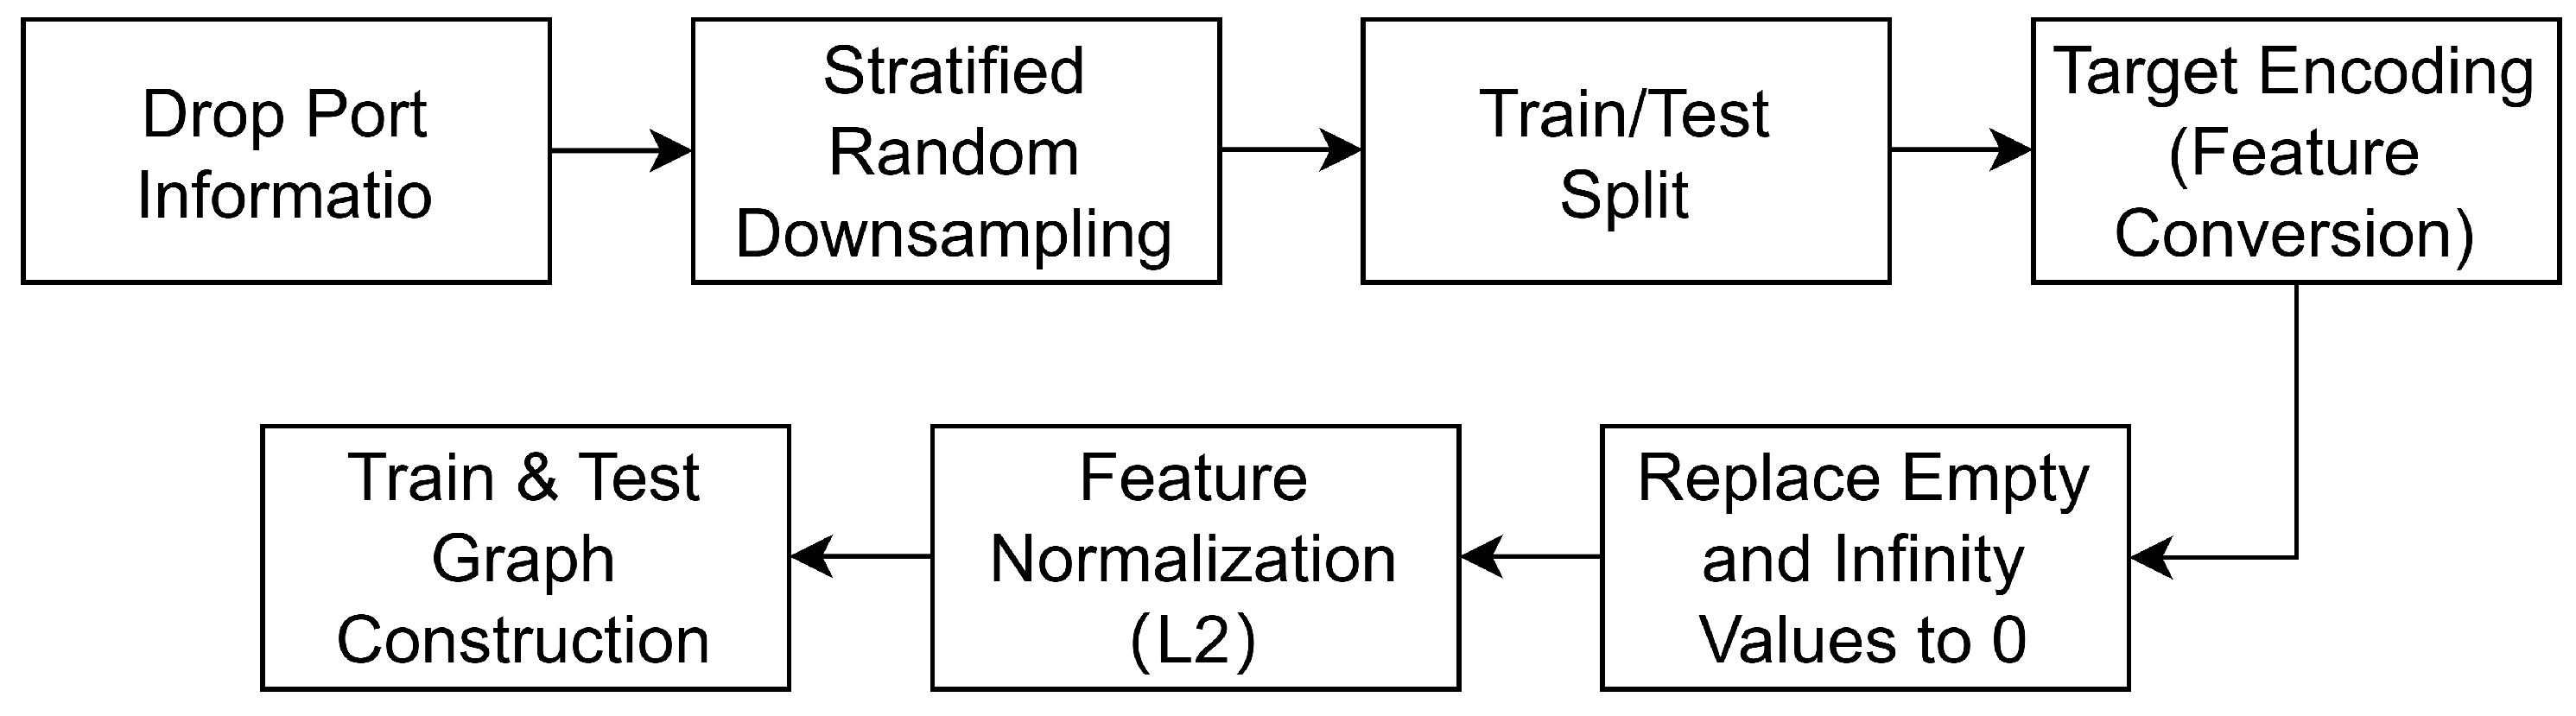
The data preprocessing and graph construction pipeline of the proposed model are carried out through a series of carefully designed steps to ensure data quality and structural consistency, as illustrated in Figure 3. First, redundant port-related information is removed to eliminate irrelevant features and reduce noise. In addition, IP addresses are converted into string formats to ensure data consistency and avoid unintended numerical bias. For large datasets, a stratified random downsampling strategy is applied, preserving the original class distribution while reducing the dataset size. For example, in the NF-CSE-CIC-IDS2018-v2 dataset, 10% of samples are randomly drawn from each attack type, thereby reducing computational cost without significantly compromising data representativeness. The processed data are then divided into training and testing subsets with a ratio of 7:3 to enable robust model evaluation. Subsequently, categorical features are transformed into numerical representations using target encoding, facilitating their compatibility with GNN input requirements. To prevent data leakage, the target encoding mappings are learned exclusively from the training set and then applied to the test set without incorporating label information from the latter. A graph structure is then constructed separately for the training and testing sets, where nodes typically represent network entities or flows and edges capture their relationships. Specifically, each unique source IP and destination IP address is mapped to a node, while each NetFlow record is represented as a directed edge connecting the corresponding node pair. The edge features consist of processed flow attributes, including TCP flags, protocol type, flow duration, byte count, and packet count. To ensure numerical stability, missing and infinite values are replaced with zeros. Before graph construction, L2 normalization is first applied to the feature vectors, followed by standardization using the StandardScaler function to transform features into a zero-mean and unit-variance distribution, which helps balance feature scales and improve model convergence. Finally, the source and destination addresses are mapped to nodes, while the processed flow information is used as edge features. To ensure consistency between node and edge feature dimensions, each node is initialized with an all-ones vector whose dimension matches that of the edge features. This initialization approach avoids the human bias introduced by manually constructed node attributes, enabling the model to focus on learning structural dependencies and edge feature-driven patterns, which is particularly beneficial for network traffic anomaly detection. Moreover, the all-ones initialization ensures dimensional consistency between node and edge features, facilitating subsequent feature fusion and message passing without the need for additional dimension transformations. Serving as a neutral and unbiased starting point, it prevents the gradient vanishing problem that may arise from zero vectors and avoids introducing random noise. As a result, the model places greater emphasis on leveraging the structural and attribute information embedded in edge features during the early training stage, effectively enhancing training stability and convergence efficiency. Through this pipeline, the data are effectively transformed into a structured graph representation suitable for downstream GNN-based anomaly detection tasks.

3.2. Self-Supervised GNN Encoder

The proposed self-supervised GNN encoding module is structurally distinct from the original GSC [29] framework. By considering the characteristics of network traffic data and their underlying topological relationships, the model is systematically optimized to more accurately and efficiently capture the differences among network flows in the context of network intrusion detection systems (NIDS). Before presenting a detailed description of the improved encoder, a brief overview of the core ideas behind the original GSC [29] and E-GraphSAGE [15] methods is first provided.

3.2.1. E-GraphSAGE

The graph neural network in the encoder is designed with a single-layer E-GraphSAGE [15] architecture, where neighborhood information aggregation is performed only once in the graph space to obtain edge embeddings. This design effectively captures the topological dependencies among network flows while avoiding the over-smoothing issue that may arise from stacking multiple layers. E-GraphSAGE [15] method is designed to effectively incorporate edge attributes into the representation learning process, thereby enhancing the model’s capability to capture complex interactions in network traffic graphs. Unlike the standard GraphSAGE [9], which primarily focuses on aggregating neighboring node features, E-GraphSAGE explicitly integrates edge features into the neighborhood aggregation function, enabling a more expressive modeling of relationships between nodes.
For a target node, the representations of its neighboring nodes are first fused with the corresponding edge features through a feature fusion operation, enabling the model to encode both structural and interaction information and facilitate message passing, as shown in Equation (1). For all nodes, the initial representation at layer k = 0 is set as h v 0 = x v .
h N ( v ) k A G G k ( { h u k 1 e u v k 1 u N ( v ) , u v E } )
Subsequently, the aggregated neighborhood information is combined with the previous representation of the target node and passed through a learnable transformation function, to obtain the updated node embedding.
h v k σ W k · C O N C A T ( h v k 1 , h N ( v ) k )
Through this process, the k-hop edge features and the underlying graph topology are effectively captured and integrated into the node representation. After K layers, the final node embedding is obtained as z v = h v K . The embedding of each edge u v is then derived by concatenating the embeddings of its two endpoint nodes.
z u v K C O N C A T ( z u K , z v K ) , u v E
To further stabilize training and enhance representation capacity, the updated node embeddings are often concatenated with the node’s previous representation, followed by normalization. Through iterative neighborhood aggregation across multiple layers, E-GraphSAGE [15] captures both local and higher-order structural patterns, making it particularly suitable for network traffic anomaly detection tasks where edge attributes carry rich semantic information.

3.2.2. GSC

GSC is a self-supervised graph representation learning method that aims to capture local structural characteristics of graphs by generating contrastive samples. It was proposed by Han et al. [29] and is built upon a contrastive learning framework. By incorporating an adaptive subgraph generation module and a structured contrastive loss function, GSC enables effective learning of intrinsic graph structures. The core idea is to select a central node to construct a subgraph and interpolate node representations based on the relationship weights among nodes within the subgraph, thereby generating high-quality contrastive samples.
In practice, GSC [29] first samples central nodes from the graph and constructs subgraphs around them using breadth-first search (BFS), where paths between nodes may span multiple hops. Subsequently, the generation module interpolates new node representations based on learned weights between neighboring nodes and the central node, formulated as:
h ^ i = j = 1 N ( i ) α i j h j
where N ( i ) denotes the neighborhood of node i in the graph G, h j represents the embedding features of neighbor node j of the central node i, and α i j represents the learned connection weight between the neighborhood node j and the center node i. In addition, edges within the subgraph are adaptively generated based on node similarity to preserve local structural information. During contrastive sample construction, pairs of subgraphs sharing the same central node are treated as positive samples, while others are considered negative samples. To optimize the model, GSC introduces a structured contrastive loss that integrates both Wasserstein distance and Gromov–Wasserstein distance to measure subgraph similarity, thereby capturing discrepancies in both node attributes and local structural distributions.
Although GSC effectively leverages graph topology to generate contrastive samples and improve node representations, it exhibits limitations in the NIDS scenario. Specifically, network traffic characteristics are predominantly reflected in edge features rather than node relationships. As a result, directly applying node-centric GSC may fail to fully capture anomalous flow patterns.

3.2.3. Self-Supervised GNN Encoder: EGSC

In network flow-based intrusion detection systems, the essential information is primarily reflected in the network flows themselves and their interdependencies. Therefore, in contrast to the function design adopted in the original GSC method, our approach places greater emphasis on edge representation learning, with the objective of characterizing both flow attributes and the interaction patterns among adjacent flows, rather than focusing predominantly on node embeddings. The proposed self-supervised graph encoder, EGSC, employs a single-layer E-GraphSAGE module to generate joint node–edge representations. Specifically, center nodes are sampled, and for each center node, a local subgraph is constructed by incorporating its first-order neighbors. An interpolated graph is further introduced to generate corresponding contrastive subgraphs, thereby forming the positive and negative sample pairs required for contrastive learning. The following formulation is constructed based on the approaches in [25,29], with additional constraints introduced to enhance the modeling of structural dependencies in network traffic graphs.
More concretely, the subgraph construction process is defined as follows. Taking each center node as the root, a fixed number of neighboring nodes are randomly selected from its immediate neighborhood to form a local subgraph. The construction is subject to the following constraints: (1) the shortest path length between any node in the subgraph and the root node is no greater than one, and (2) the distance between any pair of nodes does not exceed two. These constraints are motivated by two key observations. First, real-world attacks are typically confined to short-range interactions (⩽2 hops), whereas long-range multi-hop attacks are exceedingly rare. Second, in common DoS/DDoS scenarios, spoofed source IP addresses tend to disrupt the semantic coherence of multi-hop paths. Compared with the BFS-based sampling strategy employed in GSC, the proposed method preserves sensitivity to local topological structures while significantly reducing sampling complexity.
Subsequently, for each node v in the sampled subgraph S, a corresponding interpolated node v is generated by leveraging its neighborhood structural information. The interpolated feature is jointly computed from node and edge embeddings, as defined in Equation (5).
z v σ u N ( v ) α v u w ( z v z v u z u )
where α u v denotes the learned connection weight between nodes, z v , z u , and z v u represent node and edge embeddings, respectively, and σ is the activation function. Unlike GSC [29], which performs interpolation solely based on node representations, the proposed method integrates both node and edge information, thereby enabling a more accurate characterization of interaction patterns among network flows.
During the subgraph generation process, new edges are constructed only when real connections exist between the corresponding nodes in the sampled structure. The embedding of each newly generated edge is obtained by concatenating the embeddings of its two endpoint nodes, as defined in Equation (6).
z v u = z v z u
To accurately quantify the geometric discrepancy between the sampled subgraphs and the generated subgraphs, an optimal transport–based loss function is introduced. Specifically, the Wasserstein distance (WD [30]) is employed to measure the contrastive loss at the edge feature level, thereby capturing the distributional differences between edge embeddings, as defined in Equation (7).
W D ( S , G ) = min T π ( μ , η ) i = 1 m j = 1 m T i j c z e i , z e j
where μ and η denote the discrete distributions of two subgraphs, π ( μ , η ) denotes all the joint distributions of the edges of two subgraphs, T represents the transport matrix, and c ( · ) is the cost function that measures the distance between edge embeddings, reflecting their similarity. The corresponding edge-level contrastive loss is defined in Equation (8).
L e d g e = 1 N ( M + 1 ) i = 1 N [ log exp W D ( S i , G i ) τ + n i { 1 , , M } { i } log ( 1 exp ( W D ( S i , G n i ) / τ ) ) ]
At the structural level, the Gromov–Wasserstein distance (GWD [30]) is utilized to measure the contrastive loss of graph topology, enabling the characterization of structural discrepancies between subgraphs, as defined in Equations (9) and (10).
G W D ( S , G ) = min T π ( μ , η ) v , u , v , u T v v T u u c ^ ( z v , z v , z u , z u )
c ^ ( z v , z v , z u , z u ) = c ( z v , z u ) c ( z v , z u ) 2
where c ^ ( z v , z v , z u , z u ) captures the relational similarity between edges in the sampled and generated subgraphs. The corresponding topology-level contrastive loss is defined in Equation (11).
L t o p o l o g y = 1 N ( M + 1 ) i = 1 N [ log exp G W D ( S i , G i ) τ + n i { 1 , , M } { i } log 1 exp G W D S i , G n i / τ ]
The overall loss function is formulated as the sum of the edge-level and topology-level contrastive losses, as shown in Equation (12).
L = L e d g e + L t o p o l o g y
By jointly optimizing these two components, EGSC is able to simultaneously learn semantic (feature-level) and structural representations of network traffic, thereby effectively enhancing the representation capability for network intrusion detection.

3.3. Anomaly Detection

After training, the learned embeddings are utilized for anomaly detection analysis by applying the proposed detection module. The underlying principle of this module is to identify discriminative edge features that are highly indicative of anomalous behavior, thereby enabling effective differentiation between normal and abnormal network traffic patterns. In the binary classification setting, anomaly scores are computed based on the similarity between the learned representations and the distribution of normal patterns, allowing instances that significantly deviate from normal behavior to be flagged as anomalies. In the multi-class setting, a lightweight classifier is further trained on top of the learned embeddings to assign specific category labels to different types of network traffic, enabling fine-grained anomaly identification. Through this process, the model is capable of outputting both binary detection results (normal vs. anomalous) and multi-class predictions for various attack categories.

4. Experiment

To comprehensively evaluate the effectiveness of the proposed approach, a series of systematic experiments are conducted on benchmark datasets, with the aim of assessing its performance in anomalous network traffic detection from multiple perspectives.

4.1. Experimental Setup

For each experimental dataset used in this chapter, the training and testing sets are partitioned according to an identical ratio. Prior to the self-supervised training of the EGSCA model, the data are uniformly transformed into graph representations and subsequently fed into the EGSC encoding module to obtain discriminative embedding vectors. By jointly considering (i) the computational complexity of neighborhood aggregation and (ii) the risk of over-smoothing in deeper architectures, the number of layers in the E-GraphSAGE component of EGSC is set to one. The detailed hyperparameter configurations are summarized in Table 2. Parameter updates are performed via gradient-based backpropagation. During training, the Adam optimizer is employed with an initial learning rate of 0.001. The activation function is selected as the ReLU. For the loss function, both Binary Cross-Entropy (BCE) and Cross-Entropy (CE) are incorporated as optimization objectives to quantify the discrepancy between predicted outputs and ground-truth labels.
This model is trained in a self-supervised manner without relying on any ground-truth annotations. Specifically, contrastive learning is conducted at the subgraph level, where positive and negative sample pairs are constructed through random neighbor sampling and structural perturbations. The optimization objective is formulated using a binary cross-entropy (BCE) loss over pseudo-labels, where positive pairs are assigned a label of 1 and negative pairs are assigned a label of 0. It is important to emphasize that these labels are not derived from dataset annotations but are automatically generated based on structural consistency (i.e., pseudo-labels), ensuring that the training process remains fully self-supervised. Although ground-truth attack labels are available in the datasets, they are exclusively used for downstream evaluation via a cross-entropy (CE) loss (e.g., computing accuracy, precision, recall, and F1-score on test data) and do not participate in representation learning. Furthermore, label attributes stored in the graph are not involved in message passing or loss computation during pre-training, thereby preventing any potential information leakage. Therefore, the training process is fully self-supervised and does not exploit any label information.

4.2. Experimental Dataset

The experimental datasets employed in this study are all derived from publicly available network traffic security resources, which are considered to realistically reflect both normal communication behaviors and diverse attack activities in real-world network environments. Specifically, the datasets include NF-BoT-IoT, NF-BoT-IoT-v2, NF-ToN-IoT, and NF-CSE-CIC-IDS2018-v2. Each dataset comprises both benign traffic samples and multiple categories of malicious traffic instances.
The NF-BoT-IoT dataset was released by Sarhan et al. [31] as a NetFlow version of the original BoT-IoT dataset. More specifically, the original PCAP files were first processed and converted into NetFlow format using the nProbe tool, after which 12 key features were selected to construct this new dataset variant, namely NF-BoT-IoT. The dataset contains 600,100 flow records, including 586,241 attack flows (97.69%) and 13,859 benign flows (2.31%).
NF-BoT-IoT-v2 [32] is an extended version derived from NF-BoT-IoT, in which the number of network flow features is increased from 8 to 39, along with a substantial expansion in the number of flow records. The enhanced dataset contains 37,763,497 network flows, of which 135,037 (0.36%) are benign and 37,628,460 (99.64%) are attack samples.
NF-ToN-IoT [31] represents the NetFlow version of the ToN-IoT dataset. This dataset is comprehensive, encompassing operating system logs, IoT service telemetry, and real network traffic data. In NF-ToN-IoT, a total of 1,379,274 network flows are included, among which 1,108,995 (80.4%) are malicious and 270,279 (19.6%) are benign.
The NF-CSE-CIC-IDS2018-v2 dataset [31] was constructed by Sarhan et al. based on the original CSE-CIC-IDS2018 dataset [33] and provides a standardized NetFlow feature set to support network intrusion detection systems (NIDS). It contains 18,893,708 flow records, of which 88.05% (16,635,567) correspond to benign traffic and 11.95% (2,258,141) correspond to attack samples. The attack categories include Brute Force, Botnet, Denial-of-Service (DoS/DDoS), Infiltration, and Web-based attacks (e.g., SQL injection).

4.3. Evaluation Metrics

To quantitatively assess the performance of the proposed model, four widely adopted evaluation metrics are employed, namely Accuracy, Precision, Recall, and F1-score [34,35,36,37], as shown in Table 3. Accuracy measures the overall proportion of correctly classified samples among all predictions, providing a general indication of classification performance. However, in the context of imbalanced network traffic data, Accuracy alone may be insufficient to reflect the model’s effectiveness. Precision is defined as the ratio of correctly predicted positive samples to all samples predicted as positive, thereby evaluating the model’s ability to avoid false positives. Recall, also referred to as sensitivity, quantifies the proportion of actual positive samples that are correctly identified, reflecting the capability of the model to detect anomalous traffic. The F1-score, as the harmonic mean of Precision and Recall, offers a balanced measure that accounts for both false positives and false negatives. By jointly analyzing these four metrics, a more systematic and objective evaluation of the model’s overall performance in network traffic anomaly detection can be achieved.

4.4. Experimental Results and Comparative Analysis

In this subsection, the proposed model is evaluated from both binary and multi-class classification perspectives on four benchmark datasets. It is further compared with multiple baseline methods, followed by a detailed analysis and discussion of the experimental results. The comparison baselines include supervised methods based on graph neural networks (E-GraphSAGE [15]), as well as recently proposed self-supervised approaches (Anomal-E [20], TS-IDS [38] and NEGSC [25]).

4.4.1. Binary Classification Results

Table 4 presents the binary classification performance of the EGSCA model on four benchmark datasets. Overall, the model exhibits excellent classification capability across all datasets, with particularly outstanding performance in detection rate (DR) and F1-score. The F1-scores on NF-BoT-IoT and NF-BoT-IoT-v2 reach 0.9907 and 0.9987, respectively, with near-perfect detection rates (0.9990 and 0.9996), indicating that the model can accurately identify anomalous traffic samples while maintaining a high recall. On NF-ToN-IoT, the F1-score is 0.9604 and the DR is 0.9707, which are slightly lower than those on the first two datasets. This result may be attributable to the inherent complexity of the dataset and the imbalanced distribution of anomalous samples, leading to certain prediction errors on a small number of marginal samples. Nevertheless, the accuracy and precision remain at relatively high levels of 0.9358 and 0.9520, respectively, suggesting that the model’s overall discriminative ability is not significantly compromised. The performance on the NF-CSE-CIC-IDS2018-v2 dataset shows a different trend: although the accuracy reaches 0.9950 and the precision is as high as 0.9991, the detection rate is 0.9590, which is relatively lower. This discrepancy indicates potential challenges in terms of missed detections of a very small number of anomalous samples under specific data environments, yet the overall performance remains within an acceptable range. Collectively, the model balances high precision and high recall, demonstrating efficient and robust discriminative ability in anomalous traffic detection. The experiments validate its generalization capability across different network environments, providing reliable technical support for anomaly detection under complex traffic conditions.
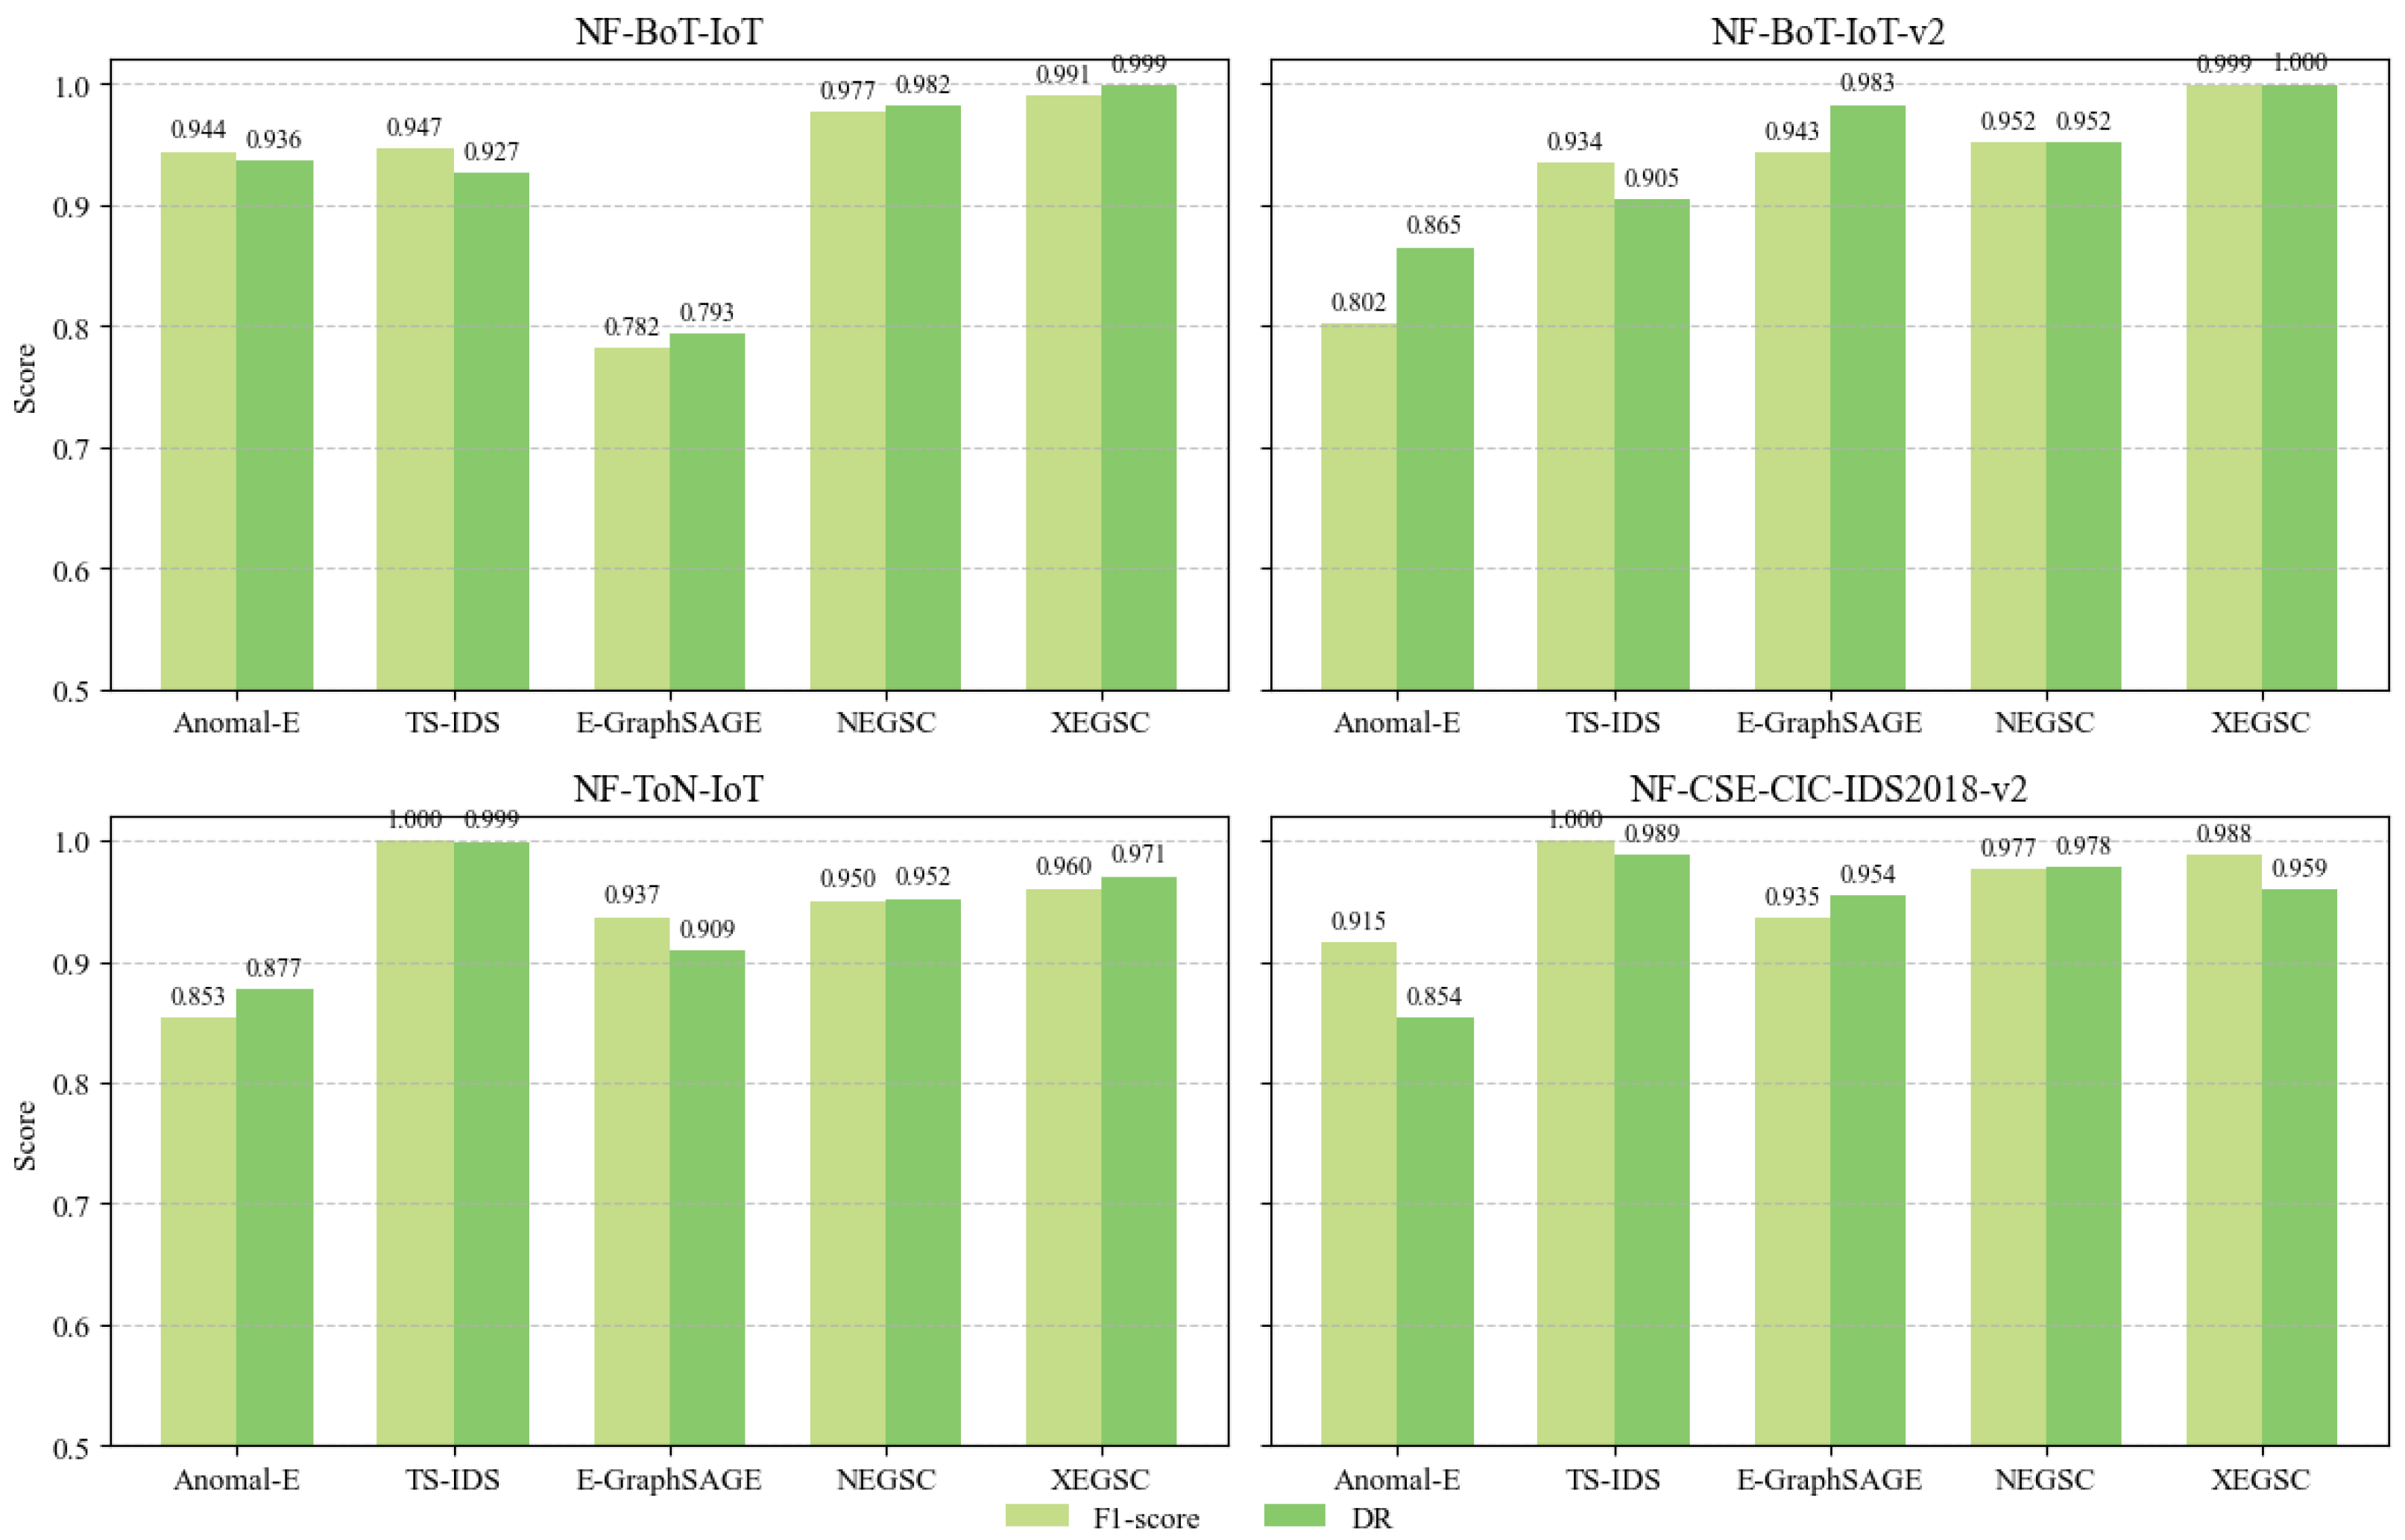
Table 5 compares the binary classification performance between the EGSCA model and existing algorithms. Figure 4 presents a performance comparison of different methods in terms of F1-score and detection rate (DR) on the four datasets. The experimental data show that the EGSCA model achieves optimal or near-optimal performance in both F1-score and detection rate (DR), reflecting its robustness and efficiency in identifying anomalous traffic. EGSCA attains the highest F1 and DR values on NF-BoT-IoT and NF-BoT-IoT-v2 (NF-BoT-IoT: F1 = 0.9907, DR = 0.9990; NF-BoT-IoT-v2: F1 = 0.9987, DR = 0.9996), approaching the theoretical optimum on both datasets. The performance fluctuations across different datasets reveal differences in generalisation capability. The EGSCA method achieves the best or second-best F1 (lowest 0.9604) on each dataset, demonstrating strong cross-dataset robustness. However, in binary classification scenarios, TS-IDS demonstrates superior performance on certain datasets, particularly in distinguishing between benign and malicious traffic. On NF-ToN-IoT and NF-CSE-CIC-IDS2018-v2, TS-IDS performs best, with EGSCA ranking second. However, on NF-BoT-IoT, the F1 of TS-IDS is slightly lower than that of EGSCA (0.9467 vs. 0.9907), suggesting potential limitations of TS-IDS on specific attack types. Although the F1 of EGSCA on these two datasets is marginally lower than that of TS-IDS (0.9604 and 0.9879, respectively), its DR remains above 0.97, indicating stable detection capability. The E-GraphSAGE algorithm shows poor consistency across datasets and insufficient generalisation ability. Although EGSCA does not outperform TS-IDS in terms of binary classification accuracy and F1-score on certain datasets (NF-ToN-IoT and NF-CSE-CIC-IDS2018-v2), its fully self-supervised learning capability provides unique advantages, particularly for multi-class network intrusion detection and scenarios where labeled data are scarce.
Comparison experiments demonstrate that EGSCA consistently achieves superior F1-score and detection rate across multiple datasets and various environmental conditions, significantly outperforming other methods. Compared with the current state-of-the-art method (E-GraphSAGE), the proposed EGSCA yields average absolute improvements of 2.06% in F1-score and 1.62% in detection rate, attaining consistent advantages across multiple datasets. This gain is not a local fluctuation but emerges stably under different data distributions and anomaly complexity levels, indicating that the performance enhancement is systematic rather than coincidental. Notably, on the more challenging NF-BoT-IoT dataset, this advantage expands further, with F1-score and detection rate improving by 1.94% and 2.93%, respectively—equivalent to an absolute leap of nearly 2–3% over a high baseline performance level. Under near-saturation performance conditions (F1-score > 0.95), an absolute improvement on the order of 2% usually means a substantial reduction in the number of false positives and false negatives, carrying significant engineering implications. Moreover, on NF-BoT-IoT-v2 (which contains complex attack types and exhibits considerable baseline performance fluctuation), EGSCA achieves improvements of 4.72% in F1-score and 4.80% in detection rate, further validating its superiority and generalisation capability in challenging scenarios. Therefore, the stable gains across datasets not only reflect the model’s enhanced ability to characterise decision boundaries, but also verify, from both statistical and practical perspectives, its sustained leading edge in complex network environments. These observations indicate that the model possesses marked advantages when handling complex and sparse anomalous samples, while confirming its generalisation capability and applicability in real-world network environments.

4.4.2. Multi-Classification Results

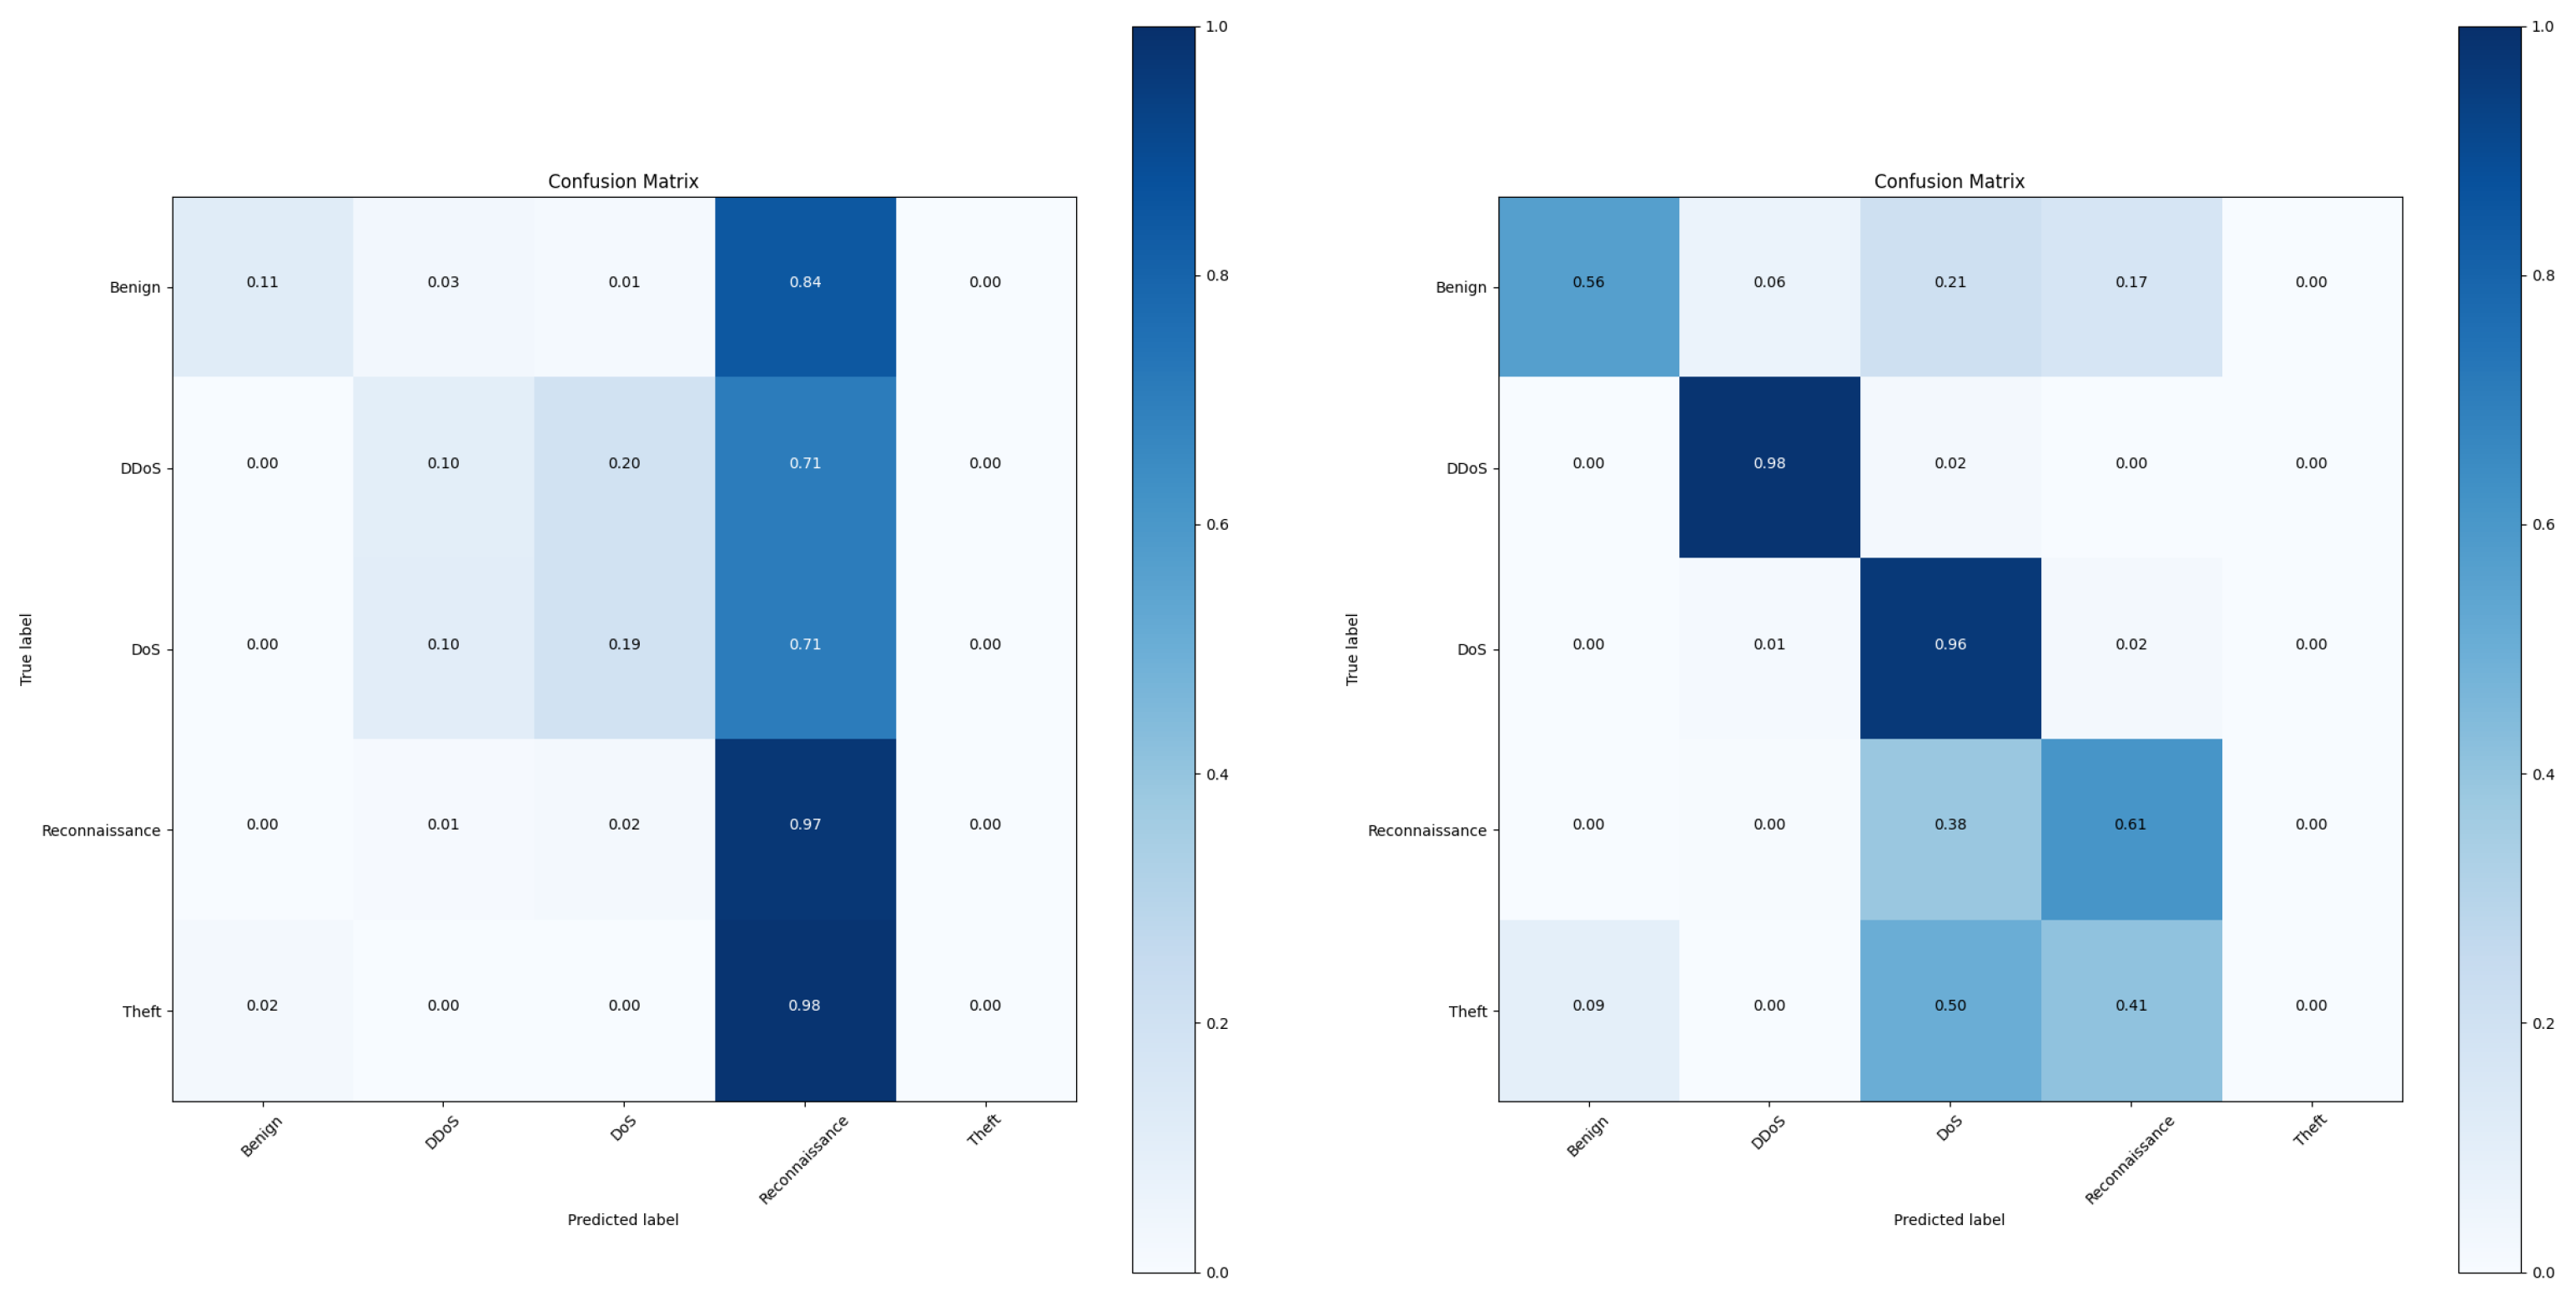
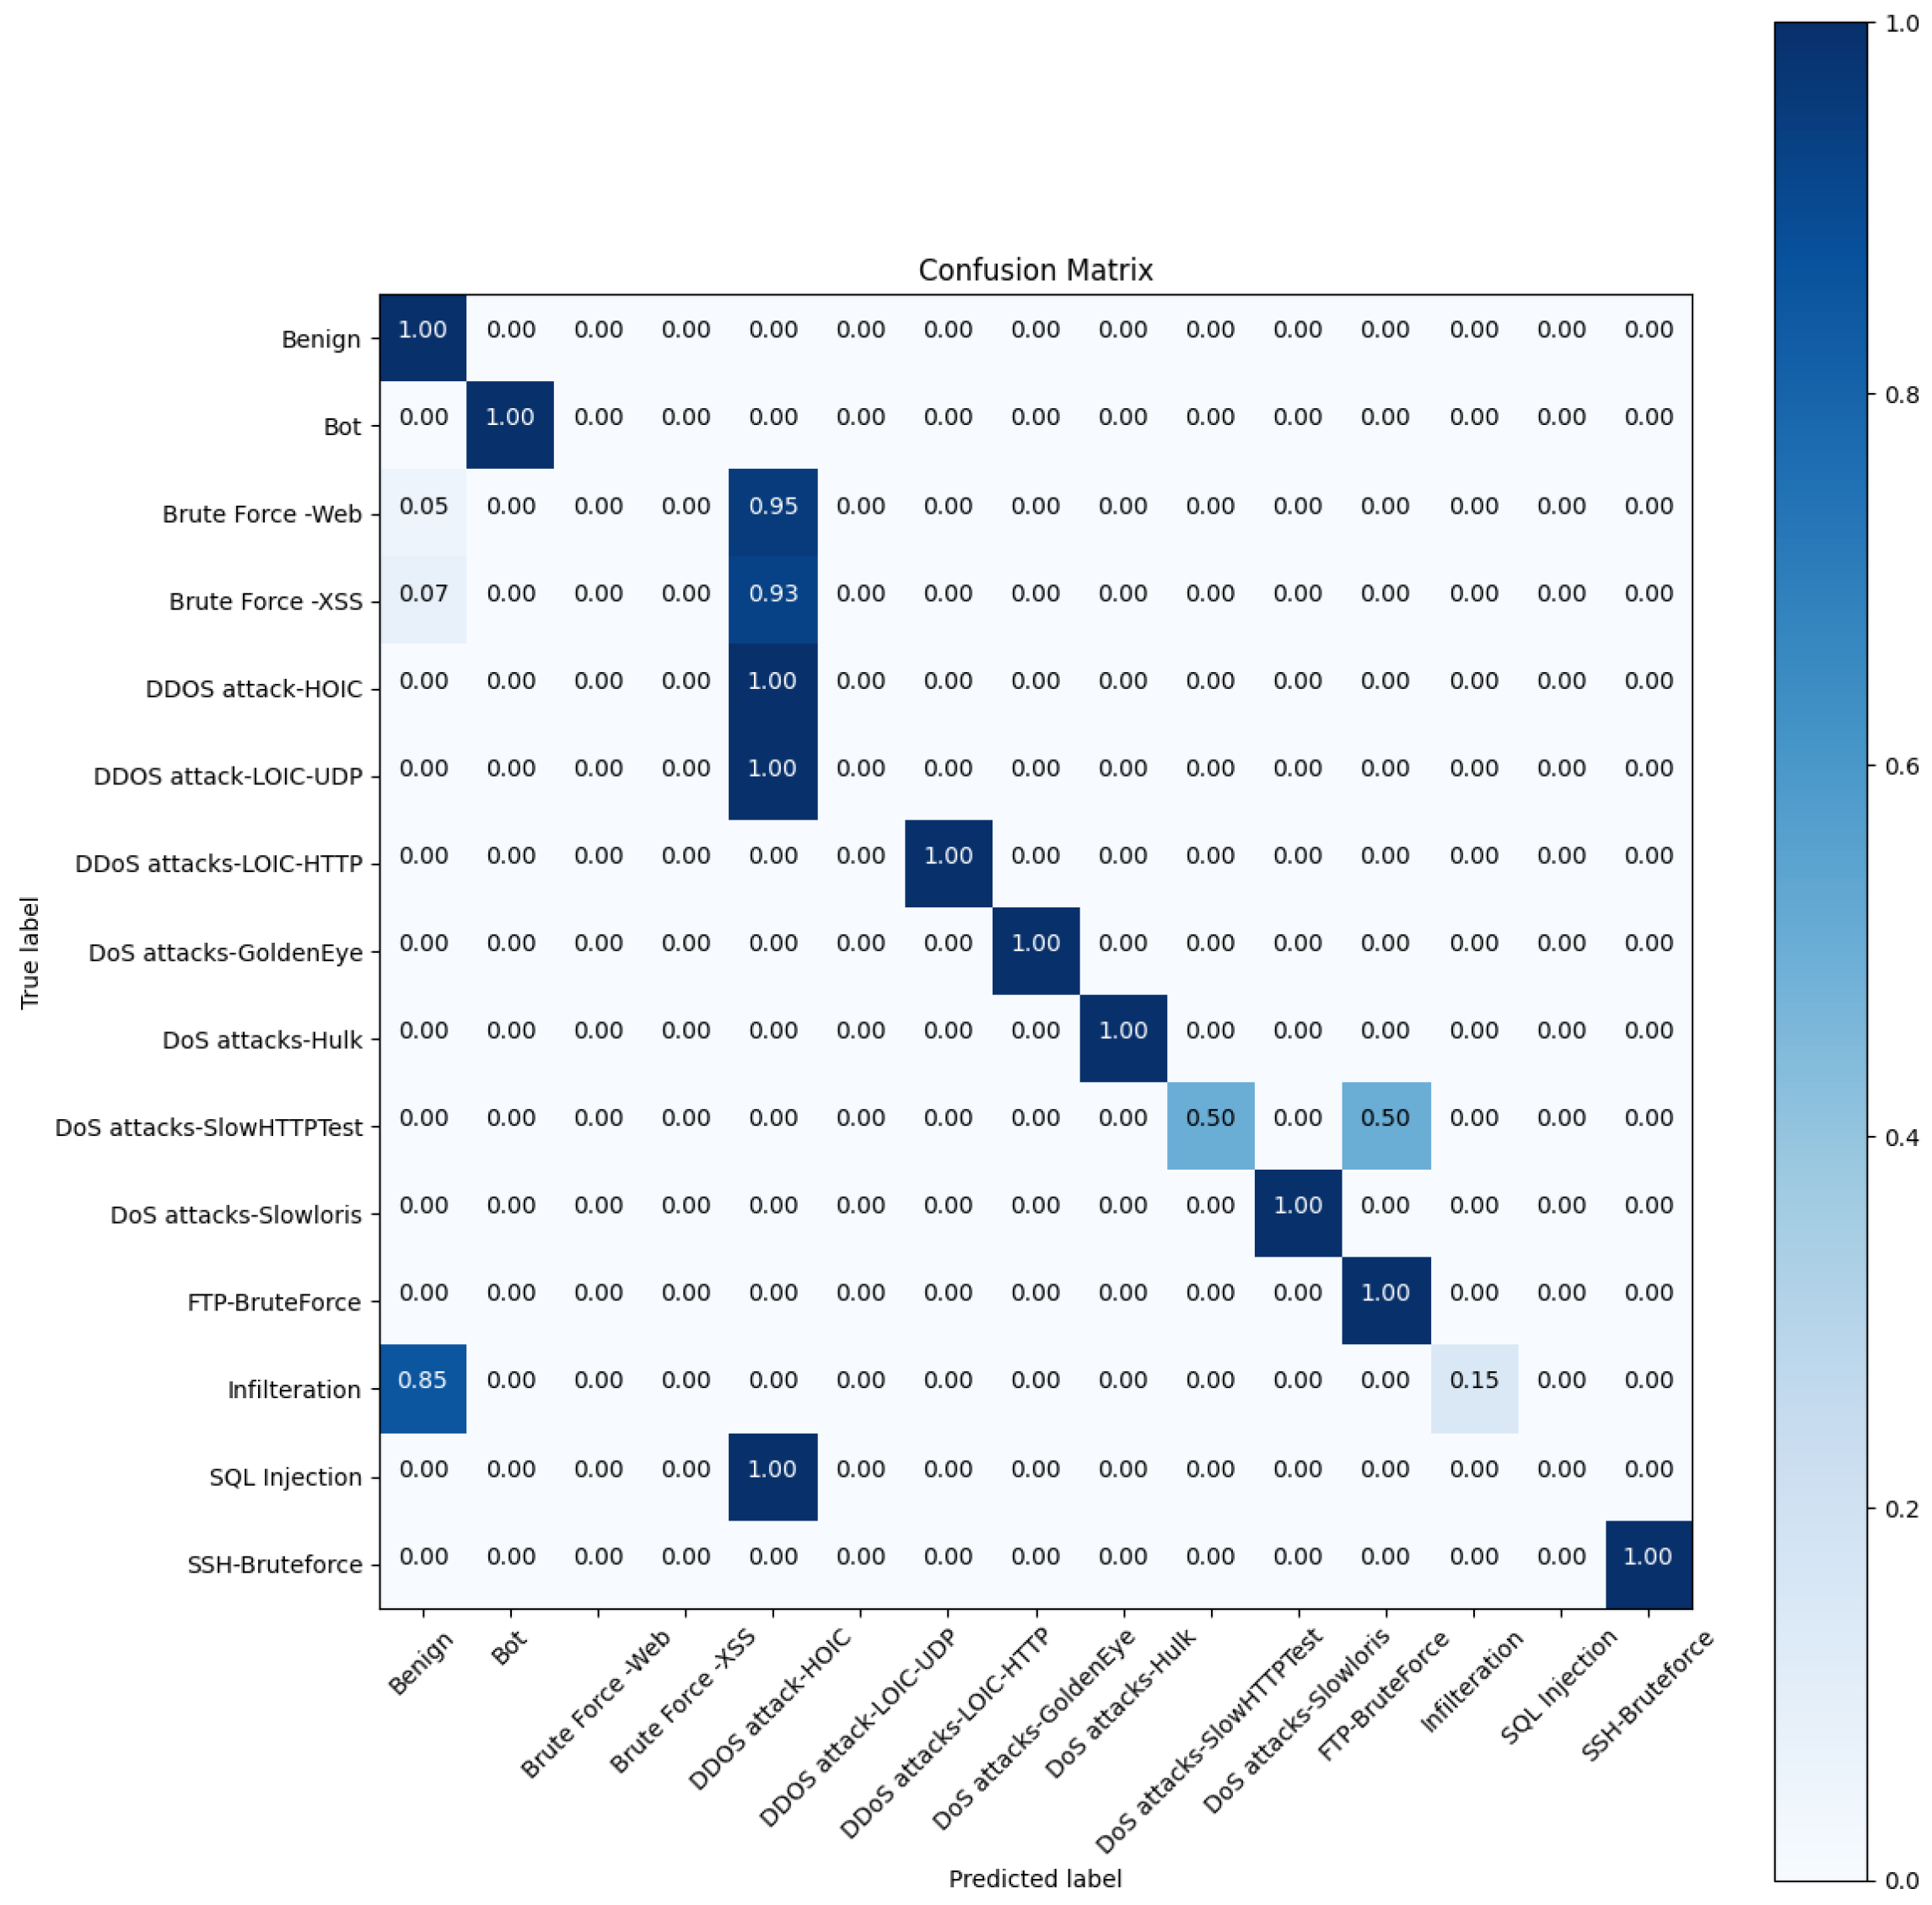
Table 6 and Table 7 present the multi-classification experimental results of the EGSCA model on the NF-BoT-IoT, NF-BoT-IoT-v2 and NF-CSE-CIC-IDS2018-v2 datasets, with their confusion matrices shown in Figure 5 and Figure 6. It is worth noting that the adopted dataset explicitly differentiates between DoS and DDoS attacks. According to the dataset definition, DoS refers to attempts to exhaust system resources and disrupt service availability, typically originating from a single source, while DDoS represents an extension of DoS involving multiple distributed sources. Despite the practical dominance of DDoS in real-world scenarios, both categories are preserved in this study to maintain consistency with the original dataset annotations and prior studies. The experimental results reveal a striking difference in the multi-classification performance of the EGSCA model between the NF-BoT-IoT and NF-BoT-IoT-v2 datasets. The weighted average F1-score and detection rate (DR) on NF-BoT-IoT-v2 reach 0.9440 and 0.9462, respectively, improving by 19.9% and 15.4% over NF-BoT-IoT. This indicates that the model possesses stronger overall discriminative ability under improved data distribution conditions. On NF-CSE-CIC-IDS2018-v2, the weighted average F1-score and DR of the model reach 0.9918 and 0.9939, respectively, indicating near-perfect macro-level performance. However, such high aggregated performance masks substantial class-level disparities, particularly for minority and hard-to-distinguish attack types, which require further analysis.
From the class-level perspective, the model’s performance exhibits pronounced imbalance. On the original NF-BoT-IoT dataset, the model performs well only on the Reconnaissance class (F1-score 0.8954, DR 0.9723), whereas Benign, DDoS and DoS classes remain poorly detected (F1-scores all below 0.25), reflecting substantial interference of class imbalance and feature overlap on decision boundary learning. By contrast, on NF-BoT-IoT-v2, the F1-scores for the DDoS and DoS classes increase to 0.9839 and 0.9425, respectively, with detection rates of 0.9505 and 0.9648, indicating that the model forms a clearer discriminative structure for high-intensity traffic attack patterns. Although performance on the Reconnaissance class declines, the substantial improvement in the overall weighted metrics suggests that the model’s ability to recognise the major attack classes is significantly enhanced. Notably, the Theft class is not effectively identified on either dataset, pointing to the persistent challenge posed by extreme sample scarcity. In the NF-CSE-CIC-IDS2018-v2 experiments, for attack types with prominent traffic characteristics and stable patterns—such as Bot, DDoS and DoS families, and SSH-Bruteforce—the model achieves F1-scores and DRs close to or reaching 1.000, while the recognition rate for the Benign class is also near perfect. This indicates robust decision boundaries for dominant patterns. Nevertheless, a marked imbalance persists at the class level. Performance on Infilteration (F1-score 0.2543, DR 0.1462) and DoS attacks-SlowHTTPTest (DR 0.5000) is significantly degraded, and several low-frequency classes (e.g., Brute Force-Web, Brute Force-XSS, SQL Injection) are not effectively identified, reflecting the model’s limited discriminative ability under conditions of extreme sample scarcity or weakly distinguishable behavioural features.
On NF-BoT-IoT, the confusion matrix reveals that the model predicts almost all samples from most classes as Reconnaissance. Benign, DDoS, DoS and Theft are all heavily misclassified into Reconnaissance, exhibiting a clear class collapse phenomenon. Only Reconnaissance itself is reasonably well identified (0.97). This indicates that the model fails to form clear multi-class decision boundaries on this dataset, owing to overlapping features and imbalance. On NF-BoT-IoT-v2, the model’s classification structure improves markedly. DDoS and DoS form clear diagonal distributions, indicating that the model can stably identify high-intensity traffic attacks. The Benign class shows moderate recognition, with some residual confusion. Cross-misclassifications occur between Reconnaissance and Theft, as well as between Reconnaissance and DoS, suggesting that low-frequency or behaviourally similar attack classes remain difficult to distinguish. Nevertheless, the overall class separation is significantly better than that on the original dataset.
On NF-CSE-CIC-IDS2018-v2, the model accurately discriminates among various network traffic classes, maintaining high overall weighted evaluation metrics and demonstrating strong multi-class capability, with only a limited degree of confusion for a few attack classes. This phenomenon is likely attributable to highly similar traffic characteristics between those attack types.
However, several minority classes (e.g., Theft, Brute Force-Web, Brute Force-XSS, DDoS attack-LOIC-UDP, and SQL Injection) exhibit extremely low or even zero F1-scores and Detection Rates (DR), highlighting the limitations of the model under long-tailed distributions. This phenomenon can be mainly attributed to the following four aspects: (1) Severe class imbalance. Minority classes account for only 0.002–0.3% of the total samples in the dataset. This extreme imbalance inherently biases the model toward majority classes during training, compresses the feature space of minority classes, and shifts the decision boundary, thereby weakening the model’s ability to recognize their anomalous patterns. (2) Feature overlap and representation confusion further exacerbate this issue. The confusion matrix shows that the extreme minority class Theft is completely overshadowed by majority classes (DoS and Reconnaissance); DDoS attack-LOIC-UDP and SQL Injection are almost entirely misclassified as DDoS attack-HOIC; and approximately 5% and 7% of Brute Force-Web and Brute Force-XSS, respectively, are misclassified as benign traffic. This indicates that the model tends to capture dominant structural patterns rather than subtle semantic differences, thereby limiting its ability to discriminate rare attacks. (3) Bias of the self-supervised learning objective. The optimization objective adopted in this work emphasizes structural consistency rather than explicit class discrimination. Under extreme imbalance conditions, this further drives the model to focus on dominant structural patterns, aggravating performance degradation on minority classes. (4) Information dilution in graph structures. During message passing in GNNs, the weak signals of minority-class nodes are easily overwhelmed by the high-frequency features of neighboring majority-class nodes, leading to homogenized representations. In summary, the extremely low performance on minority classes does not indicate a complete failure of the model, but rather results from the combined effects of class imbalance, feature overlap, the characteristics of self-supervised learning, and information dilution in graph structures. In future work, class re-weighting, hard example mining, and more fine-grained subgraph sampling strategies will be explored to enhance the modeling capability for minority and complex classes.
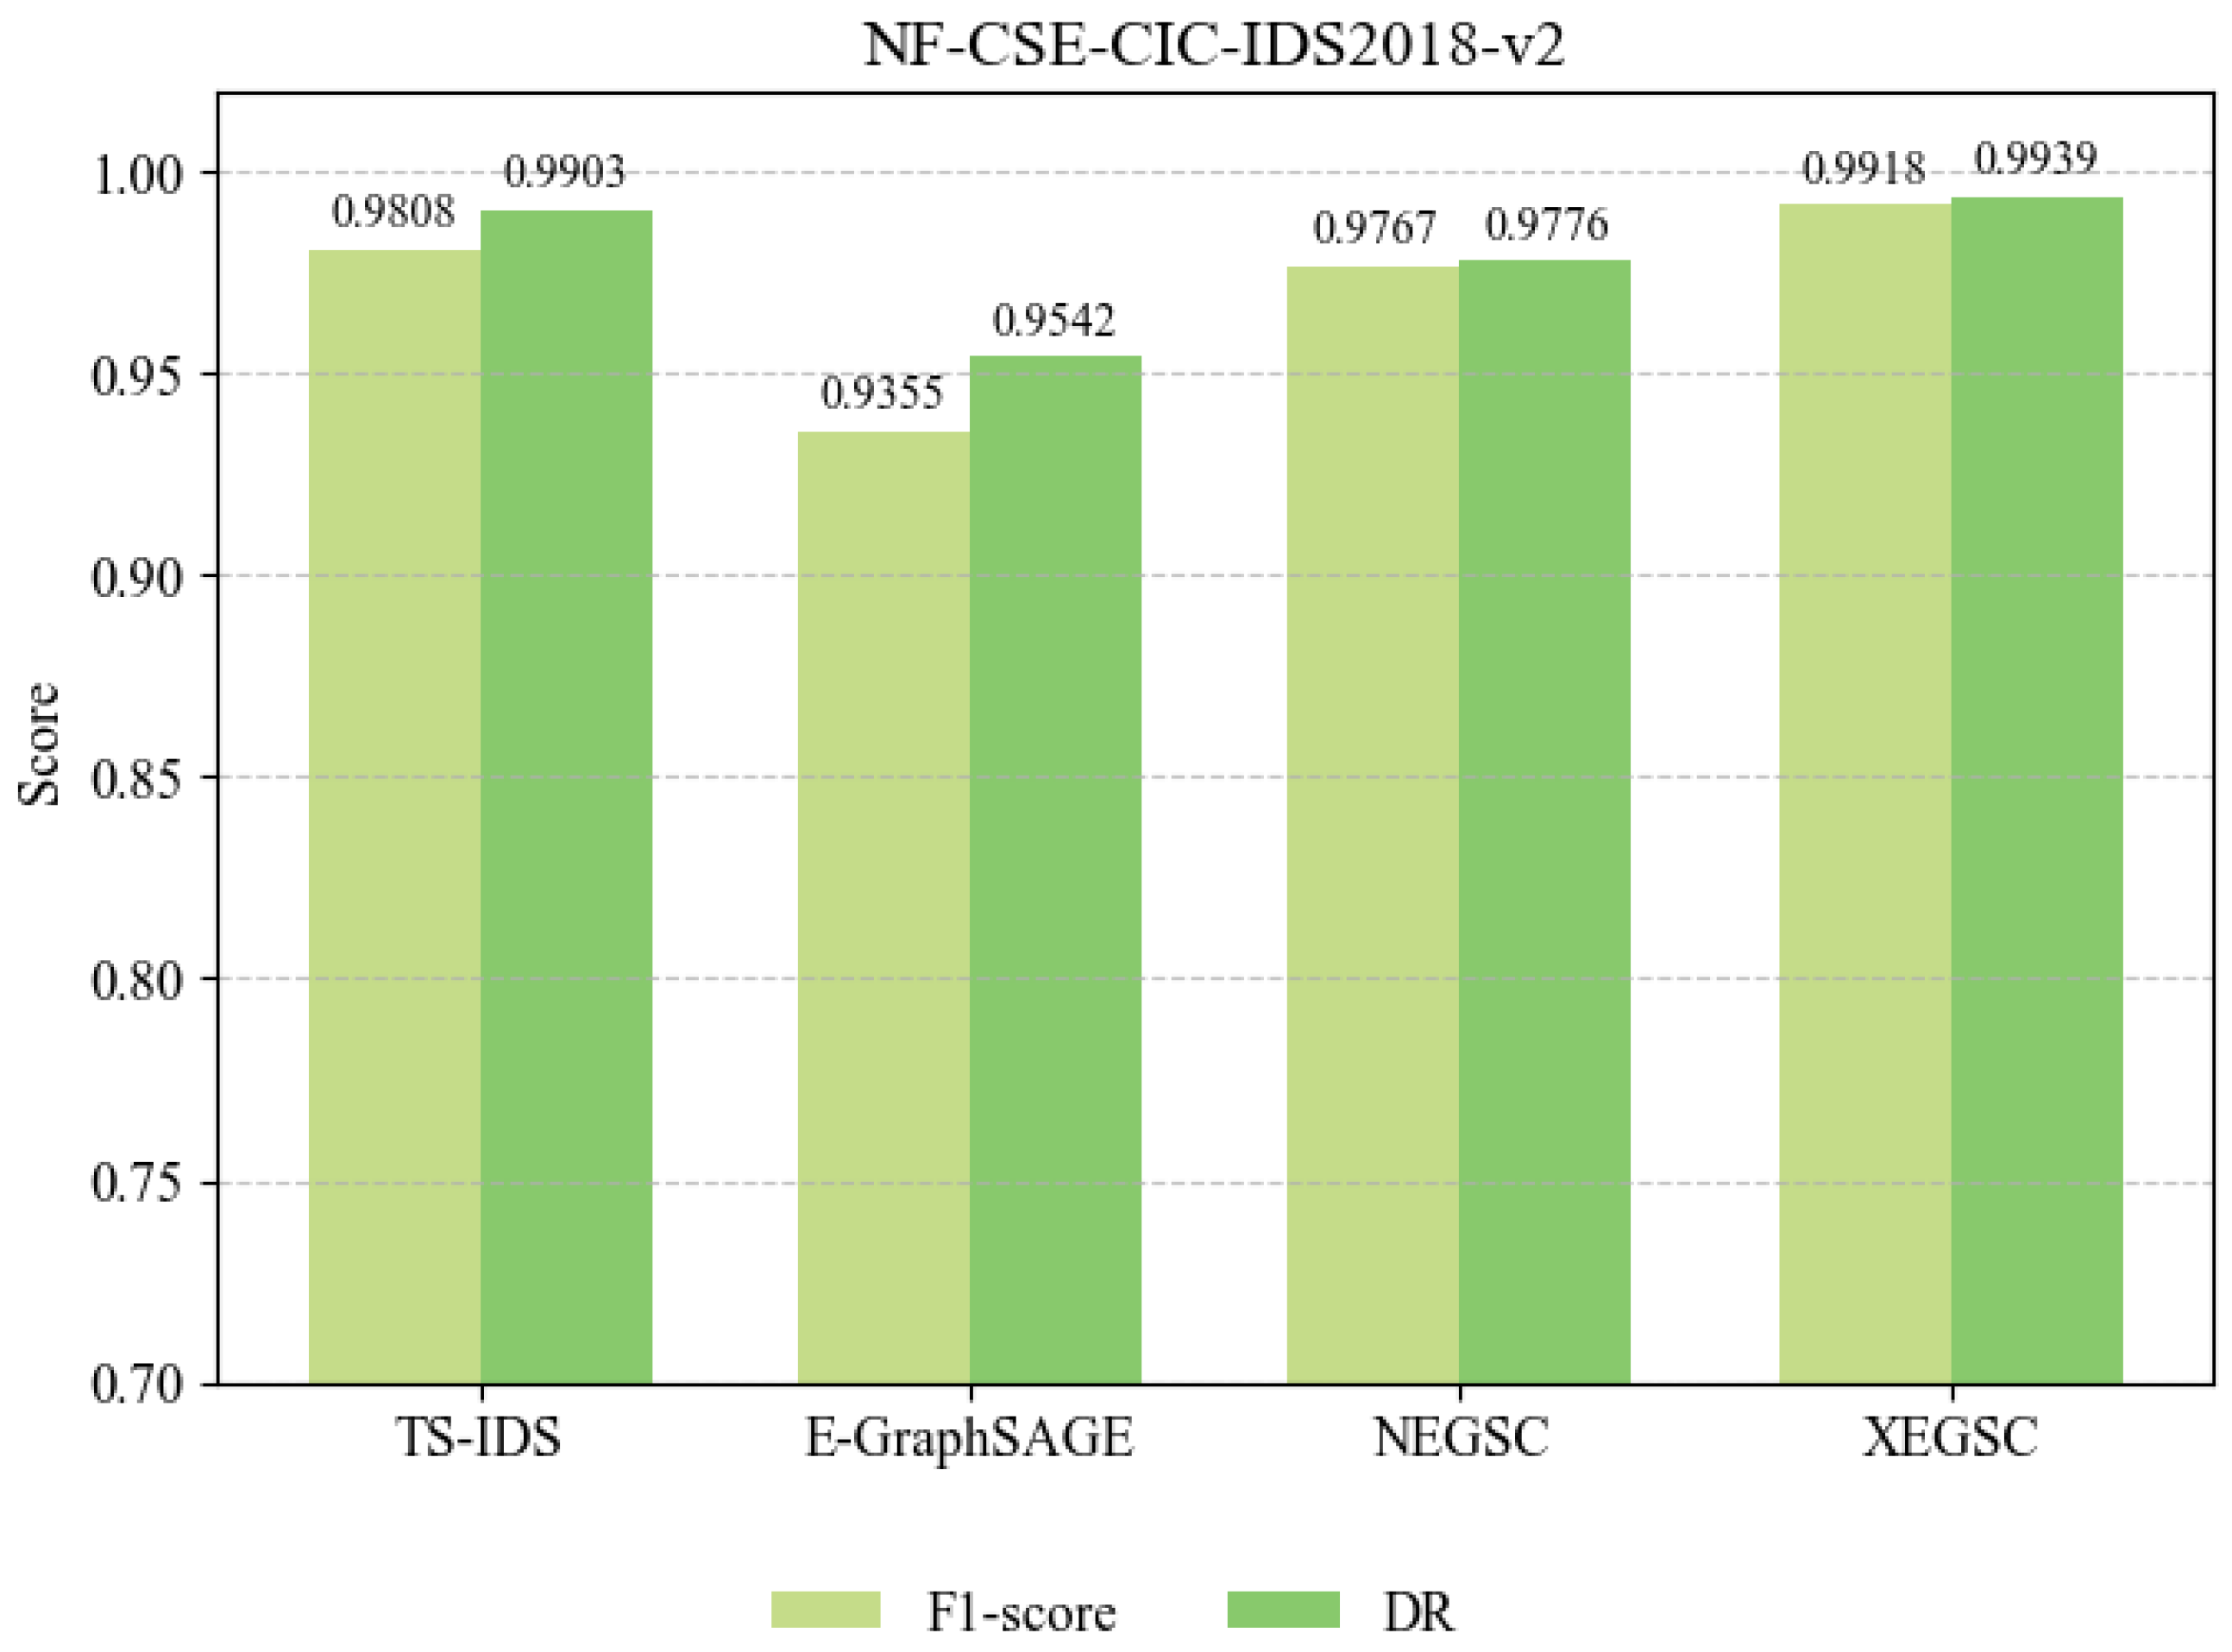
Table 8 presents the multi-class comparative experimental results of the model on the NF-CSE-CIC-IDS2018-v2 dataset. Figure 7 presents a performance comparison of different methods in terms of F1-score and detection rate (DR) on the dataset. We adopt F1-score and detection rate (DR) as evaluation metrics. As can be seen from the results, the EGSCA method achieves the best performance, with an F1-score of 0.9918 and a DR of 0.9939, outperforming all other compared methods. TS-IDS ranks second, with an F1-score of 0.9808 and a DR of 0.9903, slightly lower than EGSCA. Overall, EGSCA exhibits the strongest classification ability and detection rate in the multi-class task, significantly outperforming E-GraphSAGE, and also shows clear performance improvements over TS-IDS and NEGSC, thereby validating the effectiveness of the EGSCA model architecture.
Taken together, these results indicate that the performance of the EGSCA model is highly sensitive to the data distribution structure; its underlying discriminative potential can be unleashed under improved class separability conditions. The model is particularly adept at learning high-frequency, strongly characteristic attack patterns, yet still faces challenges in scenarios with extreme class imbalance and low-separability attacks. These findings provide clear directions for future improvements, including the introduction of resampling strategies, cost-sensitive learning, or enhanced representational separation.

4.4.3. Ablation Experiments

To further validate the effectiveness of the proposed hybrid optimal transport objective, an ablation study was conducted to independently assess the contributions of the Wasserstein Distance (WD) and the Gromov–Wasserstein Distance (GWD). Specifically, three variants were constructed: (i) WD + GWD (the full model), (ii) only WD, and (iii) only GWD. The experiments were performed on two representative datasets, and the results are reported in Table 9. In addition, to further investigate the impact of structural context, we conducted additional experiments under different subgraph sampling ranges (i.e., 1-hop, 2-hop, and 3-hop neighborhoods), and the results are reported in Table 10.
As shown in Table 9, the combined WD + GWD model consistently achieves the best performance across both datasets. On NF-BoT-IoT, removing GWD leads to a decrease of 1.42% in F1-score and 1.73% in DR, while removing WD results in drops of 1.61% and 1.81%, respectively. On NF-ToN-IoT, the performance degradation is more pronounced: using only WD reduces the F1-score by 4.72% and DR by 1.65%, while using only GWD leads to decreases of 5.20% and 0.85%, respectively. These results indicate that WD and GWD capture complementary aspects of the data, and their combination significantly enhances detection performance. Furthermore, the results under different sampling ranges show that the model achieves the best overall performance when the sampling range is set to 2 (F1-score = 0.9604, DR = 0.9707). When the range is reduced to 1, the F1-score decreases by 1.41%, indicating insufficient neighborhood information. In contrast, increasing the range to 3 leads to a smaller decline of 0.51%, suggesting that excessive neighborhood expansion may introduce redundant or noisy information.
In summary, the ablation results confirm that both WD and GWD play essential and complementary roles in the proposed framework. Meanwhile, the analysis of different sampling ranges further demonstrates that an appropriate receptive field is crucial for balancing local feature representation and structural context. The integration of these two optimal transport measures significantly enhances detection performance, thereby justifying the design of the hybrid contrastive objective.

4.4.4. Computational Efficiency Analysis

To evaluate the practicality of the proposed method in real-world large-scale network traffic scenarios, a comprehensive computational efficiency analysis is conducted, covering training time and memory consumption. The results are reported in Table 11.
The total training time is 1157.97 s, with an average per-epoch time of 0.5035 s, indicating efficient training under iterative subgraph sampling. In terms of memory usage, CPU memory increases slightly by 128.82 MB (from 15,240.03 MB to 15,368.85 MB). GPU allocated memory rises from 0.34 MB to 31.04 MB (+30.70 MB), while reserved memory increases from 2.00 MB to 86.00 MB (+84.00 MB). Overall, the method achieves a favorable balance between computational cost and performance, demonstrating good scalability for large-scale network traffic anomaly detection.

5. Conclusions

To achieve effective anomaly detection of network traffic in real-world network environments, this chapter proposes a graph neural network framework based on a self-supervised learning paradigm, termed EGSCA. This method integrates generative graph contrastive learning with an enhanced graph neural network architecture. Subgraph samples are constructed using a breadth-first strategy, and the contrastive loss function is designed by incorporating the Wasserstein distance and the Gromov–Wasserstein distance, which constrain the representation learning process from the perspectives of feature distribution consistency and topological structure similarity, respectively. In this way, high-quality graph representations are optimised under unsupervised conditions. At the model architecture level, node features and edge features are jointly propagated and aggregated via the graph neural network, effectively capturing the correlations among critical flows and enhancing the expressive power regarding the topological structure and semantic information of network traffic. Meanwhile, an attribute-based auxiliary self-supervised task is introduced to improve the consistency and discriminability within the representation space, further strengthening the robustness and generalisation capability of the model for anomaly detection. Experimental results on multiple public datasets validate the effectiveness and stability of the proposed framework. Notably, in binary classification tasks on the NF-BoT-IoT and NF-BoT-IoT-v2 datasets, the detection performance approaches the theoretical optimum. In multi-class experiments on the NF-CSE-CIC-IDS2018-v2 dataset, the model achieves a weighted average F1-score of 0.9918 and a detection rate (DR) of 0.9939. Further analysis of the multi-class results indicates that the model’s performance is highly sensitive to the data distribution structure; its latent discriminative potential can be fully unleashed under conditions of favourable class separability, and it exhibits superior recognition effectiveness for high-frequency, strongly characteristic attack types.

Author Contributions

The contributions of all authors in various aspects are as shown below. These authors all played indispensable roles in the development of the article. Investigation and research, M.Y. and C.L.; Concept introduction M.Y.; Methodology, M.Y.; Data Organization, M.Y.; Formatted Analysis, C.L.; Resources, M.Y. and C.L.; Regulation, M.Y.; Project Management, C.L.; Software, M.Y.; Verification, M.Y. and C.L.; Original Draft, M.Y.; Writing and Editing, M.Y. and C.L. All authors have read and agreed to the published version of the manuscript.

Funding

This research was supported by the Sichuan Natural Science Foundation Project (No. 2025ZNSFSC0503), the Research Project of Leshan Normal University (No. JG2024-35).

Data Availability Statement

The datasets generated and analysed during the current study are available in the Machine Learning-Based NIDS Datasets repository, this link is https://staff.itee.uq.edu.au/marius/NIDS_datasets/ (accessed on 5 November 2024). The other datasets used and analysed during the current study are available from the corresponding author on reasonable request.

Acknowledgments

The authors of the paper sincerely appreciate anonymous reviewers who review this manuscript and provided constructive comments. We also thank the editors and everyone who provided support during the development of this paper.

Conflicts of Interest

The authors declare that they have no competing interest.

References

  1. Guo, R.; Li, A.; Liu, H. An Adversarial Attack Detection Method Based on Bidirectional Consistency Discrimination for Deep Learning-Based Soft Sensors. In Proceedings of the 2025 CAA Symposium on Fault Detection, Supervision, and Safety for Technical Processes (SAFEPROCESS); IEEE: New York, NY, USA, 2025; pp. 1–6. [Google Scholar]
  2. Nalini, M.; Yamini, B.; Ambhika, C.; Siva Subramanian, R. Enhancing early attack detection: Novel hybrid density-based isolation forest for improved anomaly detection. Int. J. Mach. Learn. Cybern. 2025, 16, 3429–3447. [Google Scholar] [CrossRef] [Scilit]
  3. Zhong, M.; Lin, M.; Zhang, C.; Xu, Z. A survey on graph neural networks for intrusion detection systems: Methods, trends and challenges. Comput. Secur. 2024, 141, 103821. [Google Scholar] [CrossRef] [Scilit]
  4. Alshehri, S.M.; Sharaf, S.A.; Molla, R.A. Systematic review of graph neural network for malicious attack detection. Information 2025, 16, 470. [Google Scholar] [CrossRef] [Scilit]
  5. Sun, Z.; Teixeira, A.M.; Toor, S. GNN-IDS: Graph neural network based intrusion detection system. In Proceedings of the 19th International Conference on Availability, Reliability and Security; Association for Computing Machinery: New York, NY, USA, 2024; pp. 1–12. [Google Scholar]
  6. Li, R.; Shen, H.; Zhang, Q.; Duan, H. An edge-enhanced graphSAGE-based intrusion detection model for the internet of things. Clust. Comput. 2025, 28, 309. [Google Scholar] [CrossRef] [Scilit]
  7. Tran, D.H.; Park, M. FN-GNN: A novel graph embedding approach for enhancing graph neural networks in network intrusion detection systems. Appl. Sci. 2024, 14, 6932. [Google Scholar] [CrossRef] [Scilit]
  8. Lin, L.; Zhong, Q.; Qiu, J.; Liang, Z. E-GRACL: An IoT intrusion detection system based on graph neural networks. J. Supercomput. 2025, 81, 42. [Google Scholar] [CrossRef] [Scilit]
  9. Hamilton, W.; Ying, Z.; Leskovec, J. Inductive representation learning on large graphs. In Advances in Neural Information Processing Systems; Curran Associates, Inc.: Red Hook, NY, USA, 2017; Volume 30. [Google Scholar]
  10. Sagar, N.; Shambharkar, P.G.; Mehra, P.S. GNN-FedGAN: A GNN-Enhanced federated GAN for anomaly detection in IoT security. In Artificial Intelligence and Sustainable Innovation; CRC Press: Boca Raton, FL, USA, 2026; pp. 195–203. [Google Scholar]
  11. Farrukh, Y.A.; Wali, S.; Khan, I.; Bastian, N.D. XG-NID: Dual-modality network intrusion detection using a heterogeneous graph neural network and large language model. Expert Syst. Appl. 2025, 287, 128089. [Google Scholar] [CrossRef] [Scilit]
  12. Ma, Z.; Liu, Y.; Chen, Y.; Liu, Z.; Li, Y. XMF-GNN: A cross-modality dynamic fusion heterogeneous graph neural network for network intrusion detection. Neurocomputing 2025, 655, 131285. [Google Scholar] [CrossRef] [Scilit]
  13. Xu, H.; Geng, X.; Liu, J.; Lu, Z.; Jiang, B.; Liu, Y. A novel approach for detecting malicious hosts based on RE-GCN in intranet. Cybersecurity 2024, 7, 69. [Google Scholar] [CrossRef] [Scilit]
  14. Luša, R.; Pintar, D.; Vranić, M. TE-G-SAGE: Explainable Edge-Aware Graph Neural Networks for Network Intrusion Detection. Modelling 2025, 6, 165. [Google Scholar] [CrossRef] [Scilit]
  15. Lo, W.W.; Layeghy, S.; Sarhan, M.; Gallagher, M.; Portmann, M. E-graphsage: A graph neural network based intrusion detection system for iot. In Proceedings of the NOMS 2022—2022 IEEE/iFIP Network Operations and Management Symposium; IEEE: New York, NY, USA, 2022; pp. 1–9. [Google Scholar]
  16. You, Y.; Chen, T.; Sui, Y.; Chen, T.; Wang, Z.; Shen, Y. Graph contrastive learning with augmentations. Adv. Neural Inf. Process. Syst. 2020, 33, 5812–5823. [Google Scholar]
  17. Zhu, Y.; Xu, Y.; Yu, F.; Liu, Q.; Wu, S.; Wang, L. Graph contrastive learning with adaptive augmentation. In Proceedings of the Web Conference 2021; Association for Computing Machinery: New York, NY, USA, 2021; pp. 2069–2080. [Google Scholar]
  18. Zhu, Y.; Xu, Y.; Yu, F.; Liu, Q.; Wu, S.; Wang, L. Deep graph contrastive representation learning. arXiv 2020, arXiv:2006.04131. [Google Scholar] [CrossRef] [Scilit]
  19. Guerra, L.; Chapuis, T.; Duc, G.; Mozharovskyi, P.; Nguyen, V.T. Self-Supervised Learning of Graph Representations for Network Intrusion Detection. arXiv 2025, arXiv:2509.16625. [Google Scholar] [CrossRef] [Scilit]
  20. Caville, E.; Lo, W.W.; Layeghy, S.; Portmann, M. Anomal-E: A self-supervised network intrusion detection system based on graph neural networks. Knowl.-Based Syst. 2022, 258, 110030. [Google Scholar] [CrossRef] [Scilit]
  21. Velickovic, P.; Fedus, W.; Hamilton, W.L.; Liò, P.; Bengio, Y.; Hjelm, R.D. Deep graph infomax. Stat 2018, 1050, 21. [Google Scholar]
  22. Chen, Z.; Zou, H.; Hu, T.; Fang, X.; Zheng, J.; Li, J.; Pan, Y. A network intrusion detection system based on self-supervised learning of traffic differentiation in Internet of Things. Eng. Appl. Artif. Intell. 2025, 160, 111973. [Google Scholar] [CrossRef] [Scilit]
  23. Fan, G.; Huang, Q.; Ma, J.; Hafiz Muhammad Sanaullah, B.; Zhang, C.; Yuan, K. Anomal-EFD: A self-supervised model for anomaly detection in dynamic IoT networks. Peer-to-Peer Netw. Appl. 2026, 19, 33. [Google Scholar] [CrossRef] [Scilit]
  24. Diao, H.; Li, X.; Zhang, W.; Yu, Y.S.; Wang, Y.; Zhang, J. Self-supervised graph neural networks for network intrusion detection in cloud-edge collaboration environments. J. Cloud Comput. 2026, 15, 29. [Google Scholar] [CrossRef] [Scilit]
  25. Xu, R.; Wu, G.; Wang, W.; Gao, X.; He, A.; Zhang, Z. Applying self-supervised learning to network intrusion detection for network flows with graph neural network. Comput. Netw. 2024, 248, 110495. [Google Scholar] [CrossRef] [Scilit]
  26. Hu, J.; Wang, S.; Duan, J.; Jin, H.; Liu, X.; Zhu, E. Higher-order Enhanced Contrastive-based Graph Anomaly Detection Without Graph Augmentation. Pattern Recognit. 2025, 167, 111666. [Google Scholar] [CrossRef] [Scilit]
  27. Wu, W.; Gu, Y. Advancing unsupervised graph anomaly detection: A multi-level contrastive learning framework to mitigate local consistency deception. Neurocomputing 2025, 646, 130507. [Google Scholar] [CrossRef] [Scilit]
  28. Hou, Z.; Liu, X.; Cen, Y.; Dong, Y.; Yang, H.; Wang, C.; Tang, J. Graphmae: Self-supervised masked graph autoencoders. In Proceedings of the 28th ACM SIGKDD Conference on Knowledge Discovery and Data Mining; Association for Computing Machinery: New York, NY, USA, 2022; pp. 594–604. [Google Scholar]
  29. Han, Y.; Hui, L.; Jiang, H.; Qian, J.; Xie, J. Generative subgraph contrast for self-supervised graph representation learning. In Proceedings of the European Conference on Computer Vision; Springer: Berlin/Heidelberg, Germany, 2022; pp. 91–107. [Google Scholar]
  30. Peyré, G.; Cuturi, M.; Solomon, J. Gromov-wasserstein averaging of kernel and distance matrices. In Proceedings of the International Conference on Machine Learning; PMLR: Cambridge, MA, USA, 2016; pp. 2664–2672. [Google Scholar]
  31. Sarhan, M.; Layeghy, S.; Moustafa, N.; Portmann, M. Netflow datasets for machine learning-based network intrusion detection systems. In Proceedings of the International Conference on Big Data Technologies and Applications; Springer: Berlin/Heidelberg, Germany, 2020; pp. 117–135. [Google Scholar]
  32. Sarhan, M.; Layeghy, S.; Portmann, M. Towards a standard feature set for network intrusion detection system datasets. Mob. Netw. Appl. 2022, 27, 357–370. [Google Scholar] [CrossRef] [Scilit]
  33. Sharafaldin, I.; Lashkari, A.H.; Ghorbani, A.A. Toward generating a new intrusion detection dataset and intrusion traffic characterization. In Proceedings of the 4th International Conference on Information Systems Security and Privacy (ICISSP 2018); SCITEPRESS—Science and Technology Publications, Lda.: Setúbal, Portugal, 2018; Volume 1, pp. 108–116. [Google Scholar]
  34. Chicco, D.; Jurman, G. The advantages of the Matthews correlation coefficient (MCC) over F1 score and accuracy in binary classification evaluation. BMC Genom. 2020, 21, 6. [Google Scholar] [CrossRef] [Scilit]
  35. Goodfellow, I.; Bengio, Y.; Courville, A.; Bengio, Y. Deep Learning; MIT Press: Cambridge, MA, USA, 2016; Volume 1. [Google Scholar]
  36. Xin, Y.; Kong, L.; Liu, Z.; Chen, Y.; Li, Y.; Zhu, H.; Gao, M.; Hou, H.; Wang, C. Machine learning and deep learning methods for cybersecurity. IEEE Access 2018, 6, 35365–35381. [Google Scholar] [CrossRef] [Scilit]
  37. Mirsky, Y.; Doitshman, T.; Elovici, Y.; Shabtai, A. Kitsune: An ensemble of autoencoders for online network intrusion detection. arXiv 2018, arXiv:1802.09089. [Google Scholar] [CrossRef] [Scilit]
  38. Nguyen, H.; Kashef, R. TS-IDS: Traffic-aware self-supervised learning for IoT Network Intrusion Detection. Knowl.-Based Syst. 2023, 279, 110966. [Google Scholar] [CrossRef] [Scilit]
Figure 1. The architecture of EGSCA.
Electronics 15 02119 g001
Figure 2. Framework of the Self-Supervised GNN Encoder EGSC.
Electronics 15 02119 g002
Figure 3. Pre-processing and graph generation method.
Electronics 15 02119 g003
Figure 4. Comparison of binary classification performance of the model on four datasets.
Electronics 15 02119 g004
Figure 5. Confusion matrices of the model’s multi-classification results on NF-BoT-IoT and NF-BoT-IoT-v2.
Electronics 15 02119 g005
Figure 6. Confusion matrices of the model’s multi-classification results on NF-CSE-CIC-IDS2018-v2.
Electronics 15 02119 g006
Figure 7. Comparison histogram of multi-class classification performance between the EGSCA model and existing algorithms.
Electronics 15 02119 g007
Table 1. Comparison of different methods for network traffic anomaly detection.
CriterionSupervisedSelf-SupervisedEGSCA (Ours)
Label RequirementFull labelsNo labelsNo labels
Feature-Structure AlignmentLimitedPartialStrong (WD + GWD)
Imbalance SensitivityHighModerateModerate
Multi-class CapabilityModerateModerateStrong (complex attack patterns)
Typical StrengthLabel-rich, binaryLabel-scarce, representationLabel-scarce, robust in complex multi-class scenarios
Table 2. Hyperparameter Settings of the EGSCA Model.
HyperparameterValue
Number of Layers K1
Learning Rate1 × 10−3
Activation FunctionReLU
Loss FunctionBCE/CE
OptimizerAdam
Table 3. Evaluation metrics used.
MetricDefinition
 Accuracy T P + T N T P + F P + T N + F N
 Precision T P T P + F P
 Detection Rate (Recall) T P T P + F N
  F 1 2 × Precision × Recall Precision + Recall
Table 4. Binary classification experimental results of the EGSCA model.
DatesetF1-ScoreDRAccuracyPrecision
NF-BoT-IoT0.99070.99900.98160.9825
NF-BoT-IoT-v20.99870.99960.99730.9997
NF-ToN-IoT0.96040.97070.93580.9520
NF-CSE-CIC-IDS2018-v20.98790.95900.99500.9991
Table 5. Binary classification performance comparison of the EGSCA model against state-of-the-art algorithms.
DatesetMethodsF1-ScoreDR
NF-BoT-IoTAnomal-E0.94400.9364
TS-IDS0.94670.9267
E-GraphSAGE0.78220.7933
NEGSC0.97690.9823
EGSCA0.99070.9990
NF-BoT-IoT-v2Anomal-E0.80160.8650
TS-IDS0.93450.9050
E-GraphSAGE0.94310.9827
NEGSC0.95150.9516
EGSCA0.99870.9996
NF-ToN-IoTAnomal-E0.85330.8771
TS-IDS0.99960.9992
E-GraphSAGE0.93690.9092
NEGSC0.95040.9519
EGSCA0.96040.9707
NF-CSE-CIC-IDS2018-v2Anomal-E0.91550.8538
TS-IDS0.99950.9885
E-GraphSAGE0.93550.9542
NEGSC0.97670.9776
EGSCA0.98790.9590
Table 6. Multi-classification experimental results of the EGSCA model on the NF-BoT-IoT and NF-BoT-IoT-v2 datasets.
NF-BoT-IoTNF-BoT-IoT-v2
Class NameF1-scoreDRF1-scoreDR
Benign0.19950.11420.66360.5626
DDoS0.15270.09830.98390.9505
DoS0.24850.19030.94250.9648
Reconnaissance0.89540.97230.68940.6076
Theft0.00000.00000.00000.0000
Weighted Average0.74490.79260.94400.9462
Table 7. Multi-classification experimental results of the EGSCA model on the NF-CSE-CIC-IDS2018-v2 dataset.
NF-CSE-CIC-IDS2018-v2
Class NameF1-scoreDR
Benign0.99690.9999
Bot0.99941.0000
Brute Force -Web0.00000.0000
Brute Force -XSS0.00000.0000
DDOS attack-HOIC0.99741.0000
DDOS attack-LOIC-UDP0.00000.0000
DDoS attacks-LOIC-HTTP0.99931.0000
DoS attacks-GoldenEye0.99941.0000
DoS attacks-Hulk0.99891.0000
DoS attacks-SlowHTTPTest0.66670.5000
DoS attacks-Slowloris1.00001.0000
FTP-BruteForce0.88011.0000
Infilteration0.25430.1462
SQL Injection0.00000.0000
SSH-Bruteforce1.00001.0000
Weighted Average0.99180.9939
Table 8. Comparison of multi-class classification performance between the EGSCA model and existing algorithms.
DatasetMethodsF1-ScoreDR
NF-CSE-CIC-IDS2018-v2TS-IDS0.98080.9903
E-GraphSAGE0.93550.9542
NEGSC0.97670.9776
EGSCA0.99180.9939
Table 9. Ablation study on WD and GWD.
MethodDatesetF1-ScoreDR
EGSCA (WD + GWD)NF-BoT-IoT0.99070.9990
EGSCA (only WD)NF-BoT-IoT0.97650.9817
EGSCA (only GWD)NF-BoT-IoT0.97460.9809
EGSCA (WD + GWD)NF-ToN-IoT0.96040.9707
EGSCA (only WD)NF-ToN-IoT0.91320.9542
EGSCA (only GWD)NF-ToN-IoT0.90840.9622
Table 10. Performance Comparison under Different Subgraph Sampling Ranges on NF-ToN-IoT.
Sampling RangesF1-ScoreDRAverage Score
EGSCA (2)0.96040.97070.96555
EGSCA (1)0.94630.98440.96535
EGSCA (3)0.95530.97490.96510
Table 11. Computational Efficiency Analysis of the Proposed Method on NF-BoT-IoT-v2.
MetricValue
Total Training Time1157.97 s
Per-epoch Time0.5035 s
CPU Memory (Before/After)15,240.03/15,368.85 MB
CPU Memory Increase128.82 MB
GPU Memory Allocated (Before/After)0.34/31.04 MB
GPU Memory Allocated Increase30.70 MB
GPU Memory Reserved (Before/After)2.00/86.00 MB
GPU Memory Reserved Increase84.00 MB
Disclaimer/Publisher’s Note: The statements, opinions and data contained in all publications are solely those of the individual author(s) and contributor(s) and not of MDPI and/or the editor(s). MDPI and/or the editor(s) disclaim responsibility for any injury to people or property resulting from any ideas, methods, instructions or products referred to in the content.