Article

Commutation Failure Immunity Mechanism and State-Aware Coordinated Protection Strategy for SLCC-HVDC in Weak Receiving-End Grids

1
State Grid Jiangsu Electric Power Co., Ltd., Nanjing 210024, China
2
Construction Branch Corporation, State Grid Jiangsu Electric Power Co., Ltd., Nanjing 210003, China
3
NR Electric Co., Ltd., Nanjing 211102, China
4
East China Electric Power Design Institute Co., Ltd., China Power Engineering Consulting Group, Shanghai 200063, China
5
School of Electric Power Engineering, Nanjing Institute of Technology, Nanjing 211167, China
*
Author to whom correspondence should be addressed.
Electronics 2026, 15(10), 2115; https://doi.org/10.3390/electronics15102115
Submission received: 25 February 2026 / Revised: 1 April 2026 / Accepted: 26 April 2026 / Published: 14 May 2026
(This article belongs to the Special Issue Modeling and Control of Power Converters for Power Systems)

Abstract

In weak receiving-end grids, the active support of the valve-side static var compensator and filter (SVF) extends the commutation failure (CF) boundary of LCC-HVDC. However, SVF control state transitions reshape valve-side voltage and harmonic characteristics, causing conventional fixed threshold protection to exhibit concurrent misblocking and failure to operate risks, while SVF zone internal faults are prone to excessive pole-level escalation. This paper proposes a state-aware coordinated protection strategy for symmetric single-pole SLCC-HVDC systems. A normalized commutation margin index, derived from the commutation voltage time integral, characterizes the nonlinear CF boundary under SVF support. SVF control mode, health status, and reactive power margin serve as conditioning variables for adaptive threshold and time window modification. A three-level escalation strategy—local isolation, derated ride-through, and pole-level action—is further designed for SVF zone faults. Validation via RTDS sequence of events records and EMT–protection logic replay co-simulation shows that the proposed index achieves a 100% CF risk prediction rate across five fault scenarios, versus 40% for conventional indices. The method maintains zero failure to operate with a misblocking rate ≤ 10.1% at SNR ≥ 30 dB. The staged response correctly escalates all four SVF zone fault types to the required level, compared with two of four for the fixed threshold baseline. These results confirm effective enhancement of protection robustness, fault ride-through capability, and operational continuity for SLCC-HVDC in weak receiving-end grids.

1. Introduction

Driven by carbon neutrality targets and the high penetration of renewable energy, the voltage stability support capability of cross-regional transmission corridors and receiving-end grids has become a critical factor in enhancing energy system security and resilience. Due to its large capacity, low losses, and favorable economics, thyristor-based line-commutated converter HVDC (LCC-HVDC) remains widely used for long-distance bulk power transmission. However, in multi-infeed and weak receiving-end scenarios, AC-DC coupling is significantly enhanced. Existing studies have shown that commutation failure (CF) risk is closely correlated with system strength [1,2], and that fault types and receiving-end voltage stability levels can significantly alter the CF triggering boundary [3,4]. CF not only causes DC power dips and recovery delays but may also affect adjacent AC and secondary systems through measurement errors, feature distortion, and protection coordination actions, further reducing transmission corridor availability and power supply continuity [5]. Therefore, enhancing the CF immunity and recovery resilience of LCC-HVDC under weak receiving-end fault conditions, without violating equipment protection constraints, has become a research problem of both theoretical significance and engineering urgency.
To suppress CF risk, existing research can broadly be divided into two categories. The first focuses on improving system strength and commutation voltage conditions. For example, synchronous condensers and series voltage regulation have been used to enhance voltage support during faults [6,7], sending-end voltage fluctuation suppression helps improve the commutation environment and mitigate adverse post-fault effects [8]. In addition, synchronized phasor measurement has been used to improve risk identification in multi-infeed scenarios [9]. The second category focuses on control and protection. Existing work has reduced the occurrence and propagation of subsequent commutation failures through DC current prediction and suppression control [10,11], adaptive current control [12], and chain reaction suppression [13]. Notably, the mechanism of sending-end voltage fluctuation and its suppression methods have been further extended in recent studies [14]. Meanwhile, CF prediction, detection, and identification methods continue to evolve. Prediction methods for asymmetric faults and predictive detection methods considering voltage harmonics have been reported [15,16], detection methods based on the energy change rate and high-accuracy identification algorithms have further improved fault identification capability [17,18], improved prediction methods for subsequent commutation failures are also being refined [19]. These studies provide an important foundation for CF risk assessment and control, but most still focus on system enhancement or event identification, with insufficient discussion of how protection input features are reshaped after active reactive power support intervention and how protection logic should be adaptively adjusted based on device states.
In recent years, with the development of power electronic auxiliary commutation, hybrid DC topologies, and intelligent protection technologies, HVDC protection research has been shifting from single quantity criteria toward multi-feature fusion and state-awareness. Regarding auxiliary commutation and topology innovation, some studies have pointed out that active support devices may introduce new coupling paths and side effects under specific fault types or control configurations [20]. Other work has shown that certain active commutation support devices or topological innovations can significantly mitigate or even eliminate CF risk [21,22]. In addition, recovery and suppression strategies after active support have provided new ideas for subsequent CF mitigation [23]. However, these works mainly focus on improving commutation performance itself, with limited discussion of how active support reshapes protection criteria.
In HVDC line protection, Xiao et al. proposed a disturbance blocking criterion for differential protection of LCC-HVDC lines [24]. Liu et al. proposed a non-unit protection method suitable for long-distance LCC-HVDC lines based on voltage traveling-wave waveform characteristics [25]. S. Deb et al. proposed an improved protection algorithm based on the transient energy signum function to enhance fault detection and classification for monopolar HVDC lines [26]. Lei et al. proposed a single-end line protection method based on boundary characteristic frequency band energy ratio for hybrid HVDC systems [27]. These works reflect the trend of HVDC protection transitioning from traditional amplitude-based criteria toward multi-feature combined criteria that integrate boundary characteristics, transient energy, and frequency band information. However, they primarily focus on line fault discrimination or transient feature extraction, which addresses a different problem dimension from the converter station protection mismatch under SVF active support studied in this paper.
In the data-driven direction, Liang et al. proposed a hybrid HVDC fault identification method based on wavelet packet energy spectra and convolutional neural networks (CNN), demonstrating that data-driven methods have good feature extraction capability under complex boundary conditions [28]. Such methods expand the feature space but likewise do not address the coordination between device state and protection thresholds.
In summary, the above studies have not yet systematically answered the following questions: when SVF active support causes valve-side voltage amplitude, phase, and harmonic characteristics to change simultaneously, why does conventional fixed threshold protection exhibit the concurrent mismatch of misblocking and failure to operate; and when SVF zone internal faults can be locally isolated, how should protection logic avoid unnecessary pole-level escalation?
From an engineering perspective, at least three research gaps exist in SVF active support scenarios. First, existing commutation risk criteria mostly rely on conventional quantities such as voltage magnitude or extinction angle and cannot directly characterize the nonlinear compensation mechanism of SVF fast reactive power injection on the commutation voltage time integral. Second, existing protection methods generally assume stable statistical properties of input features and rarely incorporate control mode, health status, and reactive power margin explicitly into protection threshold and time window tuning. Third, for SVF zone local faults, existing research lacks a unified coordination framework that jointly addresses local isolation priority, derated ride-through, and pole-level action escalation conditions. These shortcomings indicate that the protection problem for weak receiving-end SLCC-HVDC is no longer simply a discrimination problem of whether CF occurs but a comprehensive problem of how commutation physics, device state, and protection action logic work together.
To address the above issues, this paper takes the symmetric single-pole LCC-HVDC system with valve-side SVF under weak receiving-end conditions as the research subject and studies the commutation boundary changes, protection criteria mismatch, and local fault escalation under SVF active support. Unlike existing research that mainly focuses on system strength enhancement, CF detection and identification, or line fault discrimination, this paper aims to establish a unified coordinated protection framework integrating commutation physical quantities, device state quantities, and protection decision logic. Specifically, the main contributions of this paper are as follows:
(1)
A normalized commutation margin index is proposed based on the commutation voltage time integral to characterize the nonlinear extension of the CF boundary under SVF active support, and its intrinsic relationship with and essential differences from conventional voltage magnitude and extinction angle indices are clarified from a physical mechanism perspective.
(2)
A state-conditioned threshold modification method is proposed, incorporating SVF control mode, health status, and reactive power margin as explicit conditioning variables to achieve adaptive adjustment of protection thresholds and time windows, thereby reducing the risk of misblocking and failure to operate of fixed threshold protection during state transitions.
(3)
A local isolation derated ride-through–pole-level action staged response strategy is proposed for SVF zone internal faults to limit the fault impact range and improve system operational continuity.
The remainder of this paper is organized as follows. Section 2 analyzes the commutation boundary extension mechanism under SVF active support and explains the distinction between the normalized commutation margin index and conventional indices. Section 3 presents the state-conditioned threshold modification method and the staged response strategy. Section 4 validates the effectiveness and robustness of the proposed method through engineering SoE records and EMT–protection logic co-simulation replay. Section 5 provides conclusions and directions for future work.

2. Commutation Failure Boundary Analysis and Protection Mismatch Mechanism Under SVF Active Support

2.1. SVF Active Support, Commutation Boundary, and Normalized Margin Index

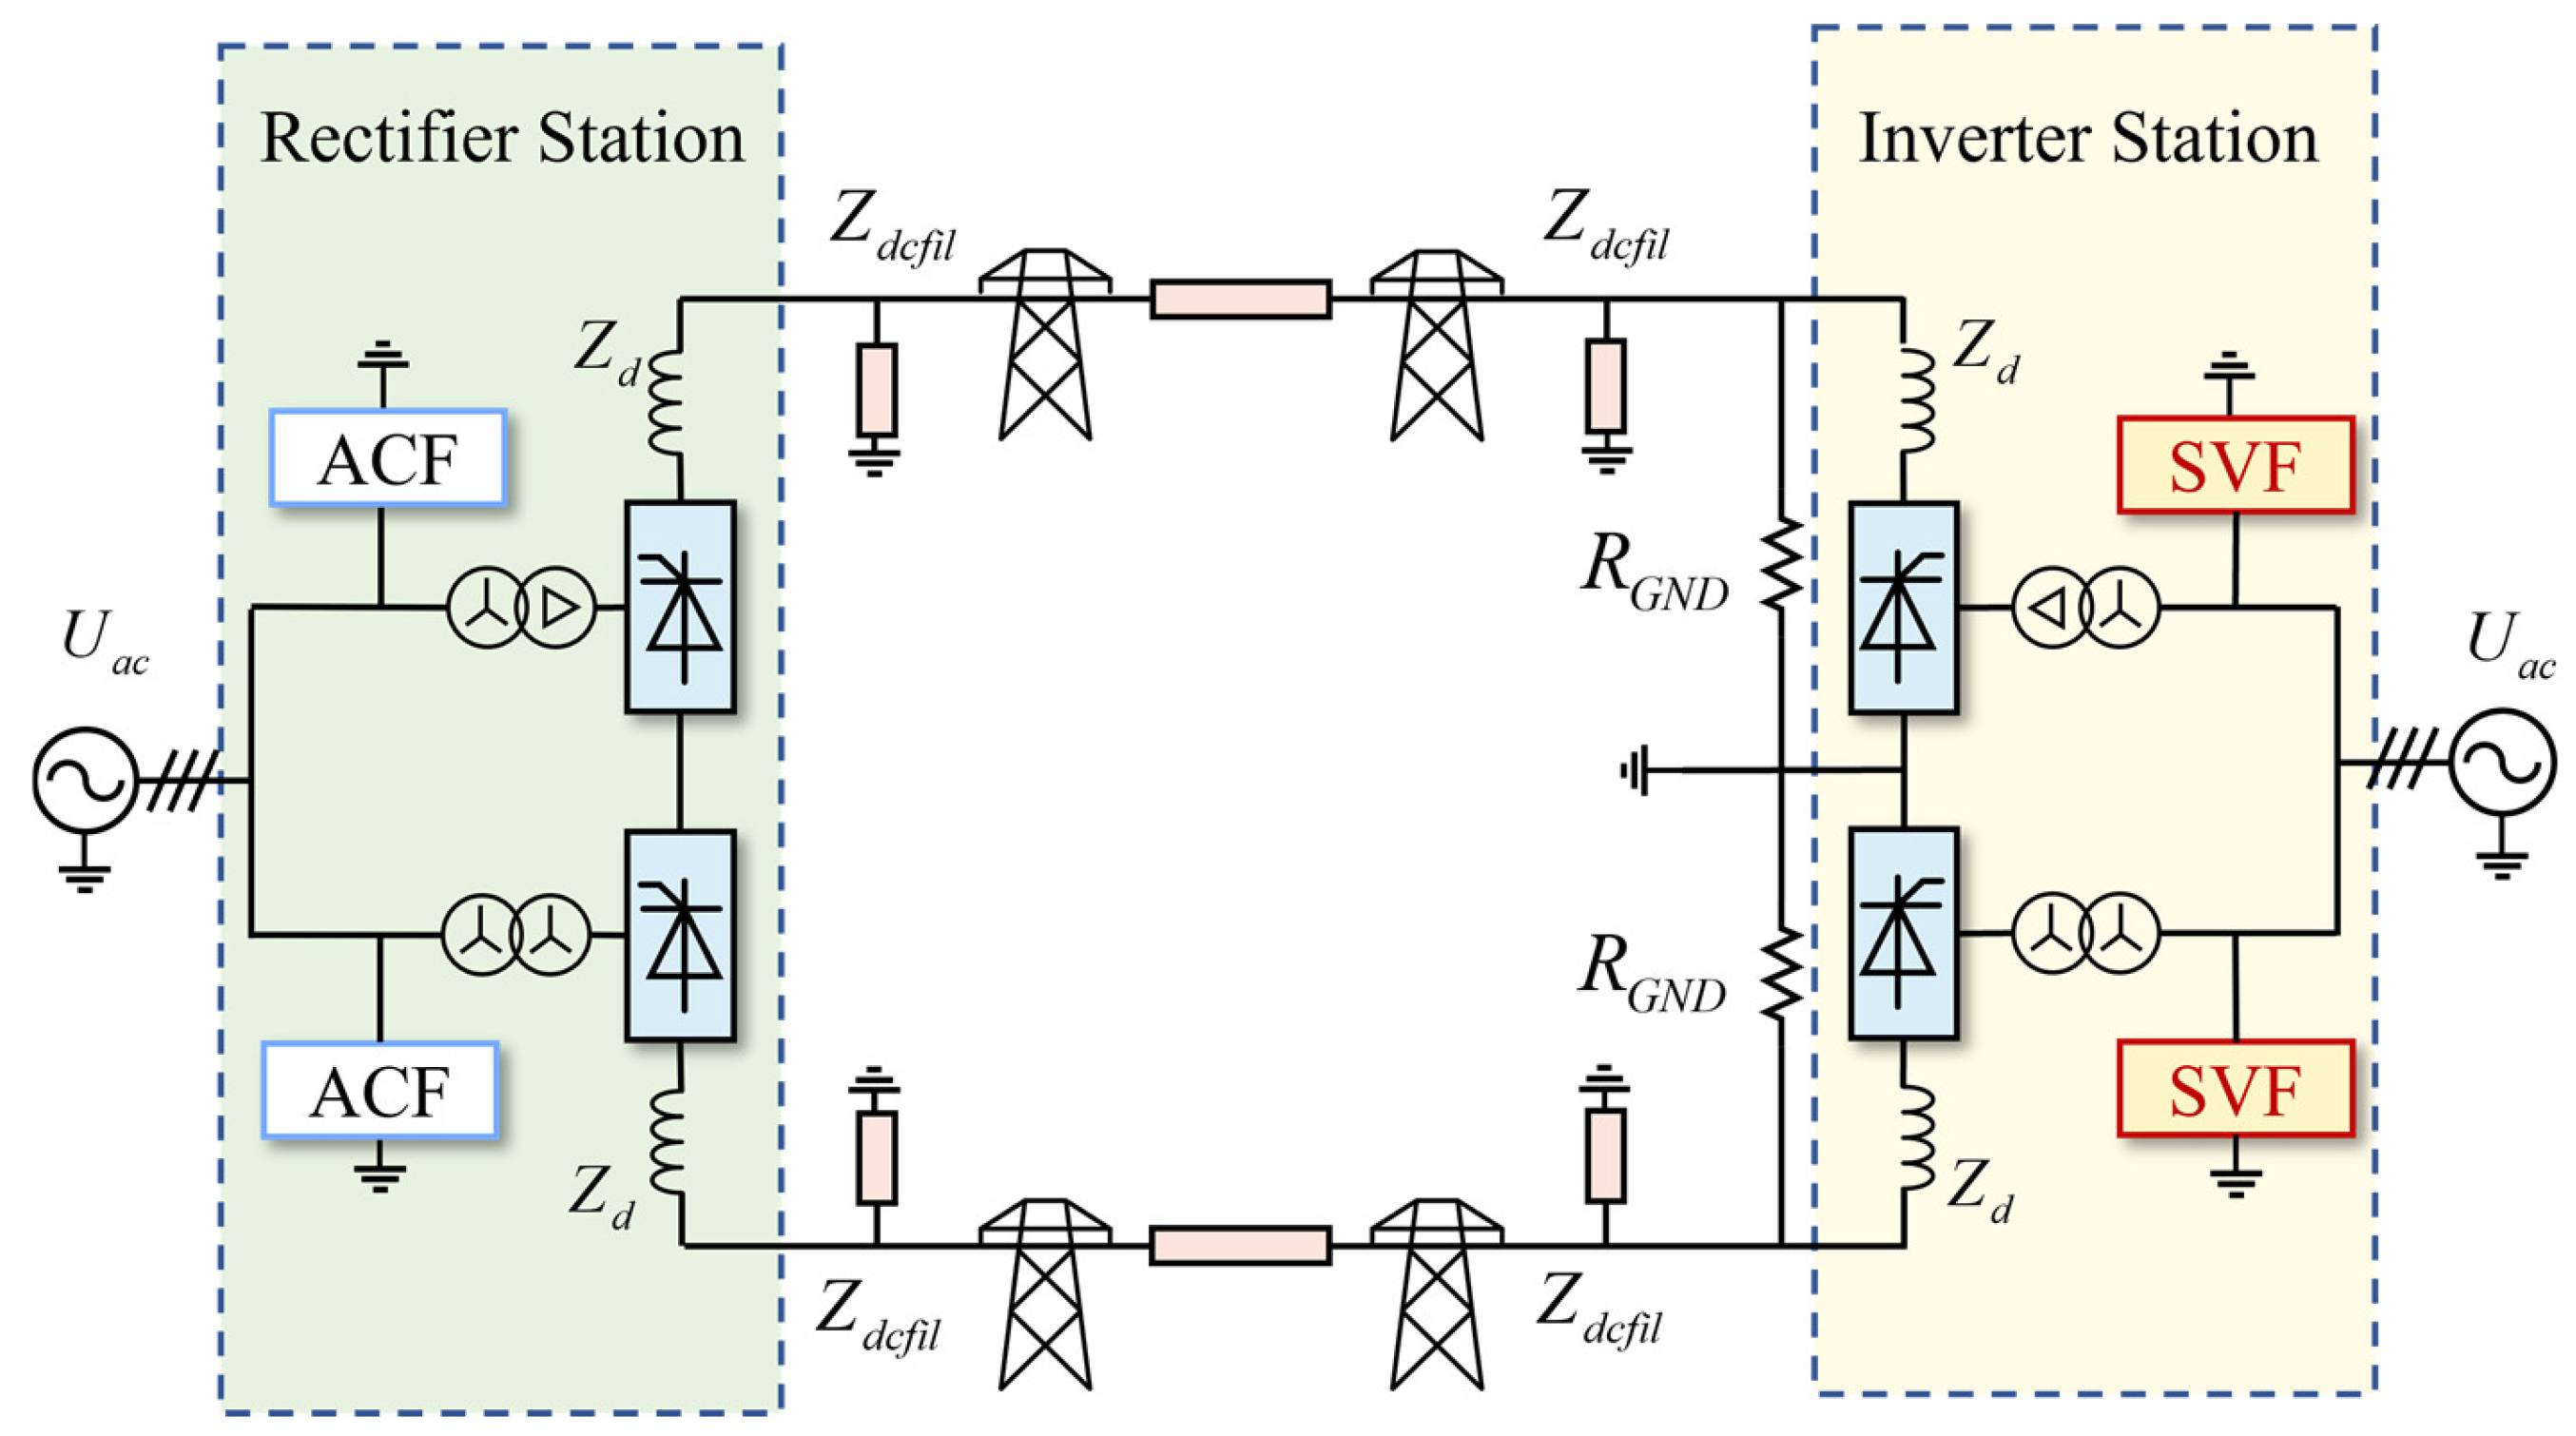
A symmetric single-pole SLCC-HVDC system comprises an LCC converter and a valve-side parallel SVF, which provides both reactive power support and filtering. During fault ride-through, the SVF modifies the valve-side voltage waveform and harmonic characteristics, influencing both the physical commutation process and the observable inputs to the protection system. Figure 1 illustrates the configuration of the studied symmetric monopole HVDC system with a single-side SLCC retrofit.
Commutation theory traditionally describes the commutation margin and CF risk using the overlap and extinction angles. Successful commutation fundamentally depends on whether the commutation voltage time integral (or commutation voltage time area) within the commutation window is sufficient to complete the DC current transfer. The commutation voltage time integral is defined as:
J c ( t ) = t t + T w u c ( τ ) d τ
where uc(t) is the commutation voltage and Tw is the commutation evaluation window. The normalized commutation margin is further defined as:
η c ( t ) = J c ( t ) L c I d c ( t ) + ϵ
where Lc is the equivalent commutation reactance, Idc(t) is the DC current, and ε is a small regularization constant (typically 10−6) to prevent division by zero during fault transients. When ηc(t) approaches or falls below 1, the commutation voltage time integral is insufficient, and CF risk increases. This quantity can be extracted directly from electromagnetic transient waveforms and is suitable as a quantifiable index linking waveform observation and commutation physics.
In SLCC, the SVF’s fast reactive power injection reshapes the valve-side voltage waveform:
u V ( t ) = u grid ( t ) + Δ u SVF ( t )
where uv(t) is the valve-side bus voltage and ΔuSVF(t) is the voltage component injected by SVF. Under quasi-steady-state (QSS) conditions, the voltage boost from SVF reactive power injection can be approximated as follows:
Δ u SVF ( t ) Q SVF ( t ) X e q U V ( t )
where QSVF(t) is the reactive power injected by SVF, Xeq is the equivalent system reactance seen from the SVF connection point, and Uv(t) denotes the RMS value of the valve-side bus voltage. The SVF simultaneously changes the amplitude, phase, and distortion characteristics of the valve-side voltage, thereby altering Jc(t) and ηc(t), and nonlinearly extending the CF boundary toward weak receiving-end conditions.
Remark 1
(Applicable Scope of the QSS Approximation). The QSS approximation in Equations (3) and (4) is primarily intended to analyze the influence of SVF active support on the commutation boundary and threshold modification trends, rather than for precise real-time margin calculation under extreme transients. Under severe voltage sags, strong harmonic distortion, or significant phase jumps, rapid voltage variations and harmonic reconstruction may reduce the numerical accuracy of the approximation. However, as long as it correctly captures the boundary trend (sufficient–critical–insufficient), its theoretical value for protection criteria design remains valid. Accordingly, this paper employs the QSS model only for deriving protection threshold boundaries and analyzing parameter influence mechanisms. The real-time protection quantity ηc is computed directly from sampled commutation voltage and DC current via time-domain integration, ensuring that approximation errors do not enter the online protection action chain. A detailed analysis of QSS approximation error sources and protection decision consistency is provided in Appendix B.
The minimum margin over the fault interval [tf, tc] is defined as:
η c , m i n = m i n t     [ t f , t c ] η c ( t )
The CF boundary is correspondingly defined on the parameter plane as:
η c , m i n = 1
Compared with conventional extinction angle or voltage magnitude indices, the proposed normalized commutation margin emphasizes the physical consistency among the commutation voltage time integral, DC current, and system reactance. It provides a stable nonlinear characterization of commutation capability under SVF active support.

Comparison with Conventional Indices

The normalized commutation margin index ηc is inherently consistent with conventional extinction angle and commutation voltage magnitude indices, as all three attempt to characterize the converter’s ability to complete current commutation. However, their physical focus differs. The voltage magnitude index is an amplitude-type indicator reflecting voltage support strength. The extinction angle index is an angle-type indicator reflecting the safety margin during thyristor turn-off. In contrast, ηc is a time area indicator that integrates the effects of commutation voltage, current, and reactance. It focuses on whether a sufficient voltage time integral has accumulated within the commutation window, aligning more directly with the physical constraints of the commutation process.
Under SVF active support, these differences are amplified. SVF reactive power injection alters the amplitude, phase, and harmonic characteristics of the valve-side voltage; its effect manifests through changes in the effective voltage time integral. When the SVF enters current limiting, saturation, withdrawal, or bypass states, the effective voltage time integral may decrease significantly even if the voltage magnitude remains relatively stable. Since ηc is constructed directly from the commutation voltage time integral, it more naturally captures this nonlinear compensation effect. Conversely, the conventional voltage magnitude index is susceptible to sliding-window smoothing, and its response to rapid state transitions often lags behind the true commutation process. The extinction angle index may be maintained near its setpoint by the controller, weakening its sensitivity to intermediate risk regions. Thus, ηc is better suited for characterizing the nonlinear deviation between voltage magnitude and commutation capability, as summarized in Table 1.

2.2. Mismatch Mechanism of Traditional Protection Criteria

Traditional LCC-HVDC protection assumes a stable positive correlation between voltage dip depth, DC disturbance, harmonic characteristics, and commutation margin. SVF active support breaks this statistical consistency in three respects.
First, voltage magnitude and commutation margin become decoupled. The SVF can rapidly raise measurable voltage during a fault, but due to phase jumps and waveform distortion, the time integral within the commutation window may still be insufficient. Thus, a voltage increase does not necessarily correspond to a synchronous enhancement of commutation capability.
Second, SVF state transitions cause feature non-stationarity. Current limiting, blocking, and control loop withdrawal alter uv(t), THD, and Q(t) at the millisecond level. Fixed threshold criteria cannot distinguish between fault-induced distortion and control loop mutations, leading to misblocking or failure to operate. The most affected elements are the commutation failure protection (CFP), low-voltage blocking criteria, and auxiliary criteria relying on harmonic or voltage features.
Third, local faults may be excessively escalated. SVF zone internal faults can generally be managed through local isolation or bypass. However, if protection logic cannot distinguish the fault impact range, these faults may be escalated to pole blocking or isolation, causing unintended outages.
In summary, voltage magnitude/commutation-margin decoupling, feature non-stationarity due to SVF state transitions, and excessive local fault escalation collectively constitute the starting point for the method design in this paper. Section 3 will propose state-conditioned threshold modification and staged response methods to address these issues.


3. State-Aware Coordinated Protection Method

This paper addresses the aforementioned mismatch from three dimensions: the normalized commutation margin provides a physics-level verification quantity; state-conditioned threshold modification handles feature non-stationarity; and staged response addresses excessive local fault escalation.

3.1. State-Conditioned Threshold Modification

Under SVF active support, protection input features vary with state transitions. The SVF operating state must therefore be explicitly incorporated into protection criteria to enable dynamic adaptation of thresholds and time windows.

3.1.1. State Vector Definition

The SVF protection-related state vector is defined as: Ssvf(t) = {Shealth, Qmargin}, where Shealth characterizes the status of key control loop switching and limiting functions—typical states include normal, current limiting, withdrawal, and bypass; Qmargin represents the available reactive power margin, defined as:
Q margin ( t ) = Q m a x Q cmd ( t ) Q m a x
where Qmax is the SVF reactive power output limit and Qcmd(t) is the current reactive power command. Qmargin reflects the remaining headroom in reactive power output.
These two state components characterize SVF support capability in terms of operational constraints and support headroom. To distinguish genuine degradation from measurement errors, a redundant consistency check mechanism is integrated into the state-sensing logic. This mechanism cross-validates Shealth with the measured Qmargin: if Shealth indicates degradation (level ≥ 2) but the reported Qmargin exceeds the rated capacity (a physical inconsistency), a suspicious-measurement flag is triggered, and the protection falls back to a conservative threshold. Table 2 presents the check results for five scenarios.
All five scenarios are correctly classified, confirming that the check logic effectively distinguishes genuine degradation, measurement deviation, and state conflict. When the suspicious flag is active, the protection automatically adopts a more conservative threshold to ensure safety, while logging the inconsistency for maintenance review.

3.1.2. Threshold Modification Rules

The core principle of state-conditioned threshold modification is to increase protection sensitivity (lower thresholds and shorter time windows) when SVF support capability decreases or feature stability deteriorates, thereby reducing missed-detection risk. Conversely, when the SVF is in a normal state with sufficient margin, protection criteria are moderately relaxed to suppress misoperation.
Specifically, threshold modification coefficient kθ and time window modification coefficient kT are defined. The modified threshold and time window are:
θ ( t ) = k ( S SVF ( t ) ) θ 0 , T ( t ) = k T ( S SVF ( t ) ) T 0
where θ0 and T0 are the nominal threshold and time window, and kθ, kT ∈ (0,1] are state-dependent modification coefficients. Table 3 provides an example of the state-conditioned threshold modification rules.

3.1.3. Characteristics of State-Conditioned Threshold Modification

State-conditioned threshold modification offers three key advantages. First, it reduces misblocking risk: when the SVF is in a normal state with sufficient commutation margin, transient feature variations due to control state transitions do not trigger excessive protection responses. Second, it reduces failure to operate risk: as SVF support capability decreases, thresholds tighten accordingly, ensuring that the protection responds promptly to commutation risk even if the voltage magnitude briefly rises. Third, the method is implemented via a state-threshold mapping table, providing high interpretability, auditability, and ease of engineering configuration.

3.2. Staged Response Decision

Conventional protection logic may excessively escalate SVF zone internal faults to pole-level actions. To address this, a staged response strategy with verifiable escalation conditions is designed.
In SLCC configurations, SVF zone internal faults—such as starting resistor faults or valve group connection line faults—can generally be managed through local isolation or bypass procedures. This allows the SVF to exit active support mode without affecting LCC valve zone operation. Escalation to pole-level actions is considered only when commutation constraints cannot be satisfied after local handling. Thus, the protection response must incorporate staged characteristics and a verifiable escalation mechanism.

3.2.1. Response Level Classification

Based on the preceding analysis, three response levels are defined:
  • Level I Response (Local Handling): SVF zone internal faults are identified by local protection, and isolation or bypass actions are executed. The impact is limited to the SVF zone, with no effect on the LCC valve zone.
  • Level II Response (Derated Ride-Through): After local handling, the SVF exits active support, and the system enters a derated ride-through state. The commutation margin is then evaluated to determine whether operational constraints are satisfied without SVF support.
  • Level III Response (Pole-Level Action): Pole blocking or isolation is executed only when derated ride-through fails to satisfy commutation constraints.
The three-level response classification adheres to the local priority principle: prioritizing the containment of fault impact range and expanding the action scope only when necessary.

3.2.2. Escalation Criteria and Tver Tuning Framework

Escalation from Level II to Level III requires satisfying verifiable escalation conditions. These conditions must balance premature escalation, which compromises system availability, and delayed escalation, which jeopardizes equipment safety.
This paper employs a condition persistence and time verification escalation mechanism: escalation conditions must be persistently met for a verification duration Tver before triggering a Level III response. Tuning Tver is a constrained problem where the lower bound is determined by the dynamic recovery process and the upper bound by equipment thermal capacity. A general tuning method is adopted:
Step 1: Determine the dynamic lower bound Tver,min. This bound must cover the transient recovery process after fault clearance, SVF control state switching, and measurement/communication latency:
Specific escalation conditions can be formalized as:
T v e r , m i n = max ( T f a u l t , m a x + T m e a s , k s c r T s e t t l e )
where Tfault,max is the typical fault clearance time, ΔTmeas is the measurement and communication margin, Tsettle is the transient time constant for key quantities (ηc, Qmargin, and valve-side voltage) to recover near steady state, and kscr is a correction factor reflecting system strength. A lower receiving-end SCR implies slower recovery and longer post-switching oscillations, necessitating a larger kscr and Tver,min.
Step 2: Determine the thermal stability upper bound Tver,max. This bound ensures that thermal and electrical stresses on relevant equipment remain within allowable limits during worst-case faults and derated ride-through:
T v e r , m a x = T t h e r m a l ( I r a t e s , S p r o j ) T a c t
where Tthermal is the thermal stability limit of relevant equipment under allowable overload conditions, and ΔTact is the reserved time for protection execution and circuit breaker operation. Sproj denotes the rated engineering capacity. For the same equipment design platform, higher rated capacity and current generally reduce the permissible thermal withstand time, thereby tightening the upper bound of Tver.
Step 3: Select the setting value between the bounds:
T v e r , m i n T v e r T v e r , m a x
In practice, the minimum feasible value satisfying this constraint is preferred to balance suppressing transient false escalation and avoiding excessive delays in pole-level action. For weak systems (low receiving-end SCR) or high measurement latency, Tver should be increased. Conversely, when equipment thermal stability margin is small or rated capacity is large, Tver should be reduced. The range 100–500 ms is a typical empirical range for weak receiving-end HVDC projects; the specific value must be determined by the general constraint relationship above.
The formal escalation condition is:
[ η c ( t ) < 1 δ ] T v e r [ Q m a r g i n ( t ) < Q m i n ] T v e r F m a n d a t o r y
where [·]≥T denotes that the condition is persistently satisfied for a duration exceeding T, and Fmandatory denotes mandatory action conditions from differential or converter protection. Level III escalation is triggered when ηc(t) < 1 − δ or Qmargin < Qmin persists beyond Tver, or when a mandatory action condition is met.

3.2.3. No De-Escalation Constraint

For safety, de-escalation from Level III is prohibited when differential protection remains active, converter protection blocking has not been released, or valve-zone equipment faults have not been isolated. This ensures that once pole-level actions are triggered, the system can only recover after the fault is fully resolved.

3.2.4. Characteristics of the Staged Response Strategy

The staged response strategy enhances operational continuity and recovery readiness while ensuring compliance with equipment protection constraints. For locally isolable SVF zone internal faults, the system can resume operation without pole-level actions. For severe faults requiring pole-level intervention, verifiable conditions guarantee both timely response and auditability.

3.3. Overall Coordinated Protection Flow

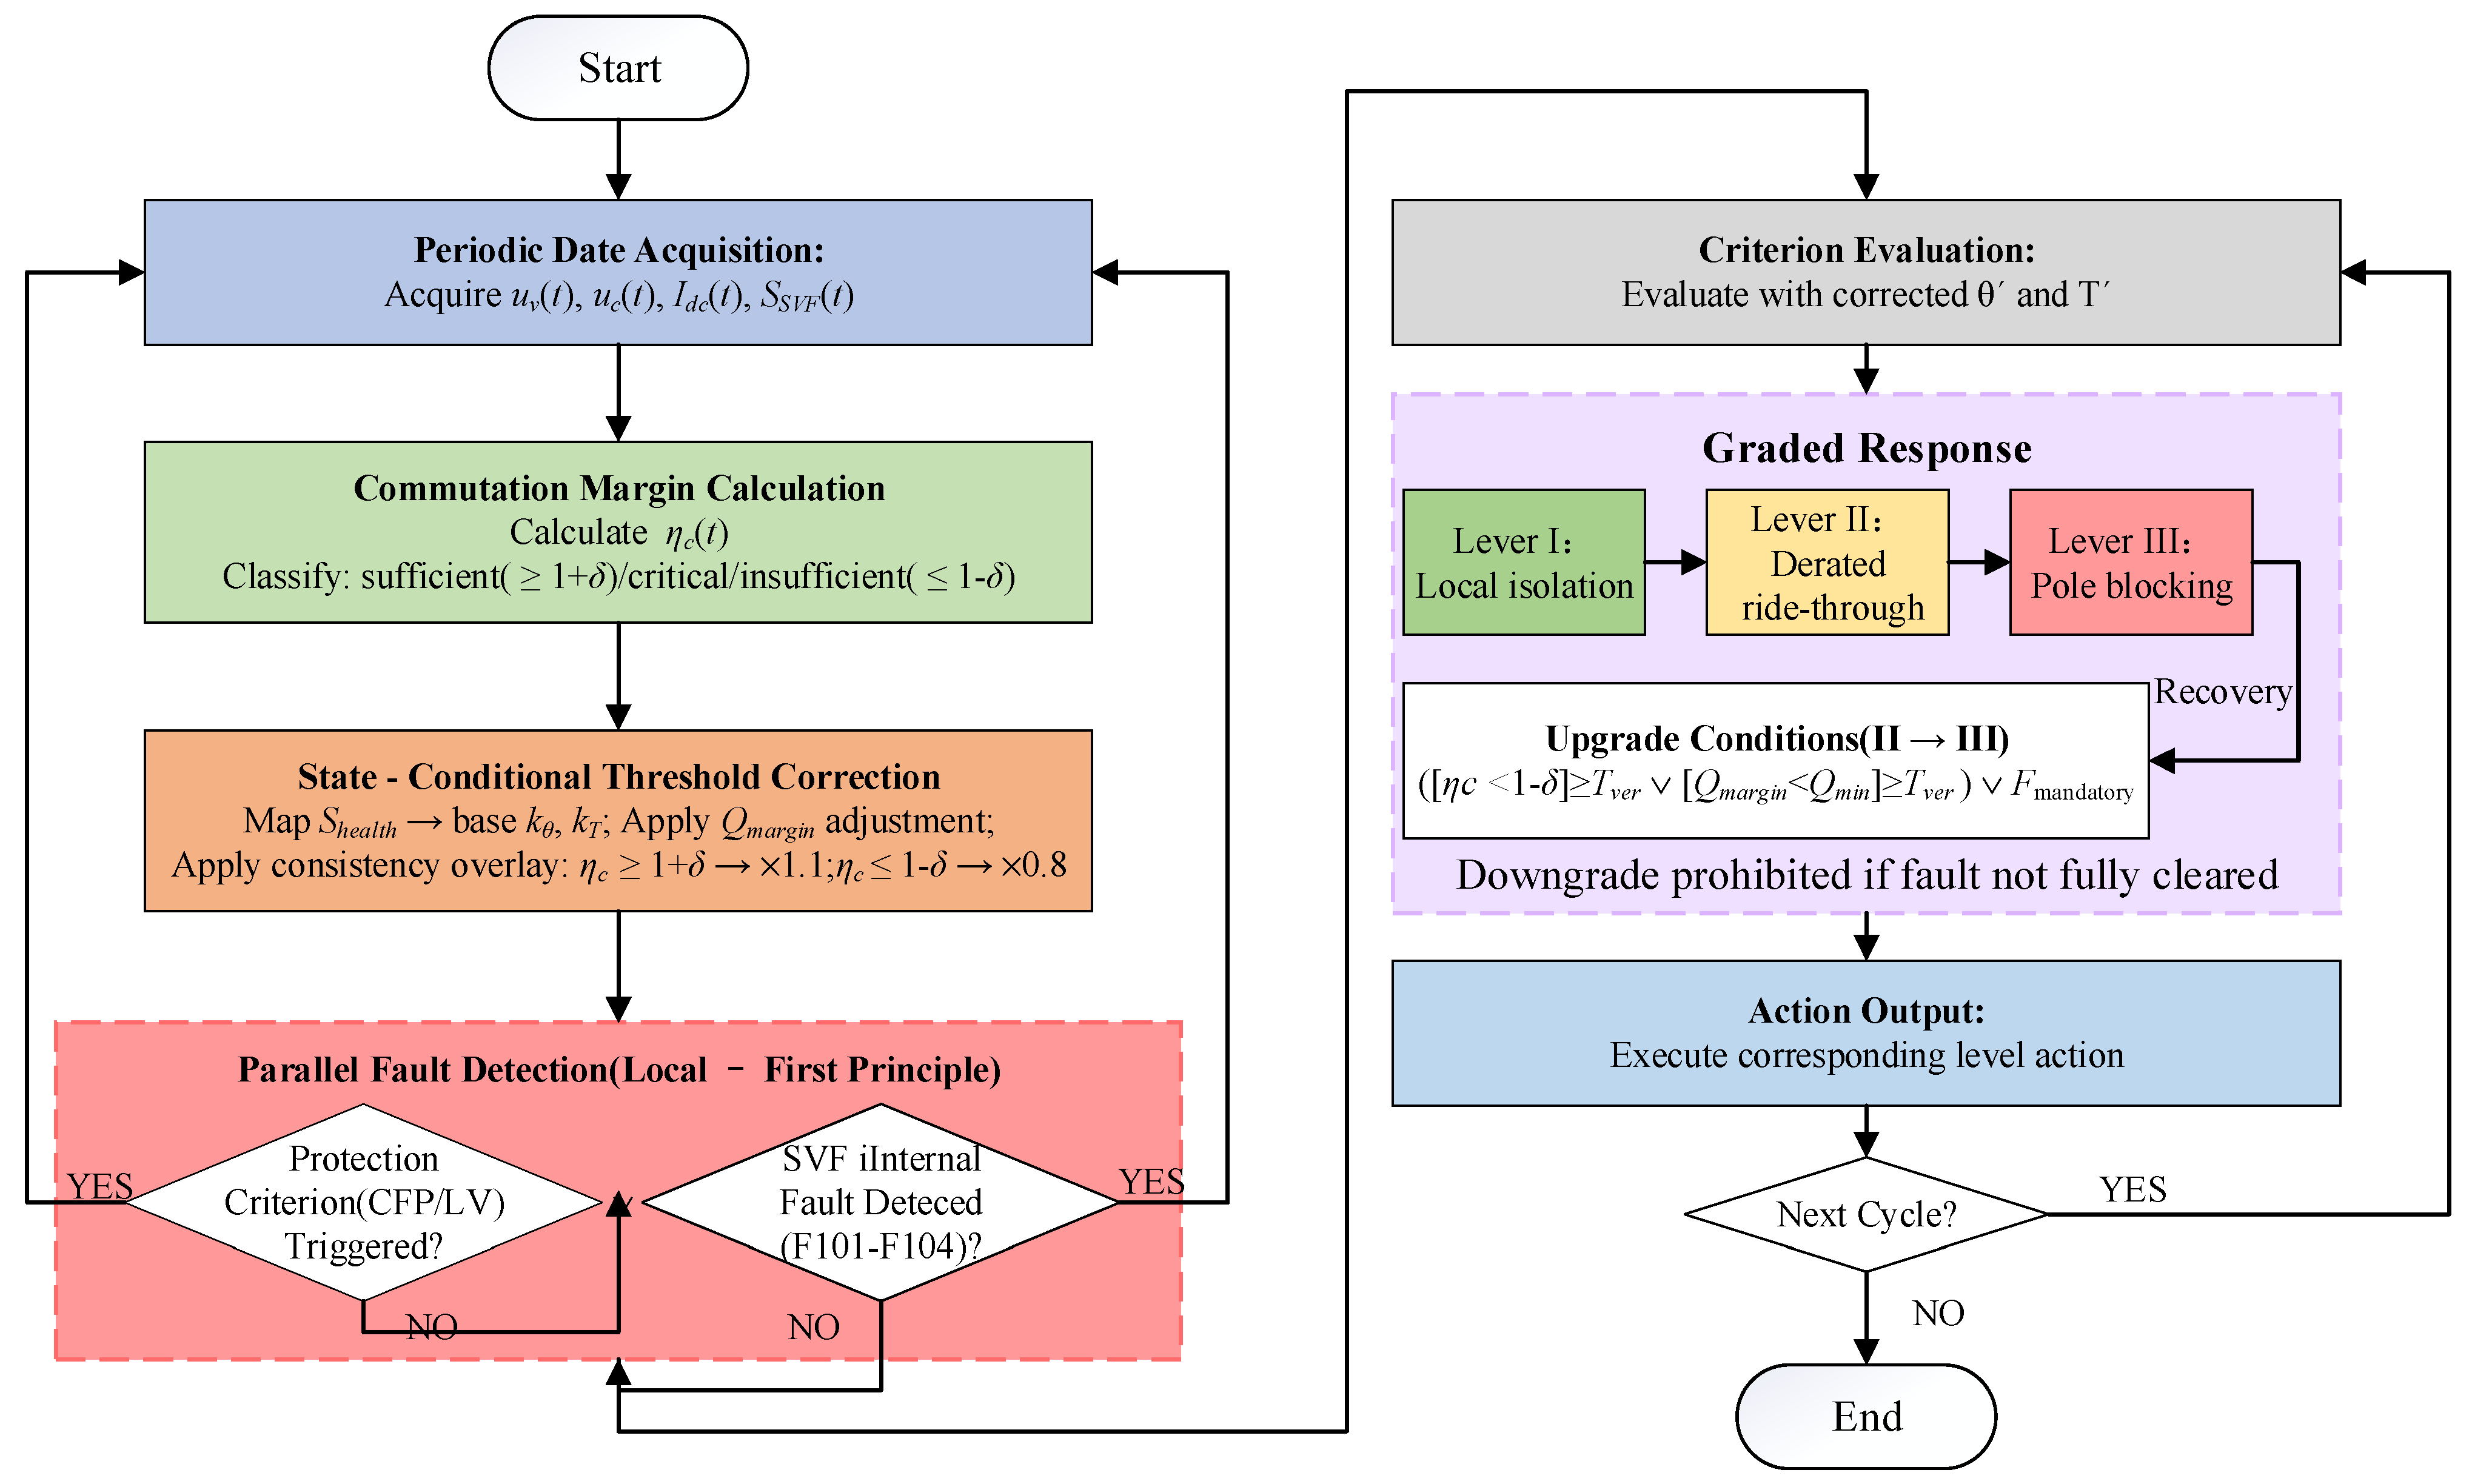
Integrating the two methods, the overall flow of the state-aware coordinated protection is as follows: the protection system periodically samples uv(t), uc(t), Idc(t), and SSVF(t). In each computational cycle, ηc(t) is calculated and classified. Threshold modification coefficients are then derived based on the SVF state and ηc(t) classification. CFP, low-voltage, and other protection conditions are evaluated using the modified thresholds. Finally, the response level is determined according to the staged response criteria, and corresponding actions are executed.
The three mechanisms are synergistic: the commutation margin index ηc(t) provides the physics-level input for both state-conditioned threshold modification and staged response; threshold modification improves criteria accuracy, reducing misjudgments in the staged response; and the local-priority principle and verifiable escalation mechanism in the staged response ensure a balance between safety and availability. The overall flow of state-aware coordinated protection is illustrated in Figure 2.

4. Verification Framework and Results

4.1. Simulation Platform and Verification Logic

This study employs a verification framework that integrates engineering sequence of events (SoE) data with electromagnetic transient (EMT) simulation. The verification process consists of two stages. First, actual RTDS closed-loop SoE records are analyzed to identify three types of mismatch phenomena in conventional fixed threshold protection under SVF active support, namely lagging protection function switching, non-stationary observable features caused by control loop state transitions, and excessive escalation of SVF zone local faults. Second, an EMT and protection logic replay co-simulation platform is established to evaluate the effectiveness and robustness of the proposed state-aware coordinated protection strategy against conventional baseline methods. This hardware-in-the-loop and real-time EMT co-simulation approach has been shown to provide high engineering validity in multi-station HVDC studies [29].
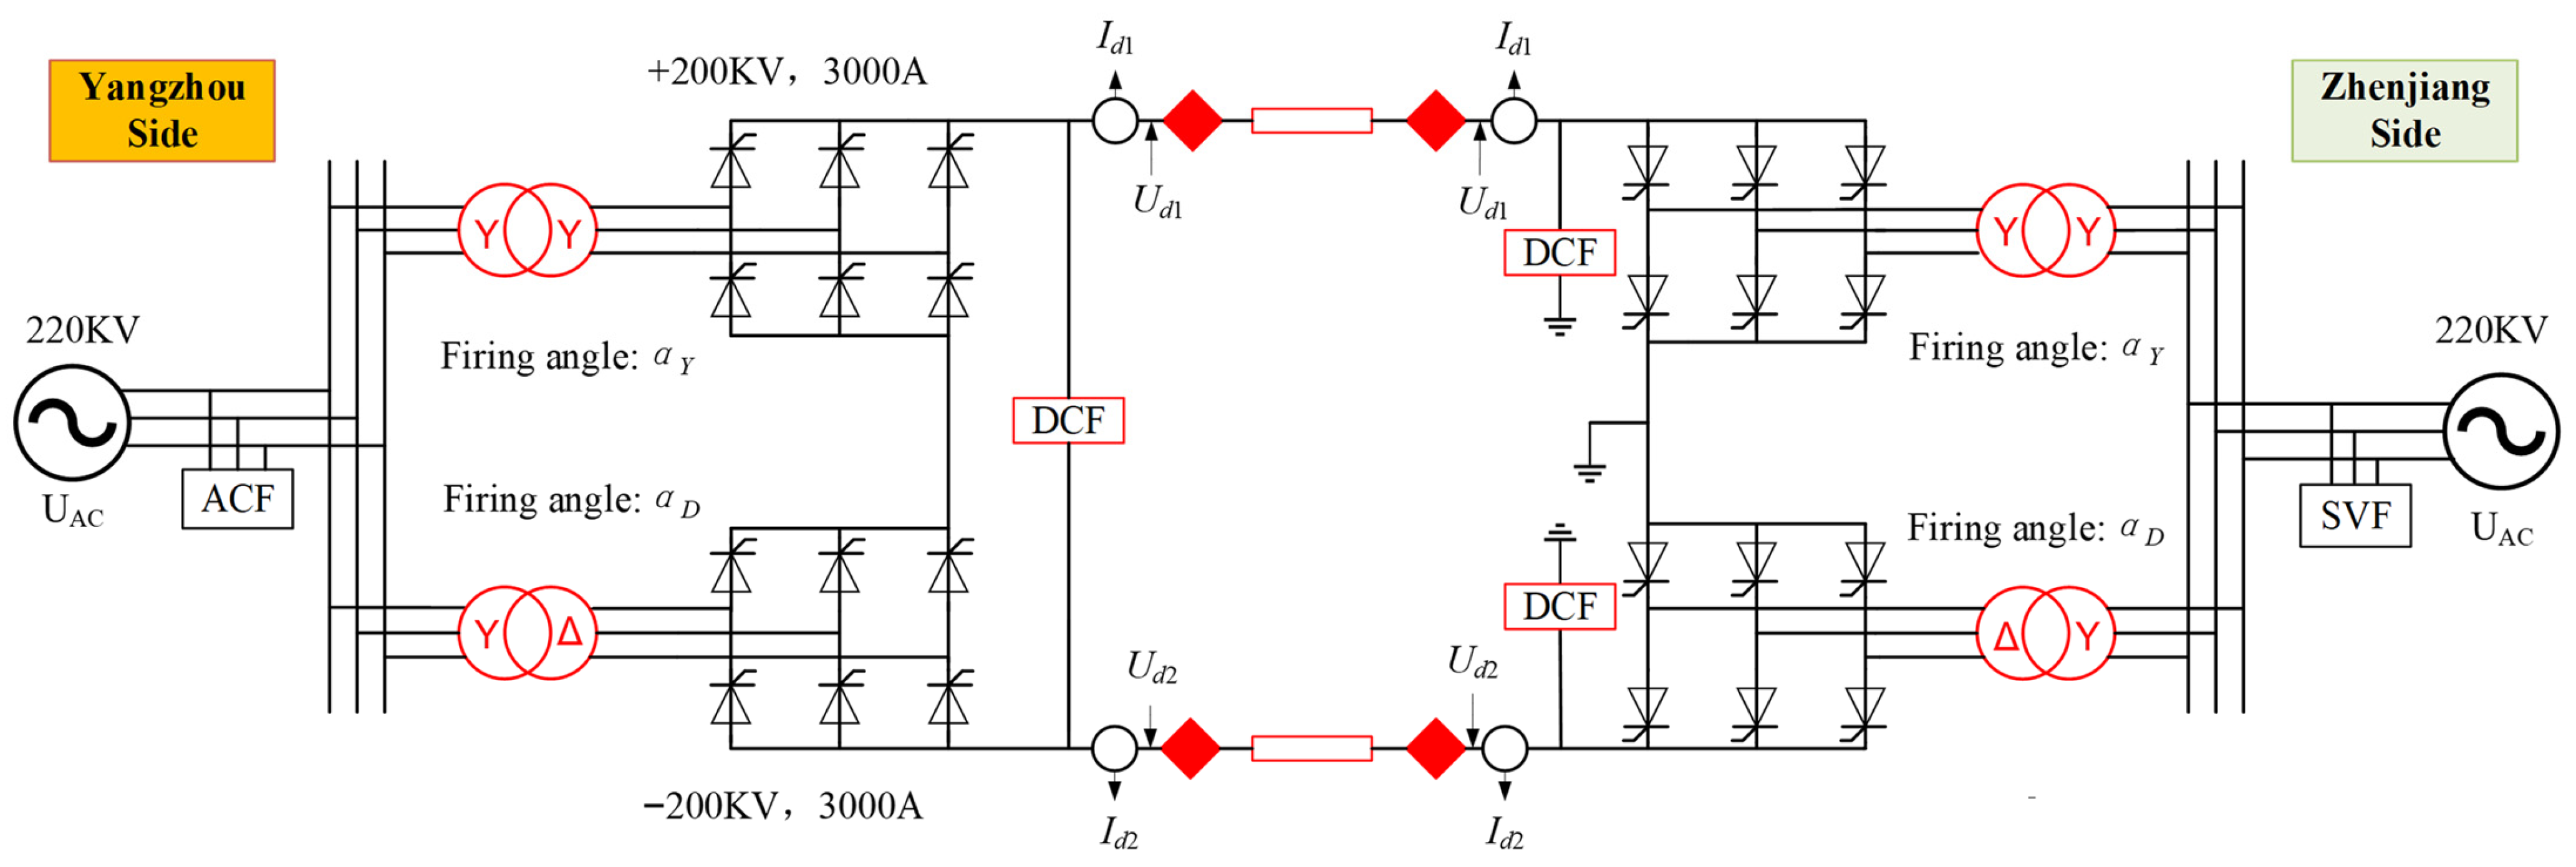
The engineering case is based on the Yangzhou–Zhenjiang HVDC Phase II project, a symmetric single-pole point-to-point scheme with metallic return grounding. Both the sending and receiving stations are equipped with 12-pulse LCC converters, while the receiving station is additionally configured with an SVF for voltage stability enhancement. AC filters (ACFs) and DC filters (DCFs) are installed to suppress harmonics and improve power quality. In the RTDS closed-loop simulation, key electrical quantities, including AC voltage, positive and negative pole DC voltages and currents, and converter firing angles, are monitored in real time. The simulation model reproduces the multi-layered DC line protection chain used in engineering practice, including traveling-wave protection, line di/dt protection, line under-voltage protection, and line differential protection. The main circuit configuration of the Yangzhou–Zhenjiang HVDC Phase II project is shown in Figure 3.
The test program includes two categories. The first comprises AC-side transient fault tests covering power-forward and power-reverse operating conditions, rectifier-side and inverter-side fault locations, and single-phase, phase-to-phase, two-phase-to-ground, and three-phase fault types, all with a fault duration of 100 ms. Different receiving-end short-circuit ratio (SCR) conditions are constructed by adjusting the AC equivalent impedance to emulate weak receiving-end scenarios. The main observed quantities include the timestamps and durations of protection blocked/released events in the SoE records, harmonic control loop exit and re-entry statistics, and the duration of pole isolation commands under fault scenarios.

4.2. AC Fault Ride-Through Verification

4.2.1. Representative Case and Low-Voltage Protection Function Switching

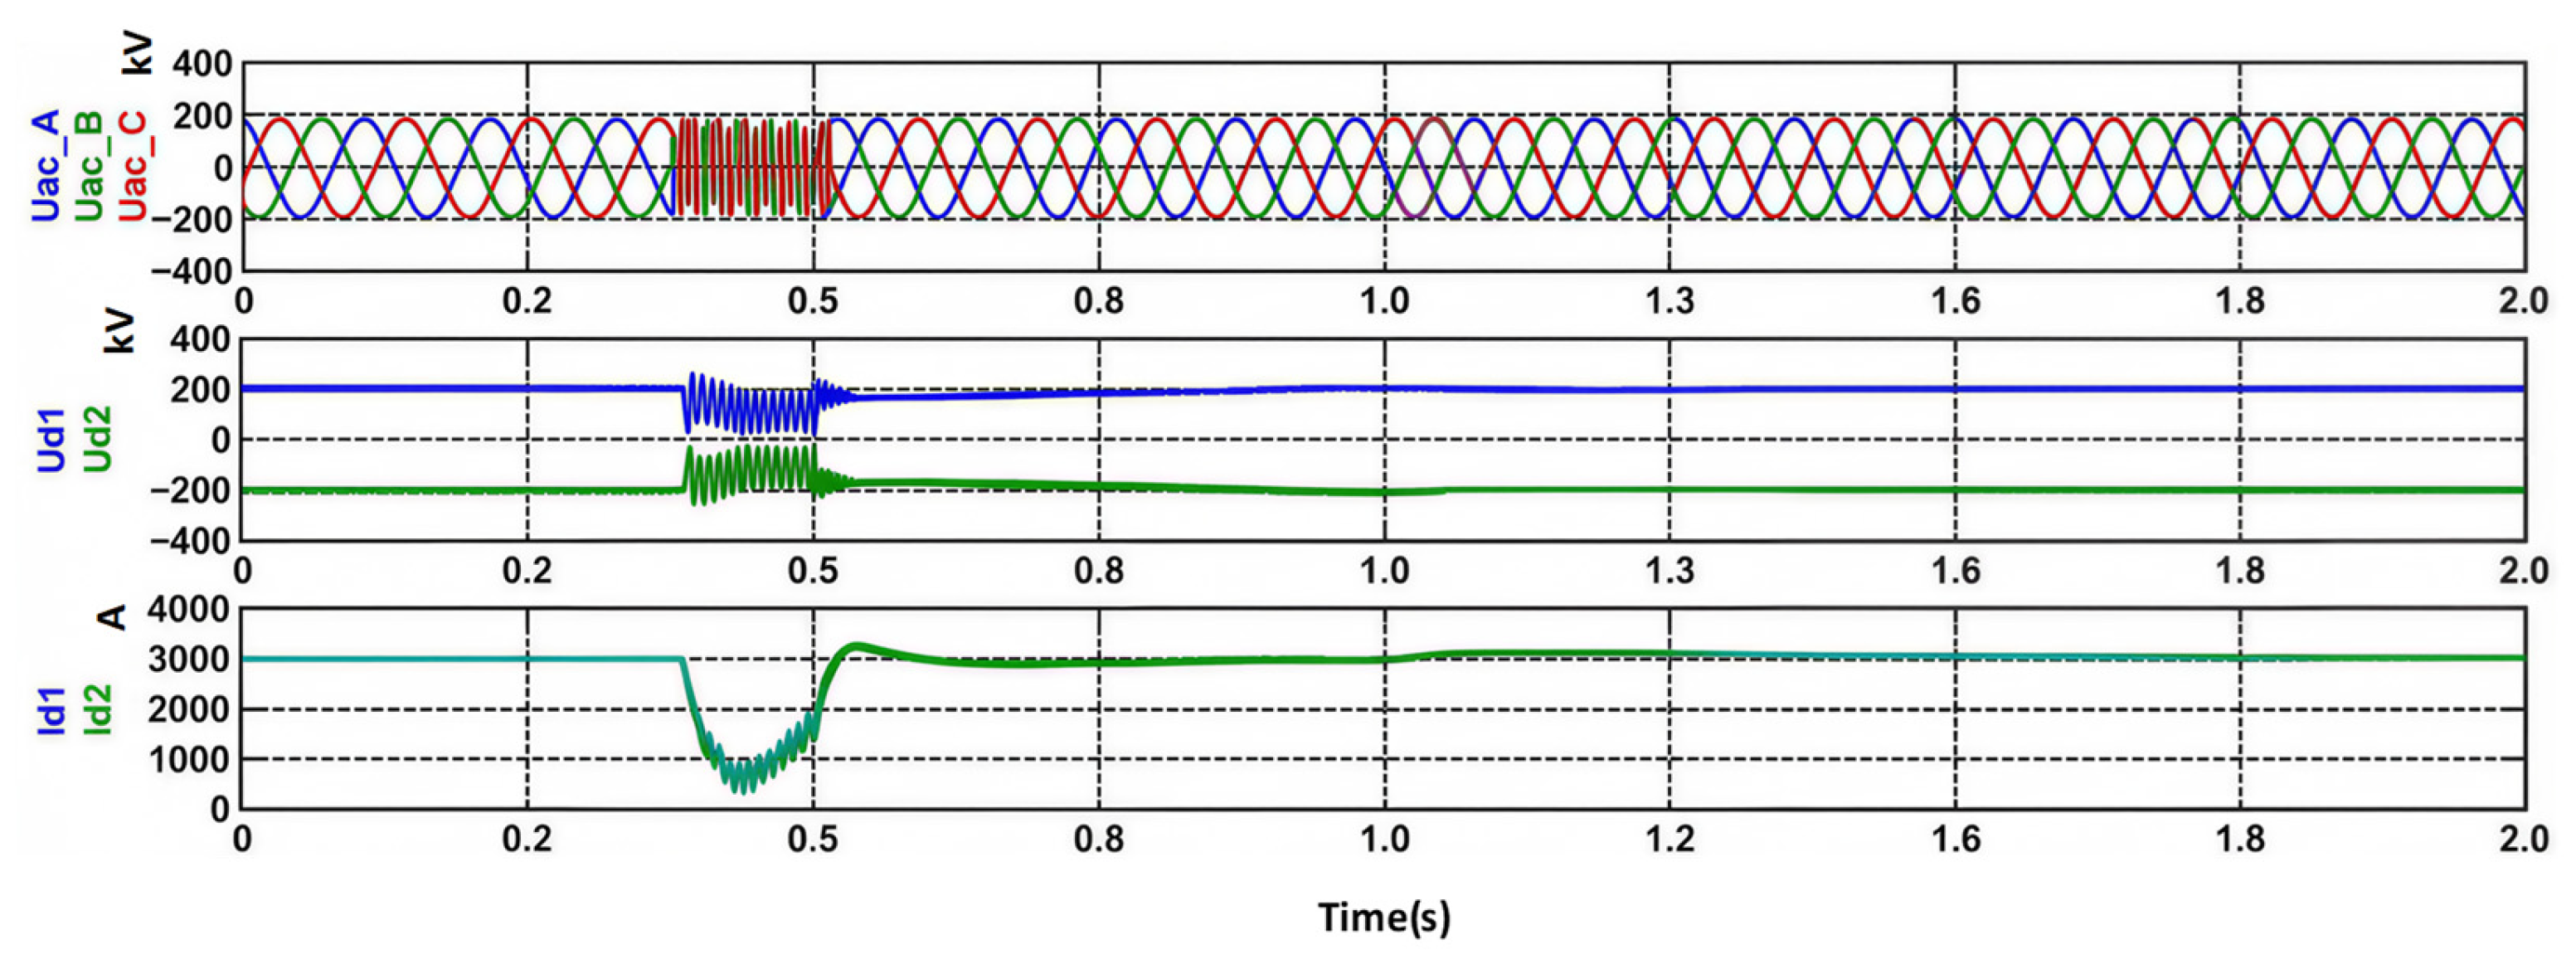
A representative case is selected: a power-forward, full-voltage operation, rectifier-side single-phase-to-ground AC fault with a duration of 100 ms. Upon fault inception, the AC voltage dip causes transient disturbances in the DC-side voltage and current, and the DC line low-voltage protection function enters a blocked state. After fault clearance, the electrical quantities recover gradually, whereas the release of the protection function is delayed relative to the waveform recovery.
Figure 4 presents representative transient waveforms of the AC voltage, DC voltage, and DC current for this case, compiled from engineering RTDS closed-loop recordings. During the fault interval, the AC voltage exhibits a pronounced dip accompanied by waveform distortion, while the DC voltage and DC current show clear transient deviations and subsequent recovery. The waveforms indicate that the main electrical quantities return close to their steady-state levels shortly after fault clearance, whereas the associated protection function is not restored immediately.
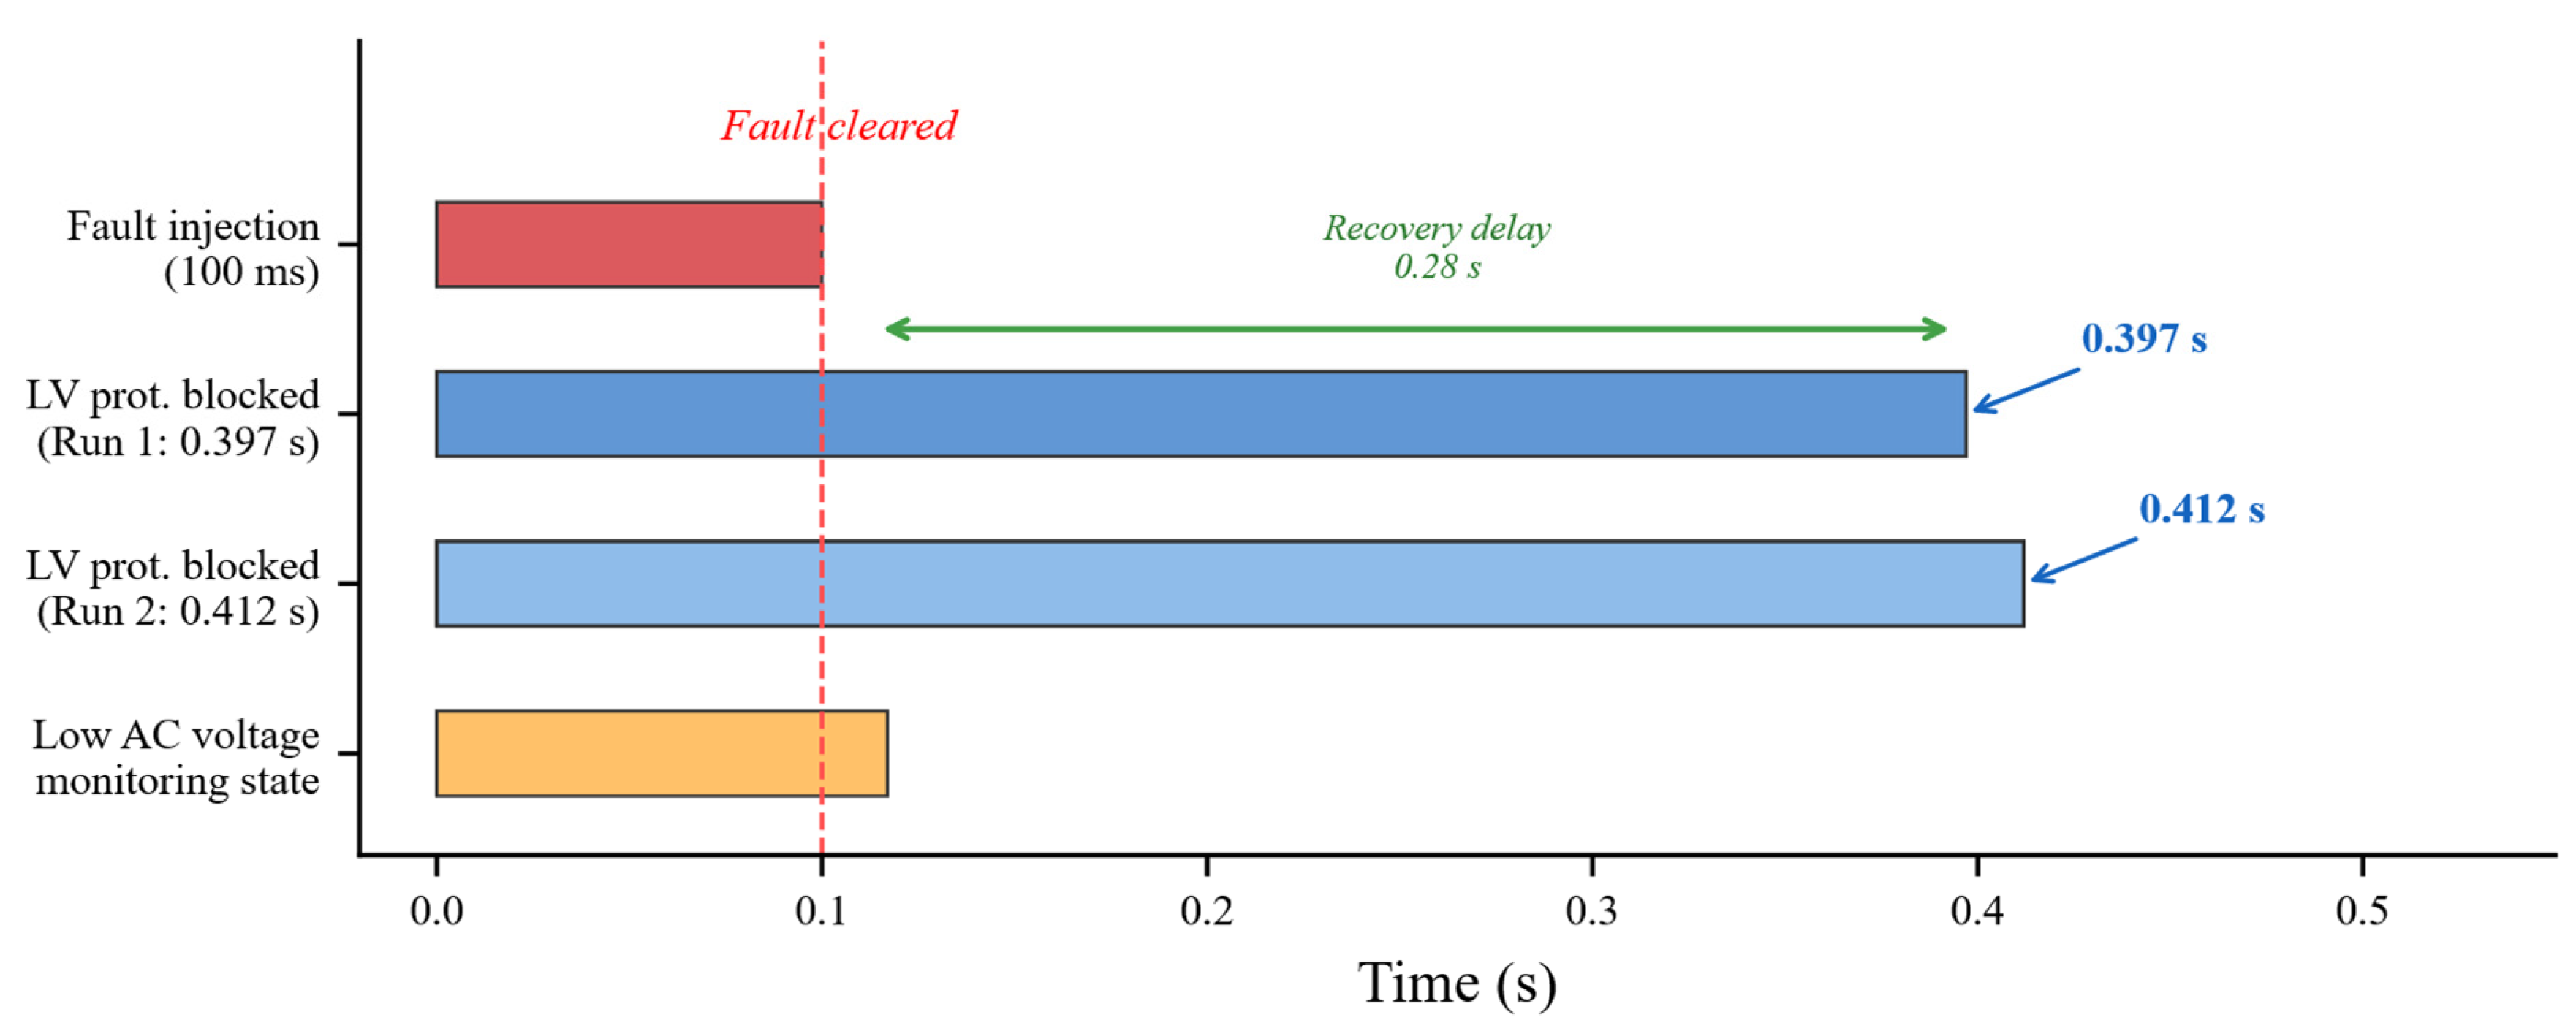
The SoE records provide direct evidence of this delayed restoration. In a representative injection under the above condition, the DC line low-voltage protection function is blocked during the fault window and released only afterward, yielding a blocking duration of approximately 0.397 s, which is significantly longer than the 100 ms fault duration. According to the SoE records, the blocking event appears at 18:59:57.070, and the corresponding release event appears at 18:59:57.467. In addition, the interval between the disappearance of the “low AC voltage switching system state” and the appearance of the “low-voltage protection function released” event is approximately 0.28 s, indicating a clear recovery delay in protection function restoration. Figure 5 illustrates the SoE timeline of these key events.
This observation has an important engineering implication. After fault clearance, the electrical quantities may have essentially recovered while the protection function remains in the blocked state. If other protection or control logic uses “low-voltage protection function restored” as an input condition, misjudgment may occur. Therefore, protection function states and their recovery delays should be incorporated as explicit conditioning variables in coordinated protection criteria. This directly supports the state-conditioned threshold modification method proposed in Section 3.1.

4.2.2. Statistical Analysis of Protection Blocking and Low-Voltage Switching Durations

Batch parsing of the SoE records from all 48 AC transient fault test cases yields the statistical results shown in Table 4 and Table 5.
Table 4 and Table 5 show that the mean and median blocking duration are both approximately 0.608 s, with a maximum of 0.815 s, which significantly exceeds the 100 ms fault duration. This is not an isolated artifact but a recurring statistical pattern across 48 test scenarios and 108 blocking/release event pairs, demonstrating that protection function switching is prevalent under weak receiving-end AC fault ride-through conditions. Table 5 further indicates that the duration of the low AC voltage switching state spans a wide range, reflecting the significant influence of fault severity and system strength on the monitoring-state duration.

4.2.3. Harmonic Control Loop State Transitions

During weak receiving-end fault ride-through, the SoE records contain a large number of harmonic control loop exit and re-entry events. The statistical results are summarized in Table 6.
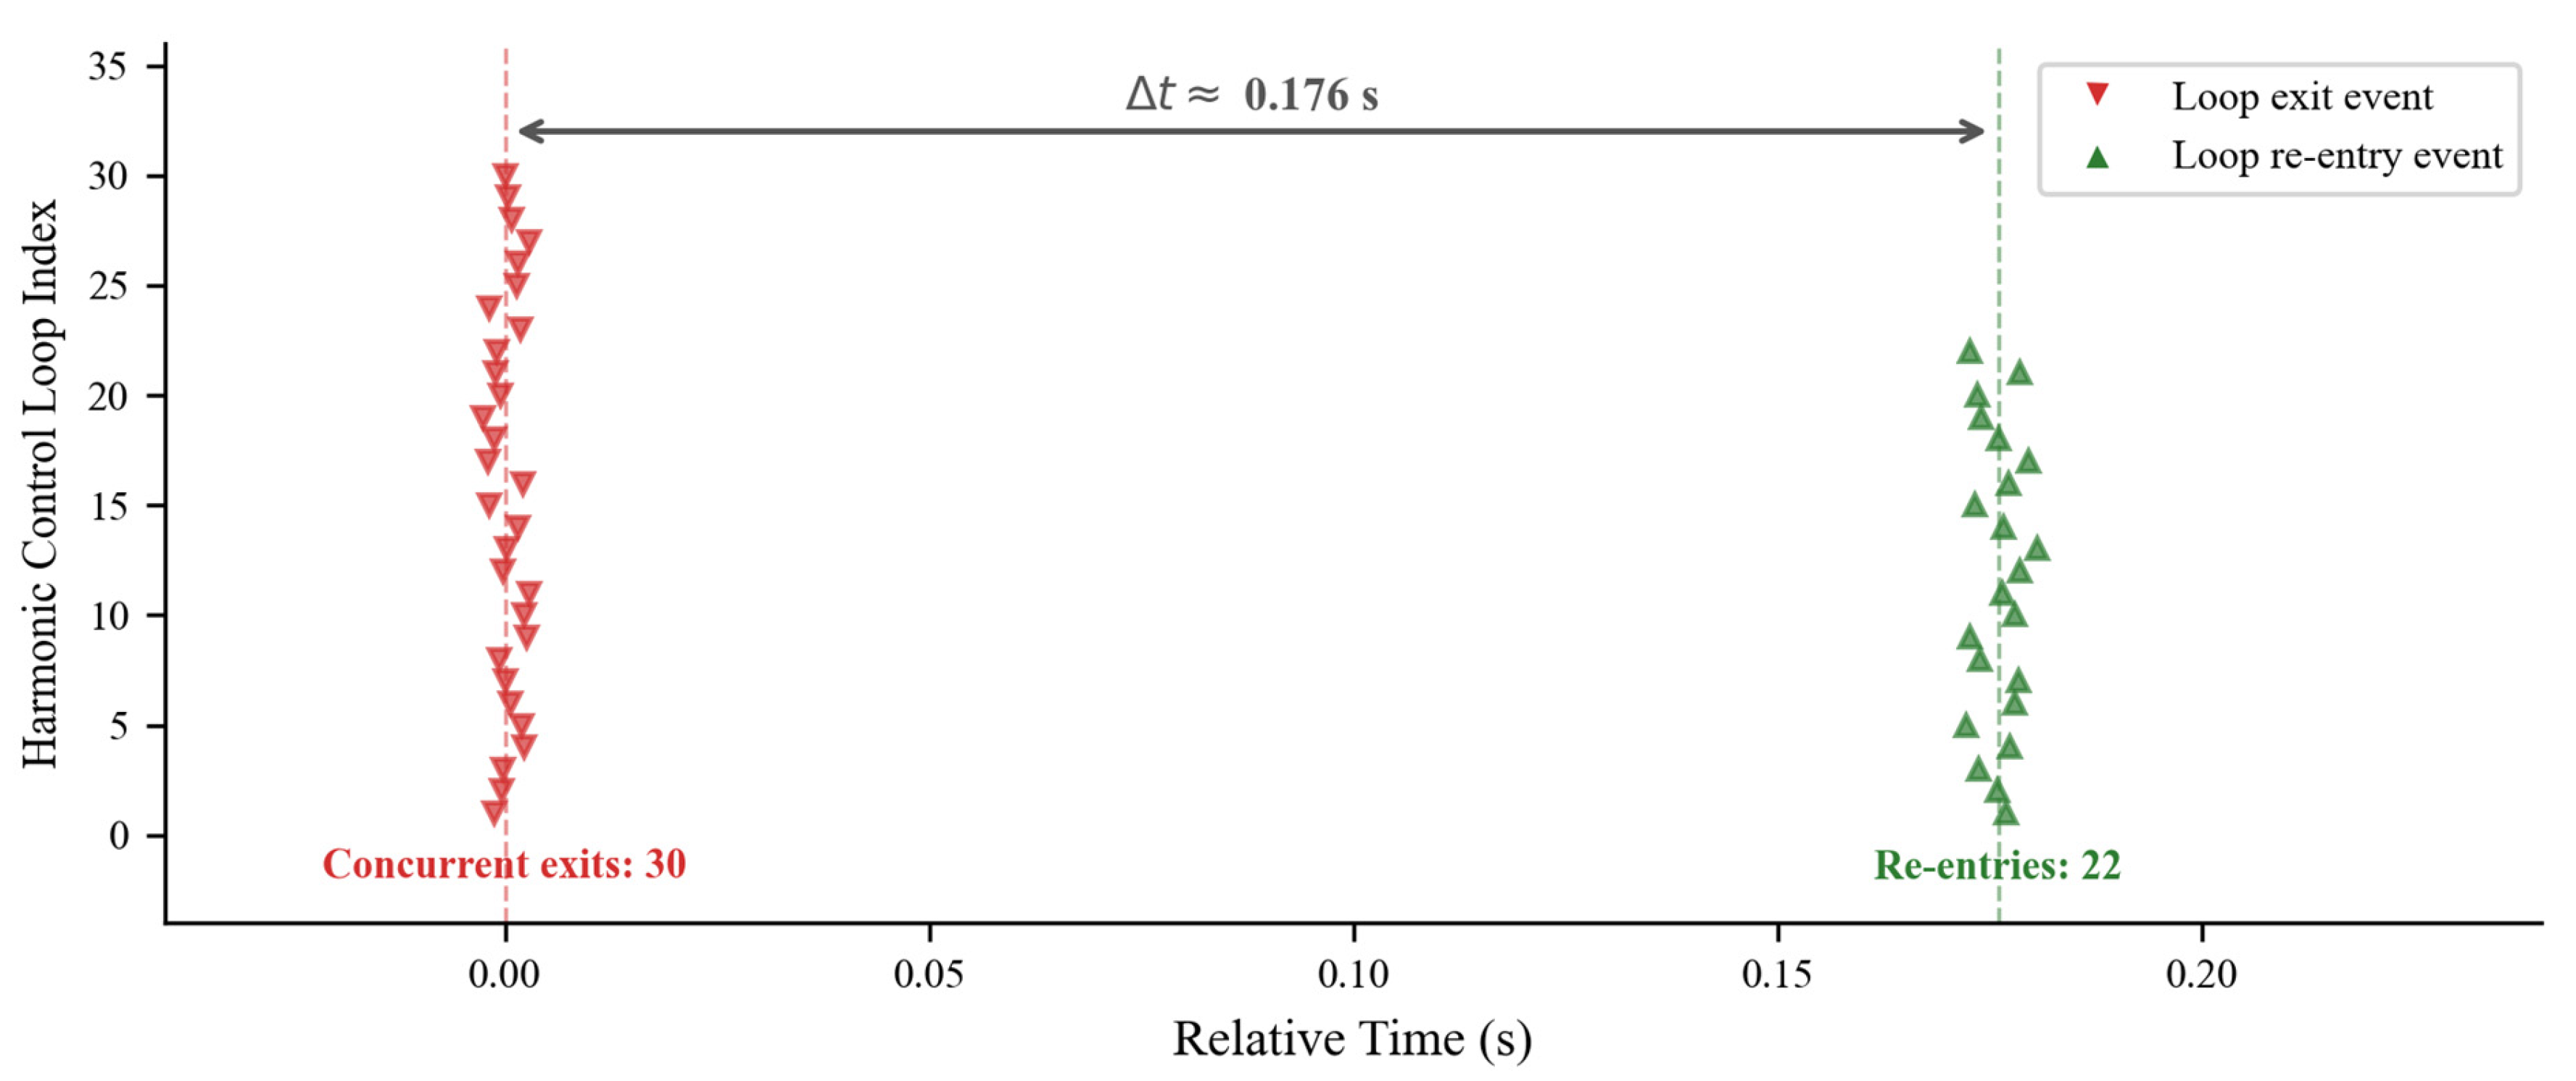
Figure 6 illustrates the SoE evidence of concurrent harmonic control loop exit and re-entry events around a representative timestamp. At the same instant, 30 control loops exit simultaneously; approximately 0.176 s later, a cluster of re-entry events occurs. This pattern reveals that the filtering control loops undergo sub-second concentrated exit–re-entry switching during the fault ride-through window. The exit–re-entry transient causes abrupt changes in the valve-side voltage harmonic spectrum: upon loop exit, previously suppressed harmonic components reappear; upon loop re-entry, the harmonic characteristics shift again. If protection criteria use voltage harmonics as inputs with fixed thresholds, they face a high risk of false triggering within this window.
The above evidence supports the design rationale of Section 3.1: the SVF health status Shealth (including harmonic control loop exit/re-entry flags, current limiting/blocking flags, etc.) should be incorporated as an explicit conditioning variable for protection criteria, enabling thresholds and time windows to adapt to the SVF operating state rather than remaining fixed during control loop state transitions.

4.2.4. Fixed Threshold Criteria Mismatch Analysis

Synthesizing the engineering evidence from Section 4.2.1, Section 4.2.2 and Section 4.2.3, two types of mismatch risks inherent to fixed threshold criteria under SVF active support scenarios can be identified:
  • Risk 1: Misblocking: During fault ride-through, transient feature mutations caused by concentrated harmonic control loop exits may be misinterpreted by fixed threshold criteria as persistent commutation failure signals, thereby triggering unnecessary blocking or prolonging the blocking duration.
  • Risk 2: Failure to operate: In the early stage of a fault, the SVF rapidly injects reactive power and briefly raises the voltage magnitude, causing voltage-based criteria to perceive system recovery. However, due to phase jumps and waveform distortion, the commutation voltage time integral may still be insufficient, and the commutation margin ηc may remain below unity. Under these conditions, fixed threshold criteria may release the protection prematurely and miss the commutation failure risk window.
The root cause of both risks is that SVF active support breaks the implicit assumption underlying traditional LCC protection, namely, that voltage magnitude is monotonically and positively correlated with commutation margin. Under SVF support, the same voltage magnitude may correspond to different commutation risks depending on the SVF operating state. The state-conditioned threshold modification proposed in Section 3.1 is designed specifically to address this mismatch mechanism.

4.3. SVF Zone Internal Fault Verification

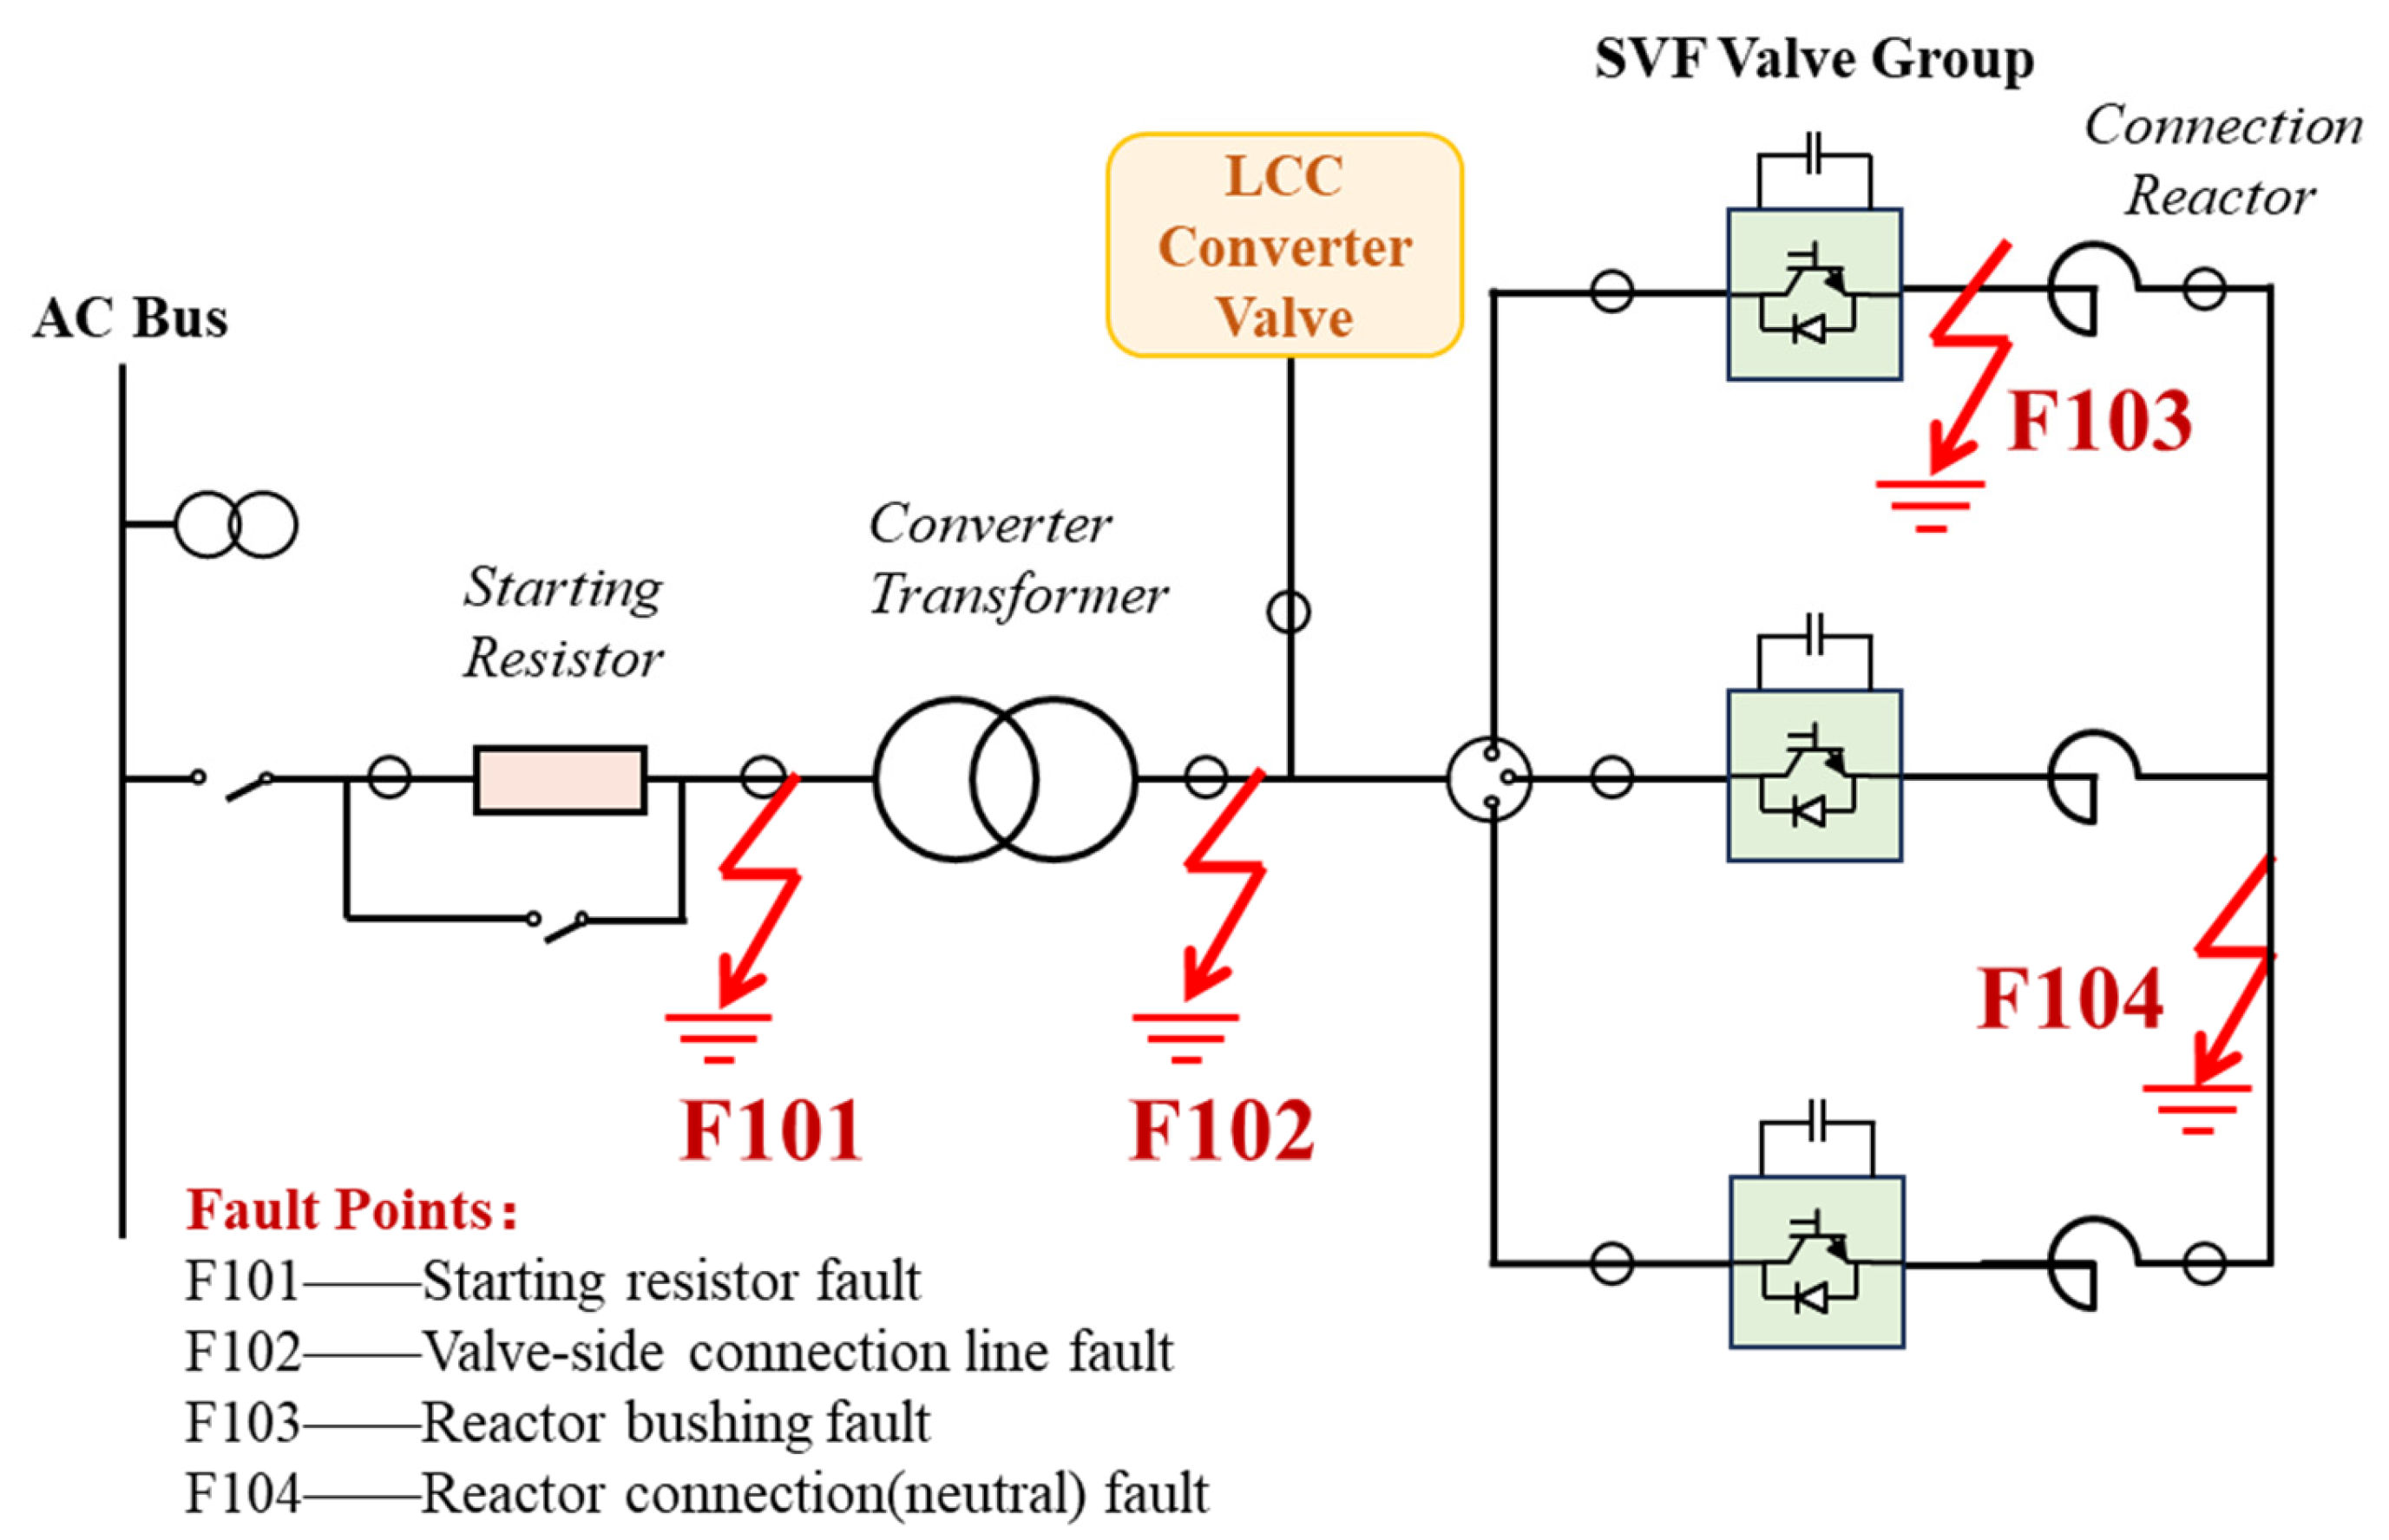
The second test category comprises SVF protection zone internal fault tests, including the starting resistor fault (F101), valve group connection line fault (F102), valve group internal fault (F103), and reactor connection fault (F104). As shown in Figure 7, the SVF protection zone extends from the converter transformer valve-side CT to the SVF reactor-side CT. These faults belong to the local isolation priority category of the staged response strategy. Local protection can isolate the fault and trigger the SVF to exit active support without directly initiating pole-level actions.

4.3.1. Representative Case Analysis

Under full-voltage, 1.0 p.u. power level, and inverter-side reactive power U-control conditions, RTDS injections were performed for F101 and F102.
  • F101: SoE records show that the pole isolation command appears at 17:43:44.068 and disappears at 17:43:46.912, a duration of approximately 2.844 s. This indicates that under an SVF zone local fault, existing engineering protection triggers a pole-level action lasting several seconds. In a staged response, the starting resistor fault could be handled via local isolation, followed by a derated ride-through attempt after the SVF exits active support. However, existing logic did not distinguish the fault scope and escalated directly to pole isolation, causing a full-pole outage.
  • F102: The pole isolation command duration is approximately 0.088 s (88 ms). Compared with F101, the durations for these two SVF zone internal faults differ by a factor of 32, exhibiting a cross-order-of-magnitude distribution.

4.3.2. Statistical Analysis of Pole Isolation Command Duration

The pole isolation command duration is statistically analyzed for all SVF zone internal fault scenarios in the SoE records (n = 70), with results shown in Table 7.
The pole isolation command duration spans from 2 ms to 2.844 s, covering three orders of magnitude. The median is only 33 ms, whereas the maximum approaches 3 s. This distribution exhibits a pronounced heavy-tail characteristic, indicating that most SVF zone faults result in short-duration pole isolation commands, while a few scenarios (e.g., F101 starting resistor fault) trigger prolonged pole-level actions.

4.3.3. Necessity Analysis for Staged Response

The evidence confirms the necessity of the proposed staged response strategy for three reasons. First, locally isolable SVF zone faults should prioritize local handling to avoid unnecessary pole-level actions. Second, after the SVF exits active support, the commutation margin must be evaluated to determine whether derated ride-through is feasible. Third, pole-level action should be triggered only when commutation constraints persistently fail, ensuring equipment safety.

4.4. Protection Logic Replay and Robustness Verification

To further validate the proposed method, the proposed logic and two conventional baselines are compared on an EMT and protection logic replay co-simulation platform. Baseline-A emulates conventional low-voltage protection without SVF awareness, using a fixed threshold θlv = 0.85 p.u. Baseline-B also uses fixed thresholds but selects them from a pre-computed lookup table according to SVF health status; it does not employ continuous tracking of the normalized commutation margin ηc. Representative fault waveforms from EMT runs are replayed through a discrete-time protection model so that all methods are evaluated under identical transients.
Robustness to measurement noise is assessed via SNR scans, and sensitivity is analyzed for key threshold coefficients, the verification time window, and dead-band settings. Throughout this section, the misblocking rate Rob is the proportion of incorrect blocking commands, and the failure to operate rate Rmt is the proportion of missed responses.
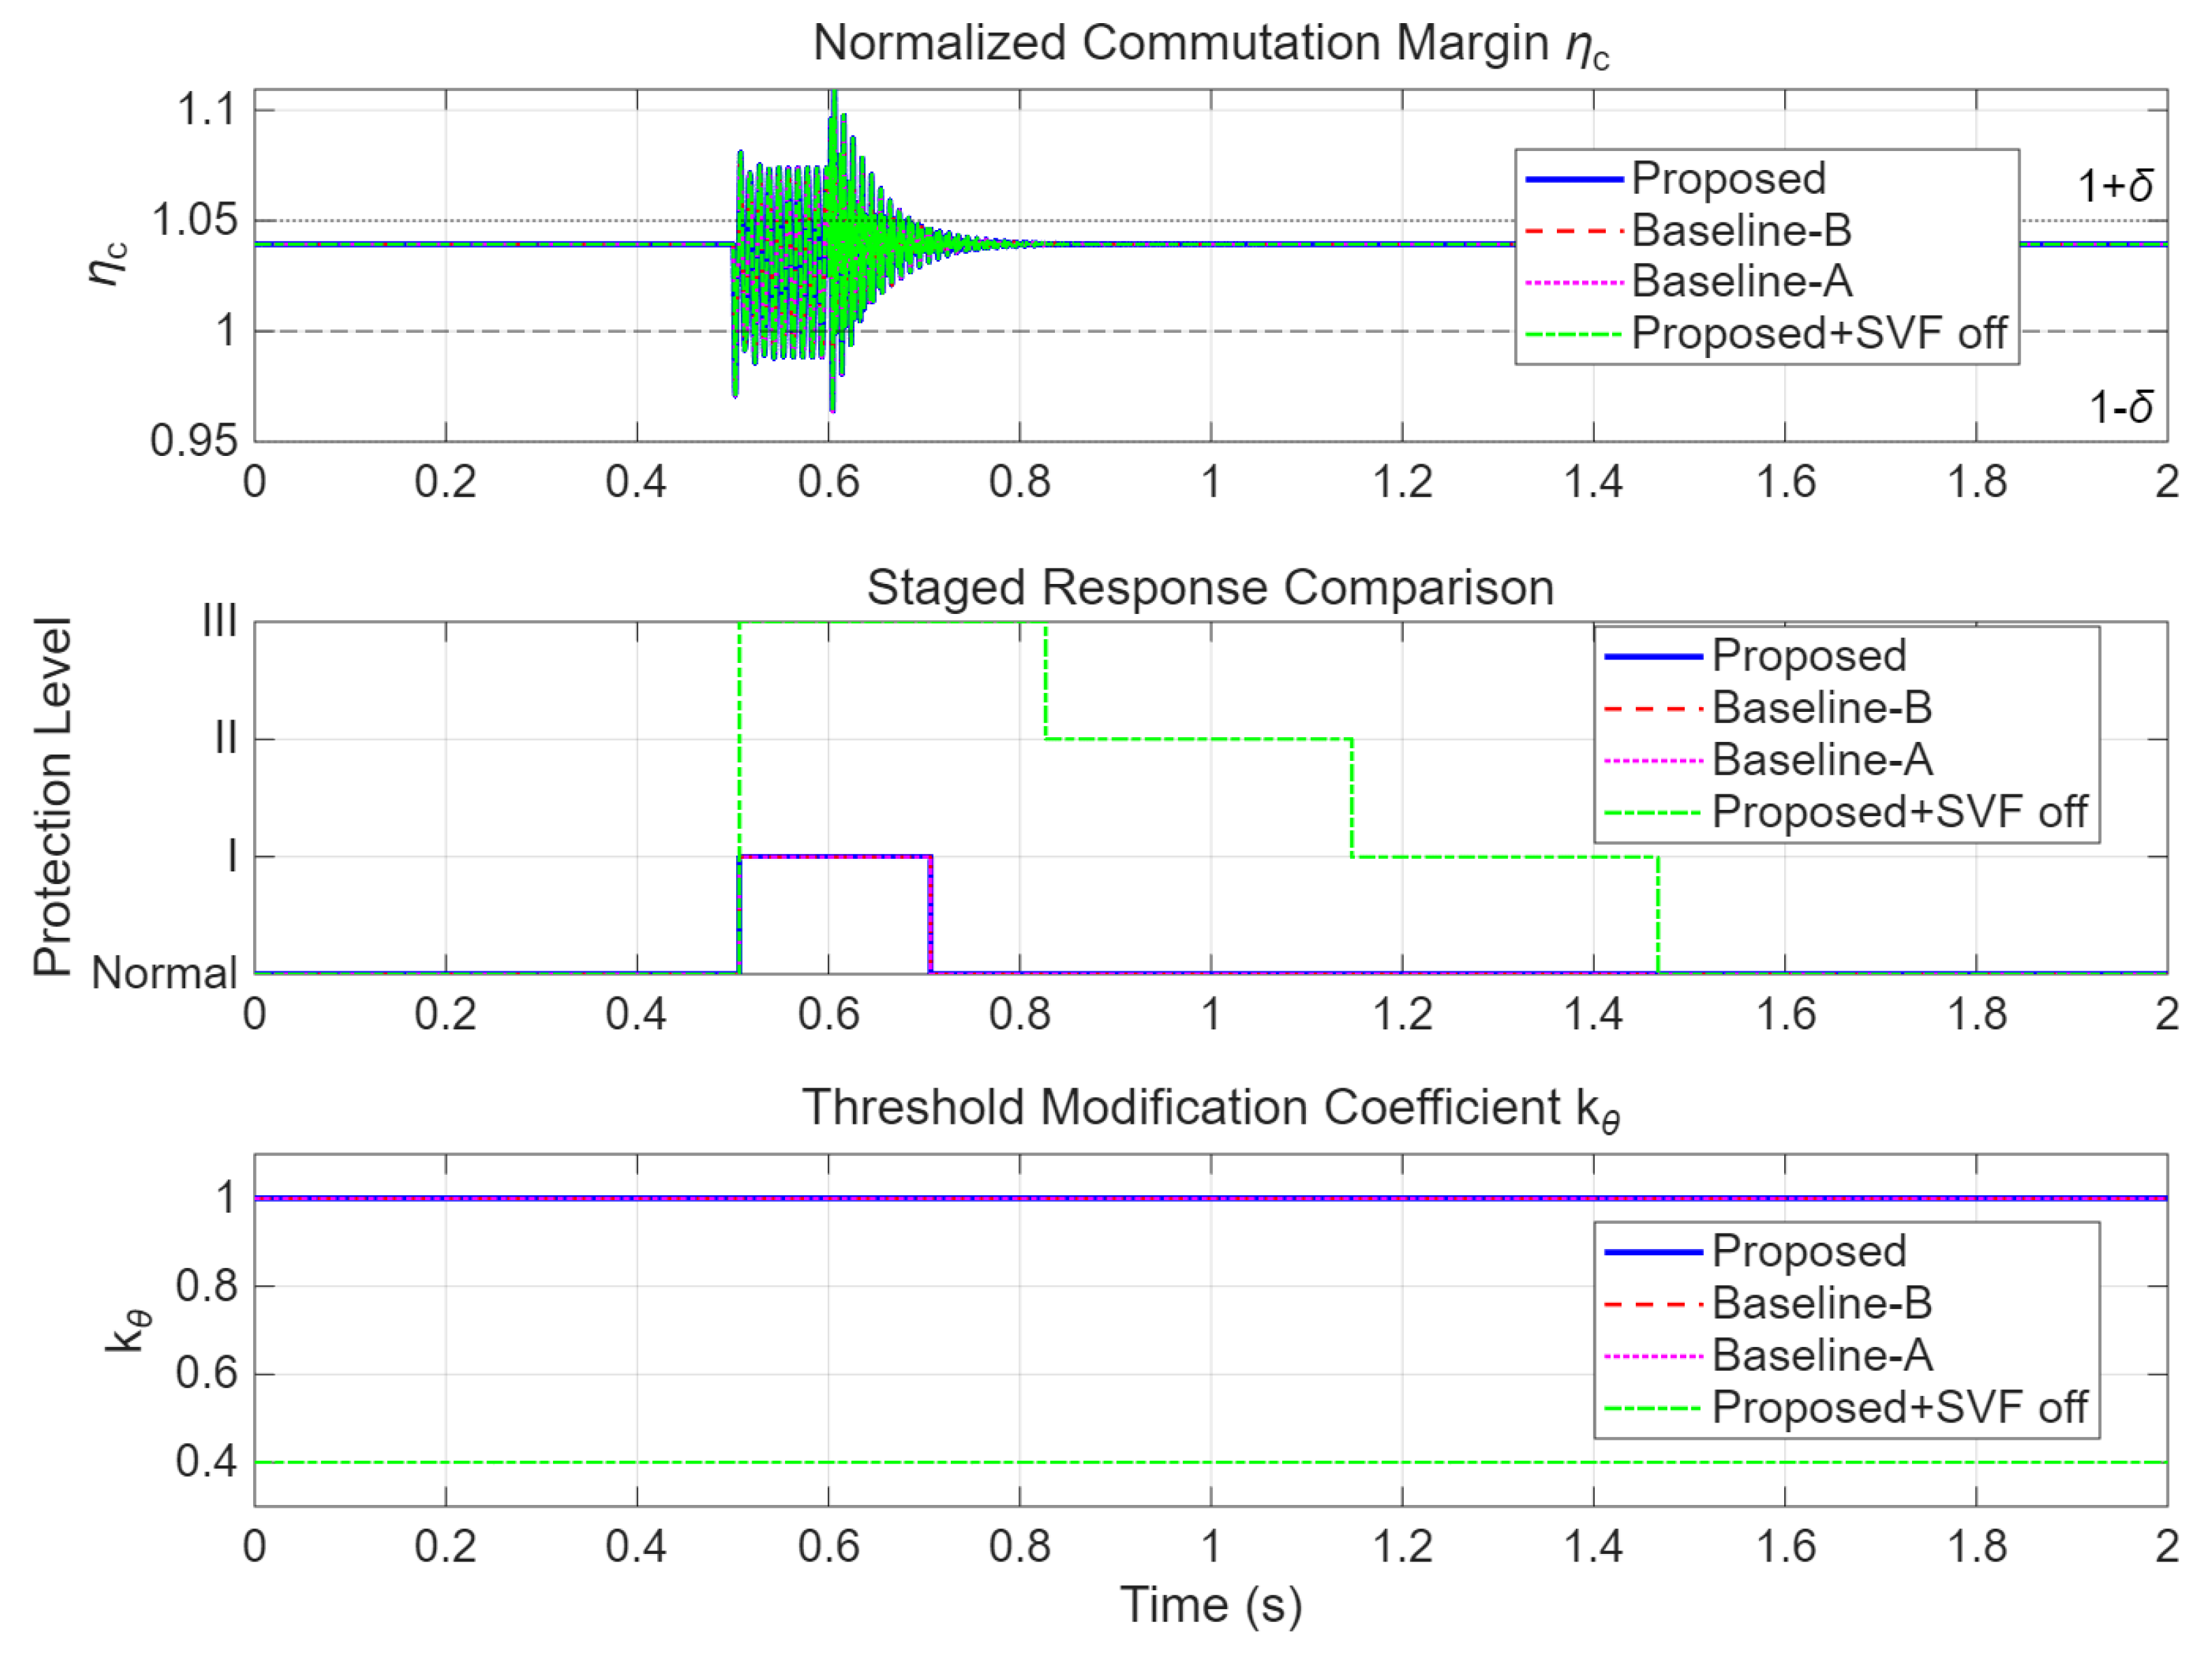
Figure 8 presents a representative time-domain comparison for a moderate inverter-side fault (single-phase-to-ground, Rf = 30 Ω) under four protection methods. The top panel in Figure 8 shows the normalized commutation margin ηc; the middle panel shows the staged response level; and the bottom panel shows the threshold modification coefficient kθ.
As shown in Figure 8, when the SVF operates normally, the proposed method and Baseline-B exhibit nearly identical ηc trajectories and both triggers only a brief Level I response, confirming that the state-aware logic does not impose additional operational burden under normal conditions. Baseline-A, using the most conservative fixed threshold, does not respond to this fault. In contrast, when the SVF is unavailable, the proposed method reduces kθ from 1.0 to approximately 0.4 and escalates to Level III promptly, reflecting the automatic tightening of the protection criterion in response to degraded support capability.

4.4.1. SNR Robustness and Noise Tolerance Boundary

An SNR scan was performed at five noise levels (Inf, 40, 30, 20, and 10 dB) for two representative scenarios. For each SNR level, 10 noise realizations were tested, and the results are summarized in Table 8.
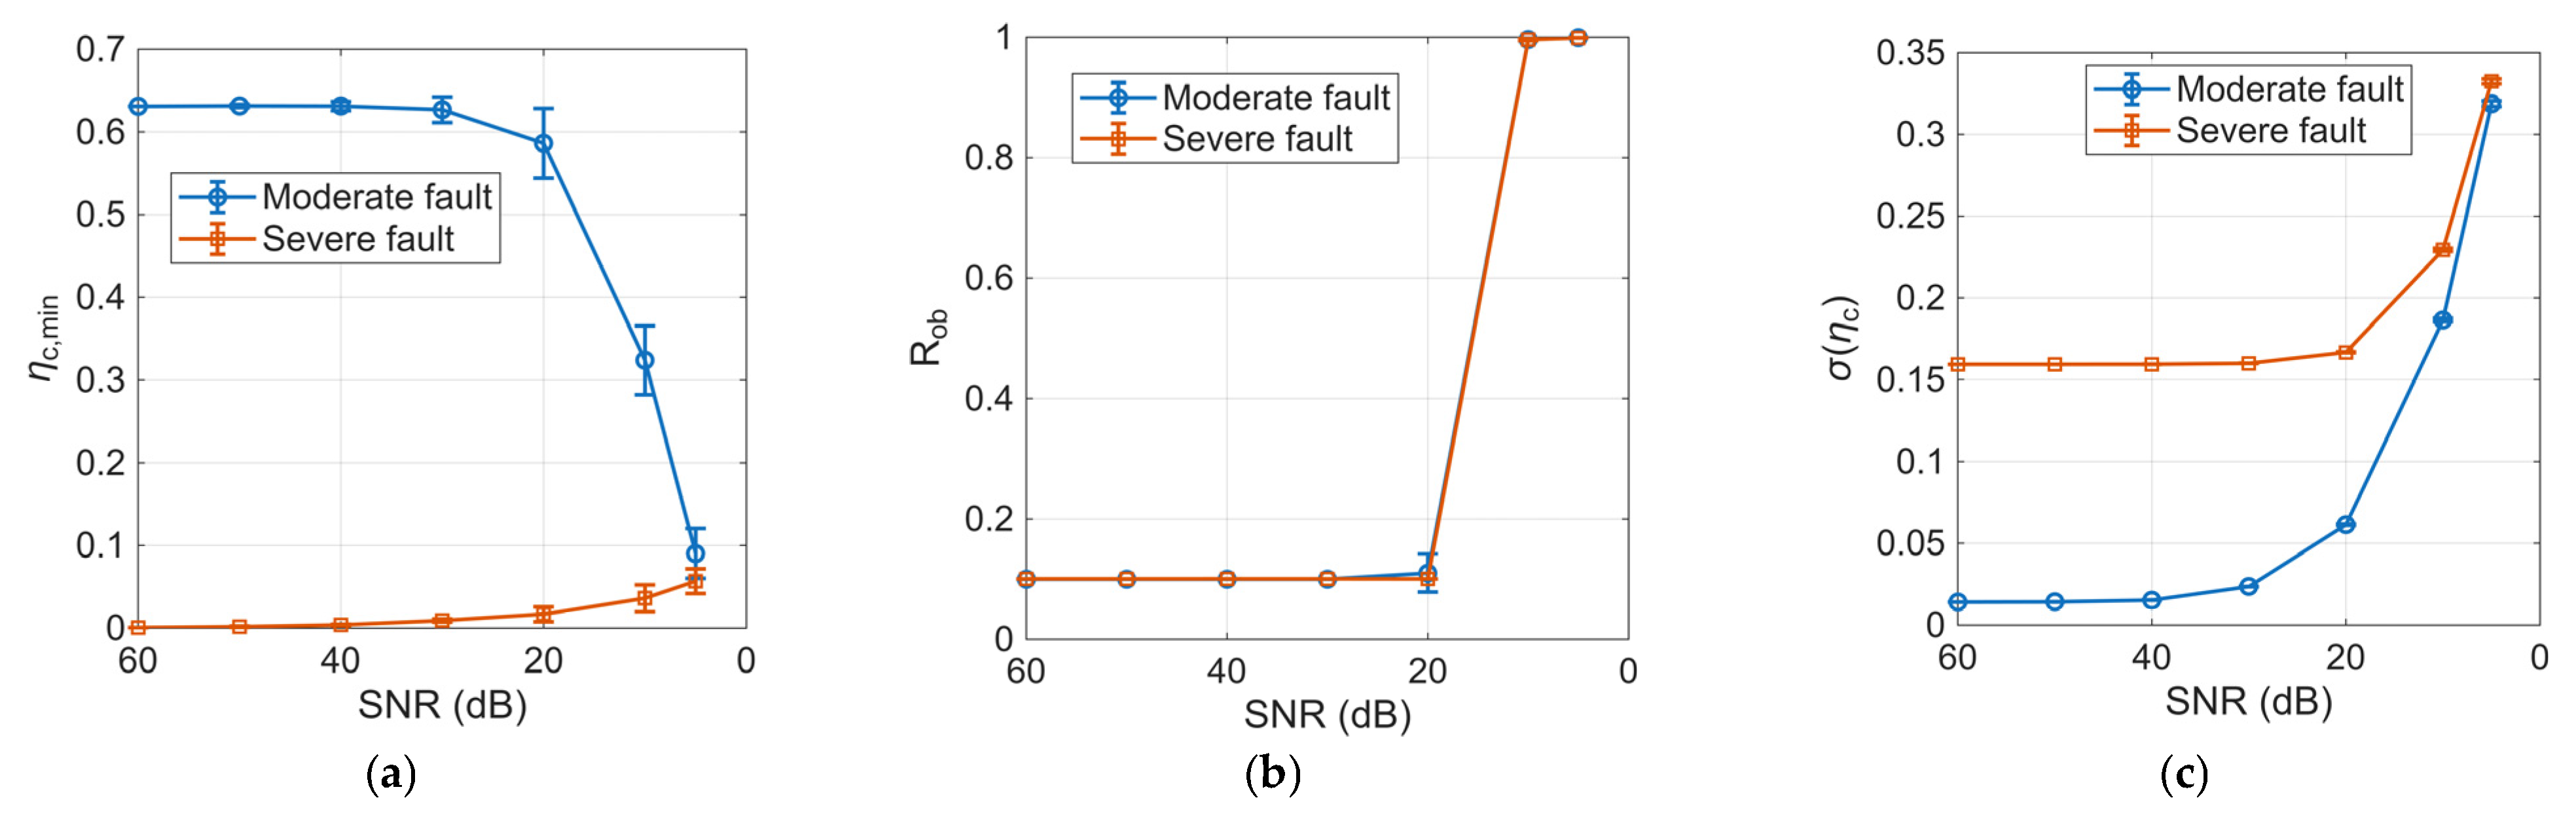
Protection performance is reliable at SNR ≥ 30 dB (Rob and Rmt stable). Figure 9 further compares the mean values and error bars of the minimum ηc, misblocking rate, and ηc standard deviation under different SNR conditions across the 10 noise realizations.
As shown in Figure 9, both representative scenarios remain comparatively stable when SNR is not lower than 30 dB: the mean ηc minimum value changes only slightly, Rob stays near its nominal level, and the error bars remain narrow. Once the SNR decreases to 20 dB, the moderate fault case begins to show visible dispersion and an increase in false blocking, indicating that noise starts to interfere with threshold discrimination. At 10 dB, the moderate fault response deteriorates sharply, and the misblocking rate approaches 1.0, which identifies the practical noise tolerance boundary of the method for the tested conditions.

4.4.2. Combined Effects of SNR and Parameter Variations

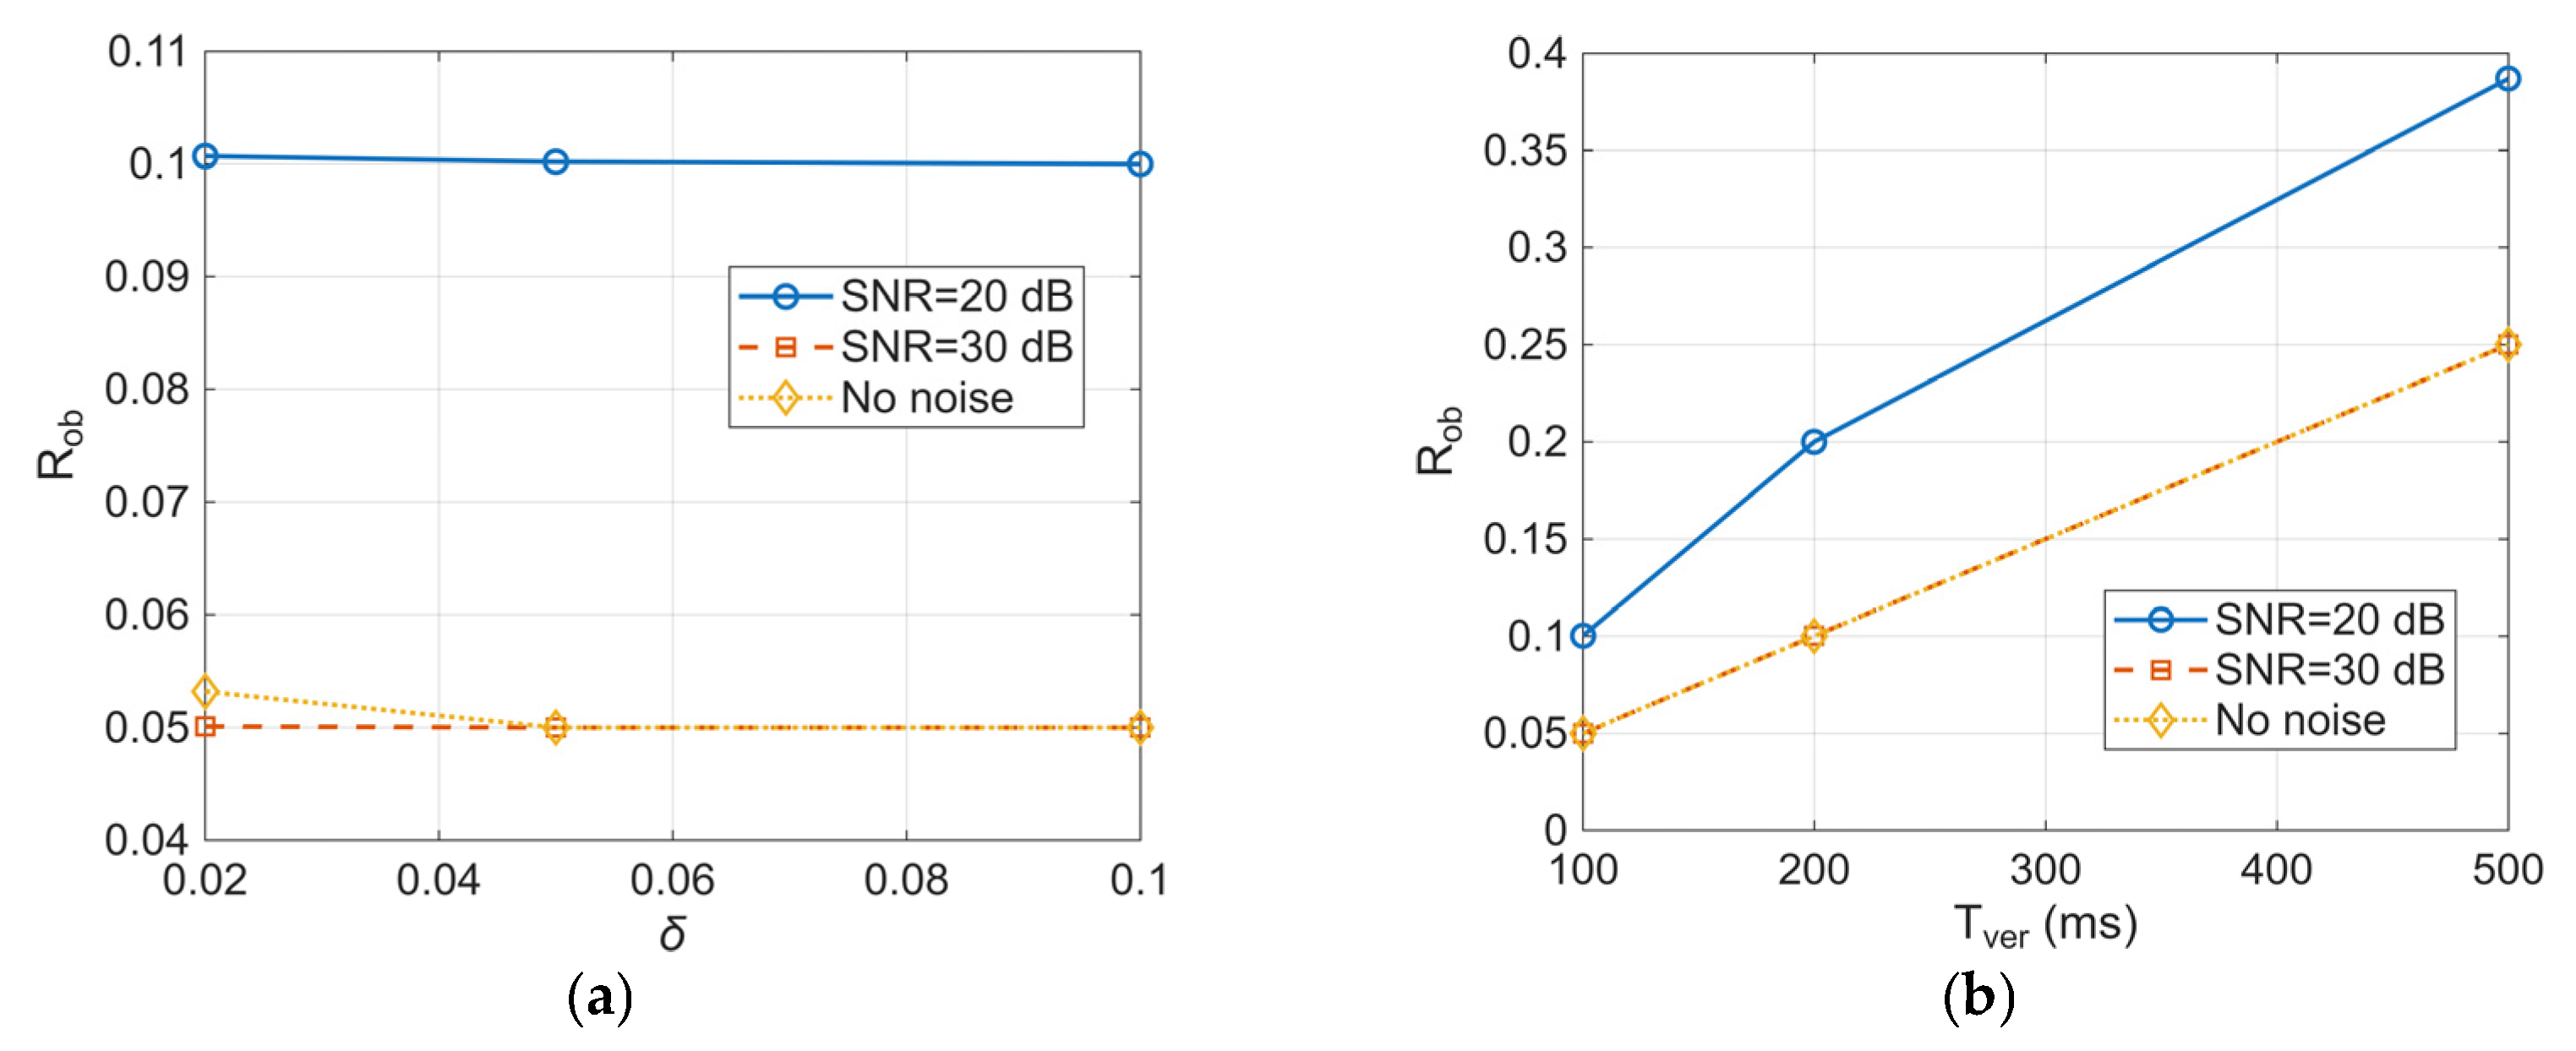
The joint effect of parameters and noise was examined over 27 combinations (3 SNR levels × 3δ values × 3Tver values). Nominal parameters δ = 0.05 and Tver = 100 ms were selected based on the tuning constraints in Section 3.2.2. For these settings, Rob = 0.050 at SNR = 30 dB and Rob = 0.100 at SNR = 20 dB. Figure 10 visualizes this parameter noise interaction.
Figure 10 shows that the parameter region around δ = 0.05 and Tver = 100 ms remains comparatively stable under noise, whereas the smaller dead-band setting δ = 0.02 exhibits clear sensitivity amplification. When Tver is fixed at 100 ms, increasing δ from 0.05 to 0.10 produces only limited additional reduction in Rob, which means the main benefit of avoiding too small a δ is robustness rather than further performance gain. Conversely, when δ = 0.05 is fixed, increasing Tver enhances verification conservatism but also prolongs blocking duration and action latency. Therefore, δ = 0.05 and Tver = 100 ms provide the best overall compromise for the present case study.

4.4.3. SVF Zone Internal Fault Staged Response Verification

Staged response verification was conducted for SVF zone internal faults, and the comparison between the baseline and proposed methods is summarized in Table 9.
The proposed method achieves Level III escalation with zero delay across all four fault types. Baseline-B reaches Level III only for F102 and F104 with a 0.3 ms delay and remains at lower levels for F101 and F103.

4.4.4. Overall Performance Comparison

Taken together, the replay results show that the proposed state-aware coordinated protection method offers three practical advantages over the conventional baseline. First, it maintains zero failure to operate in the tested weak receiving-end ride-through scenarios while suppressing misblocking under SVF degradation and noisy measurements. Second, for SVF zone internal faults, it limits unnecessary escalation by correctly matching the response level to the fault scope and achieving Level III escalation for all four tested fault types. Third, by combining adaptive threshold modification with state-consistency checks, the method remains effective across different support states and reactive power margins without relying on a single fixed threshold. These results confirm the coordinated benefit of the proposed method in balancing ride-through capability, operational continuity, and equipment protection constraints.

4.5. Discussion

4.5.1. Interpretation of Results

The proposed method’s advantage over fixed threshold baselines is most evident in two scenario types. (1) SVF degradation and state transition scenarios: as the SVF degrades from healthy to bypass, the adaptive threshold tightens proactively, with Rob increasing by 0.06–0.16. This reflects a protection philosophy of limited conservatism in exchange for zero failure to operate. Fixed threshold methods, lacking state information, are essentially insensitive to deteriorating support capability. (2) SVF zone internal fault scenarios: the proposed method achieves Level III escalation in all four fault types, while the baseline achieves this for only two of four. Under normal SVF operation in conventional fault scenarios, the proposed method and Baseline-B perform similarly (Rob ≈ 0.10), confirming that the state-sensing logic does not impose additional action burden under normal conditions.
Compared with existing research, the key advantage is the unification of three previously disconnected problems: ηc describes the commutation physics boundary under SVF active support, addressing the inability of conventional voltage/extinction angle indices to characterize nonlinear compensation effects; SVF health status and reactive power margin are explicitly incorporated into threshold tuning, addressing the insensitivity of fixed threshold methods to state transitions; and local fault isolation, derated ride-through, and pole-level action are integrated into a single staged response framework. This enables the method to not only identify risk but also constrain the action scope. The proposed method is therefore complementary to existing work on system strength enhancement, CF prediction/identification, and HVDC line fault detection.

4.5.2. Parameter Sensitivity

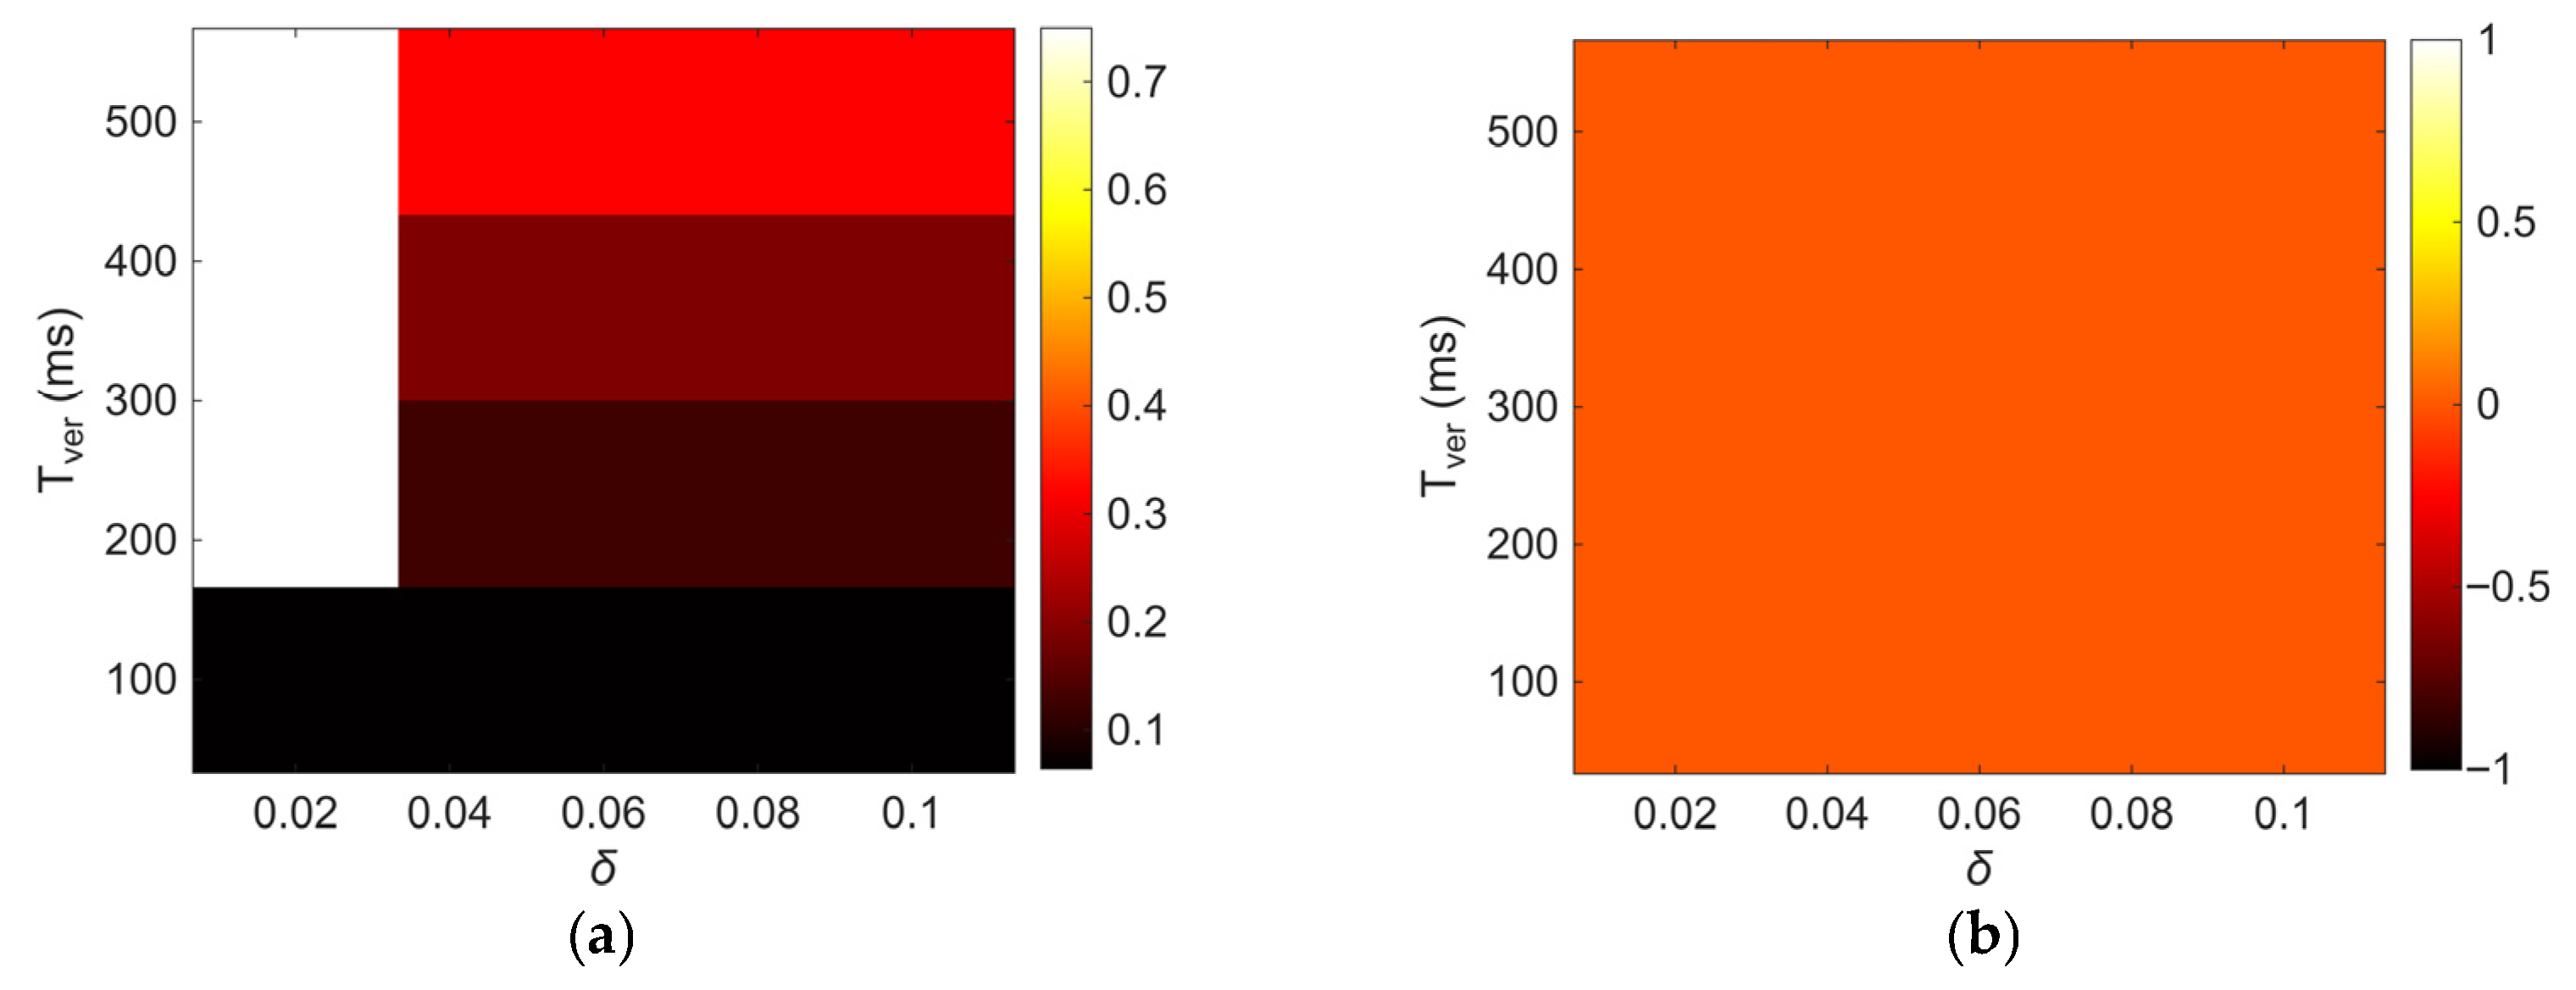
Sensitivity analysis of key parameters δ, Tver, and the state-conditioned threshold coefficient kθ reveals a trade-off between low misblocking and fast response. In the sensitivity scan, the tabulated kθ values in Table 3 are uniformly scaled to examine the effect of globally tighter or looser threshold settings. δ = 0.02 produces an overly tight threshold and amplifies noise sensitivity; Tver > 300 ms may cause thermal limit violations under low thermal stability margins. For this case study, Tver = 100 ms balances false escalation suppression, noise robustness, and action speed. From a broader engineering perspective, δ can be maintained within [0.05, 0.10], with Tver determined by equipment thermal stability margin and weak receiving-end recovery time. Figure 11 shows the sensitivity heatmaps of Rob and Rmt over the δTver parameter plane, with kθ scaling and Lc scaling fixed at their nominal values.
Figure 11a reveals a sharp contrast between δ = 0.02 and larger dead-band settings: the former produces high Rob across all Tver values, while δ > 0.04 maintains Rob below 0.15 throughout the tested range, confirming that δ = 0.02 should be avoided in practice. Figure 12b shows that Rmt remains near zero across the entire parameter space, indicating that the method preserves its failure to operate performance regardless of the specific δ and Tver combination.
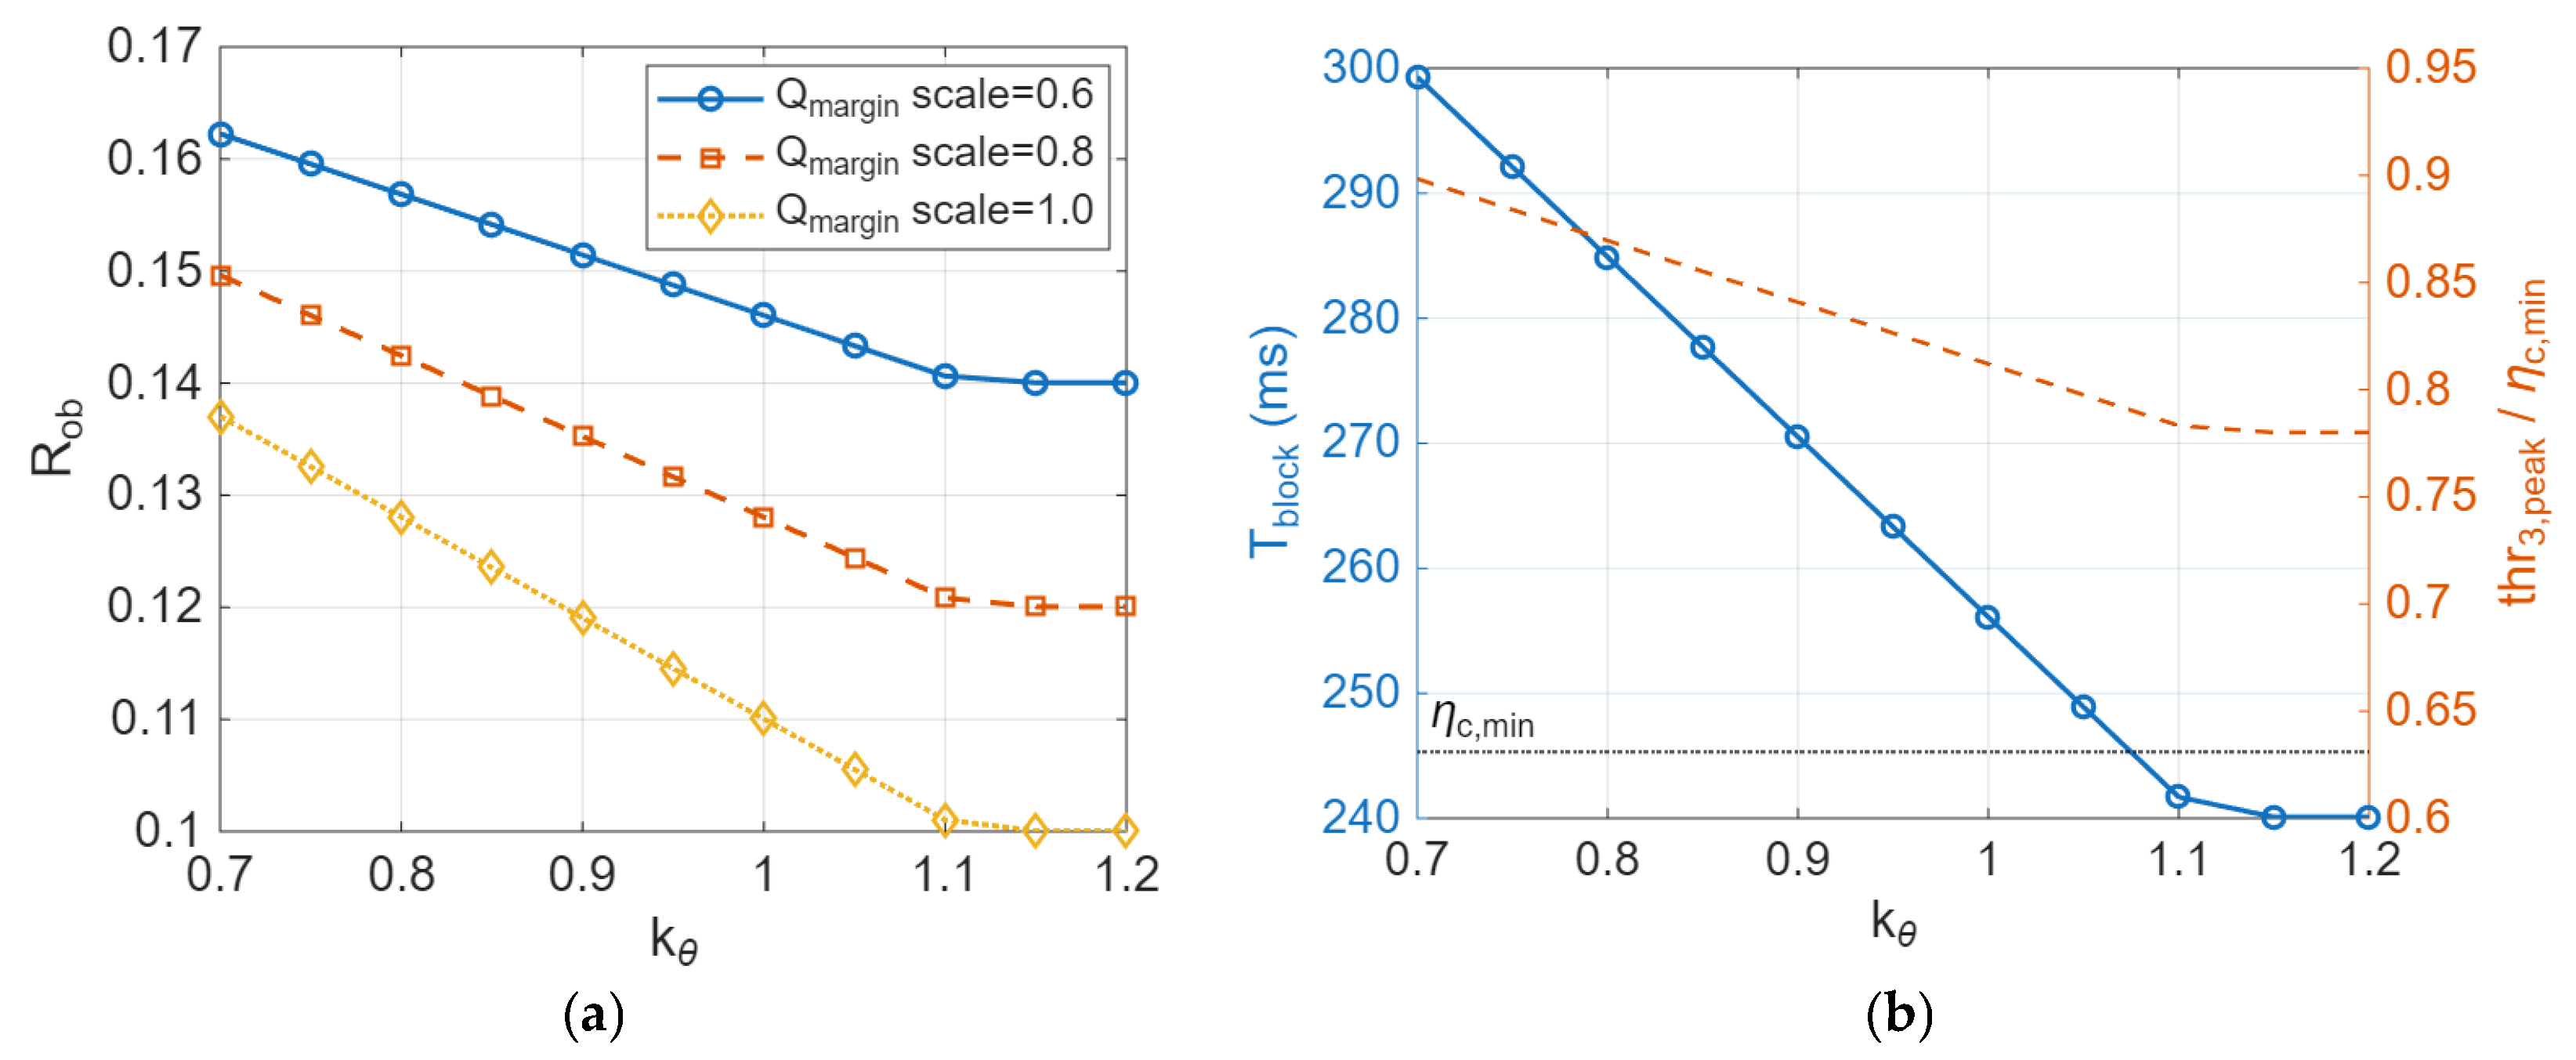
When the kθ values are uniformly scaled over [0.7, 1.2], Rob plateaus once the scaling reaches approximately 1.15, identifying the recommended reference range. Figure 12 presents a representative scan result.
Figure 12 indicates that uniformly tightening the tabulated kθ values can reduce unnecessary blocking in the loose threshold region, but the benefit gradually saturates as the scaling factor approaches about 1.15. Beyond this point, the reduction in Rob becomes limited, while the associated changes in blocking duration and effective threshold level suggest diminishing returns. In contrast, excessive relaxation of kθ weakens the protection criterion and increases the risk of undesired actions. The figure therefore supports using the plateau region near the nominal setting as the practical tuning interval.

4.5.3. Engineering Implementation Feasibility

The results confirm that SVF active support does not equate to “voltage recovery = commutation recovery.” The core issue is that voltage magnitude, phase, harmonics, and protection inputs do not share a simple monotonic mapping; they are strongly influenced by the control state. The key contribution of this paper is unifying device state, commutation physics, and protection logic into a single coordinated framework.
From an engineering deployment perspective, the proposed method has strong practical potential. The ηc calculation requires only three-phase voltage sampling and DC current measurement, completed via sliding-window integration. Its computational load is comparable to conventional RMS-type protection relays and is well within the capability of modern digital protection hardware. SVF health status and reactive power margin are already accessible in the DCS of existing SLCC-HVDC projects; only a communication channel from the DCS to the protection device is needed. The protection logic can be implemented as IEC 61850 standard [30] logic nodes embedded in existing protection devices or station control layer applications, without modifying the power system topology or primary equipment. For existing engineering systems, the method is better suited as an enhancement module for online threshold adjustment and protection coordination, rather than a complete replacement of existing protection chains.

5. Conclusions

This paper proposes a state-aware coordinated protection method for LCC-HVDC systems with SVF active support in weak receiving-end grids. The primary findings are as follows:
  • The normalized commutation margin index ηc constructed from the commutation voltage time integral, characterizes the nonlinear extension of the CF boundary under SVF support. Engineering SoE evidence confirms that voltage magnitude recovery alone does not guarantee a sufficient commutation margin, making ηc-based consistency verification necessary.
  • By explicitly incorporating the SVF state into threshold modification and combining it with a staged response strategy, the proposed method addresses both the non-stationary features that arise during fault ride-through and the excessive escalation of SVF zone internal faults. EMT and protection logic replay results show that the method exhibits good robustness and adaptability in the tested scenarios, maintains zero failure to operate at SNR ≥ 30 dB, and effectively suppresses misblocking during SVF degradation.
  • The proposed method is compatible with existing engineering action matrix architectures and can be deployed as an enhancement module within existing protection and dispatch software frameworks without changing the primary system topology or adding hardware, thereby providing support for protection tuning, logic optimization, and improved operational continuity in weak receiving-end LCC-HVDC systems.
The present study mainly verifies the consistency between the QSS model and protection decisions under conventional scenarios, while further discussion is still needed regarding the errors that may arise under more extreme transient conditions. In addition, the current validation is based on a single engineering parameter set and a representative fault set, and has not yet been extended to different capacity ratings, multi-terminal DC systems, or more complex control strategies. Moreover, the noise tolerance and engineering generality of the proposed method still warrant further assessment through higher-noise disturbance tests and field closed-loop validation. Future research may, therefore, focus on online EMT-assisted calibration, broader engineering scenarios, and field-oriented validation to further improve the applicability of the method under complex operating conditions.

Author Contributions

Conceptualization, X.L. and H.W.; Methodology, X.Z. and D.L.; Validation, B.L.; Resources, D.L. and Z.H.; Writing—original draft, H.Z.; Writing—review & editing, C.X. and H.W.; Funding acquisition, X.M. and H.W. All authors have read and agreed to the published version of the manuscript.

Funding

This research was funded by NR Electric Co., Ltd., grant number JS2500382.

Data Availability Statement

Due to confidentiality of the HVDC project, the RTDS model files and raw SoE logs cannot be publicly released. Additional data may be available from the corresponding author upon reasonable request and approval by the project owner.

Conflicts of Interest

Authors Xiaodong Liu, Xianmeng Zhang and Bailiang Liu were employed by the company State Grid Jiangsu Electric Power Co., Ltd. Authors Xintong Mao and Huilong Zhao were employed by the company Construction Branch Corporation State Grid Jiangsu Electric Power Co., Ltd. Authors Dongbin Lu and Zhilin Huang were employed by the company NR Electric Co., Ltd. Author Changyun Xu was employed by the company East China Electric Power Design Institute Co., Ltd. of China Power Engineering Consulting Group. The remaining author declares that the research was conducted in the absence of any commercial or financial relationships that could be construed as a potential conflict of interest. The authors declare that this study received funding from NR Electric Co., Ltd., grant number JS2500382. The funder was not involved in the study design, collection, analysis, interpretation of data, the writing of this article or the decision to submit it for publication.

Appendix A

Table A1. Statistical performance evaluation across typical fault scenarios.
Fault Scenarioηc,minProtection MethodMisblocking Rate RobFailure to Operate Rate RmtBlocking Duration Tblock (s)
AG (10 Ω)0.820Baseline (SVF bypassed)000
Baseline (SVF normal)000
Proposed (SVF normal)000
Proposed (SVF bypassed)0.10000.200
AG (30 Ω)0.964Baseline (SVF bypassed)000
Baseline (SVF normal)000
Proposed (SVF normal)000
Proposed (SVF bypassed)000
BCG (Solid)<0.001Baseline (SVF bypassed)0.10100.201
Baseline (SVF normal)0.10100.201
Proposed (SVF normal)0.10100.201
Proposed (SVF bypassed)0.10100.201
BCG (10 Ω)0.327Baseline (SVF bypassed)0.10100.201
Baseline (SVF normal)0.10100.201
Proposed (SVF normal)0.10100.201
Proposed (SVF bypassed)0.10100.201
BCG (30 Ω)0.631Baseline (SVF bypassed)0.10000.200
Baseline (SVF normal)0.10000.200
Proposed (SVF normal)0.10000.200
Proposed (SVF bypassed)0.10000.200
ABC (Solid)<0.001Baseline (SVF bypassed)0.10000.201
Baseline (SVF normal)0.10000.201
Proposed (SVF normal)0.10000.201
Proposed (SVF bypassed)0.10000.201
ABC (30 Ω)0.616Baseline (SVF bypassed)0.10000.200
Baseline (SVF normal)0.10000.200
Proposed (SVF normal)0.10000.200
Proposed (SVF bypassed)0.10000.200
Table A2. Detailed staged response statistics for SVF zone internal faults.
Fault TypeProtection MethodLevel ILevel IILevel III
F101 Starting resistorBaseline-BYesNo
F101 Starting resistorProposedYesYesYes
F102 Valve group connection lineBaseline-BYesYes
F102 Valve group connection lineProposedYesYesYes
F103 Valve group internalBaseline-BYesYesNo
F103 Valve group internalProposedYesYesYes
F104 Reactor connectionBaseline-BYesYes
F104 Reactor connectionProposedYesYesYes
Table A3. Joint SNR × δ × Tver robustness matrix (Rob).
SNR (dB)δTver = 100 msTver = 200 msTver = 300 ms
Inf0.020.0500.2000.200
Inf0.050.0500.1000.100
Inf0.100.0000.0000.000
300.020.9990.9990.999
300.050.0500.1000.100
300.100.0500.0500.050
200.020.9990.9990.999
200.050.1000.2000.200
200.100.0500.1000.100

Appendix B

The QSS approximation in Equations (3) and (4) may introduce commutation margin estimation errors during extreme transient AC faults. These errors arise from two main sources: rapid voltage amplitude variations within a commutation evaluation window, which reduce the accuracy of the slowly varying amplitude assumption, and harmonic components and phase jumps, which alter the effective commutation voltage time integral and bias estimates based on fundamental dominant assumptions.
While these errors reduce the numerical accuracy of the normalized commutation margin, they do not invalidate the protection mechanism analysis. The primary role of the QSS model in this paper is to characterize the influence of SVF support on the commutation boundary, threshold modification trends, and relative margin changes across different operating states, rather than to provide precise instantaneous responses as a substitute for EMT models. As long as the approximation correctly captures the boundary trend (sufficient–critical–insufficient), its theoretical value for protection criteria design remains valid. Thus, errors under extreme transients represent limitations in numerical precision rather than a failure of the protection mechanism analysis.
Based on these considerations, the QSS approximation is applicable for analyzing CF boundary trends and state correction directions under SVF active support. For instantaneous margin assessment during severe voltage sags, strong harmonic distortion, or significant phase jumps, ηc computed directly from EMT waveforms should be used as the reference.

References

  1. Zhou, H.; Yao, W.; Ai, X.; Li, D.; Wen, J.; Li, C. Comprehensive review of commutation failure in HVDC transmission systems. Electr. Power Syst. Res. 2022, 205, 107768. [Google Scholar] [CrossRef]
  2. Zhou, C.; Fang, C.; Kandic, M.; Wang, P.; Kent, K.; Menzies, D. Large-scale hybrid real time simulation modeling and benchmark for Nelson River multi-infeed HVdc system. Electr. Power Syst. Res. 2021, 197, 107294. [Google Scholar] [CrossRef]
  3. Acosta, J.S.; Xiao, H.; Gole, A.M. Sensitivity analysis of commutation failure in multi-infeed HVDC systems: Exploring the impact of AC system representations and fault types. Electr. Power Syst. Res. 2024, 234, 110802. [Google Scholar] [CrossRef]
  4. Xiao, H.; Duan, X.; Li, Y. Analytically evaluating the impact of voltage stability on commutation failure in multi-infeed LCC-HVDC systems. IEEE Trans. Power Deliv. 2022, 37, 496–506. [Google Scholar] [CrossRef]
  5. Silva, K.M.; Tavares, J.J.C.; Ribeiro, N.S.S.; Lopes, F.V. Impact of DFT-based phasor estimation errors due to commutation failures of LCC-HVDC links on the protection of AC lines in the near vicinity. Electr. Power Syst. Res. 2021, 196, 107287. [Google Scholar] [CrossRef]
  6. Li, S.; Li, Y. Suppression to commutation failure of UHVDC in hierarchical connection mode with synchronous condenser by enhancing post-fault system strength. IEEE Trans. Power Deliv. 2025, 40, 864–877. [Google Scholar] [CrossRef]
  7. Neves, G.; Watanabe, E.H. Series voltage conditioner (SeVC) to mitigate commutation failure in HVDC-LCC systems. IEEE Trans. Power Deliv. 2024, 39, 2264–2274. [Google Scholar] [CrossRef]
  8. Jin, X.; Nian, H. Overvoltage suppression strategy for sending AC grid with high penetration of wind power in the LCC-HVdc system under commutation failure. IEEE Trans. Power Electron. 2021, 36, 10265–10277. [Google Scholar] [CrossRef]
  9. Fernandes, R.O.; Tavares, M.C. Mitigation of the commutation failure problem in the HVDC multi-infeed scenario in Brazil using synchronized phasor measurement. Electr. Power Syst. Res. 2024, 235, 110829. [Google Scholar] [CrossRef]
  10. Yin, C.; Su, C. DC current prediction and suppression control strategies for inhibiting commutation failure in LCC-HVDC. Electr. Power Syst. Res. 2023, 220, 109359. [Google Scholar] [CrossRef]
  11. Li, D.; Gao, Y.; Sun, M. A general self-adaptive DC current control of LCC-HVDC for eliminating subsequent commutation failure. IEEE Trans. Power Deliv. 2023, 38, 2232–2235. [Google Scholar] [CrossRef]
  12. Liu, L.; Li, X.; Teng, Y.; Zhang, C.; Lin, S. An enhanced commutation failure prevention control in LCC based HVDC systems. Int. J. Electr. Power Energy Syst. 2023, 145, 108584. [Google Scholar] [CrossRef]
  13. Ouyang, J.; Ye, J.; Yu, J.; Zhang, Z.; Wang, J. Commutation failure suppression method considering chain reaction in multi-infeed LCC-HVDC systems. Int. J. Electr. Power Energy Syst. 2023, 146, 108792. [Google Scholar] [CrossRef]
  14. Yang, H.; Yan, C.; Wang, Y.; Liu, Y.; Liu, Z.; Liu, Q.; Wang, W.; Liu, H. Sending-end voltage fluctuation mechanism and suppression under commutation failures in LCC-HVDC systems. Electr. Power Syst. Res. 2025, 249, 112078. [Google Scholar] [CrossRef]
  15. Chen, N.; Yang, Y.; Li, L.; Cui, C.; Xue, Y.; Zhang, X.-P. Commutation failure prediction for multi-infeed LCC-HVDC systems under asymmetrical faults. IEEE Trans. Power Deliv. 2023, 38, 2034–2046. [Google Scholar] [CrossRef]
  16. Xiao, H.; Li, Y.; Duan, X. Enhanced commutation failure predictive detection method and control strategy in multi-infeed LCC-HVDC systems considering voltage harmonics. IEEE Trans. Power Syst. 2021, 36, 81–96. [Google Scholar] [CrossRef]
  17. Ma, J.; Liu, C.; Cheng, P. A detection method for HVDC commutation failure based on the variation rate of commutation inductance energy. IET Gener. Transm. Distrib. 2022, 16, 1914–1929. [Google Scholar] [CrossRef]
  18. Feng, J.; Liu, Z.; Li, K.; Li, B.; Li, J.; Li, L. A fast and high-accurate commutation failure identification method for LCC-HVDC system. High Volt. 2024, 9, 721–732. [Google Scholar] [CrossRef]
  19. Ouyang, J.; Pan, X.; Ye, J.; Xiao, C.; Diao, Y.; Zhang, Q. An improved prediction method of subsequent commutation failure of an LCC-HVDC considering sequential control response. Prot. Control Mod. Power Syst. 2023, 8, 46. [Google Scholar] [CrossRef]
  20. Zheng, Z.; Zou, Y.; Xie, Q.; Liu, L.; Ren, J.; Xiao, X.; Zhang, J. Side effect of VSC-HVDC on commutation failure in LCC-HVDC caused by sending end AC faults. IEEE Trans. Power Deliv. 2024, 39, 1310–1313. [Google Scholar] [CrossRef]
  21. Guo, C.; Zhao, C. Novel thyristor-based module-cascaded converter to eliminate commutation failure for LCC-HVDC application. IEEE Trans. Power Deliv. 2024, 39, 3492–3502. [Google Scholar] [CrossRef]
  22. Zhou, B.; Li, B.; He, J.; Li, Y.; Li, Q. A novel mitigation strategy of subsequent commutation failures in the hybrid cascaded LCC-MMC HVDC transmission system. Int. J. Electr. Power Energy Syst. 2023, 148, 108969. [Google Scholar] [CrossRef]
  23. Su, C.; Yin, C.; Li, F.; Han, L. A novel recovery strategy to suppress subsequent commutation failure in an LCC-based HVDC. Prot. Control Mod. Power Syst. 2024, 9, 38–51. [Google Scholar] [CrossRef]
  24. Xiao, H.; Ren, S.; Li, Y. Novel disturbance blocking criterion for reliable current differential protection of LCC-HVDC lines. IEEE Trans. Power Deliv. 2021, 36, 477–480. [Google Scholar] [CrossRef]
  25. Liu, Z.; Gao, H.; Luo, S. Non-unit protection for long-distance LCC-HVDC transmission lines based on waveform characteristics of voltage travelling waves. Int. J. Electr. Power Energy Syst. 2023, 150, 109079. [Google Scholar] [CrossRef]
  26. Deb, S.; Lata, S.; Bhadoria, V.S.; Tiwari, S.; Maris, T.I.; Vita, V.; Fotis, G. Improved relay algorithm for detection and classification of transmission line faults in monopolar HVDC transmission system using signum function of transient energy. IEEE Access 2024, 12, 15561–15571. [Google Scholar] [CrossRef]
  27. Lei, S.; Shu, H.; Hu, Y.; Wang, S.; Wang, G.; Shi, B. Single-end line protection of hybrid HVDC system based on boundary characteristic frequency band energy ratio. IEEE Trans. Ind. Electron. 2026, early access. [Google Scholar] [CrossRef]
  28. Liang, Y.; Zhang, J.; Shi, Z.; Zhao, H.; Wang, Y.; Xing, Y.; Zhang, X.; Wang, Y.; Zhu, H. A fault identification method of hybrid HVDC system based on wavelet packet energy spectrum and CNN. Electronics 2024, 13, 2788. [Google Scholar] [CrossRef]
  29. Dennetière, S.; Rault, P.; Sharifabadi, K.; Krajisnik, N.; Priebe, T.; Hjalmarsson, P. De-risking the first multivendor HVdc project using real-time hardware-in-the-loop simulation: Electromagnetic transient and real-time simulations are crucial. IEEE Power Energy Mag. 2024, 22, 73–86. [Google Scholar] [CrossRef]
  30. IEC 61850; Communication Networks and Systems for Power Utility Automation. International Electrotechnical Commission (IEC): Geneva, Switzerland, 2013.
Figure 1. Configuration of a symmetric monopole HVDC system with inverter-side SLCC (SVF) and conventional rectifier-side LCC.
Electronics 15 02115 g001
Figure 2. Overall state-aware coordinated protection procedure.
Electronics 15 02115 g002
Figure 3. Main circuit configuration of the Yangzhou–Zhenjiang HVDC Phase II project.
Electronics 15 02115 g003
Figure 4. Representative transient waveforms during a rectifier-side AC single-phase-to-ground fault (100 ms), redrawn from engineering RTDS recordings.
Electronics 15 02115 g004
Figure 5. SoE timeline of the DC line low-voltage protection function blocking during an AC single-phase-to-ground fault (100 ms). Blocking durations of 0.397 s and 0.412 s are observed in two injection runs; the recovery delay between “low AC voltage monitoring disappearance” and “protection function release” is approximately 0.28 s.
Electronics 15 02115 g005
Figure 6. SoE evidence of concurrent harmonic control loop exit and re-entry events during fault ride-through. Thirty loops exit simultaneously at the same timestamp; re-entry occurs approximately 0.176 s later.
Electronics 15 02115 g006
Figure 7. SVF protection zone and internal fault locations (F101–F104) in the Yangzhou–Zhenjiang HVDC Phase II project.
Electronics 15 02115 g007
Figure 8. Time-domain comparison of ηc, staged response level, and kθ under a representative moderate fault for four protection methods.
Electronics 15 02115 g008
Figure 9. ηc stability and protection action robustness under different SNR conditions. Moderate fault: Rf = 30 Ω, SVF on; severe fault: SVF on. (a) Minimum ηc under different SNR conditions. (b) False-blocking rate under different SNR conditions. (c) Standard deviation of ηc under different SNR conditions.
Electronics 15 02115 g009
Figure 10. Joint effect of δ and Tver on misblocking rate under noisy conditions. (a) Effect of δ on false-blocking rate. (b) Effect of Tver on false-blocking rate.
Electronics 15 02115 g010
Figure 11. Sensitivity heatmaps of Rob and Rmt over the δ–Tver parameter plane. (a) Sensitivity heatmaps of false-blocking rate Rob over the δTver parameter plane. (b) Sensitivity heatmaps of failure to operate rate Rmt over the δTver parameter plane.
Electronics 15 02115 g011
Figure 12. Representative effect of uniformly scaling the tabulated kθ values on misblocking rate, blocking duration, and effective threshold level. (a) False-blocking rate under uniform scaling of kθ. (b) Blocking duration and effective threshold under uniform scaling of kθ.
Electronics 15 02115 g012
Table 1. Conceptual comparison of the normalized commutation margin and conventional indices.
IndexPhysical BasisTypeKey Limitation/Feature Under SVF Active Support
ηcRatio of commutation voltage time integral to current transfer requirementTime areaReflects changes in effective voltage time integral; characterizes nonlinear compensation effects
UcommSliding-window RMS amplitude of commutation or valve-side voltageAmplitudeSusceptible to smoothing; response to rapid state transitions is relatively lagged
γestNatural extinction angle estimated from commutation equationsAngleAffected by controller regulation; insufficient sensitivity to intermediate risk and gradual margin erosion
Table 2. Redundant consistency check validation.
ScenarioSVF Health StatusQmarginSuspicious Flag
Healthy-NominalNo
Measurement deviationHealthy (0)>NominalNo
State conflictDegraded (2)>>NominalYes
Genuine degradationDegraded (2)Below nominalNo
Bypass degradationBypass (3)0No
Table 3. State-conditioned threshold modification rules (example).
State ConditionkθkTDescription
Shealth = Normal, Qmargin > 0.31.01.0Nominal state
Shealth = Normal, Qmargin ≤ 0.30.90.8Reduced support margin
Shealth = Current limiting0.80.6Reactive power output limited
Shealth = Loop exit0.70.5Harmonic characteristics may mutate
Shealth = Bypass0.60.4No active support
ηc ≤ 1 − δ (superimposed)×0.8Forced tightening
Table 4. DC line low-voltage protection function blocking duration statistics (n = 108).
StatisticValue (s)
Minimum0.396
Median0.608
Mean0.608
Maximum0.815
Table 5. Low AC voltage switching system state duration statistics (n = 202).
StatisticValue (s)
Minimum0.005
Median0.130
Mean0.261
Maximum0.495
Table 6. Harmonic control loop exit event statistics.
StatisticValue
Total exit events3189
Maximum concurrent exits at same timestamp30
Table 7. Pole isolation command duration statistics (n = 70).
StatisticValue (s)
Minimum0.002
Median0.033
Mean0.102
Maximum2.844
Table 8. SNR robustness scan results.
SNR (dB)ηc,min (Moderate)Rob (Moderate)σ(ηc) (Moderate)ηc,min (Severe)Rob (Severe)
Inf0.6310.1000.0140.00060.101
400.6420.1000.0150.00350.101
300.6610.1000.0230.01120.101
200.6270.2000.0610.01960.101
100.3090.9980.1870.02170.998
Table 9. SVF zone internal fault staged response comparison.
Fault TypeMethodHighest Response LevelEscalation SuccessfulEscalation Delay (ms)
F101 (Starting resistor)Baseline-BINo
F101ProposedIIIYes0
F102 (Valve group connection line)Baseline-BIIIYes0.3
F102ProposedIIIYes0
F103 (Valve group internal)Baseline-BIINo
F103ProposedIIIYes0
F104 (Reactor connection)Baseline-BIIIYes0.3
F104ProposedIIIYes0
Disclaimer/Publisher’s Note: The statements, opinions and data contained in all publications are solely those of the individual author(s) and contributor(s) and not of MDPI and/or the editor(s). MDPI and/or the editor(s) disclaim responsibility for any injury to people or property resulting from any ideas, methods, instructions or products referred to in the content.