Article

CDMed: Medication Recommendation via Causal Inference and Dual-Granularity Information Enhancement

Faculty of Information Engineering and Automation, Kunming University of Science and Technology, Kunming 650504, China
*
Author to whom correspondence should be addressed.
Electronics 2026, 15(10), 2087; https://doi.org/10.3390/electronics15102087
Submission received: 20 April 2026 / Revised: 9 May 2026 / Accepted: 12 May 2026 / Published: 13 May 2026
(This article belongs to the Special Issue AI-Driven Intelligent Systems in Energy, Healthcare, and Beyond)

Abstract

Medication recommendation, a crucial application of artificial intelligence in healthcare, has garnered widespread attention due to its research and practical value. However, existing methods often struggle to address three key challenges: misleading co-occurrence correlations, insufficient medication representation, and the balance between recommendation accuracy and drug–drug interaction (DDI). To overcome these challenges, we propose CDMed, a medication recommendation framework based on causal inference and dual-granularity information enhancement. First, the framework applies causal inference to identify and quantify the real therapeutic pathways among diseases, procedures, and medications in electronic health record (EHR), effectively filtering out spurious correlations commonly found in co-occurrence statistics. Second, by integrating coarse-grained medical entity relationships with fine-grained molecular structural information, it achieves effective multi-scale information fusion and enhances medication representation. Additionally, CDMed jointly models the 2D and 3D molecular structures of medications, serving as the foundation for subsequent molecular feature extraction. Finally, to achieve a balance between recommendation accuracy and safety, we applied a DDI-Constrained Bias Correction at the output stage, which enhances recommendation accuracy while controlling clinical risks. Extensive experiments on two public datasets demonstrate that CDMed improves recommendation accuracy by 2.2%, while maintaining a low DDI rate of 0.0661 alongside high inference efficiency. This result proves that CDMed achieves an optimal balance among recommendation accuracy, safety, and computational efficiency.

1. Introduction

The rapid advancement of artificial intelligence has greatly driven innovation in medical diagnosis and treatment, with AI-based healthcare recommendation systems [1] becoming a crucial part of the intelligent medical ecosystem. These systems leverage large-scale electronic health record (EHR) data [2] to assist clinicians in generating precise and safe personalized medication plans tailored to the patient’s clinical context. In doing so, they enhance clinical efficiency, improve patient outcomes, and reduce uncertainty in medical decision-making. Medication recommendation is more complex than traditional recommendation tasks, primarily with regard to two aspects: it outputs a combination of multiple medications rather than a single item, and interactions between drugs must be considered. Recommending interacting medications can reduce efficacy or even cause adverse effects, endangering patient safety. Therefore, such systems must ensure both accuracy and strict control of drug--drug interaction (DDI) [3] to maintain clinical safety.
To address these complexities, researchers have conducted extensive investigations. Early studies [4,5,6] relied exclusively on the current health information of the patient for medication recommendation. Although these methods achieved some initial results, their further development was hindered by the neglect of the long-term medical history across multiple patient encounters. Subsequent researchers [7,8,9] significantly improved accuracy by modeling the sequences of historical medical records. Recently, following advancements in DDI [10] research, several studies [11,12] have proposed incorporating molecular-level knowledge into medication recommendation, which plays a critical role in enhancing the safety of the recommended regimens.
Despite the significant achievements of existing research, several limitations persist in the following areas:
(1)
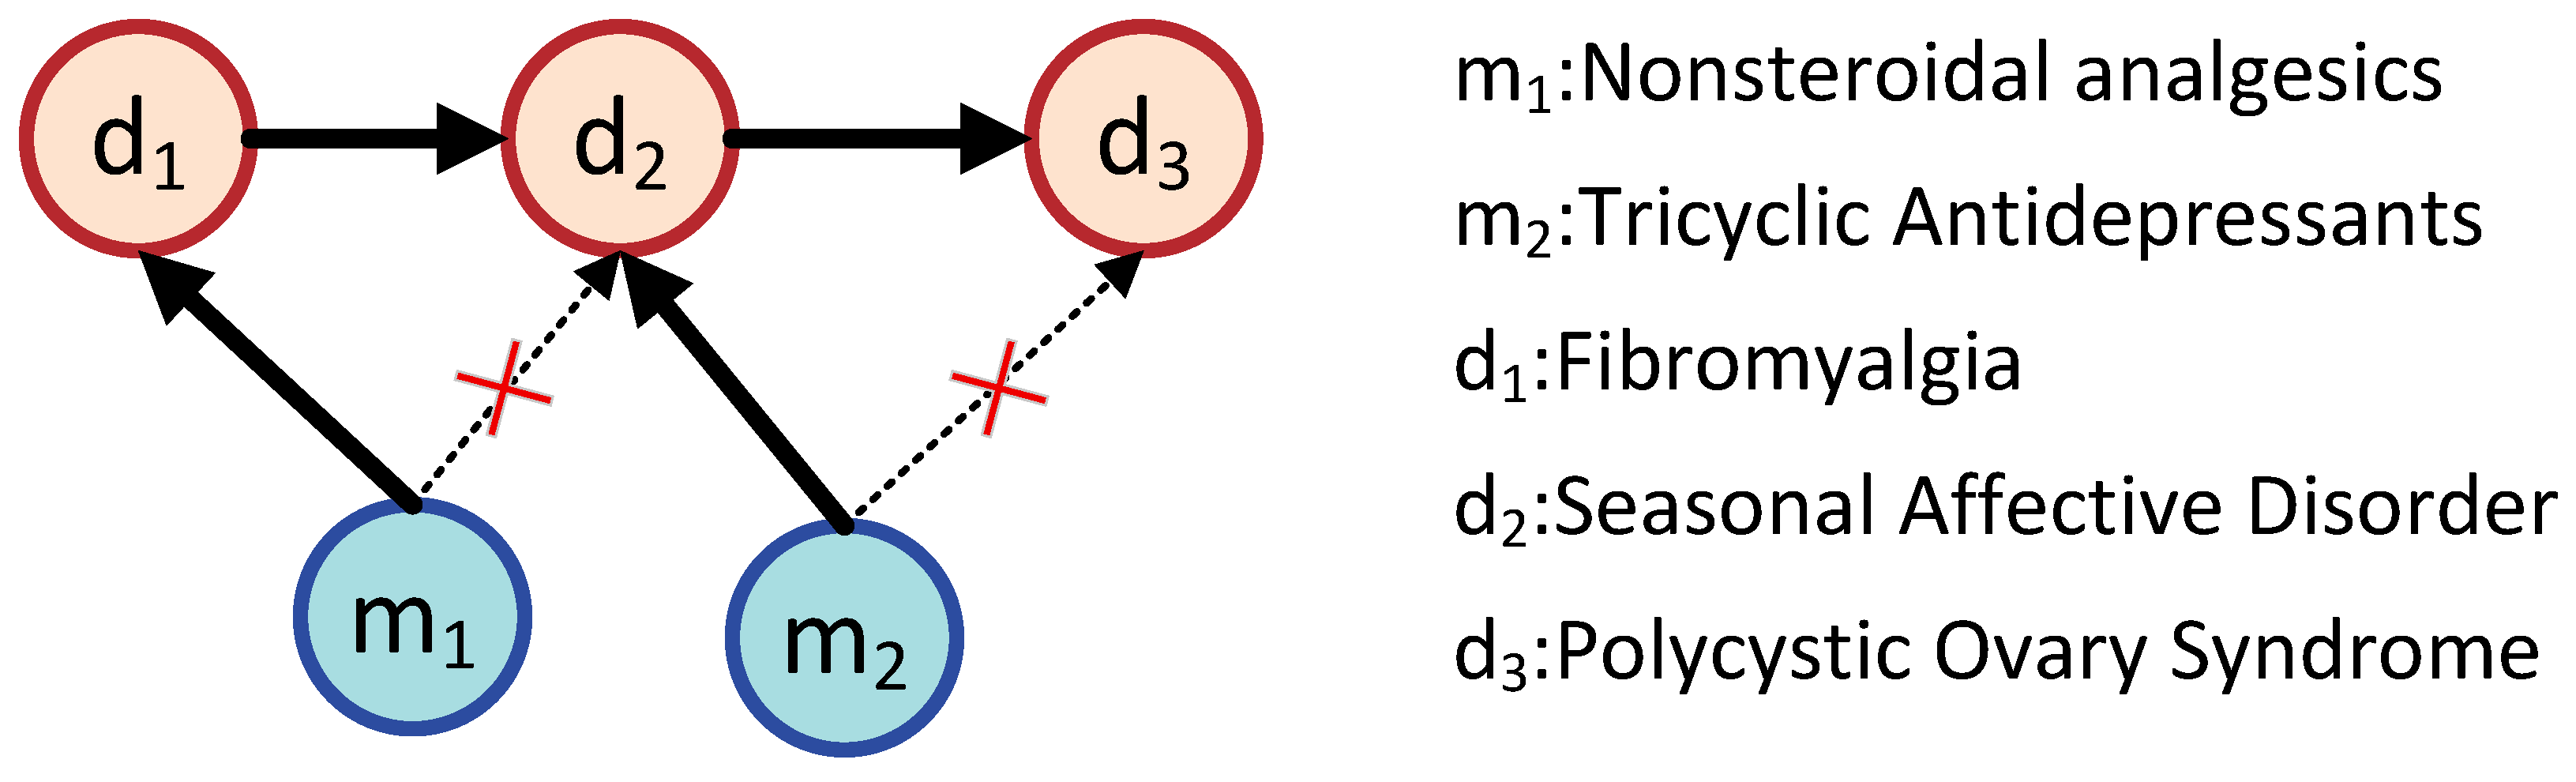
Misleading Co-occurrence of Diseases and Medications. High co-occurrence between medications and diseases in medical data is often mistaken for direct therapeutic relationships. As shown in Figure 1, while pairs like ( m 1 , d 1 ) and ( m 2 , d 2 ) reflect true treatment links, causal chains among diseases (e.g., d 1 d 2 d 3 ) cause d 2 and d 3 to co-occur statistically with m 1 and m 2 . Existing methods over-rely on co-occurrence statistics and cannot separate direct therapeutic effects from indirect correlations, leading to accumulated semantic errors in feedback loops that ultimately compromise the clinical accuracy and safety of recommendation systems.
(2)
Inadequate Medication Representation. Current medication representation methods can be categorized into two types: entity-based (coarse-grained) and molecular structure-based (fine-grained) approaches. Coarse-grained methods treat drugs as basic entities, ignoring their chemical and structural properties, which hinders the recognition of drug similarities and interactions. Fine-grained methods provide richer chemical information but primarily operate at the molecular level, while the recommendation target is the complete medication.This may lead the model to favor optimizing molecular-level features over the overall therapeutic efficacy of medications, thereby causing the learning objective to deviate from the medication recommendation task. Furthermore, if fine-grained representations rely solely on 2D structures, they lack 3D conformational information and may lead to misleading recommendations due to high similarity in 2D structures.
(3)
DDIs have not been adequately addressed. Recommended medication combinations may involve complex and clinically significant DDIs. For instance, concurrent use of olanzapine (an antipsychotic) and lorazepam (an anxiolytic) can lead to excessive central nervous system depression, increasing risks of over-sedation, respiratory depression, or coma. Therefore, effective DDI control is essential for patient safety. Prior work remains insufficient: some studies [8,13] focus only on recommendation accuracy and neglect DDI considerations, while others [11,14] that do address DDI still exhibit methodological limitations and performance bottlenecks.
In response to these challenges, some studies [11,12] have incorporated molecular knowledge to reduce the risk of DDI, demonstrating strong safety performance. However, they tend to focus excessively on molecular details and fail to consider the causal role of the medication as a holistic entity in treatment. Other studies [15,16] apply causal inference to avoid being misled by superficial co-occurrence associations, which improves accuracy but often struggles to simultaneously ensure medication safety. Furthermore, most current methods rely only on 2D molecular information and have not effectively leveraged 3D information to enhance medication representation.
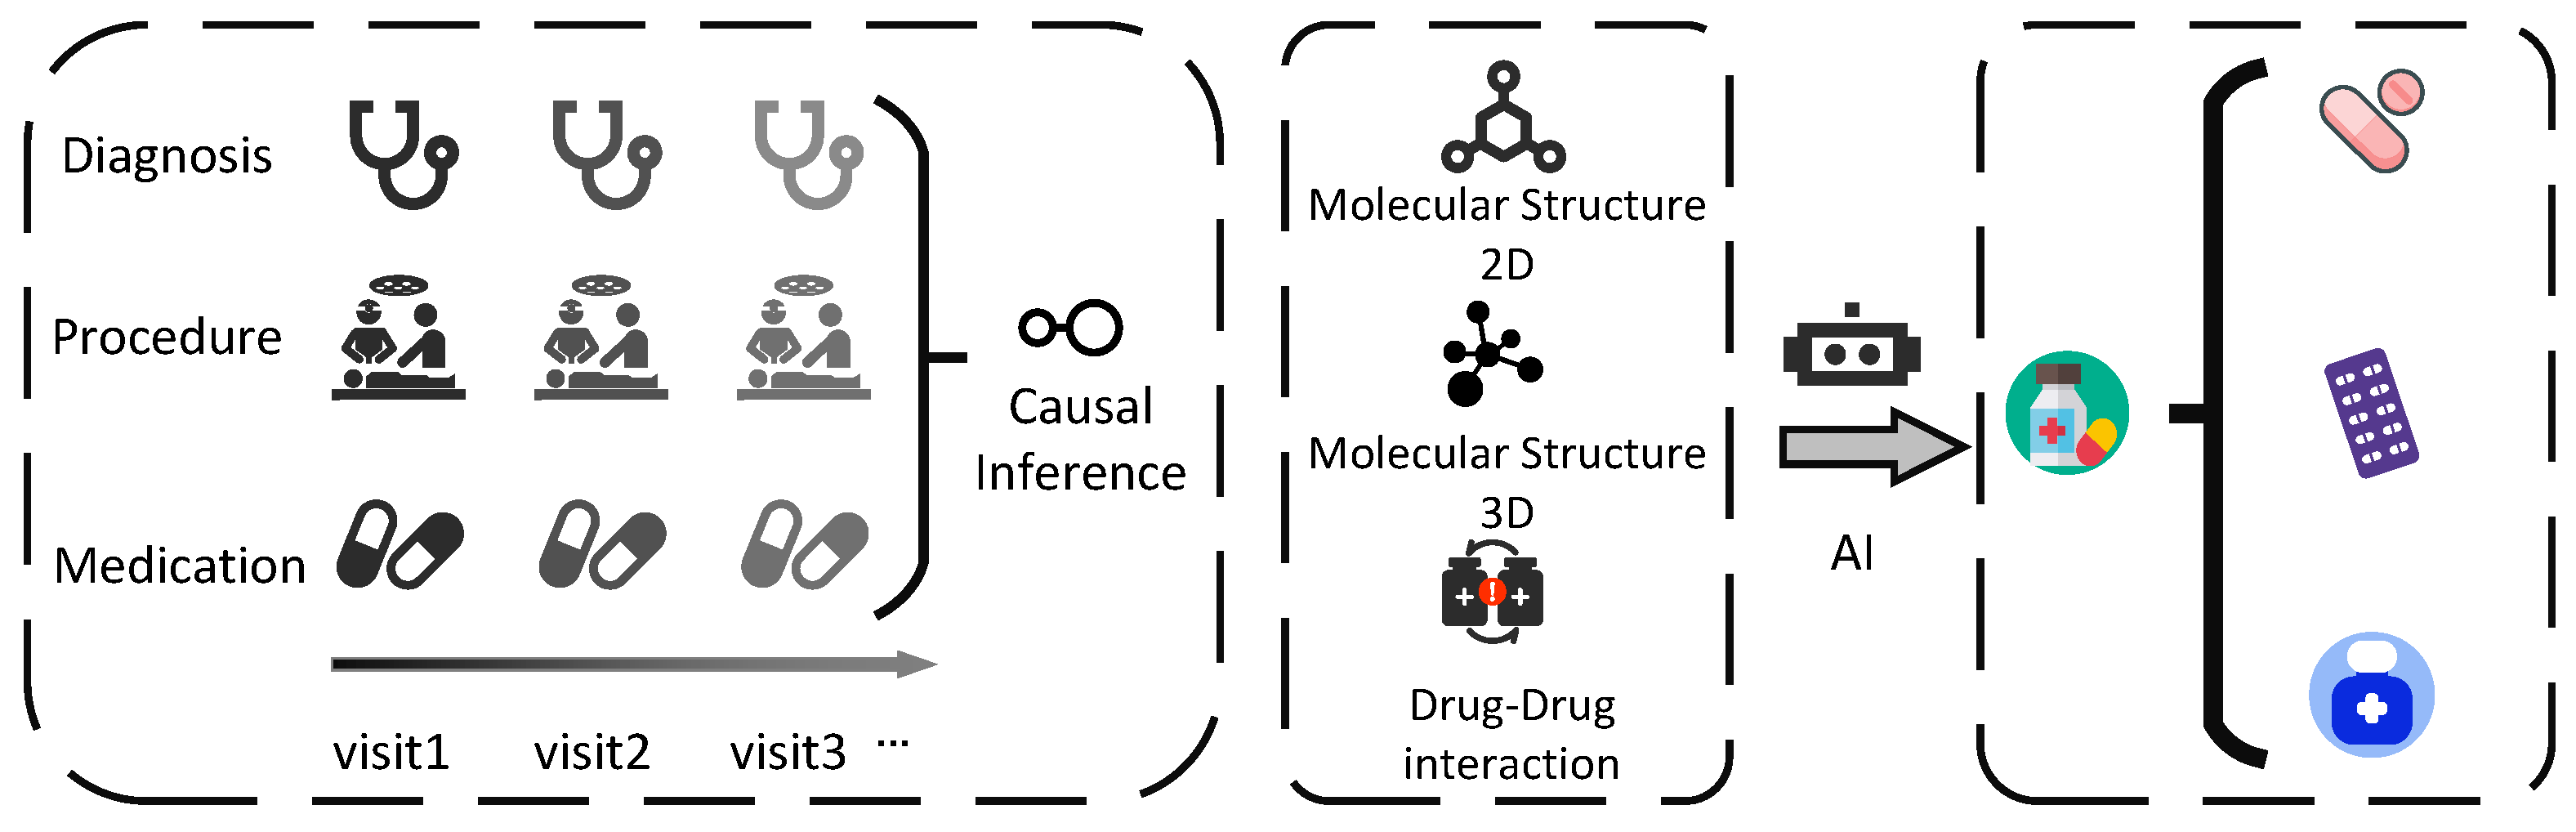
To address the aforementioned limitations, we propose CDMed, a medication recommendation framework based on causal inference and dual-granularity information enhancement. Figure 2 illustrates the workflow of CDMed. As shown in Figure 1, traditional methods often misinterpret disease co-occurrence chains as direct medication–disease therapeutic relationships, leading to recommendation bias. CDMed first employs causal inference to identify and remove such spurious correlations, thereby establishing a clear causal foundation for the subsequent dual-granularity information enhancement. Second, based on the generated causal relationships and the introduced external molecular knowledge, we explore richer associations between medications and molecules. Finally, to balance recommendation accuracy and safety, a DDI-constrained bias-correction module adjusts the final recommendation probability for each medication, and the recommended medication combination is derived based on the adjusted recommendation probabilities.
Our contributions can be summarized as follows:
  • We propose the CDMed framework, which integrates causal reasoning and dual-granularity information enhancement to address issues of misleading co-occurrence associations, insufficient representation, and the balance between safety and accuracy in medication recommendation.
  • We develop an innovative medication recommendation framework that integrates coarse-grained entity information with fine-grained molecular structural information, incorporates a molecular contrastive learning mechanism, and distills 3D molecular spatial information into a 2D graph encoder to facilitate effective extraction of molecular features.
  • We design a DDI-constrained bias correction module that enhances recommendation safety and accuracy by removing spurious correlations and mitigating DDI risks, achieving an optimal balance between safety and efficacy.
  • We conduct comprehensive experiments on two real-world data sets. The results demonstrate the superiority of the proposed method compared to other state-of-the-art baseline models.

2. Related Work

2.1. Medication Recommendation

Early medication recommendation studies, such as LEAP [6], adopted instance-based approaches that focused on single-visit data and framed the task as a multi-instance, multi-label classification problem. The field has progressed considerably in recent years, and current mainstream models for medication recommendation can be grouped into three main research directions:
The first category of research enhances personalization by modeling the sequential relationships of patient encounters. RETAIN [17] leverages patient medical history for disease prediction, whereas GAMENet [8] constructs a graph-enhanced memory module that integrates historical visit and medication data into dynamic storage for recommendations. COGNet [18] models historical visit data to recommend medications, either repeating previous prescriptions or predicting new ones. The second category improves prescription accuracy by mining associations between medical entities. DPG [19] constructs DDI graphs based on domain knowledge and medical records to model dynamic interactions. StratMed [20] mitigates data sparsity through a relational hierarchy mechanism. The third category enhances medication safety by integrating medication-related knowledge. SafeDrug [11] and MoleRec [12] utilize molecular data to reduce adverse interactions. Carmen [21] and DFHD [22] combines patient history with molecular functional learning, and BiMoRec [23] introduces 3D molecular structures to address the inherent limitations of 2D information.
Despite the previous methods having achieved success, they still possess certain limitations: (1) These methods mainly rely on co-occurrence patterns between medical entities in patient records, potentially introducing spurious correlations. (2) They do not consider collaborative complementary learning and recommendation integrating coarse-grained medication entity information with multimodal fine-grained molecular information.

2.2. Causal Inference in Recommendation Systems

Currently, a significant domain of traditional recommendation system research focuses on utilizing causal inference to address data bias [24]. By uncovering causal relationships within data, the performance of recommendation systems is enhanced, thereby overcoming the limitations of early models based solely on data correlations.
Inspired by the exceptional performance of causal inference in traditional recommendation systems, researchers have progressively begun to apply it to the field of medication recommendation. For instance, DrugRec [25] constructs a causal graph model for medication recommendation and employs a front-door adjustment strategy to identify and mitigate recommendation biases caused by the limitations of observable information. CausalMed [15] systematically introduces causal inference in the field, replacing co-occurrence with pairwise causal graphs between diseases/operations and medications to remove spurious associations. CIDGMed [16] utilizes causal inference to generate effect matrices, performing rule-based, interpretable probability interventions on the raw predictions of the model during the post-processing stage to avoid biases arising from confounding factors.
However, the aforementioned studies apply causal inference methods to medication recommendation from varying perspectives. Although they mitigate recommendation bias to some extent, they do not address this issue from the perspective of data distribution heterogeneity, nor do they fully account for the presence of DDI problems. Consequently, the essential need to improve both accuracy and safety in medication recommendation has been partially neglected.

3. Problem Definition

3.1. Medical Entities

In this study, the medical entities mainly comprise three types: diseases, procedures, and medications, represented by the sets D = { d 1 , d 2 d t } , P = { p 1 , p 2 p t } and M = { m 1 , m 2 m t } , respectively. Additionally, molecular data are sourced from PubChem’s open-source database. Three-dimensional molecular structures are encoded via SMILES strings to represent topological structures, and molecular connectivity and functional groups are defined via a Structure Data File (SDF) using atomic coordinates and bond types to define spatial conformations including stereochemical information. These two representations provide the molecular connectivity features and spatial geometric features, which collectively support the characterization of medications.

3.2. Input and Output

This paper employs EHR as the data source, which comprehensively documents the entire treatment process of patients. The medical record of patient i is represented as H i = V i 1 , V i 2 , , V i T i , where V i T i corresponds to the clinical data from the T i -th visit. V i t = D i t , P i t , M i t comprises three elements: the diagnosis set D i t D , the procedure set P i t P , and the medication set M i t M . Together, they constitute a complete medical portrait of the patient’s visit. Diagnoses and procedures describe the patient’s health status and serve as the “cause” for medications, while medications act as the intervention that addresses the “effect.” The core task of the model is to learn the complex, latent causal and associative patterns among these three elements, especially across the patient’s longitudinal visit history. We take the historical medical record H i of patient i as input, and the model predicts the most recent medication combination M ^ i as output.

3.3. DDI Matrix

DDI data used in this study were obtained from the U.S. Food and Drug Administration (FDA) Adverse Event Reporting System [26]. This dataset is encoded using the matrix M i j d d i { 0 , 1 } | M | × | M | , where a matrix element M i j d d i = 1 indicates a clinically significant interaction between medications m i and medication m j . The occurrence of “1” elements within this matrix serves as an important metric for evaluating the safety of recommended medication combinations.

3.4. Causal Discovery and Causal Inference

Causal discovery and causal inference are pivotal for understanding interaction mechanisms among variables [27]. Causal discovery identifies latent causal structures from observational data using statistical and machine learning methods; this process requires comprehensive analysis and diverse algorithmic implementations. Conversely, causal inference quantifies the effects of identified causal relationships to provide a foundation for scientific decision-making. Methods such as experimental controls, instrumental variables, and regression discontinuity can effectively estimate true causal effects, demonstrating significant value, particularly in complex data scenarios with confounding factors.

4. Methodology

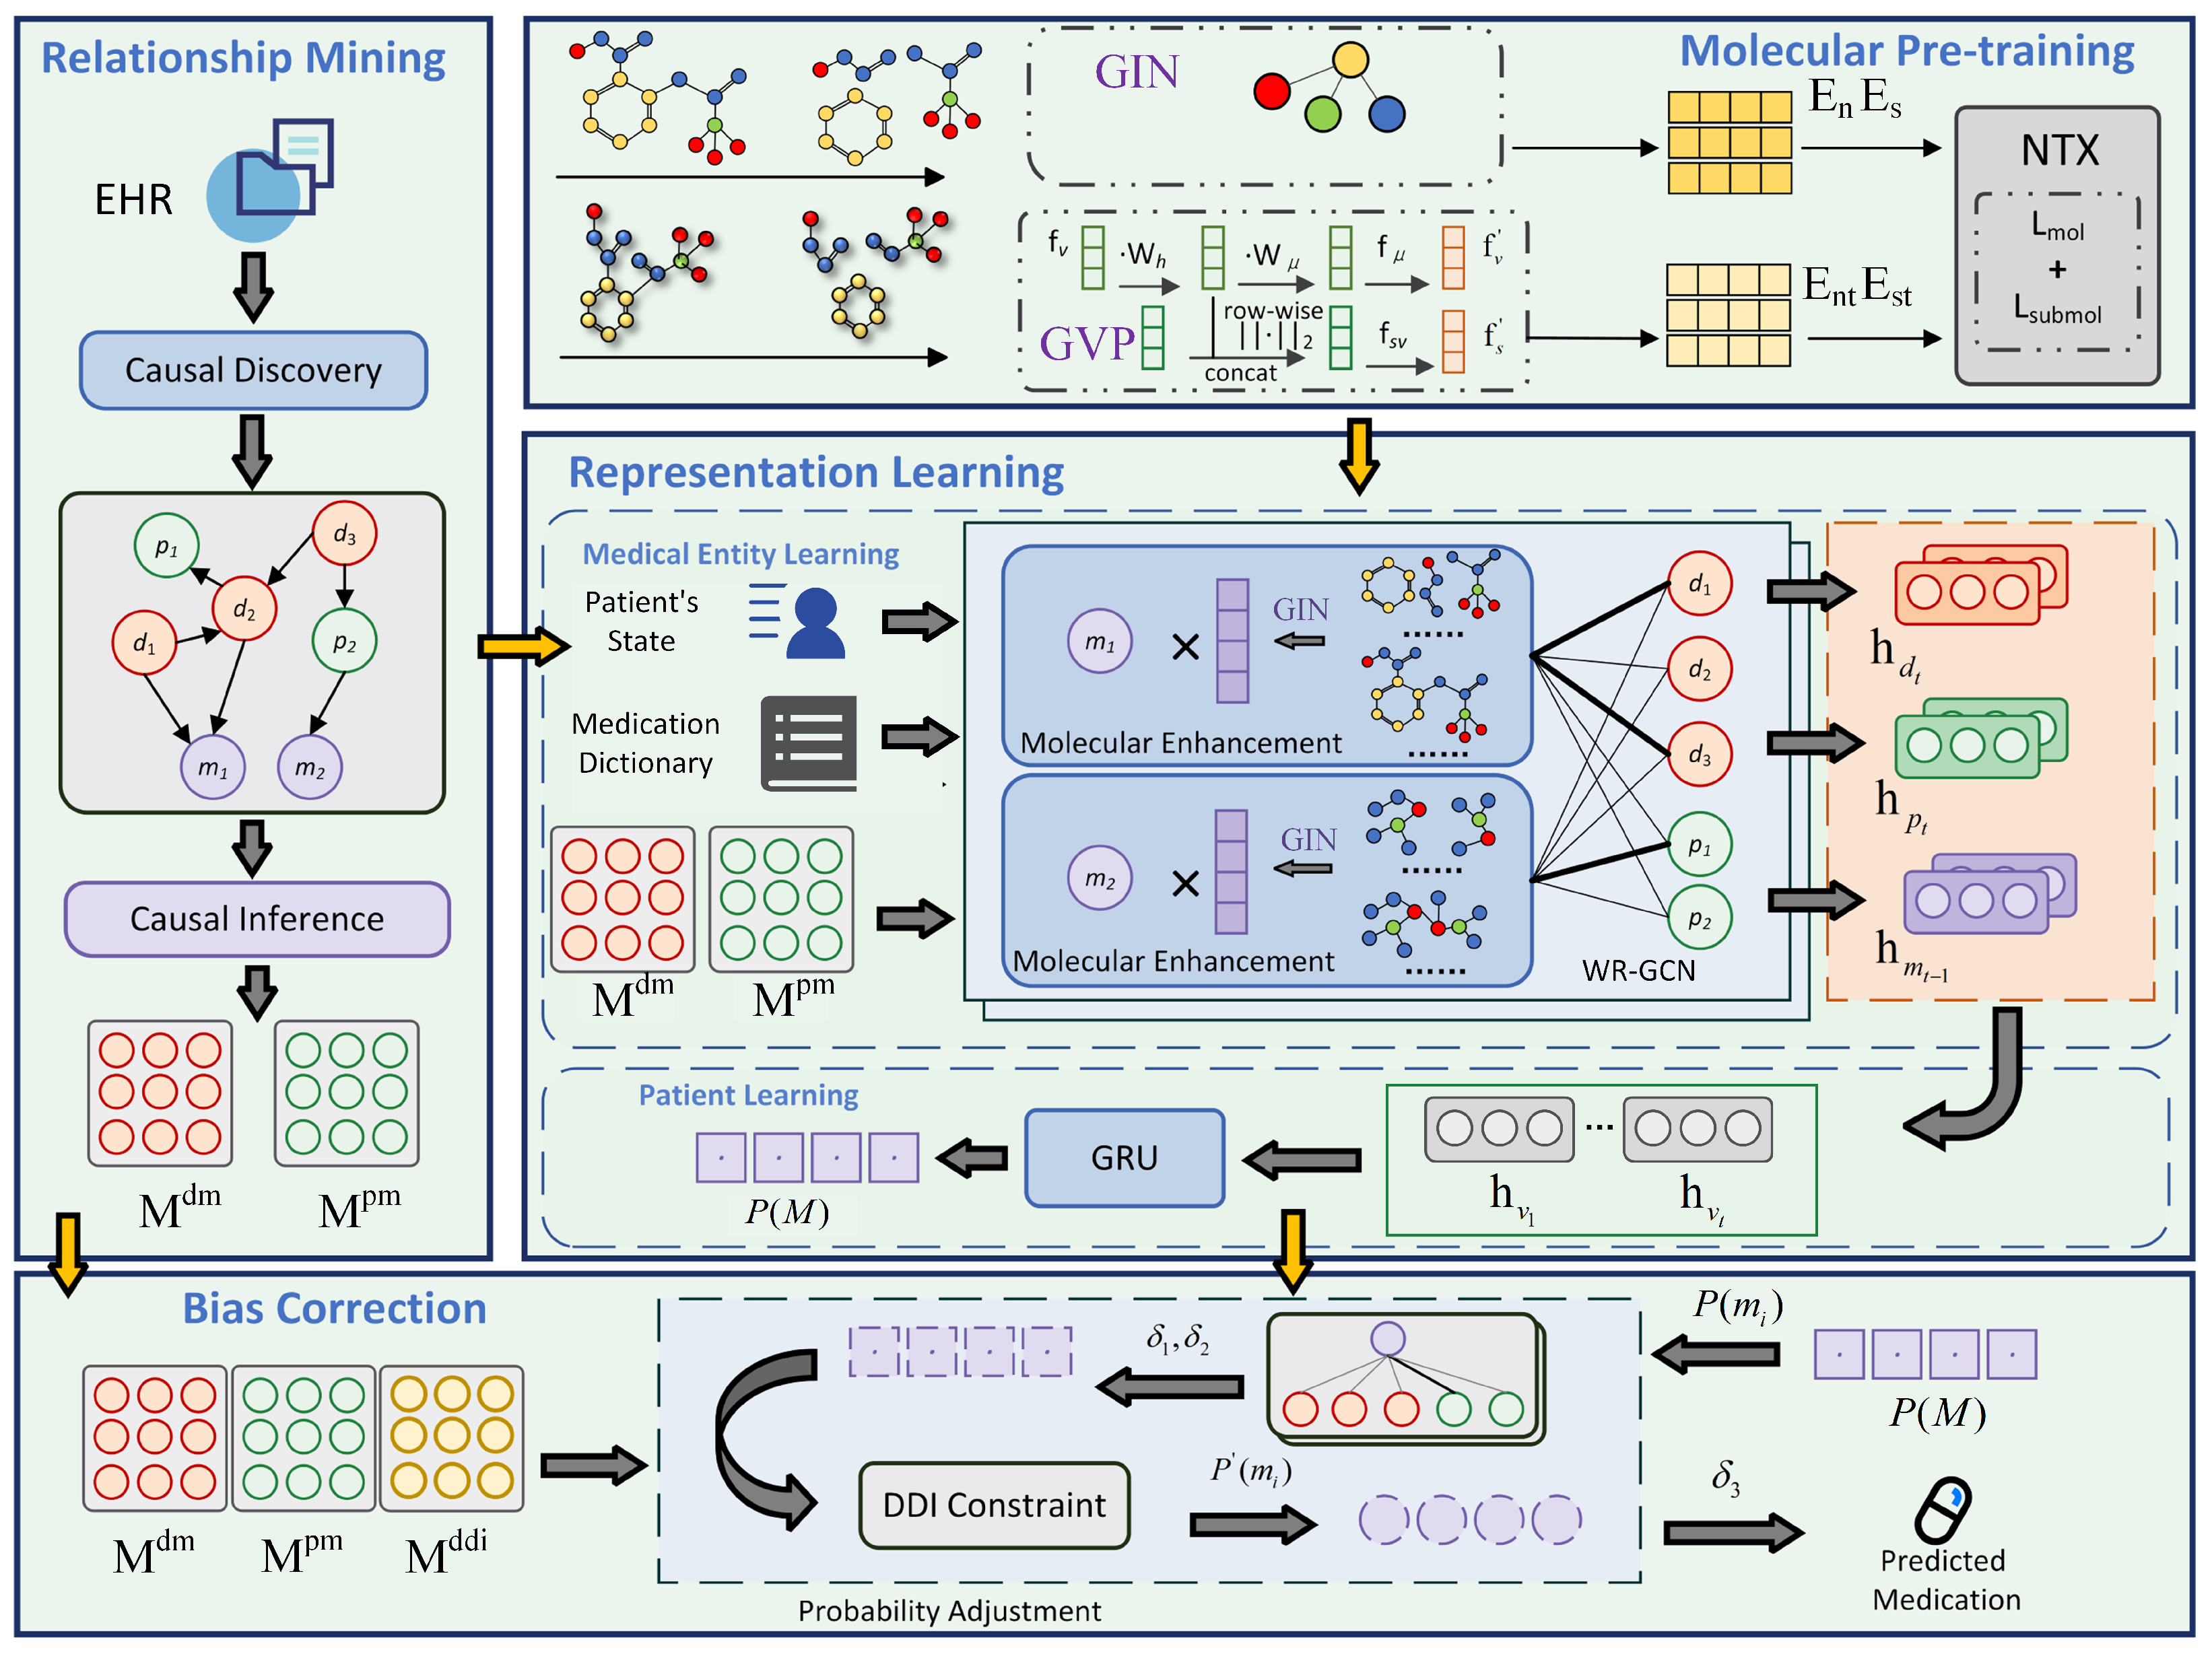
Figure 3 illustrates the proposed model framework, which comprises four core stages.
Initially, in the Causal Relationship Mining stage, medical entities such as diseases, procedures, and medications are extracted from EHR. Personalized causal graphs are then constructed via causal discovery techniques to generate quantified causal effect matrices M d m and M p m .
Following this, in the molecular pretraining stage, contrastive learning is adopted to provide a graph encoder that integrates 2D and 3D molecular structural information for downstream tasks.
Subsequently, in the dual-granularity information enhancement stage, medication-molecule mapping relationships are established according to a medication dictionary. Molecular features are extracted using the pretrained encoders, whereas a dual-granularity message-passing mechanism—integrating the causal effect matrices and molecule-medication associations—is employed to achieve multi-level representation learning of medical entities. This process generates encounter-level integrated representations and outputs initial medication recommendation probabilities.
Finally, in the DDI-Constrained Bias Correction stage, the recommendation probabilities are adaptively adjusted based on the causal effect matrices M d m and M p m and the drug–drug interaction matrix M d d i to correct training biases, ultimately outputting safe and effective individualized medication combinations.

4.1. Relationship Mining

During the causal relationship mining stage, this study explores the intrinsic associations among medical entities based on causal discovery techniques. As shown in Figure 1, by employing causal inference methods, the model identifies and eliminates spurious edges (e.g., m 1 d 3 , m 2 d 3 ) while preserving genuine therapeutic relationships (e.g., m 1 d 1 , m 2 d 2 ), thereby constructing the causal graph G of medical entities. Subsequently, the extracted causal relationships are quantified into causal effect matrices M d m and M p m , thus laying a critical foundation for subsequent coarse-grained representation learning and bias correction modules.
Based on the data distribution U in EHR, a causal graph of medical entities is constructed using the Greedy Interventional Equivalence Search (GIES) algorithm [28]. The process iteratively optimizes Bayesian equivalence classes [29] and leverages a scoring function F ( G , U ) to evaluate the graph structure, thereby identifying genuine causal chains. The corresponding formulations are as follows:
F ( G , U ) = i = 1 n f ( X i , P X i G )
G = g ( F , G )
where n denotes number of medical entities in the Bayesian network, X i represents the i-th entity, and P X i G represents the parent node set of X i in causal graph G, the entities that directly influence X i in the Bayesian network structure. The function f ( · ) is a Bayesian scoring function that quantifies the relationship between a node and its parent set. The function g ( · ) is the GIES algorithm function, which leverages the initial graph G and the equivalence scoring function F to iteratively refine the causal structure, resulting in an improved causal graph G .
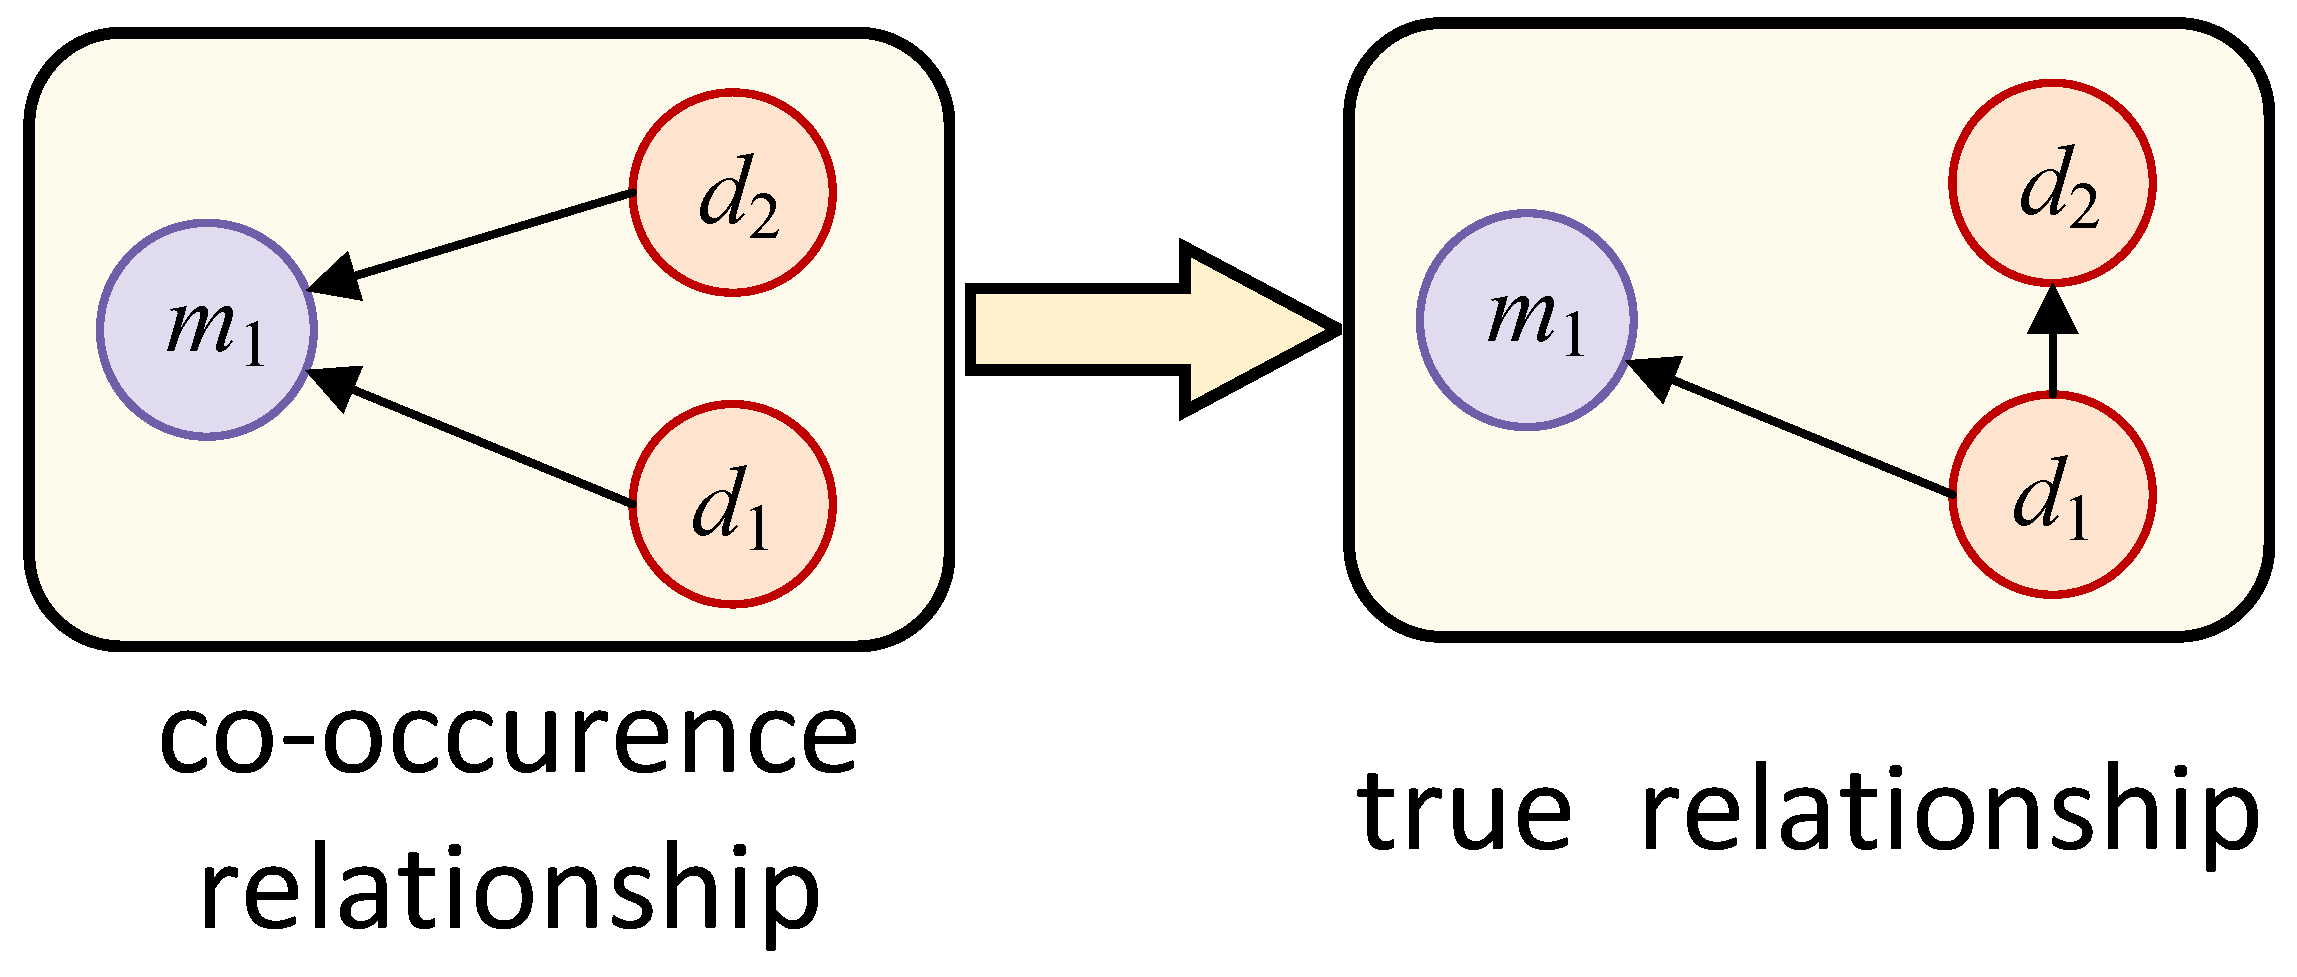
This method leverages causal relationships derived from the back-door criterion to eliminate spurious medication–disease correlations, thereby establishing a foundation for learning disease–procedure–medication associations. Beyond causality among entities of the same type, heterogeneous causal links exist between different medical entities. For instance, as illustrated in Figure 4, medication m 1 is specifically used to treat disease d 1 . To capture these heterogeneous relationships, this work applies causal inference to quantify medication–disease treatment effects, which directly verifies the efficacy of a medication for a given disease. Specifically, we treat the causal graph G as a binary variable and employ a discretized Generalized Linear Model (GLM) [30] to model the relationships between diseases/procedures and medications. The GLM is defined as:
G L M ( η ) = β 0 + i = 1 n β i X i
where G L M ( · ) denotes the logit link function, η represents the probability of the bivariate variable, β 0 is the intercept term, and β i signifies the coefficient corresponding to the i-th item. X i denotes the independent variable of the i-th item, which encompasses diseases, procedures, and medication encoding information. Equation (3) is not used for prediction but serves as a causal effect quantifier. η reflects the likelihood of the medication producing a positive therapeutic effect on specific diseases and procedures, thereby elucidating the causal effect of particular diseases or procedures on medications. This allows us to construct the causal effect matrices M d m R | D | × | M | and M p m R | P | × | M | . The core role of these matrices is to replace the simple co-occurrence statistics, which may contain spurious associations, with quantified relationships that have been de-confounded through causal inference.
In causal graph construction, computational complexity primarily arises from the search process in GIES when optimizing Bayesian equivalence classes. Its worst-case time complexity correlates strongly with the number of nodes n and the sample size, and even with sparsity constraints, the search space can theoretically grow as O ( n 2 ) . In practice, we implement two key strategies to maintain feasibility. First, we use a limited node set: though a patient’s medical entity set includes multiple diseases, procedures, and medications, the number per visit is limited and is far smaller than the total knowledge base, which substantially reduces the causal graph scale. Second, prior-knowledge-based constraints are imposed on edge search directions, such as the clinical principle that “diagnosis precedes treatment”, which substantially prunes the search space and eliminates computations along clinically implausible causal paths.
Therefore, the complexity of the personalized graph construction stage can be regarded as O ( k · n 2 ) , where n is the number of distinct medical entities in the patient’s current and historical visits, and k is a factor related to scoring computation. Since n remains manageable in clinical practice and is further reduced by prior-knowledge pruning, this step is feasible in actual implementation.

4.2. Molecular Pretraining

In the molecular pre-training stage, this study aims to integrate 2D and 3D molecular structural information. A contrastive learning approach is adopted, treating 2D and 3D encodings of the same molecule as a positive pair, and 2D–3D encodings of different molecules in the same batch as negative pairs, thereby aligning cross-modal features. The NT-Xent loss is applied to prevent representational collapse. This process distills 3D spatial information into a 2D graph encoder, allowing the model to benefit from richer 3D representations while maintaining efficient training and inference. The resulting 3D-enhanced 2D graph encoder is used for molecular feature extraction in the subsequent patient representation learning stage.
During 2D molecular modality processing, a graph is defined as G = ( ν , ε ) where the set of atoms ν serves as nodes and the set of chemical bonds ε serves as edges. To obtain the 2D representation of molecules, we employ the Graph Isomorphism Network (GIN) [31] as the encoder for medication molecular graphs, where GIN iteratively updates node features by aggregating the features of their first-order neighboring nodes. The specific formulations are as follows:
f a ( l ) = MLP ( l ) ( 1 + ϵ ( l ) ) · f a ( l 1 ) + b N ( a ) f b ( l 1 )
e n ( l ) = READOUT { f a ( l ) | a V }
where f a ( l ) is the node feature vector at layer l. The operation b N ( a ) aggregates features from the first-order neighborhood N ( a ) . To balance local structure, a learnable parameter ϵ ( l ) weights the central node’s intrinsic features, followed by an MLP ( l ) for non-linear transformation. Finally, a READOUT function performs global summation of these vectors to produce the molecular feature e n ( l ) .
Through the aforementioned process, the 2D structural features of all medication molecules are obtained and concatenated to derive the embedding matrix E n R | m o l | × d i m for the 2D molecular modality, as expressed in the following equation.
E n = e n ( i ) i = 1 n
where m o l denotes the set of medication molecules, d i m represents the feature dimensionality, and || signifies the vertical concatenation of vectors.
For the 3D molecular modality, this paper represents the molecular structure as a graph where atoms serve as nodes. If the distance between two atoms is less than 4.5 Å, an edge is considered to exist between them [32]. The symbol Ådenotes the Angstrom, a unit of length commonly used in chemistry, physics, and biology to measure infinitesimal distances, such as atomic and molecular scales. In the constructed 3D molecular graph, each node and edge are associated with geometric features, such as 3D coordinates and scalar features describing chemical properties. Consequently, this paper employs Geometric Vector Perceptrons (GVP) [33] to encode the molecular structure. In the actual model construction, a tuple ( f s , f v ) is first used to represent the atomic scalar feature matrix and vector feature matrix as inputs. Then, ( f s , f v ) is transformed into ( f s , f v ) . A READOUT function is subsequently applied to aggregate the node scalar feature matrix f s at the l-th layer to obtain the molecular feature e p ( l ) . Through the aforementioned process, the 3D structural features of all medication molecules are obtained and concatenated to derive the embedding matrix E n t for the 3D molecular modality. The GVP is defined as:
f s = σ W v · CONCAT W h f v 2 , f s + b
f v = σ W μ W h f v 2 row - wise W μ W h f v 2 row - wise
E n t = READOUT i = 1 n f s , a ( i ) a V
where, W h , W v , and W μ are three weight matrices used for feature transformation, b denotes the bias term, and ⊙ signifies element-wise multiplication. σ represents a nonlinear activation function, and 2 row - wise represents the calculation of the L2 norm for each row of the matrix. CONCAT signifies the horizontal concatenation of the L2 norm of the row vectors with f s .
Existing research indicates [12] that the properties of medication molecules are determined by specific substructures. Therefore, this paper employs the BRICS method [12] to decompose medication molecules into specific substructures. Subsequently, the RDKit [34] API is utilized to obtain the 3D structures of these substructures. Finally, the aforementioned methods are applied to derive the embedding matrices E s , E s t for the 2D and 3D modalities of the substructures, respectively.
In subsequent processing, contrastive learning achieves two primary objectives. First, it encourages the feature representations of 2D and 3D molecules with the same indices to be closer within the embedding space, thereby strengthening the consistency modeling across multimodal structures. Second, it promotes the separation of non-matching molecular structures within the embedding space. This design aims to capture bimodal consistency features of molecular structures. We adopt the widely used NT-Xent loss [35] to optimize the encoder parameters:
L NTXent ( E a , E b ) = 1 N i = 1 N log e sim ( E a i , E b i ) / τ i j N e sim ( E a i , E b j ) / τ
sim ( E a i , E b j ) = E a i · E b j E a i E b j
where, sim ( · ) denotes the cosine similarity, whereas τ is the temperature parameter utilized as the weight for the most similar negative pairs. This paper applies this loss function to both molecules and their substructures to derive the total loss function:
L total = L mol + L submol
L mol ( E a , E b ) = L NTXent ( E n , E n t )
L submol ( E a , E b ) = L NTXent ( E s , E s t )
where, L mol and L submol respectively represent the loss functions for fusing 2D and 3D multimodal physical features at the molecular structure level and the molecular substructure level.
The objective of the molecular pretraining stage is to learn a bimodal molecular encoder. Its parameters are optimized by minimizing the total contrastive loss L t o t a l . The optimization objective is formulated as follows:
Θ e n c = arg min Θ e n c L t o t a l = arg min Θ e n c ( L m o l + L s u b m o l )
where we define the parameter space to be optimized as the set of all weights of the encoders, denoted as Θ e n c = { θ G I N , θ G V P } . Θ e n c represents the updated parameter space, while θ G I N and θ G V P denote the parameters of the GIN encoder and the GVP encoder, respectively.

4.3. Representation Learning

During the representation learning stage, we adopt a dual-granularity information fusion strategy to enhance encounter-level representations h v t by integrating fine-grained molecular structural information with coarse-grained causal associations among medical entities. Its mathematical objective can be expressed as learning a mapping function F D G :
h v t = F D G ( h b a s e ; Θ C ; Θ F )
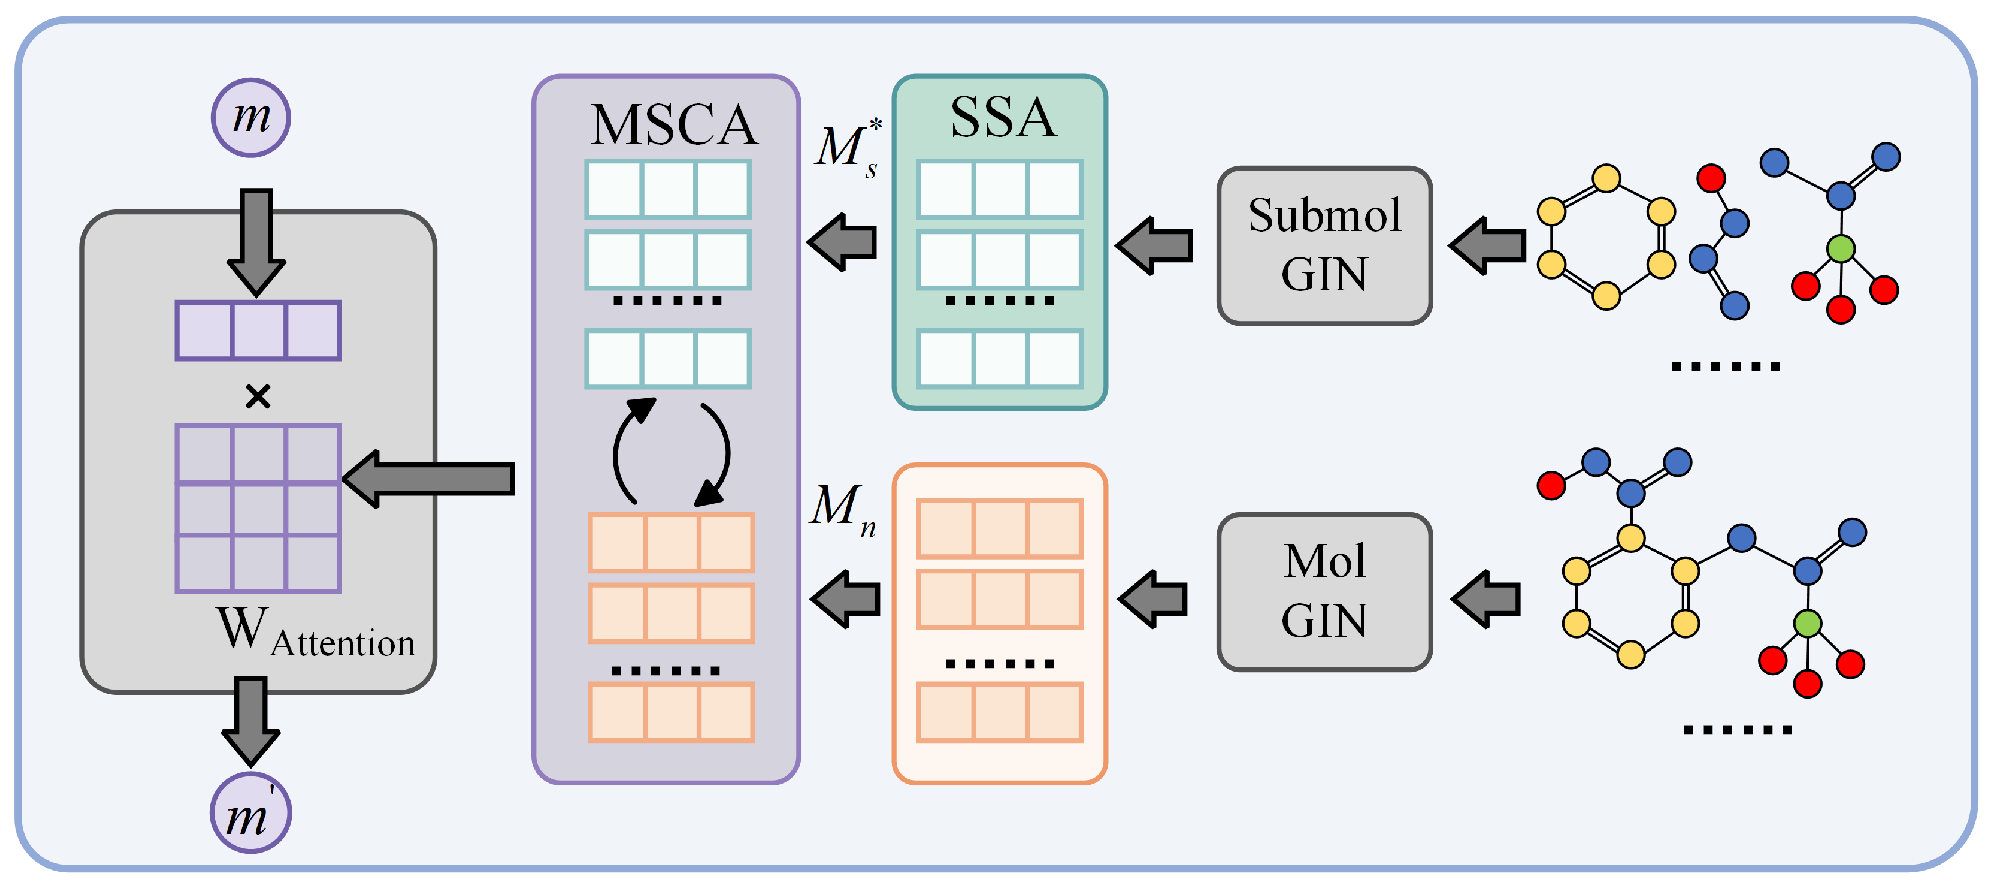
where h base represents the base representation of the patient at the t-th visit, including h d t , h p t , and h m t 1 from the previous visit. Θ C denotes the coarse-grained relation parameters derived from the causal effect matrices M d m and M p m , which model the structural causal associations among medical entities via the Weighted Relational Graph Convolutional Network (WR-GCN) [36]. Θ F represents the fine-grained parameters originating from the pretrained molecular encoder, which extract key chemical functional information from the 2D/3D features of molecules and their substructures through the Substructure Self-Attention (SSA) [37] and Molecule-Substructure Cross-Attention (MSCA) mechanisms.
The design of F D G ensures that the two levels of information are not simply concatenated but are deeply fused through attention mechanisms and graph message passing. Consequently, the resulting representation simultaneously encompasses both the causal semantic associations based on the patient’s current health status and the deep chemical properties of the medications themselves, effectively achieving the integration of multi-scale information at the encounter level.
In actual clinical diagnosis and treatment, physicians prescribe medications by integrating a patient’s current health status with historical medical records. To simulate this decision-making process, the proposed model utilizes the set of diagnoses D i t and the set of procedures P i t from the t-th encounter of patient i as the representation of their current health status. Simultaneously, the diagnoses D i t 1 , procedure set P i t 1 , and medication use records M i t 1 from the previous encounter are incorporated as historical medical information. By fusing current and historical data, the model can more comprehensively characterize the encounter scenario, thus simulating the real-world clinical decision-making process. Initially, embedding tables for diseases, procedures and medications are constructed, denoted as E d R | D | × d i m , E p R | P | × d i m and E m R | M | × d i m , respectively, whereas each row corresponds to a specific medical entity.
h d i = E d ( d i ) , h p i = E p ( p i ) , h m i = E m ( m i )
where d i D i t , p i P i t and m i M i t denote specific diagnosis and procedure medical entities, respectively, whereas h d i R d i m , h p i R d i m and h m i R d i m represent the embeddings of the medical entities d i , p i and m i .

4.3.1. Enhancing Fine-Grained Molecular Structural Features

Fine-grained relationship learning aims to extract detailed molecular-level information. By importing a predefined medication dictionary, we have established precise mapping relationships between medications and their molecular structures. Since a medication can include multiple molecular configurations and its properties are determined by specific substructures [12], we introduce a molecular enhancement module to model drug–substructure relationships. This facilitates cross-hierarchy fusion from molecular properties to drug representations, where the processing of substructure embeddings adheres to a hierarchical aggregation strategy, as shown in Figure 5.
In the molecular enhancement module, the objective is to utilize pretrained molecular and substructure encoders to extract the feature matrices M n and M s for molecules and their corresponding substructures, respectively. Considering that molecular functions originate from the synergistic effects of substructures, we introduce the SSA module [37] and the MSCA module to model the interactions within substructures and between molecules and substructures. Specifically, the substructure representation matrix is employed to establish an attention-based interaction mechanism among substructures within the same molecule. The specific formulations are as follows:
M s = S S A ( M s , M a s k ) = L a y e r N o r m ( H + M L P ( H ) )
H = L a y e r N o r m ( M s + A s e l f ( M s , M a s k ) )
A s e l f ( X ) = S o f t m a x Q K T d + M a s k V
where d represents the dimensionality of the key embedding vectors, whereas Q, K, and V denote the query, key, and value matrices, respectively, derived through linear transformations of the input X. The term M a s k signifies the molecular partitioning mask matrix, M a s k { 0 , } s × s :
M a s k = 0 Substructures i and j belong to the same molecule Substructures i and j do not belong to the same molecule
In the MSCA module, the core function of the A c r o s s function is to utilize substructure features as queries and global molecular features as keys and values. Through a cross-attention mechanism, dynamic retrieval and aggregation of global molecular information are achieved based on the respective substructures. First, a masking mechanism is introduced to constrain the attention scope within each molecule, thereby strengthening the correlation calculations between substructures and their parent molecules. Subsequently, the aggregated molecular-level representations are fused through a mapping function to ultimately form the enhanced medication-level representations. This process achieves cross-level fusion from molecular properties to medication representations. The specific formulations are as follows:
h m i = h m i W a t   t e n t i o n
W a t   t e n t i o n = M S C A ( M s , M n )
M S C A ( M s , M n ) = LayerNorm MLP Softmax Q K T d + Mask V
where h m i represents the medication representation after molecular enhancement, whereas M s signifies the substructure features enhanced via SSA. Furthermore, M n denotes the features of the molecular structure. Within the attention mechanism, Q is the query matrix derived through a linear transformation of the input M s , while K and V are the key and value matrices, respectively, obtained from the input M n .
Through the molecular enhancement module, we generate an enhanced representation h m i for each candidate drug m i , which serves as the core output of the model’s fine-grained information carrier Θ F . This representation integrates key chemical substructural features with 2D/3D global molecular topological attributes, thereby forming a fine-grained embedding enriched with chemical semantics.

4.3.2. Integrating Coarse-Grained Causal Associations

Coarse-grained relationship learning aims to further investigate the causal associations between diseases/procedures and molecularly enhanced medications, thereby avoiding reliance on simple co-occurrences. Initially, based on the causal effect matrices M d m and M p m , this research introduces a pyramid hierarchical strategy [20]. This strategy defines a parameterized deterministic allocation rule and does not constitute a piecewise objective function that requires direct optimization via gradient descent. Through a gradient G , all relationships are adaptively partitioned into n layers, forming the hierarchical structures R d m = { r 1 d m , r 2 d m , , r n d m } and R p m = { r 1 p m , r 2 p m , , r n p m } . This structure exhibits a pyramid distribution, whereas the bottom layers contain more relationships and the upper layers decrease progressively. By assigning differentiated weights to different levels, this method enhances the learning of sparse associations and mitigates data imbalance, ultimately yielding more representative coarse-grained relationships. The formulas for calculating the number of layers and the quantity of relationships in each layer are as follows:
L = max log G 1 + R ( G 1 ) r 2
r i = r 1 G i 1 1 i L 1 r 1 G L 1 + ( R r 1 G L 1 G 1 ) i = L
where L represents the total number of layers within the pyramid, whereas R signifies the count of non-zero causal effect relationships extracted from M d m or M p m . Furthermore, r i denotes the number of relationships assigned to the i-th layer, and G represents the gradient utilized for the pyramid partitioning.
Subsequently, to model coarse-grained associations among medical entities, we construct a bipartite graph G = ( N , E ) that includes medical entity information, where N is the node set of medical entities and E is the set of relational edges. Based on the architecture of a Relational Graph Convolutional Network, we adaptively model the multi-level relationships between disease–/procedure–medication pairs and map them onto the edge set E of graph G. For efficient information aggregation while preserving relational semantics, relationships of the same type are further grouped in a coarse-grained manner, leading to a Weighted Relational Graph Convolutional Network. Through multi-layer message passing on G, the model progressively updates the representations of diagnoses, procedures, and medications, denoted respectively as h d , h p , and h m , and finally obtains the node representation set h i = { h d , h p , h m } . The specific formulas are as follows:
h i ( l + 1 ) = σ e E 1 q e j N ( i , e ) W e l h j l
W e l = r e + Δ W e l
where i , j N are medical entities, h i ( l + 1 ) is the updated representation of node i at layer l + 1 , and σ is an activation function. Here, e E denotes an edge that models a specific relationship between entities, and q e is a learnable normalization factor that ensures properly scaled output features. The set N ( i , e ) contains the neighbours of node i connected by edge e. Moreover, at layer l, W e l is defined as the weight matrix of edge e, r e denotes its relational correlation, and Δ W e l corresponds to the weight update matrix of edge e.
Finally, we can obtain the representations of the t-th diagnosis, procedure, and the ( t 1 ) -th medication, denoted as h d , h p , and h m , respectively, where h d t = i = 1 n h d i , h p t = i = 1 n h p i , and h m t 1 = i = 1 n h m i . These representations constitute the output of the coarse-grained information carrier Θ C , encoding the structured causal associations among medical entities. Unlike methods relying on co-occurrence, Θ C explicitly models therapeutic causal effects, distinguishing between direct and indirect associations, thereby providing a semantic basis for subsequent patient-level holistic representation.

4.3.3. Patient Representation

To simulate the real clinical decision-making process, it is necessary to integrate the patient’s historical visit data to obtain a comprehensive patient representation. We adopt a concatenation method to combine the patient’s clinical records, and the resulting historical patient representation is shown in Equation (29).
h v t = [ h d t h p t h m t 1 ]
In this context, t represents the t-th historical visit of patient j (where t < T j ), and T denotes the total number of visits for the patient. In the representation of the current visit, the encoding of the medication component is initialized as a zero vector, which distinguishes historical medication information from the current medication space to be recommended.
Since adjacent visit records may contain overlapping information, we employ a Gated Recurrent Unit (GRU) to model the visit sequence { h v 1 , h v 2 , , h v T i } of patient i, aiming to extract dynamically evolving patient-state representations from the historical sequence rather than simply accumulating redundant data. This approach transforms overlapping information along the temporal dimension into time-series features that effectively characterize the patient’s treatment history. The corresponding formulas are as follows:
o v t = GRU ( o v t 1 , h v t )
h H = MLP ( o v t )
where o v t 1 represents an intermediate variable generated by the GRU ( · ) , whereas we define o v t as a zero vector.
Furthermore, the aforementioned concatenation–temporal integration strategy, which first concatenates entity representations integrating coarse-grained and fine-grained information and then performs temporal integration via GRU, constitutes a concrete implementation of the dual-granularity fusion function F D C . This design explicitly encodes the coarse-grained causal association carrier Θ C and the fine-grained molecular structure carrier Θ F into a unified, time-aware patient representation h H . In this process, the GRU not only filters out redundant overlaps but also captures the dynamic evolution of clinical states, thereby enabling h H to comprehensively reflect the patient’s therapeutic context.
Finally, this paper transforms the patient representation into the predicted probability P ( M ) for each medication m i via a nonlinear activation function σ .
P ( M ) = σ ( h H )
This probability distribution provides a robust semantic foundation for the subsequent bias correction based on DDI constraints.

4.4. DDI-Constrained Bias Correction

During model training, unavoidable systematic errors may compromise the reliability of predictions. We propose a DDI-constrained bias-correction mechanism, which serves as a post-processing re-weighting mechanism. Based on the initial recommendation probabilities, it dynamically adjusts the probability of each medication by integrating the causal effect matrices and the DDI matrix, ultimately outputting a personalized medication plan that balances recommendation accuracy and safety.
We impose a set of constraints on each quantified value in the causal effect matrices M d m and M p m , aiming to better balance accuracy and safety in the final outcome. Specifically, if the candidate medication demonstrates a significant therapeutic effect on the current disease and presents no DDI issues with any medication already considered in the recommendation list [ m 1 , m 2 , , m i 1 ] , its recommendation probability P ( m i ) is correspondingly increased. Conversely, if m i exhibits DDI with one or more medications in [ m 1 , m 2 , , m i 1 ] , its recommendation probability P ( m i ) remains unchanged even if it possesses therapeutic efficacy. On the other hand, if the therapeutic effect of m i on the current disease falls below a specified threshold, DDI assessment is bypassed, and its recommendation probability P ( m i ) is directly reduced, as follows:
P ( m i ) = P ( m i ) + ξ 1 ( M m i d t d m , M m i p t p m δ 1 ) ( M i j D D I = 0 ) P ( m i ) ( M m i d t d m , M m i p t p m δ 1 ) ( M i j D D I = 1 ) P ( m i ) ξ 2 ( M m i d t d m , M m i p t p m < δ 2 )
where j satisfies j [ 0 , i 1 ] . ξ 1 and ξ 2 are correction magnitudes; δ 1 and δ 2 are therapeutic effect thresholds ( δ 1 : upper, δ 2 : lower). All four parameters are hyperparameters pre-determined through extensive experimentation. P ( m i ) is the corrected recommendation probability for medication m i . A predefined threshold ξ 3 is then applied to P ( m i ) to generate the final recommendation m ^ i :
m ^ i = 1 P ( m i ) ξ 3 0 P ( m i ) < ξ 3
where m ^ i = 1 indicates that medication m i is included in the final medication recommendation set; conversely, m ^ i = 0 indicates that medication m i is not included.

4.5. Model Training

In the training phase, the medication recommendation task can be viewed as a multi-label binary classification problem. To address this, we employ two widely used loss functions for multi-label classification: the binary cross-entropy loss L b c e and multi-label margin loss L m u l t i . Additionally, a drug–drug interaction loss L d d i is included to improve recommendation safety by estimating the probability of risky medication pairs appearing in the recommended combination. The formulas for the three losses are:
L b c e = i = 1 | M | m i log ( m ^ i ) + ( 1 m i ) log ( 1 m ^ i )
L m u l t i = i , j : m i = 1 , m j = 0 max ( 0 , 1 ( m ^ i m ^ j ) ) | M |
L d d i = i = 1 | M | j = 1 | M | M i j d d i · m ^ i · m ^ j
where m i represents the ground truth, and m ^ i denotes the predicted value for the medication generated by the model.
In medication recommendation, safety necessitates controlling DDI. However, prioritizing DDI reduction as a solitary objective can compromise therapeutic efficacy, as pursuing minimum DDI rates regardless of clinical reality is suboptimal. Following reference [16], this research balances safety and effectiveness within the loss function to prevent performance degradation caused by overemphasizing a single metric.
L = α ( β L b c e + ( 1 β ) L m u l t i ) + ( 1 α ) L d d i
α = 1 λ μ max { 0 , 1 λ μ φ } λ > μ
where the hyperparameter β is utilized to regulate model complexity or regularization intensity, while the adjustable factor α serves to balance the impact of DDI on the model’s decision-making process. The variable μ , ranging from 0 to 1, represents the clinically acceptable DDI acceptance rate, which defines the upper threshold for permissible predicted DDI levels. φ functions as a dynamic adjustment factor that adaptively modulates the intensity of information propagation.
The core objective of drug recommendation is to learn optimal patient and drug representations while minimizing the main task loss function L (Equation (39)). The optimization objective is formulated as:
Θ = arg min Θ L = arg min Θ [ α ( β L b c e + ( 1 β ) L m u l t i ) + ( 1 α ) L d d i ]
where Θ denotes the set of all trainable parameters, including the medical entity embedding tables ( E d , E p , E m ), the parameters of WR-GCN, GIN, GRU, and MLP, as well as the parameters of the attention mechanism in the molecular augmentation module.

5. Experiments

To evaluate whether CDMed outperforms other models in terms of recommendation accuracy, safety, and time efficiency, we conduct comparative and ablation experiments on the publicly available MIMIC-III [27] and MIMIC-IV [28] datasets. Following these evaluations, we provide case studies and specific examples to further illustrate the model’s performance.

5.1. Datasets

This study employs two publicly available intensive care clinical datasets, MIMIC-III and MIMIC-IV, as the primary data sources. MIMIC-III comprises longitudinal medical records, including vital signs, medications, laboratory results, ICD-9 diagnoses, and nursing notes. MIMIC-IV features an optimized data structure and coding system, modularizing emergency department, inpatient, and ICU data, and adopts the ICD-10 coding system for improved data organization. Following the methodology of SafeDrug [11], the data processing involves cleaning, missing value imputation, deduplication, and temporal sequencing of raw data, with standardization achieved via medication code mapping. Finally, medication, diagnosis, and procedure information are integrated by patient admission ID to form a structured dataset, mitigating the impact of missing data. The corresponding statistics are summarized in Table 1.
To ensure the scientific rigor of the data used in this study, we conducted a systematic analysis of the MIMIC-III and MIMIC-IV datasets in terms of richness, diversity, information content, and reliability. The specific assessments are as follows:
In terms of data richness, the median number of patient visits in both datasets is two. Although the data is dominated by short-term visits, a considerable proportion of patients have multiple visit records (e.g., 20.5% of patients in MIMIC-III have more than three visits), which provides a necessary foundation for the model to learn temporal clinical evolution. In terms of data diversity, the average number of medications per visit is 8.80 (SD: 6.21) in MIMIC-III and 6.66 (SD: 4.88) in MIMIC-IV. This variable combination length reflects the complexity of clinical practice, requiring the model to dynamically generate medication sets of varying sizes rather than fixed-length predictions. Furthermore, the missing rate for key fields (e.g., diagnosis, medication) is below 0.1%. For the few missing values, forward filling (for temporal variables) or removal of entire incomplete records is applied, ensuring the completeness and reliability of the data used for training and evaluation. The above analysis demonstrates that the datasets used meet the requirements for modeling complex tasks in terms of temporal richness, medication diversity, and data quality reliability.

5.2. Compared Baselines

To validate the performance of CDMed, we selected the following high-performance baseline models for comparison:
  • LR [38] (Logistic Regression) is a linear algorithm that estimates category probabilities through feature combinations. It is widely utilized for data classification.
  • RETAIN [17] is an attention-based model for sequential data that integrates temporal dynamics to capture key clinical events and provide medication combinations.
  • GAMENet [8] combines Graph Neural Networks with memory networks to identify patterns and temporal sequences in medical data, enhancing predictive precision.
  • SafeDrug [11] integrates patient health status with molecular knowledge to mitigate the effects of DDI and recommend safer medication combinations.
  • MoleRec [12] enhances medication recommendation accuracy by leveraging fine-grained molecular substructure representations.
  • BiMoRec [23] utilizes 3D molecular structures to capture atomic coordinates and edge indices, overcoming the information limitations of 2D structures.
  • DPID [39] employs dual-view encoding and iterative denoising to filter encounter noise and prevent information loss, improving recommendation robustness.
  • PAUP [13] proposes a “Standardized Physician” module that mitigates bias via universal predictions, employs attention to integrate historical medication data, and enhances drug representations with 2D/3D molecular structures
  • CIDGMed [16] utilizes causal inference to reveal associations between diseases and medications, fusing global effects with molecular information for comprehensive representations.

5.3. Evaluation Metrics

In the present study, five key metrics are utilized to evaluate model performance: Jaccard similarity, DDI rate, F1-score, PRAUC, and the average number of medications.
  • Jaccard: Measures the similarity between the set of predicted medications and the set of ground-truth medications.
  • DDI Rate: Calculates the ratio of DDI within the recommended medication combinations.
  • F1-Score: Provides a comprehensive assessment metric by combining precision and recall.
  • PRAUC: Represents the area under the precision–recall curve.
  • Average Number of Medications: Represents the mean quantity of medications included in each recommendation.

5.4. Setup Protocol

5.4.1. Experimental Environment

All experiments in this research were conducted on a machine running the Ubuntu 22.04 operating system, equipped with an NVIDIA RTX 4090 GPU with 24 GB of memory. These experiments were implemented and evaluated utilizing Python 3.11.9, PyTorch 2.4.0, and CUDA 12.1.

5.4.2. Configuration and Parameter

All embedding tables and hidden layers in the four-layer GIN molecular encoder are 128-dimensional. Node features are nine-dimensional (e.g., atom type, chirality), whereas edge features are three-dimensional (e.g., bond type, stereochemistry). Spatial information—including conformational data, atomic coordinates, Radial Basis Function (RBF) distances, and normalized vectors—is incorporated via 3D molecular features. Probability bias adjustment thresholds are set at δ 1 = 0.97 (upper) and δ 2 = 0.9 (lower), with a prediction decision threshold of δ 3 = 0.5 . Loss function hyperparameters are β = 0.95 , φ = 0.05 and μ = 0.06 . Optimization utilizes the Adam optimizer ( lr = 0.0005 ) over 300 pretraining and 20 training epochs.

5.5. Overall Performance Comparison

Table 2 and Table 3 present a detailed comparison of the proposed CDMed model against other baseline models on the MIMIC-III and MIMIC-IV datasets. Analysis of these results yields the following conclusions:
Firstly, among machine learning benchmarks, LR provides conservative medication counts but lacks sufficient accuracy and safety. RETAIN utilizes sequential modeling yet fails to mitigate DDI risks, leading to poor safety profiles. Similarly, GAMENet enhances accuracy through historical encounter data but remains inadequate in safety due to its persistently high DDI rate.
Secondly, SafeDrug and MoleRec analyze fine-grained molecular-level medication data. While their accuracy could be improved, their safety remains strong, showing that fine-grained molecular structures help models reduce adverse drug–drug interaction effects. MoleRec and BiMoRec enhance fine-grained modeling by adding molecular substructures and 3D conformations, respectively. PAUP reduces bias via a standardized physician module and incorporates 2D/3D structures to enrich medication representations. However, these approaches rely on single-granularity modeling and neglect the overall (coarse-grained) effect of medications on diseases or treatments.
Finally, DPID improves medical-entity relationship modeling with dual-view encoding and iterative denoising, yet lacks the external molecular knowledge to enhance medication representations. CIDGMed strengthens molecule–medication links via dual-granularity fusion and emphasizes causal discovery, achieving notable accuracy gains. However, it ignores molecular-substructure and intermolecular relationship modeling, and shows shortcomings in controlling DDI.
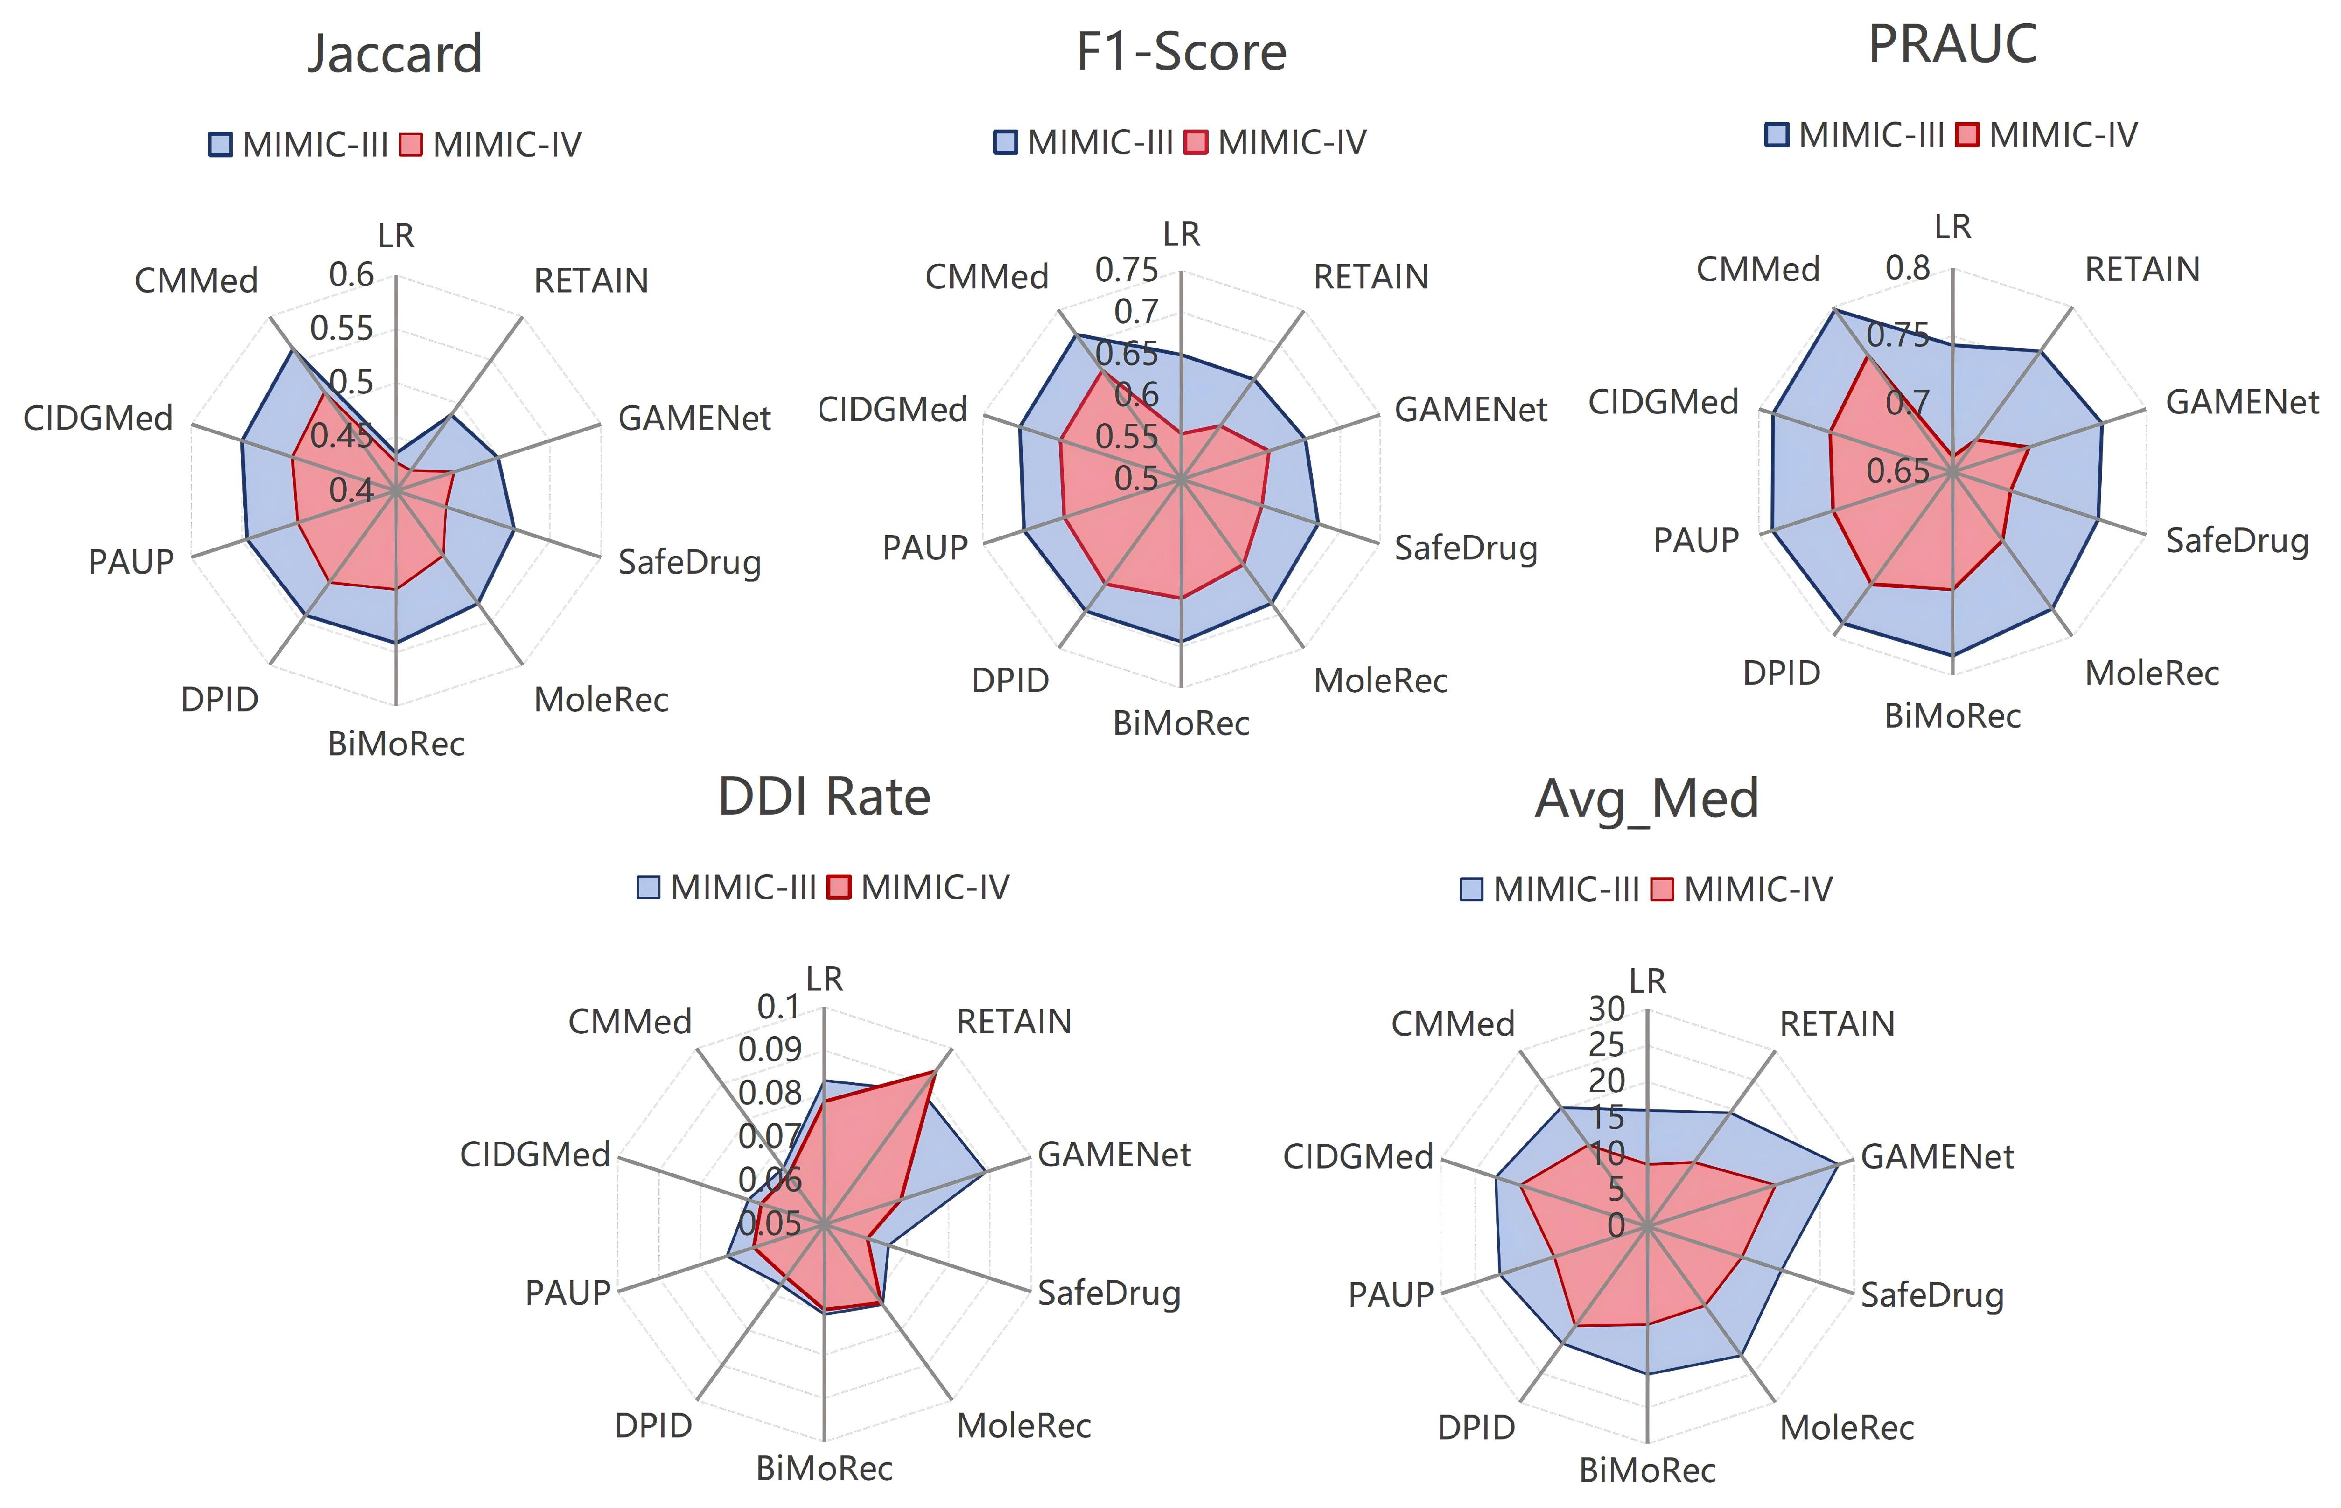
To visually compare model performance, as shown in Figure 6, we utilize a radar chart to plot five key metrics: Jaccard, F1-score, PRAUC, DDI rate, and Avg _ Med . The results indicate that CDMed and CIDGMed extend farthest toward the edge on accuracy-related axes such as Jaccard, F1, and PRAUC, which reflects their superior recommendation precision. Conversely, on safety-related axes including DDI rate and Avg _ Med , CDMed and SafeDrug are positioned closest to the center, demonstrating more effective DDI control and the ability to generate concise medication combinations.

5.6. Time Efficiency Analysis

The concept of efficient system design is crucial across various engineering fields [40]. As shown in Table 4, the temporal efficiency of CDMed is evaluated across multiple dimensions: average training duration per epoch, convergence rate, total training time, and inference latency. All experiments were conducted in a uniform environment to ensure fairness. The analysis of the Table 4 and Figure 6 indicates that CDMed has a shorter total training time than LEAP, MoleRec, and BiMoRec, and its inference time is superior to most baseline models. For instance, compared to CIDGMed, CDMed not only improves accuracy and safety—as evidenced by a 3.47% reduction in the DDI rate and a 2.25% increase in Jaccard similarity—but also achieves a 23.3% improvement in inference speed, despite a slight increase in training time. Therefore, within an acceptable time cost, CDMed achieves an optimal balance between efficiency, accuracy, and safety.
The time complexity of the CDMed algorithm is detailed below. Since pretraining is an independent preparatory step, its cost is excluded from the end-to-end efficiency comparison. Firstly, in the relationship mining module, the primary task is to uncover and quantify entity relationships via causal discovery and inference, with time complexity O ( n · d i m 2 ) , where n is the number of samples and d i m is the feature dimensionality.
Secondly, the time complexity of the representation learning module is governed by its core components. In the fine-grained stage, the SSA and MSCA modules, with a complexity of O ( n 2 dim ) , are the main computational sources, where n is the total number of substructures or molecular units. The GIN for encoding 2D molecular topology contributes O ( n 2 ) . In the coarse-grained stage, message propagation and feature aggregation on the medical-entity bipartite graph via a Weighted Relational Graph Convolutional Network has a per-layer complexity of approximately O ( N 2 R ) , where R is the number of relation types and N is the number of nodes, which can simplify to O ( n 2 ) . Embedding integration through the adaptive classifier and attention mechanism incurs a cost of O ( ( n 2 + 1 ) dim ) . In the patient representation stage, the GRU for integrating visit sequences has a complexity of O ( T · dim 2 ) , followed by an MLP with O ( dim 2 ) , whereas T is the sequence length. Consequently, the overall time complexity of this module is O ( T · dim 2 + dim 2 + n 2 dim + dim + n 2 ) .
Finally, the bias correction module under DDI constraints evaluates and adaptively adjusts preliminary medication recommendation probabilities using the causal effect matrix and DDI matrix. It performs probability correction via a single linear traversal, with a time complexity of O ( n ) . Thus, combining the time complexities of all previous stages, the overall time complexity of the CDMed model is:
O ( ( n + T + 1 ) dim 2 + ( n 2 + 1 ) dim + n 2 + n )

5.7. Ablation Study

To evaluate the contribution of individual components within CDMed, we conducted ablation studies on two public datasets by removing specific modules and modifying the underlying logic. The variants are defined as follows:
  • CDMed w/o P: This variant removes the pretraining module. Instead, it utilizes SMILES strings to construct graph data for the GIN, generating embeddings for molecular structures and substructures from scratch.
  • CDMed w/o C: This variant disregards the coarse-grained causal-based relationship learning. Instead, the association is modeled as co-occurrence-based relationships, where edge weights between disease/procedure-medication pairs are directly assigned according to their frequency in the training data.
  • CDMed w/o F: This variant disregards the fine-grained relationship learning. Instead, medication representations are initialized randomly, without leveraging molecular structural information.
  • CDMed w/o DBC: This variant removes the DDI-constrained bias correction module, does not apply causal inference to post-process the recommendation probabilities, and generates medication combinations solely based on the initial probabilities derived from the representation learning stage.
  • CDMed w/o C + F: This variant disregards the dual-granularity representation learning module based on causal inference and the molecular pretraining module. Instead, medication representations are generated via random initialization, and the graph network is constructed solely based on co-occurrence frequency statistics.
  • CDMed w/o C + F + BC: This variant retains only the co-occurrence-based baseline, which constructs medical-entity graphs and generates recommendations without molecular, causal, or bias-correction components.
The results of the ablation study are presented in Table 5. Specifically, CDMed w/o P shows a significant accuracy drop, confirming that pretraining leverages 3D molecular conformation to identify key structural features, improving drug mechanism understanding and recommendation accuracy.
CDMed w/o C reveals a marked accuracy decline, verifying that coarse-grained causal learning is essential for uncovering real medical entity relationships. CDMed w/o F slightly affects accuracy but severely compromises safety, proving that fine-grained molecular information is fundamental for clinical risk control. CDMed w/o C+F causes performance degradation, indicating the complementary roles of coarse- and fine-grained representations; their integration balances accuracy and safety.
CDMed w/o DBC leads to a notable accuracy decrease. During recommendation, this module performs rule-based post-processing using causal effects, correcting biases from data noise and spurious correlations, while suppressing high-risk DDI to enhance safety.CDMed w/o C + F + DBC exhibits declines across all metrics, confirming that the proposed components act synergistically, and their combined integration yields the best overall improvement.
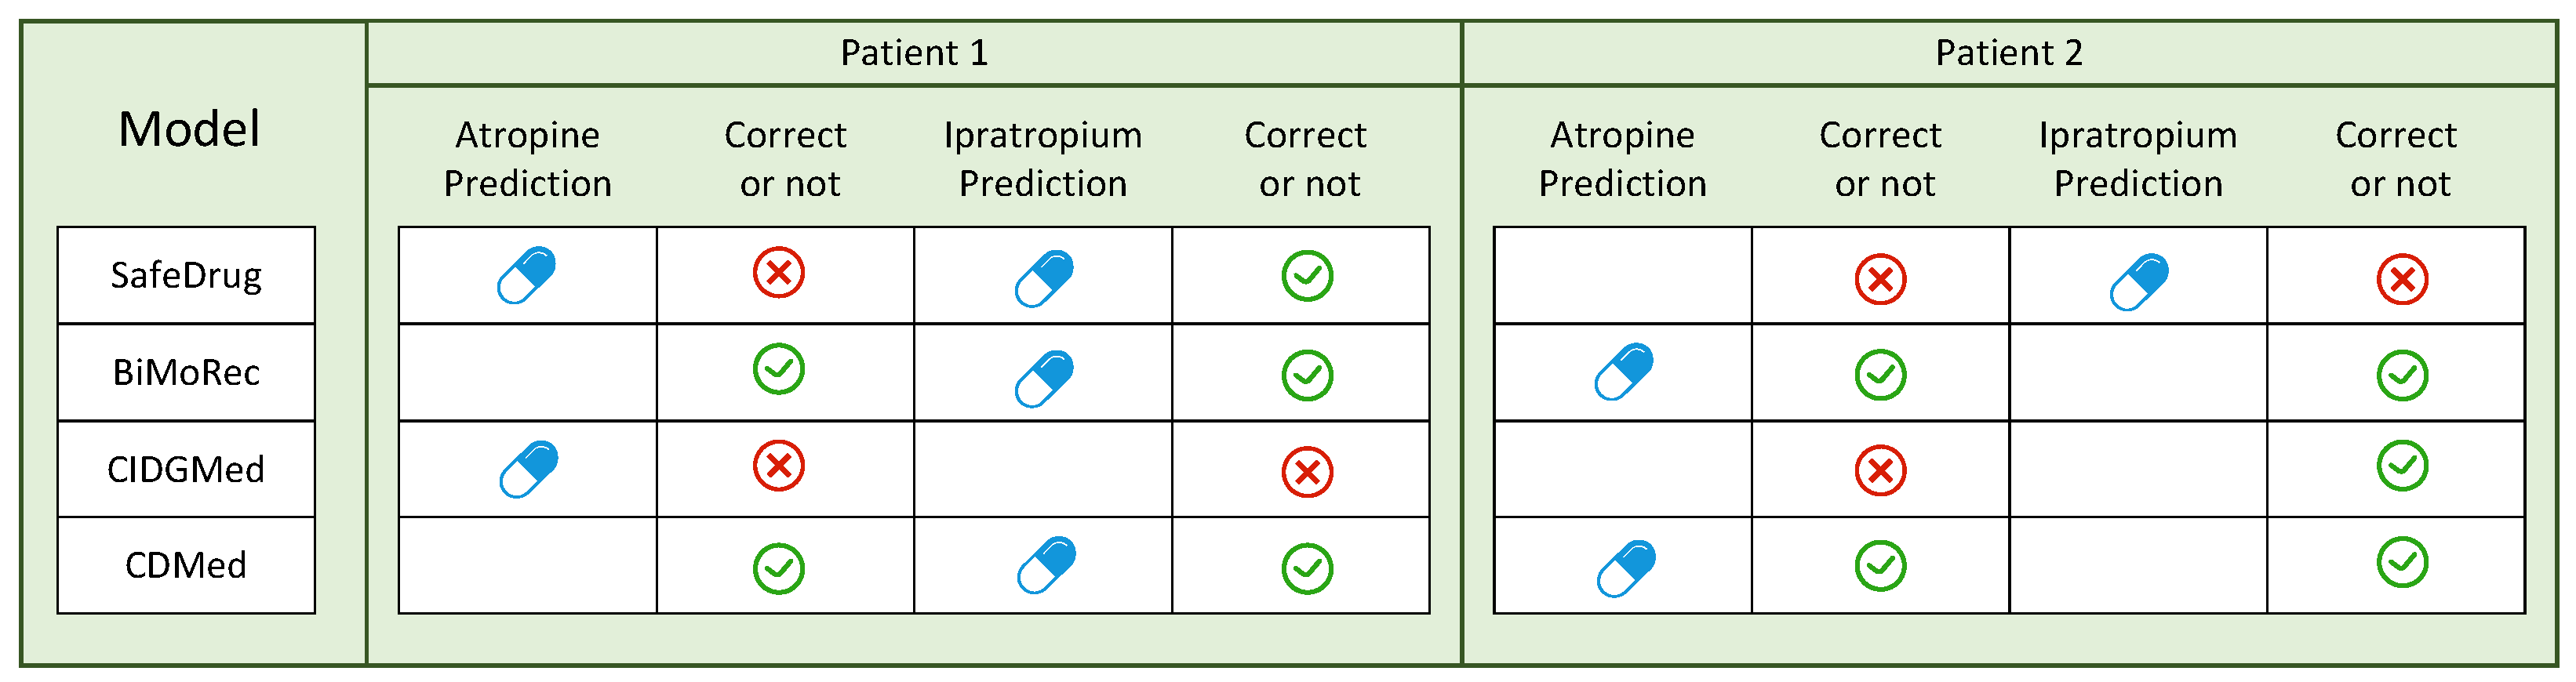
To further illustrate the role of 3D molecular information in correcting recommendation errors or omissions that may arise from models relying solely on 2D molecular data, we conducted predictions on the medications of Patient 1 and Patient 2 described in Section 5.9 using different model variants (Patient 1’s actual medication includes Ipratropium, and Patient 2’s includes Atropine). Ipratropium and Atropine are highly similar in their 2D structures, yet exhibit significant differences in the spatial arrangement of their 3D pharmacophores (detailed in the case analysis in Section 5.9). The results show that both CDMed w/o C and CDMed w/o BC correctly recommended Ipratropium and Atropine. However, CDMed w/o P erroneously recommended Atropine instead of Ipratropium for Patient 1 and failed to recommend Atropine for Patient 2. Moreover, the predictions of CDMed w/o F, CDMed w/o C+F, and CDMed w/o C + F + DBC all omitted both Atropine and Ipratropium.
The experimental results demonstrate that the incorporation of 3D molecular information in the fine-grained module plays a critical corrective role in addressing omissions or erroneous recommendations produced by models that rely only on 2D molecular information.

5.8. Hyperparameter Analysis

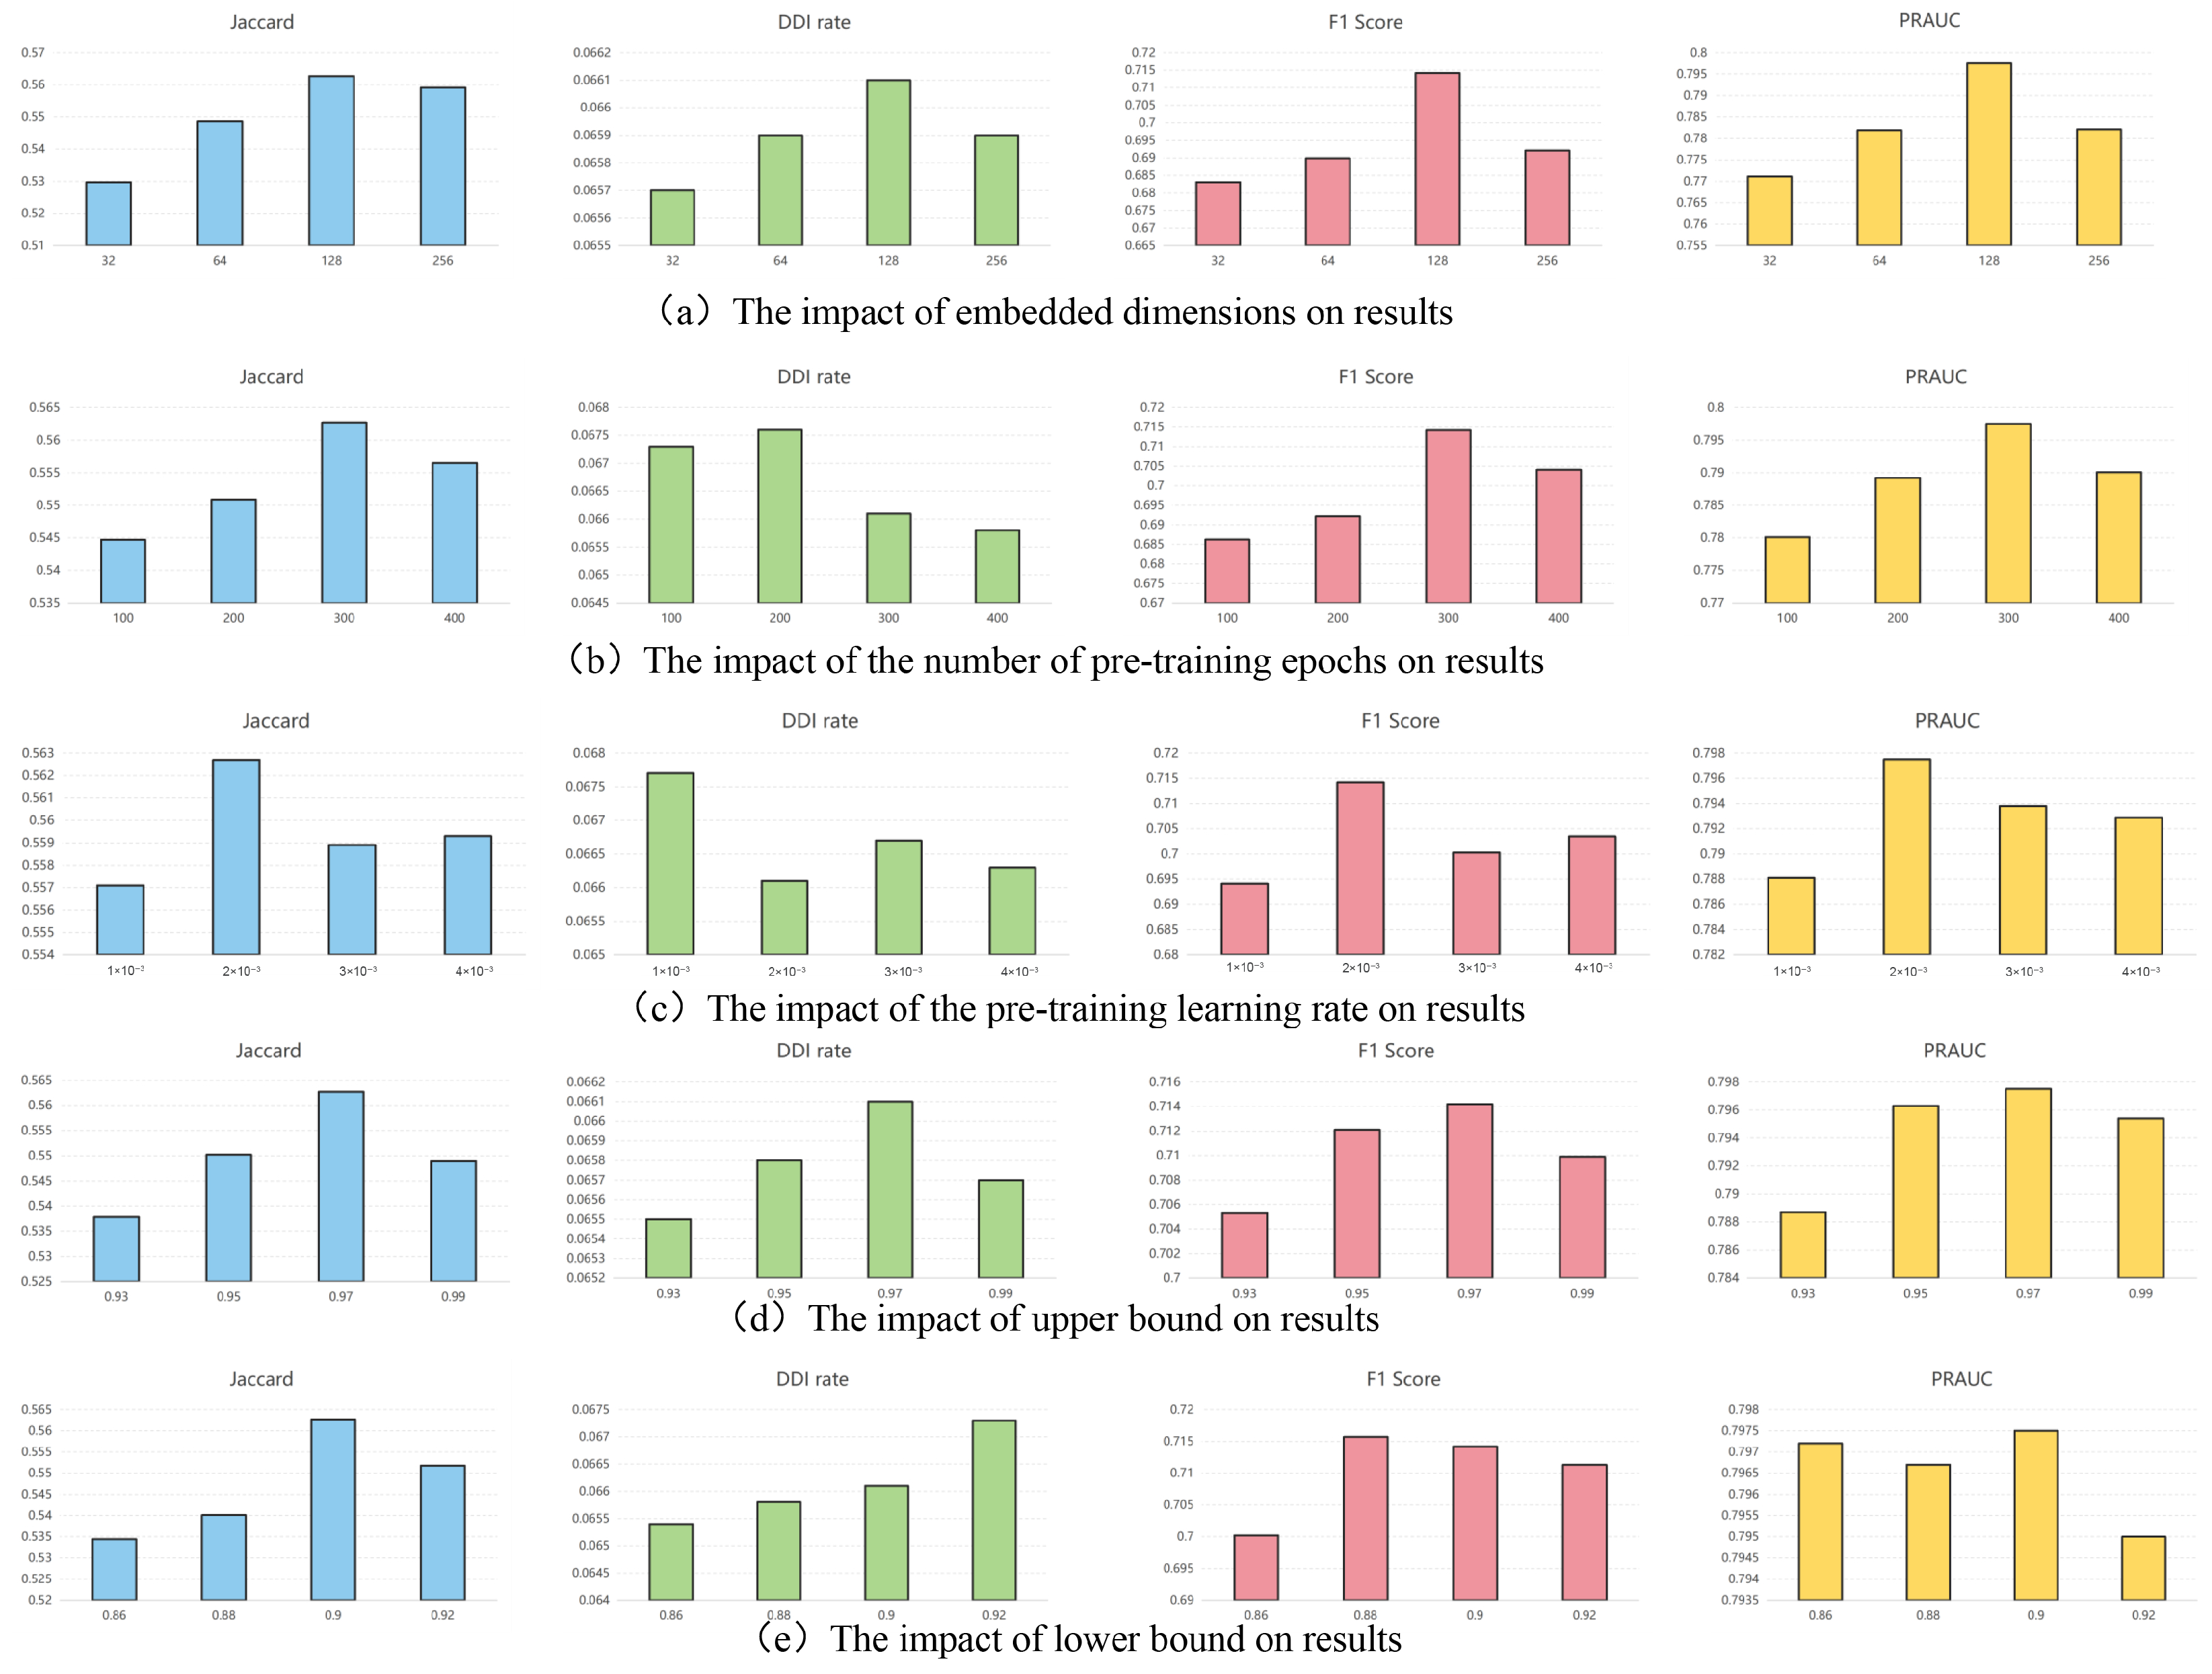
To investigate the impact of key hyperparameters on model performance, we conducted experiments on five important parameters using the MIMIC-III dataset. The corresponding results are shown in Figure 7. The experiments evaluated the model’s performance under different parameter combinations and analyzed the reasons for the observed variations.
Figure 7a illustrates the model’s performance under different embedding dimensions. Setting the dimension to 128 yields significantly higher accuracy with acceptable safety performance, and this was therefore selected as the optimal value to balance accuracy and safety.
Figure 7b,c illustrate the effects of pretraining epochs and learning rate. Insufficient training epochs result in inadequate contrastive learning, whereas an excessive number leads to performance saturation or even degradation. After comprehensive evaluation, 300 pretraining epochs and a learning rate of 2 × 10⁻³ are selected as the optimal configuration. Additionally, a dynamic learning rate adjustment strategy is employed to achieve more stable convergence.
Figure 7d,e demonstrate how the upper and lower bounds of causal effects in bias correction affect performance. It is worth noting that the selection of these bounds is crucial for the bias correction module. In this experiment, both bounds were tested from 0.5 to 1 in steps of 0.01, with four representative values shown. A causal effect below 0.90 suggests weak association, likely due to indirect co-occurrence rather than direct causality; an effect above 0.97 indicates a direct causal relationship. Under this setup, combined with DDI matrix constraints, the model optimizes drug selection based on causal strength while maintaining recommendation safety.
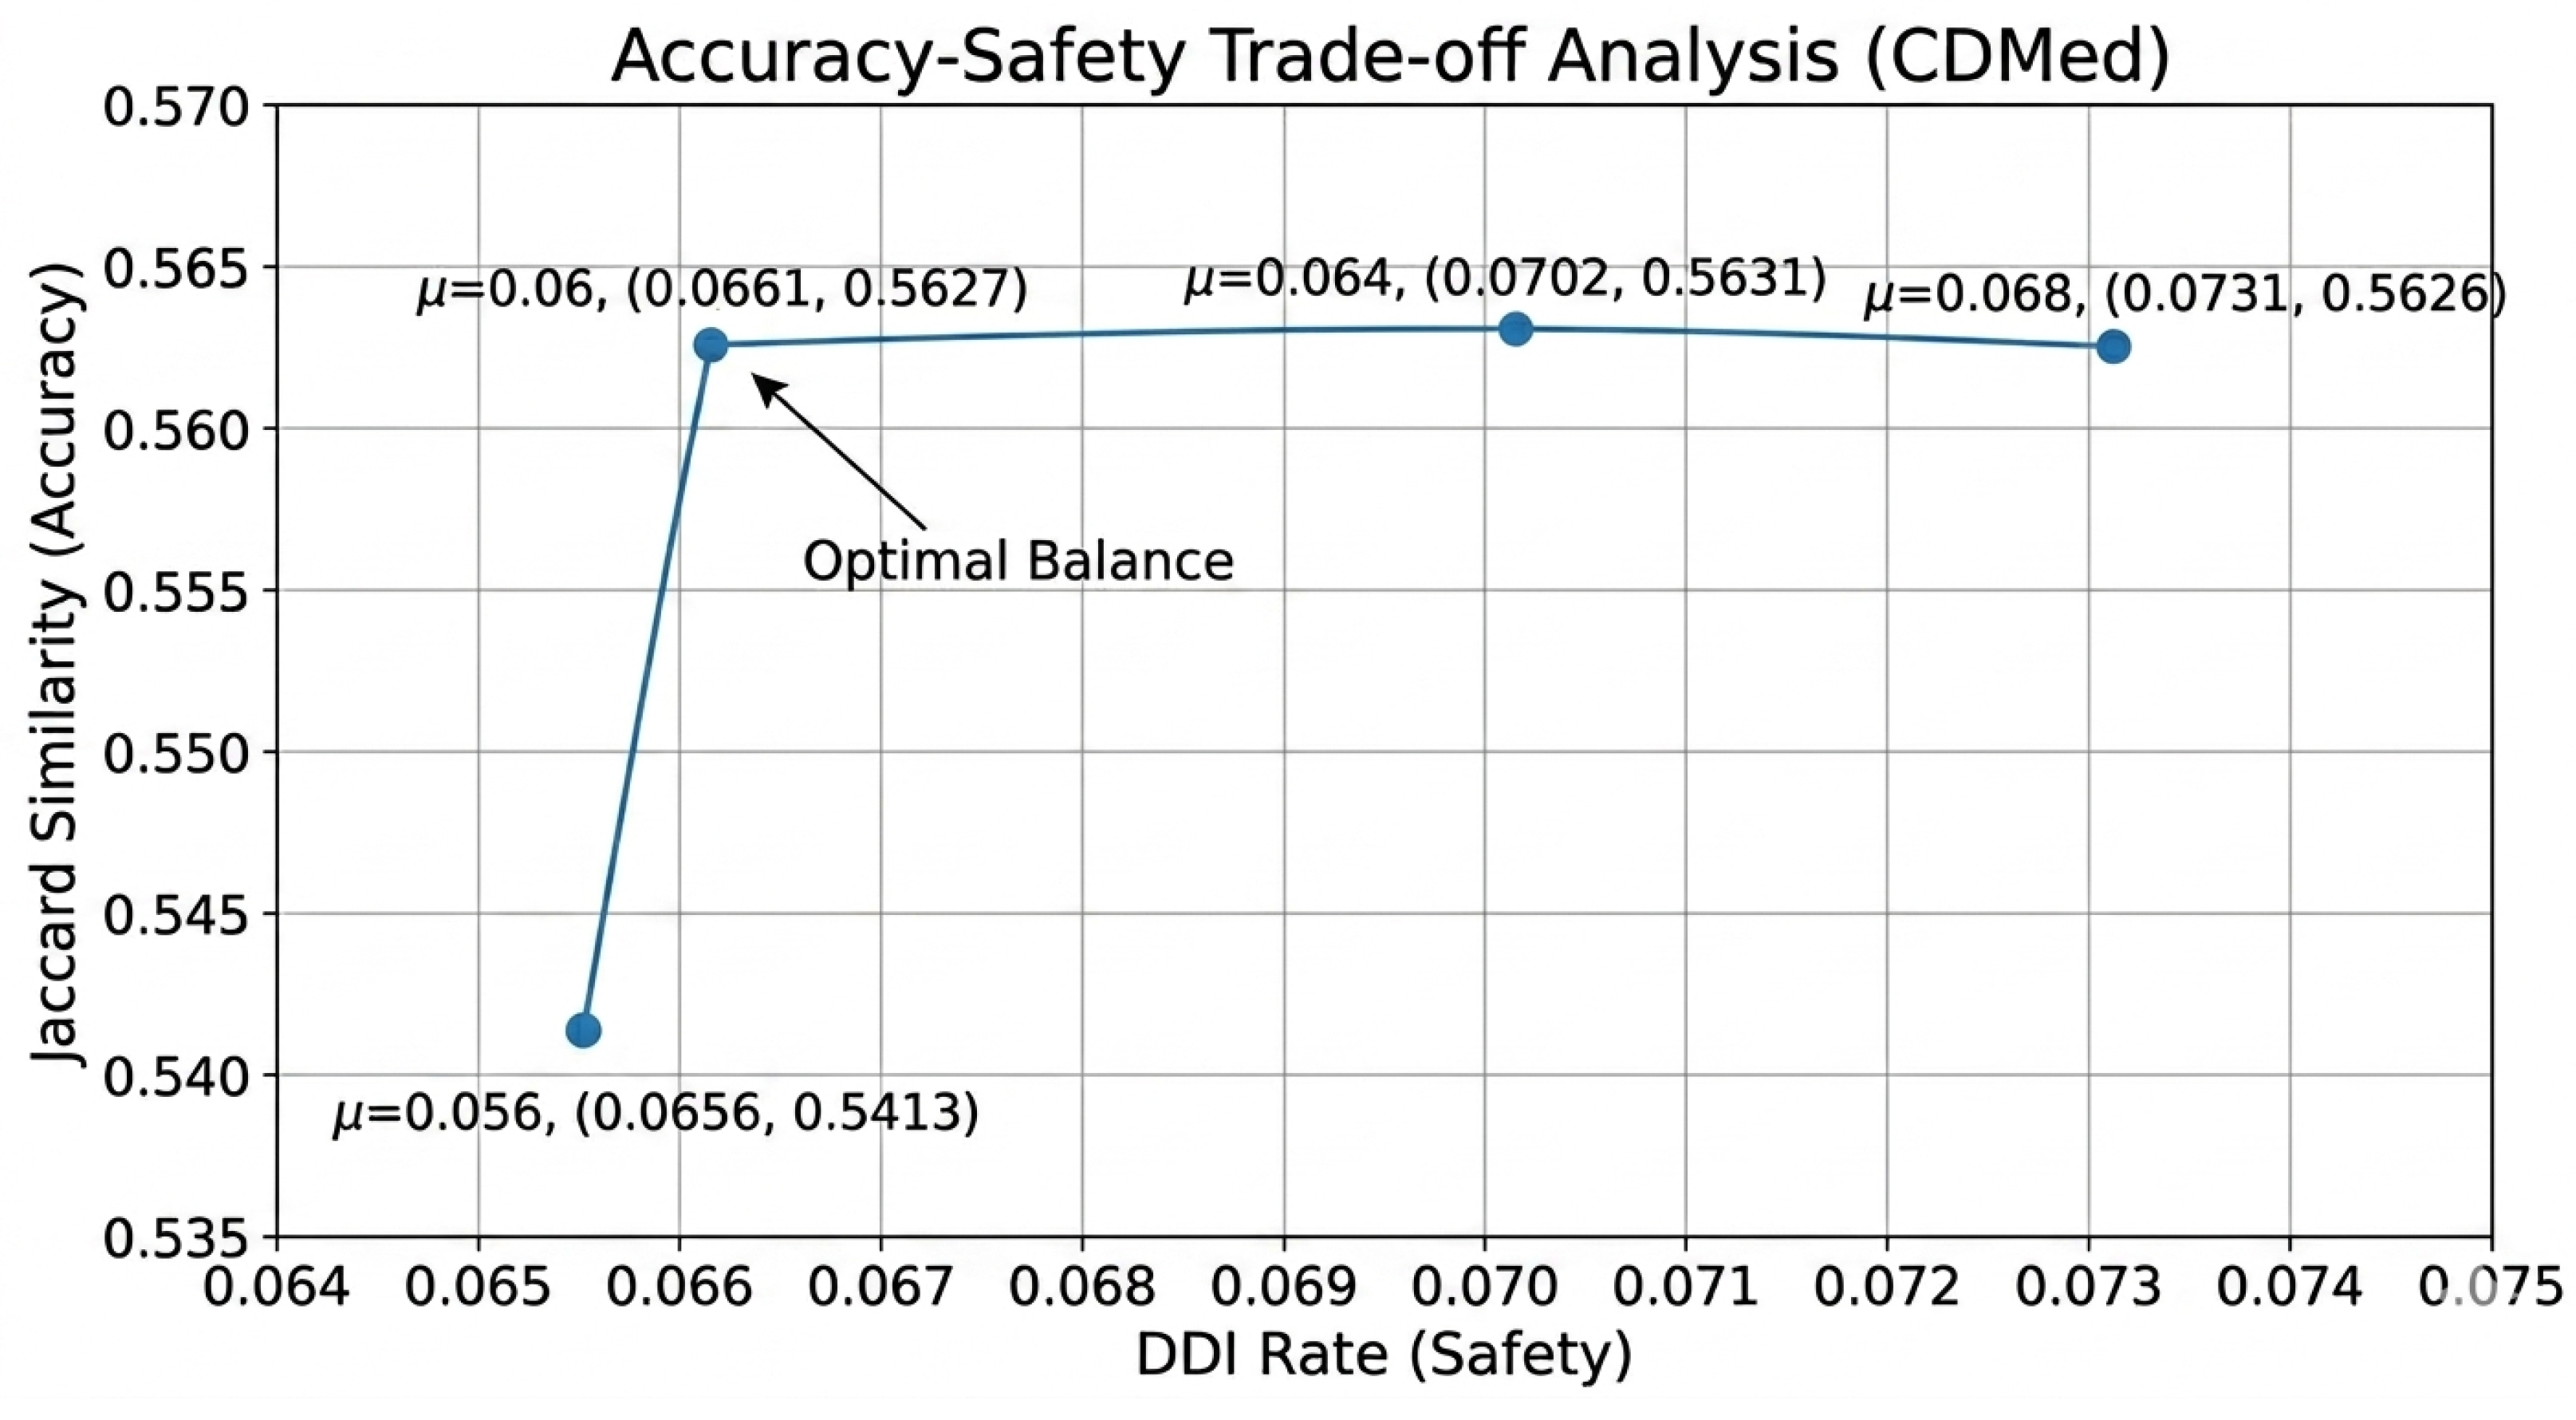
Furthermore, we adjusted the hyperparameter μ to control the strictness of the DDI constraint, thereby quantitatively verifying whether CDMed achieves an effective balance between accuracy and safety. Specifically, we set μ within the range { 0.056 , 0.06 , 0.064 , 0.068 }, retrained the model on the MIMIC-III validation set, and recorded the Jaccard similarity and DDI rate on the test set for each setting.
The experimental results are illustrated in Figure 8. As the rigor of DDI constraints decreases, the recommendation accuracy of the model improves accordingly. However, beyond the threshold of μ = 0.06 , further relaxing the DDI constraints yields diminishing returns in accuracy enhancement, and even exhibits a slight downward trend. Consequently, the model achieves the optimal balance between recommendation accuracy and safety when μ = 0.06 .

5.9. Case Study

To assess CDMed’s clinical recommendation capability, we compared it with SafeDrug, BiMoRec, and CIDGMed on three representative MIMIC-III cases (Table 6). CDMed achieves better results in correct prediction, unseen medication prediction, and omission reduction.
In the ground-truth medications of Patients 1 and 2, atropine and ipratropium bromide are included, respectively. Although their 2D molecular structures are highly similar (Tanimoto coefficient [34] > 95%), the spatial arrangement of their 3D pharmacophores shows a marked difference (pharmacophore RMSD [41] = 4.055 Å), indicating a fundamental distinction in the key stereochemical features that determine pharmacological activity. This structural difference is directly reflected in their clinical indications: atropine is primarily used to treat arrhythmia, whereas ipratropium bromide is indicated as a treatment for asthma and chronic obstructive pulmonary disease. As shown in Figure 9, using 3D molecular information, both CDMed and BiMoRec can distinguish R01A from A03B drugs and provide correct recommendations. However, CDMed demonstrates higher overall accuracy across all three patients, confirming its stronger capability in precise medication differentiation and recommendation.

6. Discussion

Clinical data often contain random missing values (e.g., partial fields of laboratory indicators and medication records are missing). The MIMIC-III/IV datasets used in this study have been cleaned and imputed through standardized processes (such as forward filling and unified coding mapping). At the model design level, CDMed mitigates the impact of missing data through the following mechanisms: during the causal discovery phase, the GIES algorithm can infer causal relationships based on observed data, demonstrating robustness to partially missing co-occurrence patterns; during the representation learning phase, the message-passing mechanism of graph neural networks can compensate for the effects of missing fields by leveraging information from neighboring nodes; during the training process, the multi-task trade-off strategy in the loss function (Formulas (39) and (40)) dynamically adjusts the weights of different data dimensions, thereby reducing the interference of missing dimensions on the overall recommendation. In future work, we will further explore mechanisms for explicitly modeling missing patterns (e.g., adding mask identifiers or employing generative adversarial imputation) to improve the reliability of the model in sparse clinical data.
Furthermore, the DDI matrix used in this study is derived from the FAERS, which is known to contain reporting biases and incomplete records. Such noise in the DDI source could potentially lead to “false negatives” within the safety constraints. To mitigate this issue, CDMed does not rely solely on a static DDI matrix. By integrating the causal effect matrices (Mdm and Mpm), the model is able to quantify the direct therapeutic necessity of each medication. This dual-check mechanism ensures that even if a specific DDI is missing from the reporting system, the system can still penalize drugs with low causal therapeutic scores, thereby enhancing the overall robustness of recommendation safety.

7. Conclusions and Future Work

In paper, we propose a medication recommendation model named CDMed, based on causal inference and dual-granularity information enhancement, which aims to uncover genuine therapeutic relationships from EHR data while eliminating misleading co-occurrence associations and balancing recommendation accuracy with safety. The model first employs causal inference to identify and quantify the actual treatment relationships among diseases, procedures, and medications in EHR, thereby constructing a causal effect matrix. Secondly, it utilizes a weighted relational graph convolutional network for coarse-grained causal modeling, combined with an attention mechanism to extract fine-grained molecular substructure features. Finally, a DDI-Constrained Bias Correction is introduced to optimize the initially generated recommendation results. Additionally, during the molecular pretraining phase, the model incorporates knowledge distillation to integrate the 3D spatial structural information of molecules into an efficient 2D graph encoder, which serves as the foundational representation for subsequent molecular feature extraction. Experimental results on publicly available clinical datasets demonstrate that CDMed achieves improvements in recommendation accuracy, safety, and computational efficiency. Case analyses further validate the model’s effectiveness in distinguishing structurally similar drugs.
Although the CDMed framework proposed in this study demonstrates a strong performance in terms of medication recommendation accuracy, safety, and computational efficiency, there are still several areas that warrant further development. Future work will focus on the following three key directions. First, to address the potential noise and incompleteness of the current DDI data, we will integrate multiple knowledge sources and adopt cross-validation and confidence-weighting strategies to construct a dynamically updated and more reliable DDI knowledge graph, thereby improving the model’s robustness to noisy data and enhancing recommendation safety. Second, to tackle the challenges of noise, redundancy, and missing data in multi-modal heterogeneous electronic health records, we will explore a large-scale data-driven dimensionality reduction approach [42] for clinical feature preprocessing to handle high-dimensional clinical data, thereby further improving the quality of input data for the model. Finally, to advance the system’s deployment in real-world clinical settings, we will conduct real-scene validation under the constraints of ethical and data-security regulations, and iteratively refine the system by incorporating feedback from clinical experts, thus enhancing its practical utility and operational feasibility. Through sustained exploration along these directions, we aim to gradually overcome the current limitations of medication recommendation systems in terms of safety, practicality, and scalability, and promote AI-assisted medication decision-making with the aim of achieving greater reliability, interpretability, and clinical value.

Author Contributions

Conceptualization, J.L.; supervision, H.W.; methodology, J.L.; investigation, H.W. and J.H.; software, J.L.; validation, H.W. and J.L.; formal analysis, H.W. and J.L.; writing—original draft preparation, J.L.; writing—review and editing, H.W.; visualization, J.L.; project administration, H.W.; funding acquisition, J.H. All authors have read and agreed to the published version of the manuscript.

Funding

This work was supported by the National Natural Science Foundation of China under Grant No. 82160347, the Yunnan Provincial Science and Technology Department Social Development Special Project No. 202403AC100018, and the Yunnan Fuwai Cardiovascular Disease Hospital Hospital-level Project Strategy Project 2025YFKT-ZL-08.

Institutional Review Board Statement

Not applicable.

Informed Consent Statement

Not applicable.

Data Availability Statement

The data presented in this study are openly available at https://mimic.physionet.org/ (accessed on 11 May 2026).

Conflicts of Interest

The authors declare no conflicts of interest; the funders had no role in the design of the study, in the collection, analysis, or interpretation of data, in the writing of the manuscript, or in the decision to publish the results.

References

  1. Zhang, S.; Li, J.; Zhou, H.; Zhu, Q.; Zhang, S.; Wang, D. Merits: Medication recommendation for chronic disease with irregular time-series. In Proceedings of the 2021 IEEE International Conference on Data Mining (ICDM); IEEE: Piscataway, NJ, USA, 2021; pp. 1481–1486. [Google Scholar]
  2. Menachemi, N.; Collum, T.H. Benefits and drawbacks of electronic health record systems. Risk Manag. Healthc. Policy 2011, 4, 47–55. [Google Scholar] [CrossRef] [PubMed]
  3. Deng, Y.; Xu, X.; Qiu, Y.; Xia, J.; Zhang, W.; Liu, S. A multimodal deep learning framework for predicting drug–drug interaction events. Bioinformatics 2020, 36, 4316–4322. [Google Scholar] [CrossRef]
  4. Gong, F.; Wang, M.; Wang, H.; Wang, S.; Liu, M. SMR: Medical knowledge graph embedding for safe medicine recommendation. Big Data Res. 2021, 23, 100174. [Google Scholar] [CrossRef]
  5. An, Y.; Zhang, L.; You, M.; Tian, X.; Jin, B.; Wei, X. MeSIN: Multilevel selective and interactive network for medication recommendation. Knowl.-Based Syst. 2021, 233, 107534. [Google Scholar] [CrossRef]
  6. Zhang, Y.; Chen, R.; Tang, J.; Stewart, W.F.; Sun, J. LEAP: Learning to prescribe effective and safe treatment combinations for multimorbidity. In Proceedings of the 23rd ACM SIGKDD International Conference on Knowledge Discovery and Data Mining; Association for Computing Machinery: New York, NY, USA, 2017; pp. 1315–1324. [Google Scholar]
  7. Yang, C.; Xiao, C.; Glass, L.; Sun, J. Change Matters: Medication Change Prediction with Recurrent Residual Networks. In Proceedings of the 30th International Joint Conference on Artificial Intelligence (IJCAI), Online, 19–26 August 2021; pp. 3728–3734. [Google Scholar]
  8. Shang, J.; Xiao, C.; Ma, T.; Li, H.; Sun, J. Gamenet: Graph augmented memory networks for recommending medication combination. AAAI Conf. Artif. Intell. 2019, 33, 1126–1133. [Google Scholar] [CrossRef]
  9. Zheng, Z.; Wang, C.; Xu, T.; Shen, D.; Qin, P.; Huai, B.; Liu, T.; Chen, E. Drug package recommendation via interaction-aware graph induction. In Proceedings of the Web Conference 2021; Association for Computing Machinery: New York, NY, USA, 2021; pp. 1284–1295. [Google Scholar]
  10. Ma, T.; Lin, X.; Song, B.; Yu, P.S.; Zeng, X. Kg-mtl: Knowledge graph enhanced multi-task learning for molecular interaction. IEEE Trans. Knowl. Data Eng. 2022, 35, 7068–7081. [Google Scholar] [CrossRef]
  11. Yang, C.; Xiao, C.; Ma, F.; Glass, L.; Sun, J. SafeDrug: Dual molecular graph encoders for safe drug recommendations. In Proceedings of the Thirtieth International Joint Conference on Artificial Intelligence, Montreal, QC, Canada, 19–27 August 2021. [Google Scholar]
  12. Yang, N.; Zeng, K.; Wu, Q.; Yan, J. Molerec: Combinatorial drug recommendation with substructure-aware molecular representation learning. In Proceedings of the ACM Web Conference 2023; Association for Computing Machinery: New York, NY, USA, 2023; pp. 4075–4085. [Google Scholar]
  13. Ma, G.-F.; Wen, X.; Yang, X.-H.; Zhou, Y.; Huang, W.; Li, X.-X.; Jiang, P. Robust drug recommendation based on patient status awareness and unbiased prediction. Inf. Process. Manag. 2026, 63, 104698. [Google Scholar] [CrossRef]
  14. Mi, J.; Zu, Y.; Wang, Z.; He, J. ACDNet: Attention-guided Collaborative Decision Network for effective medication recommendation. J. Biomed. Inform. 2024, 149, 104570. [Google Scholar] [CrossRef]
  15. Li, X.; Liang, S.; Lei, Y.; Li, C.; Hou, Y.; Zheng, D.; Ma, T. Causalmed: Causality-based personalized medication recommendation centered on patient health state. In Proceedings of the 33rd ACM International Conference on Information and Knowledge Management; Association for Computing Machinery: New York, NY, USA, 2024; pp. 1276–1285. [Google Scholar]
  16. Liang, S.; Li, X.; Mu, S.; Li, C.; Lei, Y.; Hou, Y.; Ma, T. CIDGMed: Causal inference-driven medication recommendation with enhanced dual-granularity learning. Knowl.-Based Syst. 2025, 309, 112685. [Google Scholar] [CrossRef]
  17. Choi, E.; Bahadori, M.T.; Sun, J.; Kulas, J.; Schuetz, A.; Stewart, W. Retain: An interpretable predictive model for healthcareusing reverse time attention mechanism. In Proceedings of the 30th International Conference on Neural Information Processing Systems, Barcelona, Spain, 5–10 December 2016. [Google Scholar]
  18. Wu, R.; Qiu, Z.; Jiang, J.; Qi, G.; Wu, X. Conditional generation net for medication recommendation. In Proceedings of the ACM Web Conference 2022; Association for Computing Machinery: New York, NY, USA, 2022; pp. 935–945. [Google Scholar]
  19. Zheng, Z.; Wang, C.; Xu, T.; Shen, D.; Qin, P.; Zhao, X.; Huai, B.; Wu, X.; Chen, E. Interaction-aware drug package recommendation via policy gradient. ACM Trans. Inf. Syst. 2023, 41, 1–32. [Google Scholar] [CrossRef]
  20. Li, X.; Liang, S.; Hou, Y.; Ma, T. StratMed: Relevance stratification between biomedical entities for sparsity on medication recommendation. Knowl.-Based Syst. 2024, 284, 111239. [Google Scholar] [CrossRef]
  21. Chen, Q.; Li, X.; Geng, K.; Wang, M. Context-aware safe medication recommendations with molecular graph and DDI graph embedding. AAAI Conf. Artif. Intell. 2023, 37, 7053–7060. [Google Scholar] [CrossRef]
  22. Kang, A.; Lu, M.-Y.; Tian, Y.-K.; Zhang, Y.-J. DFHD: Dual-granularity Fusion Network using Historical Drugs for Drug Recommendation. Expert Syst. Appl. 2025, 298, 129693. [Google Scholar] [CrossRef]
  23. Mu, S.; Li, C.; Li, X.; Liang, S. Medication recommendation via dual molecular modalities and multi-step enhancement. Expert Syst. Appl. 2025, 276, 127163. [Google Scholar] [CrossRef]
  24. Gao, C.; Zheng, Y.; Wang, W.; Feng, F.; He, X.; Li, Y. Causal inference in recommender systems: A survey and future directions. ACM Trans. Inf. Syst. 2024, 42, 1–32. [Google Scholar] [CrossRef]
  25. Wei, T.; Feng, F.; Chen, J.; Wu, Z.; Yi, J.; He, X. Model-agnostic counterfactual reasoning for eliminating popularity bias in recommender system. In Proceedings of the 27th ACM SIGKDD Conference on Knowledge Discovery & Data Mining; Association for Computing Machinery: New York, NY, USA, 2021; pp. 1791–1800. [Google Scholar]
  26. Hoffman, K.B.; Dimbil, M.; Erdman, C.B.; Tatonetti, N.P.; Overstreet, B.M. The Weber effect and the United States Food and Drug Administration’s Adverse Event Reporting System (FAERS): Analysis of sixty-two drugs approved from 2006 to 2010. Drug Saf. 2014, 37, 283–294. [Google Scholar] [CrossRef]
  27. Hasan, U.; Hossain, E.; Gani, M.O. A survey on causal discovery methods for temporal and non-temporal data. arXiv 2023, arXiv:2303.15027. [Google Scholar]
  28. Johnson, A.E.; Pollard, T.J.; Shen, L.; Lehman, L.W.H.; Feng, M.; Ghassemi, M.; Moody, B.; Szolovits, P.; Anthony Celi, L.; Mark, R.G. MIMIC-III, a freely accessible critical care database. Sci. Data 2016, 3, 160035. [Google Scholar] [CrossRef]
  29. Johnson, A.E.; Bulgarelli, L.; Shen, L.; Gayles, A.; Shammout, A.; Horng, S.; Pollard, T.J.; Hao, S.; Moody, B.; Gow, B. MIMIC-IV, a freely accessible electronic health record dataset. Sci. Data 2023, 10, 1. [Google Scholar] [CrossRef]
  30. Hastie, T.J.; Pregibon, D. Generalized linear models. In Statistical Models in S; Routledge: London, UK, 2017; pp. 195–247. [Google Scholar]
  31. Xu, K.; Hu, W.; Leskovec, J.; Jegelka, S. How powerful are graph neural networks? arXiv 2018, arXiv:1810.00826. [Google Scholar]
  32. Townshend, R.J.; Vögele, M.; Suriana, P.; Derry, A.; Powers, A.; Laloudakis, Y.; Balachandar, S.; Jing, B.; Anderson, B.; Eismann, S. Atom3d: Tasks on molecules in three dimensions. arXiv 2020, arXiv:2012.04035. [Google Scholar]
  33. Jing, B.; Eismann, S.; Suriana, P.; Townshend, R.J.; Dror, R. Learning from protein structure with geometric vector perceptrons. arXiv 2020, arXiv:2009.01411. [Google Scholar]
  34. Landrum, G. Rdkit documentation. Release 2013, 1, 4. [Google Scholar]
  35. Luo, Y.; Liu, Y.; Peng, J. Calibrated geometric deep learning improves kinase–drug binding predictions. Nat. Mach. Intell. 2023, 5, 1390–1401. [Google Scholar] [CrossRef]
  36. Schlichtkrull, M.; Kipf, T.N.; Bloem, P.; Van Den Berg, R.; Titov, I.; Welling, M. Modeling relational data with graph convolutional networks. In Proceedings of the European Semantic Web Conference; Springer International Publishing: Cham, Switzerland, 2018; pp. 593–607. [Google Scholar]
  37. Lee, J.; Lee, Y.; Kim, J.; Kosiorek, A.; Choi, S.; Teh, Y.W. Set transformer: A framework for attention-based permutation-invariant neural networks. In Proceedings of the International Conference on Machine Learning; PMLR: Long Beach, CA, USA, 2019; pp. 3744–3753. [Google Scholar]
  38. Indra, S.; Wikarsa, L.; Turang, R. Using logistic regression method to classify tweets into the selected topics. In Proceedings of the 2016 International Conference on Advanced Computer Science and Information Systems (ICACSIS); IEEE: Piscataway, NJ, USA, 2016; pp. 385–390. [Google Scholar]
  39. Li, X.; Meng, F.; Wei, J.; Zhang, Y. Towards robust drug recommendation based on dual perspective encoder and iterative denoising mechanism. Expert Syst. Appl. 2025, 283, 127784. [Google Scholar] [CrossRef]
  40. Cheng, K.; Xue, X.; Chan, K. Zero emission electric vessel development. In Proceedings of the 2015 6th International Conference on Power Electronics Systems and Applications (PESA); IEEE: Piscataway, NJ, USA, 2015; pp. 1–5. [Google Scholar]
  41. Sanders, M.P.; Barbosa, A.J.; Zarzycka, B.; Nicolaes, G.A.; Klomp, J.P.; De Vlieg, J.; Del Rio, A. Comparative analysis of pharmacophore screening tools. J. Chem. Inf. Model. 2012, 52, 1607–1620. [Google Scholar] [CrossRef]
  42. Tutsoy, O.; Ozturk, H.A.; Sumbul, H.E. Big data dimensionality reduction-based supervised machine learning algorithms for NASH diagnosis. BMC Bioinform. 2025, 26, 256. [Google Scholar] [CrossRef]
Figure 1. Solid arrows indicate causal relationships between two entities. Although the co-occurrence frequency between m 1 and d 3 is high, there is no actual causal relationship between them. The same applies to the relationship between m 2 and d 3 .
Electronics 15 02087 g001
Figure 2. A brief description of medication recommendation using CDMed.
Electronics 15 02087 g002
Figure 3. CDMed flowchart: The left module applies causal inference to EHR data, producing causal graphs and effect matrices; The top-right module employs contrastive learning to pre-train a graph encoder that fuses 2D/3D molecular features; The middle-right module learns enhanced patient representations through dual-granularity (medication- and molecular-level) information, yielding initial medication probabilities; The bottom module performs bias correction using the causal effect matrix and DDI constraints to refine probabilities and output the final medication combination.
Electronics 15 02087 g003
Figure 4. Correcting errors from co-occurrence relationships through causal discovery to generate causal relationships.
Electronics 15 02087 g004
Figure 5. Through the molecular augmentation module, the key molecular weights within historical medications are identified, thereby enhancing their representations.
Electronics 15 02087 g005
Figure 6. Results of our comparative experiments on the MIMIC-III and MIMIC-IV datasets.
Electronics 15 02087 g006
Figure 7. Experiments on parameter sensitivity on MIMIC-III dataset.
Electronics 15 02087 g007
Figure 8. The accuracy–safety trade-off curve of the CDMed model under DDI control constraints.
Electronics 15 02087 g008
Figure 9. Comparison of model accuracy in predicting testosterone versus estradiol.
Electronics 15 02087 g009
Table 1. Experimental statistics table.
MIMIC-IIIMIMIC-IV
# of patients635060,125
# of visits15,032156,810
# of diagnoses19582000
# of procedures14301500
# of medications131131
Average # visits2.372.61
Average # medications8.806.66
Table 2. Comparison of recommendation performance results on MIMIC-III.
MethodsJaccard ↑ F1-Score ↑PRAUC ↑DDI Rate ↓Avg. Med. ↓
LR0.4348 ± 0.00190.6491 ± 0.00190.7433 ± 0.00190.0831 ± 0.002516.0489 ± 0.0015
RETAIN0.4871 ± 0.00210.6478 ± 0.00270.7600 ± 0.00240.0879 ± 0.002219.4222 ± 0.0017
GAMENet0.4994 ± 0.00130.6560 ± 0.00160.7656 ± 0.00230.0891 ± 0.000627.7311 ± 0.0018
SafeDrug0.5154 ± 0.00150.6722 ± 0.00110.7627 ± 0.00080.0655 ± 0.002119.4316 ± 0.0019
MoleRec0.5293 ± 0.00210.6834 ± 0.00080.7746 ± 0.00120.0728 ± 0.002422.0125 ± 0.0006
BiMoRec0.5414 ± 0.00190.6944 ± 0.00150.7853 ± 0.00190.0707 ± 0.001920.3989 ± 0.0009
DPID0.5428 ± 0.00130.6948 ± 0.00190.7877 ± 0.00210.0671 ± 0.001819.9611 ± 0.0014
PAUP0.5455 ± 0.00170.6979 ± 0.00090.7896 ± 0.00170.0736 ± 0.001521.4357 ± 0.0016
CIDGMed0.5503 ± 0.00160.7053 ± 0.00210.7891 ± 0.00260.0684 ± 0.001422.0311 ± 0.0012
CDMed0.5627 ± 0.00110.7142 ± 0.00190.7975 ± 0.00150.0661 ± 0.001920.2911 ± 0.0016
Bold numbers indicate the best performance, ↑ indicates higher is better, ↓ indicates lower is better.
Table 3. Comparison of recommendation performance results on MIMIC-IV.
MethodsJaccard ↑ F1-Score ↑PRAUC ↑DDI Rate ↓Avg. Med. ↓
LR0.4264 ± 0.00110.5546 ± 0.00160.6613 ± 0.00190.0783 ± 0.00258.5738 ± 0.0013
RETAIN0.4234 ± 0.00210.5792 ± 0.00170.6792 ± 0.00130.0936 ± 0.002210.9522 ± 0.0010
GAMENet0.4565 ± 0.00180.6103 ± 0.00190.7092 ± 0.00230.0685 ± 0.001718.5895 ± 0.0018
SafeDrug0.4487 ± 0.00120.6014 ± 0.00170.6948 ± 0.00180.0604 ± 0.001113.6943 ± 0.0014
MoleRec0.4744 ± 0.00130.6262 ± 0.00180.7124 ± 0.00170.0722 ± 0.001413.4806 ± 0.0015
BiMoRec0.4917 ± 0.00150.6424 ± 0.00090.7366 ± 0.00150.0696 ± 0.001813.5489 ± 0.0011
DPID0.5052 ± 0.00240.6548 ± 0.00140.7521 ± 0.00220.0650 ± 0.001916.9611 ± 0.0013
PAUP0.4960 ± 0.00210.6474 ± 0.00110.7426 ± 0.00170.0671 ± 0.001213.5357 ± 0.0014
CIDGMed0.5013 ± 0.00110.6523 ± 0.00150.7449 ± 0.00260.0653 ± 0.001618.4811 ± 0.0015
CDMed0.5129 ± 0.00110.6611 ± 0.00190.7561 ± 0.00150.0641 ± 0.001913.9191 ± 0.0012
Bold numbers indicate the best performance, ↑ indicates higher is better, ↓ indicates lower is better.
Table 4. The performance of recent excellent models in training and inference efficiency.
ModelConvergence EpochTraining Time /Epoch (s)Total Training Times (s)Inference Times (s)
LEAP30380.111,403.0380.1
GAMENet3945.51774.519.5
SafeDrug5438.42073.620.2
MoleRec25250.86270.032.1
BiMoRec15409.36139.515.1
CIDGMed10332.73327.022.7
CDMed12354.44252.818.4
Table 5. Model variant performance on MIMIC-III and MIMIC-IV.
Model VariantMIMIC-IIIMIMIC-IV
JaccardDDIF1PRAUCJaccardDDIF1PRAUC
CDMed w/o P0.55110.06790.70290.79300.50350.06860.65350.7481
CDMed w/o C0.54890.06790.69210.79020.48920.06720.64430.7389
CDMed w/o F0.54970.07110.69920.79110.48780.07120.64570.7428
CDMed w/o DBC0.54720.06720.68820.78160.48010.06880.63820.7363
CDMed w/o C + F0.54680.07220.69870.78300.48250.07090.64190.7376
CDMed w/o C + F + DBC0.54010.07150.70170.77810.47980.06970.63920.7314
CDMed0.56270.06610.71420.79750.51290.06410.66110.7561
Bold numbers indicate the best performance.
Table 6. Results of different baselines for medication recommendation. Here, “correct” indicates correct prediction, “unseen” refers to predicted medications not in the ground truth, while “missed” refers to medications that were in the ground truth but not predicted.
PatientMethodsRecommended Medication Combination
1Ground-Truth (23)A06A B05C C07A A12B C03C A12A A02A J01M C02A B01A A11C C03A A03B N06A A01A C01A A02B C02D C01B N05C A12C C09A D01A
SafeDrug13 correct + 10 missed + 6 unseen
BiMoRec14 correct + 9 missed + 7 unseen
CIDGMed14correct + 9 missed + 5 unseen
CDMed16correct + 7 missed + 4 unseen
2Ground-Truth (20)C07A N02B B01A H03A R01A R03A A02B R05D J01F J01D N05B A04A N04C B10A G04C N06A A07E A06A A12C A07A
SafeDrug11 correct + 9 missed + 6 unseen
BiMoRec13 correct + 7 missed + 6 unseen
CIDGMed14correct + 6 missed + 4 unseen
CDMed16correct + 4 missed + 4 unseen
3Ground-Truth (20)A06A B05C A12C A07A N02B C03C A02A B01A A02B C01C A12B H03A J01M N02A R03A J01C B02B H01C N05A C01B
SafeDrug10correct + 10 missed + 5 unseen
BiMoRec14correct + 11 missed + 6 unseen
CIDGMed14correct + 11 missed + 4 unseen
CDMed15correct + 10 missed + 5 unseen
Disclaimer/Publisher’s Note: The statements, opinions and data contained in all publications are solely those of the individual author(s) and contributor(s) and not of MDPI and/or the editor(s). MDPI and/or the editor(s) disclaim responsibility for any injury to people or property resulting from any ideas, methods, instructions or products referred to in the content.