1. Introduction
Bolts are essential fasteners widely used in machinery, construction, transportation, and energy systems. As one of the most fundamental and critical mechanical components, their performance directly affects the safety, reliability, and service life of the entire structure. The system-level impact of bolt preload reliability has been extensively discussed in recent reviews [
1]. Under harsh operating conditions, such as high temperature, high pressure, strong vibration, and corrosive environments, bolt degradation and failure are more likely to occur [
2]. Engineering practice has shown that bolt failure can result in substantial casualties and significant economic losses, as evidenced by recent industrial accidents [
3]. Therefore, the development of online fault condition monitoring technologies that can operate rapidly and reliably is of great practical significance.
Conventional inspection techniques, such as visual assessment, manual tapping, and torque wrench testing, remain widely utilized due to their simplicity. However, these methods are intrinsically reliant on human expertise and are highly susceptible to subjective operational inconsistencies [
4]. Recently, vision-based inspection techniques have mitigated this subjectivity by employing deep learning algorithms for the automated recognition of bolt morphology and rotation angles [
5,
6]. Nevertheless, the efficacy of these visual methods frequently deteriorates under challenging lighting conditions, occlusions, or during the detection of incipient loosening, where visual discrepancies are negligible.
In contrast, acoustic condition monitoring presents compelling advantages, encompassing non-contact operation, deployment flexibility, and high sensitivity to interfacial degradation without necessitating structural disassembly. Foundational studies have validated the feasibility of utilizing acoustic and ultrasonic emissions to evaluate bolted joint integrity [
7,
8]. Building on this premise, contemporary research predominantly leverages direct impact or knocking acoustic signals to identify structural loosening [
9,
10]. To capture more complex structural dynamics, sophisticated vibro-acoustic modulation techniques—including frequency-swept probe waves—have been subsequently introduced [
11,
12]. Furthermore, previous studies have demonstrated the feasibility of utilizing advanced computational methods and acoustic features to quantify the degree of loosening [
13,
14]. Despite these methodological advancements, a critical bottleneck persists: acoustic signals remain highly vulnerable to background noise prevalent in complex industrial environments [
15]. Furthermore, classical acoustic feature extraction algorithms (e.g., MFCC, PLP, and standard audio filters), while highly effective in speech recognition, frequently fail to extract the critical acoustic fingerprints associated with incipient loosening under low signal-to-noise ratio (SNR < 15 dB) conditions [
14,
16,
17].
To address these bottlenecks in industrial fault diagnosis, recent studies have increasingly focused on enhancing out-of-distribution (OOD) robustness and domain generalization (DG) capability. For example, to enable robust fault detection under extreme conditions such as zero-faulty-data scenarios, architectures such as the shrinkage Mamba relation network combined with OOD data augmentation have been proposed [
18]. In addition, learning category-invariant disentangled features has been shown to significantly improve domain generalization performance [
19]. Meanwhile, the rapid development of artificial intelligence has driven industrial fault diagnosis beyond traditional convolutional architectures toward foundation models and large vision–language models (VLMs). These advanced methods leverage multimodal learning and alignment strategies to better handle complex and imbalanced industrial data. For example, recent studies have explored RLHF-optimized industrial large vision–language models for CNC fault diagnosis, highlighting the potential of multimodal architectures for alleviating data scarcity and improving interpretability [
20].
Inspired by these developments—from decoupled structural representation learning for OOD robustness to large-scale foundational modeling—this work aims to adaptively suppress unknown noise and decouple acoustic signatures through a novel network architecture. Although the present study focuses on acoustic modalities, the proposed structural design also provides a basis for future integration with broader multimodal industrial AI frameworks. Accordingly, this paper proposes PCT-Net, a novel PANNs–CNN–Transformer fusion architecture for bolt loosening detection, which integrates acoustic signal perception and deep feature learning within a unified framework. The main contributions of this work are summarized as follows: First, an adaptive spectral masking mechanism with non-zero blending is introduced to improve feature extraction under complex noise conditions. Unlike rigid zero-padding, the proposed strategy dynamically adjusts local spectral energy according to the sample-level noise floor, thereby helping preserve signal characteristics and enhance noise robustness. Second, a hierarchical local perception framework is constructed based on a cascaded bottom-up convolutional topology. By progressively expanding the channel dimensions, the model is able to better capture fine-grained local patterns and suppress ambient interference, thereby generating discriminative sequential features from high-resolution spectrograms. Third, global dependency modeling is achieved through a Transformer-based self-attention mechanism. By modeling long-range temporal dependencies across the tapping cycle, the proposed architecture enables effective integration of local and global information, thereby improving the identification of subtle loosening states. Crucially, unlike conventional hybrid models that rely on the simple sequential concatenation of convolutional and attention modules, PCT-Net establishes a synergistic “decoupling-modeling” paradigm. Rather than suffering from functional redundancy, our architecture is closely aligned with the physical characteristics of acoustic loosening signals: it explicitly assigns the multi-layer CNNs to decouple high-frequency transient impacts, while reserving the Transformer exclusively for capturing long-range structural decay. This integrated design overcomes the representation bottlenecks inherent in traditional direct-fusion networks. A more structured and detailed description of these innovations is provided in the
Supplementary Materials (File S1). Refer to the
Supplementary Materials (File S1).
2. Methodology
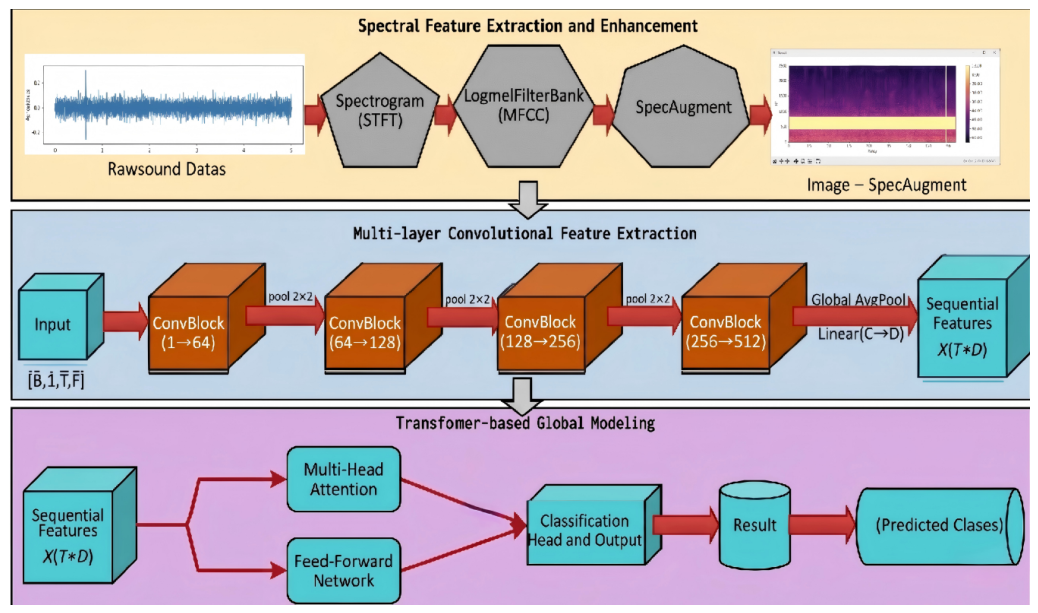
The proposed intelligent acoustic edge-monitoring system for bolt loosening detection operates through a three-stage pipeline, as systematically illustrated in
Figure 1. This end-to-end process comprises: (1) Acoustic Time–Frequency Representation and Adaptive Enhancement, which converts raw tapping sounds into perception-aligned Log-Mel spectrograms [
21] coupled with an adaptive spectral masking strategy to ensure robust performance against non-stationary industrial noise; (2) Multi-layer Convolutional Feature Extraction [
22], which compresses high-resolution acoustic inputs into compact, structure-relevant representations by capturing local time–frequency energy patterns; and (3) Transformer [
23] Global Modeling and Classification, which leverages multi-head self-attention mechanisms to construct long-range temporal dependencies, outputting highly reliable probabilities for bolt loosening states.
2.1. Acoustic Time–Frequency Representation and Adaptive Enhancement
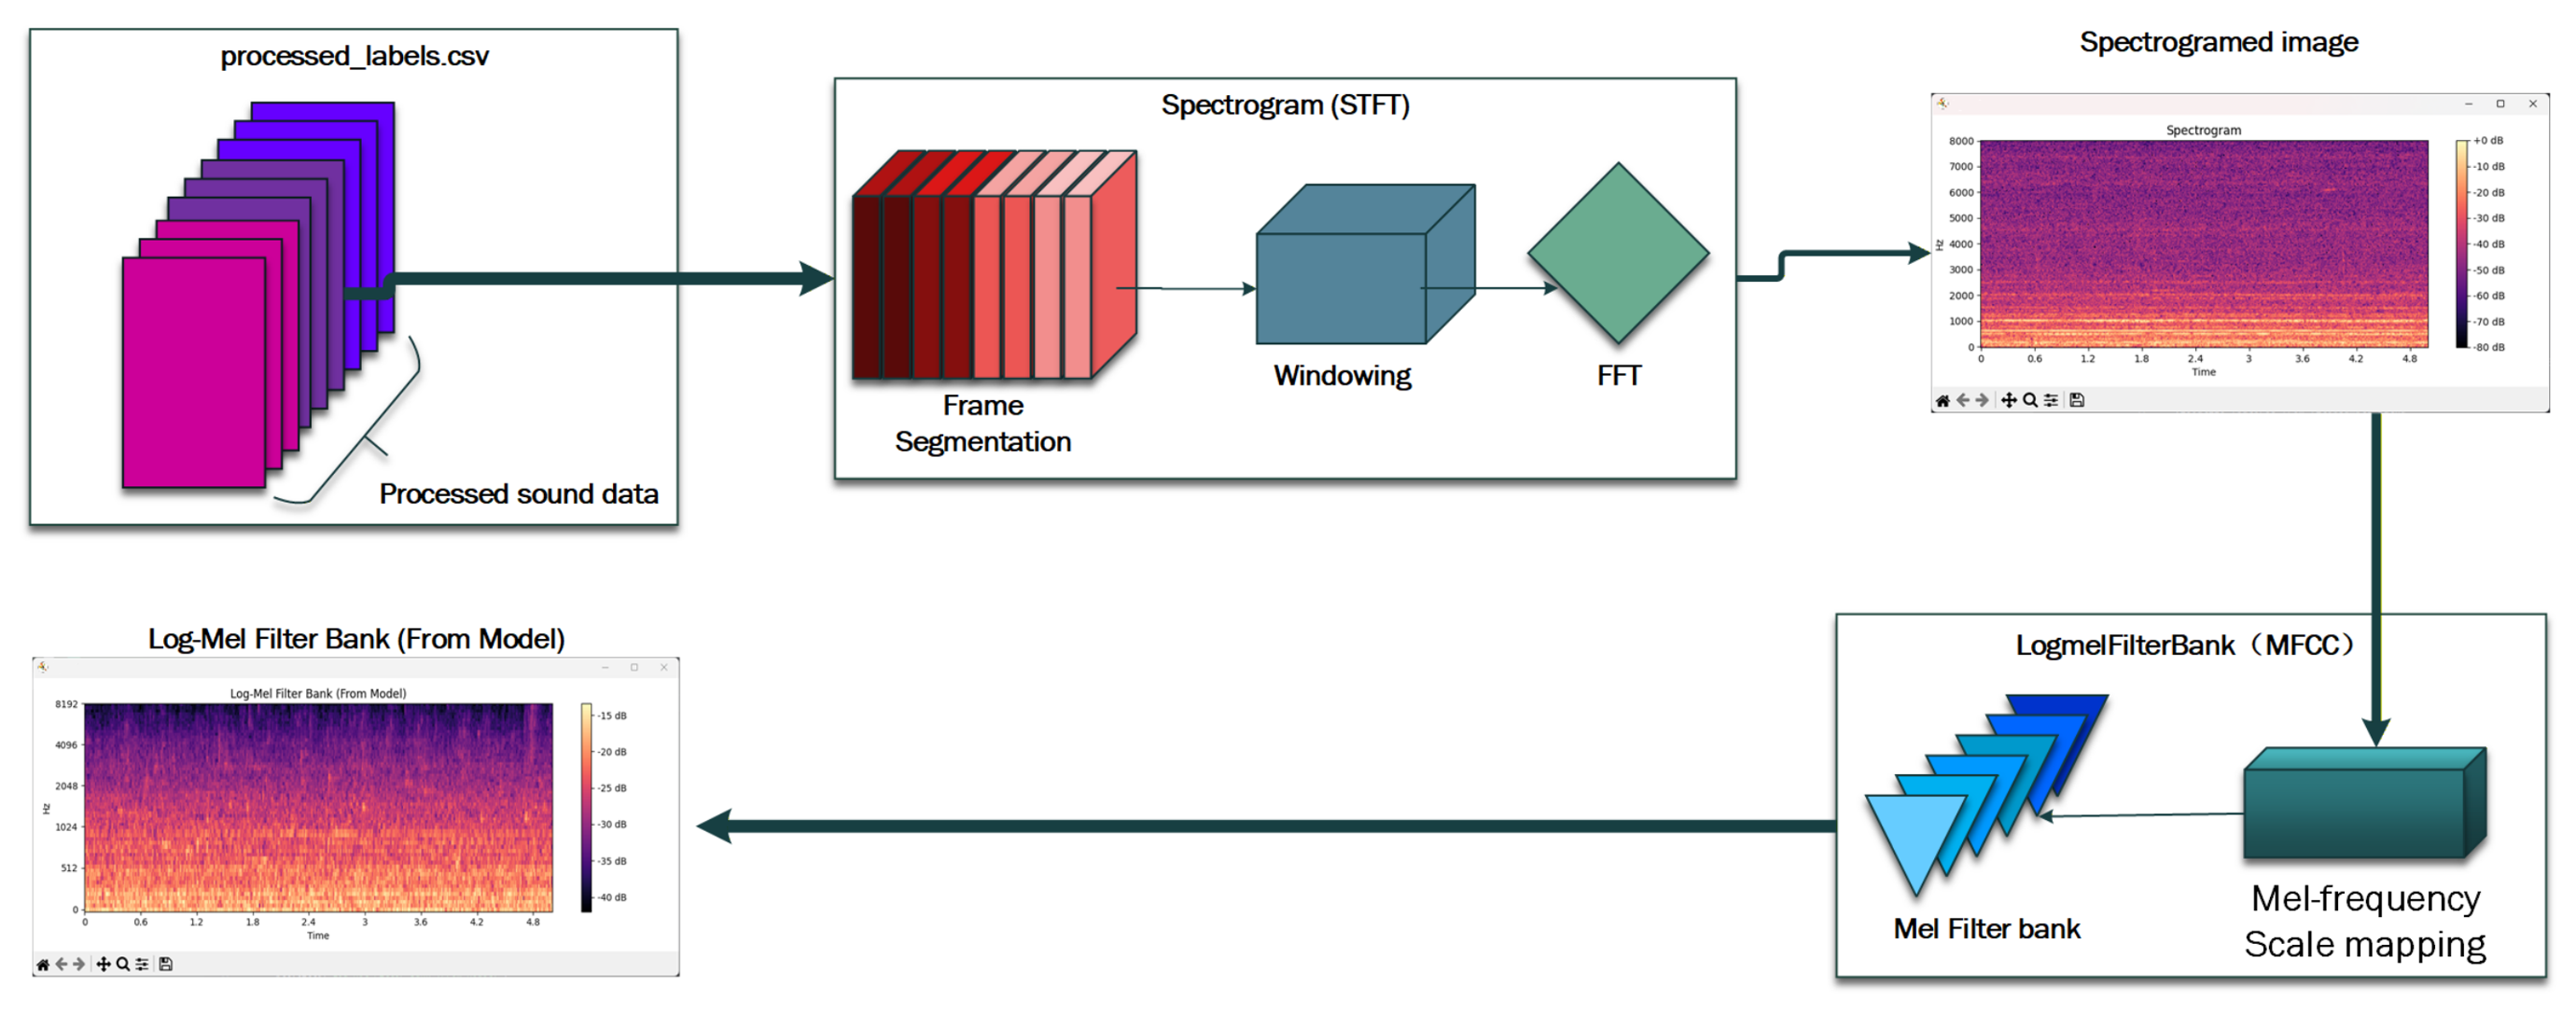
To extract stable and discriminative features from noise-interfered acoustic signals, this system deploys a rigorous digital signal processing (DSP) frontend. Initially, the raw one-dimensional acoustic waveform is transformed into a two-dimensional time–frequency spectrum via the Short-Time Fourier Transform (STFT), explicitly characterizing the energy distribution dynamics across continuous time intervals (
Figure 2).
To align this feature representation with the non-linear perceptual characteristics of human hearing—which exhibits higher sensitivity to low-frequency variations—the linear frequency axis is mapped onto the Mel scale. By applying a Mel filter bank to smooth and aggregate the STFT energy spectrum, the system ensures high resolution for critical low-frequency mechanical responses while imposing moderate compression on high-frequency background noise. The mathematical definition of this conversion is:
The energy of each channel obtained in the Mel domain is then logarithmically compressed to enhance the contrast of mid-to-low frequency information and improve numerical stability, forming the final Log-Mel spectrogram. The expression is given by:
where
is an infinitesimally small stabilization term introduced to prevent zero-logarithm errors.
Building upon this baseline representation, we introduce a novel Adaptive Spectral Masking mechanism to address the severe signal-to-noise ratio (SNR) degradation common in complex industrial environments. Conventional deep learning models are highly susceptible to “memorizing” background noise profiles. Unlike standard random masking, our approach dynamically adjusts the masking intensity based on a sample-level noise factor
in
, which is adaptively computed according to the global energy distribution:
where
E denotes the total acoustic energy of the current sample,
is the
p-th percentile of the spectral energy (representing the baseline noise floor), and
is the Sigmoid activation function. The variables
a and
b are learnable hyperparameters controlling sensitivity.
Guided by the dynamic factor
, the adaptive masking widths in the time domain (
) and frequency domain (
) are determined by:
where
T and
F represent the total time steps and frequency bands, respectively.
The critical innovation lies in abandoning the rigid “zero-padding” operation, which severely disrupts the inherent global energy and statistical properties of the acoustic signal. Instead, we introduce a Non-zero Blending mechanism. For a selected masking region
, the original spectral features are replaced by a weighted blend of the original signal and the region’s mean energy
:
where
. This DSP-driven feature enhancement strategy prevents the gradient vanishing typically caused by traditional zero-padding, increases data diversity, and compels the downstream network to learn noise-invariant features when local components are obscured.
2.2. Multi-Layer Convolutional Feature Extraction
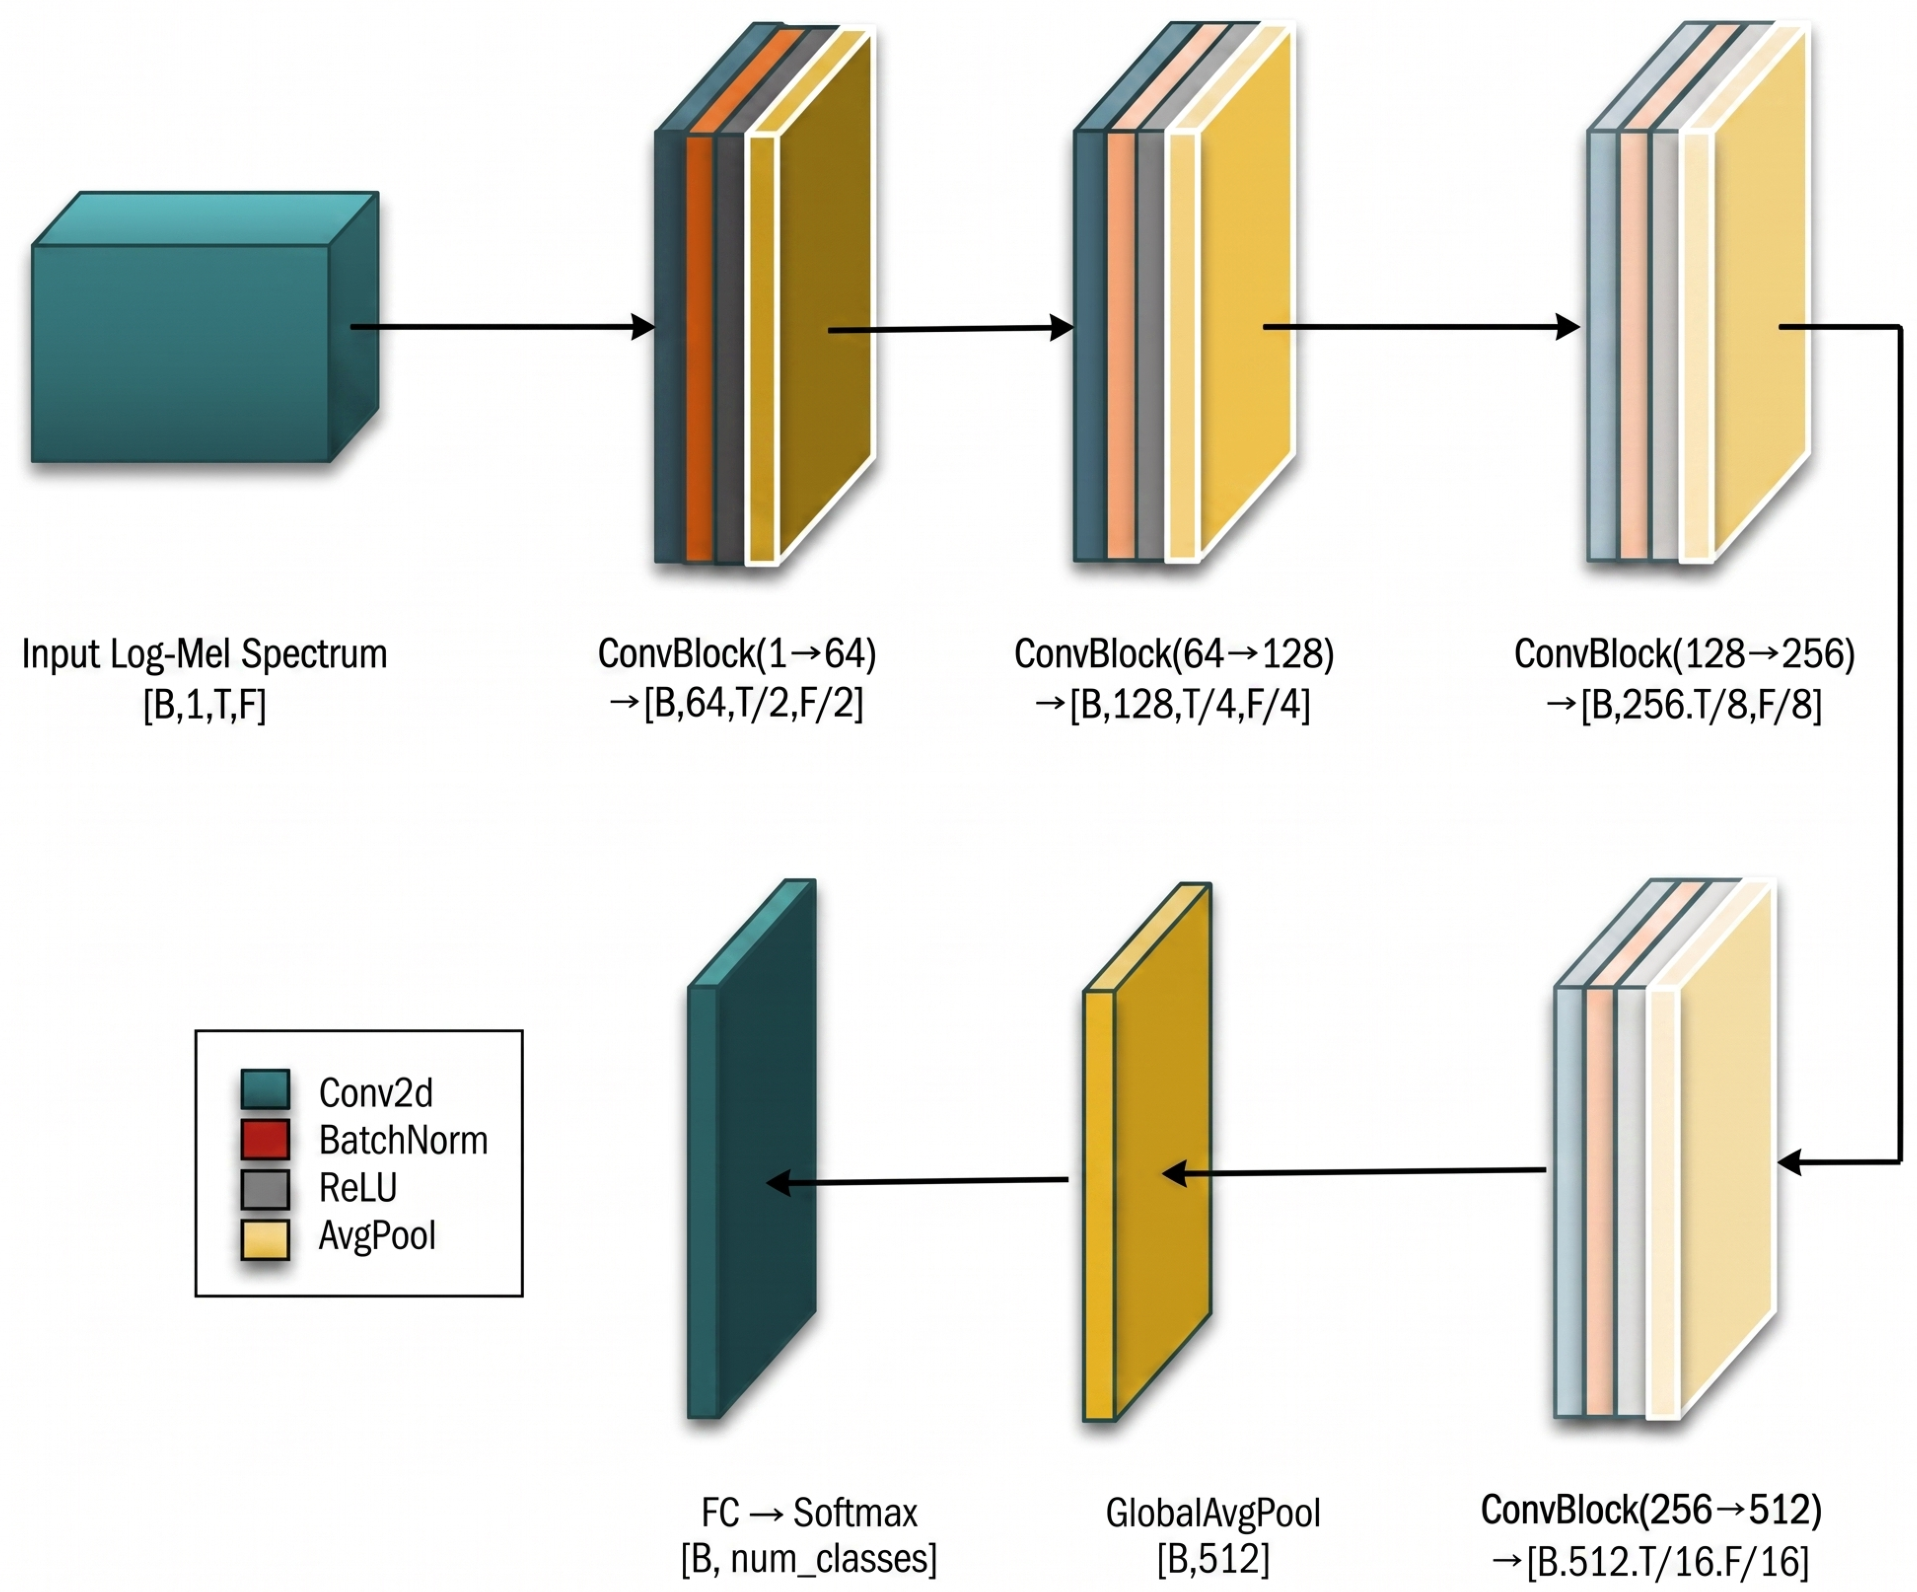
The features of bolt tapping signals exhibit high dispersion in the time–frequency domain, encompassing both “low-frequency slow variations” and “high-frequency transient impacts”. Because a single convolutional layer has a restricted receptive field, it struggles to simultaneously extract both of these typical loosening patterns. Therefore, the system incorporates a multi-layer convolutional feature extraction module consisting of four stacked ConvBlocks, detailed in
Figure 3.
Each ConvBlock adheres to an efficient local modeling substructure: Conv2d → BatchNorm → ReLU → Pooling. The feature extraction process at the
i-th layer can be formulated as:
Through layer-by-layer spatial and frequency downsampling, this bottom-up cascaded topology progressively filters out redundant environmental noise. Ultimately, it compresses the high-resolution input into a high-dimensional semantic feature map that possesses strong discriminative power for bolt states.
2.3. Transformer Global Modeling and Classification
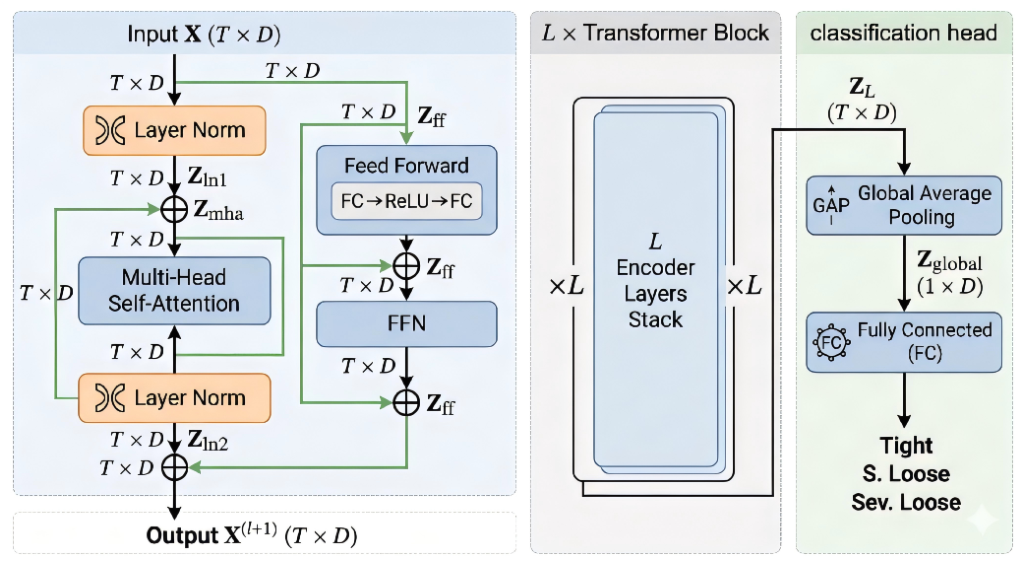
Although Convolutional Neural Networks (CNNs) excel at local texture modeling, their limited receptive fields hinder the capture of long-range dependencies across extended time spans. To overcome this bottleneck, the network seamlessly integrates a Transformer encoder, as structured in
Figure 4, on top of the CNN-extracted features.
First, a learnable linear projection layer adapts the high-dimensional local feature sequence into the hidden dimensional space of the Transformer:
where
. To ensure the model perceives the relative chronological order of different tapping responses, positional encodings (PE) are injected:
Subsequently, the sequence is fed into
L layers of a standard Transformer encoder. Its core relies on the Multi-Head Self-Attention (MSA) mechanism, which dynamically establishes global correlations between any two temporal positions within the same sequence:
Finally, Global Average Pooling is applied to the sequence output by the encoder to extract
, a global temporal feature vector representing the entire tapping cycle. Through a fully connected layer equipped with a Softmax activation function, the model outputs the categorical probability distribution of the bolt’s loosening states (e.g., tight, slightly loose, severely loose):
This architecture enables an effective integration of local time–frequency texture extraction and global structural dynamic modeling in complex acoustic scenarios.
3. Experimental Apparatus and Procedures
3.1. Experimental Apparatus and Methodology
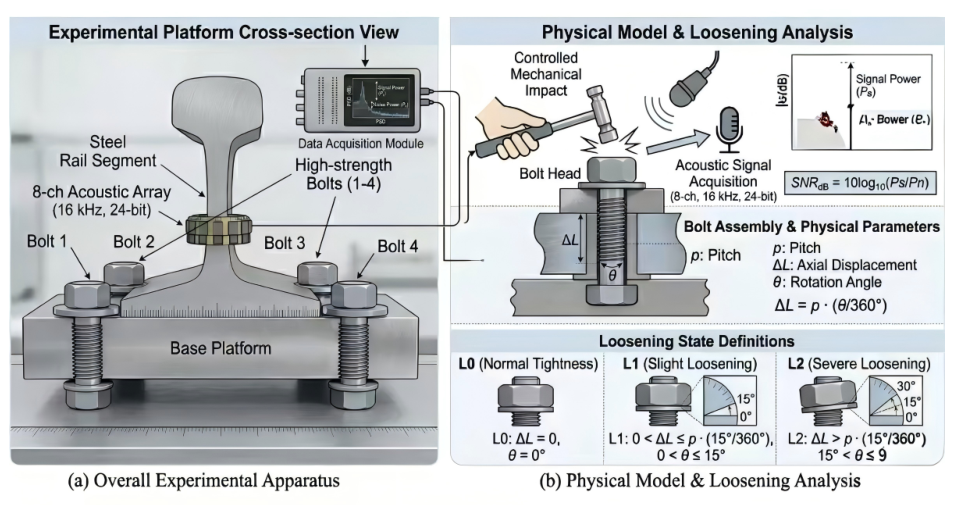
To systematically validate the performance of the proposed PCT-Net under conditions representative of complex industrial applications, a highly controlled acoustic non-destructive testing (NDT) platform was established. As shown in
Figure 5, the experimental framework includes both the hardware setup and the standardized acoustic excitation procedure. The test objects consisted of four representative types of standard high-strength bolts (denoted as bolt1 through bolt4). To ensure reproducible quantitative analysis, the condition of each bolt was strictly calibrated into three diagnostic levels: tight (L0), slight loosening (L1), and severe loosening (L2).
It is important to note that the dataset was intentionally designed to evaluate the model under rigorous boundary conditions that closely mirror the realities of the contemporary Chinese industrial environment. The four selected bolt types correspond to widely used specifications in critical domestic sectors, such as high-speed railway infrastructure, bridge construction, and heavy manufacturing, ensuring the dataset’s practical relevance. Moreover, instead of covering a broad spectrum of easily distinguishable degradation states, the dataset deliberately focuses on conditions with extremely subtle angular differences. Under the stringent safety regulations and high-frequency manual inspection protocols typical in Chinese industry, macroscopic or severe bolt loosening is seldom allowed to occur. As a result, early-stage, subtle loosening is the most common and critical fault state encountered by automated NDT systems in real-world engineering scenarios. As depicted in
Figure 5b, L1 corresponds to a rotation angle
ranging only from 0° to 15°. Distinguishing between these highly similar borderline states presents a significant challenge for acoustic feature extraction. Therefore, successful validation on this constrained yet inherently difficult dataset provides strong evidence of the robust decoupling ability and fine-grained representation capability of the proposed PCT-Net.
Acoustic excitation was generated through controlled mechanical impacts, as shown in
Figure 5. It should be noted that these impacts inherently involve slight natural variations in striking angle and force, which effectively serve as a form of physical data augmentation and help reduce the risk of model overfitting. The resulting transient vibration responses were recorded using a high-fidelity eight-channel microphone(Shenzhen Yunde IoT Technology Co., Ltd., Shenzhen, China) array. By employing a distributed multichannel array rather than a single sensor, the acquisition system captures acoustic radiation from multiple spatial positions. This configuration naturally incorporates variations in recording distance and sound reception angle, thereby enabling the dataset to better reflect the spatial acoustic diversity encountered in real industrial environments. To preserve broad-spectrum acoustic signatures and subtle structural modulation features, the data acquisition system operated at a fixed sampling rate of 16 kHz with a 16-bit quantization depth. During signal processing, particular emphasis was placed on the first 2000 sampling points of each recorded acoustic sequence, as these initial samples capture the critical transient impact response, namely the “initial shocks,” which contain the most discriminative acoustic fingerprints for structural condition assessment. The multichannel signals were then transmitted to the host computer for real-time time–frequency analysis.
3.2. Dataset Preparation and Hardware Configuration
To rigorously evaluate the generalization capability of the proposed model and prevent data leakage, a comprehensive acoustic dataset was systematically constructed. First, clean tapping signals were collected under controlled laboratory conditions. For each of the four bolt types, 400 acoustic samples were recorded for each diagnostic state (L0, L1, and L2), and each recording lasted 12 s. This carefully designed data acquisition process yielded a total of 4800 clean acoustic samples, providing a solid foundation for subsequent analysis.
To realistically simulate complex industrial acoustic interference, environmental noise from the MIMII dataset [
24] was artificially superimposed onto the clean recordings through programmatic mixing. Specifically, the clean transient signals were mixed with factory noise at six distinct signal-to-noise ratio (SNR) levels: −5 dB, 0 dB, 5 dB, 10 dB, 15 dB, and 20 dB. This noise augmentation strategy produced a robust dataset suitable for evaluating the model under a wide range of acoustic degradation conditions. The complete multi-SNR dataset was then divided into training, validation, and test sets according to a strict ratio of 7:1.5:1.5.
All deep learning experiments and model training procedures were conducted on an NVIDIA GeForce RTX 4060 GPU. The software environment was standardized using Python 3.9 and PyTorch 2.0, ensuring computational reproducibility, efficient tensor processing, and effective implementation of the Transformer-based attention mechanism. Network parameters were optimized using the Adam optimizer with a batch size of 32 and an initial learning rate of . The model was trained for 100 epochs on average.
3.3. Robustness Testing and Adaptability Analysis
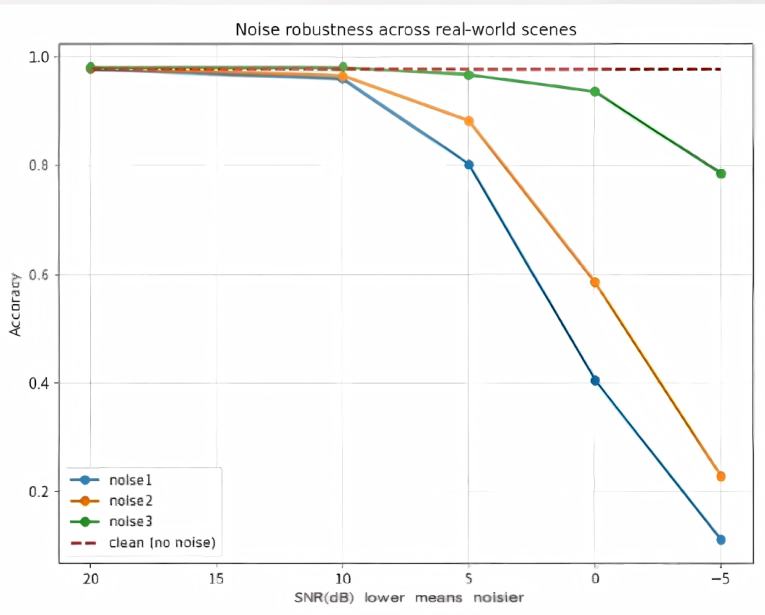
To systematically evaluate the anti-interference performance of PCT-Net in complex industrial environments, this paper incorporates three types of real noise scenarios (noise1, noise2, and noise3) [
24], disturbances caused by variations in sensor installation positions (e.g., different base spacers and fixation methods), and disturbances related to sampling angle and distance (such as close-distance recording and oblique microphone placement). These evaluations are designed to examine the adaptability of the model to diverse acoustic disturbances.
To evaluate the robustness of the model under noisy environments, three performance metrics are used:
- 1.
Signal-to-Noise Ratio (SNR):The intensity of added noise is controlled using the SNR, defined as:
where
denotes the power of the clean signal and
denotes the power of the noise.
- 2.
Accuracy (Acc): The recognition accuracy under a specified SNR is given by:
where
and
represent the number of correctly classified samples and total test samples, respectively.
- 3.
Noise-AUC: The Noise-AUC is defined as the integral of the Acc-SNR curve over the SNR interval [5 dB, 20 dB], reflecting the model’s average robustness across noise levels. A value closer to 1 indicates stronger robustness.
The results are presented in
Figure 6. The proposed model achieves an accuracy of 95.8% under standard conditions and maintains an average accuracy of 92.3% under complex interference scenarios, with the overall performance degradation controlled within 3.5%. In contrast, the traditional CNN model exhibits an average degradation of 8.6%, while the original PANNs model shows a degradation of 6.1%. These results demonstrate that the proposed method offers significantly stronger resistance to noise and interference compared with the baseline models.
Furthermore, as shown in
Table 1, under low-SNR conditions (SNR ≈ 10 dB), we further evaluate the robustness of the proposed model against noise interference. The robustness indicators (e.g., average adversarial disturbance amplitude) remain at a consistently low level under noise environments, and the model’s decision boundaries do not exhibit significant drift. This demonstrates that the proposed PANNs–CNN–Transformer fusion architecture provides stronger anti-interference capability in the spectral domain. In particular, the self-attention mechanism in the Transformer module enhances temporal feature perception, thereby effectively improving tolerance to non-stationary noise.
In conclusion, despite the limited nature of the test data, the experiments in this section have demonstrated the robust benefits of the model at different levels. The model has been demonstrated to work under complex acoustic environmental interference, indicating its potential for deployment in practical production scenarios. The experimental results validate the proposed structure’s practicality and provide a solid basis for the subsequent discrimination power tests and ablation analysis that will be carried out in the following sections.
4. Model Discriminative Power Experiment
This section evaluates the feature separability and representational capability of the model to verify its ability to distinguish fine-grained loosening states. Both quantitative indicators and visualization results are employed to validate the advantages of the proposed approach.
The primary metric used in the experiment is the Fisher-style separability, which measures the distinction between classes and the cohesion within each class for different loosening states. The core idea is that the separability of the feature space can be quantified by combining the inter-class distance and the intra-class dispersion. A higher separability ratio indicates clearer feature boundaries among loosening states, thereby facilitating more accurate model discrimination.
The key definitions are as follows:
- 1.
Class Center (): The average feature vector of all the samples for a particular loosening state.
- 2.
Within-Class Distance (
): The average Euclidean distance between samples of the same class and their class center, measuring within-class cohesion:
- 3.
Between-Class Distance (
): The average Euclidean distance between the centers of different classes, measuring class separation:
- 4.
Global Fisher-style Separability (
):
A larger indicates better “within-class concentration, between-class separation”.
- 5.
Per-Class Separability Metric (
): Refining the separation effect between a single class and the others:
where: C is the set of all classes and is the total number of classes; is the class center of class c, and is the class center of class d; denotes the i-th sample feature of class c, and is the number of samples in class c; represents the Euclidean distance. A larger value indicates a better separation effect between class c and the other classes, implying a lower misclassification rate.
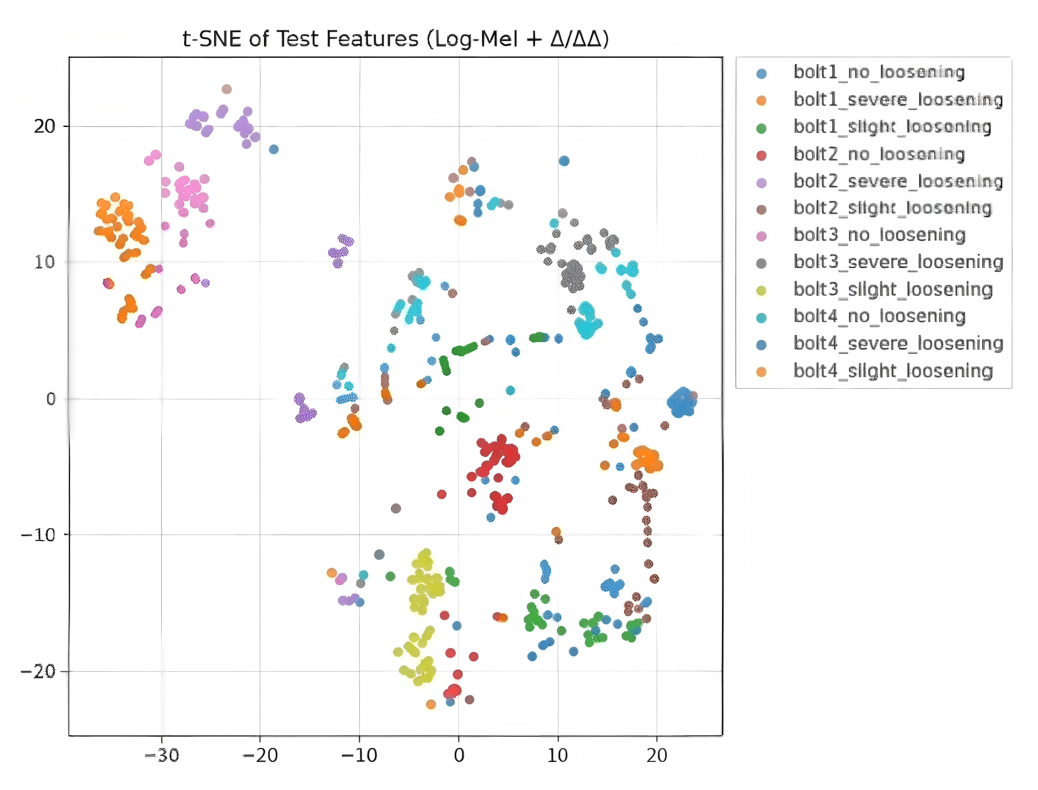
The experimental data covers 3 loosening states across 4 types of bolts, resulting in a total of 12 fine-grained categories. The input features consist of Log-Mel spectrograms combined with first-order and second-order differences, capturing both the static acoustic configuration and temporal variation characteristics, ensuring that the representations effectively reflect loosening-state differences.
Figure 7 presents the 2D t-SNE visualization results of the extracted features, providing an intuitive observation of feature separability:
- 1.
The severe loosening samples form a distinct cluster with clear boundaries.
- 2.
The feature clusters of slight loosening and no loosening are locally close, yet the inter-cluster distance under PCT-Net is noticeably larger than that of the comparison model ResNet18, indicating that PCT-Net is more sensitive to subtle acoustic differences and achieves better boundary discrimination.
To ensure the reliability of the t-SNE visualization and mitigate potential biases from parameter selection or stochastic initialization, we explicitly set the perplexity to 30. Furthermore, stability tests were conducted by repeating the dimensionality reduction process across five distinct random seeds (0, 42, 123, 2024, and 3407) using the init=’random’ configuration. The resulting embeddings exhibited high structural consistency in their overall category distributions. Quantitatively, the centroid-distance correlation between different runs remained above 0.996, and the Procrustes disparity was restricted to a narrow range of 0.008–0.017. These metrics confirm that the observed clustering patterns are stable representations of the high-dimensional feature space rather than stochastic artifacts. It should be noted that while t-SNE provides a qualitative auxiliary view of feature separation, the primary evaluation of PCT-Net’s performance relies on the quantitative metrics, such as classification accuracy and confusion matrices, presented in the subsequent sections.
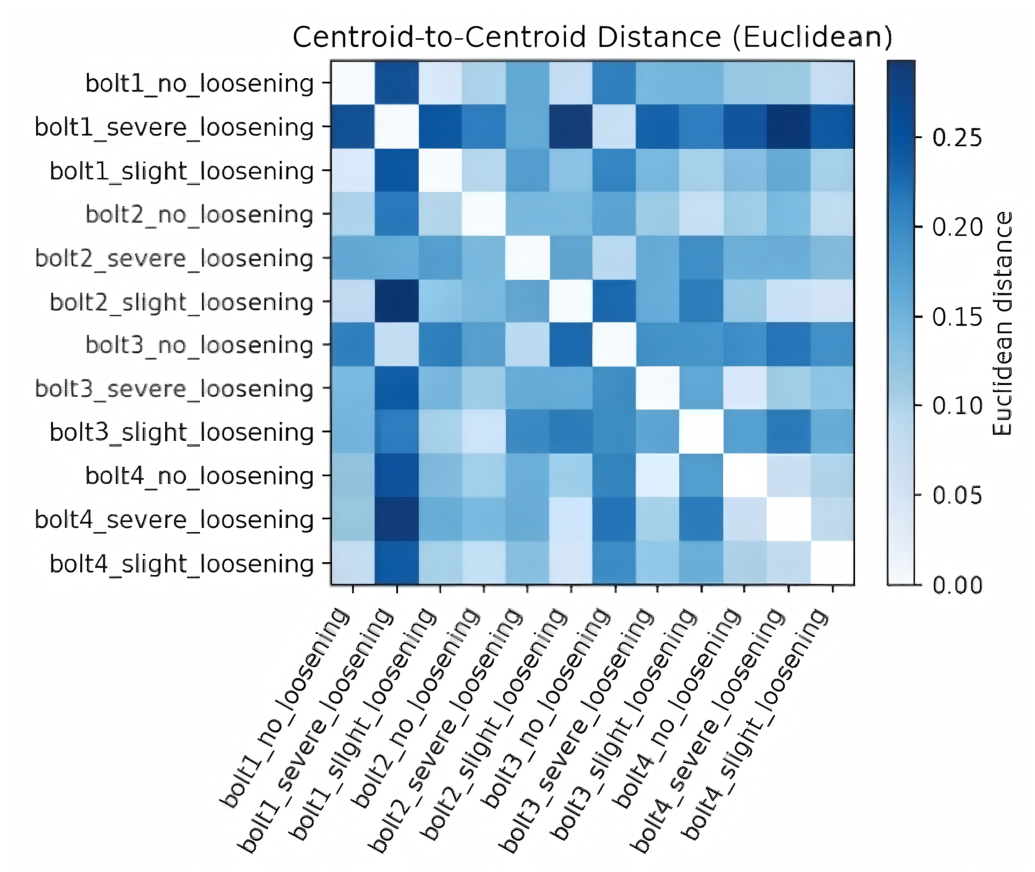
Figure 8 is the Euclidean distance heatmap of the class centers. Darker areas are concentrated between “severe loosening” and the other two categories, while lighter areas correspond to “slight loosening” and “no loosening.” This confirms that the blurry boundaries between these two categories are the main source of confusion, which is consistent with the results from the global Fisher-style separability calculation. From the quantitative comparison of feature separability in
Table 2, it can be observed that PCT-Net, with its fusion architecture of “PANNs perceptual feature fronted + CNN local modeling + Transformer global attention”, effectively enhances the separability of bolt loosening state features.
Specifically, in the fine-grained categories, PCT-Net exhibits a larger inter-cluster distance and stronger intra-class cohesion, indicating improved feature concentration and separation. The global Fisher-style separability reaches 1.546, providing a robust foundation for the reliable recognition of subtle bolt loosening states under real-world conditions.
It is worth noting that although ResNet18 achieves a relatively high accuracy of 96.16% and maintains a latency of 2.49 ms, it performs worse than PCT-Net in fine-grained category recognition due to the lack of an explicit temporal modeling mechanism. The pure CNN model, with an extremely small parameter size of 0.024 M and a very low latency of 0.42 ms, shows deployment advantages in extreme edge scenarios. However, its test accuracy is only 82.34%, and its noise resistance remains weak, making it unsuitable for high-reliability industrial applications.
On the other hand, the pure Transformer model performs the worst across all metrics. Although its FLOPs are only 0.172 G, the test accuracy reaches merely 41.65%, approaching random classification. This indicates its lack of ability to model local acoustic structures and its poor adaptability to the bolt-loosening detection task when lacking a convolutional frontend.
To further clarify why the proposed PCT-Net significantly outperforms the comparative methods, it is necessary to examine the underlying differences in their feature extraction mechanisms. First, compared with pure convolutional architectures, PCT-Net overcomes the inherent limitation of localized receptive fields. Although pure CNNs are effective at capturing local high-frequency transient impacts, they are less capable of modeling the macro-level energy decay trend across the entire acoustic sequence. PCT-Net addresses this limitation by introducing a Transformer module to capture long-range global temporal dependencies. Second, compared with the pure Transformer baseline, which shows limited performance on complex acoustic inputs, PCT-Net alleviates the problem of feature fragmentation. Transformers generally lack the spatial inductive bias required to efficiently extract fine-grained time–frequency textures directly from raw inputs. By employing CNNs as an intermediate local feature extractor, PCT-Net enables the Transformer to operate on semantically enriched tokens rather than noisy raw spectrogram patches. Third, compared with recurrent models such as CNN-BiLSTM, the self-attention mechanism in PCT-Net provides a more direct and less attenuated path for information propagation across long acoustic sequences, thereby mitigating the memory loss and gradient attenuation commonly associated with LSTM-based structures. Finally, unlike models that learn temporal-spectral features entirely from scratch, the PANNs frontend provides PCT-Net with an acoustically meaningful representation prior, giving it a clear advantage in extracting robust features under low-SNR conditions.
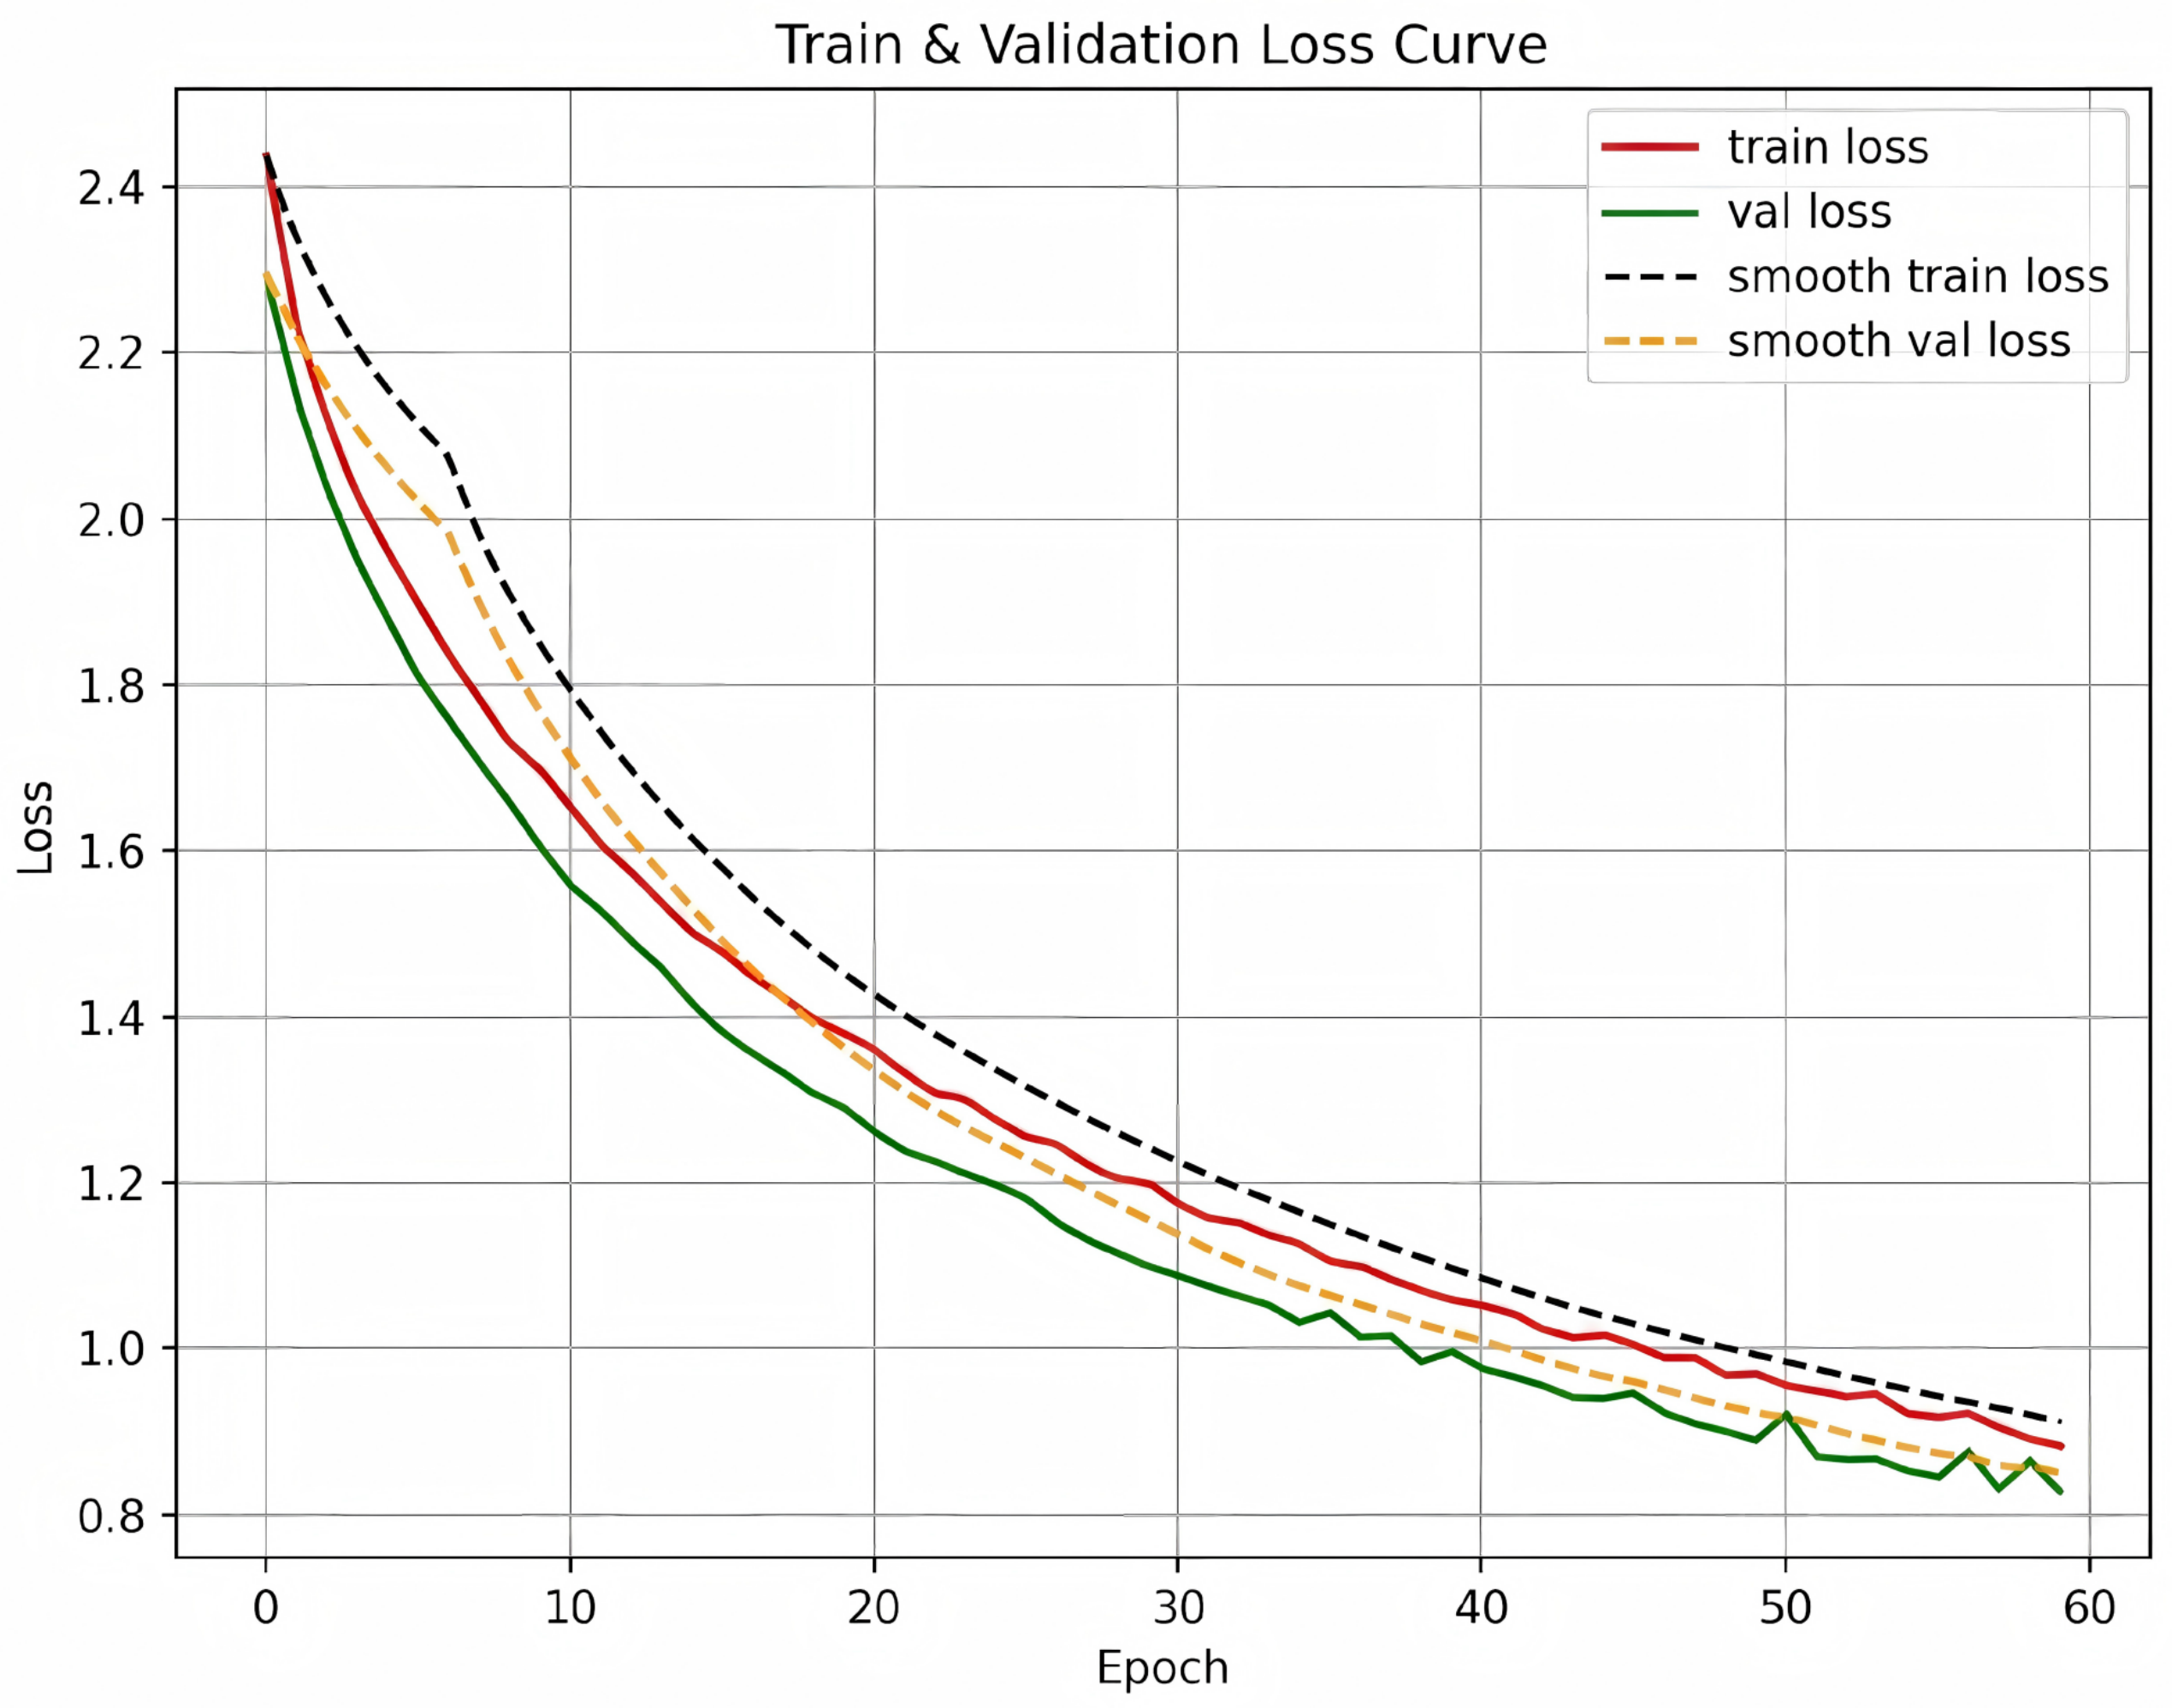
During the training process, the loss convergence curve of the model is shown in
Figure 9. According to the
metric, PCT-Net reaches 95% of its peak validation performance within only 4 epochs, indicating a favorable training pattern characterized by rapid convergence and early stabilization. Furthermore, the gap between the training loss and validation loss remains below 0.05, suggesting stable convergence behavior and strong resistance to overfitting. Overall, the results demonstrate that PCT-Net achieves a good balance among accuracy, efficiency, and stability for the current task. The significant improvement in accuracy (97.12%), together with enhanced robustness and stability, justifies its parameter size (8.112 M) and computational cost (8.222 G FLOPs). Although these computational requirements are slightly higher than those of ultra-lightweight models, they remain lower than those of standard deep networks such as ResNet18 (11.176 M parameters). This favorable trade-off among high accuracy, fast inference speed (2.45 ms), and strong anti-interference capability indicates that PCT-Net is well suited for bolt loosening detection systems and has promising potential for industrial applications.The detailed parameters of the model are listed in
Table 2 and
Table 3.
5. Ablation Study
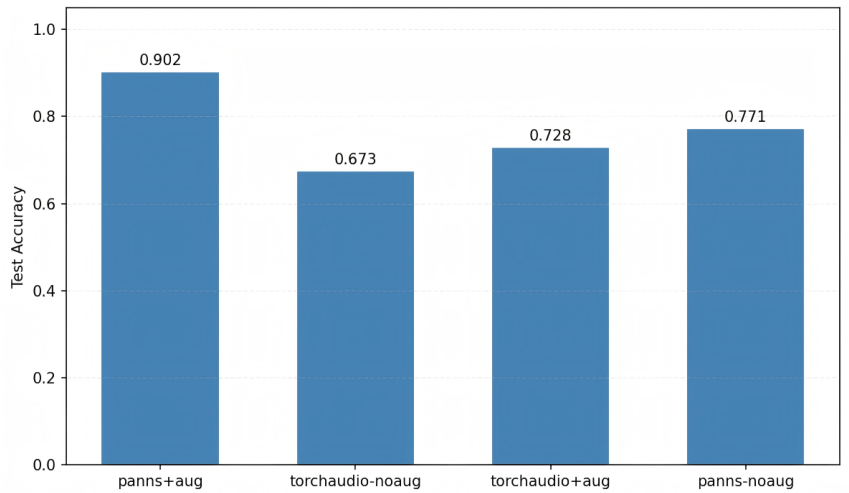
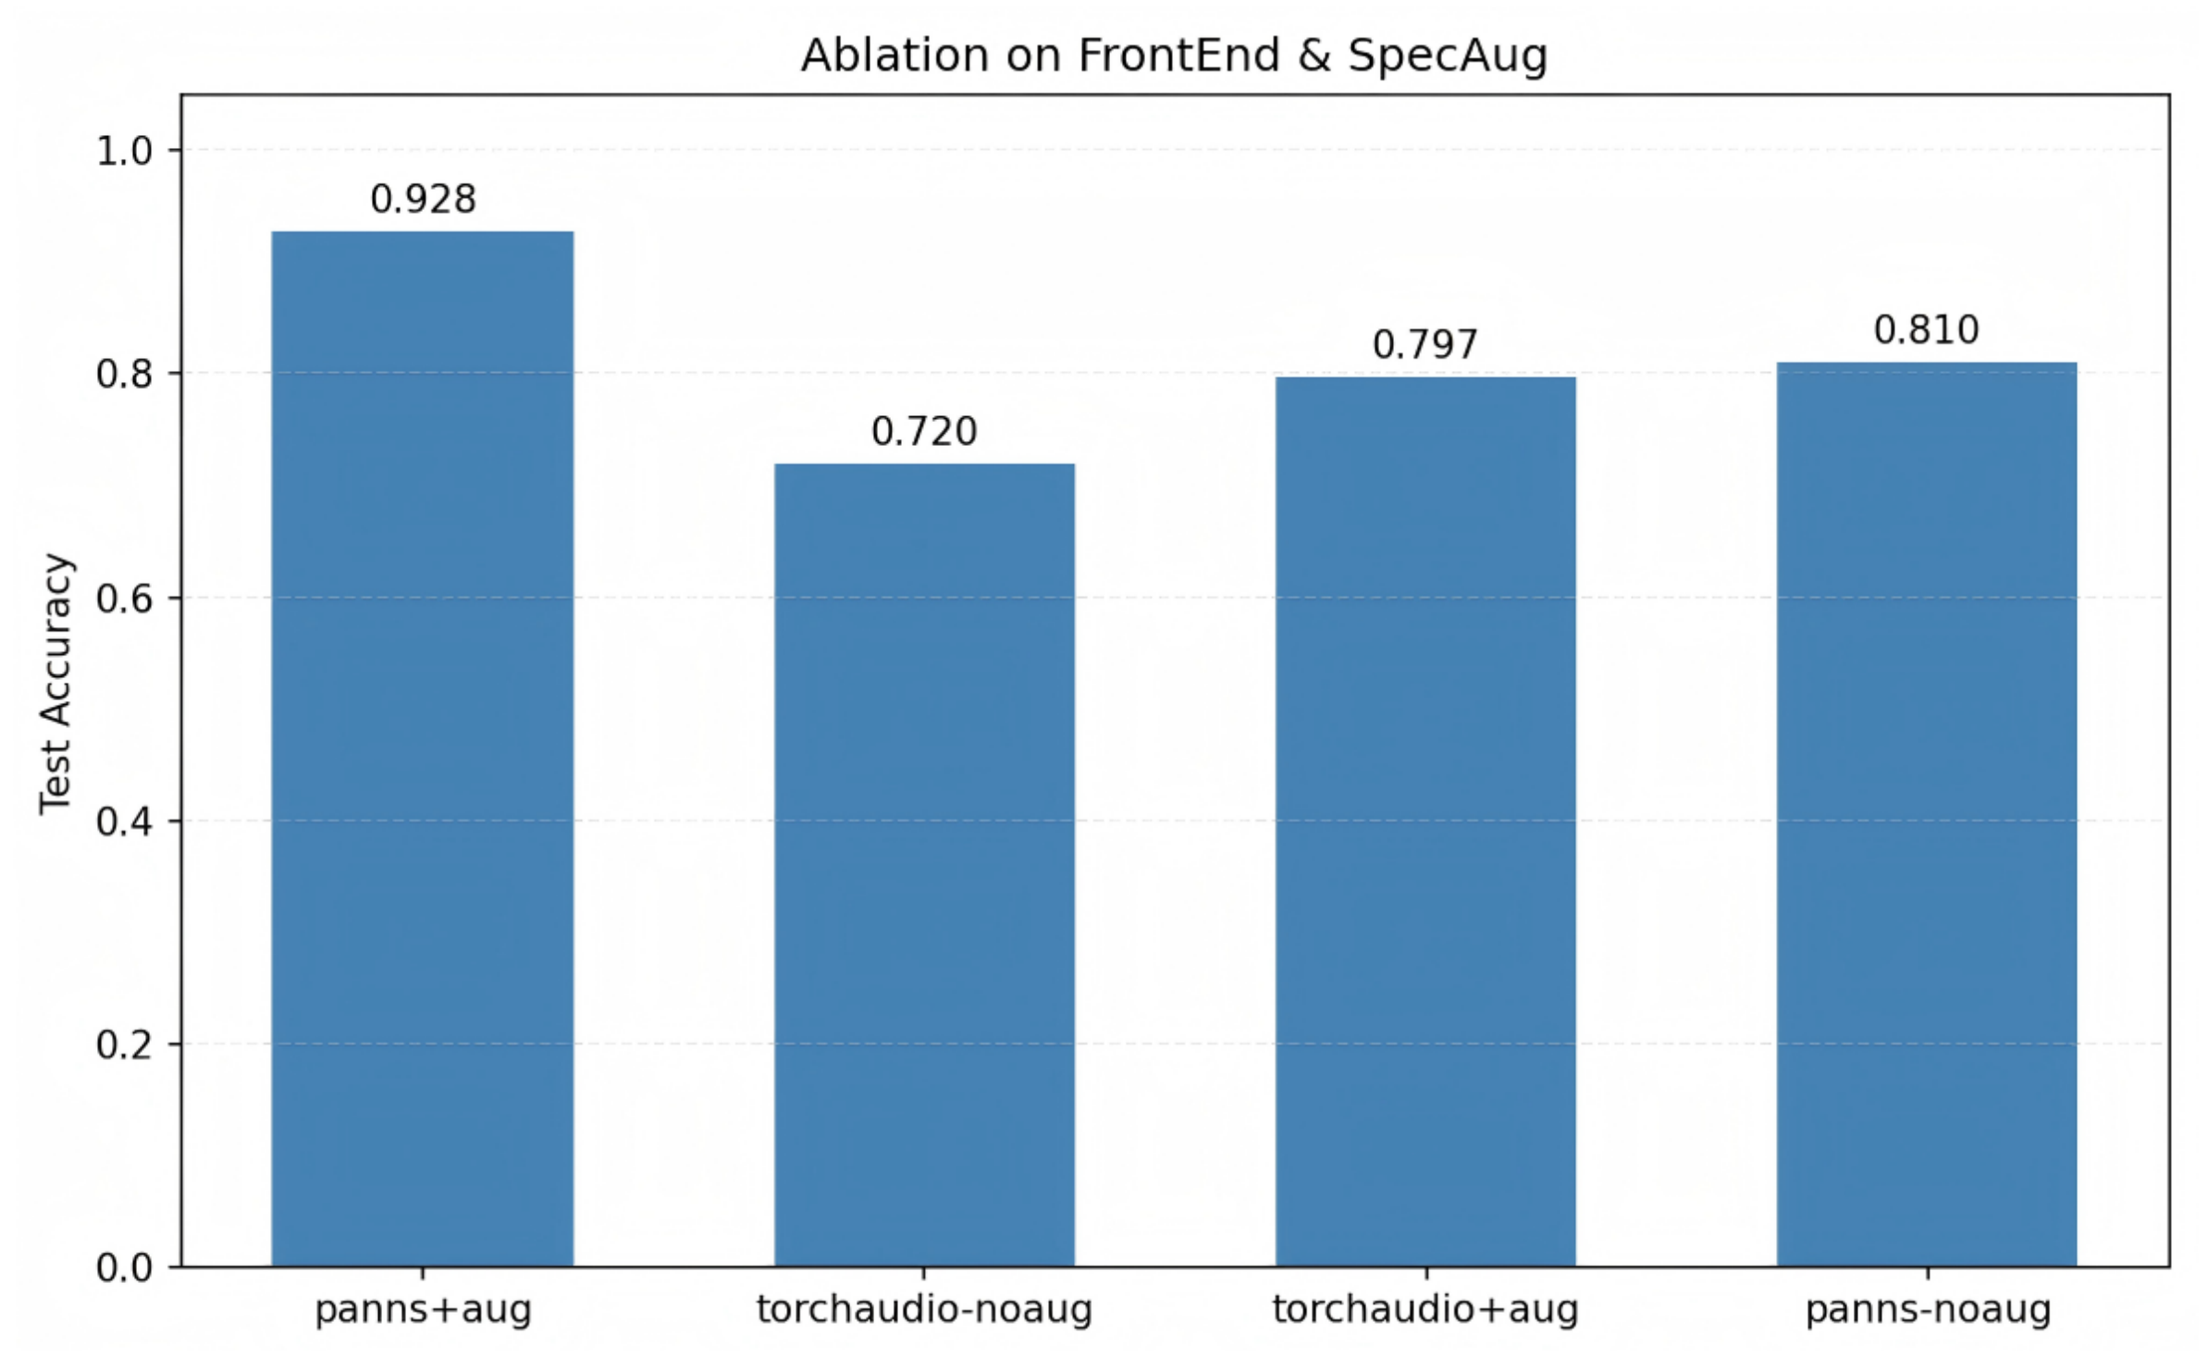
To evaluate the actual impact of the proposed frontend feature extraction module and data augmentation mechanism on model performance, an ablation study based on a two-factor interaction design was conducted. Four model combinations were constructed to quantify and analyze their independent and synergistic contributions. Under consistent training settings, backend architecture, and data input, only the frontend feature extraction module and the use of data augmentation were varied.
Specifically, the baseline model employs the default torchaudio acoustic frontend with data augmentation disabled. Its performance, without any optimization, serves as the lower bound for subsequent improvement strategies. The other three configurations include: (1) the torchaudio frontend with SpecAugment enabled, (2) the PANNs frontend without augmentation, and (3) the proposed PCT-Net combining both components.
The experiments were conducted using clean data and two noisy environments (SNR = 15 dB and SNR = 10 dB) to validate the robustness of the models under complex acoustic conditions.
As illustrated in
Figure 10 and
Figure 11, the proposed model (PANNs + SpecAugment) achieves the highest accuracy of 97.6% on the original clean test set. This corresponds to an improvement of 20.6 percentage points over the baseline model, highlighting the clear advantage of this combination under data-complete conditions. Moreover, under noisy environments with SNRs of 15 dB and 10 dB, the proposed configuration still improves the accuracy by 20.8 and 22.9 percentage points, respectively. Introducing the PANNs frontend alone yields an average accuracy gain of 13.1 percentage points, whereas incorporating SpecAugment alone results in an improvement of 12.8 percentage points. These results demonstrate that both the frontend enhancement and the data augmentation strategy make substantial contributions to improving feature quality and enhancing the generalization capability of the model.
A further comparison of the robustness variations among different combinations under noise interference reveals that upgrading only the frontend significantly reduces the misclassification rate in low-SNR environments. This indicates that the Mel perceptual scale and logarithmic compression mechanisms enhance the stability of time–frequency structures under low signal-to-noise ratios. Meanwhile, the model’s increased tolerance to information loss under mild interference is primarily driven by the data augmentation strategy. Across all tested conditions, the combined configuration consistently achieves the best performance. Therefore, both the advanced frontend and the augmentation strategy should be regarded as essential configurations for real-world deployment.
In conclusion, the frontend feature extraction module constructs more stable and semantically separable feature representations, providing a superior input space structure for the network. Simultaneously, the data augmentation method strengthens the model’s ability to resist disturbances caused by local feature occlusion and uncertainty. Both components are vital for maximizing the model’s performance ceiling and ensuring its robustness against severe interference during engineering deployment. These findings further validate the practical application potential of the proposed structural design in recognizing acoustic vibration signals.
Furthermore, to further clarify the functional necessity of the overall PCT-Net architecture, it is important to analyze the respective physical and algorithmic roles of its core components, including the frontend, the adaptive masking mechanism, and the CNN–Transformer backbone. First, as supported by the performance results above, the PANNs frontend provides a robust pre-trained acoustic representation prior, enabling the model to transfer generalized auditory knowledge to the industrial scenario, thereby alleviating overfitting and accelerating feature convergence. Second, the adaptive spectral masking module serves as an important mechanism for improving robustness against out-of-distribution (OOD) interference. It adaptively suppresses non-stationary background noise while preserving subtle transient signatures associated with early-stage bolt loosening. Third, within the backend architecture, the convolutional modules are mainly responsible for capturing fine-grained local transient patterns, particularly the high-frequency impact-related components contained in the initial stage of acoustic excitation. Finally, the Transformer modules complement the CNN by modeling global temporal dependencies and the overall energy decay trend throughout the tapping process, thereby characterizing the broader structural damping behavior. In summary, the coordinated “decoupling-modeling” framework formed by these components provides an effective pipeline for precise acoustic recognition in complex environments. Moreover, the advantage of combining CNN and Transformer modules, rather than using either in isolation, is also supported by the comparative results presented in our baseline experiments.
6. Conclusions
The article is about the acoustic intelligent recognition of bolt loosening states, which constructs the complete technical process of “preprocessing–time-frequency representation–end-to-end modeling–multi-dimensional evaluation”. In view of the industrial environment with the low SNR of the signal and fuzzy class boundary, this paper proposes the PCT-Net model with frontend feature extraction transfer, convolutional local modeling and Transformer global perception. The three states of “no loosening, slight loosening and severe loosening” are correctly classified. In normal noise conditions, the model achieves a recognition accuracy of 97.12%, which is significantly better than other acoustic models.
The contributions of this article are twofold. It first proposes a spectral masking enhancement scheme whereby interference conditions are simulated during training, thus contributing to a more robust and enhanced generalisation performance. The other contribution is a feature extractor design that combines local convolution and global attention. Doing this allows for better identification of slight variations in bolt tapping sounds, as well as enhancing category boundary discrimination ability. Experiments demonstrate that the method is robust and accurate on various tasks, especially for borderline samples such as slight loosening.
While the current study demonstrates the effectiveness of PCT-Net on widely used industrial bolts under highly subtle state variations, the diversity of the dataset remains limited by the current experimental setup. Future work will focus on expanding the dataset to include a broader range of bolt specifications and more complex multi-state loosening scenarios. In addition, although the current high-strength steel support structures are representative of a large proportion of China’s railway infrastructure, variations in base material properties, such as the use of composite sleepers or damping pads in modern track systems, pose a significant challenge for ultra-precise detection. These materials may introduce stronger acoustic damping and anisotropic wave propagation effects. Nevertheless, the data-driven framework of PCT-Net, particularly its adaptive spectral masking mechanism, provides a flexible foundation for addressing such variability. Future research will further investigate domain adaptation strategies to recalibrate the model under different material damping characteristics, thereby improving its robustness and recognition accuracy across diverse and complex railway environments.
Despite the promising performance of PCT-Net in acoustic bolt loosening detection, several limitations should be acknowledged to guide future research. First, regarding sample diversity, the current dataset, although extensive, was primarily collected in a controlled laboratory environment and may not fully capture the extreme variability of real-world railway conditions, such as high-speed train pass-by noise or complex meteorological interference. Second, the generalization of the model to other industrial scenarios—such as varying bolt sizes, different base materials, or variable tightening torques—requires further in situ empirical validation. Third, as with many deep learning-based frameworks, model interpretability remains a challenge; explicitly visualizing the specific acoustic features emphasized by the Transformer could help bridge the gap between AI predictions and underlying structural dynamics. Regarding practical application scenarios, the current PCT-Net is most suitable for periodic maintenance inspections using robotic arms or portable tapping devices in relatively stable ambient environments, rather than for continuous real-time monitoring under extreme dynamic loads. Future work will focus on collecting more diverse field data, exploring explainable techniques, and extending the model toward broader fastener health monitoring systems.




 ,
,