Article

Weak-Cue Mixed Similarity Matrix and Boundary Expansion Clustering for Multi-Target Multi-Camera Tracking Systems in Highway Scenarios

1
College of Computer Science and Technology, Zhejiang University of Technology, Hangzhou 310023, China
2
Hubei Key Laboratory of Intelligent Vision Based Monitoring for Hydroelectric Engineering, The College of Computer and Information, China Three Gorges University, Yichang 443002, China
3
Tianjin Huaxin Huiyue Technology Co., Ltd., Tianjin 300450, China
4
School of Computer Science, University of Nottingham Ningbo, Ningbo 315100, China
5
Key Laboratory of Intelligent Informatics for Safety & Emergency of Zhejiang Province, Wenzhou University, Wenzhou 325035, China
6
School of Electronic and Information Engineering, Anhui Jianzhu University, Hefei 230601, China
*
Author to whom correspondence should be addressed.
Electronics 2025, 14(9), 1896; https://doi.org/10.3390/electronics14091896
Submission received: 2 April 2025 / Revised: 28 April 2025 / Accepted: 6 May 2025 / Published: 7 May 2025
(This article belongs to the Special Issue Deep Learning-Based Scene Text Detection)

Abstract

:
In highway scenarios, factors such as high-speed vehicle movement, lighting conditions, and positional changes significantly affect the quality of trajectories in multi-object tracking. This, in turn, impacts the trajectory clustering process within the multi-target multi-camera tracking (MTMCT) system. To address this challenge, we present the weak-cue mixed similarity matrix and boundary expansion clustering (WCBE) MTMCT system. First, the weak-cue mixed similarity matrix (WCMSM) enhances the original trajectory features by incorporating weak cues. Then, considering the practical scene and incorporating richer information, the boundary expansion clustering (BEC) algorithm improves trajectory clustering performance by taking the distribution of trajectory observation points into account. Finally, to validate the effectiveness of our proposed method, we conduct experiments on both the Highway Surveillance Traffic (HST) dataset developed by our team and the public CityFlow dataset. The results demonstrate promising outcomes, validating the efficacy of our approach.

1. Introduction

Multi-target multi-camera tracking (MTMCT) systems, an essential component of intelligent transportation systems, aim to match vehicles across multiple cameras and generate global trajectories. Our system follows the same underlying concept as that in [1], where the tracking object is the person. The MTMCT process involves several key steps. First, vehicle detection is performed to extract vehicles from camera footage. Second, vehicle re-identification (ReID) is utilized to extract the ReID features of the detected vehicles. Subsequently, trajectories are generated within each camera based on vehicle detection and the ReID features. Finally, vehicle trajectories from different cameras are clustered to obtain global trajectories and produce the final result. The clustering of trajectories to generate global trajectories is a critical step, playing a pivotal role in the MTMCT system’s outstanding performance.
Researchers have focused on this topic for a long time. Qian et al. [2] introduced ELECTRICITY to automatically localize stalled vehicles and collisions using the existing traffic camera infrastructure. Nguyen et al. [3] presented an MTMCT method that establishes features in the form of a graph and designs graph similarity to match the vehicles from different cameras. Despite the proposal of some excellent works, the application of MTMCT systems to highway scenarios still faces the following challenges:
  • Low-quality trajectory features: In MTMCT systems, the trajectories are represented as a collection of ReID features that capture vehicles’ movements during a specific period. However, the quality of the trajectory features can be poor due to factors such as the high-speed movement of vehicles in highway environments and the dim lighting conditions in tunnels.
  • Low-performance trajectory clustering: When clustering vehicle trajectories, clustering algorithms are commonly used to match trajectories across different cameras. However, the observed trajectories of vehicles can be influenced by multiple factors, such as camera perspectives and traffic conditions, when vehicles pass through different cameras.
To prevent MTMCT systems from suffering from an information distribution gap between different cameras, most studies focus on feature representation. The appearance-aware method [4,5] utilizes additional information about targets, including occlusion and orientation. Fine-grained cues [6,7] are extracted during feature learning for video ReID. Moreover, nonvisual cues [8], such as learnable embeddings, reduce information biases caused by camera variations. Inspired by these studies, we design the weak-cue mixed similarity matrix (WCMSM), which is utilized to enhance the representation of trajectories by incorporating the detection results as weak cues, as shown in Figure 1. Furthermore, we propose the boundary expansion clustering (BEC) algorithm to strengthen trajectory clustering performance by considering the context of scene information. The weak-cue mixed similarity matrix and boundary expansion clustering algorithm are combined to create the WCBE MTMCT system, which focuses on improving the key step of MTMCT trajectory processing. In addition, to address the lack of MTMCT datasets for highway scenarios, we collected data from a highway in Zhejiang Province, China, and curated the Highway Surveillance Traffic (HST) dataset.
The contributions of this work are summarized as follows:
  • The WCBE MTMCT system, which combines the WCMSM and BEC, is developed to address the impact of various characteristics of high-speed highway scenes on the most critical step of trajectory aggregation in an MTMCT system.
  • The WCMSM module introduces weak cues during trajectory aggregation, enhances the discriminability of the similarity matrix for trajectories, and improves the effectiveness of subsequent clustering.
  • The BEC algorithm is a clustering algorithm that is more suitable for the characteristics of the high-speed highway scenes we have studied, thereby enhancing the performance of our MTMCT system.
  • The Highway Surveillance Traffic (HST) dataset validates the research on multi-target multi-camera tracking in highway scenarios. The dataset comprises videos from six different cameras, with a total duration of 182 min. These videos were primarily captured in highway tunnel scenes.

2. Related Works

2.1. Weak Cues

In the field of target tracking, the matching and association process is of great significance. In multi-target tracking, it is essential to associate and match the detected targets with the existing tracking trajectories. In multi-target multi-camera tracking, it is further necessary to associate the trajectories from different cameras to form global trajectories. For example, in the early spatial-based matching method in [9], the Kalman filter [10] was utilized to predict the positions of trajectories and perform the subsequent association of detection boxes. The authors of [11] adopted a heuristic matching method that uses spatial information to match the tracklets with the detection boxes. This kind of spatial-based matching was proposed relatively early and has been widely used. However, it also has some drawbacks. For instance, when the targets are severely occluded, their spatial information changes significantly. When the targets move nonlinearly, rapidly, and irregularly, the motion trajectories are difficult to predict using a simple linear model. Furthermore, there exist several graph-based learnable matching approaches. These methods convert the association task into an edge classification task and employ graph neural networks to make the data association step differentiable. For instance, GMTracker [12] and the method in [13] utilize graph models to connect short tracklets offline. Nevertheless, these methods have drawbacks. Specifically, the training and inference processes are complex and are often performed offline, which restricts their application in online tracking scenarios with high real-time requirements such as autonomous driving. In addition, there are methods that match and associate based on appearance. Appearance information has relatively stable consistency throughout a video, which is beneficial for long-term association. With the development of re-identification technology, the ReID model has also been used to extract appearance features for association. Moreover, with the development of detectors, the quality of appearance features is becoming increasingly higher.
To address more complex traffic conditions, such as mixed-modal participants (where heterogeneous traffic flows, including pedestrians and non-motorized vehicles, coexist with significantly divergent behavioral patterns) and environmental uncertainties (e.g., rainy conditions or low visibility), researchers have proposed more sophisticated association and matching methodologies. Yang et al. [14] proposed an online-learned non-linear motion map for constructing non-linear motion, which was utilized for trajectory tracking and association. Alexandre et al. [15], inspired by LSTM, proposed an approach to address both of the aforementioned challenges through a novel data-driven architecture for predicting human trajectories in crowded spaces. Chen et al. [16] proposed tailored data augmentation strategies, including SVA and DVA. SVA is used to backtrack and predict the pedestrian’s trajectory of tail classes, and DVA is used to change the background of the scene.
Most high-performance MOT methods, such as ByteTrack [17] and JDE [18], rely on appearance features and spatial information for target association. These highly discriminative and powerful features are referred to as strong cues. However, in OcSort [19], a distinct feature called velocity direction is used instead of the traditional strong cues. Subsequently, in Hybrid Sort [20], this feature, which differs from strong cues, is referred to as a weak cue. Additionally, it has also been suggested that the confidence state and height state, among others, could also be utilized as weak cues for target association. DST [21] uses two feature extraction networks to make the model into two branches to obtain the weak features suitable for tracking. The authors of [22] addressed the issue of semantic relational object tracking based on probabilistic reasoning and weak object anchoring. Motivated by this, we propose the WCMSM in this paper to expand the concept of weak cues beyond target association and apply it to trajectory association. By incorporating weak cues into our MTMCT system, we significantly improve its performance and achieve remarkable enhancements.

2.2. Trajectory Clustering

Trajectory clustering is an important step in MTMCT systems that clusters trajectories across cameras. However, cross-camera aggregation also implies crossing regions, time, and angles, making this step highly challenging. A common approach is to utilize clustering algorithms and devise strategies to overcome the challenges arising from crossing regions, time, angles, and other factors. However, as MTMCT scenarios become increasingly complex, a growing number of trajectory clustering methods have been proposed, which can mainly be categorized into the following four types:
Region-Based Clustering: These methods rely on predefined spatial regions (e.g., camera zones or traffic areas) to filter or link trajectories. In [23], the regions were manually divided, and the SCAC clustering algorithm was used for clustering between cameras. Although this method topped the competition, its trajectory clustering technique faces challenges. It strongly depends on traffic rules and scene structures. The region-based screening process may misfilter valid trajectories or not exclude invalid ones in complex scenarios. Also, it has high computational complexity. In box-level distance matrix construction and optimization, calculations and multiple operations are needed. Large-scale or multi-camera data incur high computational costs. In [24], the TCLM was proposed to obtain spatial and temporal information for better clustering performance. However, this method, similar to that in [23], has limited adaptability to complex traffic scenes. The Trajectory-based Camera Linkage Model (TCLM) relies on accurate regional division to describe trajectories and establish connections between cameras, and the metadata-assisted ReID also requires precise metadata information, such as vehicle type, brand, and color. However, the actual scene is changeable and unpredictable, and it is impossible for us to prepare all the information required by the method for every scene. In TAG [25], a matching mechanism based on zone-gate and time decay is employed to assist clustering based on the region division.
Data Distribution-Driven Clustering: These methods enhance clustering by modeling the data distribution or statistical properties. SSCME [26] leverages the data distribution to compute conceptual deviations, thereby enhancing the traditional clustering method. AAM [27] is a useful method for extracting traffic information based on varying levels of accuracy in multi-camera tracking.
Graph Structure-Based Clustering: These methods model trajectories as graph nodes/edges to capture spatial relationships. Park et al. [28] proposed an efficient two-stage clustering method by effectively capturing the spatial and structural relationships in graphical images. Matcher [29] utilizes a novel box-grained matching module to aggregate trajectories.
Anchor-Guided Clustering: These methods use anchors to guide clustering, reducing manual intervention. The authors of [30] presented UWIPL, a robust anchor-guided clustering method for tracking and re-identification in MTMCT.
In this paper, we introduce the boundary expansion clustering (BEC) algorithm for trajectory clustering. BEC incorporates scene boundary information within the context of trajectory clustering and utilizes corresponding algorithms based on our research on the HST dataset.

2.3. MTMCT Systems

An MTMCT system is complex, and each module needs improvement when addressing different tasks. In ELECTRICITY [2], an anomaly detection method is employed to automatically localize stalled vehicles and collisions using the existing traffic camera infrastructure. TIMS [27] pushes the multi-camera re-identification (ReID) workflow toward network-wide traffic information extraction. The TIMS system integrates a customized vision-based vehicle ReID (TIM-ReID) method using metric learning and establishes a traffic-informed workflow. This method faces challenges with association, especially in spatiotemporal information. For example, when calculating travel times based on the road length and speed limit, it ignores traffic accidents or detours, resulting in deviations and affecting vehicle matching. At complex intersections or with traffic control, the system may misjudge vehicle directions. In camera network and graph inference, StCGIM depends on factors related to camera loop configurations. But, in reality, camera installation errors can affect the matching accuracy of vehicle positions. Boe [31] proposed enhancements of the trajectory prediction and multi-level association methods on top of the tracking-by-detection paradigm for the single-camera multi-object tracking module of Track 1 in AI City Challenge 2022 [32]. NCCU [33] focuses on optimizing the matching of vehicle image features and geometrical factors, such as trajectory continuity, vehicle moving directions, and travel duration across different camera views. The MTMCT system proposed for NCCU has flaws in the association step. Although it considers features, trajectory continuity, driving direction, and travel time for data association, these factors may have uncertainties and errors in practice. The calculation of travel times depends on camera calibration and synchronization. Image features can be affected by light changes, occlusions, and viewing angle differences, increasing the feature differences between similar vehicles. It has been suggested that the different modules of MTMCT systems should be improved to overcome the specific challenges encountered in different MTMCT systems. Evidently, the association module in an MTMCT system often encounters issues that are difficult to resolve. This paper emphasizes that the last and most critical step in an MTMCT system, i.e., cross-camera trajectory association, has the greatest impact on the overall performance of the system. Therefore, this paper proposes the WCBE MTMCT system, which uses a more informative similarity matrix (WCMSM) to enhance trajectory clustering in multi-object tracking across highway scenarios and a clustering algorithm (BEC) that incorporates the characteristics of the highway scenes, aiming to improve the overall performance of the system.

3. Method

3.1. WCMSM: Weak-Cue Mixed Similarity Matrix

In this section, we introduce the WCMSM, which incorporates weak cues into the similarity matrix. Most MTMCT systems, such as [23,25], complete the following steps when constructing similarity matrices. First, based on the SCMT results, the ReID features of the same target are concatenated to form trajectories within a single camera, as follows:
T i d = [ T i d , i : ( t i , b i , f i ) ]
where T i d represents the tracklet associated with the unique identifier id, t i represents the time frame, b i denotes the corresponding bounding box information, and f i denotes the corresponding ReID feature.
Then, based on the concatenated appearance features f i , the similarity between two trajectories is calculated as follows:
cos T i , T j = F T i × F T j F T j × F T j
where F ( T ) represents the trajectory feature obtained by concatenating the features f i extracted from each frame of the target in the camera. From this, the similarity matrix S between m trajectories can be obtained:
S = cos T 1 , T 1 cos T 1 , T m cos T m , T 1 cos T m , T m
We can observe that in the construction of the similarity matrix, only the appearance features f i , known as strong cues, are utilized. However, when we further examine the definition of the trajectory T, we find that it consists not only of appearance features f but also includes bounding box information b. Furthermore, since the features f are extracted based on the content within the detected bounding boxes b, it can be inferred that the bounding boxes b should also be considered valid components of the similarity matrix, thereby influencing the final trajectory aggregation results based on the similarity matrix.
Through our observations of tunnel highway scenes in our study, we have found that in certain situations, such as dim lighting or changing illumination, the appearance features of the targets can be severely affected. However, regardless of how the appearance features within the detected bounding boxes may change, the size of the bounding boxes remains a relatively accurate and realistic reflection of the actual conditions of the targets. Therefore, we consider the area of the target’s bounding box b as a weak cue in our analysis.
We combine the area of the bounding box as a weak cue with the appearance features as a strong cue to obtain a new feature representation f t at time t as follows:
f t = f t x t y t + δ x t y t
where f t represents the appearance feature of the target at time t in the continuous trajectory segment, x t and y t denote the width and height of the bounding box of the target at that time, and δ represents the average of the weak-cue information within the continuous time interval [ a , b ] as follows:
δ = a b x t y t b a
Based on f t , we can obtain the new F T . By substituting F T into Equation (2) and replacing F T , we can obtain the similarity matrix WCMSM that combines the weak cues.
From the above calculation process, we know that calculating the weak cues f t requires obtaining the target appearance features f t and the corresponding bounding box size information at each time t and performing a cumulative sum, seemingly with high time complexity. But luckily, in most MTMCT systems like the one proposed, trajectories are generated first via multi-target tracking before association. So, the heavy feature extraction computations and detection box information for each frame are already performed before generating the weak-cue matrix. The extra cost for the weak-cue matrix is just one more multiplication and sum of features at each time t, which is negligible compared to feature extraction. Thus, any mainstream MTMCT system with a four-step process (object detection, ReID, single-camera multi-target tracking, and cross-camera trajectory aggregation) can incorporate the WCMSM at a low cost and use weak cues to enhance the similarity matrix.
Discussion on Other Weak Cues: In this paper, the WCMSM adopts bounding boxes as weak cues, although other factors (such as speed and direction) could also be considered weak cues. However, we consider that the selection of weak cues should prioritize factors that are computationally efficient, easily obtainable, and stable in state, such as the bounding boxes chosen in this study. Bounding boxes are readily available during the object detection stage, and their area calculation is straightforward, introducing no additional computational overhead. Moreover, even under challenging conditions, such as changes in lighting or occlusion, where a vehicle’s appearance may vary significantly, the size of the bounding box remains stable, ensuring robustness.

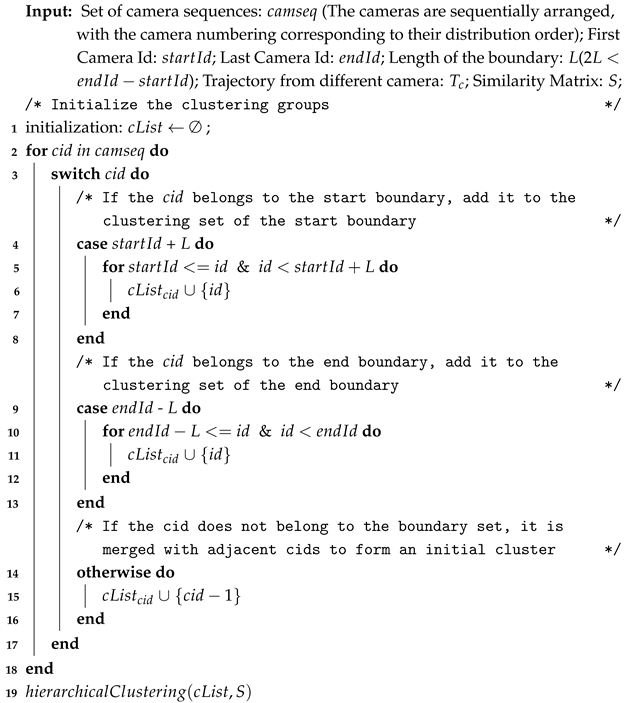
3.2. BEC: Boundary Expansion Clustering

After obtaining the similarity matrix S, based on the obtained similarity matrix S, we proceed to aggregate the trajectories obtained from different cameras using MOT algorithms (e.g., DeepSORT [34], JDE [18], or fairMot [35]). As shown in Figure 2, based on the trajectories obtained from individual cameras, we merge the trajectories from the different cameras according to the similarity matrix S (e.g., selecting adjacent camera y and camera z). This process is repeated until all trajectories are merged, resulting in the MTMCT system’s final output, which represents the global trajectories.
However, we consider that the clustering approach mentioned above, while producing results, is a simplistic and straightforward adaptation of the hierarchical clustering algorithm. There is potential for optimization in this regard. In the majority of traffic scenarios, the distribution of surveillance cameras is designed based on the characteristics of the scene. Taking our collected HST dataset as an example, all camera positions are initially set at the top of the tunnel, with adjacent cameras having similar shooting angles. Furthermore, the distribution distance between cameras is approximately the same. This ensures that the camera coverage effectively covers the entire monitored tunnel section, minimizing blind spots and considering both monitoring effectiveness and cost factors. From this, we can infer that in highway scenarios similar to those in the HST dataset, there is a correlation between the images captured by different cameras, and this correlation is related to the order of the cameras.
As a result, the correlation between camera order and the scene’s inherent characteristics is worth utilizing. Therefore, we propose the boundary expansion clustering (BEC) algorithm. As shown in Figure 3, unlike traditional clustering methods, BEC considers the order of cameras and performs clustering based on their sequential arrangement (where we assume that the numerical order of cameras represents their actual distribution order). First, during the clustering process of BEC, each clustering step selects adjacent cameras to cluster together. Once the trajectories of the adjacent cameras are completed, BEC then selects the trajectories clustered near them and repeats the clustering process until the global trajectory is obtained. Second, for cameras near the boundaries (i.e., the starting point and ending point), BEC clusters the trajectories of these cameras in a concentrated manner. We consider that during the process of entering and leaving the road section, the motion patterns of the targets are more consistent and stable compared to when they are in the middle of the road section. For example, in a highway scenario, vehicles in the middle of the road section may encounter disruptions, such as sudden exits at intermediate junctions, unexpected decelerations or delays, and the presence of highly similar vehicles together.
Algorithm 1 shows the pseudocode for the BEC algorithm, along with detailed explanations of each step. The camera sequence c a m s e q , starting camera ID s t a r t I d , and ending camera ID e n d I d , along with the boundary length L, are the inputs to the BEC algorithm. Regarding the selection of the boundary length L, we suggest that it should be determined based on the actual situation. For example, if s t a r t I d corresponds to the starting camera ID of a road section, and k represents the camera ID where the first traffic light or the first junction appears within that section, then we suggest setting the boundary length L as k s t a r t I d to capture that specific length. Then, considering the camera sequence c i d , the trajectories of the cameras within the boundary length L are concentrated into a single group, while the trajectories of the remaining cameras are grouped with the trajectories of their adjacent cameras. This process generates the clustering groups c L i s t . Next, by utilizing the similarity matrix S and the clustering groups c L i s t , the trajectories are subjected to hierarchical clustering, resulting in the final output.
Algorithm 1: Boundary expansion clustering
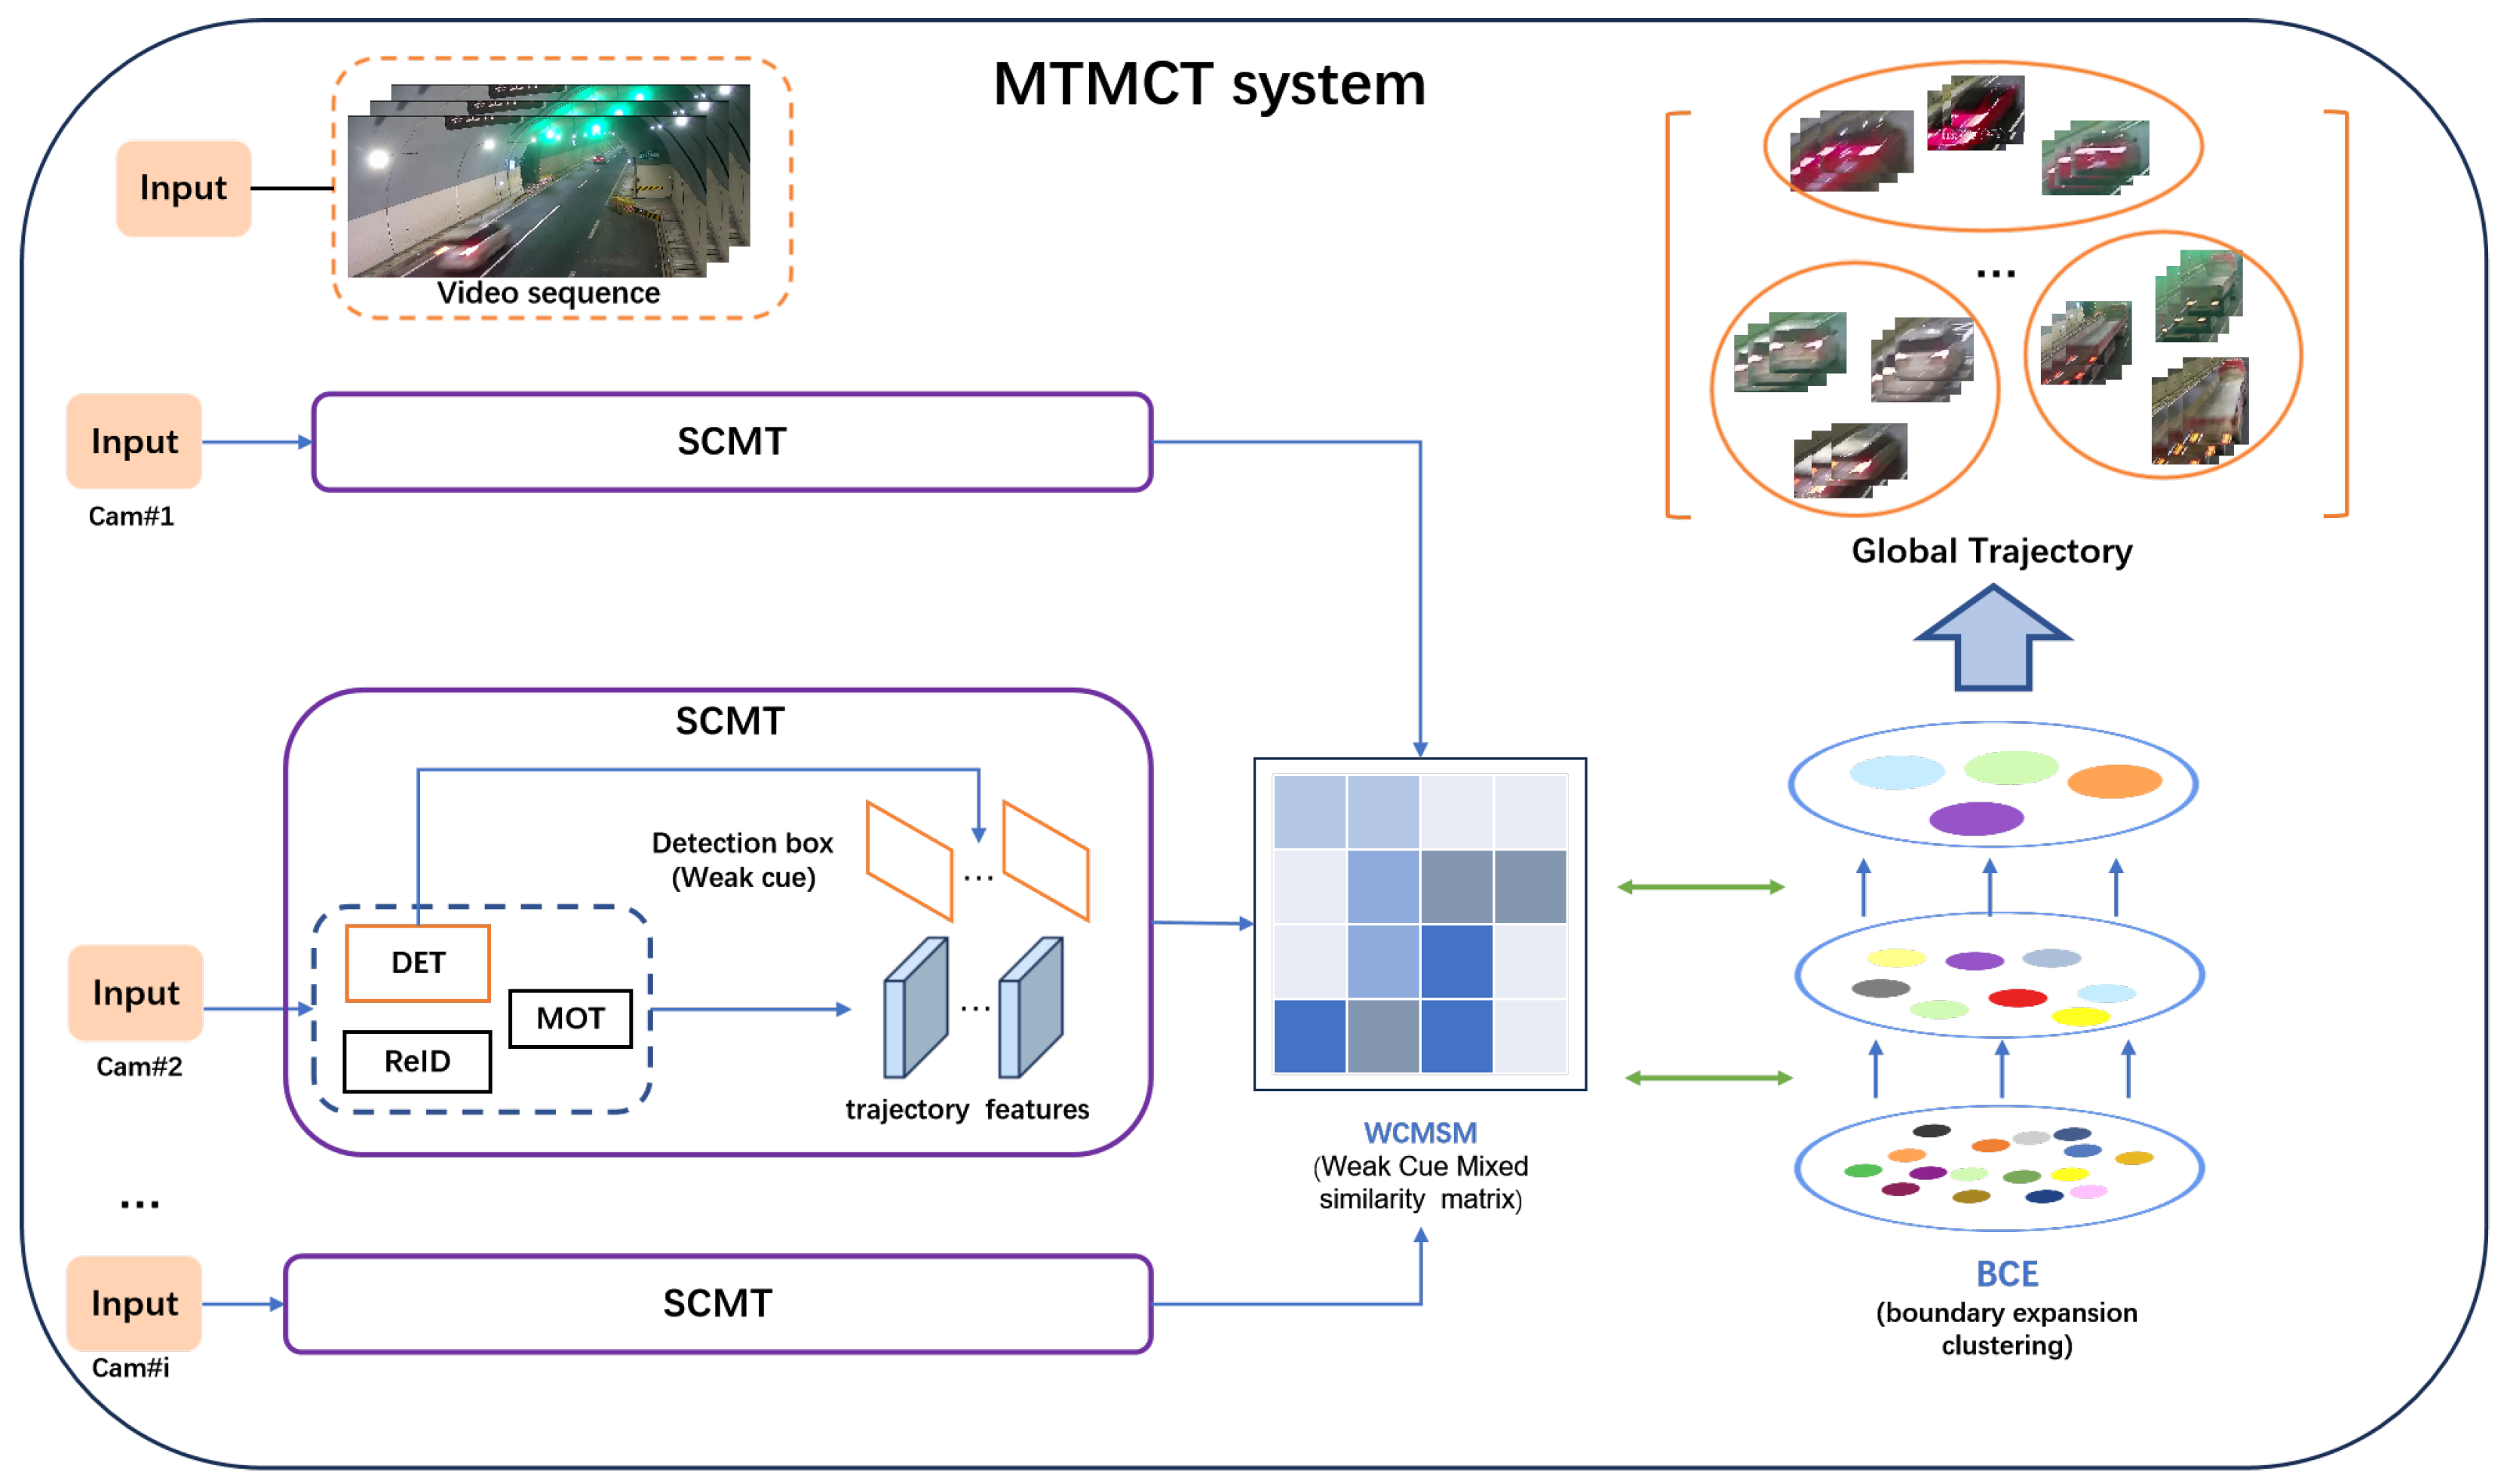
Electronics 14 01896 i001

3.3. MTMCT System

After combining our proposed WCMSM and BEC modules, we created our WCBE (weak-cue mixed similarity matrix and boundary expansion clustering) MTMCT system. In this system, we integrate the popular YOLO series of detectors [36,37,38] and utilize some well-trained ReID backbones from [39]. Additionally, we adopt the ReID feature fusion techniques described in [23,25]. Specifically, we employ different ReID backbones for feature extraction. After normalizing the features, we fuse the features extracted by the different ReID backbones by taking their average, thereby enhancing the ReID features. To further enhance performance, we incorporate the high-performing BotSort [40] into our system.
The pipeline of the entire MTMCT system is illustrated in Figure 1. The frames captured by each camera are first processed through object detection to detect the targets and generate the corresponding bounding boxes. Then, the ReID module extracts the ReID features of the targets based on the detection information. Using both the detection information and ReID features, the BotSort algorithm generates trajectories. The trajectory features are then combined with the detection information to generate a similarity matrix. Finally, the BEC algorithm is employed to aggregate the trajectories based on the generated similarity matrix, resulting in the global trajectories, which serve as the final output of the MTMCT system.

4. Experiments

In this section, the proposed modules, WCMSM and BEC, are evaluated and analyzed, and the MTMCT system is compared with other methods.

4.1. Datasets

HST: As shown in Figure 4, we established the Highway Surveillance Traffic (HST) dataset through meticulous data collection in the Tongpan Shan Tunnel section of the Hangzhou–Shaoxing–Taizhou Highway, located in Shaoxing City, Zhejiang Province, China. All the data included in HST are original and unprocessed real data collected by our team through surveillance cameras set up in the Tongpan Mountain Tunnel section. The data were collected from video clips of vehicles traveling inside the tunnel, recorded between approximately 15:00 and 17:00 Beijing time. The lighting conditions in the scene were generally good. The footage from cameras C340, C460, C820, and C940 was clear, while the footage from cameras C580 and C700 exhibited some blurring due to lighting effects. We attempted to ensure that all experiments were carried out as close to the real scene as possible. Table 1 provides a comparative analysis between the HST dataset and various other datasets, highlighting factors such as camera count, data type, duration, and data quality. The HST dataset comprises 182 min of video footage captured by six different cameras. The recordings exhibit exceptional quality, boasting a resolution of 1080p and a frame rate of 60 fps. To collect the data, we strategically positioned six cameras (C340, C460, C580, C700, C820, and C940) sequentially along the Tongpan Shan Tunnel, covering the north-to-south direction. The videos captured by these six cameras possess a resolution of 1920 × 1080 pixels, and the dataset spans a total duration of 3.03 h (182 min). The HST dataset encompasses a diverse range of commonly observed vehicle types, including cars, trucks, buses, and others.
CityFlow: The CityFlow [41] dataset, developed by NVIDIA, was specifically designed for MTMCT. It was collected from 16 cameras in a mid-sized city in the United States, spanning a total duration of 3.25 h (195.03 min). The dataset includes a large number of vehicle types, including SUVs, buses, vans, etc. As shown in Table 1, CityFlow is a video-based dataset primarily designed for MTMCT and vehicle re-identification (ReID) in urban scenarios. However, it lacks sufficient data for MTMCT research in highway scenarios.
HST is different from other MTMCT datasets such as CityFlow [41] in that other MTMCT datasets focus on bright daytime urban scenes, while the HST data were specifically collected from tunnel sections of highways with poor visibility and lighting interference. In HST, due to the high-speed passage of vehicles, there are numerous vehicle deformation and blurriness instances in the camera footage. Therefore, the scenes included in the HST dataset pose greater difficulty and challenges in MTMCT tasks, making them more meaningful for research purposes.

4.2. Evaluation Metrics

To evaluate the performance of the MTMCT system, the IDF1 metric [42] was used in this paper. IDF1 measures the ratio of correctly identified detections to the ground truth and considers the average number of calculated detections. Additionally, the IDP, IDR, and MOTA metrics were used.
The specific definitions of IDF1, IDP, IDR, and MOTA are as follows:
I D P = I D T P I D T P + I D F P I D R = I D T P I D T P + I D F N I D F 1 = 2 I D T P 2 I D T P + I D F P + I D F N M O T A = 1 F N + F P + I D S W G T
where IDSW represents the count of identifier errors caused by the identifier switches and GT represents the count of detections in the ground-truth tracking set. IDTP, IDFP, and IDFN can be calculated as follows:
I D F N = τ t T τ m τ , γ m ( τ ) , t , Δ I D F P = γ t T γ m τ m ( γ ) , γ , t , Δ I D T P = τ len ( τ ) I D F N = γ len ( γ ) I D F P
where τ denotes the ground-truth trajectory, γ m ( τ ) represents the best match of the computed trajectory for τ , γ represents the computed trajectory, τ m ( γ ) denotes the best match of the ground-truth trajectory for γ , t represents the frame index, and Δ represents the IOU threshold used to determine whether the computed bounding box matches the ground-truth bounding box (where Δ is set to 0.5 ). Additionally, m ( · ) represents a mismatch function, and it is set to 1 if there is a mismatch at t and 0 otherwise.
The evaluation metrics (IDF1, IDP, IDR, and MOTA) in MTMCT are fundamentally related yet distinct from detection metrics like IoU, precision, recall, F1 score, and AP/mAP. IDF1 mirrors the traditional F1 measure but evaluates ID consistency rather than bounding box overlap. IDP and IDR similarly correspond to detection precision and recall but incorporate identity matching considerations. MOTA comprehensively accounts for false positives (FP), false negatives (FN), and identity switches (IDSW), making it conceptually related to detection precision/recall while adding tracking-specific ID stability assessment. These tracking metrics inherently depend on detection performance, particularly the IoU between the predicted and ground-truth boxes, which itself is influenced by the localization error. Meanwhile, AP/mAP standard detection benchmarks, computed via precision–recall curves at specific IoU thresholds, indirectly relate to tracking metrics through their shared dependence on detection quality. The inference speed and number of detections represent efficiency metrics that, while not directly affecting accuracy measures like IDF1 or MOTA, require practical trade-offs with tracking performance. In essence, tracking metrics extend detection evaluation by introducing identity continuity assessment, where overall tracking performance is jointly determined by the detection quality (IoU and localization error) and system efficiency (inference speed and detection count). This hierarchical relationship shows that while tracking builds upon detection foundations, it introduces additional dimensionality through identity preservation requirements.

4.3. Experiments and Evaluation of the WCMSM

Settings: YOLOv8 [36] was used for object detection, and features were extracted from the detection results using four different ReID backbones: IBN-densenet169, IBN-ResNet101, ResNet50, and IBN-Se-ResNet101. In addition, we also included a fusion of features extracted from three backbones for comparison: IBN-ResNet101, ResNet50, and IBN-Se-ResNet101. Next, we generated trajectories using BotSort [40]. Then, we combined these trajectory features with the object detection bounding boxes detected by YOLOv8 and input them into WCMSM. Finally, we utilized a clustering algorithm to aggregate the trajectories and obtain the final output. Additionally, we conducted experiments to compare the runtime of the program before and after applying a weak cue. Here, runtime specifically refers to the time taken to generate the similarity matrix and perform trajectory clustering based on it, excluding earlier stages such as object detection, ReID feature extraction, and single-camera multi-object tracking. Each experiment was repeated 10 times, and the average execution time was recorded.
As shown in Table 2, the WCMSM exhibited a certain degree of versatility. By using different ReID backbones for feature extraction based on the detection results from YOLOv8, the final results of the MTMCT system were improved to some extent after applying the WCMSM algorithm. Specifically, when the feature extraction performance of the original ReID backbone was not satisfactory, the use of the WCMSM significantly improved the final results. The WCMSM utilized detection information for correction, leading to a noticeable enhancement in overall performance. For example, when using IBN-densenet169 as the backbone without the WCMSM, IDF1 was 28.18 , IDP was 30.08 , IDR was 26.51 , and MOTA was 57.73 . However, after incorporating the WCMSM, IDF1 increased to 32.07 , IDP increased to 34.24 , and IDR increased to 30.16 . Additionally, as shown in Table 2, using a weak cue introduced additional computational overhead, but it was generally kept within 1 s. For instance, with IBN-ResNet101, the overall runtime only increased by 0.3 s after applying the weak cue. We consider this minor time cost acceptable compared to the significant improvement in accuracy brought by the weak cue.
Based on the above data, we can conclude that the reason the WCMSM improves the overall MTMCT system lies in its compensatory effect on low-quality features. Therefore, for MTMCT systems with relatively poor original performance, the improvement in accuracy is more obvious. Further combining this with the dark tunnel scene of HST, we conducted a more in-depth analysis. Traditional MTMCT systems only rely on appearance features (strong cues) when constructing the similarity matrix. However, in actual highway scenarios, the appearance features of vehicles are extremely vulnerable to factors such as lighting conditions and blurring caused by high-speed movement. The WCMSM combines the area of the target bounding box as a weak cue with the appearance feature. The bounding box information is relatively stable and is not easily affected by the above adverse factors. For example, when the light is dim in the tunnel, the details of the vehicle’s appearance may be difficult to distinguish, but the size of the bounding box can still reflect the approximate size and positional relationship of the vehicle, providing an additional and reliable information dimension for judging trajectory similarity, thus enhancing the discriminative ability of the similarity matrix and making the system more accurate in matching and associating trajectories.
Discussion on Method Scalability: As a highly practical research topic, the real-world deployment of MTMCT requires careful consideration of scalability in multi-camera or long-duration scenarios, runtime performance, and resource consumption. We now analyze the critical factors involved when MTMCT implements the WCMSM:
(1) More cameras: The scalability of the WCMSM in multi-camera systems is primarily constrained by parallel weak cue (e.g., bounding box) computational demands. This method’s core premise involves using weak cues to compensate for degraded strong cues (appearance features) due to environmental interference (e.g., illumination changes or occlusions), with target detection area calculations forming the principal performance bottleneck. System scaling increases tracking coverage, leading to more detected targets and, consequently, significantly higher weak-cue computational loads.
(2) Longer runtime: The WCMSM exhibits two distinct scalability patterns in temporal extension scenarios: global tracking duration extension and intra-camera trajectory prolongation. The former scenario demonstrates a negligible impact, as WCMSM’s feature compensation operates locally per camera, while the latter scenario, where vehicles persist longer in camera views, induces three critical effects: (1) extended trajectories accumulating more frame-wise appearance features, (2) consequently heavier computational loads during weak-cue integration due to growing feature dimensions, and (3) potential CPU load spikes stemming from the quadratic scaling of the matrix operations involved in trajectory feature processing.
As evident from the above two extension scenarios, CPU performance emerges as the primary bottleneck in both cases. Therefore, for practical large-scale deployment, we recommend (1) implementing comprehensive CPU performance monitoring mechanisms, and (2) provisioning adequate CPU resources to guarantee real-time processing requirements.

4.4. Experiments and Evaluation of the BEC Algorithm

Settings:YOLOv8 [36] was used for object detection, and features were extracted from the detection results using four different ReID backbones: IBN-densenet169, IBN-ResNet101, ResNet50, and IBN-Se-ResNet101. In addition, we also included a fusion of features extracted from three backbones for comparison: IBN-ResNet101, ResNet50, and IBN-Se-ResNet101. Next, we generated trajectories using BotSort [40]. Lastly, for trajectory aggregation, we employed the BEC algorithm to cluster the trajectories. Moreover, we conducted experiments to compare the runtime of the program before and after applying BEC. Here, runtime specifically refers to the time taken to generate the similarity matrix and perform trajectory clustering based on it, excluding earlier stages such as object detection, ReID feature extraction, and single-camera multi-object tracking. Each experiment was repeated 10 times, and the average execution time was recorded.
As shown in Table 3, the BEC algorithm improved both the IDF1 and IDP metrics for trajectory aggregation based on the features extracted from different backbones. For example, when using the BEC algorithm for trajectory aggregation with the IBN-Se-ResNet101 backbone, there was an improvement of 2.33 in IDF1 and 2.54 in IDR. However, we observed a decrease in the IDR and MOTA metrics, especially when using a backbone like IBN-densenet169, which exhibited poor feature extraction performance.
One key factor contributing to this phenomenon was the cascading effect caused by the change in clustering rules in the BEC algorithm. In cases where the feature quality was good, the trajectories obtained from correct clustering within the boundaries were more likely to have longer lengths compared to the trajectories outside the boundaries. During subsequent clustering, the information richness of these correct trajectories played a crucial role in facilitating their identification and aggregation in the matching process while filtering out incorrect trajectories. However, when the feature quality was poor, the situation was reversed.
As shown in Table 3, after applying BEC, in addition to the improvement in accuracy, the runtime of the method became shorter, meaning that the execution time was optimized. This is because BEC treats trajectories captured by multiple cameras near the boundary as part of the same cluster during initialization, thereby reducing the number of subsequent clustering iterations. As a result, the overall execution time of the clustering algorithm is shortened.
Furthermore, the idea of BEC is to utilize the scene structure information. In highway scenarios, such as those presented in the HST dataset, the distribution of surveillance cameras exhibits a certain pattern. Based on this, the BEC algorithm selects adjacent cameras for clustering according to the camera order. This approach can take full advantage of the spatial correlation between cameras and the inherent structure of the scene. Since adjacent cameras have similar shooting angles and uniform spacing, the trajectories of vehicles within the fields of view of adjacent cameras have relatively high continuity and similarity. By preferentially clustering the trajectories of adjacent cameras, the BEC algorithm can better capture this continuity, reduce errors in trajectory matching, improve the accuracy of clustering, and thus enhance metrics such as IDF1 and IDP. In addition, boundary processing is also an important part of BEC. In boundary areas such as road entrances and exits, the motion patterns of vehicles are relatively stable. The BEC algorithm focuses on processing the trajectories of boundary cameras and clusters them preferentially. For example, at a highway entrance, vehicles are usually in the process of accelerating onto the main road, and the changes in their motion directions and speeds are relatively small; at an exit, vehicles will slow down in advance and maintain a relatively stable driving path to prepare for exiting. This stable motion pattern makes the trajectories in the boundary area easier to cluster accurately, reducing the confusion of trajectories caused by complex situations such as sudden lane changes, overtaking, or traffic jams that may occur in the middle of the road, thus further improving the algorithm’s performance when the feature quality is good.
Discussion on Method Scalability: As a highly practical research topic, the real-world deployment of MTMCT requires careful consideration of scalability in multi-camera or long-duration scenarios, runtime performance, and resource consumption. We now analyze the critical factors involved when MTMCT implements BEC:
(1) More cameras: As the number of cameras increases and the scene coverage expands, the partitioning of boundary regions becomes more critical. However, we believe that this has a minimal impact on system performance, as BEC only treats boundary regions as a single cluster and does not introduce additional computational overhead compared to other MTMCT methods.
(2) Longer runtime: Similar to the aforementioned scenario, BEC primarily improves the clustering process without introducing additional computational costs. Therefore, even if the tracking duration increases, MTMCT can still utilize BEC.

4.5. Experiments and Evaluation of the MTMCT System

4.5.1. Ablation Study

As listed in Table 4, the entire MTMCT system consisted of four modules: vehicle detection, vehicle ReID, trajectory generation, and trajectory clustering.
YOLOv8 was used for vehicle detection, and BotSort was employed to generate trajectories. The WCMSM and BEC were utilized for trajectory generation and clustering. Using BEC improved the performance metrics. Specifically, IDF1 increased by 2, IDP improved by 1.02 , IDR increased by 11.8 , and MOTA increased by 1.19 . After applying the WCMSM, IDF1, IDP, IDR, and MOTA increased by 1.04 , 0.9 , 0.8 , and 0.33 , respectively.

4.5.2. Comparison with Other Methods on HST

As shown in Table 5, our proposed method was compared with several other state-of-the-art MTMCT system methods, which are described below.
NCCU [33]: NCCU focuses on optimizing the matching of vehicle image features and geometrical factors, such as trajectory continuity, vehicle moving directions, and travel duration across different camera views.
ELECTRICITY [2]: ELECTRICITY is a highly efficient and accurate multi-camera vehicle tracking system that incorporates aggregation loss and a fast multi-target cross-camera tracking strategy.
DyGlip [43]: DyGlip introduces attention mechanisms into dynamic graphs. It incorporates a structured attention layer that considers both embedded feature information and camera-specific information. It also includes a temporal attention layer that incorporates time information. These components are then encoded and decoded.
MCMT [23]: MCMT was the state-of-the-art method in the 2021 AICity Challenge Track 3. It employs several optimization strategies based on intersection-region division, such as the Tracklet Filter Strategy (TFS), Direction-Based Temporal Mask (DBTM), and Sub-clustering in Adjacent Cameras (SCAC).
TAG [25]: TAG is a method that ranked third in the AICity Challenge 2022. It employs a cascaded tracking method based on detection-appearance features and trajectory interpolation, as well as a matching mechanism using the zone gate and time decay. This method fully utilizes the spatiotemporal appearance features, contributing to precise trajectory association.
As shown in Table 5, our method achieved the best results in terms of the IDF1, IDP, and IDR metrics. Several factors contributed to the observed results: (1) In our proposed WCMSM, the generation of the similarity matrix went beyond the conventional approach of solely MCMT on trajectory features. We incorporated additional weak-cue information, thus enhancing the accuracy of the similarity matrix. (2) Our proposed BEC considered the specific characteristics of highway scenarios that we had studied, whereas other methods did not include designs specifically tailored for highway scenarios. (3) In contrast to other methods that rely on additional information for optimization, such as on-site calibration and geographical information in NCCU, time information in DyGlip, and manual segmentation of regions in MCMT and TAG, our method stood out by not requiring such dependencies. However, in highway scenarios where vehicles maintained straight-line motion and lacked traffic rules, this additional information became less effective, resulting in fewer significant improvements in overall system performance.
Failure cases and error visualizations: Figure 5 presents some failure cases during the tracking process and provides visualizations. The main reason for failure cases is that in highway scenarios, vehicles travel at high speeds, exceeding the shutter limit of the camera, resulting in motion blur. This makes it difficult for the detector to identify targets even when the vehicle objects are large. Moreover, even if the targets are detected, the significant feature changes caused by motion blur may lead to tracking association failures.

4.5.3. Comparison with Other Methods on CityFlow

Our method (WCBE) was evaluated on the S02 validation set of CityFlow and compared with other MTMCT methods. The results are shown in Table 6. The CityFlow dataset, sourced from 16 cameras in an American city, encompasses diverse traffic scenarios and a wide range of vehicle types. It has a total duration of 3.25 h (195.03 min) and a resolution of 960p. Previous methods, like NCCU [33], ELECTRICITY [2], DyGlip [43], MCMT [23], and TAG [25], faced challenges when dealing with the complexity of CityFlow. For example, NCCU’s optimization of feature and geometry matching faced difficulties in the presence of occlusions and complex traffic flows. ELECTRICITY’s tracking strategy did not perform well in areas with numerous intersections. DyGlip’s attention mechanism struggled to cope with highly dynamic traffic. Although MCMT and TAG exhibited relatively higher performance in some metrics than our WCBE system, it should be noted that their advantages might have stemmed from a better fit with the specific characteristics of certain subsets within the CityFlow dataset. Specifically, the scenes selected from the S02 dataset were relatively random in nature, in contrast to the highly structured spatiotemporal sequences present in HST’s highway tunnel scenarios, where the footage from different cameras exhibited strong inter-correlation and sequential dependencies. As a result, WCBE found it challenging to fully utilize its strengths under such conditions, leading to its comparatively inferior performance against MCMT and TAG. MCMT’s region division and clustering strategies were more effective in specific urban areas where the traffic patterns and camera arrangements aligned well with its design. Similarly, TAG’s approach, based on detection-appearance features and trajectory interpolation, worked better in scenarios where vehicle appearances were relatively stable and trajectories followed more predictable paths. Our WCBE system, however, was designed with a comprehensive consideration of various factors. The WCMSM incorporates weak cues, specifically the area of the target bounding box, along with appearance features, to enhance the discriminability of the similarity matrix. This enables it to handle occlusions and variations in vehicle appearances more effectively. The BEC algorithm takes advantage of the characteristics of camera distribution and vehicle motion. By clustering adjacent cameras’ trajectories first and focusing on stable boundary areas, it significantly improved the clustering accuracy. On the S02 dataset, our WCBE system achieved an IDF1 of 62.9 % , an IDP of 53.18 % , and an IDR of 76.98 % . These results demonstrate that WCBE still attains competitive performance and further verify its generality and robustness in both highway and urban scenarios, highlighting the effectiveness of the WCMSM and BEC modules.

5. Conclusions

This paper makes significant contributions to the field of multi-target multi-camera tracking (MTMCT) in highway scenarios, primarily through the development of two key components: the weak-cue mixed similarity matrix (WCMSM) and the boundary expansion clustering (BEC) algorithm. The WCMSM represents a novel approach to enhancing the similarity matrix used in MTMCT. By incorporating the area of the target bounding box as a weak cue alongside the traditional appearance features (strong cues), it effectively compensates for the low-quality trajectories often encountered in highway conditions. This integration leads to a remarkable improvement in the discriminability of the similarity matrix, thereby enhancing the overall performance of the MTMCT system. Notably, in scenarios where the original performance of the system is relatively poor, the impact of the WCMSM is even more pronounced.
Through a series of experiments using different ReID backbones, it was demonstrated that the WCMSM consistently enhances performance metrics such as IDF1, IDP, and IDR, validating its effectiveness and versatility. The BEC algorithm is another crucial innovation. It capitalizes on the unique characteristics of highway scenes, particularly the distribution pattern of surveillance cameras and the stable motion patterns of vehicles near boundaries. By clustering adjacent cameras’ trajectories first and focusing on boundary cameras’ trajectories, BEC optimizes the trajectory clustering process. In cases where the input feature quality is good, it effectively reduces errors in trajectory matching and improves clustering accuracy, as evidenced by the improved IDF1 and IDP metrics. However, in situations with poor feature quality, the cascading effect of its clustering rules may lead to some fluctuations in certain metrics, yet its overall contribution to enhancing the system’s performance in suitable scenarios remains significant. By integrating the WCMSM and BEC, we developed the proposed WCBE MTMCT system.
Through extensive experiments on both the self-collected HST dataset and the public CityFlow dataset, the WCBE system outperformed several state-of-the-art MTMCT methods. On the HST dataset, it achieved an IDF1 of 71.26 % , an IDP of 78.44 % , an IDR of 65.29 % , and an MOTA of 58.31 % . The ablation experiments further confirmed the essential roles of the WCMSM and BEC in enhancing the system’s performance, thus providing strong evidence of the effectiveness of our proposed approach.
In the future, we will focus on enhancing the MTMCT system’s performance. We plan to explore advanced feature extraction for better trajectory features to improve the WCMSM and BEC. Also, we plan to integrate vehicle behavior and traffic flow data to enrich clustering and to adapt to complex scenarios. Moreover, more comprehensive experiments on larger datasets will be conducted to validate the robustness and generalizability of our method. Overall, this research not only provides an effective solution for improving the performance of MTMCT systems in highway scenarios but also offers valuable insights and a solid foundation for future research in this area.

Author Contributions

Conceptualization, S.C., Z.W., Y.Y., and J.H.; methodology, S.C., S.N., and X.C.; software, S.C., S.N., and S.L.; validation, S.N., Z.W., Y.Y., and J.H.; formal analysis, S.C. and Z.W.; investigation, S.N. and X.C.; resources, S.C., S.N., and X.C.; data curation, S.N., X.C., and S.L.; writing—original draft preparation, S.C., S.N., and X.C.; writing—review and editing, S.C., S.N., Z.W., Y.Y., and J.H.; visualization, S.N. and S.L.; supervision, Z.W., Y.Y., and J.H.; project administration, S.C., Z.W., Y.Y., and J.H.; funding acquisition, S.C. and J.H. All authors have read and agreed to the published version of the manuscript.

Funding

This work was supported by the National Natural Science Foundation of China (Grant Nos. 61906168, 62201400, and 62272267); the Fundamental Research Funds for the Provincial Universities of Zhejiang (Grant No. RF-A2024013); the Zhejiang Provincial Natural Science Foundation of China (Grant Nos. LY23F020023 and LZ23F020001); the Construction of Hubei Provincial Key Laboratory for Intelligent Visual Monitoring of Hydropower Projects (Grant No. 2022SDSJ01); and the Hangzhou AI major scientific and technological innovation project (Grant No. 2022AIZD0061).

Data Availability Statement

This study did not report any data. The proposed method was evaluated on both a proprietary dataset, HST, and a publicly available benchmark dataset, CityFlow (https://paperswithcode.com/dataset/cityflow, accessed on 5 May 2025).

Conflicts of Interest

Author Zheng Wang was employed by the company Tianjin Huaxin Huiyue Technology Co., Ltd. The remaining authors declare that the research was conducted in the absence of any commercial or financial relationships that could be construed as a potential conflict of interest.

References

  1. Ristani, E.; Tomasi, C. Features for multi-target multi-camera tracking and re-identification. In Proceedings of the IEEE Conference on Computer Vision and Pattern Recognition, Salt Lake City, UT, USA, 18–22 June 2018; pp. 6036–6046. [Google Scholar]
  2. Qian, Y.; Yu, L.; Liu, W.; Hauptmann, A.G. ELECTRICITY: An Efficient Multi-Camera Vehicle Tracking System for Intelligent City. In Proceedings of the IEEE/CVF Conference on Computer Vision and Pattern Recognition (CVPR) Workshops, Seattle, WA, USA, 13–19 June 2020. [Google Scholar]
  3. Nguyen, T.T.; Nguyen, H.H.; Sartipi, M.; Fisichella, M. Multi-Vehicle Multi-Camera Tracking With Graph-Based Tracklet Features. IEEE Trans. Multimed. 2024, 26, 972–983. [Google Scholar] [CrossRef]
  4. Zhang, X.; Yu, H.; Qin, Y.; Zhou, X.; Chan, S. Video-Based Multi-Camera Vehicle Tracking via Appearance-Parsing Spatio-Temporal Trajectory Matching Network. IEEE Trans. Circuits Syst. Video Technol. 2024, 34, 10077–10091. [Google Scholar] [CrossRef]
  5. Xu, T.; Wu, X.J.; Zhu, X.; Kittler, J. Memory Prompt for Spatiotemporal Transformer Visual Object Tracking. IEEE Trans. Artif. Intell. 2024, 5, 3759–3764. [Google Scholar] [CrossRef]
  6. Ye, M.; Lan, X.; Yuen, P.C. Robust anchor embedding for unsupervised video person re-identification in the wild. In Proceedings of the European Conference on Computer Vision (ECCV), Munich, Germany, 8–14 September 2018; pp. 170–186. [Google Scholar]
  7. Sikdar, A.; Chowdhury, A.S. Lightweight Learning for Partial and Occluded Person Re-Identification. IEEE Trans. Artif. Intell. 2024, 5, 3245–3256. [Google Scholar] [CrossRef]
  8. He, S.; Luo, H.; Wang, P.; Wang, F.; Li, H.; Jiang, W. Transreid: Transformer-based object re-identification. In Proceedings of the IEEE/CVF International Conference on Computer Vision, Montreal, BC, Canada, 11–17 October 2021; pp. 15013–15022. [Google Scholar]
  9. Bewley, A.; Ge, Z.; Ott, L.; Ramos, F.; Upcroft, B. Simple online and realtime tracking. In Proceedings of the 2016 IEEE International Conference on Image Processing (ICIP), Phoenix, AZ, USA, 25–28 September 2016; IEEE: Piscataway, NJ, USA, 2016; pp. 3464–3468. [Google Scholar]
  10. Kalman, R.E. A new approach to linear filtering and prediction problems. J. Basic Eng. Mar. 1960, 82, 35–45. [Google Scholar] [CrossRef]
  11. Zhou, X.; Koltun, V.; Krähenbühl, P. Tracking objects as points. In Proceedings of the European Conference on Computer Vision, Glasgow, UK, 23–28 August 2020; Springer: Berlin/Heidelberg, Germany, 2020; pp. 474–490. [Google Scholar]
  12. He, J.; Huang, Z.; Wang, N.; Zhang, Z. Learnable graph matching: Incorporating graph partitioning with deep feature learning for multiple object tracking. In Proceedings of the IEEE/CVF Conference on Computer Vision and Pattern Recognition, Nashville, TN, USA, 19–25 June 2021; pp. 5299–5309. [Google Scholar]
  13. Cetintas, O.; Brasó, G.; Leal-Taixé, L. Unifying short and long-term tracking with graph hierarchies. In Proceedings of the IEEE/CVF Conference on Computer Vision and Pattern Recognition, Vancouver, BC, Canada, 18–22 June 2023; pp. 22877–22887. [Google Scholar]
  14. Yang, B.; Nevatia, R. Multi-target tracking by online learning of non-linear motion patterns and robust appearance models. In Proceedings of the 2012 IEEE Conference on Computer Vision and Pattern Recognition, Providence, RI, USA, 16–21 June 2012; pp. 1918–1925. [Google Scholar] [CrossRef]
  15. Alahi, A.; Goel, K.; Ramanathan, V.; Robicquet, A.; Fei-Fei, L.; Savarese, S. Social LSTM: Human Trajectory Prediction in Crowded Spaces. In Proceedings of the 2016 IEEE Conference on Computer Vision and Pattern Recognition (CVPR), Las Vegas, NV, USA, 27–30 June 2016; pp. 961–971. [Google Scholar] [CrossRef]
  16. Chen, S.; Yu, E.; Li, J.; Tao, W. Delving into the Trajectory Long-tail Distribution for Muti-object Tracking. In Proceedings of the 2024 IEEE/CVF Conference on Computer Vision and Pattern Recognition (CVPR), Seattle, WA, USA, 17–21 June 2024; pp. 19341–19351. [Google Scholar] [CrossRef]
  17. Zhang, Y.; Sun, P.; Jiang, Y.; Yu, D.; Weng, F.; Yuan, Z.; Luo, P.; Liu, W.; Wang, X. Bytetrack: Multi-object tracking by associating every detection box. arXiv 2022, arXiv:2110.06864. [Google Scholar]
  18. Wang, Z.; Zheng, L.; Liu, Y.; Li, Y.; Wang, S. Towards real-time multi-object tracking. In Proceedings of the European Conference on Computer Vision, Glasgow, UK, 23–28 August 2020; Springer: Berlin/Heidelberg, Germany, 2020; pp. 107–122. [Google Scholar]
  19. Cao, J.; Pang, J.; Weng, X.; Khirodkar, R.; Kitani, K. Observation-centric sort: Rethinking sort for robust multi-object tracking. In Proceedings of the IEEE/CVF Conference on Computer Vision and Pattern Recognition, Vancouver, BC, Canada, 18–22 June 2023; pp. 9686–9696. [Google Scholar]
  20. Yang, M.; Han, G.; Yan, B.; Zhang, W.; Qi, J.; Lu, H.; Wang, D. Hybrid-sort: Weak cues matter for online multi-object tracking. In Proceedings of the AAAI Conference on Artificial Intelligence, Vancouver, BC, Canada, 20–27 February 2024; Volume 38, pp. 6504–6512. [Google Scholar]
  21. Han, G.; Yang, R.; Gao, H.; Kwong, S. Deep Decoupling Classification and Regression for Visual Tracking. IEEE Trans. Cogn. Dev. Syst. 2023, 15, 1239–1251. [Google Scholar] [CrossRef]
  22. Persson, A.; Zuidberg Dos Martires, P.; De Raedt, L.; Loutfi, A. Semantic Relational Object Tracking. IEEE Trans. Cogn. Dev. Syst. 2020, 12, 84–97. [Google Scholar] [CrossRef]
  23. Liu, C.; Zhang, Y.; Luo, H.; Tang, J.; Chen, W.; Xu, X.; Wang, F.; Li, H.; Shen, Y.D. City-scale multi-camera vehicle tracking guided by crossroad zones. In Proceedings of the IEEE/CVF Conference on Computer Vision and Pattern Recognition, Nashville, TN, USA, 19–25 June 2021; pp. 4129–4137. [Google Scholar]
  24. Hsu, H.M.; Cai, J.; Wang, Y.; Hwang, J.N.; Kim, K.J. Multi-target multi-camera tracking of vehicles using metadata-aided re-id and trajectory-based camera link model. IEEE Trans. Image Process. 2021, 30, 5198–5210. [Google Scholar] [CrossRef] [PubMed]
  25. Yao, H.; Duan, Z.; Xie, Z.; Chen, J.; Wu, X.; Xu, D.; Gao, Y. City-Scale Multi-Camera Vehicle Tracking Based on Space-Time-Appearance Features. In Proceedings of the IEEE/CVF Conference on Computer Vision and Pattern Recognition (CVPR) Workshops, New Orleans, LA, USA, 18–24 June 2022; pp. 3310–3318. [Google Scholar]
  26. Gong, Q.; Ma, S.; Zhang, N.; Liu, H.; Gao, H.; Zhao, Y.; Jiang, X.; Tu, W.; Chen, C.; Yang, F. A Semi-Supervised Clustering Algorithm for Underground Disaster Monitoring and Early Warning. Electronics 2025, 14, 965. [Google Scholar] [CrossRef]
  27. Yang, H.; Cai, J.; Zhu, M.; Liu, C.; Wang, Y. Traffic-informed multi-camera sensing (TIMS) system based on vehicle re-identification. IEEE Trans. Intell. Transp. Syst. 2022, 23, 17189–17200. [Google Scholar] [CrossRef]
  28. Park, H.G.; Shin, K.S.; Kim, J.C. Efficient Clustering Method for Graph Images Using Two-Stage Clustering Technique. Electronics 2025, 14, 1232. [Google Scholar] [CrossRef]
  29. Yang, X.; Ye, J.; Lu, J.; Gong, C.; Jiang, M.; Lin, X.; Zhang, W.; Tan, X.; Li, Y.; Ye, X.; et al. Box-Grained Reranking Matching for Multi-Camera Multi-Target Tracking. In Proceedings of the IEEE/CVF Conference on Computer Vision and Pattern Recognition (CVPR) Workshops, New Orleans, LA, USA, 18–24 June 2022; pp. 3096–3106. [Google Scholar]
  30. Huang, H.W.; Yang, C.Y.; Jiang, Z.; Kim, P.K.; Lee, K.; Kim, K.; Ramkumar, S.; Mullapudi, C.; Jang, I.S.; Huang, C.I.; et al. Enhancing multi-camera people tracking with anchor-guided clustering and spatio-temporal consistency ID re-assignment. In Proceedings of the IEEE/CVF Conference on Computer Vision and Pattern Recognition, Vancouver, BC, Canada, 18–22 June 2023; pp. 5238–5248. [Google Scholar]
  31. Li, F.; Wang, Z.; Nie, D.; Zhang, S.; Jiang, X.; Zhao, X.; Hu, P. Multi-Camera Vehicle Tracking System for AI City Challenge 2022. In Proceedings of the IEEE/CVF Conference on Computer Vision and Pattern Recognition (CVPR) Workshops, New Orleans, LA, USA, 18–24 June 2022; pp. 3265–3273. [Google Scholar]
  32. Naphade, M.; Wang, S.; Anastasiu, D.C.; Tang, Z.; Chang, M.C.; Yao, Y.; Zheng, L.; Rahman, M.S.; Venkatachalapathy, A.; Sharma, A.; et al. The 6th AI City Challenge. In Proceedings of the IEEE/CVF Conference on Computer Vision and Pattern Recognition (CVPR) Workshops, New Orleans, LA, USA, 18–24 June 2022; pp. 3347–3356. [Google Scholar]
  33. Chang, M.C.; Wei, J.; Zhu, Z.A.; Chen, Y.M.; Hu, C.S.; Jiang, M.X.; Chiang, C.K. AI City Challenge 2019-City-Scale Video Analytics for Smart Transportation. In Proceedings of the CVPR Workshops, Long Beach, CA, USA, 16–20 June 2019; pp. 99–108. [Google Scholar]
  34. Wojke, N.; Bewley, A.; Paulus, D. Simple online and realtime tracking with a deep association metric. In Proceedings of the 2017 IEEE International Conference on Image Processing (ICIP), Beijing, China, 17–20 September 2017; IEEE: Piscataway, NJ, USA, 2017; pp. 3645–3649. [Google Scholar]
  35. Zhang, Y.; Wang, C.; Wang, X.; Zeng, W.; Liu, W. Fairmot: On the fairness of detection and re-identification in multiple object tracking. Int. J. Comput. Vis. 2021, 129, 3069–3087. [Google Scholar] [CrossRef]
  36. Glenn, J.; Ayush, C.; Jing, Q. Ultralytics YOLOv8. Version 8.0.0. 2023. Available online: https://github.com/ultralytics/ultralytics (accessed on 5 May 2025).
  37. Glenn, J. Ultralytics YOLOv5. Version 7.0. 2020. Available online: https://github.com/ultralytics/yolov5 (accessed on 5 May 2025).
  38. Redmon, J.; Farhadi, A. YOLOv3: An Incremental Improvement. arXiv 2018, arXiv:1804.02767. [Google Scholar]
  39. Luo, H.; Chen, W.; Xu, X.; Gu, J.; Zhang, Y.; Liu, C.; Jiang, Y.; He, S.; Wang, F.; Li, H. An empirical study of vehicle re-identification on the AI City Challenge. In Proceedings of the IEEE/CVF Conference on Computer Vision and Pattern Recognition, Nashville, TN, USA, 19–25 June 2021; pp. 4095–4102. [Google Scholar]
  40. Aharon, N.; Orfaig, R.; Bobrovsky, B.Z. BoT-SORT: Robust Associations Multi-Pedestrian Tracking. arXiv 2022, arXiv:2206.14651. [Google Scholar]
  41. Tang, Z.; Naphade, M.; Liu, M.Y.; Yang, X.; Birchfield, S.; Wang, S.; Kumar, R.; Anastasiu, D.; Hwang, J.N. CityFlow: A City-Scale Benchmark for Multi-Target Multi-Camera Vehicle Tracking and Re-Identification. In Proceedings of the IEEE/CVF Conference on Computer Vision and Pattern Recognition (CVPR), Long Beach, CA, USA, 15–20 June 2019. [Google Scholar]
  42. Ristani, E.; Solera, F.; Zou, R.; Cucchiara, R.; Tomasi, C. Performance measures and a data set for multi-target, multi-camera tracking. In Proceedings of the European Conference on Computer Vision, Amsterdam, The Netherlands, 11–14 October 2016; Springer: Berlin/Heidelberg, Germany, 2016; pp. 17–35. [Google Scholar]
  43. Quach, K.G.; Nguyen, P.; Le, H.; Truong, T.D.; Duong, C.N.; Tran, M.T.; Luu, K. Dyglip: A dynamic graph model with link prediction for accurate multi-camera multiple object tracking. In Proceedings of the IEEE/CVF Conference on Computer Vision and Pattern Recognition, Nashville, TN, USA, 19–25 June 2021; pp. 13784–13793. [Google Scholar]
Figure 1. The pipeline of the proposed WCBE MTMCT system. SCMT: Single-camera multi-object tracking; DET: Detection; ReID: Re-identification; MOT: Multi-object tracking.
Electronics 14 01896 g001
Figure 2. Normal clustering.
Electronics 14 01896 g002
Figure 3. BEC clustering.
Electronics 14 01896 g003
Figure 4. Illustration of the information in the HST dataset.
Electronics 14 01896 g004
Figure 5. Failure cases and error visualizations. The box in the figure and the number in its upper left corner represent the target’s ID during tracking.
Electronics 14 01896 g005
Table 1. Publicly available datasets for image or video-based MTMCT.
NameCameraTypeLengthQuality
VeRi-77620image--
VechicleID2image--
PKU-VD1-image--
CityFlow40video195.03 min960p
LHTV16video1012.25 min1080p
HST (ours)6video182 min1080p
Table 2. Performance improvements due to the WCMSM with different backbones.
BackboneWCMSMIDF1↑ IDP↑IDR↑MOTA↑Runtime
IBN-densenet169 28.1830.0826.5157.7319.23250 s
IBN-densenet16932.0734.2430.1657.1719.43271 s
IBN-ResNet101 60.0666.2254.9557.8119.31444 s
IBN-ResNet10162.0268.3668.6357.7619.65857 s
ResNet50 68.9276.5262.6956.7919.44994 s
ResNet5072.9680.2466.8958.2019.58706 s
IBN-Se-ResNet101 70.1377.4464.0957.9319.10133 s
IBN-Se-ResNet10172.9280.3466.7558.2419.50410 s
IBN-ResNet101 + ResNet50 + IBN-Se-ResNet101 73.1780.7666.8858.3419.27957 s
IBN-ResNet101 + ResNet50 + IBN-Se-ResNet10173.6781.0967.5058.3819.46851 s
Table 3. Performance improvements due to BEC with different backbones.
BackboneBECIDF1↑ IDP↑IDR↑MOTA↑Runtime
IBN-densenet169 28.1830.0826.5157.7319.23250 s
IBN-densenet16929.0741.0822.4936.0717.73867 s
IBN-ResNet101 60.0666.2254.9557.8119.31444 s
IBN-ResNet10165.2064.4066.0253.8517.64590 s
ResNet50 68.9276.5262.6956.7919.44994 s
ResNet5070.4277.5464.4957.9817.59759 s
IBN-Se-ResNet101 70.1377.4464.0957.9319.10133 s
IBN-Se-ResNet10172.4679.9866.2358.2717.69054 s
IBN-ResNet101 + ResNet50 + IBN-Se-ResNet101 73.1780.7666.8858.3419.27957 s
IBN-ResNet101 + ResNet50 + IBN-Se-ResNet10174.2481.9067.8958.2517.71640 s
Table 4. Results of ablation experiments.
YOLOv8BotSortWCMSMBECIDF1↑IDP↑IDR↑MOTA↑
68.9276.5262.6956.79
70.4277.5464.4957.98
71.2678.4465.2958.31
Table 5. Comparison of MTMCT results on HST.
MethodIDF1↑IDP↑IDR↑MOTA↑
NCCU  [33]43.3862.0533.3512.99
ELECTRICITY [2]56.2373.2445.6335.16
DyGlip [43]66.7573.6961.0155.75
MCMT [23]62.8666.4259.6638.56
TAG [25]60.9671.6053.0850.41
WCBE (Ours)71.2678.4465.2958.31
Table 6. Comparison of MTMCT results on CityFlow.
MethodIDF1↑IDP↑IDR↑
NCCU [33]45.9748.9143.35
ELECTRICITY [2]53.1254.7851.46
DyGlip [43]64.9059.5671.25
MCMT [23]64.7452.3084.96
TAG [25]67.2254.3987.97
WCBE (Ours)62.9053.1876.98
Disclaimer/Publisher’s Note: The statements, opinions and data contained in all publications are solely those of the individual author(s) and contributor(s) and not of MDPI and/or the editor(s). MDPI and/or the editor(s) disclaim responsibility for any injury to people or property resulting from any ideas, methods, instructions or products referred to in the content.

