Article

Toward Real-Time Posture Classification: Reality Check

1
Mechatronics Engineering, Middle Tennessee State University, Murfreesboro, TN 37132, USA
2
Department of Computer Science, Virginia Tech, Blacksburg, VA 24061, USA
3
Department of Precision Mechanical Engineering, Shanghai University, Shanghai 200444, China
4
Noblis, Reston, VA 20191, USA
5
Tennessee STEM Education Center, Middle Tennessee State University, Murfreesboro, TN 37132, USA
*
Author to whom correspondence should be addressed.
Electronics 2025, 14(9), 1876; https://doi.org/10.3390/electronics14091876
Submission received: 24 March 2025 / Revised: 28 April 2025 / Accepted: 28 April 2025 / Published: 5 May 2025
(This article belongs to the Special Issue Real-Time Computer Vision)

Abstract

:
Fall prevention has always been a crucial topic for injury prevention. Research shows that real-time posture monitoring and subsequent fall prevention are important for the prevention of fall-related injuries. In this research, we determine a real-time posture classifier by comparing classical and deep machine learning classifiers in terms of their accuracy and robustness for posture classification. For this, multiple classical classifiers, including classical machine learning, support vector machine, random forest, neural network, and Adaboost methods, were used. Deep learning methods, including LSTM and transformer, were used for posture classification. In the experiment, joint data were obtained using an RGBD camera. The results show that classical machine learning posture classifier accuracy was between 75% and 99%, demonstrating that the use of classical machine learning classification alone is sufficient for real-time posture classification even with missing joints or added noise. The deep learning method LSTM was also effective in classifying the postures with high accuracy, despite incurring a significant computational overhead cost, thus compromising the real-time posture classification performance. The research thus shows that classical machine learning methods are worthy of our attention, at least, to consider for reuse or reinvention, especially for real-time posture classification tasks. The insight of using a classical posture classifier for large-scale human posture classification is also given through this research.

1. Introduction

Real-time posture classification is important and has strong implications for fall prevention, which poses significant risks to human health and safety. The human gait is inherently unstable. An unstable human gait is attributed to the bipedal nature of the gait, where the human body is analogous mechanically to an inverted pendulum, which is unstable and tends to fall without proper musculoskeletal control strategies [1,2,3]. Such an unstable gait structure would lead to significant risks to human health. Specifically, slips and falls are major hazards to human health. Falls are the leading cause of emergency room visits (21.3%) [4] and account for over 800,000 hospital emergency visits a year. Among them, 5% of falls lead to bone fractures and subsequently decreased quality of life [4]. Automatic posture classification can help detect falls, thus preventing fall-related injuries [5]. Qualitative posture information provides limited semantic information, making it less useful for fall prevention [6,7]. Quantitative posture classification offers an unprecedented opportunity to classify human posture and is thus crucial for fall prevention. The use of classical machine learning is known to be successful for posture classification. Traditionally, human posture classification relies on participants wearing light reflective markers on motion tracking suits. The light reflective markers are further tracked by cameras for obtaining the spatial position of the joints of humans. The method involving reflective markers, while effective and accurate, is cumbersome to setup and use in practice [8].
To overcome the challenges of using inconvenient reflective markers for a posture classification system, one effective measure for recognizing the properties of human gait and posture is to monitor human motion in real time with a computer-vision-centered approach. The marker-free computer-vision-centered approach is known to be able to automatically transform camera data into 3D joint positions, thus being extensively used for various tasks [9,10,11,12]. Among them, Qu has identified, measured, and contrasted differences between subjects with high and low fall risk [9]. Similarly, Jia has trained a computer vision system to identify muscle force [10]. On the other hand, Dubois was able to track step duration, step length, and gait speed variables without body markers by using an existing computer vision system to recognize joint positions [11]. Similarly, Kaenchan used a similar system with multiple cameras to determine if a subject’s movement was balanced [12].
The computer-vision-centered posture classification approach has involved the use of a single or multiple cameras for posture classification [13]. The benefits of using multiple cameras is that the occlusion is minimized through the process, thus offering an occlusion-free posture classification environment. Studies have also used surveillance cameras for monitoring the elderly in home environments by classifying standing, sitting, bending/squatting, side-lying, and lying postures [14]. The challenge of using multiple cameras for posture classification is that there is a significant amount of cost with respect to the hardware and data processing pipeline associated with such a system. For example, to analyze the large amount of data collected through the multi-camera system effectively, multiple stages of data analysis strategy were used to analyze the data for the classification of the posture [15]. To address the difficulties of employing large amounts of video camera feed data for posture classification, distributed learning was used to reduce the load of computation on each node to therefore achieve higher overall computation efficiency [16]. However, such a distributed computing paradigm has encountered significant difficulties for real-time posture classification, where only limited successes have been achieved [16]. To address the challenges of using multiple cameras for real-time posture classification, the use of a single camera has become more preferred for various human posture classification tasks. The examples of the work include gait cycle detection for slip and fall prevention [17], motion pattern quantification for Parkinson’s disease [18], foot posture detection [19], workspace fall prevention [20], athletic training [21], human metabolic rate determination [22], hand motion recognition [23], balance recovery training [24], shoe design [25], and senior health monitoring [26]. Previous studies suggest that Kinect sensors are accurate enough to evaluate human motion tasks [27,28,29,30,31,32,33]. It is known that the Kinect camera is able to precisely capture human motion [34]. Similarly, head motion estimation with the camera was found in high accuracy through the use of Kinect cameras [35,36]. Study has shown that Kinect cameras can be used to evaluate a wide range of work poses for ergonomics studies [37].
More recent posture classifiers tend to avoid the use of classical machine learning and have gradually converged to the use of deep learning methods to address the classification challenges frequently encountered in real scenes, such as cluttered backgrounds, occlusions, viewpoint variation, execution rate, and camera motion [38]. Deep learning is known able to offer high accuracy and robustness in posture classification. Examples of its applications include the measurement of upper extremity motion [39], human action recognition [40], a geometry-based learning strategy for action recognition [41], person identification [42], people counting (using a deep residual learning framework) [43], measurement of upper limb body functions [39], and study of cross-subject and cross-view recognition performance [44].
However, the real-time performance of deep learning in posture classification is still inferior and not able to meet the needs of real-world applications [45,46,47]. The notable most recent research includes AlphaPose [48], HumanBench [49], ViTPose++ [50], and WideHRNet [51]. Among all the works, they were able to achieve 39+ frames per second (FPS) processing on GPU computers, e.g., NVIDIA RTX 3090/4090. However, running on a CPU has been known to be extremely slow, which is able to run about 1–5 FPS depending on the performance of the CPU. Other more real-time oriented object recognition frameworks such as the Yolo series have been proposed. It is known that Yolo11-s has achieved 1120 FPS processing on GPUs for general object recognition [52,53]. However, Yolo11-s has behaved poorly on CPUs, which only can achieve 4.5 FPS performance for object recognition [52]. Similarly, running these frameworks on edge devices is also known to be difficult due to the limited size of the GPU on most edge devices. The root cause of the low efficiency of these methods is due to the lower efficiency of the convolution neural network or transformer network, which demands a significant amount of parallel GPU-based computation [54,55,56,57].
In addition to the disadvantages of computational inefficiency, deep learning methods also posses the disadvantages of requiring a large number of training and validation data. The scale of the data is frequently up to 1000 times larger than the data needed for conventional machine learning methods [58,59,60]. Similarly, compared to the LSTM method, the transformer-based model tends to require even larger training data [61]. With regard to the large language model, the training data requirement is even larger [62,63]. For example, GPT-3 training requires more than 45T data [64]. GPT-4 training requires even larger amounts of data, where 14 trillion tokens training data were used throughout the training process [65]. Similarly, 15 trillions tokens were required for training the Llama 3 model [66]. Such significant amounts of data have been causing significant issues for academic institutes to train meaningful and generalized large machine learning models.
In contrast to deep learning methods, classical machine learning methods such as support vector machines and random forests do not require expensive hardware for training and running. However, these classical methods often have lower accuracy compared to deep learning methods for high-dimensional data [67]. The Kinect camera data readily available in skeleton format are, however, relatively lower dimensional data and thus suitable for classical machine learning methods to analyze [44]. With this research motivation, it is thus important to study the gap regarding the accuracy between classical machine learning and deep learning methods in order to achieve real-time posture classification performance. Such a reality check is able to help us to identify the most suitable methods for real-time posture classification and its related applications.
Through this research, we aim to identify the best real-time posture classification methods. For this goal, computation-extensive methods such as AlphaPose, ViTPose++, Yolo11, and other variant deep learning posture classifiers are not an ideal choice, offering limited outputs of 0.5–5 FPS of posture recognition for CPU or edge-device-based computing [68,69,70,71,72,73,74,75,76]. The low computational efficiency of these deep learning methods has motivated us to rethink the classical machine learning methods for identifying the most efficient and accurate machine learning methods for real-time posture classification. Recent studies have shown that classical machine learning methods are indeed still important. For example, classical machine learning methods such as k-nearest neighbor are known to be effective in classifying postures accurately and efficiently [14]. Similar insight has been also gained through the recenter AI breakthrough of Deepseek-R1 [77]. Deepseek-R1 does not rely on complicated, resource and computation intensive learning approaches; rather, it has mostly relied on a simple reinforcement learning method, namely, the group relative policy optimization approach in the learning process [78]. Results, however, have shown that this computationally efficient method has made a significant breakthrough in AI research [79].
Therefore, goal of the research is to determine classical classifier accuracy, robustness, and speed and compare them with a lightweight deep learning method, The long short-term memory method (LSTM) was examined to validate the performance of the classical machine learning methods. To accomplish this goal, we have designed a posture classification experiment through the collection of human posture data, applying both classical machine learning and deep learning methods on the collected data, and compared the accuracy and speed of the methods. It is expected that this research can shine a light on identifying the real-time performance and accuracy of the these methods and contributing to the selection of the best method for real-time posture classification.

2. Methods

The overall procedure of the experiment started with collecting the image data using a Kinect V2 sensor (Microsoft, Inc., Redmond, WA, USA) for various postures. Subsequently, the data were annotated with joint positions, where the annotated data were subjected to three sets of experiments. In the first set of experiments, we compared the accuracy of different classical machine learning classifiers for the classification of the postures. In the second set of experiments, we tested the classifiers using partial joint information. For the verification of the impacts of noise on classification accuracy, random noise was added to the classification task. Different levels of noise were added to the experimental data to obtain the accuracy of the classifiers. In the third set of experiments, deep learning methods were applied to process the posture data. The performance of the classification of the posture was compared between classical machine learning and deep learning methods to obtain the contrastive differences between the two methods.

2.1. Data Collection Setup

Data collection was conducted in an indoor environment, but no particular indoor setting is required due to the accuracy of the Kinect V2 camera in posture recognition [12]. Figure 1 shows the joint centers (layered over the participant) connected by green lines, as provided by the Kinect V2 sensor SDK. The intermittent time interval between consecutive postures at a comfortable pace for participants was allowed in order to have the data properly recorded by the RGBD camera. It occurred that while collecting the posture data, some of the samples contained missing or redundant markers. To address the problem, these samples were removed manually by screening data prior to data processing.

2.2. Data Collection Procedure

Participants assumed various postures as well as posture transitions. Each participant performed four different postures. The age of the participants (5 in total) varied between 18 and 30. The Body Mass Index (BMI) ranged from 21 to 26. We assume that the gender of the participant has no effect because the RGBD camera (Kinect V2) is able to track males and females equally well [28,29,30,31,32,33]. For this reason, no gender balance was considered in our study. It is worth noting that the transitional video data were removed because they contain transitional motion such as participants coming into and leaving the experimental scenes. By removing such transitional motion, this will reduce the impacts of the these transitional scenes on the posture classification. The tasks required the completion of upper-body, lower-body, and whole-body movement postures. Each participant performed tasks in random order to remove the effects of orders for different postures. Table 1 contains the description of different postures and posture transitions. The data were collected under normal room environment with sufficient but not too strong nor too dark lighting conditions.
In total, we collected 10,000 trials of body motion. The decision for the sample size was made through considering the features of the data, including x , y , z coordinate values of the joints. With these features, it is known that support vector machine (SVM) requires 300 samples [80,81]. Gaussian naive Bayes method requires about 30 samples for posture classification [82]. Random forest requires about 500 samples for posture classification [83]. AdaBoost requires about 400 samples for posture classification [80]. Given the posture repetition duration and the features of the posture data, the LSTM deep learning method requires about 8000 samples for posture classification [84]. As such, the use of 10,000 posture trials is sufficient for both classical and LSTM deep learning classifiers assessed in this research.
The diversity of the postures was also carefully ensured through purposely asking participants to vary the postures throughout the data collection process. For example, through the leg raising and lowering motion, we asked participants to lower the leg on different levels of height to ensure the diversity of the dataset. Similarly, for the jumping posture, we have asked participants to jump at different levels of height from the ground to ensure the diversity of the data. For sit to stand posture, the straightness of the standing posture was also varied to ensure the diversity of the posture data. The upper-body bending posture was also varied to ensure the angle of upper-body bending to ensure the diversity of the bending motion of the upper body. Lastly, the upper-body turning posture was also varied to ensure that the turning angle of the upper body was varied, thus satisfying the diversity of the posture data.

2.3. Data Labeling

For data labeling purpose, we developed a customized data labeling GUI tool for labeling the posture data. The labeler labeled the images recorded by the recorder and outputted the labeled skeleton data. The skeleton data were subsequently used by the classifiers. The images labeled by the customized data labeler were transformed into 3D joint positions: ( x , y , z ) for the skeleton data. Specifically, the skeleton data include joint positions of the feet, ankles, knees, hips, spine, shoulder, elbows, wrists, and hands. Given that there is a left and right version of a joint such as the hands, both the left and right joint positions were treated separately. Each posture, already associated with a human labeled posture, was now also associated with the Kinect-generated joint coordinates. The labeled data were cross-checked by the labeler and advisor to ensure the accuracy of the labeling process for the inter- and intra-labeling accuracy and reliability.

2.4. Training

The classifiers were trained with joint coordinates as the input and types of postures as labels. The hyper-parameters of the different classifiers are shown in Table 2. The choices of the hyper-parameters in the table have been rigorously validated through our experiments to achieve the robustness of the training and inference while ensuring the simplicity of the classifiers for real-time posture classification performance. Driven by the uniform distribution of the classes in the training and testing data among multiple different posture classes, the train-and-test split ratio was set at 60% to 40%. In the first experiment, we ran the classical classifiers with no occlusions or noise. Our experiment shows that the use of 60% to 40% split test ratio offered similar performance of the five-fold cross-validation. This provides a baseline that shows how the classical classifiers perform under these hyper-parameter conditions.

2.4.1. Aggregate Impact of Noises and Missing Joints

We systematically validated the performance of the classical machine learning for posture classification to ensure its robustness in resisting attacks from noise and occlusions. In this set of three experiments, we determined if any classical classifiers were suitable. In the second experiment, we ran the classical classifiers with missing joint data. The classifiers only had access to the most relevant classifier data. For example, during lower-body motion such as leg raising, upper-body motion is limited. For this reason, we tested lower-body motion classifiers without upper-body joint data. The joints used for each type of motion are shown in Table 3. This enabled us to verify whether the classifier is robust to missing joint information. Together, these experiments determine if any of the classifiers involving classical machine learning are suitable for posture classification.

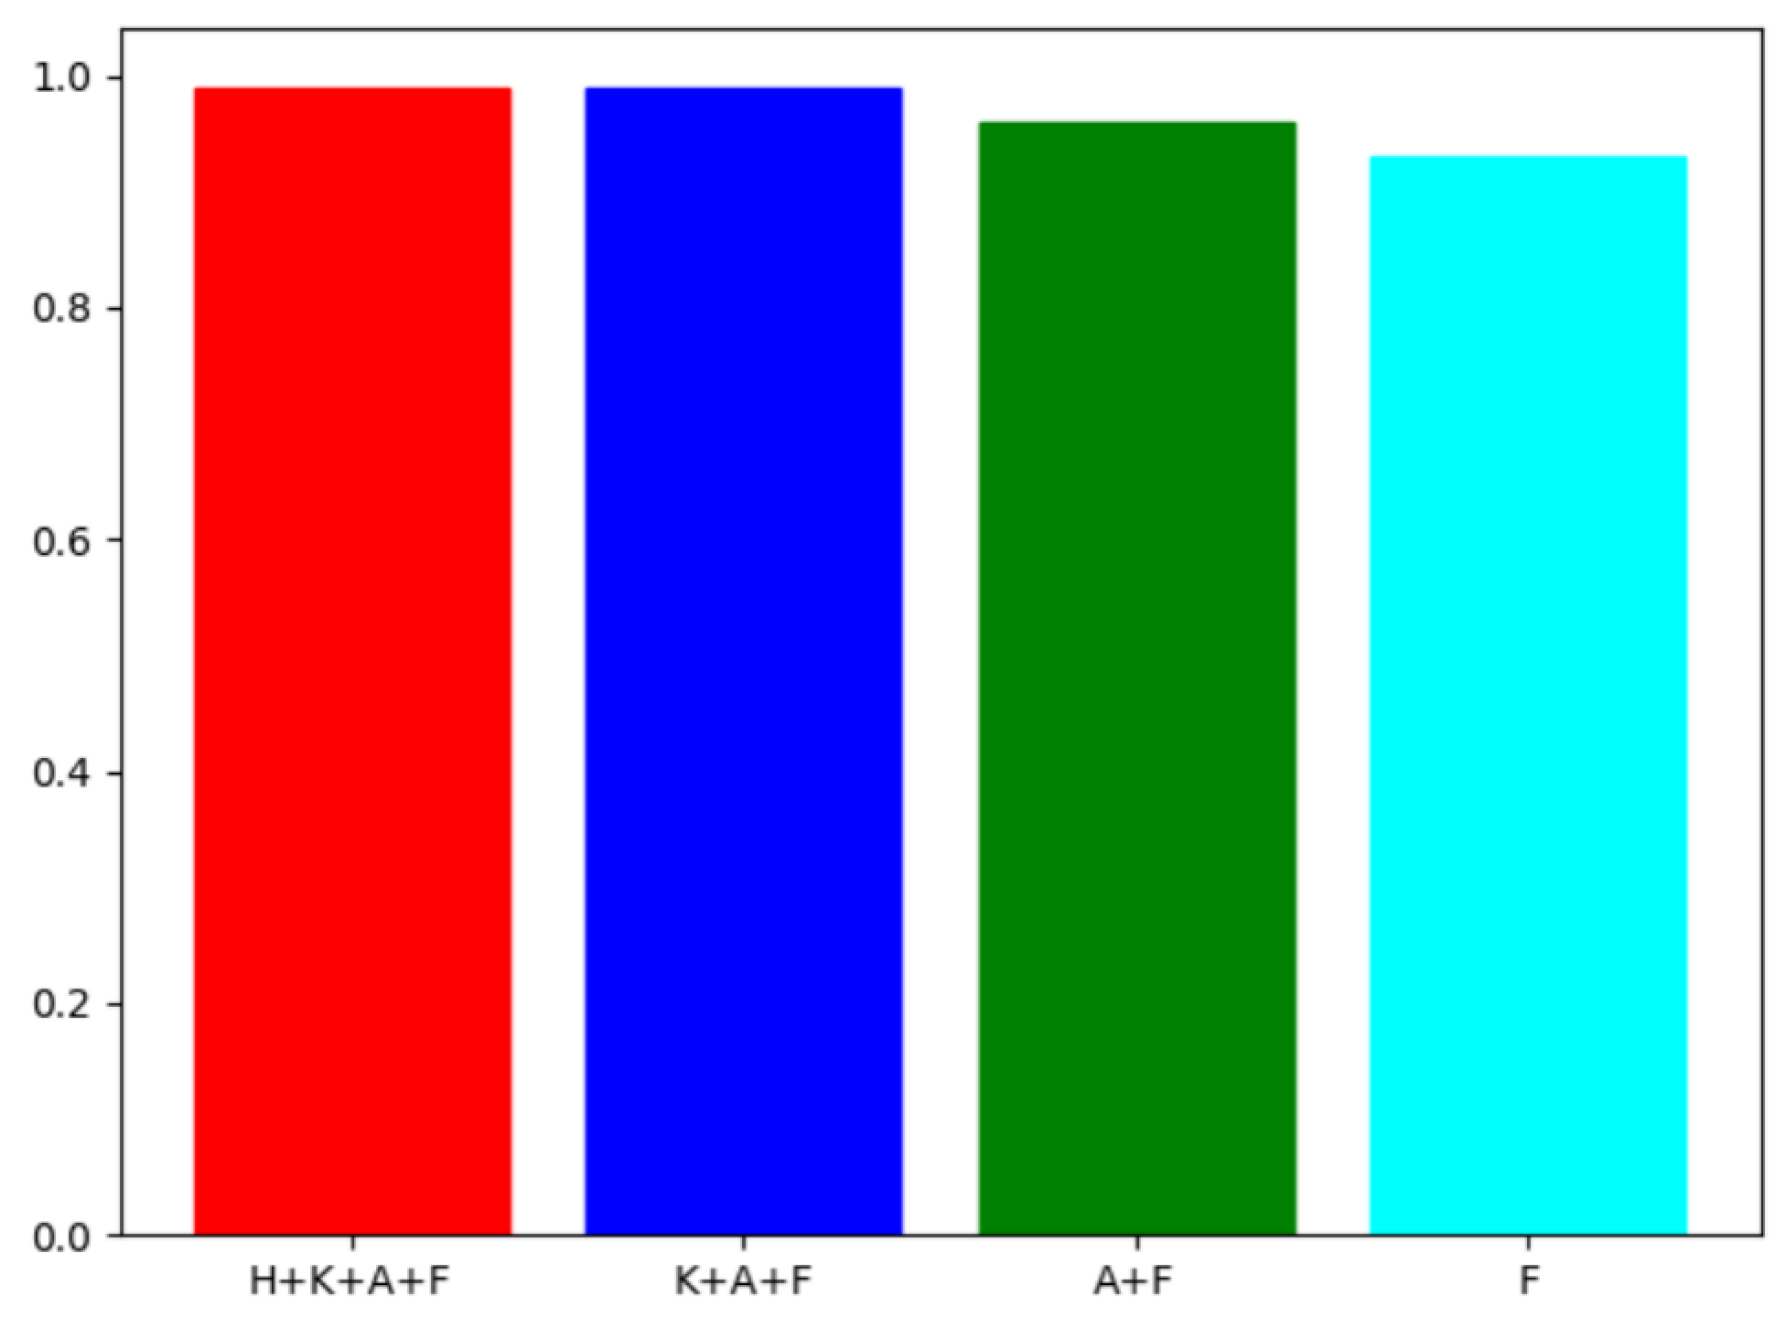
2.4.2. Gradual Impacts of Noises and Missing Joints

To better understand how noise and occlusions affect the performance of posture classifiers with classical machine learning, two experiments have been performed. In the first experiment, we measured classifier accuracy, for leg raising and lowering motion, with increasing noise. Random noise (zero or one) was applied to the data. Through this process, 6 different noise levels were used including 1.5/100, 4.5/100, 8/100, 15/100, 20/100, and 30/100.
In the second experiment, the impacts of the joints on the accuracy of the classifiers were measured. An example of such evaluation is shown in below. Using leg raising and lowering motion as an example, for the validation of the number of joints on classification performance, different numbers of joints involved in the training have been tested. Specifically, the classifier accuracy for several joint sets below has been measured for the validation of the number of joints on the classification of the leg raising and lowering motion:
  • Hip, knee, ankle, and foot joints;
  • Knee, ankle, and foot joints;
  • Ankle and foot joints;
  • Foot joints.
Through the validation of the combination of different joints to examine their impacts on the classification accuracy of body motion, these tests allow for the evaluation of the robustness of the classifier when the camera views are occluded. It means that even if a joint is occluded, the limited use of joint information for human body motion classification is still able to ensure the robustness of the model, which is crucial for the use of a single camera for real-time posture classification. To explore the benefits of camera occlusion, the use of the lowest number of joints for classification also enables the use of less data, thus improving the speed of training.

2.4.3. Comparison of Classical Machine Learning and Deep Learning

In the third experiment, the classification accuracy of the classical classifiers with missing joint data and added noise was examined. This experiment shows whether the classifiers are robust to noise in addition to occlusions. For any classical classifier to replace a deep learning method, the classical classifier must be nearly as accurate. To compare the effectiveness of the classical machine learning methods with deep learning, we implemented a deep learning classifier, a long short-term memory (LSTM) classifier [85], and compare its performance with the classical machine learning methods.
We implemented four experiments to compare the accuracy of the classical classifiers and the LSTM deep learning classifier. In the first experiment, we measured the accuracy of the LSTM method without noise or occlusions. In the second experiment, we ran the LSTM method with noise. In the third experiment, we ran the LSTM method with occlusions. In the fourth experiment, we compared the inference time of the LSTM method with the classical classifiers with and without GPU acceleration.

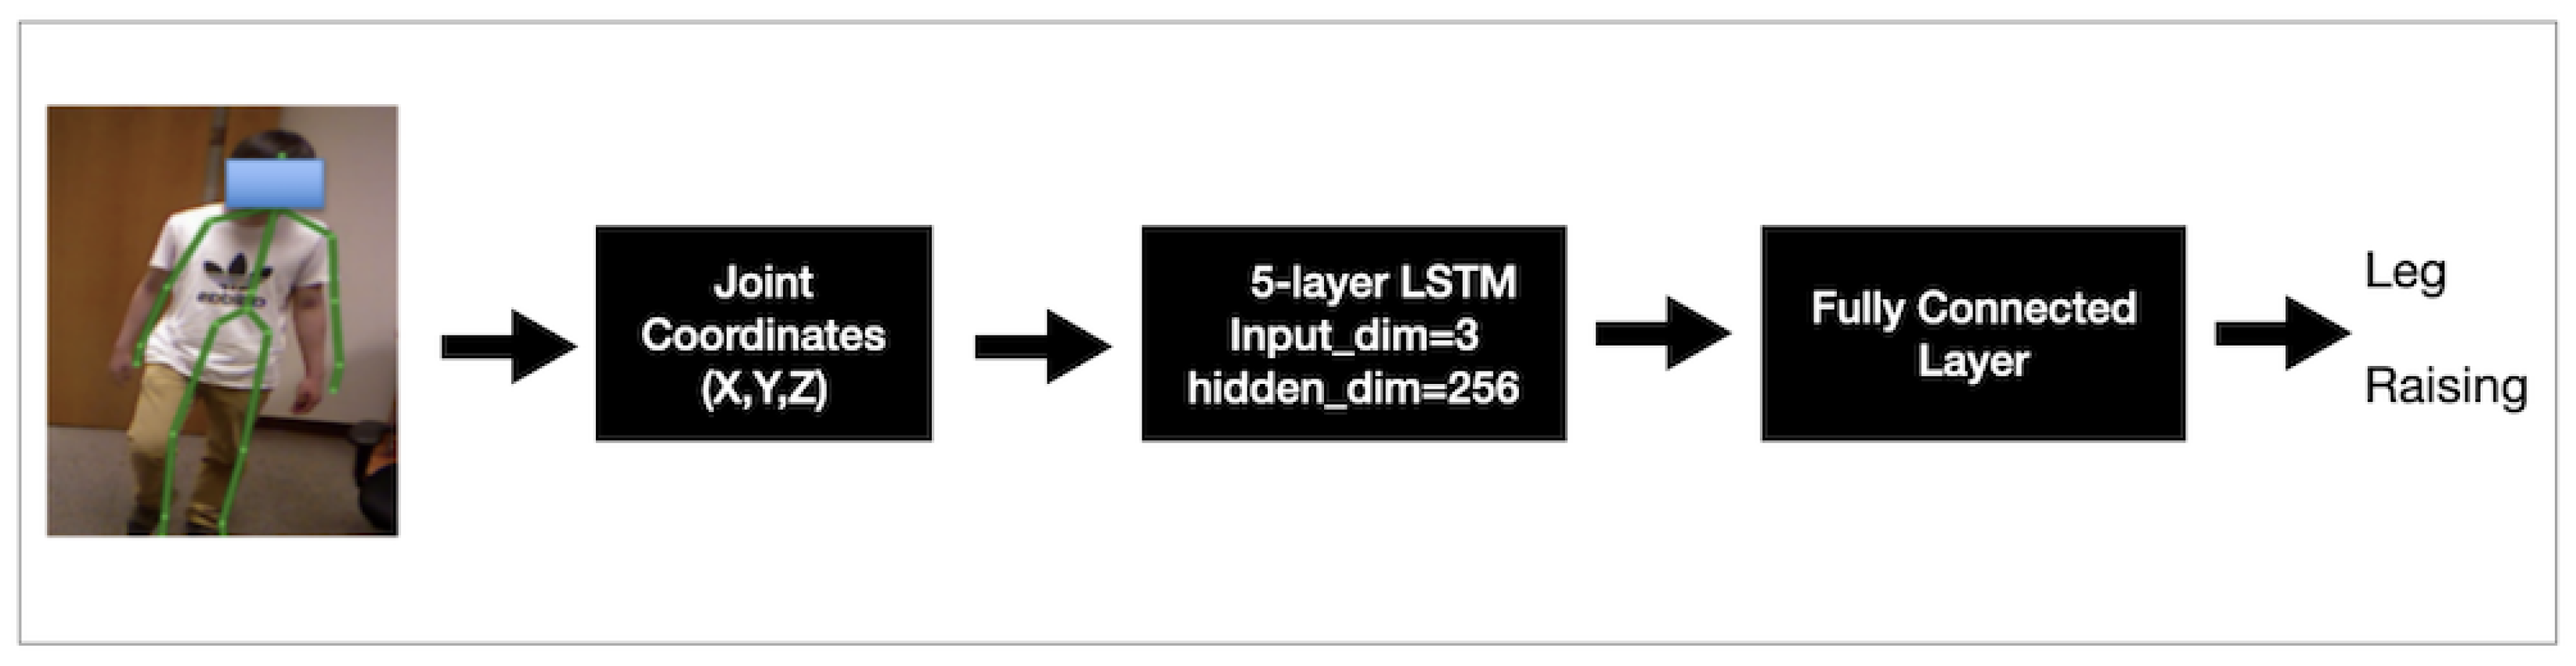
2.4.4. Deep Learning Classifier Details

To compare classical machine learning classifiers with a deep learning method, we implemented the LSTM deep learning classifier shown in Figure 2. The lightweight LSTM method contains five sequential layers of modules interconnected through the cell state. This is meant to achieve a long-term dependency cell state memorizing effects. The five layers of LSTM modules were further processed through fully connected layers as the output for classifying the posture. Within the LSTM method, cross-entropy was used as the loss function.
In order to avoid the overfitting of the classifiers and ensure that the loss function continuously decreased while the accuracy continuously improved, a cyclic learning rate was employed [86]. The cyclic learning rate refers to the fact that cyclic learning rate changes over time but is not simply monotonically decreasing. Through the LSTM implementation, we used the cos function. Experimentally, a cyclic learning rate is effective at keeping the loss function low and accuracy high. Through the cyclic learning, RMSprop optimizer was used as the optimizer. Different learning rates were leveraged to obtain the highest accuracy without overfitting. Experimental results show that the use of a learning rate of 0.0005 was able to offer the strongest performance with a training epoch of 5000. The smallest cyclic learning rate ranged from 0.0005/100 to 0.0005 such that it was able to achieve a robust and accurate learning schedule. Finally, we stopped the training early to avoid overfitting.

3. Results

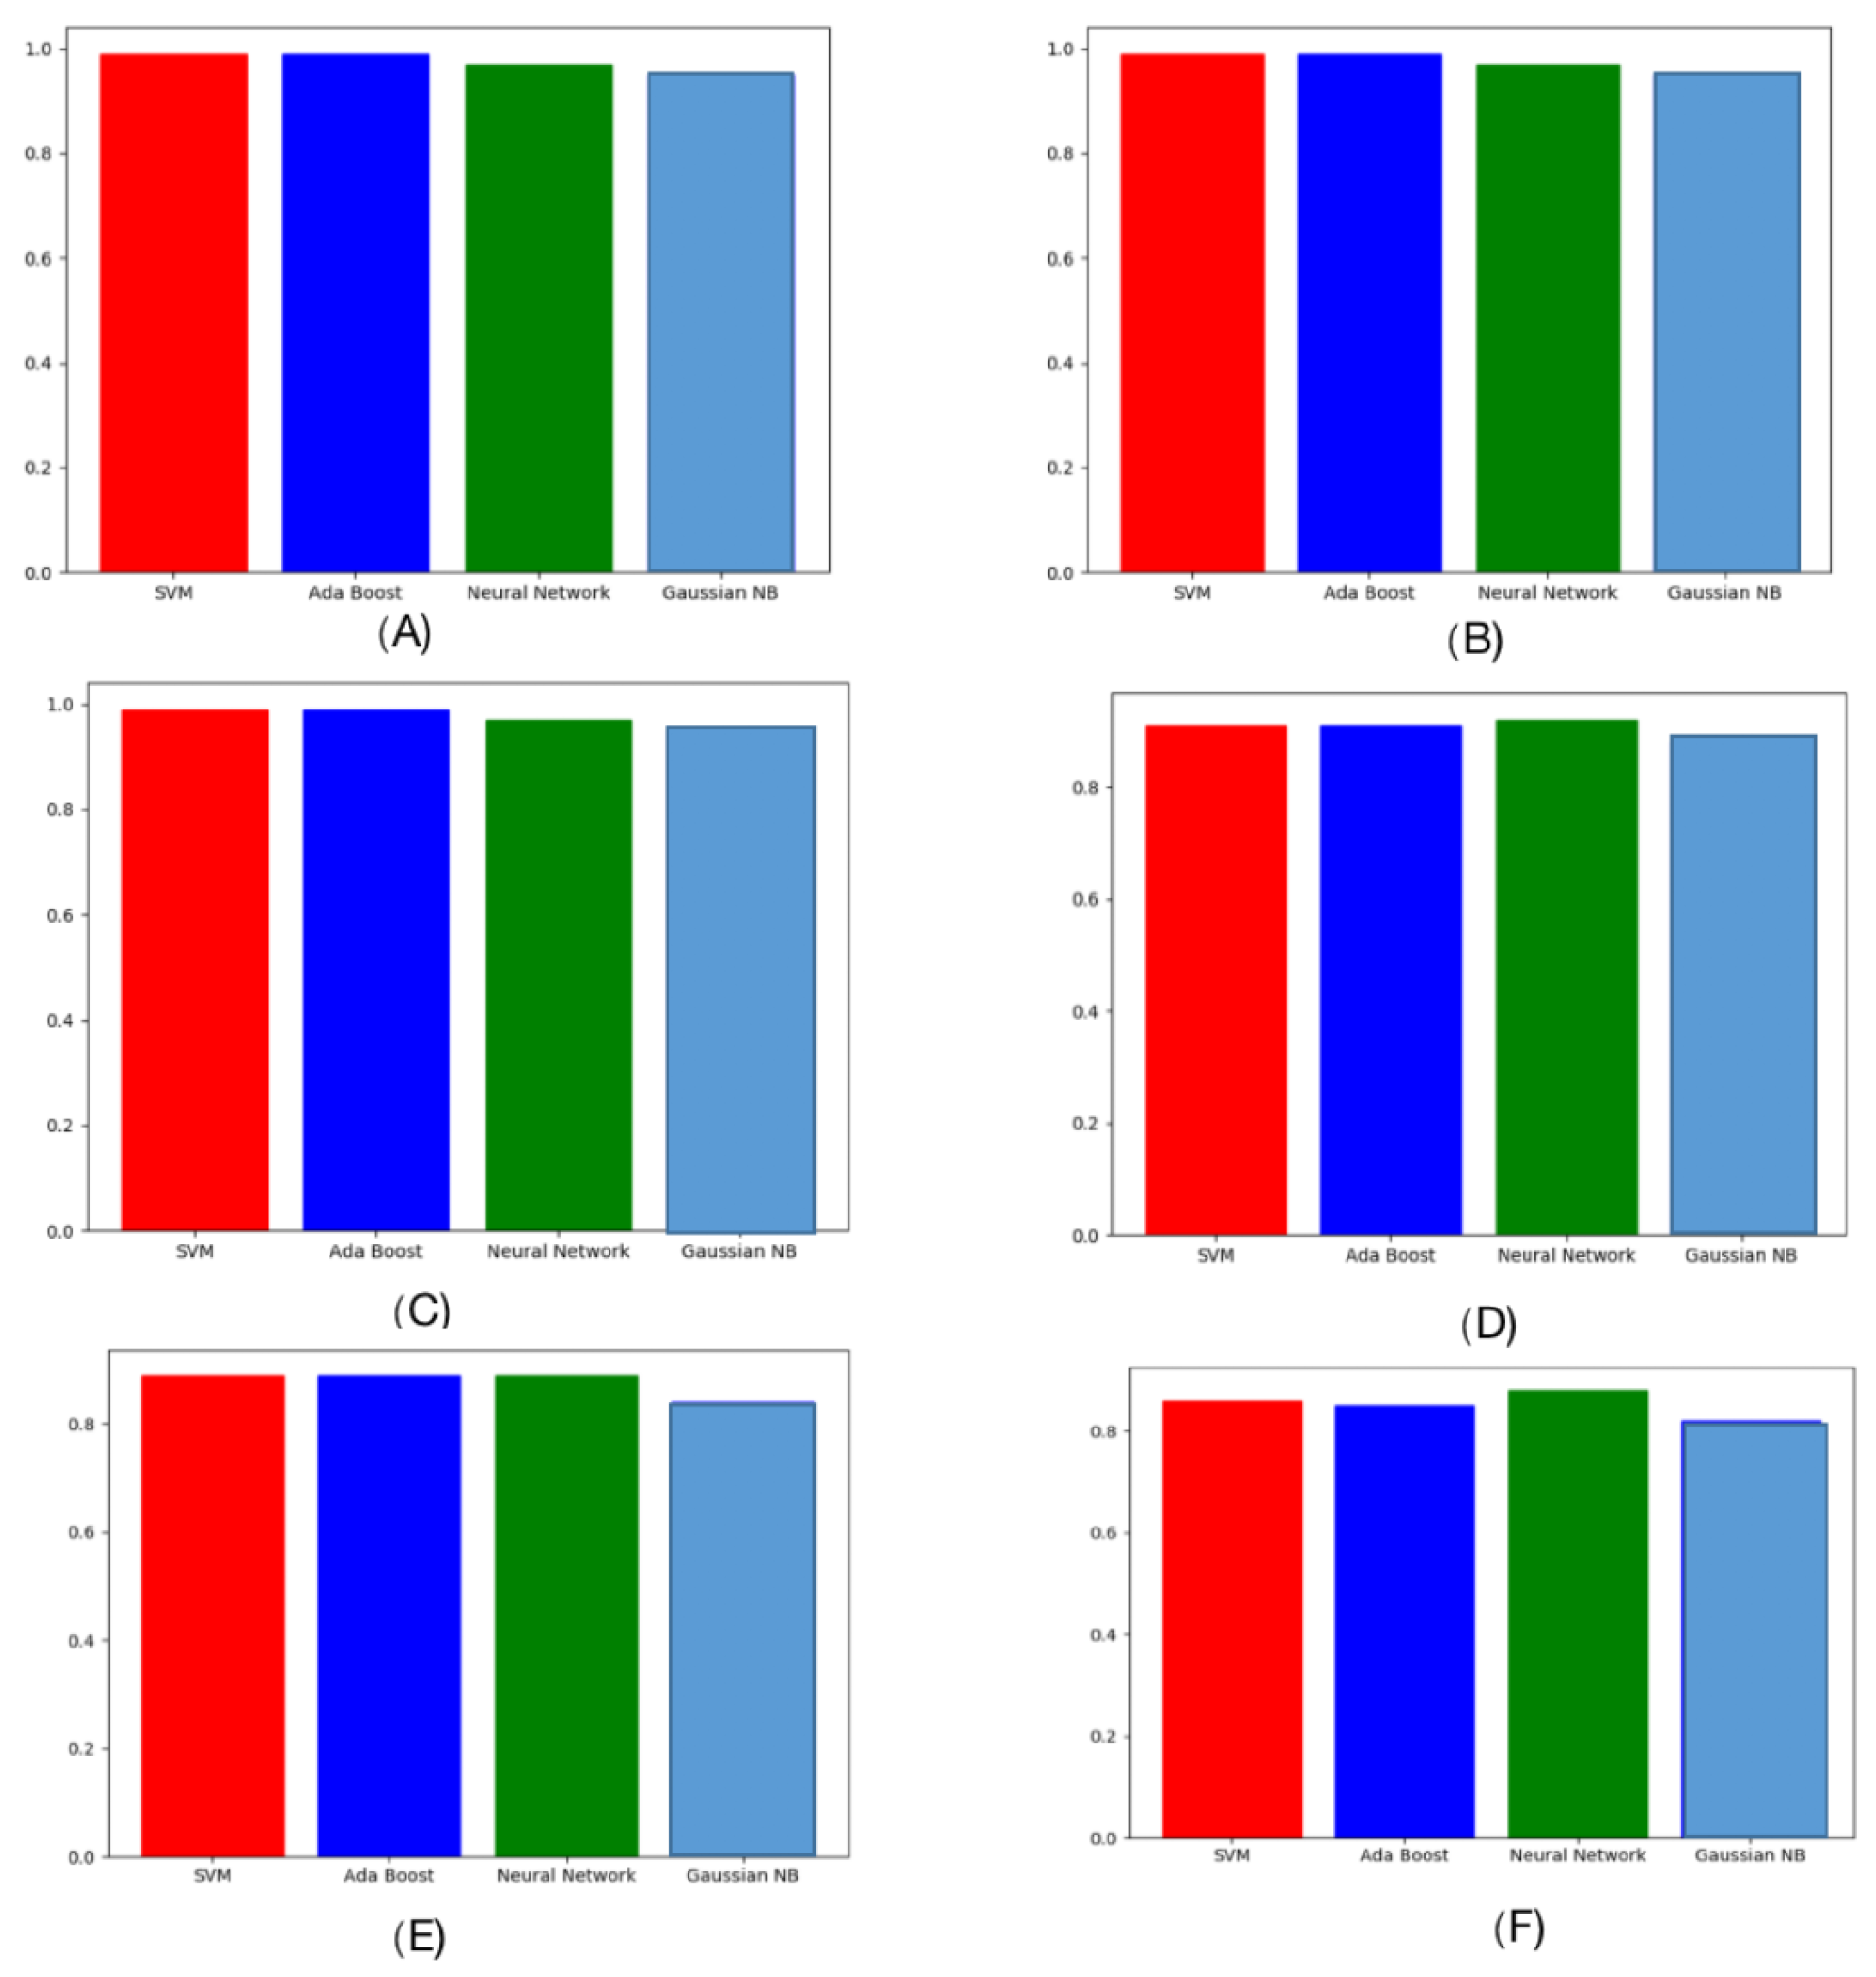
3.1. Aggregate the Impacts of Noise and Missing Joints

We measured the impacts of missing joints and noises on the classifiers’ accuracy results. The classifier accuracy result for each type of classifier and posture is shown in Figure 3 and Figure 4.
First, the results without noise or missing joints are shown in Figure 3. Gaussian NB and random forest achieved stable classification accuracy for all the different postures. Similarly, the neural network classifier achieved high accuracy. In contrast, Adaboost was relatively inaccurate. Figure 3 also shows how robust the classifiers were for the ignored joint positions. The results show that omitting unrelated joints did not decrease the classification accuracy significantly. With or without all joints, Adaboost and the neural network still had the same individual posture accuracy. For example, the leg raising motions always had the lowest accuracy for Adaboost. Gaussian NB, however, performed slightly better on leg raises. These classifiers were generally robust, even with missing joints.
As seen in Figure 4, we have validated the conditions with missing joints with random noise added. Consistent with the results without noise, Adaboost was less accurate than the other methods. With noise, Adaboost and the neural network were both less accurate. Specifically, random forest and SVM had the strongest resistance to noise. Following adding the noise, their classification accuracy results showed no significant drops. These results show that the classical machine learning classifiers are robust to missing joints and noise.

Gradual Impact of Noise and Missing Joints

Without adding noise or removing joints, the baseline of the accuracy of the classical machine learning is shown in Figure 3. It shows the accuracy results of the classical machine learning methods for the five different postures.
After adding noise to the posture data, the impacts of the gradual increases in noise and gradual removal of joints on the classification accuracy results are shown. The impacts of different noise levels on the classification accuracy results, for leg raising and lowering, is shown in Figure 5. It shows that the classification accuracy dropped more significantly for noise levels greater than 15/100. However, the accuracy results did not decrease for noise levels less than 8/100.
The impacts of reducing the joint subset size are recorded in Figure 6 and Figure 7. To demonstrate this, the leg raising and lowering motion was used as an example, as shown in Table 3. The number of joints gradually decreased, and we examined the decline of the classification accuracy.
The results show that reducing the number of joints involved in classification did reduce the classification accuracy, but the reduction was not significant until the joints were reduced to only ankles and feet. With only feet, the classification accuracy was still greater than 80%. This indicates that the classical machine learning algorithms are robust. Throughout the tests, the support vector machine, Adaboost, and neural network classifiers showed better accuracy than Gaussian NB to resist the reduction of joints.

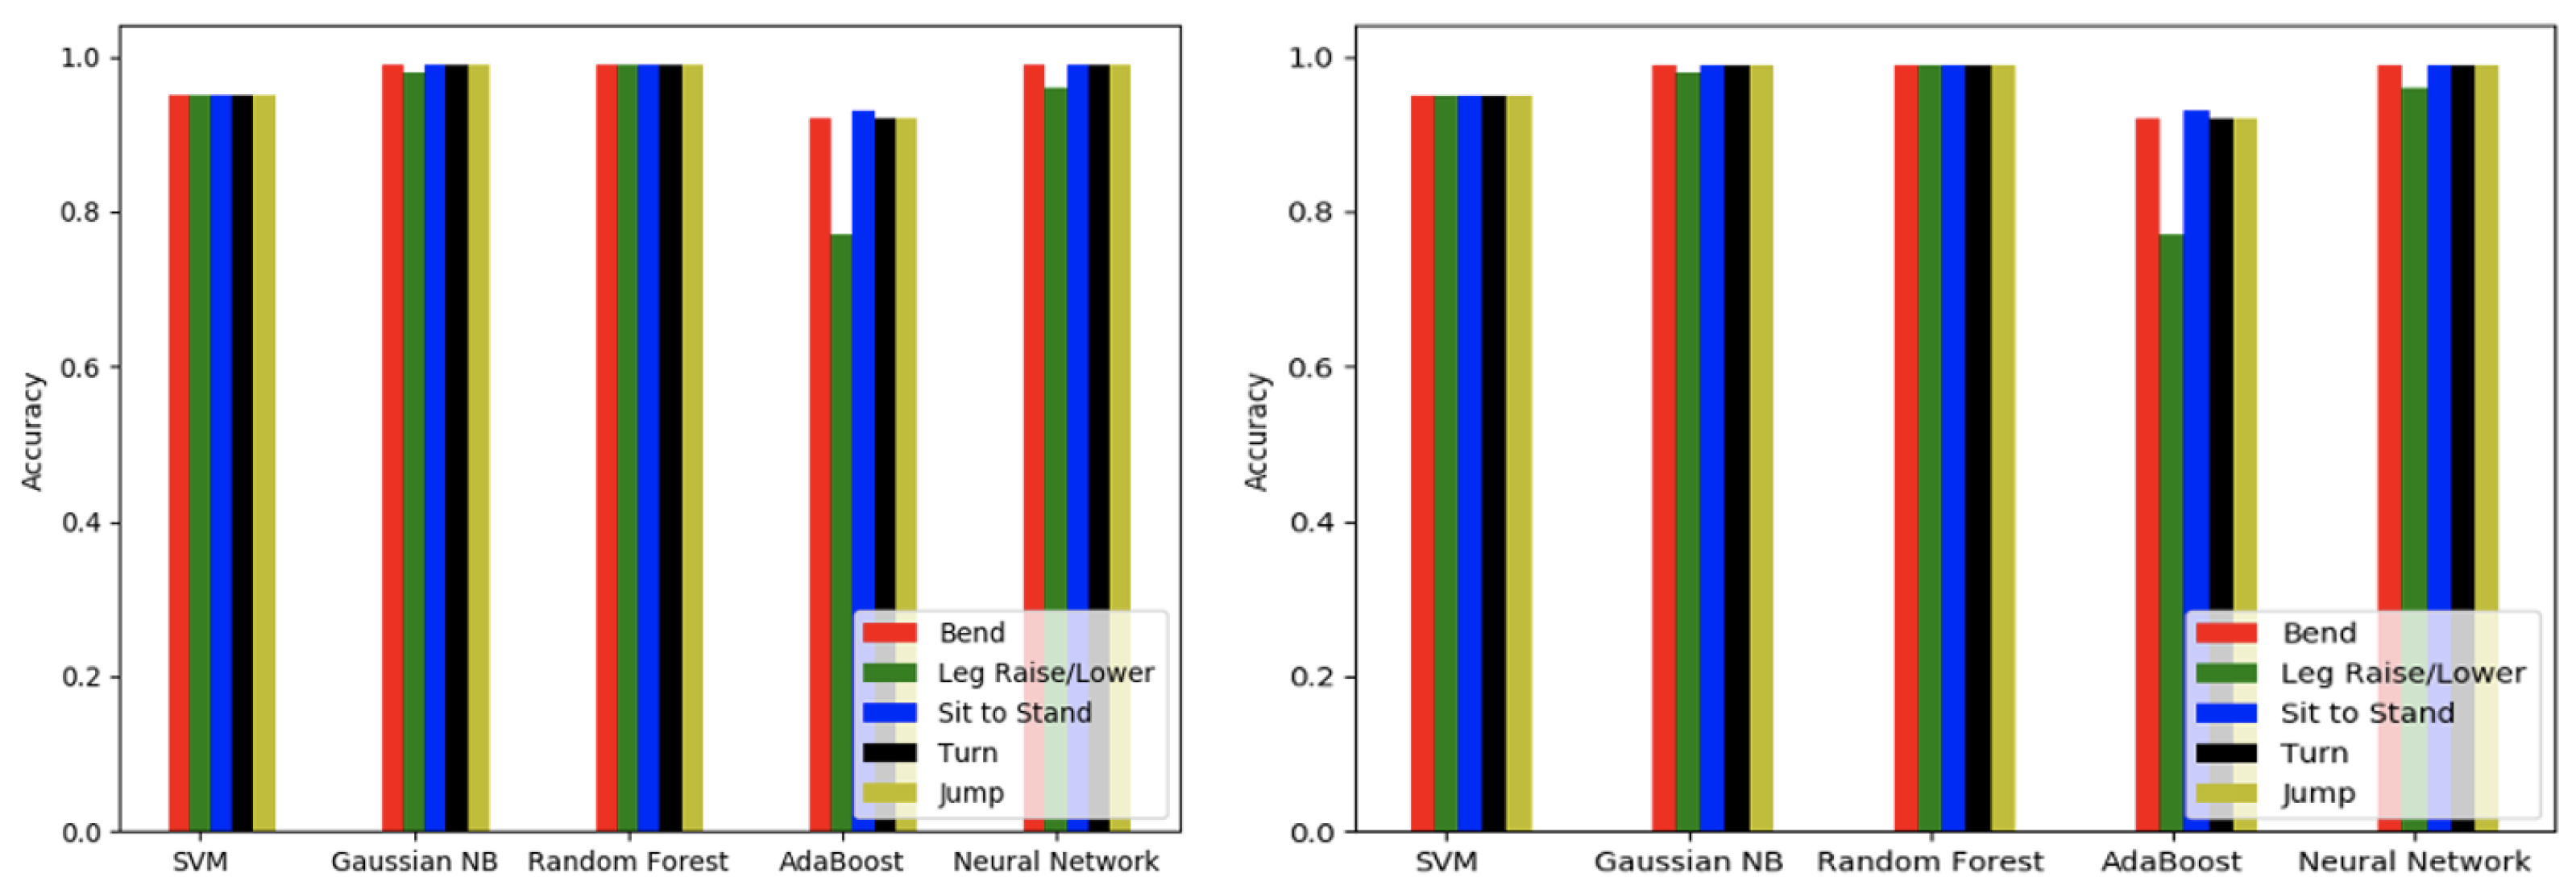
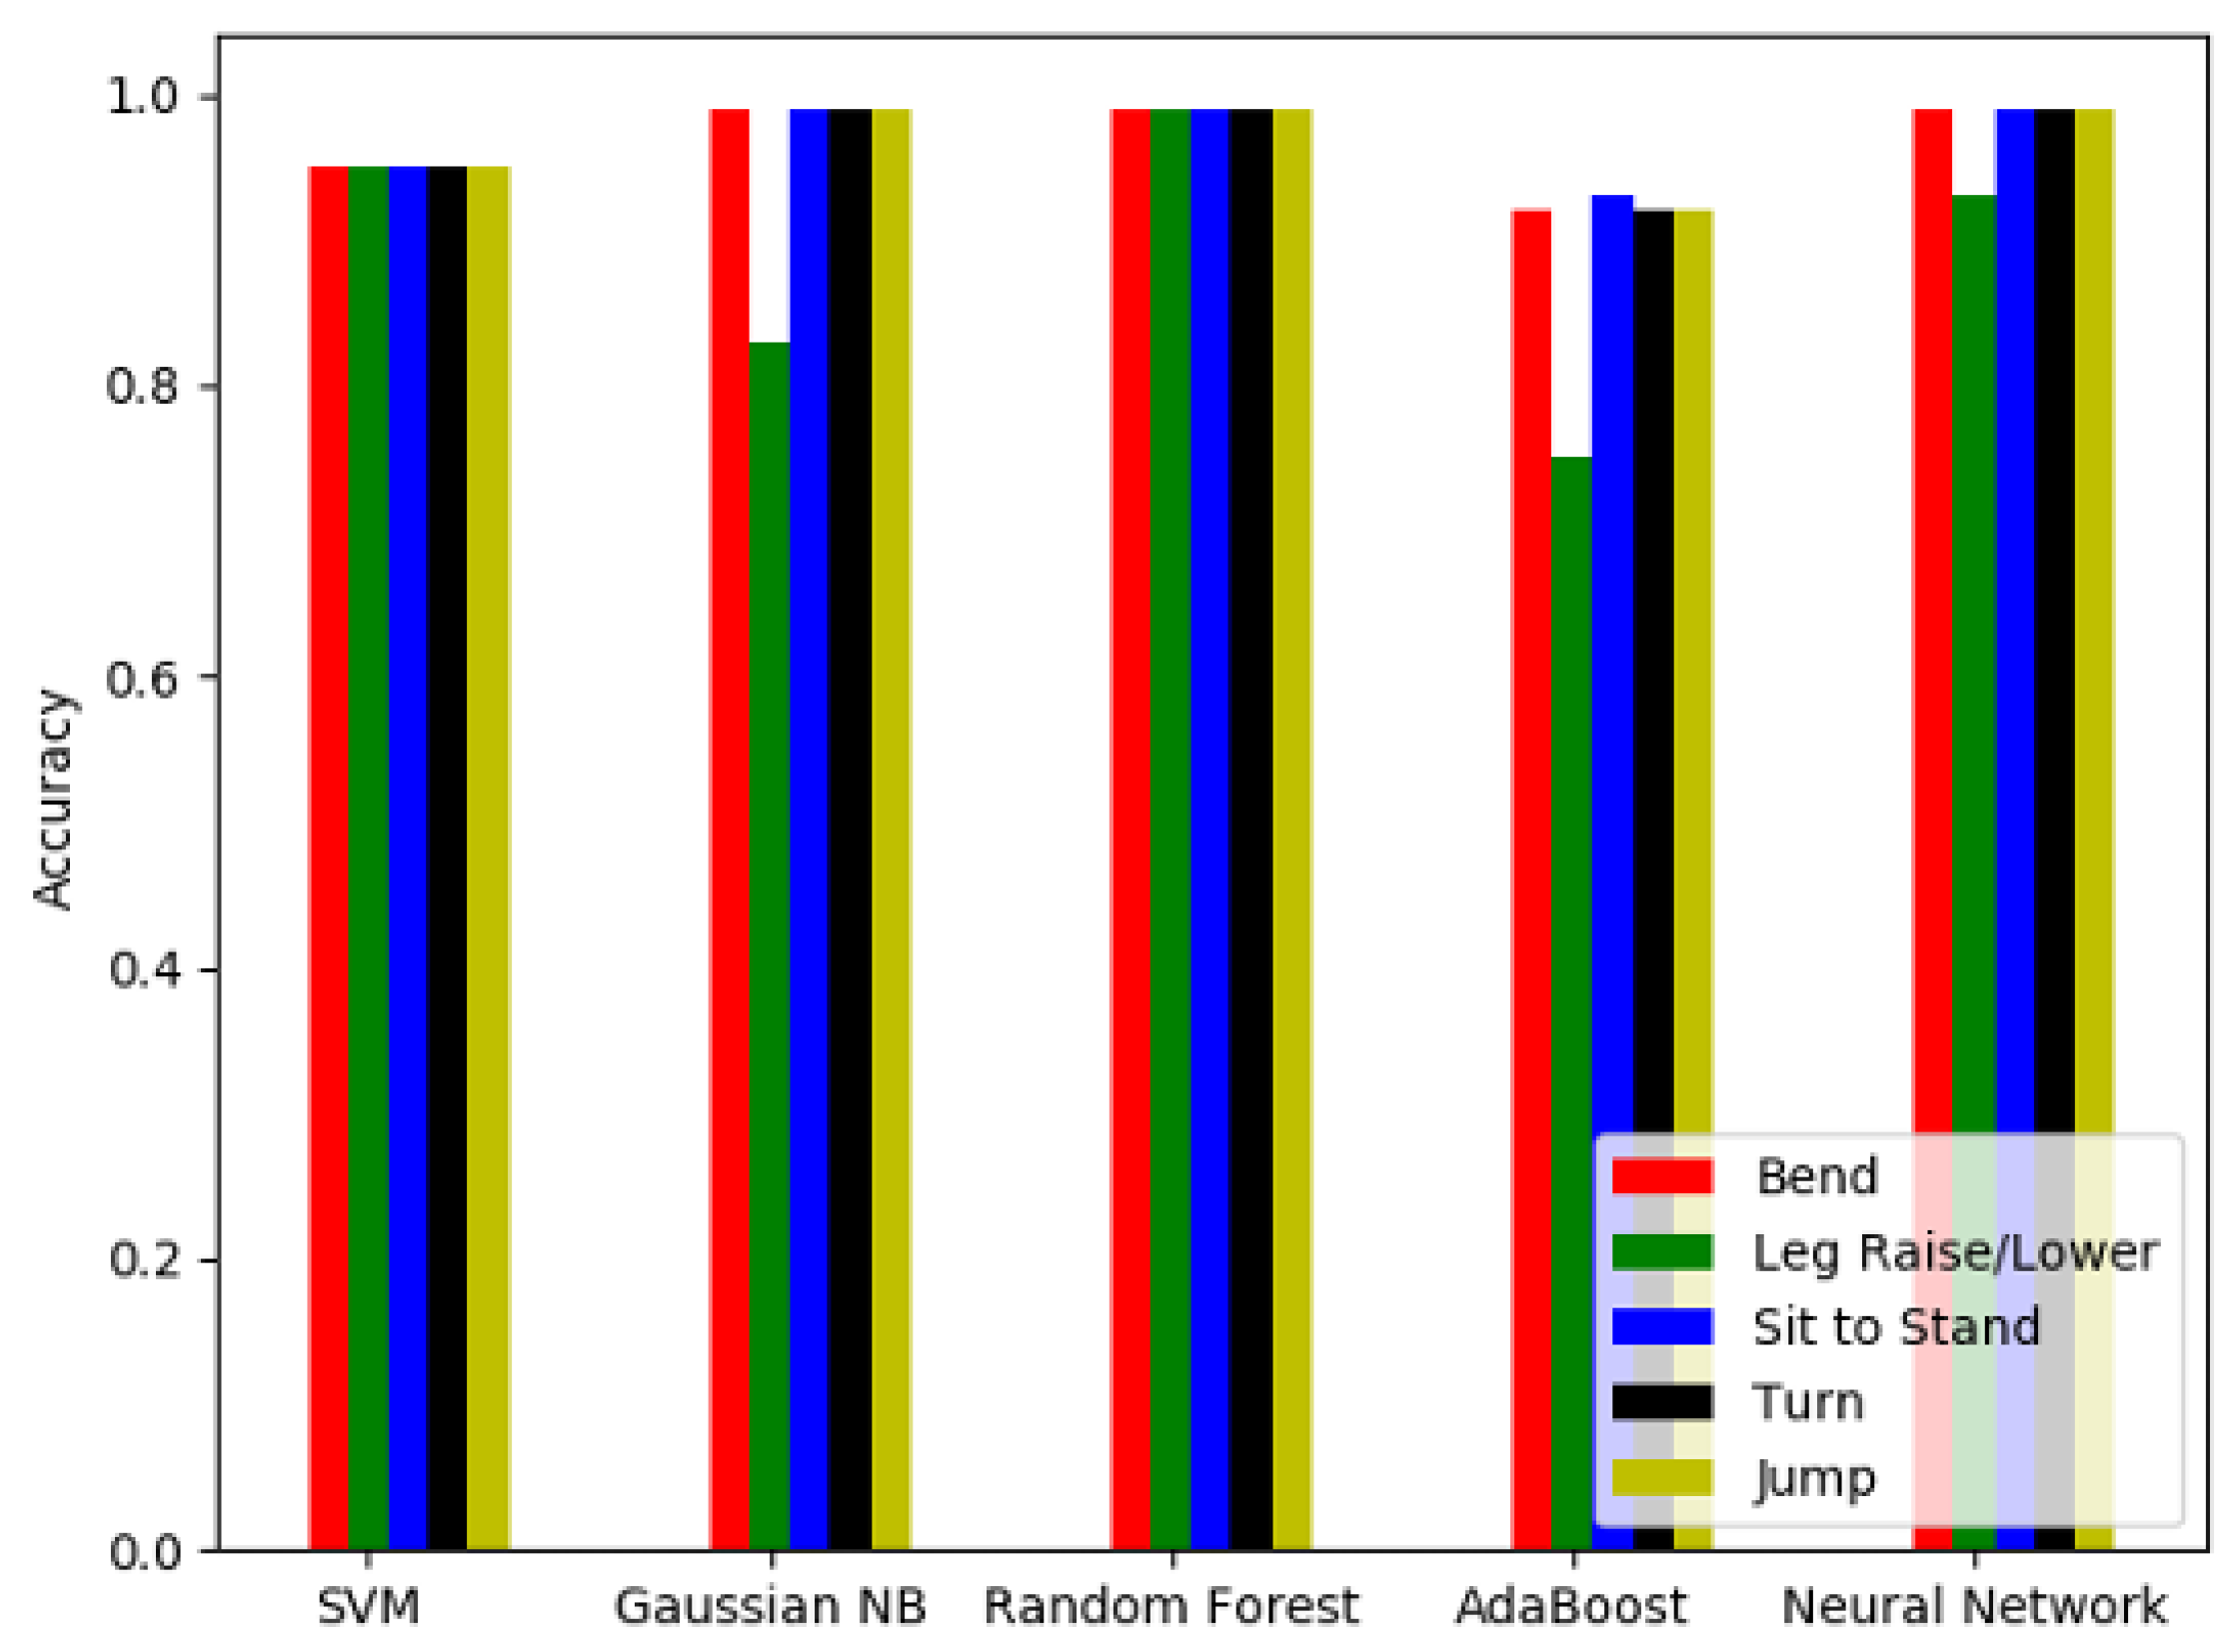
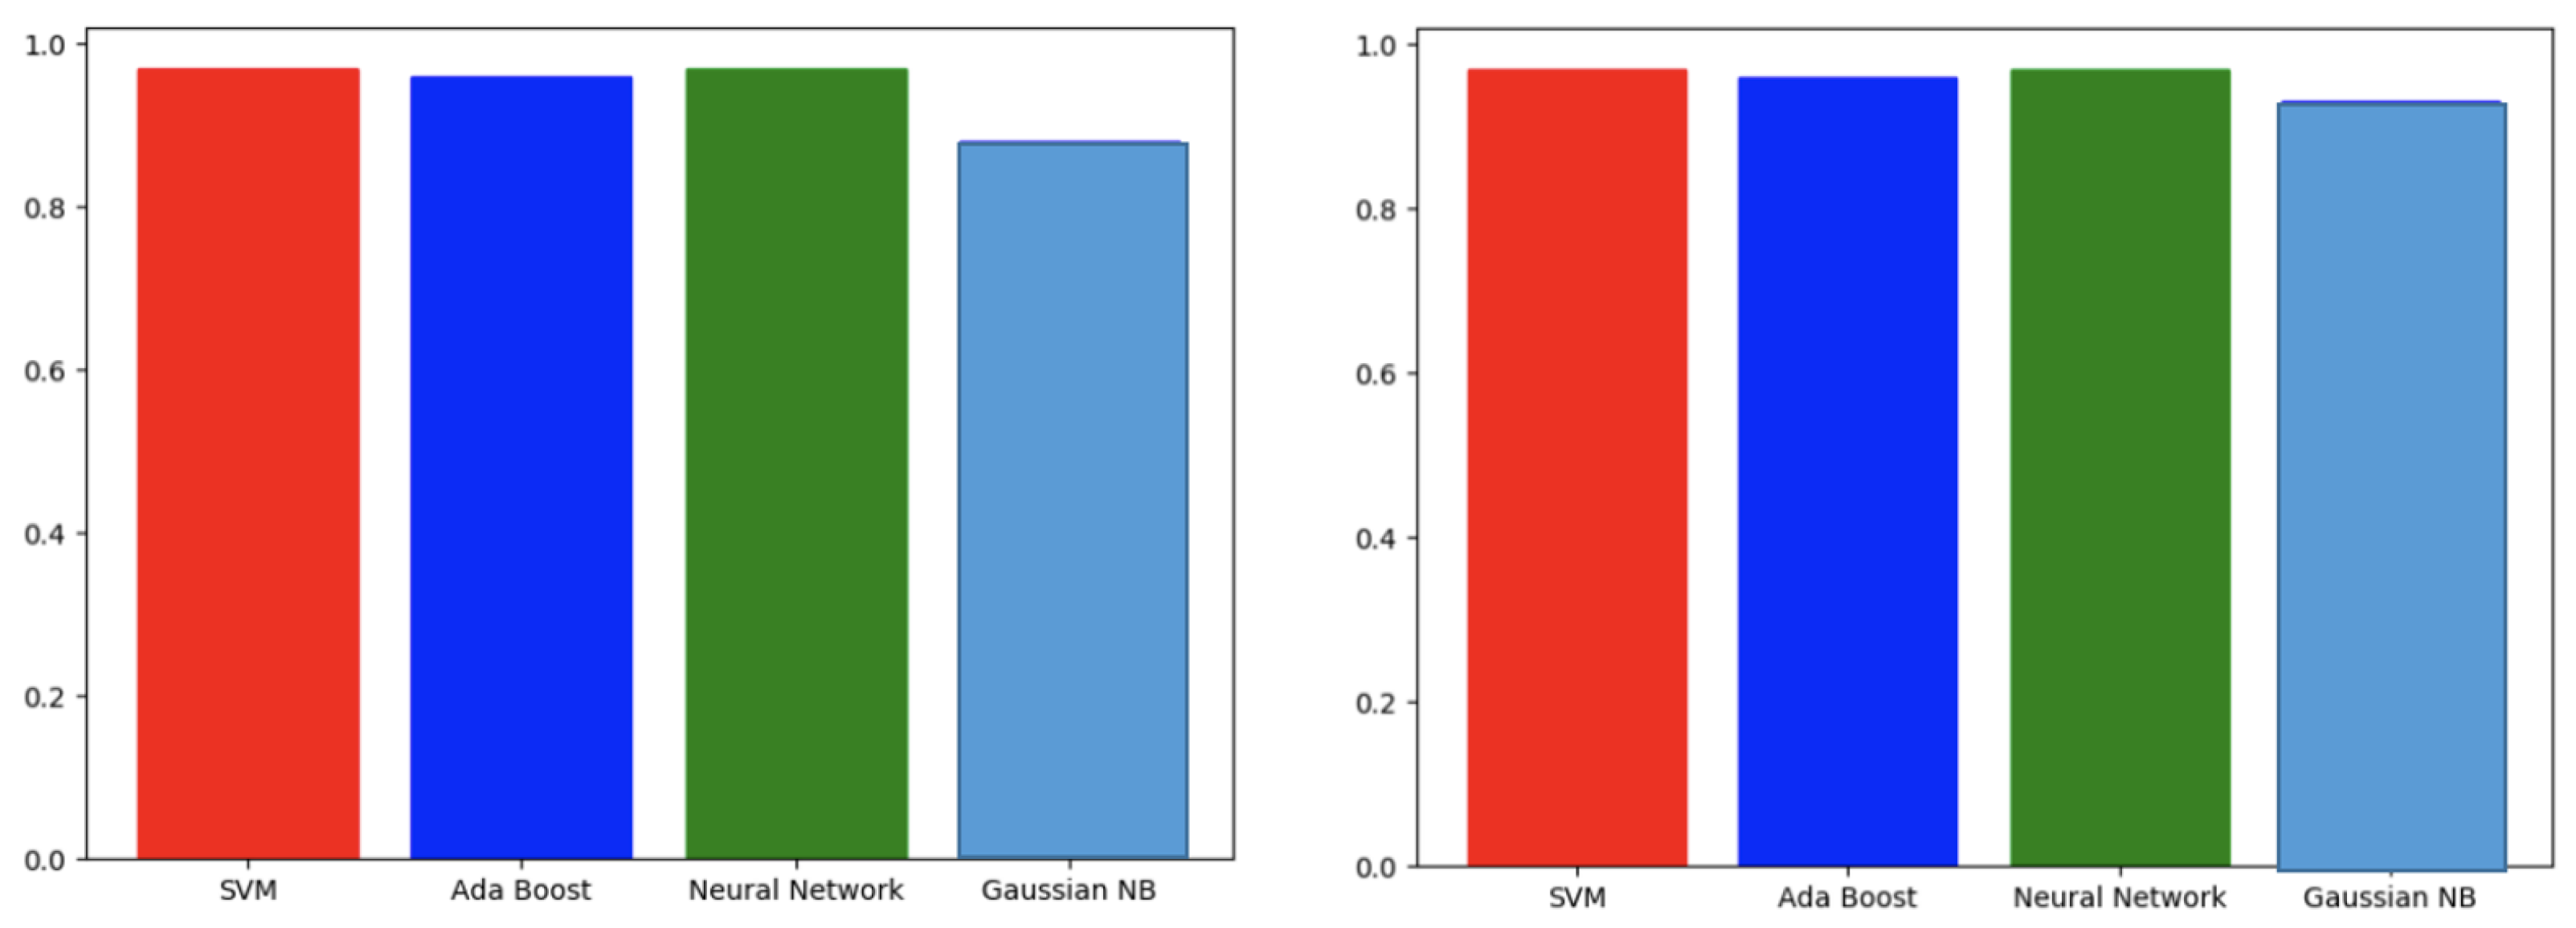
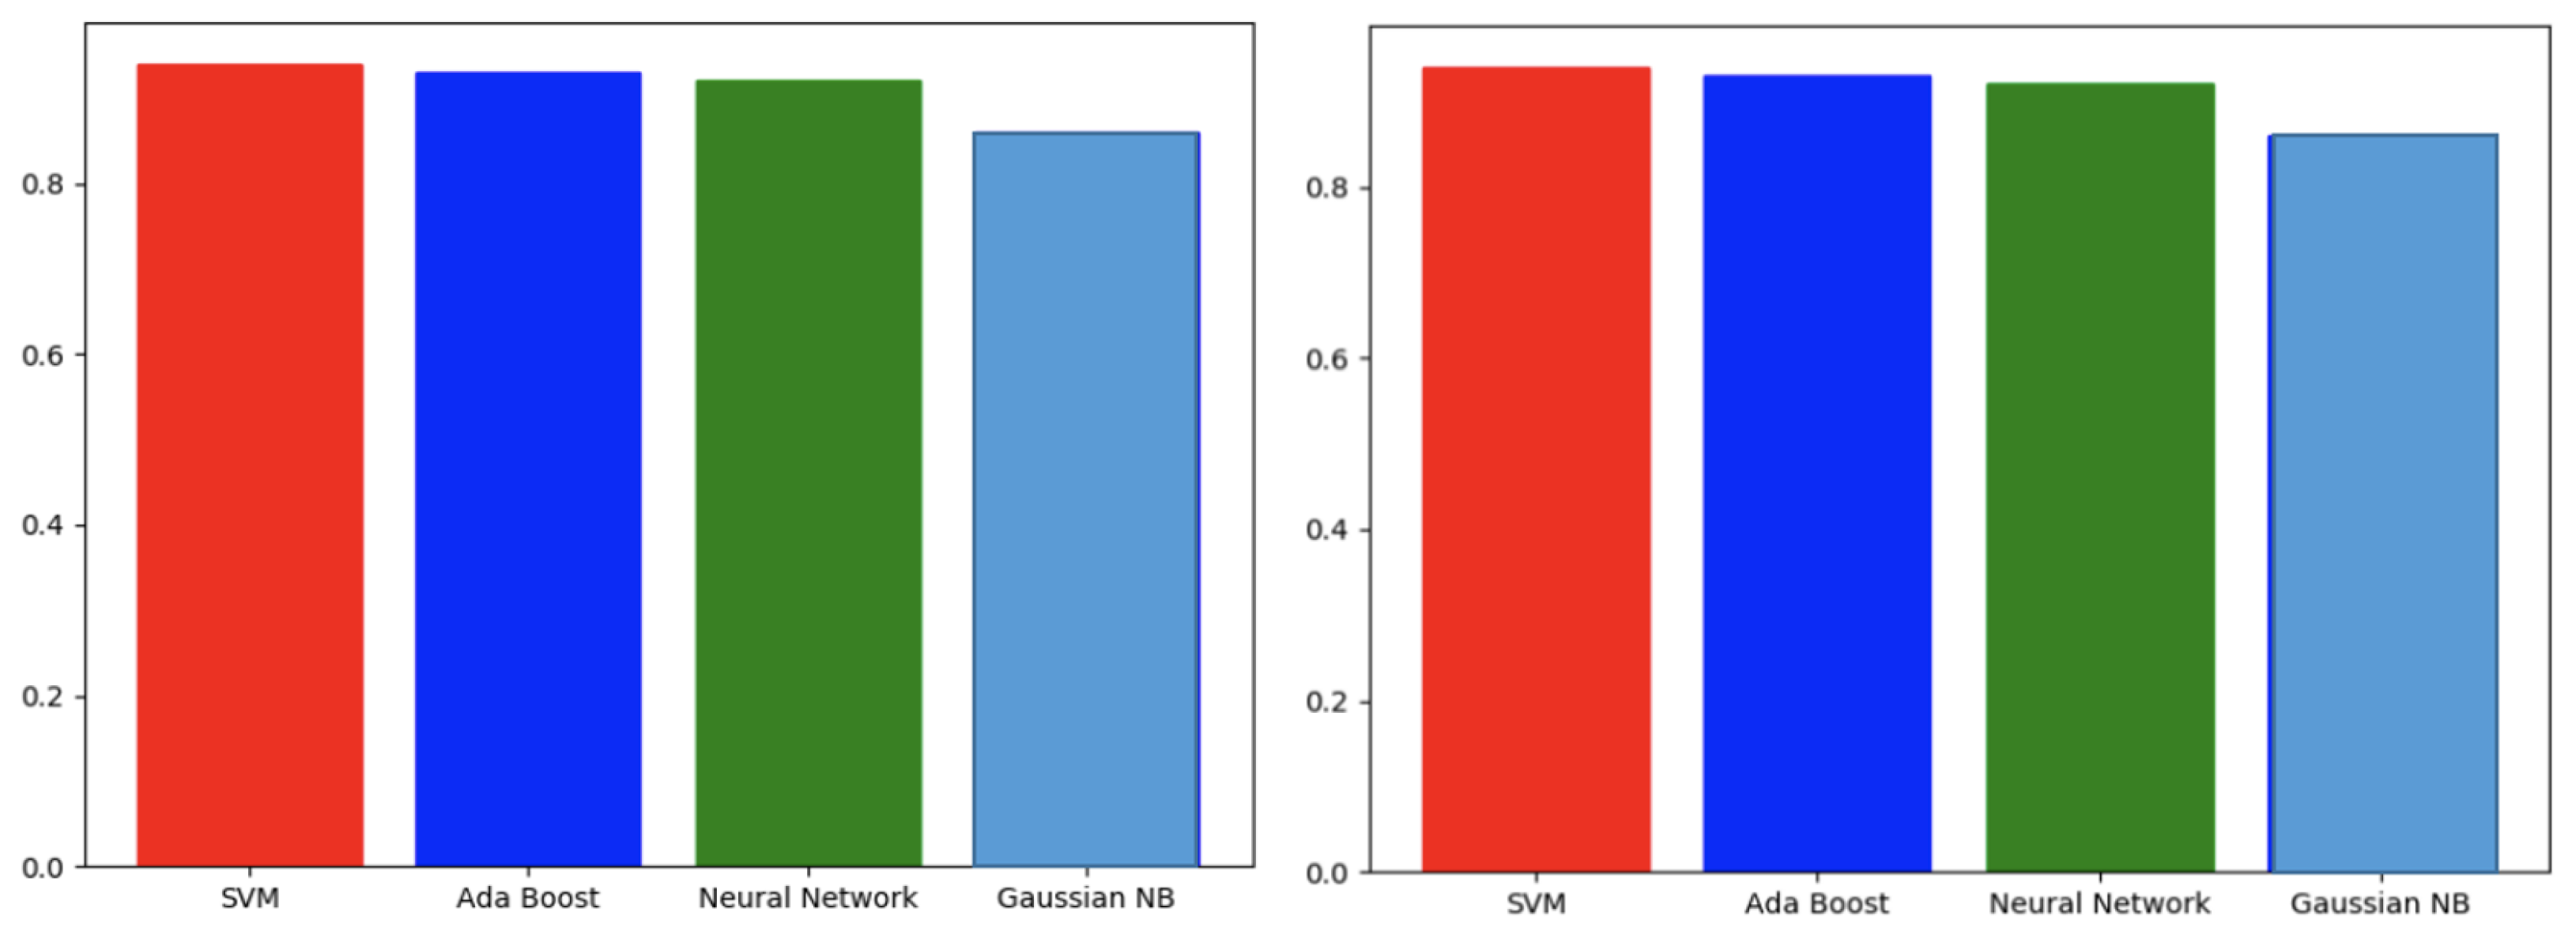
3.2. Comparison of Classical Machine Learning and Deep Learning

We compared the classical machine learning classification methods with the long short-term memory (LSTM) method. The classification accuracy (without noise) of the LSTM method for different postures (bending, sit to stand motion, leg raising and lowering, turning, and jumping) is shown in Figure 8. The accuracy of the LSTM classifier is similar to the accuracy of the classical machine learning methods, where leg raising or lowering motion, jumping, and sit to stand are associated with higher classification accuracy results than for the classical machine learning methods. Turning and bending are associated with lower classification accuracy results than for the classical machine learning methods.
In order to examine the impacts of the noise levels on the classification accuracy, random noise levels were also added to LSTM training. The classification accuracy of the LSTM method with noise is shown in Figure 8. Similar to the classical machine learning classification accuracy, when 20% of the labels were contaminated with noise, the classification accuracy started to drop significantly. With 30% of labels contaminated, similar to classical machine learning, the accuracy dropped significantly to just above 80%.
Similarly, the influences of significant joints involved in LSTM classification were also examined. A comparison between the classical machine methods and the LSTM method was also conducted for leg raising and lowering, with four different joints involved, as shown in Figure 9.
For LSTM, a reduction in classification accuracy also occurred when the number of joints involved in the classification was reduced. However, similar to classical machine learning, the reduction did not become significant until only the ankle and foot were used for classification. The accuracy was lowest when only a foot was used. Overall, the impacts of the reduced number of joints on classification was similar between deep learning and classical machine learning.
Figure 10 shows the inference speed of both classical machine learning and LSTM. The results reveal that LSTM inference took significantly longer than most classical methods on both a CPU and GPU. The one exception was Adaboost. LSTM ran faster than the Adaboost method on the CPU but slower on the GPU.
A summary of the results is provided in Table 4 that lists the classifiers with the highest accuracy, that were most resistant to noise, with th fastest inference speed, and with the slowest inference speed.

4. Conclusions

Our research systematically studied the robustness of classical machine learning classifiers across several experiments. Our results show that classical machine learning classifiers can classify postures with relatively high accuracy, are resistant to noise, and are also resistant to occlusions. The classical machine learning classifiers can classify postures with accuracy ranging between 75% and 99%, usually at least 95%.
Further examination of the influences for the choices of joints on classification was conducted. The results show that by varying the number of joints used to classify leg raising and lowering motion, it was discovered that reducing the number of joints reduced the classification accuracy from over 90% to over 84%. The majority of classifiers, however, retained accuracy results higher than 90%. The classification accuracy only dropped to 85% when only a single joint, the foot, was exclusively considered.
Our results also suggest that considering only a subset of joints is sufficient to classify postures; it means that the use of all joint information is unnecessary for posture classification. This not only improves the training and inference speed of the model but also matches our intuition that upper-body posture classification should only depend on upper-body joints, while lower-body motion may not be crucial for posture classification. While the use of only significant joints for posture classification seems like a simple idea, and it does have significant practical implications. The use of more joints for classification will make the model sensitive to occlusion in reality. As such, without compromising the model generalization capability, posture classifiers should consider the use of the lowest number of joints for classification, making it feasible to use a single camera for posture classification.
The impacts of random noise on classical machine learning classification accuracy were examined. Through the random noise experiments, we found that the classifier accuracy, even with random integer noise added to labels, did not decrease significantly. The classification accuracy only fell below 80% when over 20% of labels contained noise. This suggests that the classical classifiers are robust to noise and overfitting.
We have compared the classical machine learning classification methods with an LSTM deep learning method. We discovered that the classical machine learning classifiers are able to achieve similar classification accuracy as LSTM. The classification accuracy of the classical classification methods was between 75% and 99%, where the LSTM method had accuracy results between 86% and 99%. The results show that the deep learning method yielded slightly better performance in high-noise conditions, but for the majority of conditions, the classical machine learning classification methods have provided sufficient accuracy.
We have also discovered that the inference speeds of the classical machine learning methods were faster than the LSTM deep learning method. Specifically, the Gaussian NB method inference speed was faster on a CPU than the speed of LSTM inferred on a GPU. Without hardware acceleration, the LSTM method was about 20 times slower than the slowest classical machine learning classification methods while running on a CPU. However, on a GPU, the LSTM performance was comparable with classical classifiers, as shown in Figure 10.
These results suggest the following areas of future work. First, the experiments measuring the gradual impact of occluding joints suggest future work to determine what joints are relevant for different postures and motion. Determining important joints for different posture detection could inform where cameras should be placed to detect different postures. Second, this research only explored one deep learning method, and other deep learning methods should be also explored in the future. While classical machine learning is cheaper to implement, alternative deep learning methods such as the transformer method may provide more insights for more comprehensive comparison. Third, the assembly use of classical machine learning with reinforcement learning together may yield interesting results. Specifically, the success of reinforcement learning shows that agent-based reinforcement learning is able to largely compensate for the performance of the reasoning capability of classical machine learning as such, expecting to yield strong reasoning performance [77]. Fourth, a larger sample size is desired for the large-scale posture classification study. It is planned that the use of large-scale online data such as the Halpe-FullBody dataset, featuring 40,000 images, will be performed to further fine-tune the performance of the classical classifier real-time classification performance [48]. Fifth, we have also recognized the limitation of the sample size implemented in this research. As such, in future research, it would be beneficial to increase the sample size to further compare the noise and occlusion robustness of the classical machine learning and deep learning methods to identify the real-time and robust posture classifiers. The use of a larger sample size will become helpful to reduce potential overfitting of the data, which could be interesting to explore for the future research as well. Sixth, for the future research, it would also be beneficial to consider the balance of the gender of the participants to identify the potential impacts of gender on the performance of posture classification.
In this research, we have shown that classical classifiers are able to accurately classify postures. This study showed that classical machine learning methods are cost-effective, resistant to occlusions, resistant to noise, and do not require subjects to wear markers. Our research may find practical real-time-driven applications, including health and safety monitoring, without the cost of a complicated deep learning implementation. It would not incur the cost of a massive dataset and large number of GPUs. The inexpensive classical classifiers are adequate to classify postures for applications such as fall and slip prevention when real-time performance is the top priority.

Author Contributions

Conceptualization, H.Z.; Software, D.D.; Formal analysis, D.G.; Resources, W.Z. and G.R. All authors have read and agreed to the published version of the manuscript.

Funding

The research is supported through the National Science Foundation, Division of Engineering Education and Centers, Grant/Award Number 2306285.

Institutional Review Board Statement

The study was conducted in accordance with the Declaration of Helsinki, and the protocol was approved by MTSU Institutional Review Board.

Informed Consent Statement

Informed consent for participation was obtained from all subjects involved in the study.

Data Availability Statement

“The data are available upon request due to restrictions, e.g., privacy or ethical”—the data presented in this study are available upon request from the corresponding author.

Conflicts of Interest

Author Drew Dudash was employed by the company Noblis. The remaining authors declare that the research was conducted in the absence of any commercial or financial relationships that could be construed as a potential conflict of interest.

References

  1. Kot, A.; Nawrocka, A. Modeling of human balance as an inverted pendulum. In Proceedings of the 2014 15th International Carpathian Control Conference (ICCC), Velke Karlovice, Czech Republic, 28–30 May 2014; pp. 254–257. [Google Scholar]
  2. Buczek, F.L.; Cooney, K.M.; Walker, M.R.; Rainbow, M.J.; Concha, M.C.; Sanders, J.O. Performance of an inverted pendulum model directly applied to normal human gait. Clin. Biomech. 2006, 21, 288–296. [Google Scholar] [CrossRef] [PubMed]
  3. Morasso, P.; Cherif, A.; Zenzeri, J. Quiet standing: The single inverted pendulum model is not so bad after all. PLoS ONE 2019, 14, e0213870. [Google Scholar] [CrossRef] [PubMed]
  4. National Floor Safety Institute. Slip and Fall Quick Facts; NFSI: Southlake, TX, USA, 2022. [Google Scholar]
  5. Delahoz, Y.S.; Labrador, M.A. Survey on fall detection and fall prevention using wearable and external sensors. Sensors 2014, 14, 19806–19842. [Google Scholar] [CrossRef]
  6. Cucchiara, R.; Grana, C.; Prati, A.; Vezzani, R. Probabilistic posture classification for human-behavior analysis. IEEE Trans. Syst. Man Cybern.-Part A Syst. Hum. 2004, 35, 42–54. [Google Scholar] [CrossRef]
  7. Juang, C.F.; Chang, C.M. Human body posture classification by a neural fuzzy network and home care system application. IEEE Trans. Syst. Man Cybern.-Part A Syst. Hum. 2007, 37, 984–994. [Google Scholar] [CrossRef]
  8. Zhang, H.; Nussbaum, M.A.; Agnew, M.J. Use of wavelet coherence to assess two-joint coordination during quiet upright stance. J. Electromyogr. Kinesiol. 2014, 24, 607–613. [Google Scholar] [CrossRef]
  9. Qu, X.; Hu, X.; Tao, D. Gait initiation differences between overweight and normal weight individuals. Ergonomics 2021, 64, 995–1001. [Google Scholar] [CrossRef]
  10. Jia, B.; Kumbhar, A.N.; Tong, Y. Development of a Computer Vision-Based Muscle Stimulation Method for Measuring Muscle Fatigue during Prolonged Low-Load Exposure. Int. J. Environ. Res. Public Health 2021, 18, 11242. [Google Scholar] [CrossRef]
  11. Dubois, A.; Charpillet, F. A gait analysis method based on a depth camera for fall prevention. In Proceedings of the 2014 36th Annual International Conference of the IEEE Engineering in Medicine and Biology Society, Chicago, IL, USA, 26–30 August 2014; pp. 4515–4518. [Google Scholar]
  12. Kaenchan, S.; Mongkolnam, P.; Watanapa, B.; Sathienpong, S. Automatic Multiple Kinect Cameras Setting for Simple Walking Posture Analysis. In Proceedings of the 2013 International Computer Science and Engineering Conference (ICSEC), Bangkok, Thailand, 4–6 September 2013; pp. 245–249. [Google Scholar]
  13. Cucchiara, R.; Prati, A.; Vezzani, R. Posture classification in a multi-camera indoor environment. In Proceedings of the IEEE International Conference on Image Processing 2005, Genoa, Italy, 11–14 September 2005; Volume 1, p. I-725. [Google Scholar]
  14. Nasution, A.H.; Emmanuel, S. Intelligent video surveillance for monitoring elderly in home environments. In Proceedings of the 2007 IEEE 9th Workshop on Multimedia Signal Processing, Chania, Crete, Greece, 1–3 October 2007; pp. 203–206. [Google Scholar]
  15. Ben Hamida, A.; Koubaa, M.; Nicolas, H.; Amar, C.B. Video surveillance system based on a scalable application-oriented architecture. Multimed. Tools Appl. 2016, 75, 17187–17213. [Google Scholar] [CrossRef]
  16. Keshavarz, A.; Tabar, A.M.; Aghajan, H. Distributed vision-based reasoning for smart home care. In Proceedings of the ACM SenSys Workshop on DSC; ACM Press: New York, NY, USA, 2006. [Google Scholar]
  17. Xu, X.; McGorry, R.W.; Chou, L.S.; Lin, J.H.; Chang, C.C. Accuracy of the Microsoft Kinect™ for measuring gait parameters during treadmill walking. Gait Posture 2015, 42, 145–151. [Google Scholar] [CrossRef]
  18. Galna, B.; Barry, G.; Jackson, D.; Mhiripiri, D.; Olivier, P.; Rochester, L. Accuracy of the Microsoft Kinect sensor for measuring movement in people with Parkinson’s disease. Gait Posture 2014, 39, 1062–1068. [Google Scholar] [CrossRef] [PubMed]
  19. Mentiplay, B.F.; Clark, R.A.; Mullins, A.; Bryant, A.L.; Bartold, S.; Paterson, K. Reliability and validity of the Microsoft Kinect for evaluating static foot posture. J. Foot Ankle Res. 2013, 6, 10. [Google Scholar] [CrossRef] [PubMed]
  20. Dutta, T. Evaluation of the Kinect™sensor for 3-D kinematic measurement in the workplace. Appl. Ergon. 2012, 43, 645–649. [Google Scholar] [CrossRef]
  21. Zhang, L.; Chien Hsieh, J.; Wang, J. A Kinect-based golf swing classification system using HMM and Neuro-Fuzzy. In Proceedings of the 2012 International Conference on Computer Science and Information Processing (CSIP), Xian, China, 24–26 August 2012; pp. 1163–1166. [Google Scholar]
  22. Na, H.; Choi, J.H.; Kim, H.; Kim, T. Development of a human metabolic rate prediction model based on the use of Kinect-camera generated visual data-driven approaches. Build. Environ. 2019, 160, 106216. [Google Scholar] [CrossRef]
  23. Pedersoli, F.; Adami, N.; Benini, S.; Leonardi, R. XKin -: EXtendable Hand Pose and Gesture Recognition Library for Kinect. In Proceedings of the 20th ACM International Conference on Multimedia, Nara, Japan, 29 October–2 November 2012; pp. 1465–1468. [Google Scholar]
  24. Hu, X.; Li, Y.; Chen, G.; Zhao, Z.; Qu, X. Identification of balance recovery patterns after slips using hierarchical cluster analysis. J. Biomech. 2022, 143, 111281. [Google Scholar] [CrossRef]
  25. Hu, X.; Duan, Q.; Tang, J.; Chen, G.; Zhao, Z.; Sun, Z.; Chen, C.; Qu, X. A low-cost instrumented shoe system for gait phase detection based on foot plantar pressure data. IEEE J. Transl. Eng. Health Med. 2023, 12, 84–96. [Google Scholar] [CrossRef]
  26. Parajuli, M.; Tran, D.; Ma, W.; Sharma, D. Senior health monitoring using Kinect. In Proceedings of the 2012 Fourth International Conference on Communications and Electronics (ICCE), Hue, Vietnam, 1–2 August 2012; pp. 309–312. [Google Scholar]
  27. Clark, R.A.; Pua, Y.H.; Bryant, A.L.; Hunt, M.A. Validity of the Microsoft Kinect for providing lateral trunk lean feedback during gait retraining. Gait Posture 2013, 38, 1064–1066. [Google Scholar] [CrossRef]
  28. Manghisi, V.M.; Uva, A.E.; Fiorentino, M.; Bevilacqua, V.; Trotta, G.F.; Monno, G. Real time RULA assessment using Kinect v2 sensor. Appl. Ergon. 2017, 65, 481–491. [Google Scholar] [CrossRef]
  29. Ma, M.; Proffitt, R.; Skubic, M. Validation of a Kinect V2 based rehabilitation game. PLoS ONE 2018, 13, e0202338. [Google Scholar] [CrossRef]
  30. Geerse, D.J.; Coolen, B.H.; Roerdink, M. Kinematic validation of a multi-Kinect v2 instrumented 10-meter walkway for quantitative gait assessments. PLoS ONE 2015, 10, e0139913. [Google Scholar] [CrossRef]
  31. Cai, L.; Ma, Y.; Xiong, S.; Zhang, Y. Validity and reliability of upper limb functional assessment using the Microsoft Kinect V2 sensor. Appl. Bionics Biomech. 2019, 2019, 7175240. [Google Scholar] [CrossRef] [PubMed]
  32. Latorre, J.; Colomer, C.; Alcañiz, M.; Llorens, R. Gait analysis with the Kinect v2: Normative study with healthy individuals and comprehensive study of its sensitivity, validity, and reliability in individuals with stroke. J. Neuroeng. Rehabil. 2019, 16, 1–11. [Google Scholar] [CrossRef] [PubMed]
  33. Wochatz, M.; Tilgner, N.; Mueller, S.; Rabe, S.; Eichler, S.; John, M.; Völler, H.; Mayer, F. Reliability and validity of the Kinect V2 for the assessment of lower extremity rehabilitation exercises. Gait Posture 2019, 70, 330–335. [Google Scholar] [CrossRef] [PubMed]
  34. Obdržálek, Š.; Kurillo, G.; Ofli, F.; Bajcsy, R.; Seto, E.; Jimison, H.; Pavel, M. Accuracy and robustness of Kinect pose estimation in the context of coaching of elderly population. In Proceedings of the 2012 Annual International Conference of the IEEE Engineering in Medicine and Biology Society, San Diego, CA, USA, 28 August–1 September 2012; pp. 1188–1193. [Google Scholar]
  35. Kondori, F.A.; Yousefi, S.; Li, H.; Sonning, S.; Sonning, S. 3D head pose estimation using the Kinect. In Proceedings of the 2011 International Conference on Wireless Communications and Signal Processing (WCSP), Nanjing, China, 9–11 November 2011; pp. 1–4. [Google Scholar]
  36. Saeed, A.; Al-Hamadi, A. Boosted human head pose estimation using kinect camera. In Proceedings of the 2015 IEEE International Conference on Image Processing (ICIP), Quebec City, QC, Canada, 27–30 September 2015; pp. 1752–1756. [Google Scholar]
  37. Plantard, P.; Auvinet, E.; Le Pierres, A.S.; Multon, F. Pose estimation with a kinect for ergonomic studies: Evaluation of the accuracy using a virtual mannequin. Sensors 2015, 15, 1785–1803. [Google Scholar] [CrossRef]
  38. Wu, D.; Sharma, N.; Blumenstein, M. Recent advances in video-based human action recognition using deep learning: A review. In Proceedings of the 2017 International Joint Conference on Neural Networks (IJCNN), Anchorage, AK, USA, 14–19 May 2017; pp. 2865–2872. [Google Scholar]
  39. Ma, Y.; Liu, D.; Cai, L. Deep Learning-Based Upper Limb Functional Assessment Using a Single Kinect v2 Sensor. Sensors 2020, 20, 1903. [Google Scholar] [CrossRef]
  40. Chang, M.J.; Hsieh, J.T.; Fang, C.Y.; Chen, S.W. A Vision-Based Human Action Recognition System for Moving Cameras Through Deep Learning. In Proceedings of the 2019 2nd International Conference on Signal Processing and Machine Learning, Hangzhou, China, 27–29 November 2019; pp. 85–91. [Google Scholar]
  41. Papadakis, A.; Mathe, E.; Spyrou, E.; Mylonas, P. A Geometric Approach for Cross-View Human Action Recognition using Deep Learning. In Proceedings of the 11th International Symposium on Image and Signal Processing and Analysis (ISPA), Dubrovnik, Croatia, 23–25 September 2019; pp. 258–263. [Google Scholar]
  42. Huynh-The, T.; Hua, C.H.; Tu, N.A.; Kim, D.S. Learning 3D spatiotemporal gait feature by convolutional network for person identification. Neurocomputing 2020, 397, 192–202. [Google Scholar] [CrossRef]
  43. Fuentes-Jimenez, D.; Martin-Lopez, R.; Losada-Gutierrez, C.; Casillas-Perez, D.; Macias-Guarasa, J.; Luna, C.A.; Pizarro, D. DPDnet: A robust people detector using deep learning with an overhead depth camera. Expert Syst. Appl. 2020, 146, 113168. [Google Scholar] [CrossRef]
  44. Wang, L.; Huynh, D.Q.; Koniusz, P. A comparative review of recent kinect-based action recognition algorithms. IEEE Trans. Image Process. 2019, 29, 15–28. [Google Scholar] [CrossRef]
  45. Liaqat, S.; Dashtipour, K.; Arshad, K.; Assaleh, K.; Ramzan, N. A hybrid posture detection framework: Integrating machine learning and deep neural networks. IEEE Sens. J. 2021, 21, 9515–9522. [Google Scholar] [CrossRef]
  46. Luo, Y.; Peng, Y.; Yang, J. Basketball Free Throw Posture Analysis and Hit Probability Prediction System Based on Deep Learning. Int. J. Adv. Comput. Sci. Appl. 2024, 15, 934–946. [Google Scholar] [CrossRef]
  47. Kumar, R.A.; Chakkaravarthy, S.S. YogiCombineDeep: Enhanced Yogic Posture Classification using Combined Deep Fusion of VGG16 and VGG19 Features. IEEE Access 2024, 12, 139165–139180. [Google Scholar] [CrossRef]
  48. Fang, H.S.; Li, J.; Tang, H.; Xu, C.; Zhu, H.; Xiu, Y.; Li, Y.L.; Lu, C. Alphapose: Whole-body regional multi-person pose estimation and tracking in real-time. IEEE Trans. Pattern Anal. Mach. Intell. 2022, 45, 7157–7173. [Google Scholar] [CrossRef] [PubMed]
  49. Tang, S.; Chen, C.; Xie, Q.; Chen, M.; Wang, Y.; Ci, Y.; Bai, L.; Zhu, F.; Yang, H.; Yi, L.; et al. Humanbench: Towards general human-centric perception with projector assisted pretraining. In Proceedings of the IEEE/CVF Conference on Computer Vision and Pattern Recognition, Vancouver, BC, Canada, 17–24 June 2023; pp. 21970–21982. [Google Scholar]
  50. Xu, Y.; Zhang, J.; Zhang, Q.; Tao, D. Vitpose++: Vision transformer for generic body pose estimation. IEEE Trans. Pattern Anal. Mach. Intell. 2023, 46, 1212–1230. [Google Scholar] [CrossRef] [PubMed]
  51. Samkari, E.; Arif, M.; Alghamdi, M.; Al Ghamdi, M.A. WideHRNet: An Efficient Model for Human Pose Estimation Using Wide Channels in Lightweight High-Resolution Network. IEEE Access 2024, 12, 148990–149000. [Google Scholar] [CrossRef]
  52. Kishor, R. Performance Benchmarking of YOLOv11 Variants for Real-Time Delivery Vehicle Detection: A Study on Accuracy, Speed, and Computational Trade-offs. Asian J. Res. Comput. Sci. 2024, 17, 108–122. [Google Scholar] [CrossRef]
  53. Ultralytics. YOLO11. 2024. Available online: https://docs.ultralytics.com/models/yolo11/ (accessed on 27 April 2025).
  54. Welser, J.; Pitera, J.W.; Goldberg, C. Future computing hardware for AI. In Proceedings of the 2018 IEEE International Electron Devices Meeting (IEDM), San Francisco, CA, USA, 1–5 December 2018; pp. 1–3. [Google Scholar]
  55. Rossi, D.; Zhang, L. Network artificial intelligence, fast and slow. In Proceedings of the 1st International Workshop on Native Network Intelligence, Rome, Italy, 9 December 2022; pp. 14–20. [Google Scholar]
  56. Mazzia, V.; Khaliq, A.; Salvetti, F.; Chiaberge, M. Real-time apple detection system using embedded systems with hardware accelerators: An edge AI application. IEEE Access 2020, 8, 9102–9114. [Google Scholar] [CrossRef]
  57. Tuli, S.; Jha, N.K. AccelTran: A sparsity-aware accelerator for dynamic inference with transformers. IEEE Trans. Comput.-Aided Des. Integr. Circuits Syst. 2023, 42, 4038–4051. [Google Scholar] [CrossRef]
  58. Sun, C.; Shrivastava, A.; Singh, S.; Gupta, A. Revisiting unreasonable effectiveness of data in deep learning era. In Proceedings of the IEEE International Conference on Computer Vision, Venice, Italy, 22–29 October 2017; pp. 843–852. [Google Scholar]
  59. Oyedare, T.; Park, J.M.J. Estimating the required training dataset size for transmitter classification using deep learning. In Proceedings of the 2019 IEEE International Symposium on Dynamic Spectrum Access Networks (DySPAN), Newark, NJ, USA, 11–14 November 2019; pp. 1–10. [Google Scholar]
  60. Rajput, D.; Wang, W.J.; Chen, C.C. Evaluation of a decided sample size in machine learning applications. BMC Bioinform. 2023, 24, 48. [Google Scholar] [CrossRef]
  61. Zeyer, A.; Bahar, P.; Irie, K.; Schlüter, R.; Ney, H. A comparison of transformer and lstm encoder decoder models for asr. In Proceedings of the 2019 IEEE Automatic Speech Recognition and Understanding Workshop (ASRU), Sentosa, Singapore, 14–18 December 2019; pp. 8–15. [Google Scholar]
  62. Kandpal, N.; Deng, H.; Roberts, A.; Wallace, E.; Raffel, C. Large language models struggle to learn long-tail knowledge. In Proceedings of the International Conference on Machine Learning. PMLR, Honolulu, HI, USA, 23–29 July 2023; pp. 15696–15707. [Google Scholar]
  63. Thirunavukarasu, A.J.; Ting, D.S.J.; Elangovan, K.; Gutierrez, L.; Tan, T.F.; Ting, D.S.W. Large language models in medicine. Nat. Med. 2023, 29, 1930–1940. [Google Scholar] [CrossRef]
  64. Li, C. OpenAI’s GPT-3 Language Model: A Technical Overview. Available online: https://tinyurl.com/4j8ec3hz (accessed on 27 April 2025).
  65. Schreiner, M. GPT-4 Architecture, Datasets, Costs and More Leaked. 2023. Available online: https://tinyurl.com/5vecrkcu (accessed on 27 April 2025).
  66. Smith, M.S. Llama 3 Establishes Meta as the Leader in “Open” AI. Available online: https://tinyurl.com/ys3sunmj (accessed on 27 April 2025).
  67. Krizhevsky, A.; Sutskever, I.; Hinton, G.E. ImageNet Classification with Deep Convolutional Neural Networks. Commun. ACM 2017, 60, 84–90. [Google Scholar] [CrossRef]
  68. Chandran, S.; Yatagawa, T.; Kubo, H.; Jayasuriya, S. Learning-based Spotlight Position Optimization for Non-Line-of-Sight Human Localization and Posture Classification. In Proceedings of the IEEE/CVF Winter Conference on Applications of Computer Vision, Waikoloa, HI, USA, 3–8 January 2024; pp. 4218–4227. [Google Scholar]
  69. Odesola, D.F.; Kulon, J.; Verghese, S.; Partlow, A.; Gibson, C. Smart Sensing Chairs for Sitting Posture Detection, Classification, and Monitoring: A Comprehensive Review. Sensors 2024, 24, 2940. [Google Scholar] [CrossRef] [PubMed]
  70. Song, Y.P.; Wu, X.; Yuan, Z.; Qiao, J.J.; Peng, Q. PostureHMR: Posture Transformation for 3D Human Mesh Recovery. In Proceedings of the IEEE/CVF Conference on Computer Vision and Pattern Recognition, Seattle, WA, USA, 16–22 June 2024; pp. 9732–9741. [Google Scholar]
  71. Noh, S.; Bae, K.; Bae, Y.; Lee, B.D. H^ 3Net: Irregular Posture Detection by Understanding Human Character and Core Structures. In Proceedings of the IEEE/CVF Conference on Computer Vision and Pattern Recognition, Seattle, WA, USA, 16–22 June 2024; pp. 5631–5641. [Google Scholar]
  72. Yeung, C.; Ide, K.; Fujii, K. AutoSoccerPose: Automated 3D posture Analysis of Soccer Shot Movements. In Proceedings of the IEEE/CVF Conference on Computer Vision and Pattern Recognition, Seattle, WA, USA, 16–22 June 2024; pp. 3214–3224. [Google Scholar]
  73. Lee, M.H.; Zhang, Y.C.; Wu, K.R.; Tseng, Y.C. GolfPose: From Regular Posture to Golf Swing Posture. In International Conference on Pattern Recognition; Springer: Berlin/Heidelberg, Germany, 2025; pp. 387–402. [Google Scholar]
  74. Yan, L.; Du, Y. Exploring Trends and Clusters in Human Posture Recognition Research: An Analysis Using CiteSpace. Sensors 2025, 25, 632. [Google Scholar] [CrossRef] [PubMed]
  75. Zhai, Y.; Jia, G.; Lai, Y.K.; Zhang, J.; Yang, J.; Tao, D. Looking into gait for perceiving emotions via bilateral posture and movement graph convolutional networks. IEEE Trans. Affect. Comput. 2024, 15, 1634–1648. [Google Scholar] [CrossRef]
  76. Yan, K.; Liu, G.; Xie, R.; Fang, S.H.; Wu, H.C.; Chang, S.Y.; Ma, L. Novel Subject-Dependent Human-Posture Recognition Approach Using Tensor Regression. IEEE Sens. J. 2024, 25, 1041–1053. [Google Scholar] [CrossRef]
  77. Samet, L. “One of the most amazing breakthroughs”: How DeepSeek’s R1 Model is Disrupting the AI Landscape. Available online: https://tinyurl.com/2je7zm2h (accessed on 27 April 2025).
  78. Schmid, P. Bite: How Deepseek R1 Was Trained. Available online: https://tinyurl.com/msawcht6 (accessed on 27 April 2025).
  79. Rai, S.; Purnell, N. What Is DeepSeek R1 And How Does China’s AI Model Compare to OpenAI, Meta? Available online: https://tinyurl.com/2jzjxnjn (accessed on 27 April 2025).
  80. Rizvi, N. An Empirical Comparison of Machine Learning Models for Classification. Master’s Thesis, University of South Carolina, Columbia, SC, USA, 2020. [Google Scholar]
  81. Sordo, M.; Zeng, Q. On sample size and classification accuracy: A performance comparison. In International Symposium on Biological and Medical Data Analysis; Springer: Berlin/Heidelberg, Germany, 2005; pp. 193–201. [Google Scholar]
  82. Rendle, S. Factorization machines. In Proceedings of the 2010 IEEE International conference on data mining, Sydney, Australia, 13–17 December 2010; pp. 995–1000. [Google Scholar]
  83. Saez, Y.; Baldominos, A.; Isasi, P. A comparison study of classifier algorithms for cross-person physical activity recognition. Sensors 2016, 17, 66. [Google Scholar] [CrossRef]
  84. Goodfellow, I.; Bengio, Y.; Courville, A. Deep Learning; MIT Press: Cambridge, MA, USA, 2016; Available online: http://www.deeplearningbook.org (accessed on 1 January 2016).
  85. Hochreiter, S.; Schmidhuber, J. Long Short-Term Memory. Neural Comput. 1997, 9, 1735–1780. [Google Scholar] [CrossRef]
  86. Smith, L.N. Cyclical Learning Rates for Training Neural Networks. In Proceedings of the 2017 IEEE Winter Conference on Applications of Computer Vision (WACV), Santa Rosa, CA, USA, 24–31 March 2017; pp. 464–472. [Google Scholar]
Figure 1. The examples of the postures of the participants: (A) bending posture; (B) leg raising and lowering; and (C) upright standing.
Electronics 14 01876 g001
Figure 2. Diagram used for illustration of the LSTM method. The left side of the diagram shows the input—the ( x , y , z ) coordinates of the joints. The coordinates were processed by the LSTM method and output as the classification of the posture.
Electronics 14 01876 g002
Figure 3. The impacts of all joints versus significant joints only for the accuracy of the posture classification while no noise was added to the data. (Left): Classical machine learning classification methods’ classification accuracy results. All joints contributing to the posture control are involved in the posture classification. (Right): Classical machine learning classification methods’ classification accuracy results. Only joints significantly contributing to the posture control are involved in the posture classification.
Electronics 14 01876 g003
Figure 4. The impacts of different noise levels on the performance of the classical classifiers. The classification accuracy of the classical machine learning classification methods while random levels of noise were added to the data.
Electronics 14 01876 g004
Figure 5. Classical machine learning classifier accuracy results with different noise levels for the label of leg raising and leg lowering motion. Six different level ratios of all labels contaminated with noise: (A) 1.5/100; (B) 4.5/100; (C) 8/100; (D) 15/100; (E) 20/100; and (F) 30/100.
Electronics 14 01876 g005
Figure 6. Leg raising and lowering motion classification accuracy with four joints (left) and three joints (Right) involved. (Left): Leg raising and lowering motion classification accuracy with four joints involved: hip, knee, ankle, and foot. (Right): Leg raising and lowering motion classification accuracy with three joints involved: knee, ankle, and foot.
Electronics 14 01876 g006
Figure 7. Leg raising and lowering motion classification accuracy with two joints (Left) and one joint (Right) involved. (Left): Leg raising and lowering motion classification accuracy with two joints involved: ankle and foot. (Right): Leg raising and lowering motion classification accuracy with one joint involved: foot.
Electronics 14 01876 g007
Figure 8. LSTM posture classification accuracy. (Left): The LSTM method classification accuracy for different postures (without noise). (Right): The LSTM method classification accuracy with different degrees of noise applied on the label of leg raising and lowering motion. Six different ratios of all labels contaminated with noise: (A) 1.5/100; (B) 4.5/100; (C) 8/100; (D) 15/100; (E) 20/100; and (F) 30/100.
Electronics 14 01876 g008
Figure 9. The impacts of the number of joints involved for the performance of the LSTM classification. Leg raising and lowering motion LSTM classification accuracy with different joints involved (Hip, Knee, Ankle, and Foot) are considered (without noise).
Electronics 14 01876 g009
Figure 10. Inference speed of classical machine learning and LSTM. Inference was conducted on a GeForce RTX 4070 12 GB and Intel Core i5-13400F 2.5 GHz CPU equipped desktop. (Left): Classifier inference speeds using a GPU. (Right): The classifier inference speeds without a GPU; CPU only.
Electronics 14 01876 g010
Table 1. The summary of body postures.
Posture 1Posture 2Posture 3
Whole-Body Motion: Jumping PostureLower-Body Motion: Sit to Stand PostureBody Transition Motion: Leg Raising/Lowering Posture
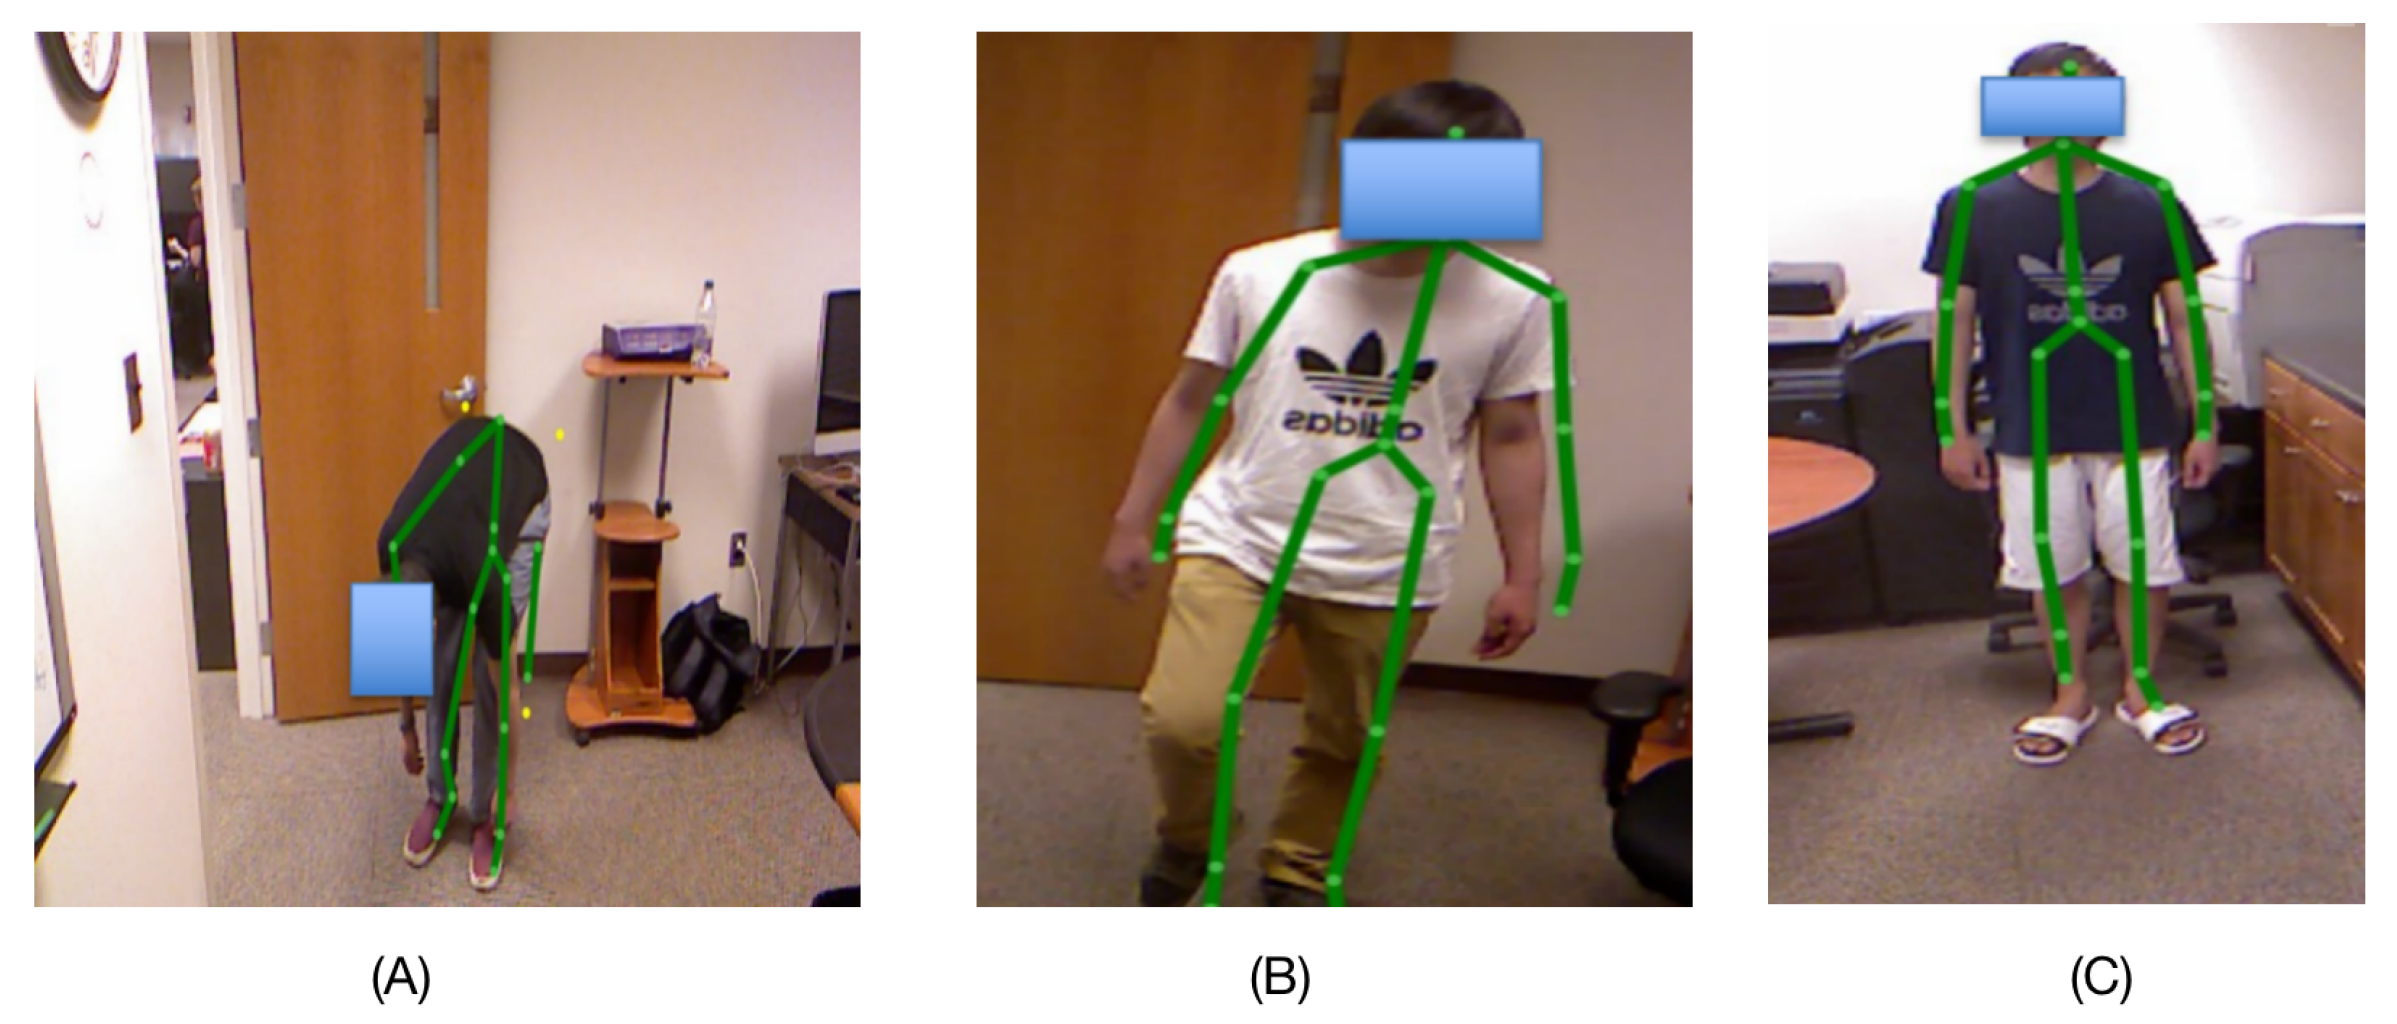
Participants performed intermittent jumps in the frontal plane. One image was taken when participants jumped off from the ground. Another image was taken during the landing.Participants raised their left/right leg intermittently in the sagittal plane. One image was taken when participants either raised their left or right leg. Another image was taken when participants lowered their left or right leg.Participants transitioned between sitting and standing postures in the sagittal plane. One image was taken while participants were in the sitting posture and another in the standing posture.
Posture 4 and 5
Upper-Body Motion: Bending PostureUpper-Body Motion: Turning Posture
Participants bent forward intermittently in the sagittal plane. One image was taken while participants assumed the upright posture. Another image was taken while participants bent forward in the sagittal plane.Participants turned their body intermittently in the transverse plane. One image was taken while their body was turned left, in the transverse plane, with both arms held horizontally in front of the chest. Another image was taken while turned right.
Table 2. The summary of hyper-parameters of the classification methods.
Method NameHyper-Parameters
Support Vector MachineLinear kernel
Gaussian Naive Bayesian (NB)Largest variance of the features = 10 9
Random ForestThe number of trees in the forest = 10
Minimum samples split = 2
AdaBoostMaximum number of estimators where boosting is terminated = 50
Learning rate = 1
Neural Network9 hidden units (3 layers in total)
Table 3. The significant motion joint centers considered for the posture classification.
Body Motion StylesSignificant Motion Joint Centers
Whole-Body Motion: Jumping PostureFoot, Knee, Hip, Spine, Head, Shoulder, Elbow, Wrist, Hand
Lower-Body Motion: Leg Raising/Lowering PostureFoot, Ankle, Knee
Body Transition Motion: Sit to Stand PostureKnee, Hip, Elbow, Wrist, Hand
Upper-Body Motion:Bend posture: Spine, Hip, Head, Shoulder, Elbow, Wrist, Hand
Turn Posture Motion: Knee, Hip, Shoulder, Elbow, Wrist, Hand
Table 4. The summary of the accuracy and speed for both classification machine learning and LSTM methods.
MetricSuperior Method(s)
Highest AccuracySVM, Gaussian NB, random forest, neural network, and LSTM. All methods achieved 99% of accuracy for different scenarios.
Most Resistant to NoiseSVM and LSTM. Accuracy was reduced from 99% to 86% when 30% of labels contained noise.
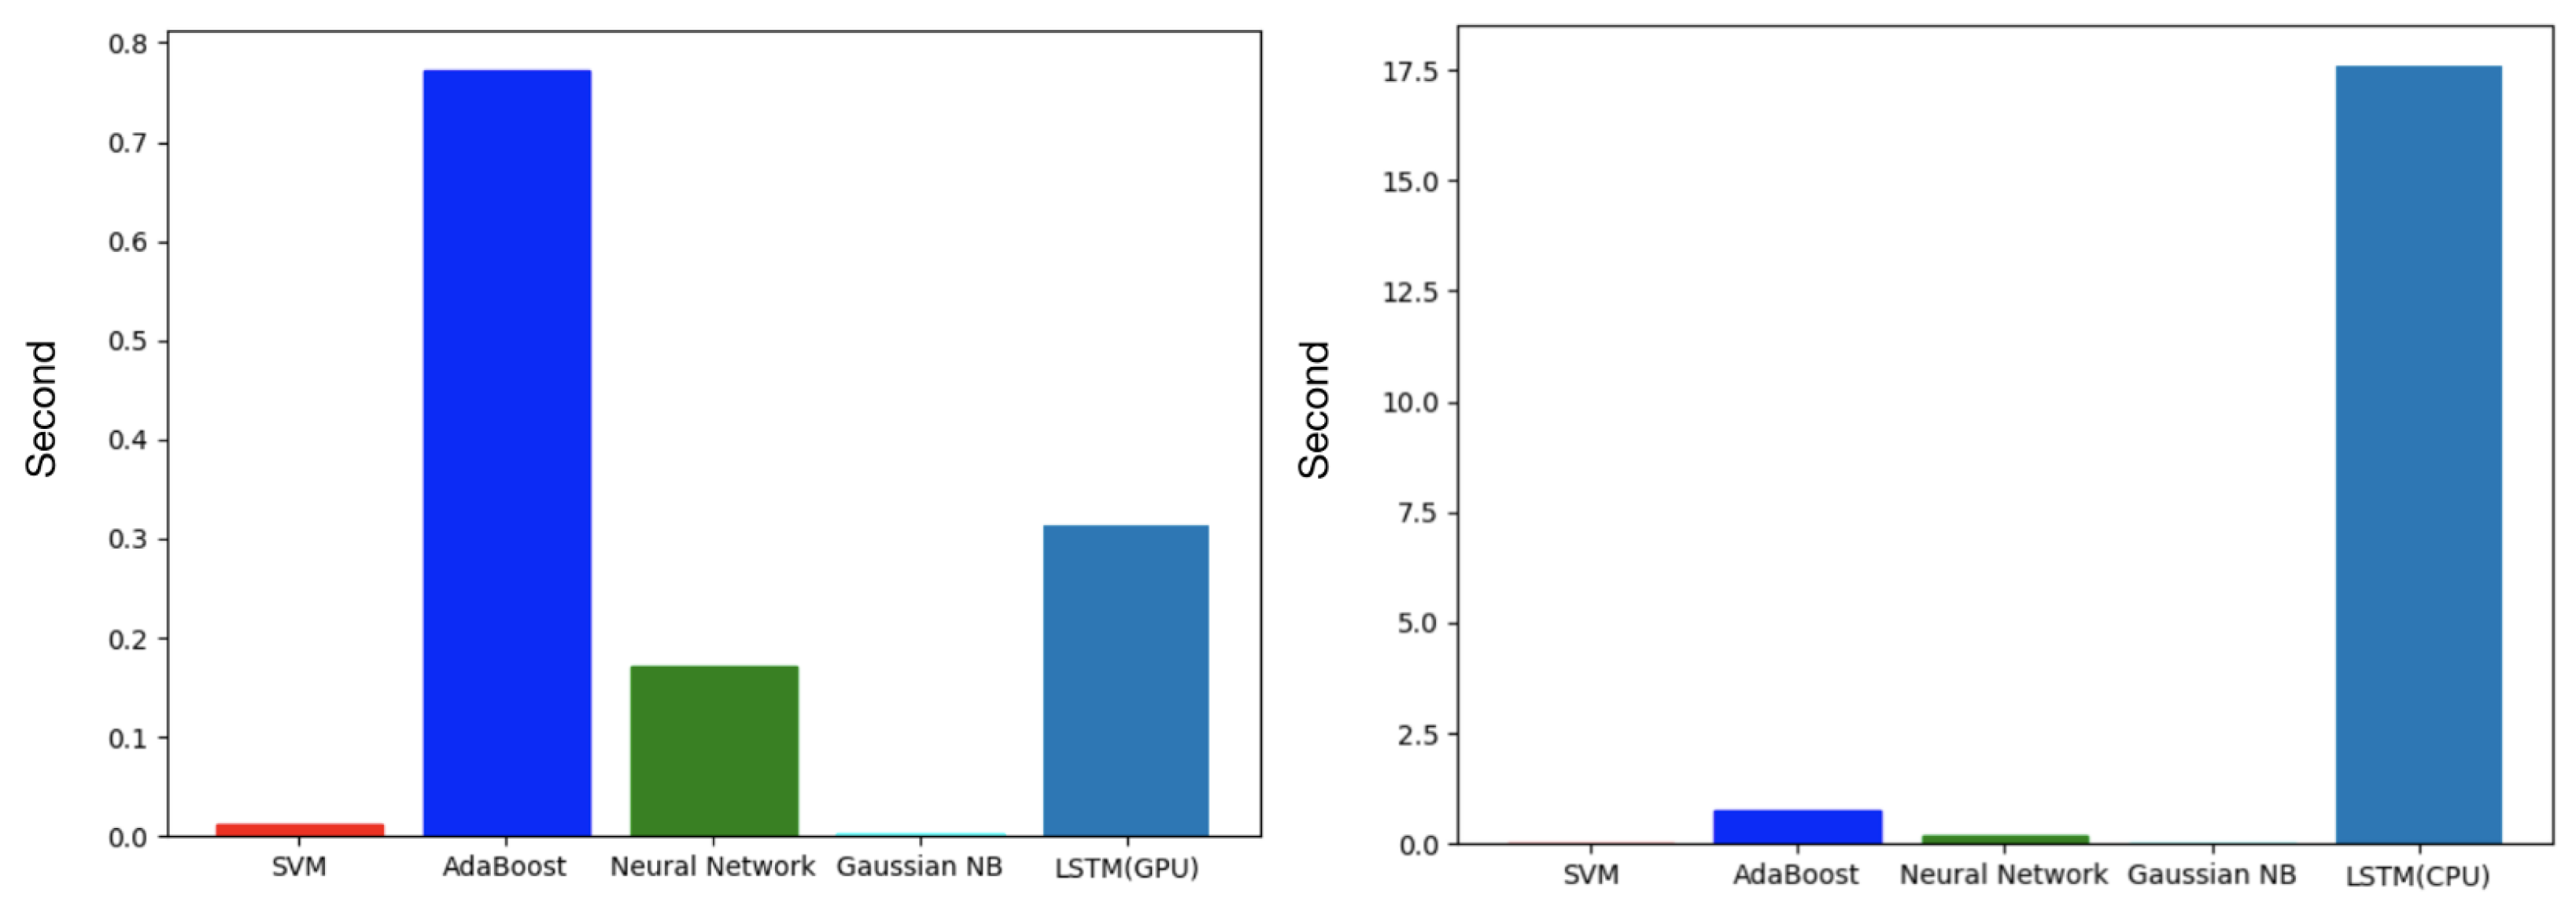
Fastest Inference SpeedGaussian NB. The inference time was 0.0024 s for inference of 40% of data.
Slowest Inference Speed
  • When all methods used CPU only, LSTM was the slowest (17.6 s for inference of 40% of data).
  • When LSTM used GPU, all classical machine learning classification methods still used CPU. AdaBoost was the slowest (0.77 s for inference of 40% of data).
Disclaimer/Publisher’s Note: The statements, opinions and data contained in all publications are solely those of the individual author(s) and contributor(s) and not of MDPI and/or the editor(s). MDPI and/or the editor(s) disclaim responsibility for any injury to people or property resulting from any ideas, methods, instructions or products referred to in the content.

