Abstract
Retinitis Pigmentosa (RP) is a progressive retinal disorder that leads to vision loss and blindness. Accurate staging of RP is crucial for effective treatment planning and disease management. This study aims to develop an objective and reliable method for RP staging by integrating handcrafted features extracted from visual field (VF) grayscale and multifocal electroretinography (mfERG) P1 wave amplitude maps using machine-learning models. Four machine-learning models were evaluated using features derived from VF grayscale maps (GLCM and gray tone features) and mfERG P1 amplitude maps (RGB and HSV features). Additionally, feature selection was performed using the Random Forest (RF) algorithm to identify the most relevant features. The experimental results showed that the Support Vector Machine (SVM) model achieved the highest classification performance with 98.39% accuracy, 98.26% precision, 98.55% recall, 98.41% F1 score, and 99.17% specificity using the seven most important features: RGB Entropy_R, GLCM Contrast_90°, RGB Std_R, GLCM Homogeneity_90°, RGB Energy_R, Histogram Kurtosis, and GLCM Energy_90°. These findings demonstrate that fusing grayscale and amplitude maps provides an effective approach for RP staging. The proposed method may serve as an objective, automated decision-support tool for ophthalmologists, enhancing clinical evaluations and enabling personalized treatment strategies for RP patients.
1. Introduction
The retina’s complex structure and strong metabolic activity make it a fundamental part of the visual process. It is a thin and sensitive structure that is made up of pigment epithelium, photoreceptor cells (cones and rods), ganglion cell layer, nerve fiber layer, and various support cells. Within them, the photoreceptor cells detect light beams and convert the information into electrical signals that are transmitted to the brain [1,2]. However, impairment in photoreceptor cell activity can result in severe vision loss and dramatically impact an individual’s quality of life.
Retinitis Pigmentosa (RP) is a progressive retinal disease characterized by degeneration of the photoreceptor cells. An estimated 1/3000 to 1/4000 people worldwide are thought to suffer from RP, making it one of the most common inherited disorders. The symptoms of RP, which often first appear in childhood or adolescence, include peripheral visual field constriction and decreased night vision. As the disorder progresses, the field of vision becomes progressively narrower, resulting in a condition called tunnel vision, which can eventually lead to total blindness [3,4].
It is extremely difficult to provide safe and efficient treatment for RP because of the genetic variety of the condition, the many biological roles of the altered proteins, and the numerous molecular variables that cause illness symptoms. For this reason, therapy strategies are often specialized according to the stage of the disease [5]. In this context, early-stage treatment could include pharmacological supplements such as vitamin A, brimonidine, docosahexaenoic acid, and lutein; intermediate-stage treatments could include stem cell therapy; and later, advanced-stage treatment may include more invasive procedures such as retinal prostheses, cell transplantation, and gene therapy [5,6,7]. Each of these treatment strategies has the potential to slow the progression of RP, preserve vision, and improve patients’ quality of life. Therefore, it is crucial to correctly identify the stages of RP so that the optimal treatments can be applied to individuals and the effects of the disease can be minimized.
The staging of RP is fundamental to understanding how the disease progresses and to determining optimal treatment strategies. In this context, Iftikhar et al. [8] proposed a scoring system including the parameters of visual acuity (VA), visual field (VF) width, and ellipsoid zone width on optical coherence tomography (OCT) to classify the severity of RP disease in a simple and effective way. Similarly, Oner and Kahraman [9] added multifocal electroretinography (mfERG) parameters in addition to these parameters to evaluate the severity of RP comprehensively. Such research enables a more precise identification of the stages of RP, contributing to the determination of the optimal treatment strategies for the patient and thereby more effective management of the care process. However, these approaches are often carried out manually, relying on the knowledge and experience of specialists, which can lead to subjectivity and wasting of time in the process. Therefore, it is necessary to develop a modern system that is superior to traditional methods to quickly and accurately identify the stages of RP.
VF is a test used to determine both peripheral and central visual losses by evaluating the total visual capacity of the individual. The grayscale maps obtained from this test visualize the losses in the patient’s visual field in gray tones, revealing the effects of RP on peripheral and central vision in detail [10,11]. On the other hand, mfERG is a test that more accurately and in detail reflects localized problems by its ability to precisely detect electrical activity in different regions of the retina and generate topographic maps. The P1 wave amplitude maps in the test visualize the P1 wave amplitude densities, the positive peak following the first negative deflection, providing a detailed map of the local effects of RP in the retina [12]. In this context, grayscale maps and P1 wave amplitude maps have been effectively evaluated before and after stem cell applications in the treatment of RP patients in recent years. For example, two separate studies by Oner and Kahraman reported similar improvements in both grayscale maps and P1 wave amplitude maps after treatment in individuals with RP [13,14]. These findings suggest that grayscale and P1 wave amplitude maps may be potential parameters in the assessment and monitoring of RP disease.
Nowadays, the role of biomedical images increases quickly due to clinical diagnostic and treatment techniques. The images offer crucial information for disease diagnosis, therapy planning, and patient status monitoring. However, properly analyzing and classifying these images is often a complex and challenging process. Machine-learning models are a powerful tool to automate this process and obtain more reliable results. On the other hand, the success of machine-learning models strongly depends on the quality and relevance of the features extracted from biomedical images. In this context, feature extraction is the process of extracting meaningful information from raw images and directly affects the performance of classification models. On biomedical images, these features are usually mathematical metrics representing visual features such as texture, shape, color, and so on. These selected features significantly improve the performance of machine-learning models in classification, segmentation, and other image analysis tasks. In recent years, feature extraction processes have been based on deep learning architectures such as Convolutional Neural Networks (CNNs). However, CNN-based approaches require large datasets for the classification of biomedical images [15,16,17,18,19]. This could limit the effectiveness of CNN models due to ethical restrictions and difficulties in accessing patient data and may lead to performance losses when working with smaller datasets. In this context, traditional handcrafted feature extraction methods such as grayscale, Gray Level Co-occurrence Matrix (GLCM), RGB, HSV, and histogram, which are widely preferred in the literature, are very useful, especially for small datasets due to their potential to achieve successful results with less data [20]. Hence, in this study, we propose the use of an innovative fusion model that combines handcrafted features from grayscale maps (gray tone and GLCM histogram features) and P1 wave amplitude maps (RGB and HSV histogram features) for automatic classification of RP stages with machine-learning models. In addition, this study aims to optimize the feature vector, identify the features that are important in the staging of RP, and improve the overall accuracy of machine-learning models through feature selection using the Random Forest [21] algorithm. This approach can increase the reliability of clinical decision support systems by achieving higher accuracy rates in diagnostic processes.
The main contributions of this paper are given below:
- Firstly, in this study, we present a novel method for automatic staging of RP by fusing handcrafted features extracted from VF grayscale maps and mfERG P1 wave amplitude maps and using them as input data to machine-learning algorithms such as Support Vector Machine (SVM), Decision Tree (DT), K-Nearest Neighbor (KNN), and Discriminant Analysis (DA). To the best of our knowledge, this is the first study to use grayscale maps and P1 wave amplitude maps for the staging of RP.
- Secondly, we determine the best handcrafted features to optimize the performance of machine-learning models by performing feature selection with the RF algorithm.
- Thirdly, this paper contributes to the field of ophthalmology by validating the effectiveness of grayscale maps and P1 wave amplitude maps in the staging of RP disease.
- Finally, our study shows that the automatic detection of RP stages can offer important support to researchers in managing the disease and determining optimal treatment.
Related Works
Previous studies have demonstrated that handcrafted features can successfully classify and detect diseases in a variety of medical images [22]. For example, it has been revealed that handcrafted features can be effectively used to classify diabetic retinopathy [23,24,25] and glaucoma [26,27] from fundus images, detect breast cancer [28,29] from histopathological images, and detect COVID-19 [30,31] from X-ray or computed tomography images. Nevertheless, there are no studies in the literature that employ handcrafted features in the staging of RP. Instead, more common in the literature are segmentation-based studies on the binary classification of RP as patient vs. health, multi-classification with other eye diseases, and segmentation-based studies for the diagnosis of RP. In this context, a few machine-learning papers on RP are discussed below.
Rashid et al. [32] proposed a modified Squeeze-and-Excitation ResNet (SE-ResNet) architecture to classify pigment landmarks in color fundus images of individuals with RP. They reported that this modified model exhibited high performance in successfully classifying different pigment types related to RP. Liu et al. [33] showed an Infant Retinal Intelligence Diagnostic System (IRIDS) for the early detection of nine different fundus diseases, including RP. This system classified fundus diseases with an average accuracy of 96.45% using deep learning techniques. Wang et al. [34] designed a deep learning-based platform to automatically identify 30 different fundus diseases (including RP) using ultra-wide angle fluorescence angiography images. Based on the ConvNeXt architecture, this system enabled diagnosis and evaluation with an accuracy comparable to retinal experts and achieved high AUC values on test datasets. Alharbi [35] developed a hybrid deep learning model to categorize five different diseases, glaucoma, normal, RP, maculopathy, and pathological myopia, from fundus images. This model is based on a classifier that includes preprocessing, vessel segmentation, feature extraction, and integration of SqueezeNet and a Long-Term Recurrent Convolutional Network (LRCN). As a result of the study, 98% accuracy was achieved. Arsalan et al. [36] proposed two CNN-based networks for the computer-aided diagnosis of RP: a single spatial combination network and a triple spatial combination network for segmentation. Their CNNs showed high performances in scanning individuals with RP and analyzing RP disease. Nagasato et al. [37] introduced a system based on deep learning models such as Visual Geometry Group-16, Residual Network-50, InceptionV3, DenseNet121, and EfficientNetB0 to predict the visual function of RP patients from ultra-wide-angle fundus autofluorescence images and objectively monitor disease progression. Wang et al. [38] compared deep learning model segmentation with manual correction to conventional manual grading (MG) in measuring the photoreceptor ellipsoid region area and outer segment volume in subjects with RP. Their findings revealed that this approach could reduce the burden of human assessors for the measurement of biomarkers in assessing disease progression and treatment outcomes. Chen et al. [39] employed a transfer learning-based model for the automatic detection of RP from color fundus photographs. They reported that the Xception model had the highest performance with 96%. Wang et al. [40] constructed a hybrid model combining U-Net and sliding window CNN models for the automatic segmentation of retinal layers in spectral domain OCT B-scans of patients with RP. They found that this hybrid model improved the measurement of retinal layer thickness. Khaing et al. [41] suggested a U-Net-based segmentation model named ChoroidNET for the segmentation of choroidal parameters using OCT images of RP patients. They presented that this approach provides a superior performance in both quantitative and qualitative segmentation of the choroidal layer and choroidal vessels. Masumoto et al. [42] reported that RP can be detected from healthy eyes with high sensitivity and specificity using deep neural networks on ultrawide-angle pseudo color and autofluorescence images. Iadanza et al. [43] developed a machine-learning-based clinical decision support system using pupillometry data to classify RP from control groups in pediatric patients. In their study, two separate SVM algorithms were used to classify the features obtained from pupillometric data, and 84.6% accuracy, 93.7% sensitivity, and 78.6% specificity rates were obtained from this system.
In this context, several methods have been developed for RP classification and analysis, but the existing focus is on identifying the different stages of RP. In this study, color and texture handcrafted features of grayscale maps and P1 wave amplitude maps are used to automatically classify the stages of RP.
2. Materials and Methods
This section explains the proposed approach to multi-classifying early stage (ES), mid-stage (MS), and advanced stage (AS) of RP using grayscale maps and P1 wave amplitude maps. Figure 1 shows the overall framework of the proposed approach. As shown in Figure 1, the various steps used in the classification of grayscale maps and P1 wave amplitude maps are detailed in the following sections.
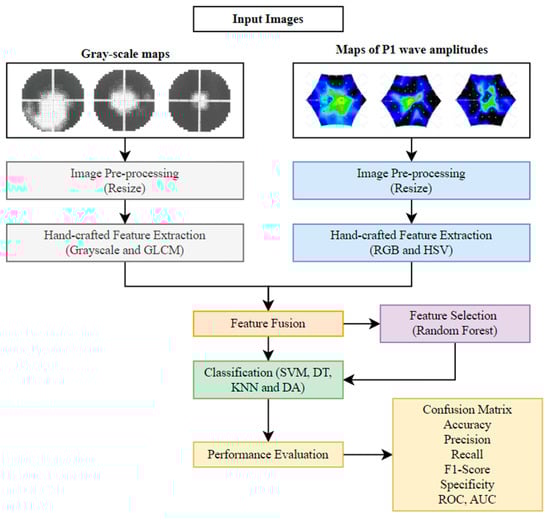
Figure 1.
Framework of the proposed approach.
2.1. Patients Database
For this research, the dataset was provided by the Ophthalmology Unit of Acıbadem Kayseri Hospital. The study was also approved by the Acıbadem Mehmet Ali Aydınlar University Medical Research Assessment Board (ATADEK), and the procedures were conducted in accordance with the Declaration of Helsinki (2023-16/553). All subjects who participated in the study were 18 years of age or older and were given comprehensive information and informed consent prior to participation in the experiments.
The diagnosis of RP was based on clinical history, VF tests, and mfERG recordings using a recording protocol in accordance with the International Society for Clinical Electrophysiology of Vision (ISCEV) standards. The VF test was performed on a Humphrey VF analyzer with the 30-2 program using the Swedish Interactive Threshold Algorithm (SITA) standard. The 30-2 program evaluates 30 fields at 76 points. In VF, the grayscale map is a visual representation of retinal sensitivity that numerically expresses the perceived stimulus intensity threshold in decibels (dB). The darker regions on these maps indicate reduced retinal sensitivity [10]. On the other hand, the mfERG test was performed on the Metrovision MonPackOne system in accordance with ISCEV standards to evaluate retinal function in detail. This test divides the retinal surface into 61 hexagonal regions, enabling simultaneous electrophysiologic responses to be obtained from each region [12]. The mfERG responses consist of three basic components, namely N1, P1, and N2. In particular, the P1 amplitude response gives important information about the functional condition of the retina [44]. The MonPackOne system automatically generates P1 wave amplitude maps based on P1 wave amplitudes recorded in each of the 61 hexagonal regions.
This experimental study recruited a total of 124 individuals with RP (67 right eyes and 57 left eyes). Also, patients with additional eye disorders such as uveitis, cataracts, and glaucoma were excluded. In this study, the staging of RP was performed by two expert physicians separately according to the grading criteria of the parameters of VF and mfERG tests in the work proposed by Oner and Kahraman [9]. As a result, individuals with RP were categorized into three stages: early (32 individuals), moderate (44 individuals), and advanced (48 individuals). Based on the staging, all demographic characteristics of the study subjects are presented in detail in Table 1. In addition, Figure 2 shows examples of grayscale maps and P1 wave amplitude maps of the three stages.

Table 1.
Demographic characteristics of the stages of RP.
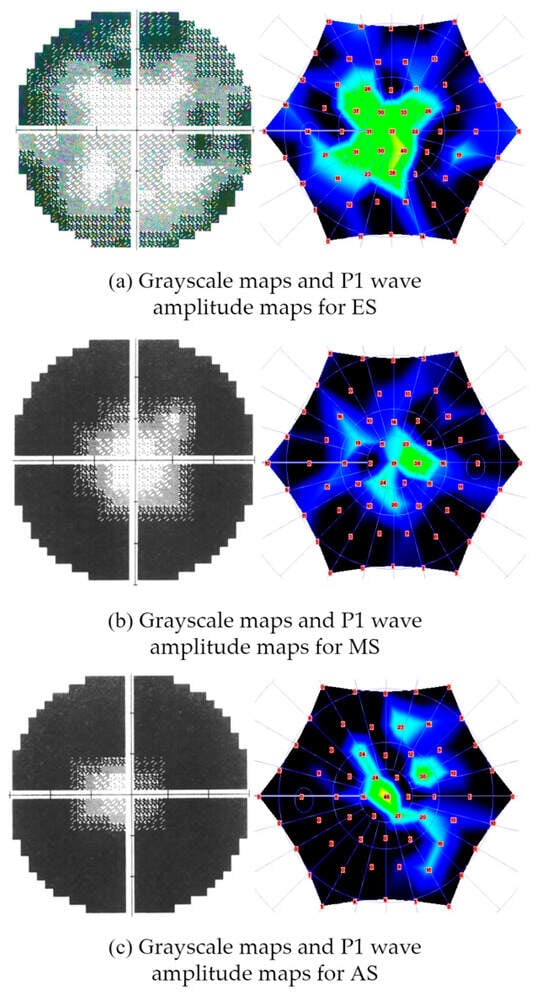
Figure 2.
Examples of grayscale maps and P1 wave amplitude maps of different stages of RP: (a) grayscale maps and P1 wave amplitude maps for early stage (ES), (b) grayscale maps and P1 wave amplitude maps for mid-stage (MS), (c) grayscale maps and P1 wave amplitude maps for advanced stage (AS).
2.2. Preprocessing
The grayscale maps and P1 wave amplitude maps for this study were obtained from different medical modalities, so there are size differences between these maps. Before feature extraction, these maps were resized to ensure consistency in the analytic process. In this context, the original size of the grayscale maps was 910 × 1070 pixels, and the P1 wave amplitude maps were 680 × 720 pixels; both maps were resized to 390 × 440 pixels.
2.3. Handcrafted Feature Extraction
The proposed approach for multiple classifications of RP as ES, MS, and AS in grayscale maps and P1 wave amplitude maps is based on handcrafted features. Handcrafted features are obtained by analyzing the information on images using computational methods. These represent complex information in a simpler way, optimizing the use of resources such as memory and computational power. In this approach, due to the importance of color and texture features in staging RP, we extract histogram-based statistical and GLCM texture features from grayscale maps and RGB and HSV color space features from P1 wave amplitude maps. We then fuse the features extracted from these two maps. Details about these extracted features are presented below:
Gray Level Co-occurrence Matrix (GLCM): The Gray Level Co-occurrence Matrix (GLCM) developed by Haralick et al. [45] calculates the frequency of occurrence of certain gray level pixels with neighboring pixels at different angles in grayscale images. Features such as homogeneity, contrast, correlation, and energy are obtained using these four different angles (0°, 45°, 90°, and 135°) [20]. As a result, a 16-dimensional feature vector was extracted from grayscale maps using GLCM.
Gray tone: Gray tone is an image analysis process that represents the brightness levels in an image only in shades of gray between black and white. A 6-dimensional feature vector is obtained by calculating color space features such as mean, standard deviation, skewness, energy, entropy, and kurtosis using the histogram of grayscale maps.
Color space: Color space is a system in which each color in an image is numerically described by specific coordinates. In this study, RGB and HSV color spaces are utilized to extract features from P1 wave amplitude maps based on histograms. RGB is preferred for the study of intensity distributions in the red, green, and blue color channels. HSV is applied for detailed characterization of hue, saturation, and brightness components [46]. We extracted features such as mean, standard deviation, skewness, energy, entropy, and kurtosis using RGB and HSV histograms [47]. These two-color spaces obtained a total of 36 features. Accordingly, a total of 58-dimensional feature vectors were created by fusing the features extracted from the grayscale maps and P1 wave amplitude maps to identify the stages of RP. The formulas and definitions of the statistical features obtained from this gray tone, GLCM, RGB, and HSV are shown in Table 2.
Table 2.
The formulas and definitions of statistical features obtained from GLCM, RGB, and HSV.
2.4. Feature Selection Based on Random Forest (RF)
Feature selection is a key step used to optimize the performance of machine-learning models and ensure that the models are not affected by redundant information. To select features, we use the Random Forest (RF) algorithm, which has shown strong performance in analyzing data and is popular among machine-learning approaches. The basis of RF-based feature selection is the use of the Gini index or the out-of-bag (OOB) error rate to assess the impact of each feature during model training, thereby quantitatively measuring the importance of the features [48]. Accordingly, the steps of the RF feature selection approach are described below:
Step 1:
K classification trees are generated from the original training dataset. K is the number of trees used in the model. This step includes building different trees using different subsets of the dataset.
Step 2:
For each tree, OOB samples are created. These samples consist of data not used during model training. The error of the OOB samples for each tree t is expressed as .
Step 3:
The value of each feature is randomly shuffled across samples to create a corrupted sample . This sample is used to measure the impact of features on model performance. The importance of the feature is calculated by the formula in Equation (1) [49]:
Here, the feature importance value ( indicates how much a particular feature contributes to the prediction performance. In the proposed study, the number of 100 trees is used, which has led to successful results in previous studies [50].
The RF approach calculates the importance score of each feature and ranks them; however, it does not directly determine the optimal number of features to include in the classification. Therefore, in this study, the features ranked by RF were sorted in descending order based on their importance scores. Subsequently, the top 5, 6, 7, 8, and 9 features were incrementally evaluated, and classification was performed at each step to analyze changes in model performance. This stepwise strategy helped to reduce redundant information while improving computational efficiency [50].
2.5. Machine-Learning Models with All Features and Selected Features
In this study, four different classification models were used to predict RP stages with 58 features extracted from grayscale maps and P1 wave amplitude maps. These models are the well-known SVM, DT, KNN, and DA algorithms. The hyperparameters of the models are tuned using Grid Search (GS) to achieve an optimal classification performance. The following describes the main features of the four machine-learning models:
- Support Vector Machine (SVM) is a commonly used machine-learning algorithm designed to classify both linear and nonlinear separable datasets by forming an optimal hyperplane that maximizes the margin between classes. To establish the basic structure of the SVM, the regularization parameter C, the kernel function, the kernel degree, and the coding method need to be determined. Accordingly, GS was applied to determine the optimal hyperparameters, and 1000 was chosen as the regularization parameter C, Gaussian (RBF) as the kernel function, 2.2 as the kernel order, and one vs. one as the coding method.
- Decision Tree (DT) is a machine-learning classifier that can be applied to regression and classification problems by operating based on a divide-and-conquer strategy. It consists of a tree structure where each internal node represents a decision rule, and the leaf nodes correspond to class labels. The classification process starts at the root node, where the samples are recursively split according to their feature values until they reach a terminal leaf node. To improve the classification performance of the DT model, it is important to determine its hyperparameters. In this context, the optimal configuration using GS involved setting the minimum number of leaf node observations to 1, the maximum number of decision splitting operations to 32, and the splitting criterion to 2.
- K-Nearest Neighbor (KNN) is a distance-based supervised learning algorithm used for classification and regression tasks. Unlike other algorithms, KNN does not create an explicit training phase; instead, it stores all training set samples and classifies new data based on similarity measures. The classification process involves calculating the distance between a new data point and all training set instances and assigning the class label based on the majority vote of k nearest neighbors. The value of k (the number of neighbors) and the distance metric used are two key hyperparameters that significantly affect the performance of the KNN model. Therefore, the choice of optimal hyperparameters is critical. In this study, the k parameter of the KNN model is set to 2, and the distance metric is set to Cityblock using the GS method.
- Discriminant Analysis (DA) is a statistical and machine-learning model applied to data visualization, classification, and dimensionality reduction tasks. This model aims to separate different classes in a dataset by finding a discriminant function that maximizes the separation between them. DA can be grouped into Linear Discriminant Analysis (LDA) and Quadratic Discriminant Analysis (QDA), both of which are widely used in various classification problems. LDA assumes that different classes share the same covariance matrix, leading to linear decision boundaries, while QDA allows each class to have its own covariance matrix, leading to quadratic decision boundaries. In this study, GS was applied to the type of discriminant function and the amount of regularization to improve the classification performance by optimizing the hyperparameters of the DA model. As a result, QDA is set as the optimal discriminant function, and the optimal gamma value is set to 0.
In addition, using the RF model in this study, the 9 features with the highest importance among 58 features were identified. These features were gradually added to the dataset in order of importance (first 5, then 6, 7, 8, and 9 features) in different combinations and used for the staging of RP with the four machine-learning algorithms described.
2.6. Performance Evaluation Metrics
To evaluate the performance of classification models and ensure their reliability and generalizability is a fundamental approach in machine learning. Especially in the case of medical data classification, several well-known performance metrics are used to evaluate the efficiency of a model. In this study, confusion matrix, accuracy, precision, recall, F1 score, specificity, Receiver Operating Characteristic (ROC) curve, and Area Under the Curve (AUC) are used to assess classification performance. The definitions of these metrics are presented in the figure below:
- The confusion matrix enables a comprehensive summary of a classifier’s predictions by comparing predicted to actual class labels. It is made up of four basic components. These are true positives (TPs), representing correctly classified positive examples; true negatives (TNs), representing correctly classified negative examples; false positives (FPs), where negative examples are misclassified as positive; and false negatives (FNs), where positive examples are misclassified as negative.
- Accuracy is a metric that represents the ratio of correctly classified samples to the total number of samples. It is expressed as Equation (2) below:
- Precision, also known as positive predictive value, measures the proportion of correctly predicted positive samples among all samples classified as positive. It is calculated by the formula given in Equation (3):
- Recall, also named sensitivity, measures the model’s ability to correctly identify all positive samples. It is calculated by the formula in Equation (4):
- The F1 score represents the harmonic mean of precision and recall and provides a balanced measure when both false positives and false negatives need to be minimized. The formula for this metric is presented in Equation (5):
- Specificity, also known as true negative rate, determines the ability of the classifier to correctly identify negative examples. Equation (6) defines the formula for specificity:
- The ROC curve is a graph which shows the relationship between the true positive rate (TPR) and the false positive rate (FPR). AUC, a summary indicator of this curve, is used to measure the success of the classifier in distinguishing between different classes. The formula for AUC is given in Equation (7) [51]:
3. Results
In this section, we present the results for the staging of RP using machine-learning models such as SVM, DT, KNN, and QDA. Our approach is the first study to use both modalities for the automatic staging of RP by combining handcrafted features extracted from VF grayscale maps and mfERG P1 wave amplitude maps. Furthermore, we performed feature selection using the RF algorithm, allowing us to identify the most important features and optimize the classification performance. The classification results obtained using all extracted features are compared with those obtained after RF-based feature selection, highlighting the impact of feature reduction on staging accuracy.
3.1. Experimental Setup
The dataset used in this study consists of a total of 124 images belonging to three classes. In this paper, 5-fold cross-validation (CV) is used to ensure a robust performance evaluation of the proposed model. In the 5-fold CV approach, the dataset is randomly divided into five equal folds. During each iteration, four folds are used for training and one fold for testing. This process is repeated five times, allowing each fold to be used as a test set exactly once. In each iteration, the model is trained on the training folds and evaluated on the testing fold so that the model learns efficiently. When the training process is complete for all folds, CV-based overall scores for the confusion matrices, accuracy, precision, sensitivity, specificity, F1 score, and AUC metrics are extracted, enabling a comprehensive evaluation of the model’s performance. Figure 3 shows the scheme of the 5-fold CV. This proposed method is implemented in Python 3.8.10 on a 12th Generation Intel(R) Core (TM) i7-12650H 2.30 GHz processor using the Keras framework within the Spyder environment. For image preprocessing and performance evaluation, the NumPy, Pandas, OpenCV, and scikit-learn libraries were utilized.
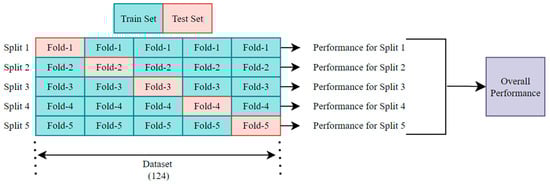
Figure 3.
The scheme of k-fold cross-validation with k = 5.
3.2. Evaluation of Feature Selection with RF
In this study, gray tone and GLCM texture features were extracted from grayscale maps to obtain a total of 22 features, and RGB and HSV color space features were extracted from P1 wave amplitude maps to obtain a total of 36 features to estimate the stage of RP. A total of 58 features extracted from these two maps were then fused to generate a comprehensive feature vector for analysis. However, since the performance evaluation of such a large feature vector may increase the computational cost for machine-learning algorithms, the RF method was used for feature selection.
Figure 4 shows the ranking of 58 features according to their importance scores calculated by the RF method. Since using all 58 features may introduce redundant information and reduce computational efficiency, the selection of the most relevant features becomes essential for optimal classification. Therefore, the top-ranked features were incrementally evaluated, and it was observed that model performance improved up to the inclusion of the seventh feature but started to decline thereafter. As a result of the analysis, nine features with the highest importance were selected to evaluate the classification performance. The names of the selected features, the imaging modality they belong to, and their importance scores are listed in detail in Table 3. According to the results in Table 3, the feature with the highest importance score is RGB Entropy_R (0.6118), extracted from the mfERG P1 wave amplitude maps. This is followed by GLCM Contrast_90° (0.5290), extracted from VF grayscale maps.
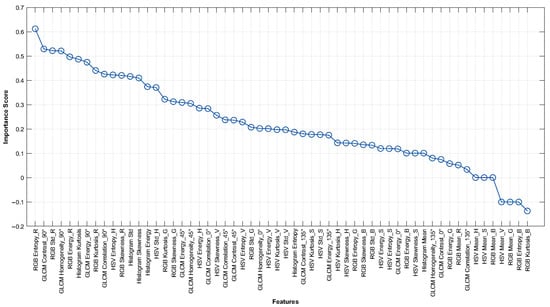
Figure 4.
Feature importance ranking of 58 features obtained from grayscale and P1 wave amplitude maps based on RF algorithm.
Table 3.
Importance scores of the 9 selected features using the RF algorithm.
When the distribution of the features is examined, it appears that four of the nine features selected by the RF method were obtained from the mfERG imaging modality, while five were obtained from the VF imaging technique. In this context, RGB color space features (RGB Entropy_R, RGB Std_R, RGB Energy_R, and RGB Kurtosis_R) extracted from mfERG P1 wave amplitude maps seem to have high importance scores. On the other hand, GLCM-based textural features (Contrast_90°, Homogeneity_90°, Energy_90°, and Correlation_90°) extracted from the VF grayscale maps are observed to be prominent.
3.3. Results of Classification Models with All Features
This section presented the performance results of four different machine-learning models, SVM, DT, KNN, and QDA, in staging RP using all extracted features. The performance metrics of these models, including overall accuracy, precision, recall, F1 score, and specificity, are shown in Table 4. According to this table, SVM outperformed the other models in terms of these metrics with values of 0.8710, 0.8677, 0.8839, 0.8758, and 0.9328, respectively.
Table 4.
The overall performance metrics of classification models with all features.
In addition, Figure 5 and Figure 6 show the overall confusion matrices and ROC curves for each model, respectively. The confusion matrices indicated that the number of misclassifications for SVM, DT, KNN, and QDA models was 16, 19, 18, and 28, respectively. As a result, the SVM model obtained the lowest number of misclassifications. When the ROC curves were examined, it was seen that the SVM model distinguished the ES, MS, and AS classes in the achievement of the best performance. The AUC scores for these classes were calculated as 0.978, 0.952, and 0.986, respectively.
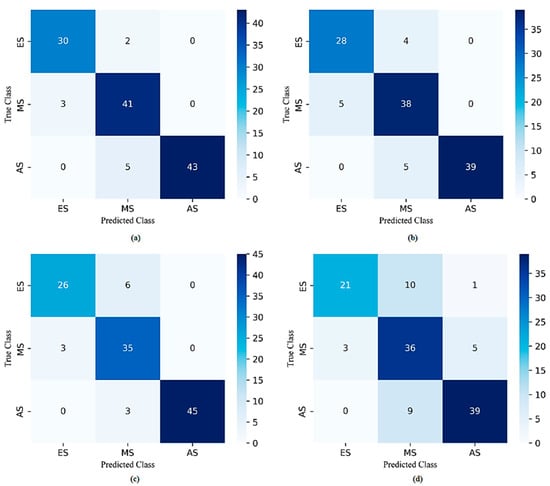
Figure 5.
The overall confusion matrices of (a) SVM, (b) DT, (c) KNN, and (d) QDA with all features.
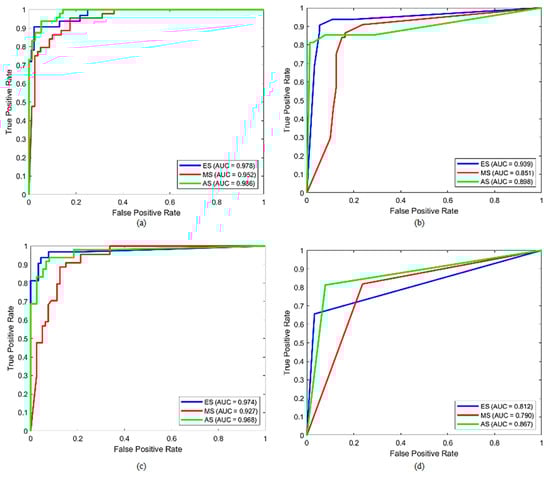
Figure 6.
The overall ROC curves of (a) SVM, (b) DT, (c) KNN, and (d) QDA with all features.
3.4. Results of Machine Learning Models with Selected Features with RF Algorithm
In this section, the nine features with the highest importance determined using the RF algorithm are gradually added to the dataset in order of importance, and the classification results are evaluated with different combinations. First, classification was performed using the first five features, and then the analysis was extended by adding six, seven, eight, and nine features. In this process, SVM, DT, KNN, and QDA models were used to stage the RP. Table 5 presents the overall performance metrics obtained from the classification processes of these models using five, six, seven, eight, and nine features. According to this table, the SVM model achieved the highest performance in the classification with five features, yielding an accuracy of 0.9355, precision of 0.9362, recall of 0.9402, F1 score of 0.9382, and specificity of 0.9670, making it the most successful classifier. When six features were used, the SVM model outperformed the others, achieving 0.9435 accuracy, 0.9419 precision, 0.9423 recall, 0.9421 F1 score, and 0.9715 specificity. For seven features, the SVM model performed the best, achieving 0.9839 accuracy, 0.9826 precision, 0.9855 recall, 0.9841 F1 score, and 0.9917 specificity. For eight features, the SVM model obtained the highest performance with accuracy, precision, recall, F1 score, and specificity values of 0.9516, 0.9501, 0.9574, 0.9537, and 0.9743, respectively. Finally, using nine features, the SVM model achieved 0.9435 accuracy, 0.9426 precision, 0.9506 recall, 0.9466 F1 score, and 0.9700 specificity, making it the best-performing classifier.
Table 5.
The overall performance metrics of the machine-learning models with the selected features using the RF algorithm.
Furthermore, the results indicated that the best classification performance in all of the SVM, DT, KNN, and QDA models was obtained when seven features were used: RGB Entropy_R, GLCM Contrast_90°, RGB Std_R, GLCM Homogeneity_90°, RGB Energy_R, Histogram Kurtosis, and GLCM Energy_90°. Accordingly, Figure 7 and Figure 8 depict the overall confusion matrices and ROC curves obtained with the dataset generated using the seven best-performing features for each model, respectively. When the confusion matrices were analyzed, the number of misclassifications for SVM, DT, KNN, and QDA models was 2, 10, 4, and 6, respectively. According to these results, the SVM model had the lowest number of misclassifications. When the ROC curves were analyzed, it was determined that the SVM model discriminated the ES, MS, and AS classes as the best model. The AUC scores calculated for these classes were 0.999, 0.998, and 1.0, respectively.
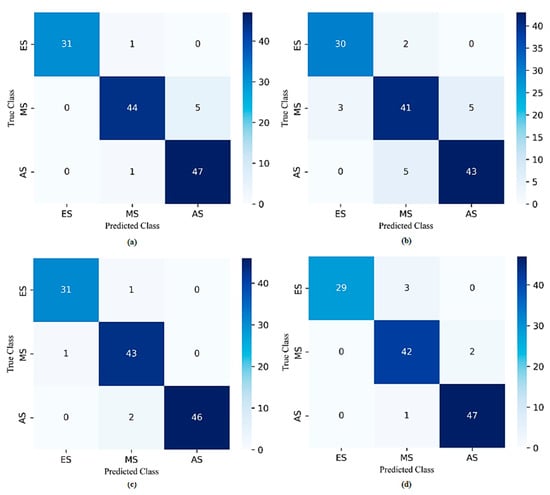
Figure 7.
The overall confusion matrices of (a) SVM, (b) DT, (c) KNN, and (d) QDA for the 7 best-performing selected features with the RF algorithm.
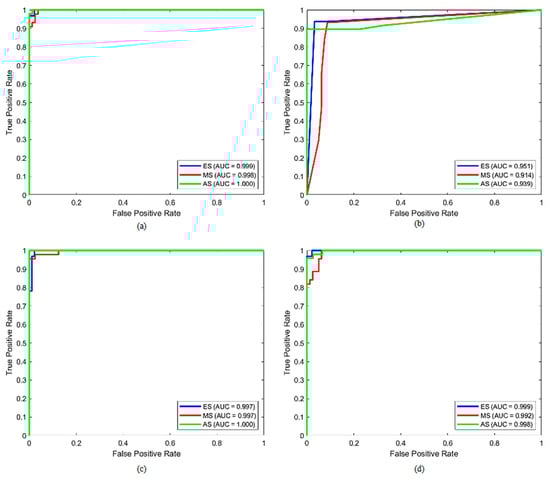
Figure 8.
The overall ROC curves of (a) SVM, (b) DT, (c) KNN, and (d) QDA of the 7 best-performing selected features with the RF algorithm.
3.5. Comparative Analysis of Performance Evaluation of Classification Models
In this study, accuracy, precision, recall, F1 score, and specificity were used to evaluate the performance of the machine-learning models. Accordingly, the experimental results of the models using all features and the models trained with the seven most important features selected by the RF algorithm are shown in Figure 9. The results show that the models using the seven selected features outperformed the models using all features in terms of accuracy, precision, recall, F1 score, and specificity. According to these results, the SVM model with the best performance increased accuracy by 11%, precision by 11%, recall by 11%, F1 score by 10%, and specificity by 6%, approximately.
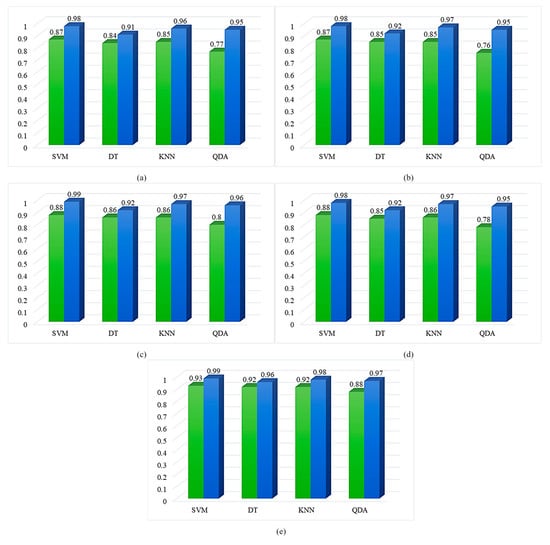
Figure 9.
Comparative analysis of the overall (a) accuracy, (b) precision, (c) recall, (d) F1 score, and (e) specificity of the classification models using all features (green bars) and with the 7 most important features (blue bars) selected by the RF algorithm.
4. Discussion
In this research, we evaluated handcrafted features extracted from VF grayscale maps and mfERG P1 wave amplitude maps to objectively and automatically classify the stages of RP disease. These features were provided as input to machine-learning models, including SVM, DT, KNN, and QDA, and used to discriminate the ES, MS, and AS of RP. In addition, the performance of the models was optimized by using the RF algorithm for feature selection. The results show that SVM can detect the stages of RP with high accuracy rates.
In the study, when all features were used, SVM outperformed the other models, with 87.10% accuracy, 86.77% precision, 88.39% recall, 87.58% F1 score, and 93.28% specificity scores. These findings showed that the SVM model was more effective in classifying the stages of RP compared to the other models. Furthermore, in the classification process, the most important features determined after feature selection with the RF algorithm were gradually evaluated. In the first stage, the models were trained using the five features with the highest importance score, and then the models were retrained by adding one more feature with a high importance score to this training set (top six features). This process continued with the addition of the first seven, eight, and nine features, respectively, and the classification performance of the models was obtained at each step. The results showed that when using the first seven selected features by the RF algorithm, the SVM model achieved the highest performance, obtaining 98.39% accuracy, 98.26% precision, 98.55% recall, 98.41% F1 score, and 99.17% specificity. These findings highlighted the significant impact of feature selection on improving classification performance and the importance of selecting the most discriminative features for the accurate staging of RP.
Moreover, as a result of the analysis, it was determined that the seven features that performed the best in all models were RGB Entropy_R, GLCM Contrast_90°, RGB Std_R, GLCM Homogeneity_90°, RGB Energy_R, Histogram Kurtosis, and GLCM Energy_90°. In this context, GLCM-based texture features extracted from grayscale maps and RGB-based color space features extracted from P1 wave amplitude maps were crucial in determining the stages of RP. In particular, GLCM-based texture features successfully reflect texture differences in grayscale maps, as well as RGB and HSV histogram-based color features effectively representing color variations in P1 wave amplitude maps. These results suggest that selecting the features used to detect the stages of RP not only from a single modality but also from a fusion of different structural and color-based features improves the classification accuracy.
This paper also separately evaluated 22 features extracted from grayscale maps and 36 features extracted from P1 wave amplitude maps. Classification was implemented using the SVM algorithm, which obtained the highest performance among the tested classifiers. Using only the features of the grayscale maps, SVM obtained 83.87% accuracy, 83.11% precision, 83.64% recall, 83.37% F1 score, and 91.83% specificity. Similarly, using only features extracted from P1 wave amplitude maps resulted in 83.06% accuracy, 82.77% precision, 83.42% recall, 83.09% F1 score, and 91.34% specificity. Nevertheless, fusing these feature sets into a 58-dimensional vector and applying SVM resulted in a significant improvement of the classification metrics: 87.10% accuracy, 86.77% precision, 88.39% recall, 87.58% F1 score, and 93.28% specificity. These findings demonstrated that the fusion of features extracted from different imaging modalities leads to a significant performance improvement in RP staging and underlines the relevance of both grayscale structural maps and P1-based functional data. In addition to the handcrafted feature evaluation, we also investigated the classification performance of deep features extracted from well-known pre-trained CNNs, namely AlexNet, VGG16, and ResNet18. Using 4096, 4096, and 512 deep features extracted from these models, respectively, classified with SVM resulted in accuracy scores of 85.48%, 83.87%, and 85.48%. Our proposed handcrafted feature fusion method outperforms these models, achieving an accuracy of 87.10% with all features and a significantly higher accuracy of 98.39% when using the first seven selected features. This result supports the idea that handcrafted features guided by domain knowledge can offer a competitive and, in some cases, superior performance compared to deep learning models, especially in small and medium-sized datasets, while also offering better interpretability.
Accordingly, in this study, we adapted handcrafted techniques, including GLCM-based texture features [23,52], grayscale features [53,54], and RGB and HSV color space statistical features [55], which have been widely used in the literature for multiple classifications of various retinal diseases and have shown successful results, to identify the stages of RP. As a result, the selection of these features in accordance with the studies in the literature played an important role in the successful identification of the stages of RP. We also improved the performance of our approach by performing feature selection using the RF algorithm, which determines the importance of the features in the dataset and selects the features with the highest discriminative value. After feature selection, we obtained remarkable improvements in the overall performance metrics of the machine-learning models.
However, this study has several limitations. Firstly, the research dataset is limited to one country and one hospital, which may affect the reliability of the findings. Since artificial intelligence models—particularly machine-learning algorithms—typically benefit from large and diverse datasets, this limitation could impact the robustness of the proposed approach. To address this issue, future studies aim to expand the dataset by collecting additional cases from different hospitals and countries, which will help to enhance the model’s ability to generalize across various clinical settings. Secondly, only grayscale maps and P1 wave amplitude maps were used in this study. In future studies, the performance of the model can be further improved by including extracted features from other imaging modalities, such as OCT images and fundus photographs.
5. Conclusions
The previous studies focused on determining the diagnosis of RP using segmentation-based methods [32,36,38,40,41], classifying healthy individuals with RP [39,42,43], and differentiating RP from other retinal diseases [33,34,35]. However, studies to determine the severity of RP disease are limited, and the existing studies rely on assessing RP in a mostly manual way. In this regard, Iftikhar et al. [8] aimed to determine the severity of RP using VA, VF width, and OCT ellipsoid zone width parameters. Similarly, Öner and Kahraman [9] emphasized the importance of electrophysiological tests in determining the severity of RP by integrating mfERG P1 wave amplitudes into these parameters. Both approaches depend directly on ophthalmologists’ interpretations and use manual methods to determine the severity of RP. In this study, unlike the existing studies, we proposed a novel approach based on machine-learning models by fusing image features of VF grayscale and mfERG P1 wave amplitude maps to objectively and automatically determine the stages of RP. The results showed that the SVM algorithm can classify the stages of RP with high accuracy rates. Moreover, feature selection by the RF algorithm significantly improved the classification performance.
In recent years, successful applications of deep learning models have been reported for multi-class retinal disease staging, such as diabetic retinopathy [56,57], glaucoma [58], and age-related macular degeneration [59]. However, these models are limited in terms of practical applicability for rare diseases such as RP due to their complex architecture, high computational requirements, and dependence on large-scale datasets. The long data-collection time and heterogeneous clinical findings in diseases such as RP make it difficult to develop deep learning-based staging systems. In contrast, our approach focuses on a staging framework for RP by utilizing well-known machine-learning classifiers. This approach can offer a practical and interpretable solution that can assist ophthalmologists in managing RP and planning personalized treatment strategies by enabling fast and accurate staging of the disease.
Author Contributions
Conceptualization, B.K., A.Ö. and A.G.; methodology, B.K.; software, B.K.; validation, B.K., A.Ö., N.S.K. and A.G.; formal analysis, B.K. and A.G.; investigation, B.K., A.Ö., N.S.K. and A.G.; resources, B.K., A.Ö., N.S.K. and A.G.; data curation, B.K., N.S.K. and A.Ö.; writing—original draft preparation, B.K.; writing—review and editing, B.K., A.Ö., N.S.K. and A.G.; visualization, B.K.; supervision, A.Ö., N.S.K. and A.G.; project administration, B.K., A.Ö. and A.G. All authors have read and agreed to the published version of the manuscript.
Funding
This research is a part of an ongoing project related to a PhD thesis funded by TÜBİTAK (The Scientific and Technological Research Council of Türkiye), 1002A Short Term R&D Funding Program (Project No: 123E388, Project Title: Staging of Retinitis Pigmentosa with Machine-Learning Algorithms Using Multifocal Electroretinogram Stimulus Responses and Amplitude-Latency Maps).
Institutional Review Board Statement
For this research, the dataset was provided by the Ophthalmology Unit of Acıbadem Kayseri Hospital. The study was also approved by the Acıbadem Mehmet Ali Aydınlar University Medical Research Assessment Board (ATADEK), and the procedures were conducted in accordance with the Declaration of Helsinki (2023-16/553; date of approval 16 October 2023).
Informed Consent Statement
Informed consent was obtained from all subjects involved in this study.
Data Availability Statement
The data presented in this study is available on request from the corresponding author.
Acknowledgments
This study was supported by the Scientific and Technological Research Council of Türkiye (TÜBITAK) under Grant Number 123E388. The authors thank TÜBITAK for their support.
Conflicts of Interest
The author Ayşe Öner was employed by the hospital Acibadem Taksim. The remaining authors declare that the research was conducted in the absence of any commercial or financial relationships that could be construed as a potential conflict of interest.
Abbreviations
The following abbreviations are used in this manuscript:
| RP | Retinitis Pigmentosa |
| VA | Visual acuity |
| VF | Visual field |
| OCT | Optical coherence tomography |
| MfERG | Multifocal electroretinography |
| CNN | Convolutional Neural Networks |
| GLCM | Gray Level Co-occurrence Matrix |
| SVM | Support Vector Machine |
| DT | Decision Tree |
| KNN | K-Nearest Neighbor |
| DA | Discriminant Analysis |
| ES | Early stage |
| MS | Mid-stage |
| AS | Advanced stage |
| QDA | Quadratic Discriminant Analysis |
References
- Grossniklaus, H.E.; Geisert, E.E.; Nickerson, J.M. Introduction to the Retina. In Progress in Molecular Biology and Translational Science; Elsevier: Amsterdam, The Netherlands, 2015; Volume 134, pp. 383–396. ISBN 978-0-12-801059-4. [Google Scholar]
- Badar, M.; Haris, M.; Fatima, A. Application of Deep Learning for Retinal Image Analysis: A Review. Comput. Sci. Rev. 2020, 35, 100203. [Google Scholar] [CrossRef]
- Qi, X.-Y.; Mi, C.-H.; Cao, D.-R.; Chen, X.-Q.; Zhang, P. Retinitis Pigmentosa and Stem Cell Therapy. Int. J. Ophthalmol. 2024, 17, 1363–1369. [Google Scholar] [CrossRef]
- Huang, Z.-Y.; Liang, L.-N.; Li, Y.-M.; Xu, K.; Li, X.-Y. Genetic, Environmental and Other Risk Factors for Progression of Retinitis Pigmentosa. Int. J. Ophthalmol. 2022, 15, 828–837. [Google Scholar] [CrossRef] [PubMed]
- Hamel, C. Retinitis Pigmentosa. Orphanet J. Rare Dis. 2006, 1, 40. [Google Scholar] [CrossRef] [PubMed]
- Wu, K.Y.; Kulbay, M.; Toameh, D.; Xu, A.Q.; Kalevar, A.; Tran, S.D. Retinitis Pigmentosa: Novel Therapeutic Targets and Drug Development. Pharmaceutics 2023, 15, 685. [Google Scholar] [CrossRef] [PubMed]
- Dias, M.F.; Joo, K.; Kemp, J.A.; Fialho, S.L.; Da Silva Cunha, A.; Woo, S.J.; Kwon, Y.J. Molecular Genetics and Emerging Therapies for Retinitis Pigmentosa: Basic Research and Clinical Perspectives. Progress. Retin. Eye Res. 2018, 63, 107–131. [Google Scholar] [CrossRef]
- Iftikhar, M.; Lemus, M.; Usmani, B.; Campochiaro, P.A.; Sahel, J.A.; Scholl, H.P.N.; Shah, S.M.A. Classification of Disease Severity in Retinitis Pigmentosa. Br. J. Ophthalmol. 2019, 103, 1595–1599. [Google Scholar] [CrossRef]
- Oner, A.; Kahraman, N.S. A New Classification for Retinitis Pigmentosa Including Multifocal Electroretinography to Evaluate the Disease Severity. Open J. Ophthalmol. 2023, 13, 37–47. [Google Scholar] [CrossRef]
- Wong, S.H.; Plant, G.T. How to Interpret Visual Fields. Pract. Neurol. 2015, 15, 374–381. [Google Scholar] [CrossRef]
- Nguyen, X.-T.-A.; Moekotte, L.; Plomp, A.S.; Bergen, A.A.; Van Genderen, M.M.; Boon, C.J.F. Retinitis Pigmentosa: Current Clinical Management and Emerging Therapies. IJMS 2023, 24, 7481. [Google Scholar] [CrossRef]
- Hoffmann, M.B.; Bach, M.; Kondo, M.; Li, S.; Walker, S.; Holopigian, K.; Viswanathan, S.; Robson, A.G. ISCEV Standard for Clinical Multifocal Electroretinography (mfERG) (2021 Update). Doc. Ophthalmol. 2021, 142, 5–16. [Google Scholar] [CrossRef] [PubMed]
- Oner, A.; Kahraman, N.S. Suprachoroidal Umbilical Cord Derived Mesenchymal Stem Cell Implantation for the Treatment of Retinitis Pigmentosa in Pediatric Patients. Am. J. Stem Cell Res. 2023, 5, 1–7. [Google Scholar]
- Kahraman, N.S.; Oner, A. Umbilical Cord Derived Mesenchymal Stem Cell Implantation in Retinitis Pigmentosa: A 6-Month Follow-up Results of a Phase 3 Trial. Int. J. Ophthalmol. 2020, 13, 1423–1429. [Google Scholar] [CrossRef]
- Suzuki, K. Overview of Deep Learning in Medical Imaging. Radiol. Phys. Technol. 2017, 10, 257–273. [Google Scholar] [CrossRef]
- Lahmiri, S.; Boukadoum, M. Hybrid Discrete Wavelet Transform and Gabor Filter Banks Processing for Features Extraction from Biomedical Images. J. Med. Eng. 2013, 2013, 1–13. [Google Scholar] [CrossRef] [PubMed]
- Dimitrovski, I.; Kocev, D.; Kitanovski, I.; Loskovska, S.; Džeroski, S. Improved Medical Image Modality Classification Using a Combination of Visual and Textual Features. Comput. Med. Imaging Graph. 2015, 39, 14–26. [Google Scholar] [CrossRef]
- Kommineni, J.; Mandala, S.; Sunar, M.S.; Chakravarthy, P.M. Accurate Computing of Facial Expression Recognition Using a Hybrid Feature Extraction Technique. J. Supercomput. 2021, 77, 5019–5044. [Google Scholar] [CrossRef]
- Nanni, L.; Brahnam, S.; Ghidoni, S.; Lumini, A. Bioimage Classification with Handcrafted and Learned Features. IEEE/ACM Trans. Comput. Biol. Bioinf. 2019, 16, 874–885. [Google Scholar] [CrossRef]
- Bansal, P.; Garg, R.; Soni, P. Detection of Melanoma in Dermoscopic Images by Integrating Features Extracted Using Handcrafted and Deep Learning Models. Comput. Ind. Eng. 2022, 168, 108060. [Google Scholar] [CrossRef]
- Saraswat, M.; Arya, K.V. Feature Selection and Classification of Leukocytes Using Random Forest. Med. Biol. Eng. Comput. 2014, 52, 1041–1052. [Google Scholar] [CrossRef]
- Li, X.; Li, L.; Jiang, Y.; Wang, H.; Qiao, X.; Feng, T.; Luo, H.; Zhao, Y. Vision-Language Models in Medical Image Analysis: From Simple Fusion to General Large Models. Inf. Fusion. 2025, 118, 102995. [Google Scholar] [CrossRef]
- Hardas, M.; Mathur, S.; Bhaskar, A.; Kalla, M. Retinal Fundus Image Classification for Diabetic Retinopathy Using SVM Predictions. Phys. Eng. Sci. Med. 2022, 45, 781–791. [Google Scholar] [CrossRef]
- Tăbăcaru, G.; Moldovanu, S.; Răducan, E.; Barbu, M. A Robust Machine Learning Model for Diabetic Retinopathy Classification. J. Imaging 2023, 10, 8. [Google Scholar] [CrossRef]
- Ramasamy, L.K.; Padinjappurathu, S.G.; Kadry, S.; Damaševičius, R. Detection of Diabetic Retinopathy Using a Fusion of Textural and Ridgelet Features of Retinal Images and Sequential Minimal Optimization Classifier. PeerJ Comput. Sci. 2021, 7, e456. [Google Scholar] [CrossRef] [PubMed]
- Raveenthini, M.; Lavanya, R. Multiocular Disease Detection Using a Generic Framework Based on Handcrafted and Deep Learned Feature Analysis. Intell. Syst. Appl. 2023, 17, 200184. [Google Scholar] [CrossRef]
- Aljohani, A.; Aburasain, R.Y. A Hybrid Framework for Glaucoma Detection through Federated Machine Learning and Deep Learning Models. BMC Med. Inform. Decis. Mak. 2024, 24, 115. [Google Scholar] [CrossRef]
- Ameh Joseph, A.; Abdullahi, M.; Junaidu, S.B.; Hassan Ibrahim, H.; Chiroma, H. Improved Multi-Classification of Breast Cancer Histopathological Images Using Handcrafted Features and Deep Neural Network (Dense Layer). Intell. Syst. Appl. 2022, 14, 200066. [Google Scholar] [CrossRef]
- Al-Jabbar, M.; Alshahrani, M.; Senan, E.M.; Ahmed, I.A. Analyzing Histological Images Using Hybrid Techniques for Early Detection of Multi-Class Breast Cancer Based on Fusion Features of CNN and Handcrafted. Diagnostics 2023, 13, 1753. [Google Scholar] [CrossRef]
- Prince, R.; Niu, Z.; Khan, Z.Y.; Emmanuel, M.; Patrick, N. COVID-19 Detection from Chest X-Ray Images Using CLAHE-YCrCb, LBP, and Machine Learning Algorithms. BMC Bioinform. 2024, 25, 28. [Google Scholar] [CrossRef]
- Alinsaif, S. COVID-19 Image Classification: A Comparative Performance Analysis of Hand-Crafted vs. Deep Features. Computation 2024, 12, 66. [Google Scholar] [CrossRef]
- Rashid, R.; Aslam, W.; Mehmood, A.; Vargas, D.L.R.; Diez, I.D.L.T.; Ashraf, I. A Detectability Analysis of Retinitis Pigmetosa Using Novel SE-ResNet Based Deep Learning Model and Color Fundus Images. IEEE Access 2024, 12, 28297–28309. [Google Scholar] [CrossRef]
- Liu, Y.; Xie, H.; Zhao, X.; Tang, J.; Yu, Z.; Wu, Z.; Tian, R.; Chen, Y.; Chen, M.; Ntentakis, D.P.; et al. Automated Detection of Nine Infantile Fundus Diseases and Conditions in Retinal Images Using a Deep Learning System. EPMA J. 2024, 15, 39–51. [Google Scholar] [CrossRef] [PubMed]
- Wang, X.; Li, H.; Zheng, H.; Sun, G.; Wang, W.; Yi, Z.; Xu, A.; He, L.; Wang, H.; Jia, W.; et al. Automatic Detection of 30 Fundus Diseases Using Ultra-Widefield Fluorescein Angiography with Deep Experts Aggregation. Ophthalmol. Ther. 2024, 13, 1125–1144. [Google Scholar] [CrossRef] [PubMed]
- Alharbi, M. Multi-Classification of Eye Disease Based on Fundus Images Using Hybrid Squeeze Net and LRCN Model. Multimed. Tools Appl. 2024, 83, 69197–69226. [Google Scholar] [CrossRef]
- Arsalan, M.; Haider, A.; Park, C.; Hong, J.S.; Park, K.R. Multiscale Triplet Spatial Information Fusion-Based Deep Learning Method to Detect Retinal Pigment Signs with Fundus Images. Eng. Appl. Artif. Intell. 2024, 133, 108353. [Google Scholar] [CrossRef]
- Nagasato, D.; Sogawa, T.; Tanabe, M.; Tabuchi, H.; Numa, S.; Oishi, A.; Ohashi Ikeda, H.; Tsujikawa, A.; Maeda, T.; Takahashi, M.; et al. Estimation of Visual Function Using Deep Learning From Ultra-Widefield Fundus Images of Eyes With Retinitis Pigmentosa. JAMA Ophthalmol. 2023, 141, 305. [Google Scholar] [CrossRef]
- Wang, Y.-Z.; Juroch, K.; Birch, D.G. Deep Learning-Assisted Measurements of Photoreceptor Ellipsoid Zone Area and Outer Segment Volume as Biomarkers for Retinitis Pigmentosa. Bioengineering 2023, 10, 1394. [Google Scholar] [CrossRef]
- Chen, T.-C.; Lim, W.S.; Wang, V.Y.; Ko, M.-L.; Chiu, S.-I.; Huang, Y.-S.; Lai, F.; Yang, C.-M.; Hu, F.-R.; Jang, J.-S.R.; et al. Artificial Intelligence–Assisted Early Detection of Retinitis Pigmentosa—The Most Common Inherited Retinal Degeneration. J. Digit. Imaging 2021, 34, 948–958. [Google Scholar] [CrossRef]
- Wang, Y.-Z.; Wu, W.; Birch, D.G. A Hybrid Model Composed of Two Convolutional Neural Networks (CNNs) for Automatic Retinal Layer Segmentation of OCT Images in Retinitis Pigmentosa (RP). Trans. Vis. Sci. Tech. 2021, 10, 9. [Google Scholar] [CrossRef]
- Khaing, T.T.; Okamoto, T.; Ye, C.; Mannan, M.A.; Miura, G.; Yokouchi, H.; Nakano, K.; Aimmanee, P.; Makhanov, S.S.; Haneishi, H. Automatic Measurement of Choroidal Thickness and Vasculature in Optical Coherence Tomography Images of Eyes with Retinitis Pigmentosa. Artif. Life Robot. 2022, 27, 70–79. [Google Scholar] [CrossRef]
- Masumoto, H.; Tabuchi, H.; Nakakura, S.; Ohsugi, H.; Enno, H.; Ishitobi, N.; Ohsugi, E.; Mitamura, Y. Accuracy of a Deep Convolutional Neural Network in Detection of Retinitis Pigmentosa on Ultrawide-Field Images. PeerJ 2019, 7, e6900. [Google Scholar] [CrossRef] [PubMed]
- Iadanza, E.; Goretti, F.; Sorelli, M.; Melillo, P.; Pecchia, L.; Simonelli, F.; Gherardelli, M. Automatic Detection of Genetic Diseases in Pediatric Age Using Pupillometry. IEEE Access 2020, 8, 34949–34961. [Google Scholar] [CrossRef]
- Giambene, B.; Verdina, T.; Pennino, M.; Fabbrucci, M.; Cavallini, G.M.; Menchini, U. Multifocal Electroretinographic Responses in Sector Retinitis Pigmentosa. Int. Ophthalmol. 2020, 40, 703–708. [Google Scholar] [CrossRef] [PubMed]
- Haralick, R.M.; Shanmugam, K.; Dinstein, I. Textural Features for Image Classification. IEEE Trans. Syst., Man Cybern. 1973, SMC-3, 610–621. [Google Scholar] [CrossRef]
- Paramastri, G.A.; Pramunendar, R.A. Glaucoma Detection Through Fundus Images Using Radial Basis Function With Color and GLCM Feature Extraction. In Proceedings of the 2021 International Seminar on Application for Technology of Information and Communication (iSemantic), Semarangin, Indonesia, 18 September 2021; IEEE: New York, NY, USA, 2021; pp. 222–227. [Google Scholar]
- Mutlag, W.K.; Ali, S.K.; Aydam, Z.M.; Taher, B.H. Feature Extraction Methods: A Review. J. Phys. Conf. Ser. 2020, 1591, 012028. [Google Scholar] [CrossRef]
- Iranzad, R.; Liu, X. A Review of Random Forest-Based Feature Selection Methods for Data Science Education and Applications. Int. J. Data Sci. Anal. 2024, 16, 132–145. [Google Scholar] [CrossRef]
- Ali, R.; Nipu, S.M.A.; Khan, S.A. A Decision Support System for Classifying Supplier Selection Criteria Using Machine Learning and Random Forest Approach. Decis. Anal. J. 2023, 7, 100238. [Google Scholar] [CrossRef]
- Fei, H.; Fan, Z.; Wang, C.; Zhang, N.; Wang, T.; Chen, R.; Bai, T. Cotton Classification Method at the County Scale Based on Multi-Features and Random Forest Feature Selection Algorithm and Classifier. Remote Sens. 2022, 14, 829. [Google Scholar] [CrossRef]
- Moldovanu, S.; Obreja, C.-D.; Biswas, K.C.; Moraru, L. Towards Accurate Diagnosis of Skin Lesions Using Feedforward Back Propagation Neural Networks. Diagnostics 2021, 11, 936. [Google Scholar] [CrossRef]
- Althubiti, S.A.; Paul, S.; Mohanty, R.; Mohanty, S.N.; Alenezi, F.; Polat, K. Ensemble Learning Framework with GLCM Texture Extraction for Early Detection of Lung Cancer on CT Images. Comput. Math. Methods Med. 2022, 2022, 1–14. [Google Scholar] [CrossRef]
- Gupta, S.; Thakur, S.; Gupta, A. Comparative Study of Different Machine Learning Models for Automatic Diabetic Retinopathy Detection Using Fundus Image. Multimed. Tools Appl. 2023, 83, 34291–34322. [Google Scholar] [CrossRef]
- Tamim, N.; Elshrkawey, M.; Nassar, H. Accurate Diagnosis of Diabetic Retinopathy and Glaucoma Using Retinal Fundus Images Based on Hybrid Features and Genetic Algorithm. Appl. Sci. 2021, 11, 6178. [Google Scholar] [CrossRef]
- Singh, L.K.; Khanna, M. Pooja A Novel Multimodality Based Dual Fusion Integrated Approach for Efficient and Early Prediction of Glaucoma. Biomed. Signal Process. Control 2022, 73, 103468. [Google Scholar] [CrossRef]
- Nadeem, M.W.; Goh, H.G.; Hussain, M.; Liew, S.-Y.; Andonovic, I.; Khan, M.A. Deep Learning for Diabetic Retinopathy Analysis: A Review, Research Challenges, and Future Directions. Sensors 2022, 22, 6780. [Google Scholar] [CrossRef]
- Li, X.; Jiang, Y.; Zhang, J.; Li, M.; Luo, H.; Yin, S. Lesion-Attention Pyramid Network for Diabetic Retinopathy Grading. Artif. Intell. Med. 2022, 126, 102259. [Google Scholar] [CrossRef] [PubMed]
- Zedan, M.; Zulkifley, M.; Ibrahim, A.; Moubark, A.; Kamari, N.; Abdani, S. Automated Glaucoma Screening and Diagnosis Based on Retinal Fundus Images Using Deep Learning Approaches: A Comprehensive Review. Diagnostics 2023, 13, 2180. [Google Scholar] [CrossRef]
- Jeong, Y.; Hong, Y.-J.; Han, J.-H. Review of Machine Learning Applications Using Retinal Fundus Images. Diagnostics 2022, 12, 134. [Google Scholar] [CrossRef]
Disclaimer/Publisher’s Note: The statements, opinions and data contained in all publications are solely those of the individual author(s) and contributor(s) and not of MDPI and/or the editor(s). MDPI and/or the editor(s) disclaim responsibility for any injury to people or property resulting from any ideas, methods, instructions or products referred to in the content. |
© 2025 by the authors. Licensee MDPI, Basel, Switzerland. This article is an open access article distributed under the terms and conditions of the Creative Commons Attribution (CC BY) license (https://creativecommons.org/licenses/by/4.0/).