1. Introduction
In Educational Data Mining (EDM) and Learning Analytics (LAs), research has traditionally prioritized optimizing machine learning models for performance metrics [
1,
2]. Machine learning models significantly impact student performance analysis, learning pattern identification, and educational outcome improvement [
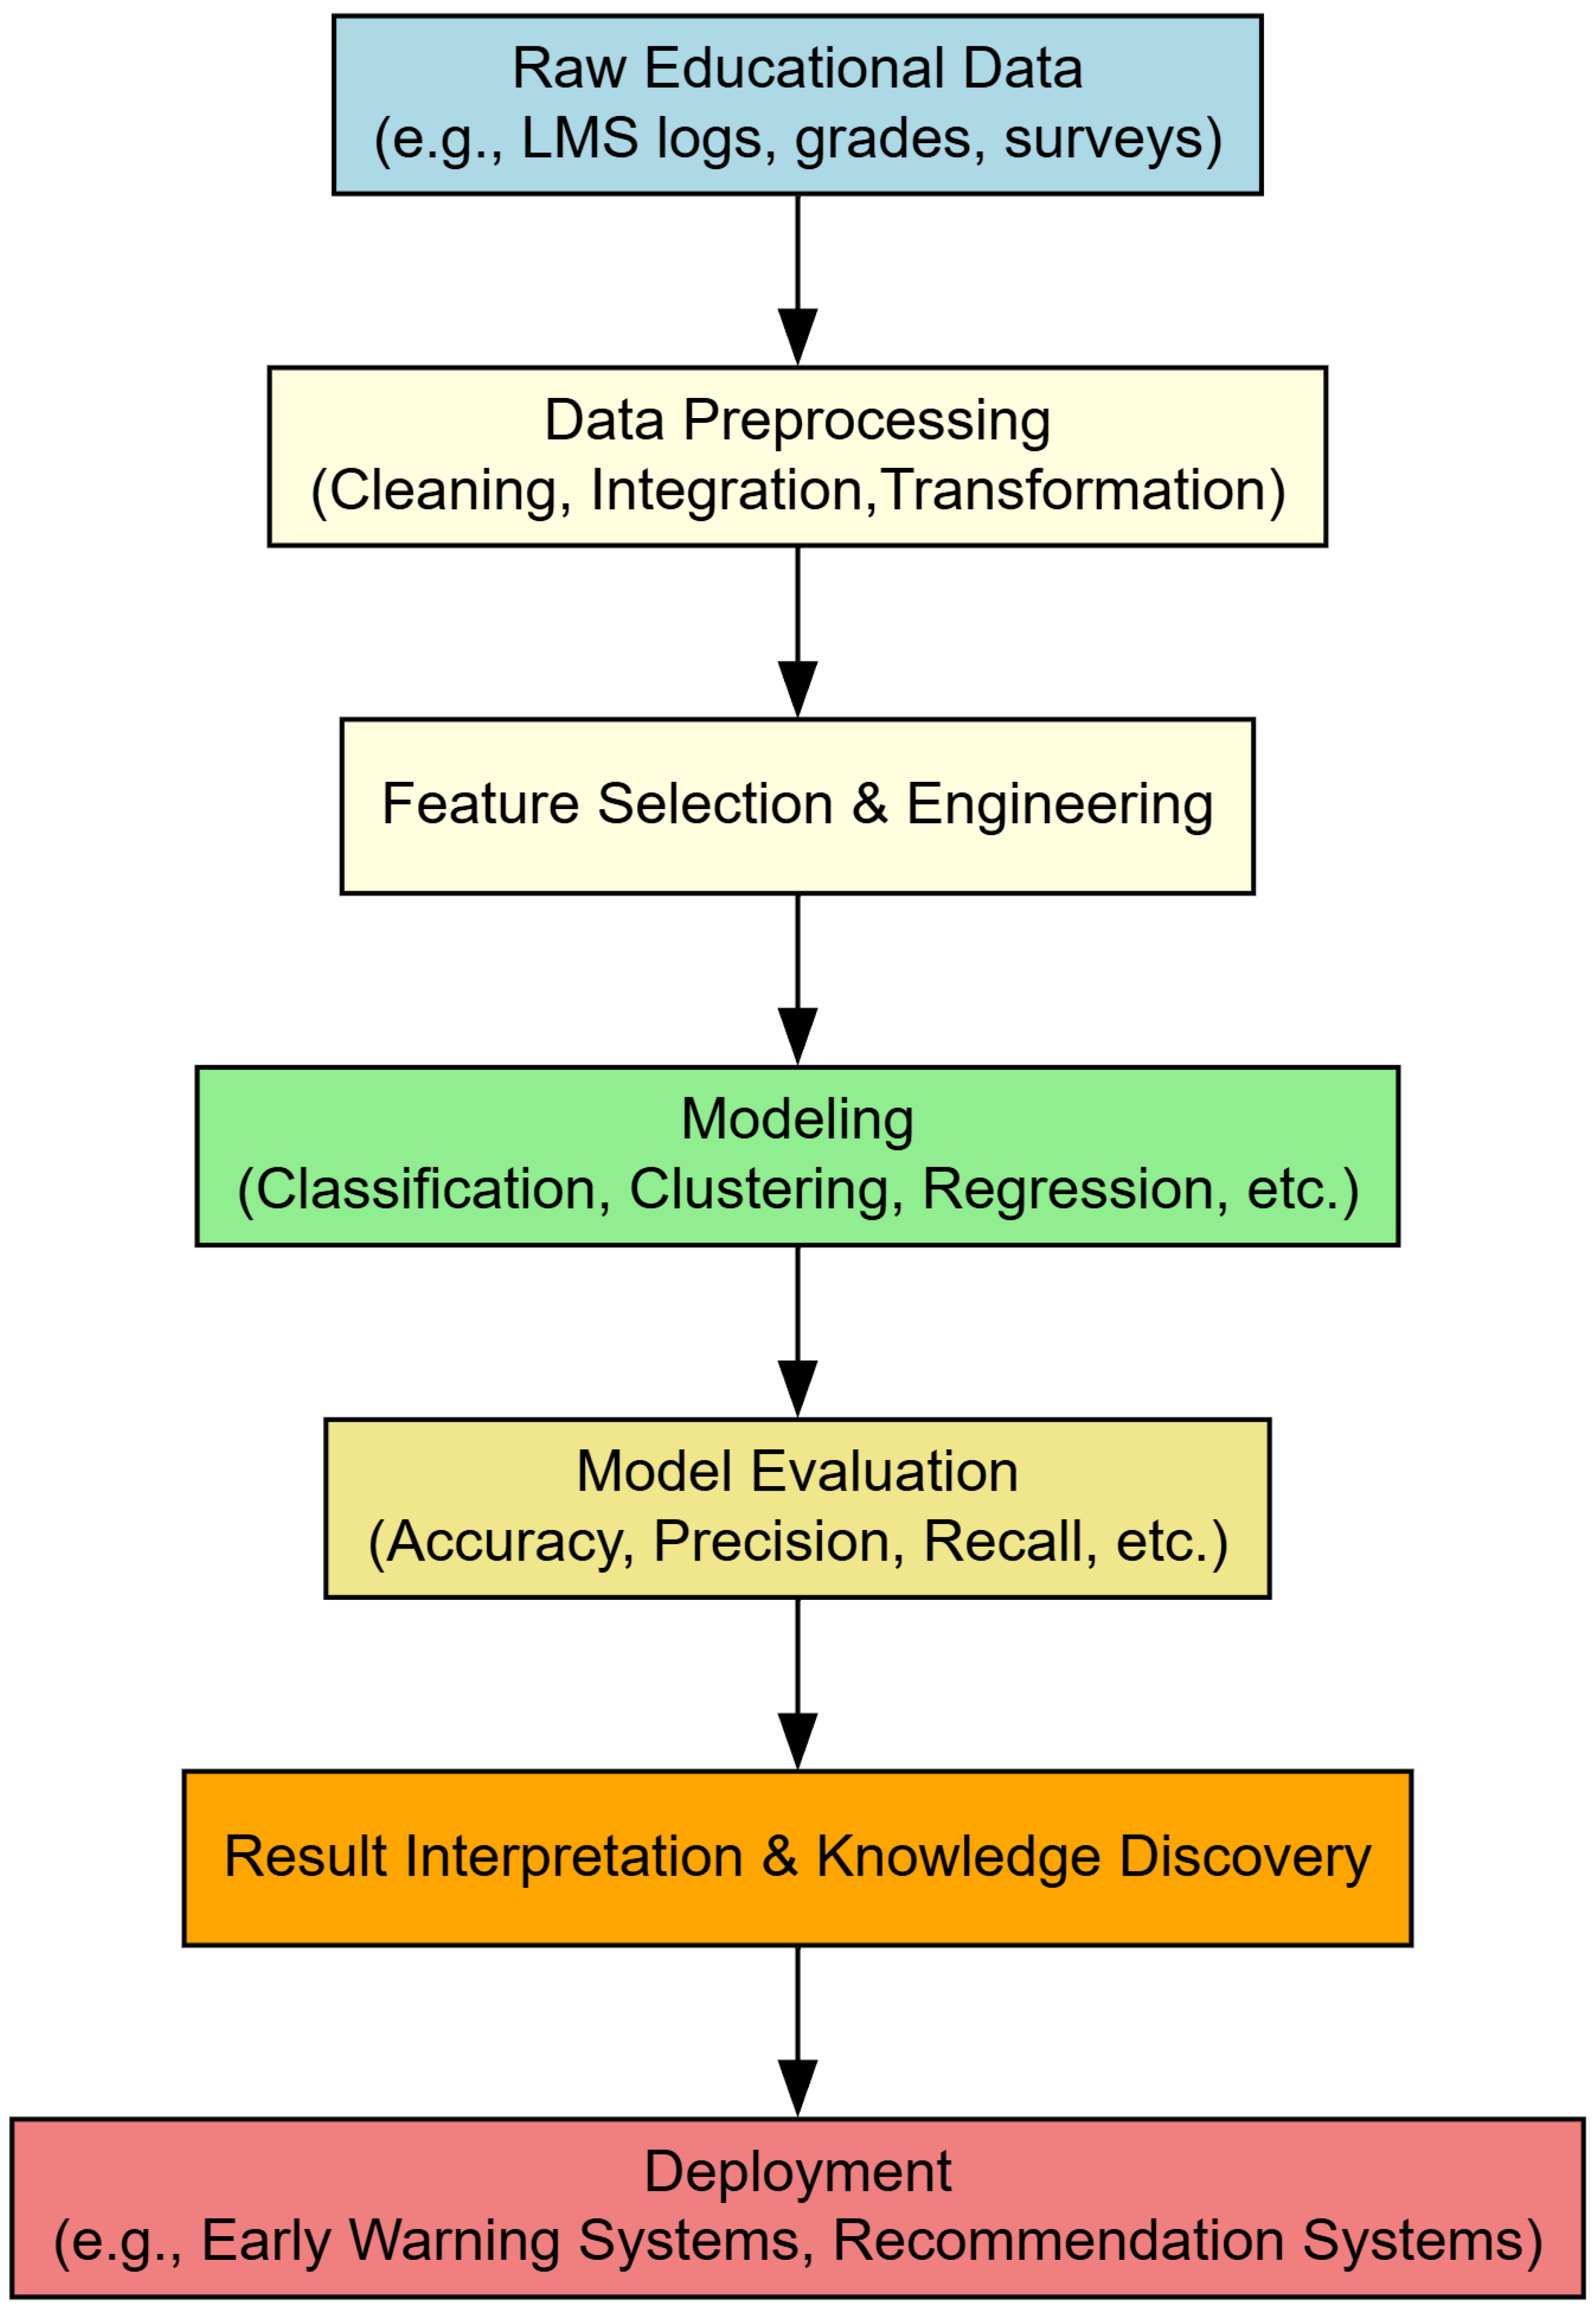
3]. As shown in
Figure 1, the educational data mining process involves several stages. Yet, these models can embed and perpetuate biases, thereby reinforcing systemic inequalities in grading, admissions, and personalized learning recommendations [
4].
Bias in data refers to systematic distortions that misrepresent the reality the data are supposed to reflect. In educational data, bias can emerge from various sources such as socioeconomic status, geographic location, gender, race, or prior academic exposure. This is particularly critical in educational contexts, where biased data can reinforce existing inequalities or misguide interventions. For example, if historical data underrepresent students from marginalized communities, predictive models may underestimate their performance or potential, leading to unfair treatment in admissions, resource allocation, or personalized recommendations.
These biases are not only present in individual data points but can also manifest across structural and behavioral patterns within different types of education systems. In online learning environments, for instance, students with unstable internet access or lower digital literacy may generate incomplete or misleading learning data, skewing models toward digitally advantaged learners. Similarly, in traditional classroom settings, grading practices or teacher perceptions may introduce subjective bias into performance metrics. Understanding and evaluating these forms of bias is essential, as their unaddressed presence can compound educational disadvantage, misinform policy decisions, and diminish trust in data-driven systems.
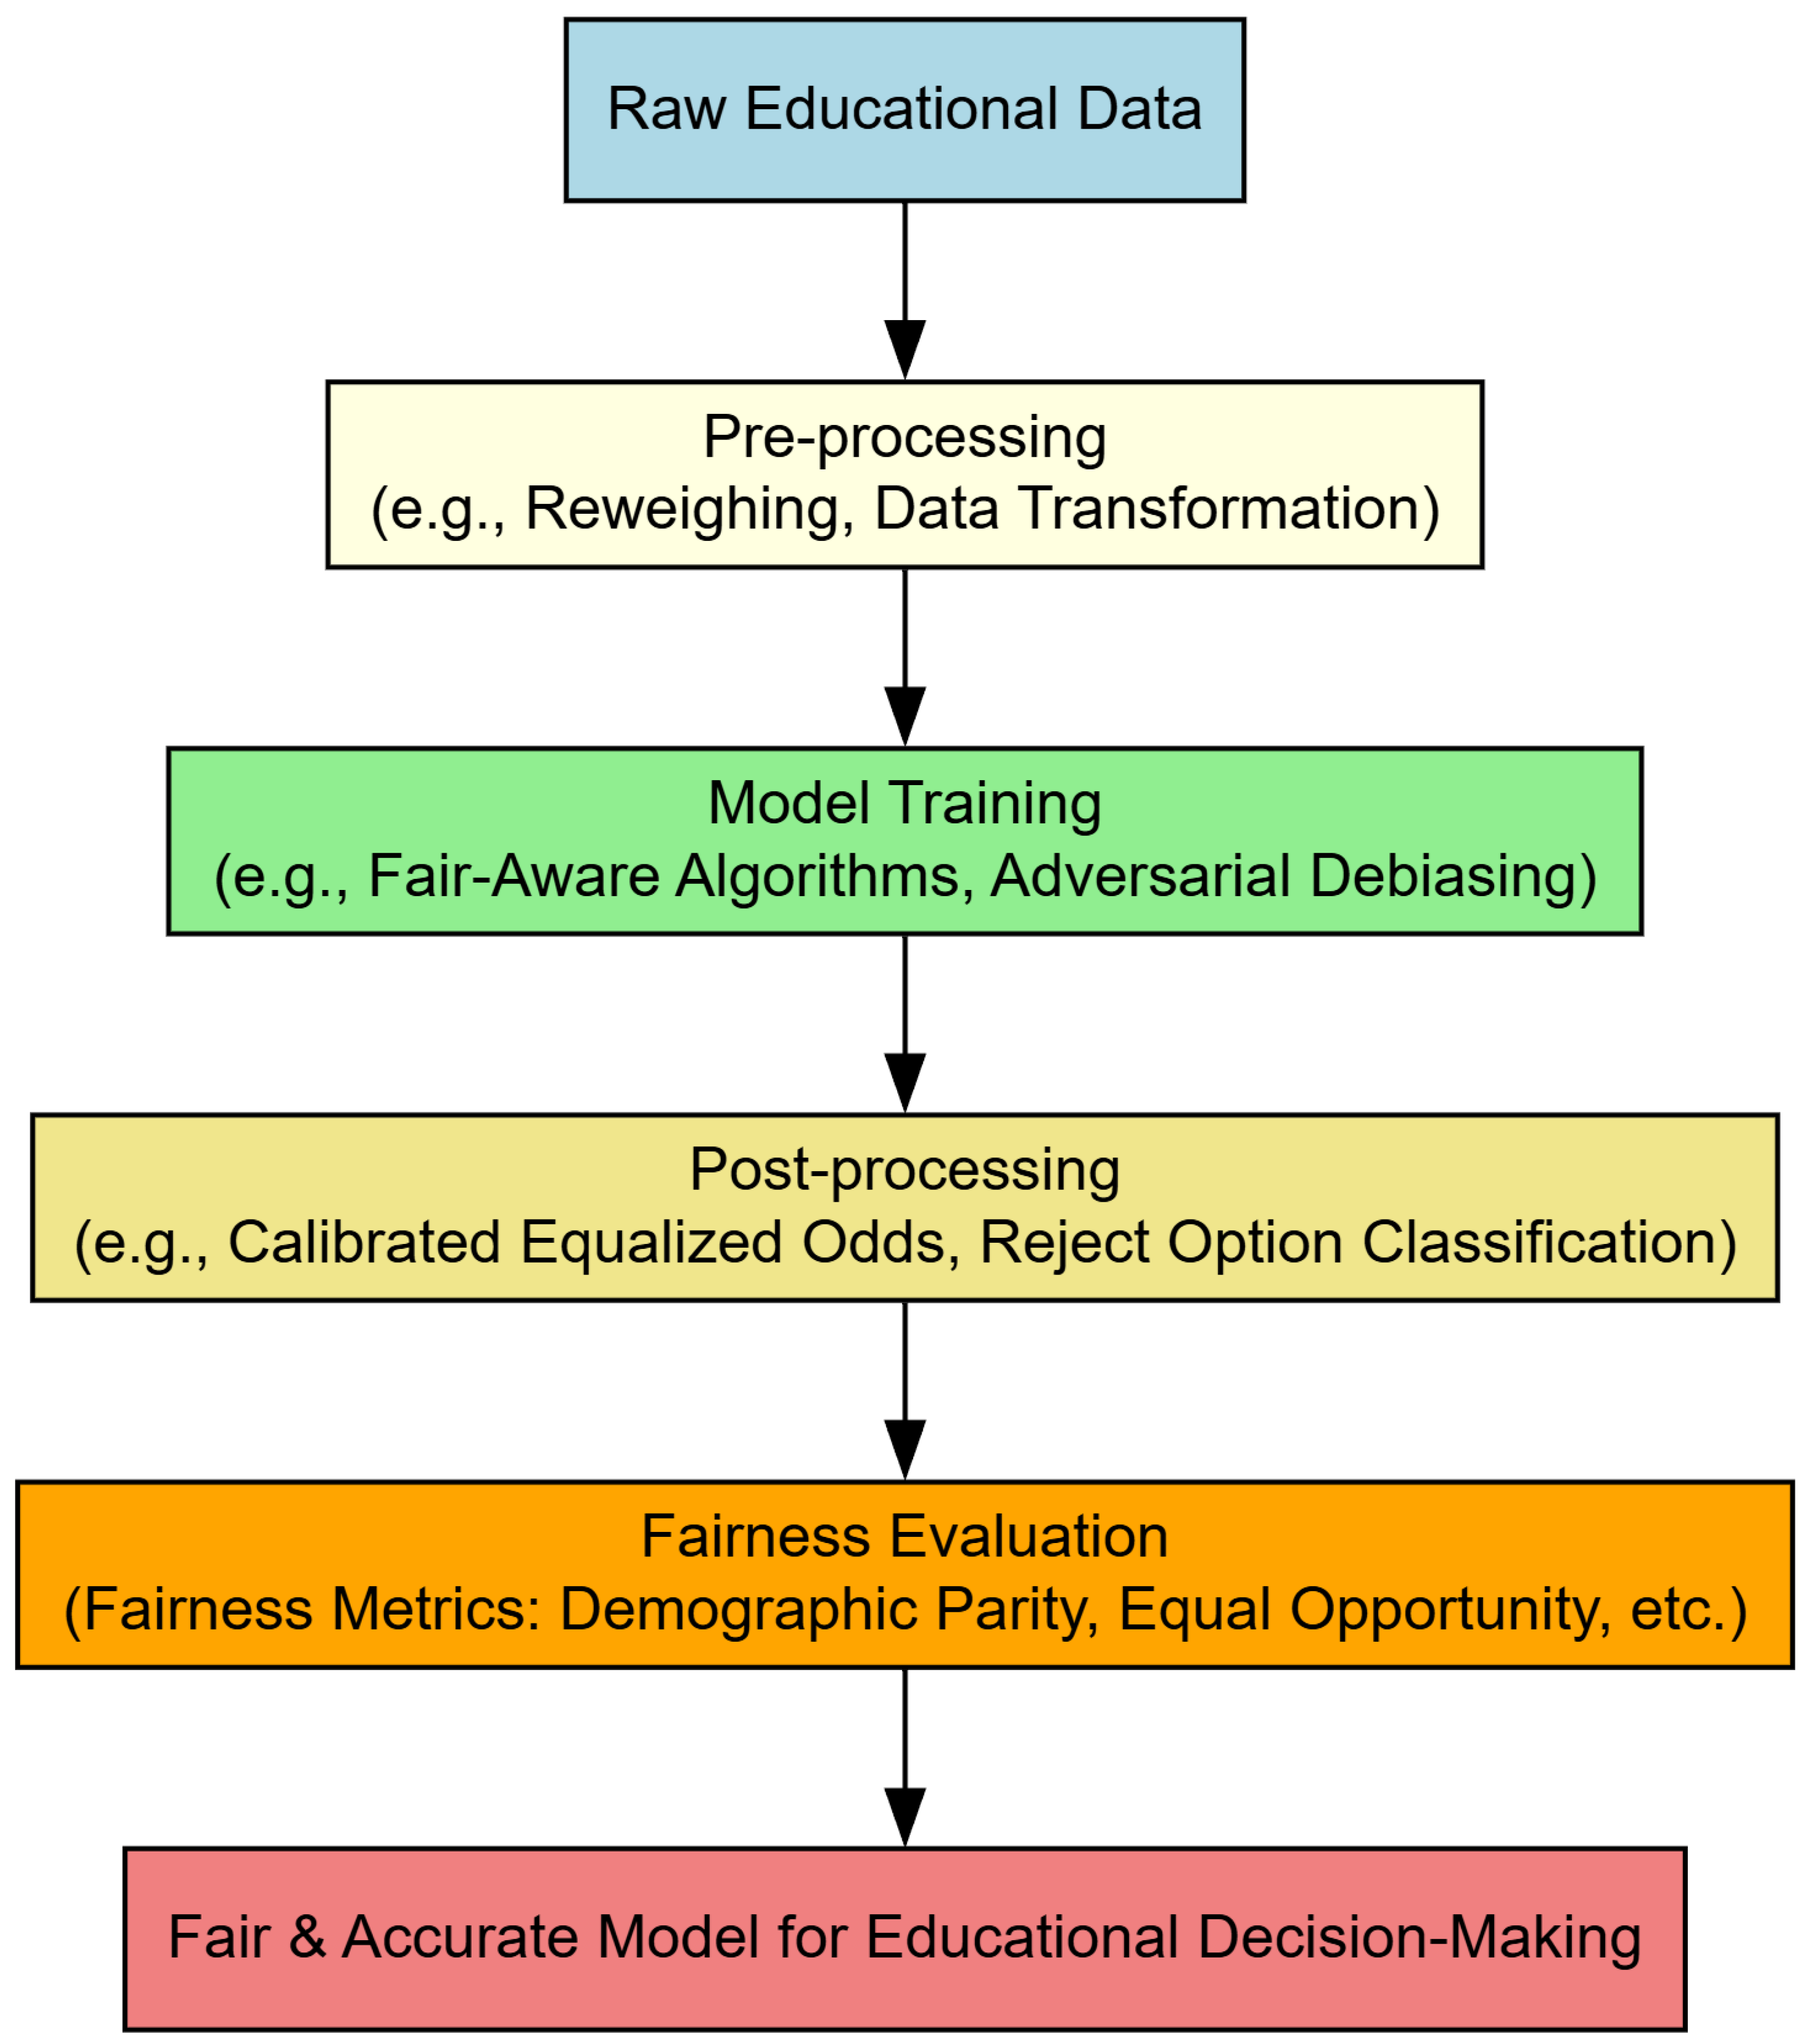
To mitigate such impacts, fairness-aware approaches are integrated at different stages of the educational data mining process. Preprocessing techniques aim to reduce bias before model training—this may include rebalancing datasets, removing outliers, or transforming features. In-processing methods embed fairness constraints directly into the learning algorithms, such as adversarial debiasing or fair-regularized loss functions. Post-processing focuses on adjusting model outputs to improve equity, for example, through equalized odds or threshold optimization.
Recent studies and publications from both within and outside these fields have highlighted concerns regarding algorithmic fairness, particularly the unfair treatment of certain demographic groups, primarily based on gender and race (for example, the bestseller [
5]). This recognition has spurred significant research into fairness in machine learning and artificial intelligence more broadly [
6].
Baker and Hawn [
7] provide a nuanced analysis of algorithmic bias in educational technologies, addressing its causes, manifestations, and potential solutions across demographic dimensions such as race, gender, nationality, socioeconomic status, and disability. Similarly, Fenu [
8] underscores the need for fairness-aware pipelines, continuous fairness assessment, and transparency-enhancing tools to mitigate bias in educational applications. A systematic review by Lisha et al. [
9] investigated predictive bias in educational ML applications, analyzing 49 peer-reviewed studies published since 2010. The review identified three core fairness issues: the role of protected attributes, the application of fairness measures, and bias mitigation strategies. The work highlights that imbalanced training data and flawed model design are primary contributors to systematic discrimination. Notably, while group-level fairness metrics such as equalized odds are commonly applied, there is limited exploration of intersectional bias and metric suitability for specific educational contexts, revealing gaps in existing methodologies.
Deho et al. [
10] explored whether incorporating sensitive attributes—such as gender, age, disability, and home language—into LA models enhanced fairness without compromising predictive performance. Their study on a three-year dropout dataset from an Australian university found that the inclusion or exclusion of sensitive attributes had marginal effects on fairness and accuracy. Crucially, the study emphasizes that simply removing sensitive attributes does not eliminate bias but may obscure deeper inequalities. The authors advocate for targeted bias mitigation algorithms over simplistic attribute exclusion, underscoring the importance of recognizing often-overlooked sensitive attributes like home language and disability.
Idowu et al. [
11] categorized fairness into individual and group fairness, evaluating algorithmic equity through metrics such as ABROCA, demographic parity, and counterfactual fairness. Their review discusses bias mitigation strategies, including class balancing, adversarial learning, fairness through awareness/unawareness, and counterfactual fairness. They found no strict tradeoff between fairness and accuracy; rather, fairness-enhancing strategies were found to often complement predictive performance. However, they found that societal biases may lead users to prefer biased systems, presenting challenges in real-world adoption.
The authors in [
12] investigated the impact of class balancing techniques on mitigating algorithmic bias in predictive modeling for education. According to this study, eleven class balancing techniques were applied across three predictive tasks to assess their effects on fairness and accuracy. The findings suggest that oversampling techniques, such as SMOTE and ADASYN, can significantly improve predictive fairness without sacrificing accuracy. By systematically evaluating the interplay between data balancing methods, fairness, and predictive performance, the research highlights the importance of addressing demographic imbalances in educational datasets.
While class balancing techniques such as SMOTE and ADASYN are widely used to address class imbalance and mitigate algorithmic bias, they are not without limitations. One potential drawback is the risk of overfitting, especially when synthetic instances are generated in sparse regions of the feature space, which may lead the model to learn patterns that do not generalize well to unseen data. Additionally, these methods can introduce fictitious data points that do not accurately reflect the true underlying distribution, particularly in complex or highly non-linear datasets. This is especially problematic in educational data, where subtle contextual factors influence student behavior and performance. In such cases, synthetic examples might lack the nuanced relationships present in real student data, potentially distorting the model’s learning process.
In [
13], the authors introduced a Fair Logistic Regression (Fair-LR) model designed to address demographic biases in predictions by enforcing fairness constraints such as equalized odds. Using a dataset from high school students interacting with an Algebra II learning platform, the study compared Fair-LR’s performance against traditional fairness-unaware models like Logistic Regression, Support Vector Machine, and Random Forest. The results revealed that Fair-LR achieved significantly better fairness across demographic groups, particularly in reducing disparities in prediction outcomes (e.g., true positive and false positive rates) by race and gender, while maintaining competitive predictive accuracy.
In [
14], the authors conducted a systematic literature review and applied their findings to investigate fairness in learning analytics through a case study using the OULAD [
15]. They identified three types of discrimination in learning analytics—direct, indirect, and underestimation—highlighting subtle algorithmic biases, especially in underrepresented groups. They also reviewed methods to measure fairness, such as Disparate Impact (DI), Normalized Mutual Information (NMI), and Underestimation Index (UEI), and approaches to mitigate bias, including data preprocessing, fairness optimization, and post-processing techniques. Applying these insights to the OULAD, they evaluated various predictive models, finding that algorithms tended to reproduce existing biases, with mixed success in improving fairness using constraint-based methods or excluding sensitive attributes. Their work underscores the importance of information-theoretic measures to identify imbalances in datasets and call for refined fairness techniques in learning analytics.
The study by [
16] systematically evaluated seven well-established group fairness measures—statistical parity, equal opportunity, equalized odds, predictive parity, predictive equality, treatment equality, and absolute between-ROC area (ABROCA)—across five widely used educational datasets. These datasets vary in size, protected attributes, and class imbalances, thereby reflecting diverse educational contexts. The authors employed four commonly used machine learning models—Decision Trees, Naive Bayes, Multi-layer Perceptron, and Support Vector Machines—along with two fairness-aware algorithms, namely, Agarwal’s reduction-based approach and AdaFair. The results revealed that fairness metrics exhibit substantial variation across models and datasets, emphasizing that the selection of an appropriate fairness measure is context-dependent. Notably, ABROCA demonstrated relatively low variability across models and datasets, making it a more stable and reliable indicator of fairness.
To the best of our knowledge, the most recent research in this area is that of [
17]. In their study, the authors investigated the effectiveness of bias mitigation methods in machine learning models applied to an educational dataset, specifically the High School Longitudinal Study of 2009 (HSLS:09) dataset. The authors evaluated the performance of four bias mitigation techniques—reweighting, uniform resampling, preferential resampling, and reject option-based classification (ROC) pivoting—using the DALEX library (v1.7.0) in Python, with Decision Trees as the sole machine learning model. Among the evaluated techniques, the ROC pivoting method emerged as the most balanced approach, achieving a moderate reduction in bias while preserving the original predictive performance of the model.
This study aims to critically address a significant research gap in the systematic evaluation of fairness mitigation strategies within educational machine learning applications. Specifically, we conducted a comprehensive, pipeline-wide comparison of bias mitigation techniques—including preprocessing (e.g., reweighting, learning fair representations, and disparate impact remover), in-processing (e.g., adversarial debiasing and prejudice remover), and post-processing methods (e.g., equalized odds and calibrated equalized odds). These methods were applied across three distinct learning analytics datasets: HOULAD, xAPI-Edu, and OULAD, with each presenting unique fairness-related challenges due to the influence of protected attributes on model outcomes. The need for robust strategies to balance predictive performance with algorithmic fairness is therefore both urgent and context-dependent.
Each dataset represents a critical area in education where fairness and performance are tightly intertwined. The student performance dataset focuses on the early identification of students at risk of academic failure, which is a key concern for supporting timely interventions in secondary education. The MOOC dataset targets the pervasive issue of learner attrition, aiming to predict dropout risk and inform adaptive course designs that foster sustained engagement. The student admissions dataset highlights issues of equity in access to higher education, seeking to uncover and mitigate potential biases in admission decisions driven by sensitive features such as gender or socioeconomic background.
All three tasks are framed as binary classification problems: predicting pass/fail outcomes, dropout likelihood, or admission decisions, respectively. Although these predictive tasks differ in context and implications, they share a common challenge—ensuring that model decisions do not systematically disadvantage specific groups. While we applied a variety of machine learning algorithms and fairness mitigation strategies, our central research question remained consistent: how can we effectively reduce algorithmic bias in educational predictions without sacrificing model utility?
Our motivation stems from a critical need in the field: the absence of a holistic, comparative framework for assessing fairness interventions across varied educational scenarios. Despite the existence of numerous fairness-aware algorithms, their effectiveness can vary widely based on task characteristics, data imbalance, and the nature of sensitive attributes involved. Our approach is therefore not to prescribe a one-size-fits-all solution but rather to provide empirical evidence that can guide educational stakeholders—such as data scientists, institutional decision makers, and policymakers—in selecting contextually appropriate fairness strategies aligned with their specific goals and constraints.
While our empirical focus was on three representative datasets, the broader contribution of this study lies in its systematic and task-agnostic analysis of bias mitigation techniques across the entire machine learning pipeline. By evaluating the performance of these techniques using multiple fairness metrics and under varying data conditions, we offer actionable insights into their practical strengths, limitations, and tradeoffs. Ultimately, the findings from our comparative study serve not only to inform the design of fairer predictive systems in education but also to support the development of responsible AI practices in real-world, high-stakes applications.
In contrast, Wongvorachan et al. [
17] focused narrowly on four techniques—uniform and preferential resampling, reweighting, and ROC pivoting—applied solely to the HSLS:09 high school dropout dataset, reporting that the ROC pivot method best preserved the accuracy while reducing false positive disparity. Le Quy et al. [
16], meanwhile, did not implement mitigation algorithms but instead analyzed the stability of seven group fairness metrics (e.g., statistical parity, equalized odds, ABROCA, etc.) across five datasets and six predictive models, illustrating the sensitivity of fairness assessments to both the chosen metric and threshold definitions.
Our work extends these efforts by offering a more generalizable evaluation that accounts for the interaction between multiple classifiers and various fairness interventions. Through this approach, we systematically examined the tradeoffs between fairness and predictive performance. While preprocessing methods like learning fair representations often achieve a balanced compromise, in-processing and post-processing techniques offer alternative advantages, though each technique has its own limitations. A nuanced understanding of these tradeoffs is essential for developing ethical and responsible machine learning systems in educational contexts.
The key contributions of this study are as follows:
We conducted a comprehensive empirical evaluation of fairness mitigation strategies (preprocessing, in-processing, and post-processing) across three representative educational datasets, with each reflecting a distinct real-world prediction task.
We analyzed the tradeoffs between fairness and predictive accuracy, offering insight into how different techniques perform under various fairness metrics and data conditions.
We demonstrate how each mitigation method (e.g., reweighting, LFR, DIR, etc.) has been practically applied to educational datasets and highlight their effectiveness and limitations in educational settings.
Based on the experimental results, we propose practical recommendations for selecting fairness-aware methods tailored to specific educational challenges, helping bridge the gap between theoretical fairness frameworks and real-world educational applications.
The remainder of this paper is structured as follows.
Section 2 introduces various bias mitigation techniques, categorizing them into preprocessing, in-processing, and post-processing approaches.
Section 3.1 presents an overview of the three learning analytics datasets employed in this study, discussing their characteristics. In
Section 3.4, we define the classification and fairness metrics used to evaluate the effectiveness of these techniques. The experimental design, including data preprocessing, model selection, and evaluation methodology, is also detailed in
Section 3, followed by an in-depth analysis of the results in
Section 4. Finally,
Section 5 critically examines the findings, contextualizing them within the broader field of fairness in AI, while
Section 6 summarizes key insights and outlines directions for future research.
3. Experiments
3.1. Datasets
In this subsection, we provide a concise overview of the datasets utilized in our experimental procedure for evaluating both performance and fairness.
3.1.1. Hellenic Open University Learning Analytics Dataset (HOULAD)
This dataset described in [
26] was collected as part of the Erasmus+ initiative “DevOps Competences for Smart Cities”. It initially included data from 961 MOOC participants, with 944 completing a comprehensive questionnaire. After preprocessing steps such as addressing missing data and performing data cleaning, a total of 923 cases were prepared for the final analysis. The final dataset consists of 66.6% males and 33.4% females. A significant majority, 75.5%, did not succeed in obtaining the certificate, while only 24.5% achieved certification.
The dataset is organized into three main subsets:
Demographics Subset: This section contains mostly categorical features, such as gender, education level, etc.
Performance Subset: It includes 10 primarily numerical features related to academic outcomes.
Activity Subset: This subset features 12 numerical attributes describing engagement on the online learning platform.
3.1.2. xAPI-Educational Mining Dataset
This dataset comprises information on 480 students across primary, secondary, and high school levels, encompassing 16 attributes [
27,
28]. These attributes include gender, nationality, place of birth, educational level, grade level, course topic, classroom ID, semester, parent responsible for the student, raised hands, visited resources, viewing announcements, discussion group participation, parent answering surveys, parent school satisfaction, and student absence days. The students in the dataset are from 14 predominantly Islamic countries. The dataset covers a diverse range of course topics, including IT, Math, Arabic, Science, English, Quran, Spanish, French, History, Biology, Chemistry, and Geology. It was sourced from the Kalboard 360 LMS via an experienced API (xAPI). The Class column in the dataset categorizes students’ overall performance into three levels—low, middle, and high—based on their total grades. For our study, these categories were simplified into binary classification: Pass (1), representing middle and high performance, and Fail (0), representing low performance. This binary classification served as the target variable for this study and has also been adopted in other studies [
28,
29,
30]. During the preprocessing phase, we excluded the attributes of nationality, place of birth, and semester to streamline the analysis. After preprocessing, 478 cases remained, comprising 63.4% male and 36.6% female participants. A significant majority, 73.9%, demonstrated medium to high academic performance, while the remaining 26.1% were classified as low-performing.
3.1.3. Open University Learning Analytics Dataset (OULAD)
The Open University Learning Analytics Dataset (OULAD) [
15] is a publicly available dataset designed to support research in learning analytics and educational data mining. Developed from data collected at the Open University (OU), the largest distance-learning institution in the United Kingdom, OULAD provides a rich source of information on student demographics, course enrollments, assessment performance, and interactions with the Virtual Learning Environment (VLE). The dataset includes anonymized data from 32,593 students enrolled in seven different courses across multiple semesters in 2013 and 2014. The OULAD dataset is organized into seven distinct CSV files, with each representing specific components of student and course data. From these individual files, we constructed a unified dataset that was subsequently used for our analysis. The final outcomes of students enrolled in these courses were categorized into four groups: Distinction, Pass, Fail, and Withdrawn. For the purposes of our analysis, we transformed these groups into a binary classification problem by merging the Distinction and Pass categories. The Fail category was retained as is, while data corresponding to the Withdrawn category were excluded from the analysis. Additionally, certain features, including id_student, date_unregistration, date_registration, weighted_score, late_rate, fail_rate, region, and imd_band, were removed from the dataset. To address imbalances in features such as highest_education and age_band, we suppressed distinct categories within these features. The final dataset comprises 22,437 cases, with 54.4% male and 45.6% female participants. A significant majority, 68.6%, successfully passed the exams, while the remaining 31.4% did not.
3.2. Experimental Procedure
Beyond the preprocessing steps outlined in the preceding sections, our experimental procedure remained consistent across the three learning analytics datasets to ensure methodological consistency and comparability of results.
For each experiment, the dataset was split into a training set (70%) and a testing set (30%) to support model training and evaluation. This process was repeated five times, and the results were averaged to ensure robustness.
In this study, the default parameter settings provided by scikit-learn (sklearn) were used for the implementation of logistic regression, naive Bayes, and decision tree classifiers. For logistic regression, sklearn uses the ‘lbfgs’ solver by default, with L2 regularization (penalty = ‘l2’), and a regularization strength parameter C = 1.0. The model also assumes a maximum of 100 iterations (max_iter = 100) for convergence. In the case of naive Bayes, the Gaussian naive Bayes (GaussianNB) variant was employed, which assumes features follow a normal distribution and uses default priors and a variance smoothing parameter (var_smoothing = 1 ) to handle numerical stability. For decision trees, the DecisionTreeClassifier was applied with the Gini impurity (criterion = ‘gini’) as the default metric for node splitting, no restriction on tree depth (max_depth = None), and other default values for parameters like min_samples_split = 2 and min_samples_leaf = 1.
The hyperparameter values for the various fairness mitigation techniques were systematically kept identical across all datasets to maintain experimental rigor and eliminate variability arising from parameter selection. Specifically, for the learning fair representations (LFR) technique, the hyperparameters were set to (default values) and (ad hoc setting instead of the default value that is .
In our study, the tuning parameter in the disparate impact remover (DIR), which controls the extent to which features are adjusted to mitigate bias, was selected based on a balance between fairness improvement and predictive performance. We experimented with a range of values (typically from 0.0 to 1.0, where 0.0 applies no transformation and 1.0 enforces full fairness) and evaluated each setting using both fairness metrics (e.g., disparate impact ratio, equal opportunity, etc.) and accuracy measures. The repair level was selected as , controlling the degree of modification applied to the dataset to mitigate bias.
The prejudice remover technique employed a regularization strength of , which adjusts the tradeoff between accuracy and fairness. For all other techniques, default hyperparameters were utilized to maintain a baseline configuration.
Additionally, in the case of the calibrated equalized odds technique, we adopted the weighted approach as a cost constraint, ensuring that adjustments to decision thresholds were proportionally distributed to minimize disparities across demographic groups while preserving model performance.
This systematic approach allows for a controlled and replicable experimental framework, facilitating a robust evaluation of fairness interventions within learning analytics datasets.
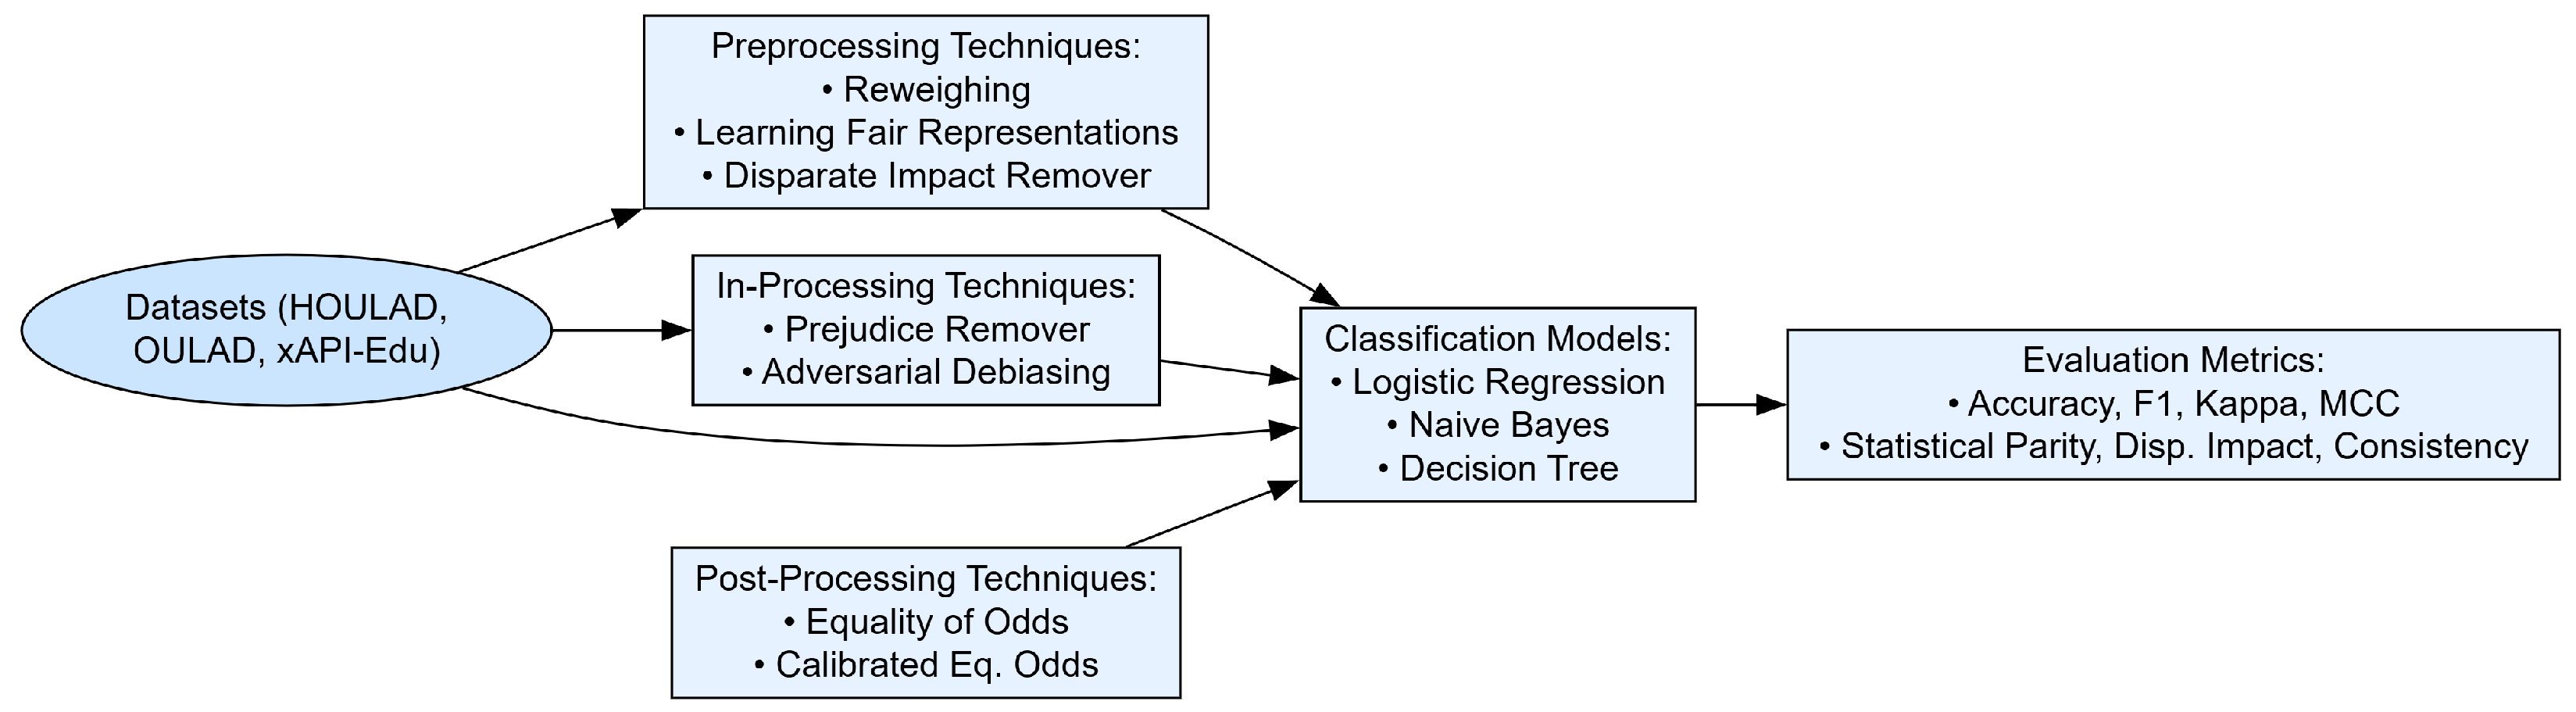
The experimental procedure (
Figure 3) was built around the Python programming language, with the scikit-learn library employed for the development and evaluation of machine learning models and AIF360 [
31] serving as the library for assessing and mitigating algorithmic fairness concerns. AI Fairness 360 (AIF360) is an open-source Python library created by IBM Research to address the challenges of algorithmic fairness in machine learning.
3.3. Classification Metrics
Classification measures are essential for evaluating the performance of machine learning models. Accuracy is the most commonly used metric, representing the proportion of correctly classified instances out of the total instances. However, accuracy can be misleading when dealing with imbalanced datasets, where one class dominates the other. AUC (Area Under the Curve), specifically the AUC-ROC (Receiver Operating Characteristic curve), measures the model’s ability to distinguish between classes by evaluating the tradeoff between true positive and false positive rates. A higher AUC indicates better classification performance across different decision thresholds. Recall, also known as sensitivity or true positive rate, quantifies the model’s ability to correctly identify positive instances, making it particularly useful when the cost of missing positive cases is high. Precision, on the other hand, assesses the proportion of correctly predicted positive cases among all predicted positives, ensuring that the model does not produce excessive false positives.
Balancing precision and recall is crucial, and the F1-score provides a harmonic mean of the two, offering a single metric that accounts for both false positives and false negatives. This is especially useful when there is an uneven class distribution. Beyond these traditional measures, Cohen’s kappa evaluates classification performance while considering agreement by chance, making it a robust metric for assessing inter-rater reliability. Similarly, the Matthews correlation coefficient (MCC) provides a more comprehensive evaluation by considering all four elements of the confusion matrix (true positives, false positives, true negatives, and false negatives). The MCC is particularly valuable in cases of class imbalance, as it offers a balanced assessment of predictive performance across all classes.
3.4. Fairness Metrics
Although an extensive number of fairness metrics has been proposed in the literature [
32,
33,
34], and it is widely acknowledged that no single fairness measure is universally applicable across all contexts, our research focuses on three of the most widely adopted and conceptually distinct measures: statistical parity, disparate impact, and consistency [
35].
3.4.1. Statistical Parity
This metric requires that model’s predictions to be independent of a protected attribute (such as gender, race, or disability). It ensures that different demographic groups receive positive outcomes at equal rates. Mathematically, a model satisfies statistical parity if
where
is the predicted outcome, and
A represents the protected attribute. This means that the proportion of favorable predictions should be the same across all groups, regardless of differences in other characteristics.
3.4.2. Disparate Impact
Disparate impact is mainly a legal concept that is also used for fairness using statistical terms. Contrary to statistical parity, disparate impact is defined as the ratio of favorable predictions between unprivileged and privileged groups. It is defined here as follows:
3.4.3. Consistency
Consistency is an individual fairness metric unlike the previous two that belongs to group fairness category metrics. This metric evaluates whether similar individuals receive similar predictions from a model. It is based on the idea that individuals with similar characteristics should be treated similarly in terms of outcomes, regardless of their membership in a particular protected attribute group. It is defined as follows:
Therein, the following are defined:
n is the number of individuals.
is the predicted outcome for individual i.
is the set of the nearest neighbors of (individuals with similar features).
is the predicted outcome for each individual j in the neighborhood.
3.4.4. Comparison of Measures and Methods
Fairness metrics such as demographic parity, equalized odds, and predictive parity each reflect different conceptualizations of fairness in machine learning. Demographic parity emphasizes outcome equality across groups, making it valuable in ensuring equal access to educational opportunities. However, it may inadvertently ignore differences in legitimate performance factors among groups. In contrast, equalized odds focuses on achieving similar error rates (e.g., false positives and false negatives) across groups, which is especially important in high-stakes decisions such as student admissions or targeted interventions. Meanwhile, predictive parity ensures consistency in predictive value (e.g., precision) across groups. Importantly, these criteria are often mutually incompatible—satisfying one may inherently violate another. Thus, selecting the appropriate fairness metric must be guided by the ethical and practical priorities of the specific educational context.
Fairness mitigation strategies, much like the metrics themselves, come with their own tradeoffs and implementation considerations. Preprocessing techniques—such as reweighting, learning fair representations (LFR), and the disparate impact remover (DIR)—are model-agnostic and relatively straightforward to implement. This makes them especially suitable for educational systems where internal model access is limited or models are proprietary. However, they may oversimplify nuanced bias structures embedded in the data. In contrast, in-processing methods like adversarial debiasing or fairness-constrained optimization often yield better fairness–performance tradeoffs but require modification of the learning algorithm, which may not be feasible in black-box environments. Post-processing techniques operate on the model outputs, offering flexibility when working with fixed models, though they raise ethical concerns about altering predictions without addressing underlying learning processes.
In our study, we operationalized fairness mitigation by first identifying underrepresented and overrepresented groups based on sensitive attributes such as gender or ethnicity. Group representation was assessed by comparing the proportion of samples belonging to each group either to the overall dataset or to a reference baseline. Reweighting was then applied to balance the influence of each group during training: samples from underrepresented groups were assigned higher weights, while those from overrepresented groups received lower weights. This technique, evaluated using fairness metrics like demographic parity and equal opportunity alongside performance measures, allowed us to minimize bias without compromising accuracy.
For example, we can apply reweighting to the student performance dataset, using gender as the sensitive attribute. By computing group-level frequencies, we rebalance the dataset to amplify the impact of underrepresented students during training. For the MOOC dataset, where the task was to predict dropout risk, we can employ learning fair representations (LFR). LFR transforms the original features into a latent space that preserves task-relevant information while obfuscating sensitive group membership. This allows the model to retain meaningful educational patterns while reducing its dependence on sensitive attributes, ultimately supporting fairer predictions. Finally, we can use the disparate impact remover (DIR) in the student admissions dataset, which involves sensitive attributes like ethnicity. DIR modifies the input features—such as test scores or GPA—by reducing their correlation with sensitive attributes, thereby promoting equitable prediction outcomes. This preprocessing step helps ensure that applicants’ chances of admission are not disproportionately influenced by group membership.
Together, these methods illustrate how fairness-aware interventions—tailored to the characteristics of each dataset and task—can effectively mitigate bias in educational prediction systems.
5. Discussion
The experimental results highlight the varying effectiveness of preprocessing, in-processing, and post-processing fairness interventions across the three datasets. In the case of the HOULAD, preprocessing techniques, particularly learning fair representations (LFR), demonstrated the most balanced tradeoff between predictive performance and fairness. The reweighting method provided moderate improvements in fairness while maintaining accuracy, whereas disparate impact remover slightly reduced the model performance. In-processing methods, such as prejudice remover and adversarial debiasing, successfully mitigated bias but introduced minor accuracy tradeoffs. Similarly, post-processing approaches, like equality of odds and calibrated equalized odds, yielded improvements in fairness at the cost of slight accuracy reductions, reinforcing that fairness interventions must be carefully selected based on the desired balance between bias mitigation and predictive power.
For the xAPI-Educational Mining dataset, the results indicate that fairness-aware preprocessing methods provided the most promising outcomes. LFR once again stood out as the most effective, achieving high accuracy while significantly reducing the disparate impact value. Reweighting also improved fairness while maintaining competitive accuracy levels. In-processing techniques, particularly adversarial debiasing, exhibited notable fairness improvements, although this came at the cost of reduced accuracy, making it suitable for cases where fairness is prioritized. Post-processing techniques, such as calibrated equalized odds, further enhanced fairness by improving statistical parity and disparate impact values; however, the potential risk of overfitting to fairness constraints must be carefully considered. These results suggest that preprocessing techniques, particularly LFR, offer the best compromise between fairness and predictive performance for this dataset.
The OULAD experiments, which analyzed fairness concerning gender and disability as protected attributes, reinforce similar trends. Preprocessing techniques, particularly LFR, achieved near-perfect accuracy and fairness, making them the most effective strategy for bias mitigation. Reweighting offered minor improvements without significantly altering the model accuracy, while disparate impact remover had mixed results, sometimes reducing performance for specific classifiers. In-processing methods, including prejudice remover and adversarial debiasing, moderately enhanced fairness but did not entirely eliminate disparities, highlighting their limitations. The choice between these methods depends on the acceptable tradeoff between slight accuracy loss and fairness improvement.
Finally, post-processing interventions for OULAD, such as calibrated equalized odds, yielded perfect accuracy for all models but only marginally improved fairness. While these techniques are beneficial for maintaining high predictive performance, they may not be sufficient in addressing deeper fairness concerns without complementary preprocessing or in-processing strategies. The results suggest that preprocessing approaches, particularly LFR, consistently outperformed other bias mitigation strategies across datasets, providing the most reliable balance between predictive performance and fairness. These findings emphasize the need for dataset-specific fairness interventions, where preprocessing methods appear most effective for achieving equitable predictions without substantial accuracy tradeoffs.
The experimental results reveal that different classification models interact distinctively with various fairness-enhancing interventions. For instance, the decision tree classifier, which typically relies on the entirety of the training data to generate interpretable rules, showed substantial gains in both fairness and accuracy when preprocessing techniques were applied. In the HOULAD, its accuracy increased from 0.91 (without any processing) to 0.95 using the reweighting technique, and its fairness, measured via statistical parity and disparate impact, improved from 0.04 and 1.18 to −0.05 and 0.82, respectively. This suggests that preprocessing methods such as reweighting, which adjusts data distributions prior to learning, allow decision trees to make more equitable splits. Similarly, in the xAPI dataset, the decision tree performance peaked at 0.98 accuracy with learning fair representations (LFR), demonstrating that sophisticated preprocessing can align well with tree-based learners, improving both predictive quality and fairness outcomes.
In contrast, post-processing techniques exhibited mixed impacts on decision trees. While calibrated equalized odds increased the decision tree accuracy to 1.00 in both datasets, the fairness metrics (e.g., statistical parity at −0.05 and disparate impact at 0.77 for HOULAD) indicate moderate bias mitigation. However, compared to preprocessing, the improvement was less pronounced in terms of the disparate impact value. This may be due to the nature of post-processing, which modifies predictions after model training and does not influence the internal structure of the decision tree. Therefore, it does not fully leverage the interpretive capacity of tree-based models, suggesting that preprocessing might be the more effective pairing.
Additionally, in-processing techniques such as prejudice remover and adversarial debiasing were primarily applied to models like logistic regression and naive Bayes. These methods, which modify the learning algorithm itself, maintained high accuracy (0.91–0.93) and achieved respectable fairness scores. However, they are less interpretable and often harder to apply to non-probabilistic models like decision trees. Interestingly, logistic regression—a model that benefits from both data-driven and regularization-based strategies—achieved optimal fairness-accuracy tradeoffs under preprocessing and post-processing, with LFR and calibrated equalized odds achieving perfect or near-perfect metrics in both dimensions. This highlights that the model architecture plays a crucial role: simpler models (e.g., naive Bayes) benefit from fairness adjustments in a stable manner, while more complex ones (e.g., decision trees) respond better to techniques that reshape the input data distribution. These findings suggest that model selection should be considered jointly with the fairness technique to achieve both equitable and effective classification.
6. Conclusions and Future Work
This study evaluated the effectiveness of preprocessing, in-processing, and post-processing fairness mitigation techniques in educational data mining across three datasets: HOULAD, xAPI-Educational Mining, and OULAD. The findings demonstrate that fairness-aware preprocessing techniques, particularly learning fair representations (LFR), consistently achieved the best balance between predictive accuracy and fairness. In-processing methods, such as adversarial debiasing and prejudice remover, also effectively reduced bias but came with slight accuracy tradeoffs. Post-processing approaches, including calibrated equalized odds, improved fairness while maintaining high predictive performance, though they may not fully eliminate disparities without complementary interventions.
The comparative analysis highlights the importance of selecting fairness strategies based on dataset characteristics and the specific fairness–accuracy tradeoffs required for educational applications. While preprocessing methods generally outperform other approaches, the choice of bias mitigation technique should align with the ethical and practical considerations of each use case. Ensuring fairness in educational data mining is particularly crucial, as biased models can reinforce systemic inequalities and negatively impact student opportunities.
In this study, we employed the same hyperparameter values for techniques such as learning fair representations, disparate impact remover, and prejudice remover across all three datasets. For the cost constraint in calibrated equalized odds, we adopted a weighted approach that balanced the false negative ratio and false positive ratio, ensuring consistency across datasets.
We acknowledge that this constitutes a key limitation of our research, as it impacts both the performance and fairness metrics. Simply put, using different hyperparameter settings for certain techniques could potentially lead to different conclusions regarding their suitability. A valuable direction for future research would be to systematically explore the effects of varying these hyperparameter values. Such an investigation could offer deeper insights into their influence on both performance outcomes and fairness metrics, thereby enhancing our understanding of the tradeoffs involved.
We also recognize that intersectional bias remains an open and critical area for future work. Assessing and mitigating intersectional bias is particularly challenging due to the combinatorial explosion of group categories and the resulting data sparsity, which complicates both statistical analysis and fairness interventions.
Future research could also explore hybrid fairness interventions that combine multiple strategies to further optimize both fairness and accuracy. As educational institutions increasingly rely on data-driven decision making, ensuring algorithmic fairness will be essential in promoting equitable and inclusive learning environments.


