Article

A Dynamic Spatiotemporal Deep Learning Solution for Cloud–Edge Collaborative Industrial Control System Distributed Denial of Service Attack Detection

1
Purple Mountain Laboratories, Nanjing 211111, China
2
School of Cyber Science and Engineering, Southeast University, Nanjing 211189, China
*
Author to whom correspondence should be addressed.
Electronics 2025, 14(9), 1843; https://doi.org/10.3390/electronics14091843
Submission received: 1 April 2025 / Revised: 25 April 2025 / Accepted: 27 April 2025 / Published: 30 April 2025
(This article belongs to the Section Artificial Intelligence)

Abstract

:
With the continuous development of industrial intelligence, the integration of cyber–physical components creates a need for effective attack detection methods to mitigate potential DDoS threats. Although several DDoS attack detection modeling approaches have been proposed, few effectively incorporate the unique characteristics of industrial control system (ICS) architectures and traffic patterns. This paper focuses on DDoS attack detection within cloud–edge collaborative ICSs and proposes a novel detection model called FedDynST. This model combines federated learning and deep learning to construct feature graphs of traffic data. Introducing dynamic and static adjacency matrices, this work reveals the interactions between long-term industrial traffic data and short-term anomalies associated with DDoS attacks. Convolutional neural networks are utilized to capture distinctive temporal features within industrial traffic, thereby improving the detection precision. Moreover, the model enables continuous optimization of the global detection framework through a federated learning-based distributed training and aggregation mechanism, ensuring the privacy and security of industrial client data. The effectiveness of the FedDynST model was validated on the CICDDoS2019 and Edge-IIoTset datasets. The simulation results validated the superiority of the proposed approach, and thus, demonstrated significant improvements in both detection accuracy and convergence.

1. Introduction

Industrial control systems (ICSs) collectively denote the technologies designed to ensure the reliable monitoring and automation of industrial operations [1]. In recent years, modern ICSs and IT systems have displayed a trend of close integration under the development of industrial digitization, intelligence, and informatization. To manage and make sense of the vast data produced by modern ICSs, researchers have introduced edge and edge–cloud computing into their design. This integration has gradually led to the development of a collaborative cloud–edge architecture [2,3]. Under this architecture, ICSs achieve data sharing, knowledge sharing, and resource sharing, but the security boundaries become increasingly blurred, making them more susceptible to cyber attacks [4,5].
Among today’s most disruptive cyber threats are distributed denial of service (DDoS) attacks, impacting various fields, including communications, energy, and transportation [6,7,8]. DDoS attacks are particularly challenging in the field of ICS security due to their suddenness, large scale, and potential for severe harm [9]. In recent years, the methods of DDoS attacks have become more diversified, and the frequency of attacks has been on the rise, causing serious impacts and threats to the industrial production sector. For example, in July 2023, the ransomware group Lockbit 3.0 launched a DDoS attack on Nagoya Port in Japan, causing the port’s container handling system NUTS to shut down for a day and disrupting container handling operations, resulting in significant economic losses [10]. In November of the same year, a South Korean semiconductor manufacturer suffered a DDoS attack, leading to a production line shutdown and substantial economic losses. In ICS scenarios, such attacks can not only lead to production halts and service interruptions but also pose potential risks to personal safety [11,12].
Accordingly, strengthening DDoS detection and mitigation in ICS environments is essential. Early detection techniques for DDoS attacks in ICS primarily relied on simple feature rules, such as traffic thresholds, request frequency, and whitelisting [13]. For instance, signature detection techniques were introduced to build rule sets for identifying specific attack patterns, while network traffic analysis tools were used for the manual analysis of suspicious traffic information [14]. These methods typically depend on fixed rules and thresholds, leveraging experience and existing human knowledge to identify DDoS attacks. Although these techniques perform well against known attack patterns, they exhibit insufficient adaptability in the face of novel attacks.
With the increasing diversity and complexity of attack types, ICSs begin adopting machine learning methods to enhance dynamic adaptive capabilities in DDoS attack detection. Machine learning models, including J48, Naive Bayes, and Random Forest, have shown effectiveness in detecting DDoS attacks across diverse datasets. Among these, the Random Forest algorithm outperforms both J48 and Naive Bayes, demonstrating a higher accuracy in machine learning-based detection [15]. However, machine learning-based detection methods often require substantial labeled data and rigorous feature selection. When feature selection is inadequate, the accuracy of attack detection can be significantly affected. Additionally, some literature suggests that relying solely on machine learning methods may not be sufficient to capture the deeper characteristics of industrial traffic [16].
In recent years, deep learning has garnered significant attention for its strong feature extraction capabilities and outstanding performance. Advanced models, like convolutional neural networks (CNNs) and recurrent neural networks have been employed to analyze traffic patterns within industrial control systems. This approach is especially effective for processing time-series data, as it can identify complex traffic patterns and potential attack signals [17,18,19]. However, current deep learning methods primarily focus on learning local features of traffic data, such as the statistical characteristics of individual fields or field groups, and lack attention to the macro-level connections and global recognition patterns within industrial traffic datasets.
On the other hand, cloud–edge collaborative ICSs are deployed in a distributed manner. The hardware configurations, operating systems, application versions, and firmware update frequencies may differ from one factory to another [20]. Attackers can exploit these differences by adopting varied attack strategies, leading to detection models trained solely on local data from a single ICS having limited attack recognition capabilities. Additionally, the traffic data from industrial production processes may contain substantial sensitive information related to industrial operations, so centralized data training may significantly increase the risk of privacy breaches [21].
To address this gap, this work proposes a detection model that combines deep learning methods with a federated learning framework. First, this study adopted a federated learning framework within a cloud–edge collaborative ICS to avoid the exchange of raw data. By training on traffic data from multiple ICSs, the model improved its ability to detect and defend against attack behaviors. Second, this study modeled the correlations between features in industrial traffic data using a non-Euclidean graph structure. Considering the characteristics of ICS traffic, static and dynamic adjacency matrices were used to explore the interactions between traffic features on different time scales. By implementing the proposed graph convolutional network (GCN), the model effectively captured and learned complex relationships between traffic features, and thus, improved the global feature recognition.
In summary, this study focuses on DDoS attack detection algorithms in cloud–edge collaborative industrial control scenarios based on deep learning and federated learning, with the following main contributions:
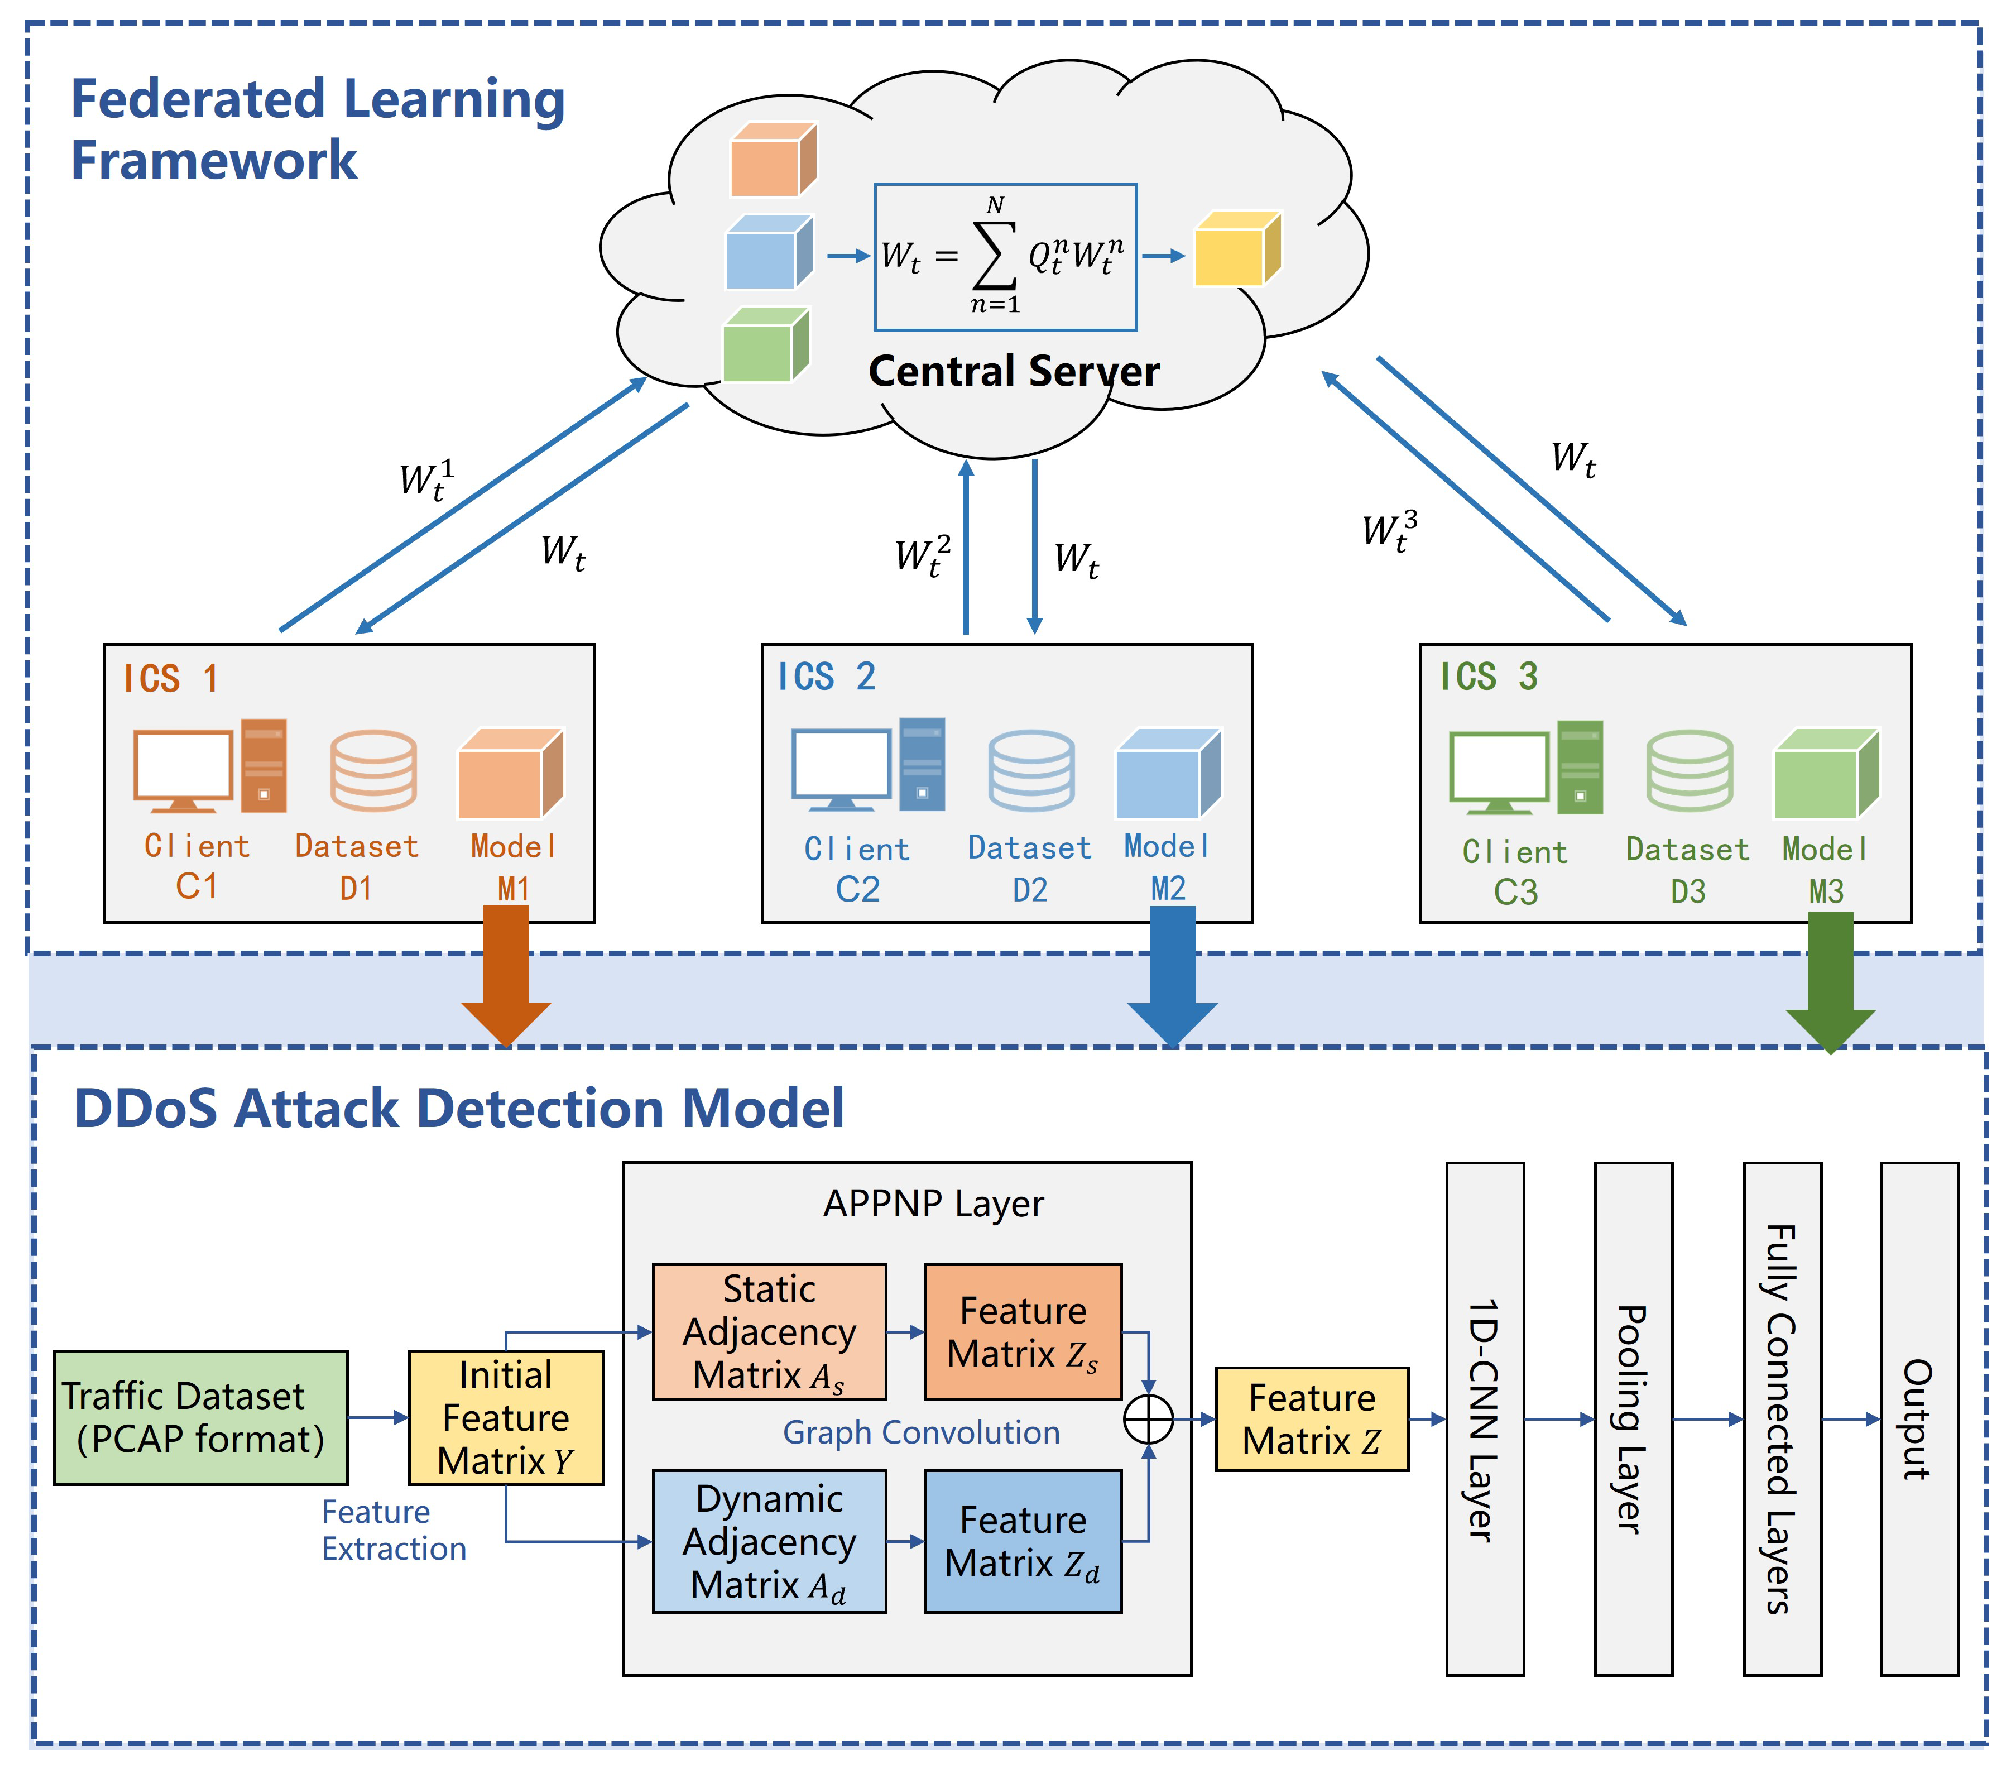
  • A federated learning framework suitable for cloud–edge collaborative ICSs is proposed. By assigning dynamic weights to each industrial client, the framework optimizes the learning process of the global model, enhancing the overall performance.
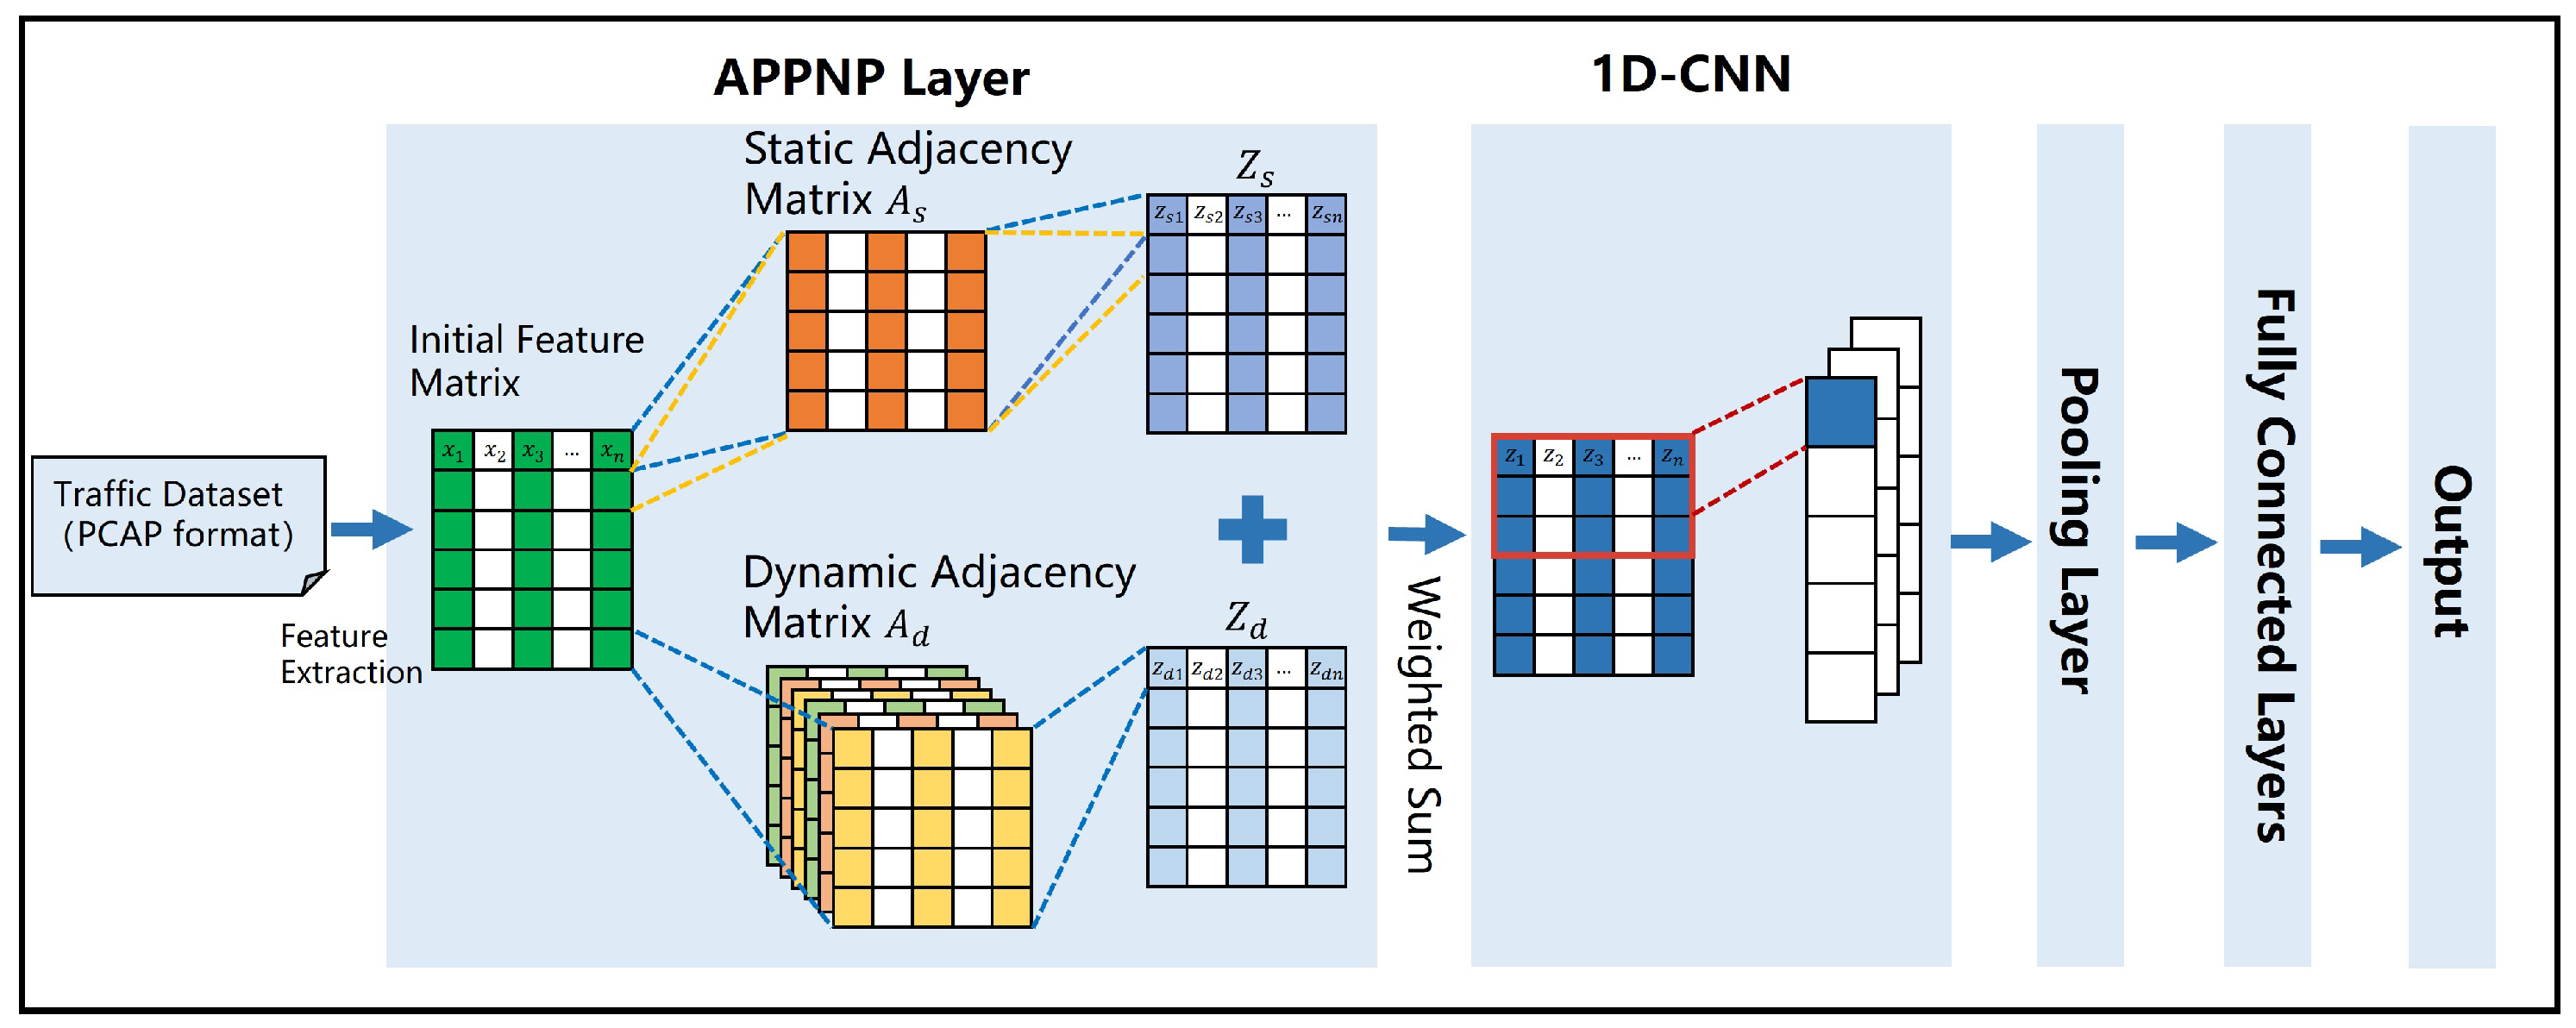
  • A DDoS attack detection model is introduced that constructs static and dynamic adjacency matrices to address the differences between long-term and short-term traffic data. This approach extracts relationships between the features of industrial traffic data across different time scales, enabling better capture of the deeper characteristics of DDoS attacks in industrial scenarios.
  • The proposed model was tested on the CICDDoS2019 and Edge-IIoTset datasets and benchmarked against multiple federated and deep learning-based DDoS detection approaches. The results confirmed its effectiveness, demonstrating clear performance gains over existing methods.

2. Related Work

DDoS detection within industrial control environments has attracted considerable research attention. This section specifically reviews deep learning-based approaches for identifying such attacks. Researchers have utilized deep learning techniques to learn and analyze the features of ICS traffic data from various dimensions, thereby enhancing the ability to identify DDoS attacks.
In the spatial dimension, Haider et al. [22] introduced a deep CNN ensemble framework that effectively detects DDoS attacks in software-defined networks by capturing spatial characteristics of network traffic, achieving a high detection accuracy. Kim et al. [23] suggested converting traffic data features into grayscale and RGB images. They leveraged the ability of CNNs to process spatial information, thereby extracting the spatial features of these images and effectively improving the performance of intrusion detection systems.
In the temporal dimension, recurrent neural networks, including Gated Recurrent Units (GRUs) and Long Short-Term Memory (LSTM) variants, are commonly employed to capture temporal patterns in time-series data [24,25]. Shen et al. [26] proposed an LSTM-based deep learning model for DDoS detection in SDN-based Industrial Internet environments. The LSTM network identifies DDoS attacks and normal traffic based on temporal features, and its effectiveness was validated through experiments with real industrial control network topologies. Yazdinejad et al. [27] combined LSTM with autoencoders (AEs) to propose the LSTMAE deep learning model. This model leverages temporal features of traffic data to assist in decision tree usage, effectively identifying anomalous data and threats. It performed well on datasets from gas pipeline and secure water treatment systems.
In the spatiotemporal dimension, Zainudin et al. [28] proposed a hybrid model combining CNN and LSTM for identifying DDoS attacks targeting controllers. This model effectively extracts both spatial and temporal features from traffic data, demonstrating a high detection accuracy. Diaba et al. [29] utilized a hybrid deep learning approach that integrates CNN and GRU to mine spatial and temporal features of smart grid traffic for DDoS attack detection. Their research demonstrated that this method significantly improved the DDoS attack detection accuracy in smart grid applications. Söğüt et al. [30] introduced a hybrid model based on CNN and LSTM for industrial control SCADA systems. Using SCADA system test data, they evaluated the hybrid model against individual CNN and LSTM models, and observed improved detection accuracy for DDoS attacks.
The mentioned deep learning-based attack detection methods primarily delve into traffic features from spatial and temporal dimensions to enhance DDoS attack recognition. Specifically, CNNs are commonly used to extract spatial features of traffic, while temporal features are learned through recurrent neural networks. However, traditional CNNs, as was noted above, mainly focus on learning local features of the traffic, i.e., the statistical characteristics of individual fields or groups of fields. They have a limited ability to recognize the relationships and global patterns across the entire set of traffic fields.
In the field of federated learning, Li et al. [31] introduced FLEAM, a federated learning-based architecture designed to mitigate DDoS attacks, which adopts a federated learning enhanced architecture combined with the IMA-GRU protocol to combat malicious DDoS scripts. This model offers greater flexibility, scalability, and adjustability, along with an improved detection accuracy and reduced response time. Zainudin et al. [32] introduced the FedDDoS model, which uses Pearson’s correlation coefficient (PPC) to select potential traffic features based on FS methods. To reduce the model complexity, the model utilizes CNNs with residual connections to extract features, followed by an MLP for attack classification, demonstrating good detection performance. Shao et al. [33] applied federated learning to intrusion detection in an ICS. By employing an evolutionary neural architecture search, they developed a lightweight federated learning model that performed well in dataset-based experiments. Federated learning-based methods allow for model training in distributed environments without sharing raw data, effectively protecting the data privacy [34]. However, current research on federated learning for cloud–edge collaborative industrial control scenarios is limited.

3. Methodology

3.1. Model Architecture

This paper proposes FedDynST, a deep learning-based solution for DDoS detection in cloud–edge collaborative ICS environments. As shown in Figure 1, the architecture integrates a DDoS detection module with a federated learning framework.

3.2. Federated Learning Algorithm Based on Dynamic Weights

Within the federated learning framework, each industrial client employs a local CNN to learn from its traffic data and independently train a DDoS detection model. The trained model parameters are sent to a central server for aggregation and then returned to each client to update their local models, enabling effective training and optimization without disclosing sensitive data. This approach aligns well with the current cloud–edge collaborative architecture in ICSs, where data transmission between the cloud and edges typically occurs over relatively closed industrial private networks. Moreover, techniques such as homomorphic encryption and access control are employed to minimize data leakage and privacy risks during training.
Considering that the scenarios and data quality faced by different ICS clients vary, resulting in differing quality of trained models, this paper proposes an improved dynamic weighting algorithm based on the federated averaging algorithm (FedAvg). The algorithm assigns dynamic weights to client model updates, optimizing the global model’s learning process and enhancing its performance and convergence speed.
The design of the dynamic weights is based on two metrics: the difference between the client’s model update parameters and the global model update parameters, and the client’s local training loss. The divergence metric is defined as Equation (1):
A k = 0.5 + 0.5 c o s ( ω C , ω G )
where A k represents the difference index between the local client model update parameters and the previous round of global client model update parameters, ω C is the client local update model parameters, and ω G represents the previous round of global model update parameters.
Another important metric for the model is the local training loss. Generally, a lower training loss indicates a higher quality of the locally trained model, and thus, the client’s weight in the federated learning process should be greater. To facilitate the integration of the client’s loss with the divergence metric A k , normalization is applied, as shown in Equation (2):
L k t = 1 l o s s k t j = 1 m l o s s k t
where m is the total number of clients participating in the training, L k t is the normalized index of training loss for client k in round t, and l o s s k t represents the training loss of client k in round t.
The weight coefficient of each client is set by combining the divergence and loss value indicators, as defined in Equation (3):
Q k = 0.5 A k + 0.5 L K
Finally, all client weight coefficients are normalized, and a weighted aggregation of all client models is performed to generate a new global model. As the federated learning training progresses, the training loss of each participating local client model changes, and its divergence from the global model also changes. Consequently, in the new global model, the parameters from higher-quality clients have a larger proportion. This method not only ensures rapid convergence speed but also effectively enhances the model’s performance.

3.3. DDoS Attack Detection Model

The detection model comprises an APPNP graph CNN, a 1D CNN, pooling layers, and fully connected layers, as illustrated in Figure 2.
The model receives traffic data that have been subjected to feature extraction, resulting in an initial feature matrix fed into the APPNP graph convolution layer. Here, both static and dynamic adjacency matrices facilitate graph convolution on traffic features, extracting relationships between ICS traffic data packet fields to enhance feature expression. Subsequently, the feature matrix from the graph convolution is input into the 1D-CNN layer, primarily extracting temporal sequence features from ICS traffic data. Finally, the traffic data undergo pooling after spatial and temporal convolutions, and is processed through fully connected layers to perform the ultimate task of DDoS attack detection. The subsequent sections provide a detailed discussion of each component of the proposed model.

3.3.1. APPNP Graph Convolution Layer
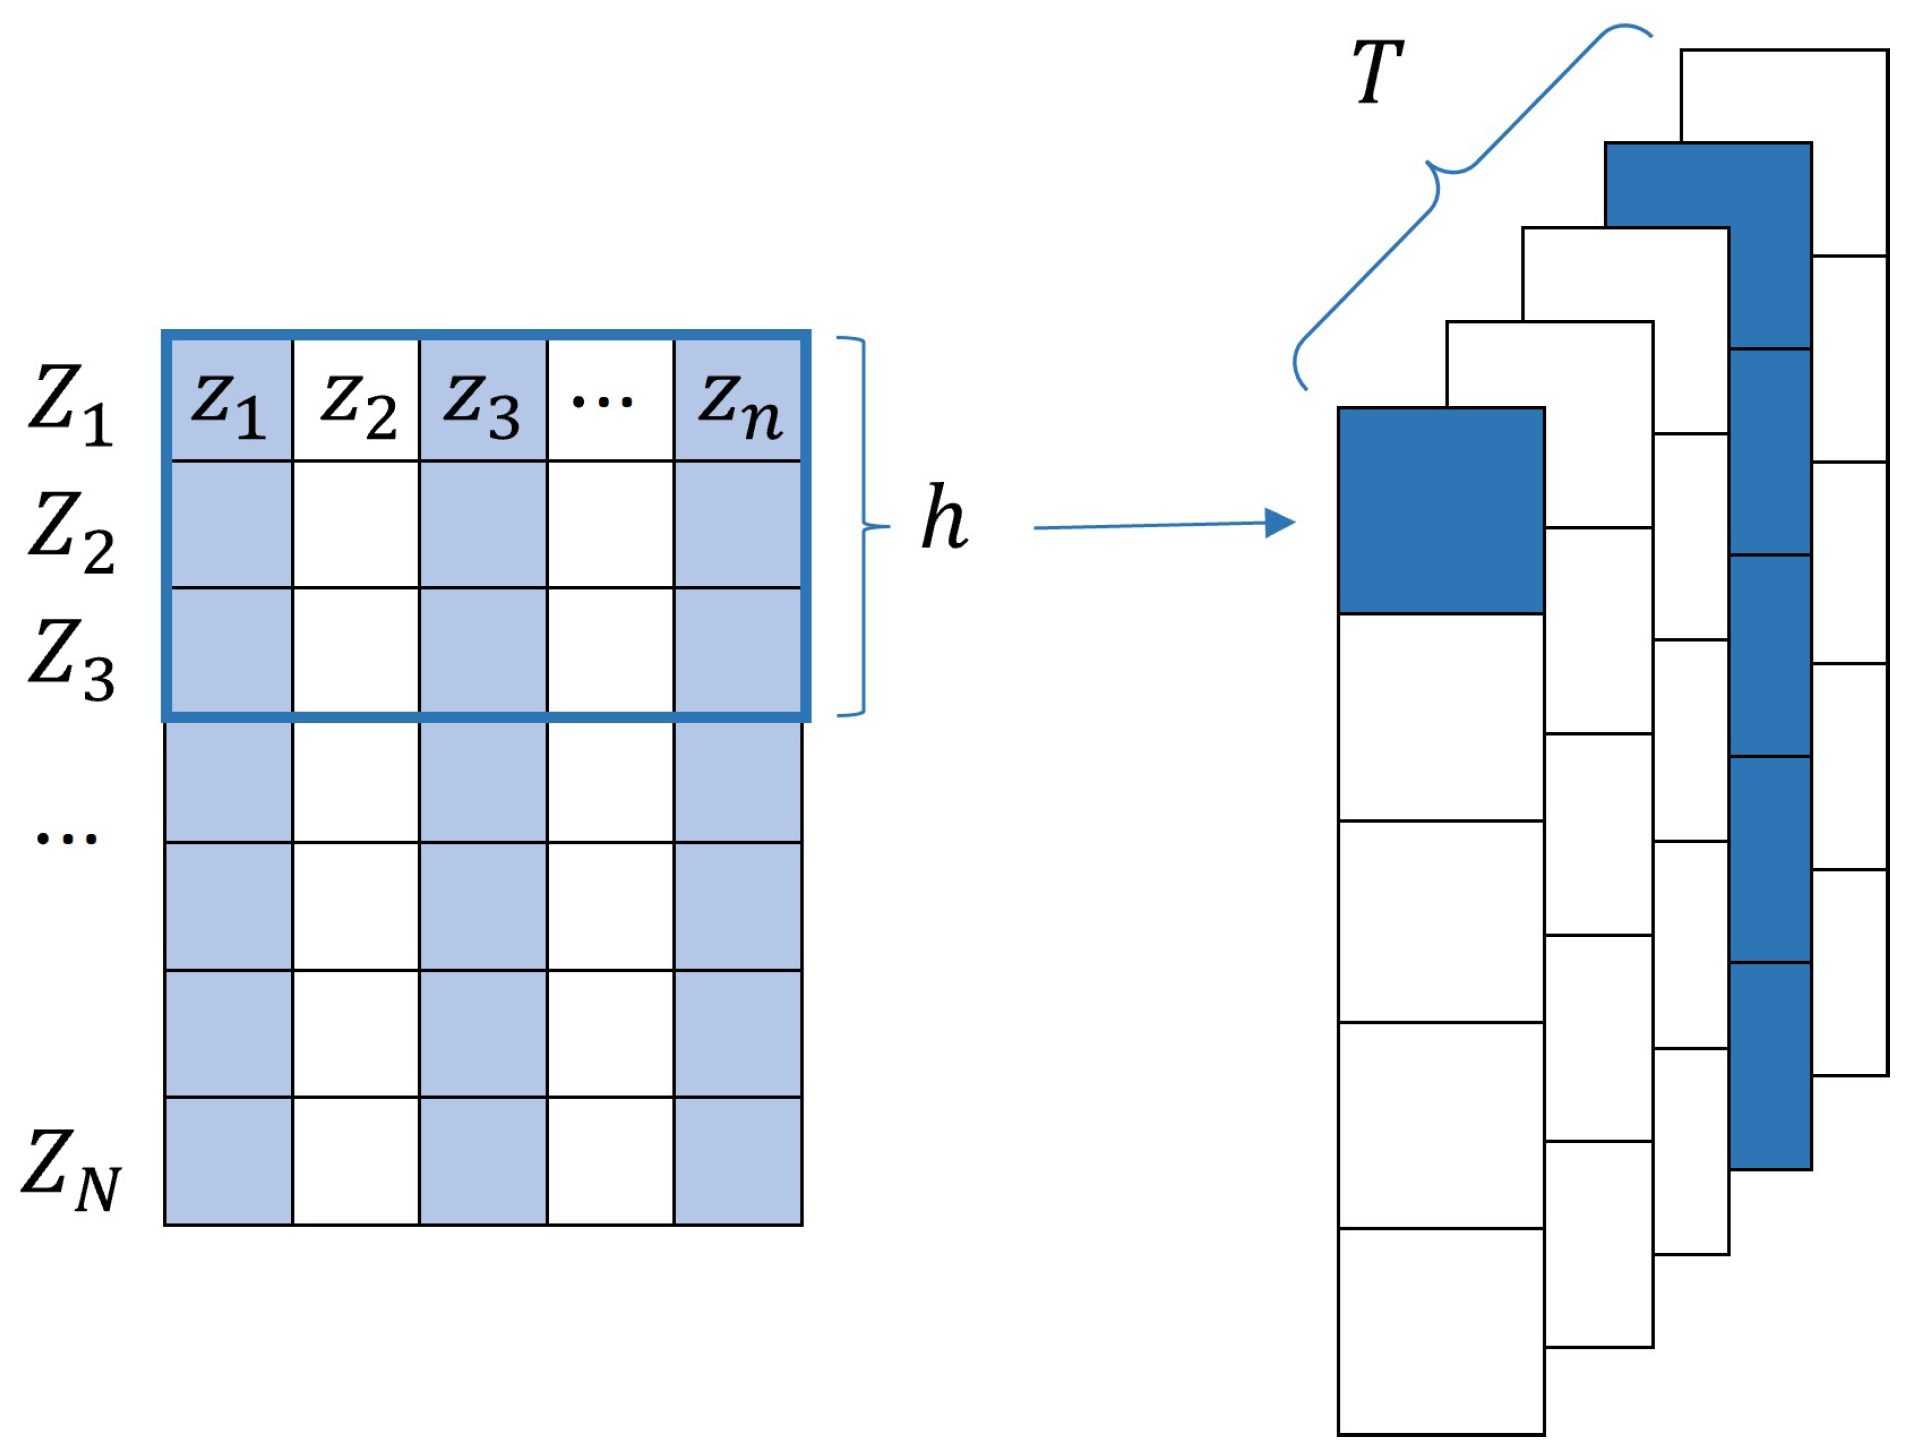
In this layer, static and dynamic adjacency matrices are constructed based on long-term and short-term flow data, respectively. After performing graph convolution operations using these two types of adjacency matrices, we maximized the correlation of the outputs obtained from the graph convolution through an unsupervised loss function based on mutual information.
ICSs typically operate in periodic modes, with devices regularly transmitting and receiving data. The static adjacency matrix, derived from long-term statistics of ICS traffic data, captures enduring relationships between traffic features, providing reliable feature associations for the model. Conversely, DDoS attacks in ICSs often induce notable changes in traffic features over short intervals. The dynamic adjacency matrix, informed by short-term traffic data, captures relationships between traffic features, enabling real-time detection of anomalous changes in ICS traffic and bolstering the model’s ability to identify sudden attacks. Integrating these two types of adjacency matrices allows for a more comprehensive exploration of traffic data feature relationships across various time scales.
Specifically, this work employed the graph neural network APPNP to model the relationships between traffic features. APPNP, a graph neural network, combines GCN and personalized PageRank [35]. Compared with a traditional GCN, APPNP offers faster convergence and fewer parameters. The specific process is as follows.
For long-term ICS traffic data, this study measured the correlation between variables by calculating the mutual information between traffic features. Specifically, the static adjacency matrix A s R n × n is defined such that A s [ i , j ] = 1 indicates a connection between variable i and variable j, while A s [ i , j ] = 0 indicates no connection. The definition of A s is given in Equation (4):
A s [ i , j ] = 1 if M I ( x i , x j ) ϵ 0 otherwise
where x i and x j represent the sequence data of traffic features i and j across the entire training set, and ϵ is a predefined threshold. The average mutual information M I ( x i , x j ) is calculated, where N is the number of features extracted from the traffic data. The mutual information M I ( x i , x j ) is defined in Equation (5):
M I ( x i , x j ) = p ( x , y ) log p ( x , y ) p ( x ) p ( y ) d x d y
where p ( x , y ) is the joint probability density function of x i and x j , while p ( x ) and p ( y ) are their marginal probability density functions, respectively.
Considering the influence of various factors over time, the correlation between traffic data features may change. Therefore, a dynamic adjacency matrix is constructed to update the correlations between traffic data features in real time, allowing for timely responses to these changes. The specific steps are as follows.
First, the training set is segmented by a time window T (as shown in Figure 3), where each time window T contains N data packets X. For each time window T, the traffic data Y i R N × n is transposed to obtain Z i R n × N (where n represents the number of traffic data features). Then, the similarity between features is calculated to define the adjacency matrix for each traffic packet. The calculation process is shown in Equations (6) and (7):
M 1 = σ ( Z i Θ 1 ) , M 1 R n × f
M 2 = σ ( Z i Θ 2 ) , M 2 R n × f
where two different mapping functions, Θ 1 R N × f and Θ 2 R N × f , are used to map Z i R n × N to a higher-dimensional space R n × f , enhancing the representation capability of the relationships between features. Here, σ is the sigmoid activation function.
Next, the inner product similarity is used to obtain the similarity matrices M 1 M 2 T and M 2 M 1 T . These two similarity matrices represent the dependency of source nodes on target nodes and target nodes on source nodes within the graph, respectively. By adding these two matrices together, bidirectional modeling is achieved (with σ as the sigmoid activation function). This results in the adjacency matrix A d corresponding to the traffic data Y i within each time window T, as follows:
A d = σ ( M 1 M 2 T + M 2 M 1 T ) , A R n × n
Finally, to ensure the sparsity of the adjacency matrix and prevent overfitting, the average similarity score of each dynamic adjacency matrix is used to filter the adjacency matrix, as shown in the following equation:
A d ( i , j ) = 1 , A d ( i , j ) 1 n n A , i , j [ 1 , n ] 0 , A d ( i , j ) < 1 n n A , i , j [ 1 , n ]
The constructed static adjacency matrix A s and dynamic adjacency matrix A d are symmetrically normalized. Graph convolution operations using the APPNP model are then applied to extract both the fixed and dynamic relationships between the traffic data features. The computation process is outlined as follows, from Equation (10) to Equation (13):
Z s ( 0 ) = Y
Z s ( k ) = ( 1 α ) A s ^ Z s ( k 1 ) + α Z s ( 0 )
Z d ( 0 ) = Y
Z d ( k ) = ( 1 α ) A d ^ Z d ( k 1 ) + α Z d ( 0 )
where A s ^ and A d ^ are the normalized static and dynamic adjacency matrices, respectively. Y is the set of N traffic data packets within the time window T, with Y R N × n . To differentiate the outputs of the graph convolution operations using different adjacency matrices, let Z s ( 0 ) = Y and Z d ( 0 ) = Y , representing the inputs to the GCN using the static and dynamic adjacency matrices, respectively. Z s ( k ) and Z d ( k ) represent the static and dynamic node variable embedding matrices after the APPNP graph convolution. α is the weight coefficient of the initial residual, ranging between 0 and 1, and k denotes the number of layers in the GCN.
The final graph convolution result is obtained by weighting the outputs of the static and dynamic adjacency matrix convolutions, as defined in Equation (14):
Z ( k ) = ( 1 η ) Z s ( k ) + η Z d ( k )
where Z ( k ) R N × n , and η represents the weight proportion of the dynamic adjacency matrix output.
The static adjacency matrix is constructed based on long-term traffic data feature relationships, reflecting stable correlations between features over an extended period and typically exhibiting high reliability. Therefore, this manuscript maximizes the correlation by maximizing the mutual information between Z d ( k ) , the output from the convolution with the dynamic adjacency matrix, and Z s ( k ) , the output from the convolution with the static adjacency matrix. Assuming two random variables, X and Y, their mutual information M I ( X , Y ) can be maximized following the method proposed by Belghazi et al. [36], as shown in Equation (15):
max M I ( X , Y ) E P ( X , Y ) [ D ( X , Y ) ] log E P ( X ) P ( Y ) e D ( X , Y )
where D ( X , Y ) is a binary classifier, and its implementation method is as follows:
D ( d i , s i ) = σ ( d i T W s i )
where σ is the activation function and W is the weight matrix. To concretize this maximization process, we define an unsupervised loss function L p :
L p Z d ( k ) , Z s ( k ) = E P d i , s i D d i , s i + log E P ( d ) P ( s ) e D d i , s i
where d i and s i represent the outputs corresponding to the dynamic and static adjacency matrices, respectively. For each batch of data, a pair is selected from the joint distribution P ( d i , s i ) to estimate the first term of the loss function L p . Then, s i is shuffled within the batch to generate negative sample pairs, estimating the second term of the loss function L p , thereby achieving the maximization of mutual information.

3.3.2. CNN Layer

After extracting the relationships between traffic data features using the APPNP graph convolution layer, the next step is to extract the temporal information of the traffic data using a temporal convolution module [37]. This manuscript employs a 1D-CNN as the temporal convolution module to extract the temporal features of the traffic data, as shown in Figure 4.
As mentioned above, after applying the APPNP graph convolution to the traffic data Y, the output Z ( k ) is obtained. The structure of the 1D-CNN is illustrated in the diagram below. The output Z ( k ) from the graph convolution is input into the 1D-CNN for convolution operations, as follows:
Z ( l ) = g ( Z ( l 1 ) W ( l ) + b ( l ) )
where Z ( l ) represents the feature map of the first layer; W ( l ) and b ( l ) represent the weights and biases of the convolution kernel, respectively; and g is the activation function. Assuming the convolution kernel size is h and the number of output channels is T, since the input Z ( k ) R N × n , the output after extracting temporal features using the 1D-CNN is Z O R ( N h + 1 ) × T .

3.3.3. Pooling Layer

After processing through the APPNP graph convolution and 1D-CNN layers, a significant amount of traffic feature information is extracted, leading to a substantial increase in the feature dimensions. However, high-dimensional features increase the model’s parameter count and computational complexity. Introducing a pooling layer can effectively address this issue. The pooling layer compresses high-dimensional features into a one-dimensional representation. This reduces the computational complexity while preserving key information, ensuring the model retains strong representational capacity. The one-dimensional feature layer obtained after pooling is flattened and concatenated into a one-dimensional feature vector, serving as the input for the subsequent fully connected layer.
In the fully connected layer, each neuron is connected to all neurons in the previous layer, integrating the features extracted by the previous layers for the final classification task:
y = σ ( W x + b )
where x is the input vector for the fully connected layer, y is the output vector, W is the weight matrix, b is the bias vector, and σ is the activation function.
Finally, the output from the fully connected layer is passed through a softmax function to compute classification scores, and thus, determine whether the input traffic Y corresponds to a DDoS attack.
Cross-entropy loss is employed as the supervised training objective, quantifying the gap between the model’s predicted distribution and the actual label distribution:
L s = 1 N i = 1 N [ y i log ( y ^ i ) + ( 1 y i ) log ( 1 y ^ i ) ]
where N is the number of samples, y i is the true label of the i-th sample (0 or 1), and y ^ i is the predicted probability of the sample being positive. Combining the unsupervised loss function L p proposed in this section, the total loss of the DDoS attack detection model is defined as the weighted sum of the two loss functions, as shown in Equation (21):
L = L s + μ L p
where μ is the weight of the unsupervised loss, ranging between 0 and 1.

4. Experiment Settings and Results Analysis

4.1. Datasets and Preparation

This study employed the CICDDoS2019 and Edge IIoTset datasets to validate the detection of ICS DDoS attacks.
The CICDDoS2019 dataset, developed by the Canadian Institute for Cybersecurity, is a widely used benchmark in DDoS detection research. It contains traffic data from 13 common DDoS attack types—including HTTP floods, TCP SYN floods, and UDP floods—alongside normal traffic, simulating a realistic network environment [38].
The Edge-IIoTset dataset is a recent benchmark combining IoT and IIoT applications for network security research. It is well-suited for studies involving ensemble and federated learning-based intrusion detection. The dataset includes 14 categories of malicious traffic, with DDoS attacks further divided into HTTP flood, TCP SYN flood, UDP flood, and ICMP flood. It also features traffic from diverse network devices using various protocols, including Modbus/TCP—an application-layer protocol commonly used in ICS environments [39].

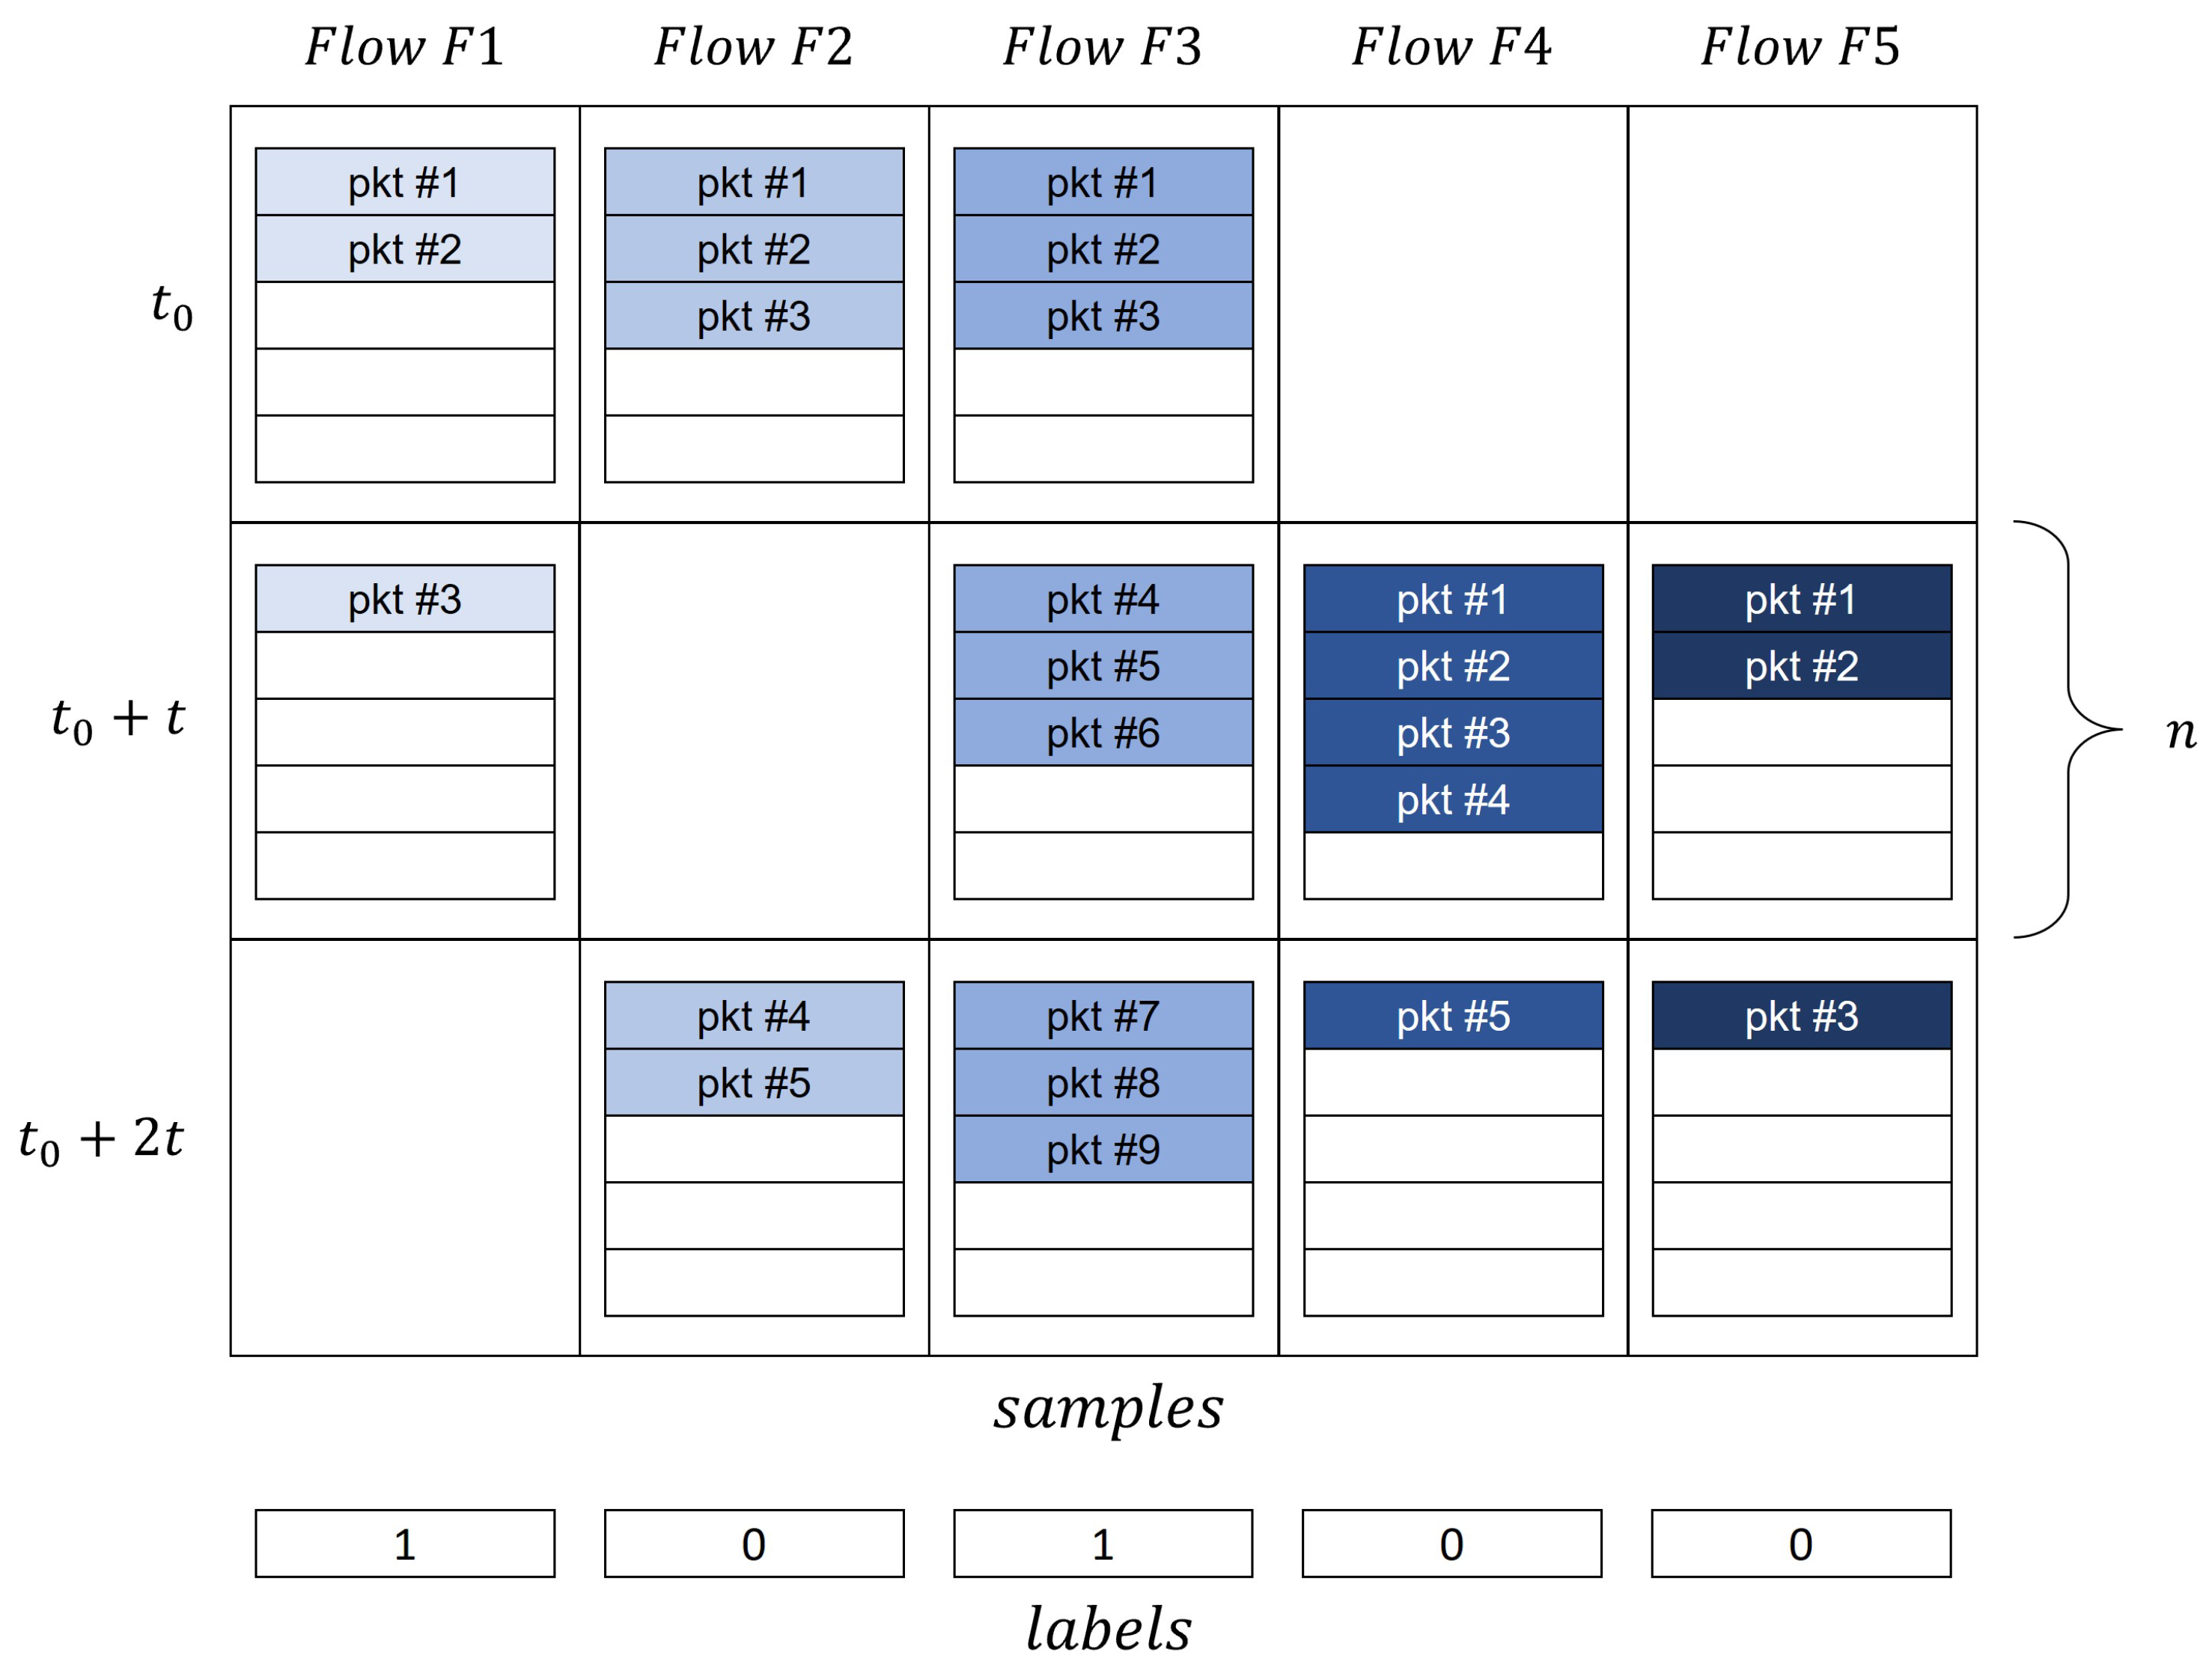
4.1.1. Dataset Preprocessing

The shared nature of communication links leads to the multiplexing of packets from various data streams, and as a result, packets belonging to the same stream can be transmitted non-sequentially. This means that the order of packets in the captured raw traffic data may be non-continuous. To address this, this study employed a network traffic preprocessing algorithm proposed by Doriguzzi-Corin [40], which converts captured raw traffic data into an array-like data structure and divides them into sub-data streams based on time windows.
The traffic preprocessing algorithm aggregates packets belonging to the same bidirectional flow into sub-flow samples of size n × f , where f is the number of features extracted from the traffic, and n is the maximum number of packets collected during the parsing of each flow within the time window t. If the number of packets collected within each time window t exceeds n, the flow is truncated; if it is less than n, it is padded with zeros at the end. Finally, each sample is assigned a corresponding label (attack traffic or normal traffic). As shown in Figure 5, the algorithm’s output E can be seen as a two-dimensional sample array, where each row represents packet samples captured within the same time window, and each column represents packet samples belonging to the same bidirectional flow.
Additionally, in terms of feature selection, this research primarily selected 20 network traffic features, including parts of the IP header fields, TCP header fields, UDP header fields, and some application layer protocol fields. Features such as IP addresses and port numbers, which are closely tied to specific classes, were excluded to ensure a fair and accurate model performance.

4.1.2. Dataset Partitioning

Since ICSs are primarily deployed in a distributed manner, the devices in different systems can vary significantly, allowing attackers to exploit these differences with various DDoS attack methods. As a result, the types and volumes of DDoS attack traffic data in different systems often differ. This situation aligns with the federated learning scenario, where data from different participants are not independently and identically distributed. To reflect this scenario, this study included specific category divisions for the CICDDoS2019 and Edge-IIoTset datasets.
First, considering that the number of normal traffic and some attack traffic samples in the CICDDoS2019 and Edge-IIoTset datasets was excessive, random sampling of the datasets was necessary. Then, an artificial categorization of attack types is implemented so that each client’s dataset contains different DDoS attack types, simulating the data distribution in a real ICS environment. The specific details are as follows.
CICDDoS2019 dataset: Based on the 13 types of DDoS attacks in the CICDDoS2019 dataset, we selected a portion of the traffic sample data and divided it into 13 datasets, each representing one client. Among these, seven clients contained only one type of DDoS attack traffic in addition to normal traffic, three clients contained two types of DDoS attack traffic, two clients contained four types of DDoS attack traffic, and one client contained all 13 types of DDoS attack traffic. The specific dataset divisions are shown in Table 1. Note that the last two columns in this table are the same because we performed random sampling of the dataset to ensure that the ratio of the attack traffic to normal traffic was 1:1. This approach is commonly used to maintain the effectiveness of training by balancing the classes.
Edge-IIoTset dataset: Similar to the division method for the CICDDoS2019 dataset, based on the four types of DDoS attacks in the Edge-IIoTset dataset, we selected a portion of the traffic sample data and divided it into four datasets, each representing one client. Among these, Client 1 contained all four types of DDoS attack traffic in addition to normal traffic, Client 2 contained two types of DDoS attack traffic, and Clients 3 and 4 each contained only one type of DDoS attack traffic. The specific dataset divisions are shown in Table 2.
This dataset division method ensured the non-IID nature of the datasets across different clients, which better tested the training effectiveness of the proposed FedDynST model. For each local client dataset, we divided the data into training, validation, and test sets in an 8:1:1 ratio. Additionally, 5% of the traffic data from each dataset was selected to form a global test set to evaluate the generalization performance and accuracy of the global model.

4.2. Evaluation Methodology

4.2.1. Evaluation Metrics

Evaluation metrics: This study used five metrics to evaluate the classification performance of the FedDynST model from different perspectives: accuracy, precision, recall, F1-score, and AUC. The formulas for these metrics are as follows:
  • Accuracy: T P + T N T P + T N + F P + F N ;
  • Precision: T P T P + F P ;
  • Recall: T P T P + F N ;
  • F1-score: 2 × P r e c i s i o n × R e c a l l P r e c i s i o n + R e c a l l ;
  • AUC: the area under the ROC curve, reflecting the trade-off between the true positive rate and the false positive rate.
  • where TP, TN, FP, and FN represent true positive, true negative, false positive, and false negative, respectively. These metrics are selected to provide a comprehensive assessment of model performance, taking into account not only the overall accuracy but also the balance between the detection precision and false positives, which is critical for the continuous operation of ICSs.

4.2.2. Comparison Algorithms

To validate the effectiveness of the FedDynST model in detecting attacks, we selected several classic algorithms and recent novel DDoS attack detection models based on federated learning frameworks for comparison. These were as follows:
  • FLAD: This algorithm, detailed in [41], is an adaptive federated learning algorithm for DDoS attack detection. The study used two DDoS attack detection models: FLAD + CNN and FLAD + MLP. Both models were used for comparison in this study.
  • FedDDoS: This model, presented at [32], utilizes Pearson coefficient-based feature selection techniques to enhance the detection performance while reducing the model complexity. The detection model for this algorithm is CNN + MLP, and the federated learning algorithm used is FedAvg.
  • FedAvg: This classic algorithm in the field of federated learning, introduced in [42], serves as a benchmark model and provides an important starting point for subsequent research. In this work, we trained both a CNN model and our proposed DDoS attack detection model under this federated learning algorithm to compare overall detection performance. These models are denoted as FedAvg + CNN and FedAvg + Ours, respectively.

4.3. Comparative Experiments

4.3.1. Parameter Settings

The proposed model was implemented by PyTorch 2.1.1 on a server equipped with an Intel(R) Xeon(R) Platinum 8352V, 2.10 GHz CPU, and Nvidia RTX 4080 GPU. The presented results are the mean of five runs for all models. The parameter settings for both the DDoS attack detection model and the federated learning framework in the FedDynST model were as follows:
  • APPNP layer:
    -
    Input dimension: 20;
    -
    Output dimension: 20;
    -
    Number of layers: 3;
    -
    α : 0.3;
    -
    Weight for the dynamic adjacency matrix ( η ): 0.3.
  • CNN layer:
    -
    Input channels: 20;
    -
    Output channels: 64;
    -
    Kernel size: 3.
  • Loss function:
    -
    Weight for the maximization of mutual information loss (unsupervised loss) ( μ ): 0.1.
  • Final classification layer:
    -
    Two fully connected layers for each node with a hidden layer size of 64;
    -
    Output dimension: 1;
    -
    Dropout rate: 0.5.
  • Federated learning: each round, half of the clients were randomly selected for aggregation (client selection ratio C = 0.5):
    -
    Local training epochs E = 5;
    -
    Communication rounds r = 20;
    -
    Batch size for the attack detection model: 100;
    -
    Learning rate: 0.005;
    -
    Number of epochs: 5;
    -
    Optimizer: Adam. The final trained model was the one that performed the best on the validation set.

4.3.2. Results

Based on the parameter settings outlined in the previous section, the model training was conducted and compared with the following five models: FLAD+CNN, FLAD+MLP, FLAD+Ours, FedDDoS, and FedAvg+CNN. The experimental results on the CICDDoS2019 dataset and the Edge-IIoTset dataset are as follows:
(1)
Results on CICDDoS2019 Dataset
Table 3 indicates the comparative experimental results of the detection accuracy across the test sets of the 13 clients. Table 4 presents the average values of various metrics across the test sets of the 13 clients. Table 5 provides the comparison results of various metrics on the global test set.
From the experimental results, it can be seen that on the CICDDoS2019 dataset, the FedDynST model generally outperformed the other models in terms of accuracy, precision, recall, F1-score, and AUC. Specifically, as shown in Table 1, the detection accuracy of the FedDynST model on the 13 clients was consistently higher than that of other models, where the detection accuracy of each client exceeded 0.96, indicating strong adaptability and high stability of the FedDynST model. According to Table 2, the average values of each metric across the 13 clients for the FedDynST model were also superior to those of the other models. Compared with the novel FLAD + CNN model, the FedDynST model represented an improvement of 2.57% in accuracy, 0.77% in precision, 1.59% in recall, 1.18% in F1-score, and 2.79% in AUC. This indicates that the FedDynST model could identify attack traffic with a higher accuracy in DDoS attack detection tasks. According to the experimental results on the global test set shown in Table 3, the FedDynST model also led the other models in all metrics, reflecting the proposed model’s ability to adapt to different data from various clients, demonstrating good robustness and effective performance across diverse scenarios.
(2)
Results on Edge-IIoTset Dataset
For the Edge-IIoTset dataset, the detection performance of the global model was tested on the test sets of four clients and the global test set using the same metrics. The specific comparative experimental results are shown in Table 6, Table 7 and Table 8.
The experimental results indicate that the proposed FedDynST model outperformed the other models in all metrics, both on the test sets of the four clients and the global test set. Compared with the CICDDoS2019 dataset, the Edge-IIoTset dataset is more suitable for intrusion detection research based on ensemble learning and federated learning. This dataset includes industrial traffic data based on the Modbus/TCP protocol, providing more realistic test scenarios for model training that align with actual ICSs. Therefore, this validates the FedDynST model’s detection capability and application potential in more realistic environments.

4.3.3. Analysis

Overall, the FedDynST model demonstrated superior detection capabilities across both client test sets and the global test set. Models relying solely on a CNN for mining traffic data features struggle to effectively learn traffic patterns. As a result, such a model shows diminished capability in distinguishing normal traffic from attacks during classification tasks. The enhanced detection capabilities of the proposed FedDynST model can be attributed to its improvements in feature representation in several key aspects.
First, the model employs graph neural networks to capture multi-scale temporal dependencies between traffic features, thereby improving the feature representation. Furthermore, it employs one-dimensional 1D-CNN to extract the temporal features of traffic, thereby enriching the feature representation from multiple dimensions and perspectives. This multidimensional feature extraction boosts the model’s ability to identify DDoS attacks.
Second, compared with the average global model update methods used in the FLAD and FedAvg federated learning frameworks, the FedDynST model employs a dynamic weight-based federated learning global model parameter update method. This method optimizes weight allocation by considering the divergence between local and global models and the training loss of clients. This targeted updating ensures a better global model quality and convergence speed.
To further explore the correlation between certain features in industrial control traffic data, one can quantify the relationships between these features by calculating mutual information. Using the Edge-IIoTset dataset as an example, Figure 6 displays a heatmap of the mutual information calculated for selected features from the dataset samples. The color brightness in the heatmap indicates the magnitude of mutual information: brighter colors (closer to yellow) represent higher mutual information values, while darker colors (closer to purple) represent lower values. This demonstrates that there was indeed some correlation between the features of the traffic data.
Particularly, Modbus/TCP protocol features unique to industrial control traffic, such as ModbusADU_len, ModbusADU_transId, and ModbusADU_protoId, showed a high correlation with other features. For instance, the bright area between TCP_window_size (TCP sliding window) and ModbusADU_len (Modbus Application Data Unit length) suggests a strong correlation between these two features. Generally, when ModbusADU_len was larger, this correlation implies that each Modbus/TCP protocol packet contained more data, necessitating a larger TCP window to improve the transmission efficiency. Therefore, the high correlation between these feature fields was reasonable.
The results confirm that the dynamic and static adjacency matrix traffic feature mining method proposed in this manuscript is highly suitable for industrial control scenarios. This is also a primary reason why the FedDynST model outperformed the other models in comparative experiments.

4.4. Ablation Study

The primary innovation of the proposed FedDynST model lies in its integration of static and dynamic adjacency matrices to extract the relationships between traffic data features across different time scales, alongside the design of a dynamic weight-based federated learning parameter update method. These elements collectively ensure the detection performance of the final trained global model. To further explore the model’s rationale, this section examines the effectiveness of each component of the model, validating their contributions to DDoS attack detection, as follows:
  • FedDynST model: This model uses both static and dynamic adjacency matrices to extract relationships between traffic features across different time scales. It also employs an unsupervised mutual information maximization loss to maximize the correlation between the outputs of graph convolutions using the two types of adjacency matrices. Additionally, it improves upon the traditional FedAvg federated averaging algorithm by designing a dynamic weight-based federated learning parameter update method.
  • FedDynST-APP model: this variant removes the graph convolution layer, retaining only the 1D-CNN layer, to investigate the impact of using static and dynamic adjacency matrices for extracting relationships between traffic features on the model.
  • FedDynST-Loss model: this variant removes the unsupervised loss function, aiming to explore the impact of the correlation between the outputs of graph convolutions using different adjacency matrices on the model.
Based on these ablation experiment model variants, this section compares the performance metrics of the different model variants on the CICDDoS2019 and Edge-IIoTset datasets, using both the client test sets and the global test set. The specific results are shown in Table 9, Table 10, Table 11 and Table 12.
The results indicate that the FedDynST model outperformed the other model variants across both datasets, demonstrating the effectiveness of the methods designed within the model. First, the FedDynST model significantly outperformed the FedDynST-APP model, which removed the graph convolution layer, across all the test sets. This highlights the importance of capturing relationships between traffic features for model detection performance. Second, the FedDynST model also surpassed the FedDynST-Loss model, which omitted the unsupervised loss function, indicating that ensuring a certain degree of correlation between traffic feature relationships extracted across different time scales is crucial for maintaining the detection performance. Finally, the FedDynST-Fed model, which replaced the dynamic weight-based federated learning algorithm with the FedAvg federated averaging algorithm, showed a significantly inferior performance compared with the FedDynST model. This confirmed that the dynamic weight-based federated learning algorithm designed in this work effectively enhanced the performance of the final trained global model.

4.5. Parameter Study

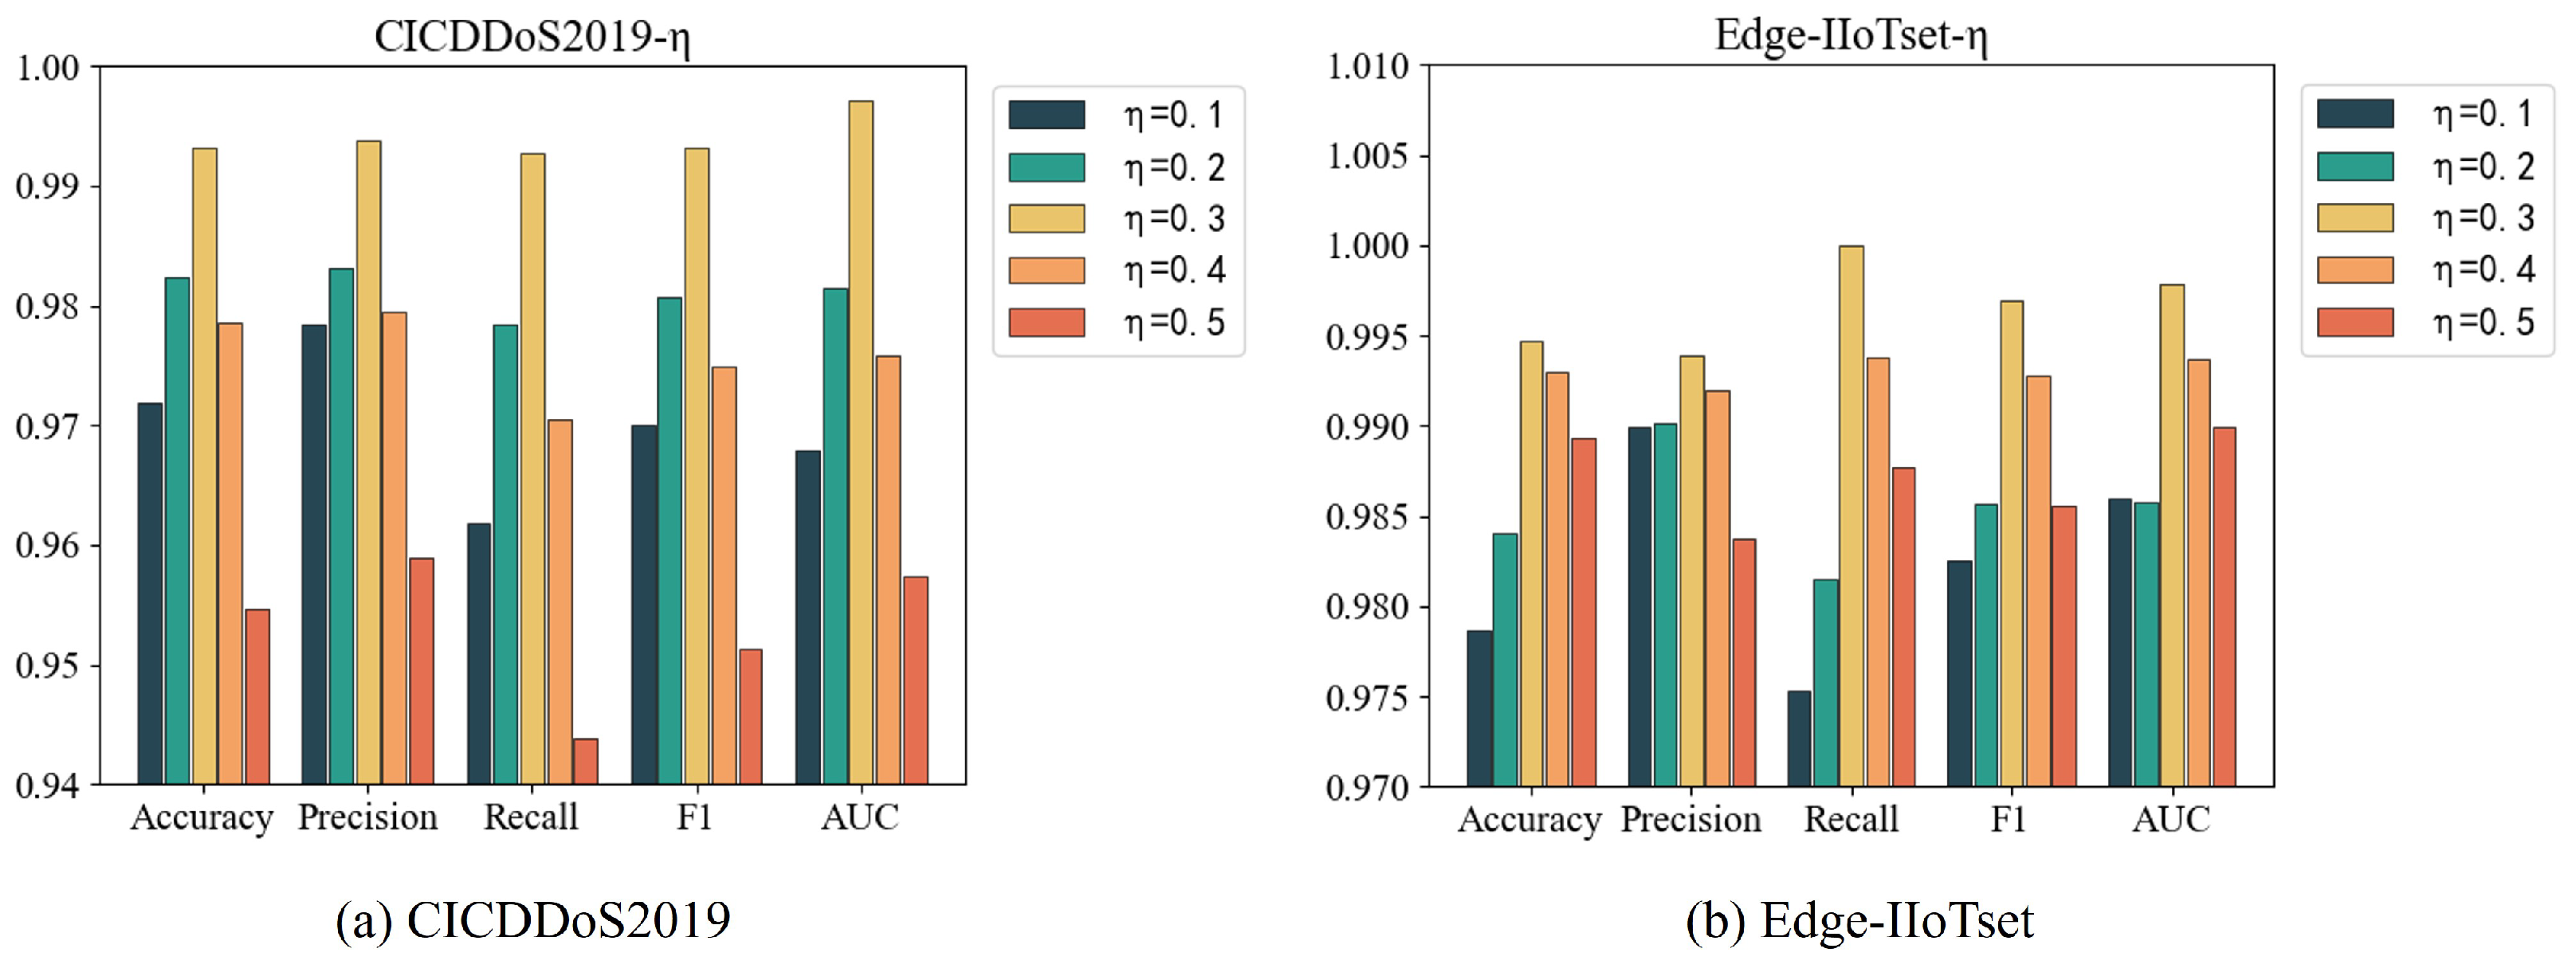
4.5.1. The Weight Proportion of the Dynamic Adjacency Matrix

In the FedDynST model, the output weight parameters of the static adjacency matrix and the dynamic adjacency matrix through the APPNP graph convolution layer are set to 1 η and η , respectively. To explore the impact of η on the model performance, this section tests presents the results of testing the FedDynST model on the CICDDoS2019 and Edge-IIoTset datasets, with η set to 0.1, 0.2, 0.3, 0.4, and 0.5 while keeping the other parameters unchanged. The experimental results are illustrated in Figure 7.
The experimental results indicate that on both the CICDDoS2019 and Edge-IIoTset datasets, the model’s performance initially improved and then declined as η increased, where it reached its optimal performance around η = 0.3 . On the CICDDoS2019 dataset, the model achieved its second-best performance at η = 0.2 , while on the Edge-IIoTset dataset, the second-best performance occurred at η = 0.4 . The model achieved an optimal performance when η was within a reasonable range; excessively high or low values of η adversely affected the performance. When η was too low, the information captured by the dynamic adjacency matrix on short time scales contributed minimally to the overall feature representation, which was detrimental to subsequent classification tasks. Conversely, when η was too high, the feature representation of the traffic included too much information about changes in traffic feature relationships, making the model overly sensitive to variations in the traffic features and leading to false alarms, thereby degrading the performance. Overall, the proportion of the dynamic adjacency matrix’s output weight should not exceed that of the static adjacency matrix, aligning with general understanding.

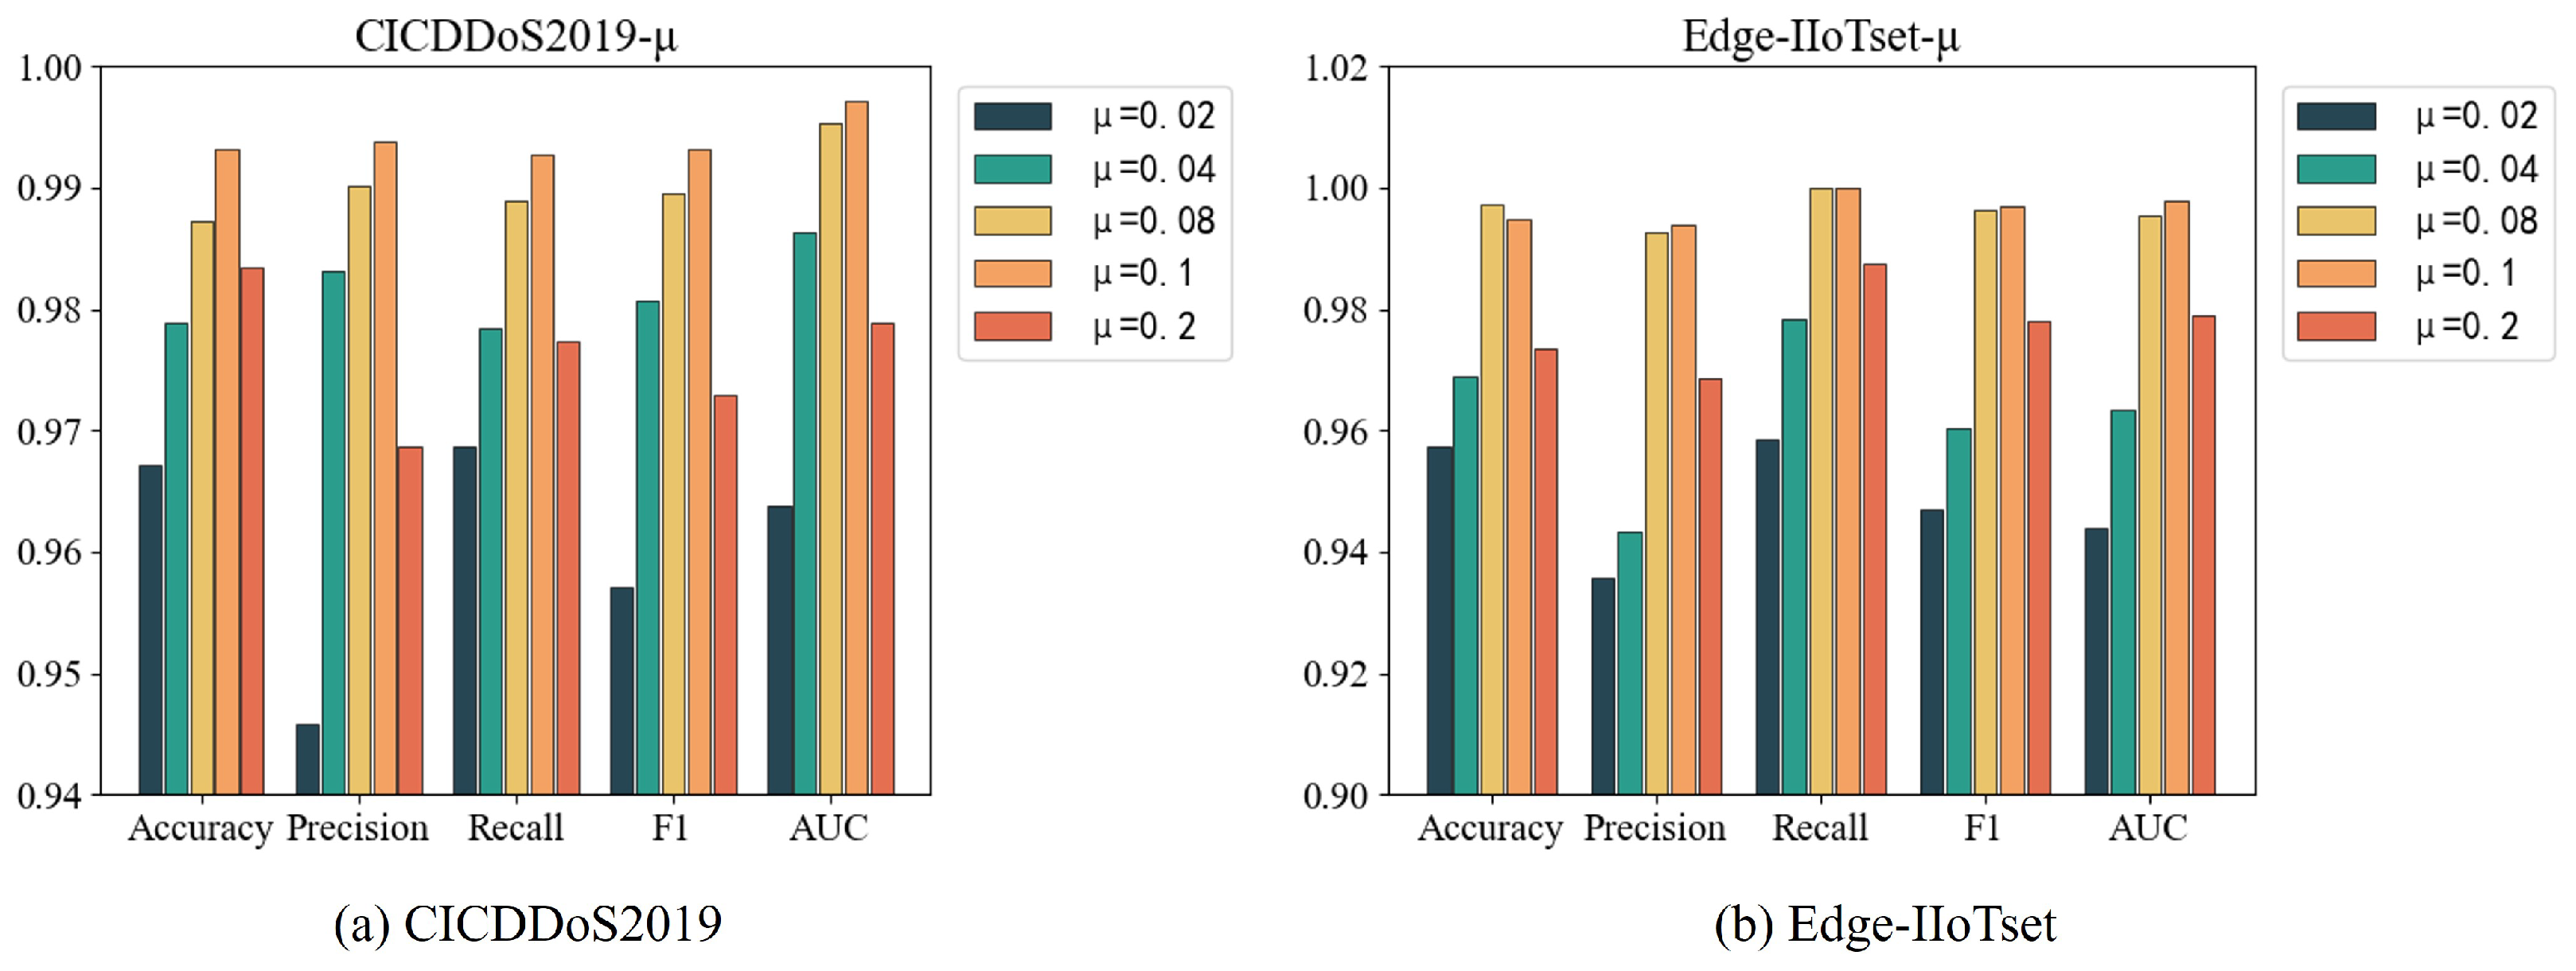
4.5.2. The Weight of Unsupervised Loss

In the FedDynST model, the total loss function is a weighted sum of the supervised cross-entropy loss for the classification task and the unsupervised maximum mutual information loss, with the unsupervised loss weighted by μ . To explore the impact of the parameter μ on model performance, this section presents the results of a controlled variable analysis with μ set to 0.02, 0.04, 0.08, 0.1, and 0.2 on the CICDDoS2019 and Edge-IIoTset datasets. The experimental results are shown in Figure 8.
The results indicate that, similar to the parameter η , the model’s performance on both datasets initially improved and then declines as μ increased, reaching its optimal performance around μ = 0.1 . When μ was less than 0.1, the model performance dropped significantly, indicating that the influence of the unsupervised loss in the total loss function was insufficient. This suggests that the model did not effectively leverage the relationships between traffic data features to enhance detection performance. Conversely, when μ exceeded 0.1, the model performance also declined, suggesting that the model’s final classification task still needed to be primarily guided by the supervised loss. As μ continued to increase, the model overly focused on the intrinsic structure of the traffic data while neglecting the actual goal of the classification task, leading to a decrease in the performance.

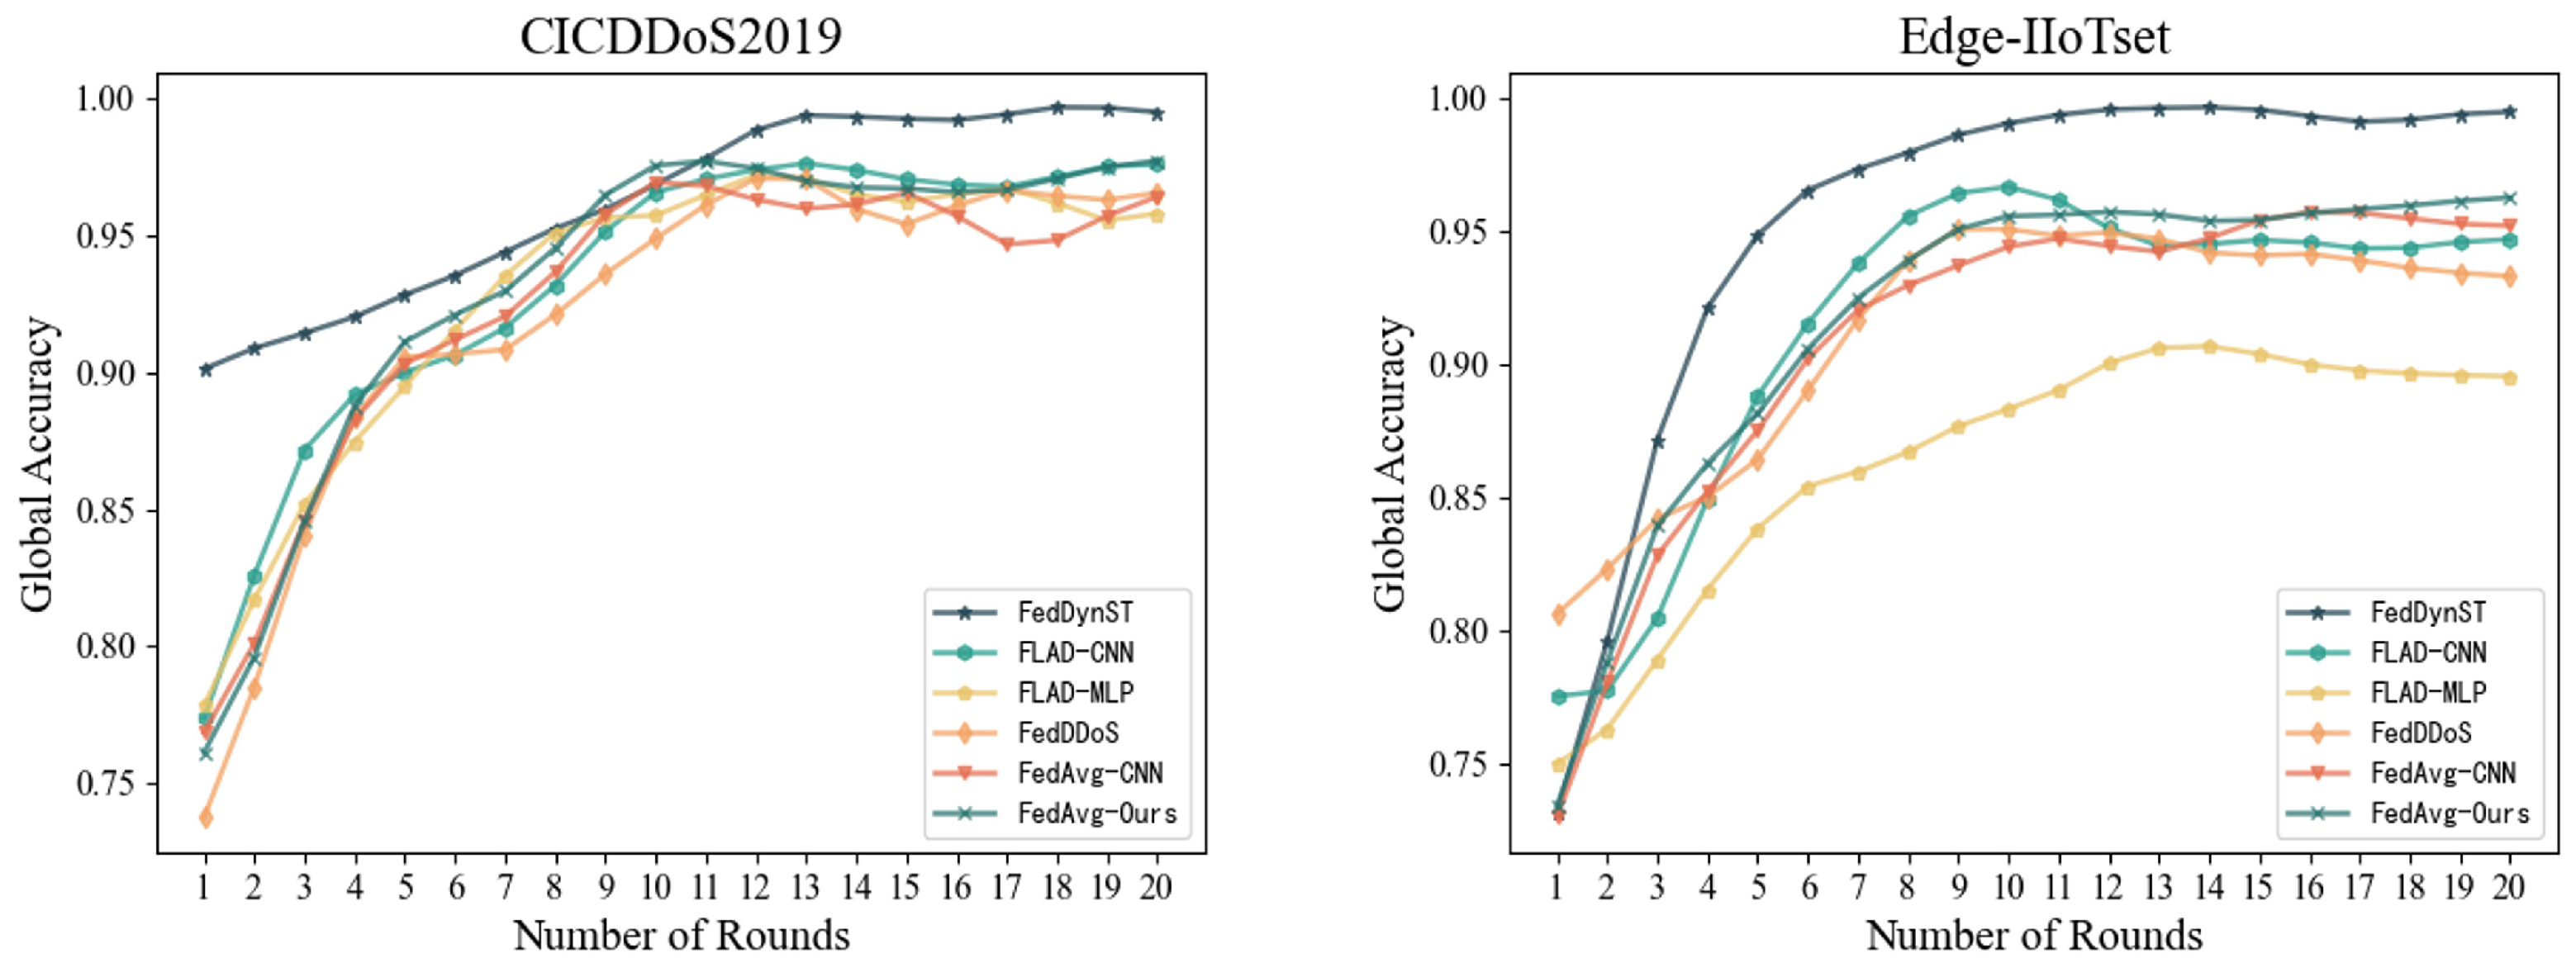
4.6. Convergence Study

To assess the complexity and feasibility of the FedDynST model, we compared its convergence with previously discussed models. After 20 rounds of federated learning training, we calculated the average metrics for each communication round and the total time taken for the training, as shown in Table 13 and Table 14.
According to the experimental results, the FedDynST model demonstrated a superior performance in terms of the average accuracy, precision, recall, F1-score, and AUC compared with the other five models while maintaining similar training times. Specifically, as illustrated in Figure 9, which show the convergence plots of accuracy for different datasets, the FedDynST model experienced a rapid increase in accuracy during the initial rounds of federated learning training and stabilized quickly. In contrast, the other models converged more slowly, and their average metrics after stabilization remained lower than those of the FedDynST model. This indicates that the FedDynST model could achieve high performance metrics in a relatively short amount of time when dealing with different data from various clients, demonstrating excellent convergence properties.
Moreover, the training times for 20 rounds of federated learning for the FLAD + Ours and FedAvg + Ours models on both datasets were higher than for the FedDynST model. This suggests that the federated learning algorithm based on dynamic weight Q, as designed in this study, offered superior convergence speed. Overall, the convergence performance of the FedDynST model surpassed that of the comparison models, particularly in terms of the convergence speed and final performance metrics, indicating the high practicality of the FedDynST model in industrial control system scenarios.

5. Conclusions

This paper proposes FedDyST, a DDoS attack detection model based on federated learning and dynamic spatiotemporal networks, which was specifically designed for ICSs within cloud–edge environments. Within the framework of federated learning, we innovatively combined static and dynamic adjacency matrices to learn the relationships between traffic data features across various temporal scales. This approach significantly enhanced the performance of the DDoS attack detection model. Our experimental analysis, conducted on both the CICDDoS2019 and Edge-IIoTset datasets, demonstrated the superior detection performance of our proposed model when compared with various federated learning-based DDoS detection algorithms.
Future work will focus on further investigating the engineering implementation of DDoS attack detection in cloud–edge collaborative industrial control scenarios. This aims to enhance the identification capabilities of DDoS attack traffic across different industrial contexts and facilitate the implementation of more targeted defense strategies.

Author Contributions

Methodology, B.L.; Software, D.G.; Validation, D.G.; Formal analysis, D.Z. and X.H.; Investigation, Z.C.; Resources, J.C.; Data curation, Z.C.; Writing—original draft, Z.C.; Writing—review & editing, B.L., D.Z. and X.H. All authors have read and agreed to the published version of this manuscript.

Funding

This work was supported by National Key R&D Progam of China under grant no. 2022YFB3104300 and the Jiangsu Provincial Natural Science Foundation of China under grant BK20240292.

Data Availability Statement

Data are contained within the article.

Conflicts of Interest

The authors declare no conflicts of interest.

References

  1. Fan, X.; Fan, K.; Wang, Y.; Zhou, R. Overview of cyber-security of industrial control system. In Proceedings of the 2015 International Conference on Cyber Security of Smart Cities, Industrial Control System and Communications (SSIC), Shanghai, China, 5–7 August 2015; IEEE: Piscataway, NJ, USA, 2015; pp. 1–7. [Google Scholar]
  2. Zhao, L.; Li, B.; Yuan, H. Cloud Edge Integrated Security Architecture of New Cloud Manufacturing System. J. Syst. Eng. Electron. 2024, 35, 1177–1189. [Google Scholar] [CrossRef]
  3. Cao, K.; Hu, S.; Shi, Y.; Colombo, A.W.; Karnouskos, S.; Li, X. A survey on edge and edge-cloud computing assisted cyber-physical systems. IEEE Trans. Ind. Inform. 2021, 17, 7806–7819. [Google Scholar] [CrossRef]
  4. McLaughlin, S.; Konstantinou, C.; Wang, X.; Davi, L.; Sadeghi, A.R.; Maniatakos, M.; Karri, R. The cybersecurity landscape in industrial control systems. Proc. IEEE 2016, 104, 1039–1057. [Google Scholar] [CrossRef]
  5. Aslam, M.M.; Tufail, A.; Apong, R.A.A.H.M.; De Silva, L.C.; Raza, M.T. Scrutinizing security in industrial control systems: An architectural vulnerabilities and communication network perspective. IEEE Access 2024, 12, 67537–67573. [Google Scholar] [CrossRef]
  6. Kaur, A.; Krishna, C.R.; Patil, N.V. A comprehensive review on Software-Defined Networking (SDN) and DDoS attacks: Ecosystem, taxonomy, traffic engineering, challenges and research directions. Comput. Sci. Rev. 2025, 55, 100692. [Google Scholar] [CrossRef]
  7. Aljohani, T.; Almutairi, A. Modeling time-varying wide-scale distributed denial of service attacks on electric vehicle charging Stations. Ain Shams Eng. J. 2024, 15, 102860. [Google Scholar] [CrossRef]
  8. Somani, G.; Gaur, M.S.; Sanghi, D.; Conti, M.; Buyya, R. DDoS attacks in cloud computing: Issues, taxonomy, and future directions. Comput. Commun. 2017, 107, 30–48. [Google Scholar] [CrossRef]
  9. Kumar, S.; Dwivedi, M.; Kumar, M.; Gill, S.S. A comprehensive review of vulnerabilities and AI-enabled defense against DDoS attacks for securing cloud services. Comput. Sci. Rev. 2024, 53, 100661. [Google Scholar] [CrossRef]
  10. Senarak, C. Port cyberattacks from 2011 to 2023: A literature review and discussion of selected cases. Marit. Econ. Logist. 2024, 26, 105–130. [Google Scholar] [CrossRef]
  11. Slowik, J. Evolution of ICS Attacks and the Prospects for Future Disruptive Events; Threat Intelligence Centre Dragos Inc.: Hanover, MD, USA, 2019. [Google Scholar]
  12. Stouffer, K.; Falco, J.; Scarfone, K. Guide to industrial control systems (ICS) security. NIST Spec. Publ. 2011, 800, 16. [Google Scholar]
  13. Lin, C.T.; Wu, S.L.; Lee, M.L. Cyber attack and defense on industry control systems. In Proceedings of the 2017 IEEE Conference on Dependable and Secure Computing, Taipei, Taiwan, 7–10 August 2017; IEEE: Piscataway, NJ, USA, 2017; pp. 524–526. [Google Scholar]
  14. Praseed, A.; Thilagam, P.S. HTTP request pattern based signatures for early application layer DDoS detection: A firewall agnostic approach. J. Inf. Secur. Appl. 2022, 65, 103090. [Google Scholar] [CrossRef]
  15. Alhaidari, F.A.; Al-Dahasi, E.M. New approach to determine DDoS attack patterns on SCADA system using machine learning. In Proceedings of the 2019 International Conference on Computer and Information Sciences (ICCIS), Sakaka, Saudi Arabia, 3–4 April 2019; IEEE: Piscataway, NJ, USA, 2019; pp. 1–6. [Google Scholar]
  16. Koay, A.M.; Ko, R.K.L.; Hettema, H.; Radke, K. Machine learning in industrial control system (ICS) security: Current landscape, opportunities and challenges. J. Intell. Inf. Syst. 2023, 60, 377–405. [Google Scholar] [CrossRef]
  17. Li, B.; Wu, Y.; Song, J.; Lu, R.; Li, T.; Zhao, L. DeepFed: Federated deep learning for intrusion detection in industrial cyber–physical systems. IEEE Trans. Ind. Inform. 2020, 17, 5615–5624. [Google Scholar] [CrossRef]
  18. Mittal, M.; Kumar, K.; Behal, S. Deep learning approaches for detecting DDoS attacks: A systematic review. Soft Comput. 2023, 27, 13039–13075. [Google Scholar] [CrossRef] [PubMed]
  19. Cai, J.; Wei, Z.; Luo, J. ICS anomaly detection based on sensor patterns and actuator rules in spatiotemporal dependency. IEEE Trans. Ind. Inform. 2024, 20, 10647–10656. [Google Scholar] [CrossRef]
  20. Wang, Y.; Fang, L.; Hu, B.; Ge, G.; Zhou, X.; Zhang, W. Overview of Research on Cloud-Edge-End Collaboration Technology of Industrial Control System. In Proceedings of the 2023 International Conference on Electronics, Computers and Communication Technology, Guilin China, 17–19 November 2023; IEEE: Piscataway, NJ, USA, 2023; pp. 169–174. [Google Scholar]
  21. Huong, T.T.; Bac, T.P.; Long, D.M.; Luong, T.D.; Dan, N.M.; Quang, L.A.; Cong, L.T.; Thang, B.D.; Tran, K.P. Detecting cyberattacks using anomaly detection in industrial control systems: A federated learning approach. Comput. Ind. 2021, 132, 103509. [Google Scholar] [CrossRef]
  22. Haider, S.; Akhunzada, A.; Mustafa, I.; Patel, T.B.; Fernandez, A.; Choo, K.K.R.; Iqbal, J. A deep CNN ensemble framework for efficient DDoS attack detection in software defined networks. IEEE Access 2020, 8, 53972–53983. [Google Scholar] [CrossRef]
  23. Kim, J.; Kim, J.; Kim, H.; Shim, M.; Choi, E. CNN-based network intrusion detection against denial-of-service attacks. Electronics 2020, 9, 916. [Google Scholar] [CrossRef]
  24. Ortega-Fernandez, I.; Sestelo, M.; Burguillo, J.C.; Piñón-Blanco, C. Network intrusion detection system for DDoS attacks in ICS using deep autoencoders. Wirel. Netw. 2024, 30, 5059–5075. [Google Scholar] [CrossRef]
  25. Dev, A.; Lal, A.; Yadav, N.; Kumar, M. Enhancing Intrusion Detection Systems through Federated Learning and Gated Recurrent Units. In Proceedings of the 2024 IEEE Conference on Engineering Informatics (ICEI), Melbourne, Australia, 20–28 November 2024; IEEE: Piscataway, NJ, USA, 2024; pp. 1–8. [Google Scholar]
  26. Shen, C.; Xiao, G.; Yao, S.; Zhou, B.; Pan, Z.; Zhang, H. An LSTM based malicious traffic attack detection in industrial internet. In Proceedings of the 2021 International Conference on Security, Pattern Analysis, and Cybernetics (SPAC), Chengdu, China, 18–20 June 2021; IEEE: Piscataway, NJ, USA, 2021; pp. 60–65. [Google Scholar]
  27. Yazdinejad, A.; Kazemi, M.; Parizi, R.M.; Dehghantanha, A.; Karimipour, H. An ensemble deep learning model for cyber threat hunting in industrial internet of things. Digit. Commun. Netw. 2023, 9, 101–110. [Google Scholar] [CrossRef]
  28. Zainudin, A.; Ahakonye, L.A.C.; Akter, R.; Kim, D.S.; Lee, J.M. An efficient hybrid-dnn for ddos detection and classification in software-defined iiot networks. IEEE Internet Things J. 2022, 10, 8491–8504. [Google Scholar] [CrossRef]
  29. Diaba, S.Y.; Elmusrati, M. Proposed algorithm for smart grid DDoS detection based on deep learning. Neural Netw. 2023, 159, 175–184. [Google Scholar] [CrossRef] [PubMed]
  30. Söğüt, E.; Erdem, O.A. A multi-model proposal for classification and detection of DDoS attacks on SCADA systems. Appl. Sci. 2023, 13, 5993. [Google Scholar] [CrossRef]
  31. Li, J.; Lyu, L.; Liu, X.; Zhang, X.; Lyu, X. FLEAM: A federated learning empowered architecture to mitigate DDoS in industrial IoT. IEEE Trans. Ind. Inform. 2021, 18, 4059–4068. [Google Scholar] [CrossRef]
  32. Zainudin, A.; Akter, R.; Kim, D.S.; Lee, J.M. FedDDoS: An efficient federated learning-based DDoS attacks classification in SDN-enabled IIoT networks. In Proceedings of the 2022 13th International Conference on Information and Communication Technology Convergence (ICTC), Jeju Island, Republic of Korea, 19–21 October 2022; IEEE: Piscataway, NJ, USA, 2022; pp. 1279–1283. [Google Scholar]
  33. Shao, J.M.; Zeng, G.Q.; Lu, K.D.; Geng, G.G.; Weng, J. Automated federated learning for intrusion detection of industrial control systems based on evolutionary neural architecture search. Comput. Secur. 2024, 143, 103910. [Google Scholar] [CrossRef]
  34. Bao, G.; Guo, P. Federated learning in cloud-edge collaborative architecture: Key technologies, applications and challenges. J. Cloud Comput. 2022, 11, 94. [Google Scholar]
  35. Gasteiger, J.; Bojchevski, A.; Günnemann, S. Predict then propagate: Graph neural networks meet personalized pagerank. arXiv 2018, arXiv:1810.05997. [Google Scholar]
  36. Belghazi, M.I.; Baratin, A.; Rajeswar, S.; Ozair, S.; Bengio, Y.; Courville, A.; Hjelm, R.D. Mine: Mutual information neural estimation. arXiv 2018, arXiv:1801.04062. [Google Scholar]
  37. Kiranyaz, S.; Avci, O.; Abdeljaber, O.; Ince, T.; Gabbouj, M.; Inman, D.J. 1D convolutional neural networks and applications: A survey. Mech. Syst. Signal Process. 2021, 151, 107398. [Google Scholar] [CrossRef]
  38. Sharafaldin, I.; Lashkari, A.H.; Hakak, S.; Ghorbani, A.A. Developing realistic distributed denial of service (DDoS) attack dataset and taxonomy. In Proceedings of the 2019 International Carnahan Conference on Security Technology (ICCST), Chennai, India, 1–3 October 2019; IEEE: Piscataway, NJ, USA, 2019; pp. 1–8. [Google Scholar]
  39. Ferrag, M.A.; Friha, O.; Hamouda, D.; Maglaras, L.; Janicke, H. Edge-IIoTset: A new comprehensive realistic cyber security dataset of IoT and IIoT applications for centralized and federated learning. IEEE Access 2022, 10, 40281–40306. [Google Scholar] [CrossRef]
  40. Doriguzzi-Corin, R.; Millar, S.; Scott-Hayward, S.; Martinez-del Rincon, J.; Siracusa, D. LUCID: A practical, lightweight deep learning solution for DDoS attack detection. IEEE Trans. Netw. Serv. Manag. 2020, 17, 876–889. [Google Scholar] [CrossRef]
  41. Doriguzzi-Corin, R.; Siracusa, D. FLAD: Adaptive federated learning for DDoS attack detection. Comput. Secur. 2024, 137, 103597. [Google Scholar] [CrossRef]
  42. McMahan, B.; Moore, E.; Ramage, D.; Hampson, S.; Arcas, B.A. Communication-efficient learning of deep networks from decentralized data. In Proceedings of the Artificial Intelligence and Statistics, Fort Lauderdale, FL, USA, 20–22 April 2017; PMLR: Birmingham, UK, 2017; pp. 1273–1282. [Google Scholar]
Figure 1. Architecture design of the FedDynST model, illustrating the DDoS attack detection model integrated with the federated learning framework.
Electronics 14 01843 g001
Figure 2. DDoS attack detection model architecture, comprising APPNP graph convolutional network, 1D convolutional network, pooling layer, and fully connected layer, with input from feature-extracted traffic data.
Electronics 14 01843 g002
Figure 3. Schematic of training set segmentation according to time window T.
Electronics 14 01843 g003
Figure 4. Schematic of 1D-CNN structure.
Electronics 14 01843 g004
Figure 5. Graphical representation of the traffic preprocessing algorithm that aggregates packets of bidirectional traffic into array-like sub-traffic samples based on a time window.
Electronics 14 01843 g005
Figure 6. Edge IIoTset dataset traffic feature mutual information heatmap.
Electronics 14 01843 g006
Figure 7. Sensitivity analysis of our model to η .
Electronics 14 01843 g007
Figure 8. Sensitivity analysis of our model to μ .
Electronics 14 01843 g008
Figure 9. Convergence study of accuracy on CICDDoS2019 and Edge-IIoTSet datasets.
Electronics 14 01843 g009
Table 1. Traffic division of DDoS attacks (CICDDoS2019).
ClientsTypes of Attack TrafficNumber of Attack Traffic SamplesNumber of Normal Traffic Samples
1DNS, MSSQL38243824
2LDAP, NETBIOS55225522
3MSSQL143,510143,510
4NETBIOS143,325143,325
5NTP, SSDP872872
6ALL Types47304730
7SNMP10,99810,998
8SSDP20,48120,481
9SYN18,03218,032
10TFTP33,26633,266
11UDP24,04424,044
12UDPFLAG, MSSQL, TFTP, UDP50655065
13WebDDoS, MSSQL, TFTP, UDP87058705
Table 2. Traffic division of DDoS attacks (Edge-IIoTset).
ClientsTypes of Attack TrafficNumber of Attack Traffic SamplesNumber of Normal Traffic Samples
1HTTP, ICMP, TCP, UDP27402740
2ICMP, TCP56975697
3TCP24992499
4UDP48964896
Table 3. Comparison results of client detection accuracy (CICDDoS2019).
ClientsFedDynST (Ours)FLAD + CNNFLAD + MLPFedDDoSFedAvg + CNNFedAvg + Ours
10.99890.98700.92860.93850.93770.9658
20.99371.00.92880.95840.93540.9841
30.99720.97570.96670.95840.95350.9756
40.99590.97580.95150.96350.96170.9836
50.99780.96110.97720.96580.95410.9684
60.99480.97420.93750.97370.96470.9785
71.00.97480.96830.94170.95410.9914
81.00.97200.94020.96140.95870.9781
90.99860.94550.89610.93560.93440.9654
100.99840.96770.96620.92580.95430.9874
111.00.94430.94710.93250.91480.9647
120.98030.95780.94120.94120.94580.9682
130.96290.94860.93430.94280.92150.9874
Table 4. Comparison results of client evaluation metrics (CICDDoS2019).
ModelAccuracyPrecisionRecallF1AUC
FedAvg + Ours0.97690.95470.96170.95820.9736
FedAvg + CNN0.94540.93890.95680.94780.9554
FedDDoS0.94920.94980.96020.95500.9675
FLAD + MLP0.94490.95380.96060.95720.9435
FLAD + CNN0.96800.97580.97380.97480.9678
FedDynST0.99370.98350.98970.98660.9957
Table 5. Comparison results of global evaluation metrics (CICDDoS2019).
ModelAccuracyPrecisionRecallF1AUC
FedAvg + Ours0.98740.96980.96540.96760.9745
FedAvg + CNN0.96870.97250.96350.96800.9674
FedDDoS0.96980.96540.96830.96680.9699
FLAD + MLP0.96670.98830.96490.97650.9687
FLAD + CNN0.97510.98350.97590.97970.9785
FedDynST0.99320.99380.99270.99320.9972
Table 6. Comparison results of client detection accuracy (Edge-IIoTset).
ClientsFedDynST (Ours)FLAD + CNNFLAD + MLPFedDDoSFedAvg + CNNFedAvg + Ours
10.99890.97250.98210.96280.98380.9738
20.95780.93280.80000.91250.97250.9417
30.95000.91480.77000.92430.91350.9384
40.97980.95940.82020.92480.94380.9489
Table 7. Comparison results of client evaluation metrics (Edge-IIoTset).
ModelAccuracyPrecisionRecallF1AUC
FedAvg + Ours0.95070.97850.93430.95590.9695
FedAvg + CNN0.95340.95870.93340.94590.9547
FedDDoS0.93110.94150.92100.93110.9458
FLAD + MLP0.84310.86040.78750.77870.8916
FLAD + CNN0.94490.92430.93740.93080.9818
FedDynST0.96940.99030.94890.96811.0
Table 8. Comparison results of global evaluation metrics (Edge-IIoTset).
ModelAccuracyPrecisionRecallF1AUC
FedAvg + Ours0.96780.96890.97520.97200.9614
FedAvg + CNN0.95180.94840.99180.97310.9718
FedDDoS0.93180.93580.98120.95800.9574
FLAD + MLP0.89530.85370.86420.85890.6104
FLAD + CNN0.94680.94181.00.97010.9608
FedDynST0.99470.99391.00.99690.9979
Table 9. Ablation results of client evaluation metrics (CICDDoS2019).
ModelAccuracyPrecisionRecallF1AUC
FedDynST-Loss0.97680.96380.97250.96810.9528
FedDynST-APP0.96020.95340.97200.96260.9625
FedDynST0.99370.98350.98970.98660.9957
Table 10. Ablation results of global evaluation metrics (CICDDoS2019).
ModelAccuracyPrecisionRecallF1AUC
FedDynST-Loss0.96850.95830.97890.96850.9832
FedDynST-APP0.98740.95890.96870.96480.9568
FedDynST0.99320.99380.99270.99320.9972
Table 11. Ablation results of client evaluation metrics (Edge-IIoTset).
ModelAccuracyPrecisionRecallF1AUC
FedDynST-Loss0.95880.96870.93260.95030.9778
FedDynST-APP0.94290.97140.92890.94970.9874
FedDynST0.96940.99030.94890.96811.0
Table 12. Ablation results of global evaluation metrics (Edge-IIoTset).
ModelAccuracyPrecisionRecallF1AUC
FedDynST-Loss0.97850.97120.98410.97760.9678
FedDynST-APP0.98340.97590.98780.98180.9752
FedDynST0.99470.99391.00.99690.9979
Table 13. Convergence study on the CICDDoS2019 dataset.
ModelAccuracyPrecisionRecallF1AUCTime (s)
FedAvg + Ours0.93780.93890.93380.93880.9409449.56
FedAvg + CNN0.92450.93740.94120.93930.9285420.27
FedDDoS0.92010.91180.92870.92020.8978445.82
FLAD + MLP0.92880.92170.93240.92700.9125388.87
FLAD + CNN0.93300.94140.94420.94280.9325415.34
FedDynST0.96280.97140.95410.96290.9518405.98
Table 14. Convergence study on the Edge-IIoTset dataset.
ModelAccuracyPrecisionRecallF1AUCTime (s)
FedAvg + Ours0.93650.95790.90110.92860.948725.21
FedAvg + CNN0.93240.96130.89740.92840.951218.93
FedDDoS0.92840.95840.87410.91780.941619.86
FLAD + MLP0.95870.96140.90140.93040.965741.89
FLAD + CNN0.94780.96360.89470.92790.958753.38
FedDynST0.97280.97140.91280.94120.976221.83
Disclaimer/Publisher’s Note: The statements, opinions and data contained in all publications are solely those of the individual author(s) and contributor(s) and not of MDPI and/or the editor(s). MDPI and/or the editor(s) disclaim responsibility for any injury to people or property resulting from any ideas, methods, instructions or products referred to in the content.

