Article

Evaluating the Performance of DenseNet in ECG Report Automation

1
Department of Anatomy, College of Osteopathic Medicine, New York Institute of Technology, Old Westbury, NY 11568, USA
2
Department of Osteopathic Manipulative Medicine, College of Osteopathic Medicine, New York Institute of Technology, Old Westbury, NY 11568, USA
*
Author to whom correspondence should be addressed.
Electronics 2025, 14(9), 1837; https://doi.org/10.3390/electronics14091837
Submission received: 15 March 2025 / Revised: 17 April 2025 / Accepted: 26 April 2025 / Published: 30 April 2025
(This article belongs to the Special Issue Digital Intelligence Technology and Applications)

Abstract

:
Ongoing advancements in machine learning show great promise for automating medical data interpretation, potentially saving valuable time in life-threatening situations. One such area is the analysis of electrocardiograms (ECGs). In this study, we investigate the effectiveness of using a DenseNet121 encoder with three decoder architectures: Gated Recurrent Unit (GRU), Long Short-Term Memory (LSTM), and a Transformer-based approach. We utilize these models to generate automated ECG reports from the publicly available PTB-XL dataset. Our results show that the DenseNet121 encoder paired with a GRU decoder yields higher performance than previously achieved. It achieves a METEOR (Metric for Evaluation of Translation with Explicit Ordering) score of 72.19%, outperforming the previous best result of 55.53% from a ResNet34-based model that used LSTM and Transformer components. We also discuss several important design choices, such as how to initialize decoders, how to use attention mechanisms, and how to apply data augmentation. These findings offer valuable insights into creating more robust and reliable deep learning tools for ECG interpretation.

1. Introduction

Electrocardiograms (ECGs) play a crucial role in diagnosing, triaging, and managing patients with cardiovascular conditions. However, the traditional process of ECG interpretation often relies on rule-based computerized systems with limited accuracy or requires manual review by specialists, which can be time-consuming and resource-intensive, especially in low-resource settings [1]. Recent advancements in machine learning (ML) have opened new possibilities for automating ECG analysis and report generation, potentially improving the efficiency and accessibility of cardiac care.
AI-based systems have shown promise in automating the diagnosis of various rhythm and conduction disorders from ECGs [2,3,4]. These systems can potentially overcome the limitations of conventional computerized interpretations by offering greater accuracy and flexibility. However, many existing ML models are constrained by their dependence on discretely defined labels and raw signal data, which may not be readily available in all clinical settings [1,2,5].
To address these challenges, researchers have begun developing more sophisticated ML models capable of generating comprehensive ECG reports directly from ECG images. One such approach is the vision encoder–decoder model, which combines image processing capabilities with natural language generation to produce detailed, expert-level diagnostic statements [1,2]. These models aim to replicate the visual assessment process used by expert clinicians through the analysis of ECG images in various formats and lead layouts to generate automated reports [1].
One such ML encoder is ResNet34, which is a 34-layer deep convolutional neural network architecture that was originally developed for image classification tasks and has demonstrated robust performance in various ECG classification applications across diverse healthcare settings and geographical locations [1,2]. By leveraging residual connections, ResNet34 effectively mitigates the vanishing gradient problem often encountered in deep neural networks, enabling efficient training on large-scale datasets without significant loss of accuracy. In ECG analysis, these skip connections also help the model capture subtle morphological changes in electrical waveforms, which are critical for distinguishing between normal cardiac rhythms and arrhythmias [2]. Moreover, the modular nature of ResNet34 allows for seamless integration with transfer learning approaches, further enhancing its adaptability to different ECG datasets and clinical conditions [1,6]. This combination of accuracy, efficiency, and adaptability not only holds the potential to transform traditional ECG interpretation but also presents a promising avenue for delivering high-quality cardiac care in resource-constrained environments.
Despite its strengths, ResNet also has some drawbacks. One of the primary issues with ResNet is the inefficiency in feature reuse. In ResNet, each layer receives input only from the previous layer via identity shortcuts, which means that intermediate features are not explicitly shared across the network. This can lead to redundancy in feature extraction, as deeper layers may unnecessarily relearn features that were already captured by earlier layers [7]. ResNet also tends to be less parameter-efficient compared to DenseNet. Since ResNet does not explicitly reuse features across layers, it often requires a larger number of parameters to achieve high performance [7]. Another limitation of ResNet lies in its reliance on identity shortcuts, which, while effective at mitigating the vanishing gradient problem, can constrain the network’s ability to learn complex representations. These shortcuts essentially preserve the input signal and bypass certain transformations, which may limit the diversity of features learned by the network [7]. DenseNet addresses this by concatenating feature maps instead of summing them (as in ResNet). This approach allows each layer to access a richer and more diverse set of features from all preceding layers, leading to better representation learning and improved performance in tasks requiring detailed feature extraction [8].
Despite these limitations, application of ResNet in ECG report generation has demonstrated remarkable results, with a METEOR score of 55.53%, which surpasses the previous best model score of 24.51% by Qiu et al. [2,9]. Qiu et al. utilized BERT (Bidirectional Encoder Representations from Transformers), a large language model (LLM). While ResNet has shown promise, the exploration of other advanced neural network architectures such as DenseNet for ECG report generation is yet to be seen. DenseNet is another ML encoder that overcomes this limitation by introducing dense connectivity, where each layer is connected to all preceding layers. This ensures that features learned at earlier stages are directly reused by subsequent layers, promoting efficient feature sharing and reducing redundancy [7,10]. Furthermore, DenseNet’s design reduces the number of parameters required by reusing features extensively, which not only improves computational efficiency but also reduces the risk of overfitting, especially important when working with smaller datasets [7,8].
From a design point of view, we hypothesize that DenseNet should outperform ResNet because the dense connectivity provides each subsequent layer with direct access to all preceding feature maps, allowing the network to reuse low-level ECG characteristics at progressively deeper levels. In ECG interpretation, subtle waveform details like minor deviations in the QRS complex or ST segment can be crucial for distinguishing specific heart conditions. When these early cues are passed forward through dense connections, later layers do not have to relearn the same features; they can focus on combining or refining them instead. This helps produce more accurate descriptions of each patient’s cardiac state, since DenseNet has a richer and more holistic view of all signal variations across the entire model depth.
Despite some of these advantages that DenseNet may provide due to its design, its usefulness is subject to changes in training parameters, the robustness of the dataset, and the task it is being evaluated for. For example, a recent study on the classification of diabetic retinopathy images found ResNet, compared to DenseNet, achieving significantly superior precision, recall, and F1-scores across all classes, indicating better overall performance in diabetic retinopathy classification tasks [11]. Another study found ResNet achieved a better area under the curve (AUC), surpassing DenseNet variants in chest radiograph classification [12]. These studies, among many others, highlighted ResNet’s ability to handle complex medical imaging in certain tasks better than DenseNet.
Due to this complex nature between better design practices for a task not always yielding better performance on actual data, we aim to fill this gap by examining the effectiveness of DenseNet in this specific task of ECG report generation. DenseNet has shown impressive results in various image classification tasks, and its unique architecture, which connects each layer to every other layer in a feed-forward fashion, may offer advantages in capturing complex ECG signal patterns [13].
To comprehensively evaluate DenseNet’s capabilities, we employ a variety of decoder architectures in our study. These include Gated Recurrent Units (GRUs), Long Short-Term Memory (LSTM) networks, and a Transformer-based approach. GRUs and LSTM are both variants of recurrent neural networks designed to handle long-term dependencies in sequential data, making them potentially well suited for processing ECG signals [14]. The Transformer-based approach, which has revolutionized natural language processing tasks, may also offer unique benefits in capturing global dependencies within ECG data.
By investigating these diverse decoder architectures in combination with DenseNet, we aim to provide a thorough comparison of DenseNet versus ResNet in their performance to generate ECG reports. This research not only explores the potential of DenseNet but also contributes to the broader understanding of how different neural network architectures can be optimized for medical signal processing and report generation tasks.

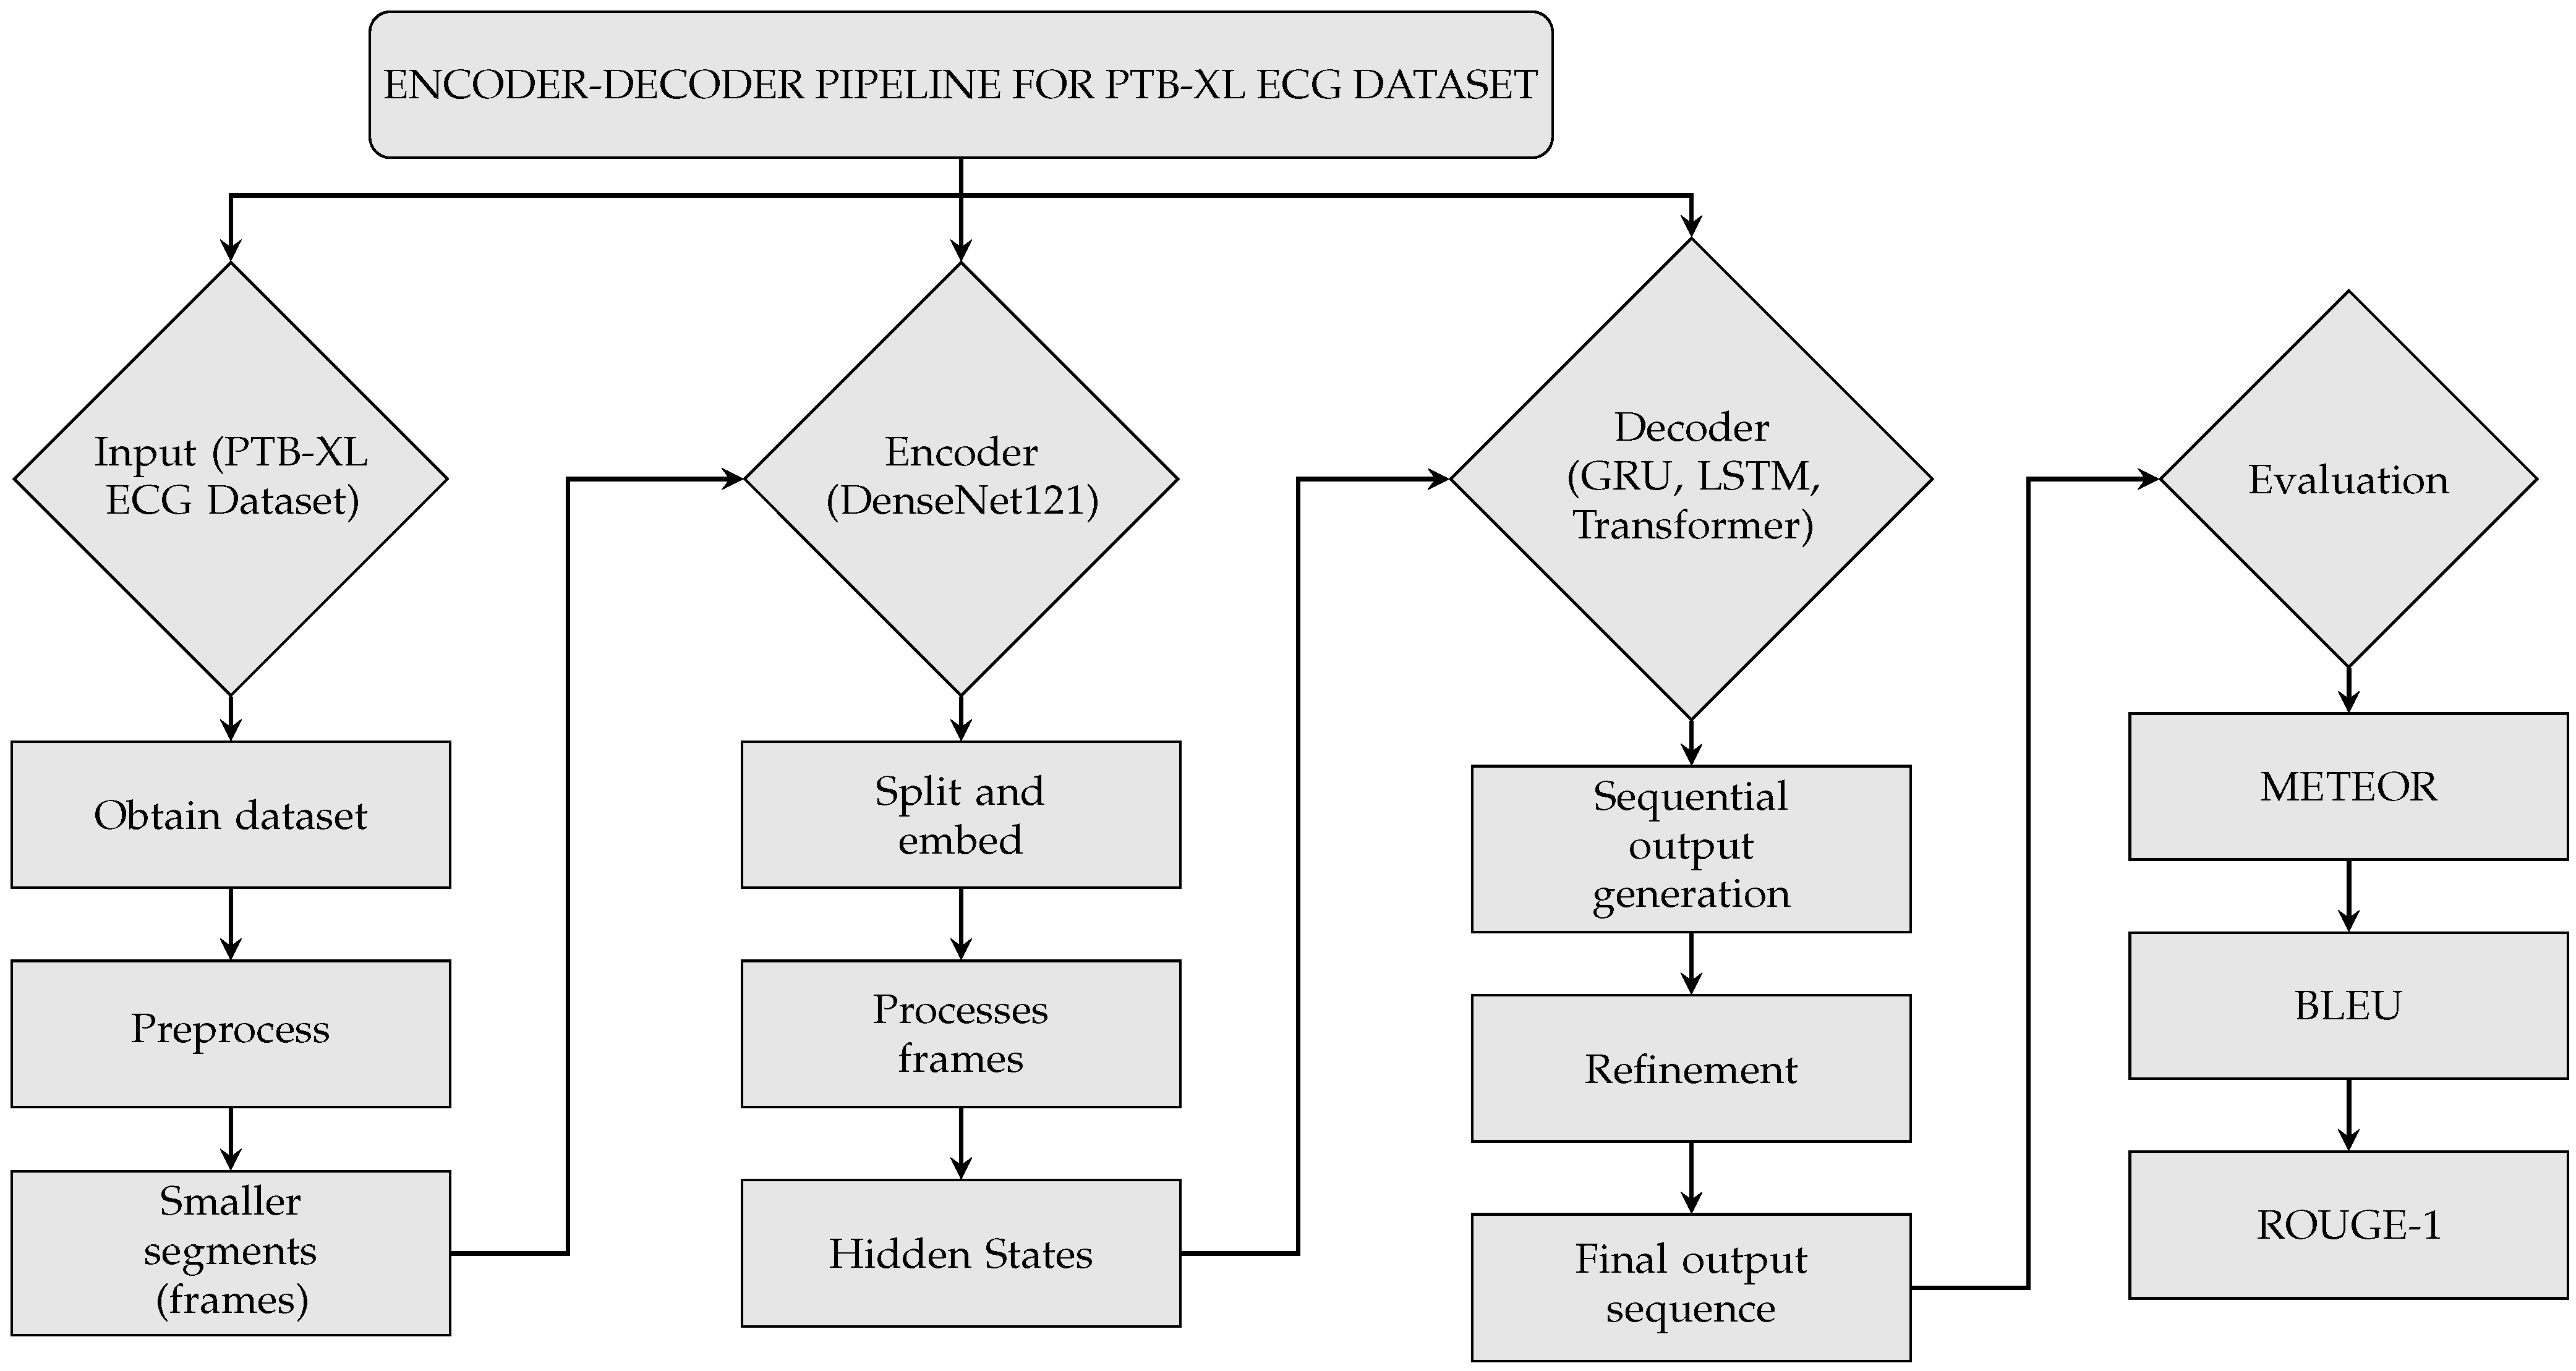
2. Materials and Methods

2.1. Data Preprocessing and Inputting

2.1.1. Dataset

To investigate the performance of DenseNet compared to ResNet, we used the same dataset that ResNet was evaluated on by Bleich et al. and that BERT was evaluated on by Qiu et al. [2,9]. The PTB-XL dataset is a large-scale electrocardiography (ECG) dataset that has become increasingly popular for tasks involving ML training on ECG datasets. Released as part of the PhysioNet archives, it provides comprehensive, high-quality ECG recordings, along with essential metadata and detailed labels for an extensive set of cardiac conditions. It includes over 21,000 clinical 12-lead ECG records, spanning a broad range of patient demographics and cardiac conditions [15]. Previous studies have highlighted how larger, more varied datasets like PTB-XL help reduce the risk of overfitting and promote better performance in real-world diagnostic tasks [16].

2.1.2. Preprocessing

Preprocessing was performed according to the official split instructions provided by the authors of the PTB-XL dataset. In the PTB-XL dataset, each ECG record is typically sampled at 500 Hz and downsampled to 100 Hz for computational efficiency and noise reduction. According to the official preprocessing for the PTB-XL dataset pipeline described by Wagner et al., each ECG is stored in a matrix based on the number of time steps (1000 for 100 Hz), and 12 represents the standard 12 leads of an ECG. After initial filtering, artifact removal, and resampling, the signals are assigned to training, validation, and test sets using metadata provided by Wegner et al. that ensure properly stratified splits across different cardiac conditions. This makes sure that no overlap happens among the training, validation, and test subsets [15]. Furthermore, it allows us to keep the dataset consistent between our prior study on ResNet and our current study on DenseNet. For our study, we took the raw 12-lead, 10-s ECG recordings and partitioned them into smaller segments called frames. We opted for 2.5 s for each frame as this provided the best results in a previous study [11].
The rationale behind segmenting ECG signals into frames is that ECG data are multichannel time series. Each ECG recording consists of sequential data points across multiple leads, forming a matrix representation. For instance, at a sampling rate of 100 Hz, each lead contains 1000 data points over the 10-s duration. By dividing the ECG recordings into shorter frames, the encoder or machine learning model can process these multichannel waveforms sequentially, effectively capturing temporal dependencies and subtle morphological features.
This segmentation approach is particularly beneficial because it allows models to isolate and emphasize critical ECG waveform characteristics, such as the QRS complex, P-wave, and T-wave. These features, which are essential for accurate diagnosis and classification, might otherwise be obscured or diluted when analyzing the entire signal in a single pass. Additionally, segmenting the ECG signals into frames significantly reduces the computational complexity associated with processing large, continuous time-series data, making the analysis more efficient and manageable.
While wavelet transformations or other frequency-domain methods can be applied to ECG data in general, the standard practice we found with PTB-XL specifically involves using the raw ECG signals [12,17,18]. This approach leverages the temporal and morphological characteristics inherent in the raw ECG waveforms, enabling models to effectively capture subtle diagnostic features directly from the original data.
Furthermore, we used tokenization and abbreviation Replacement to further process the provided annotated text. We used tokenization to help convert long strings of text into more uniform pieces that the network can learn from. By removing punctuation and spacing inconsistencies, the resulting token lists become more consistent, improving how well the model can recognize and associate certain medical terms with specific ECG patterns. This step is especially valuable given the frequent use of technical abbreviations and jargon in clinical documentation, which can otherwise impede automated processing.
Another advantage of breaking down text in this manner is the ability to unify medical shorthand. Instead of encountering a variety of acronyms and abbreviations for the same condition, each of these shorter forms is mapped to a standardized full phrase, as seen in Table 1. In this way, repeated references to the same underlying condition become consistent, preventing the model from misinterpreting variations in language.

2.1.3. Noise Reduction

The PTB-XL dataset in its raw form includes detailed signal quality annotations including “baseline drift”, “burst noise”, “static noise”, and “electrodes problems” [15]. These annotations were meticulously provided by an expert with extensive technical knowledge in ECGs who reviewed the entire dataset. Among these characteristics, static noise affects 14.94% and burst noise impacts 2.81% of the dataset. While static noise is characterized by a consistent, persistent interference that manifests as flat lines, sudden spikes, or a crackling pattern superimposed on the ECG signal, burst noise refers to sudden, short-lived spikes of interference that occur intermittently within the ECG signal. Additionally, baseline drift, which refers to slow, global variations in the ECG signal baseline, was annotated in 7.36% of the recordings. In our study, datapoints with this annotation were also excluded to maintain the integrity of the training data. Overall, 77.01% of the original dataset was classified as highest quality, meaning the images had no annotations related to noise, baseline drift, or electrode issues. The ML models were trained and evaluated on these datapoints only.

2.1.4. Training, Validation, and Testing

To address the issue of overlapping data in the training, validation, and testing sets, we use stricter splitting methods; we apply the official PTB-XL splits, which ensure that each patient’s data appear in only one set. This approach helps prevent data leakage and strengthens our evaluation. We also remove any duplicate ECG waveforms in the updated dataset versions, further reducing the risk of hidden overlap. Particularly, we used PTB-XL version 1.0.3, in which the curators of the dataset eliminated 36 duplicates and refined consensus labels [15]. Importantly, while some patients have multiple ECG recordings, these are retained as they reflect legitimate clinical follow-ups rather than problematic overlaps.
For our PTB-XL experiments, we apply a random split, which assigns 80% of the data to training and 10% each to validation and testing. This procedure keeps data from the same patient in a single partition, maintaining dataset integrity and improving overall reliability.

2.2. DenseNet Encoder

DenseNet architectures were originally created for 2D image analysis, specifically to handle tasks like object recognition and segmentation [10]. Despite being popularized for 2D images, the DenseNet approach can be adapted for different input dimensionalities, including one-dimensional signals such as ECG data. By replacing 2D convolutions and pooling operations with 1D equivalents we transform DenseNet into what is often termed DenseNet1D. This adaptation allows the model to effectively learn patterns in time-series inputs, where data typically unfold along only one axis (time). Leveraging 1D convolutional networks can be highly advantageous for ECG classification and diagnosis, because clinical waveform signals have unique temporal structures that differ from two-dimensional images. Consequently, 1D DenseNet variants retain the core idea of dense connectivity while aligning with the nature of physiological signals, making them a powerful baseline or feature extractor for ECG analysis.

2.2.1. Splitting and Embedding

Once the PTB-XL ECG data are preprocessed into smaller frames, these frames are fed into the initial convolution and dense blocks of DenseNet121. Mathematically, in the l-th layer of a dense block, the output x l is given by
x l = x 0 , x 1 , , x l 1 H l
where x 0 , x 1 , , x l 1 denotes the connections or concatenation of all preceding layer outputs, and H l is a composite function of batch normalization, ReLU, and a 3 × 3 convolution [10]. When applied to ECG frames, this layer-by-layer concatenation ensures that important morphological cues (such as QRS amplitude or ST segment deviations) from earlier portions of the signal are preserved and continuously refined as the network goes deeper. After passing through all four dense blocks of DenseNet121, the model performs global average pooling and projects the resulting features into a fully connected classification or regression output [10].

2.2.2. Frames Processing

As the ECG frames progress through the dense blocks, the network continuously concatenates feature maps, allowing for the efficient reuse of features and promoting gradient flow. The output of each dense block is concatenated with its input, as shown in the following equation:
Z = concat ( X , Y )
where X is the input tensor and Y is the output of the dense block [19]. Between dense blocks, DenseNet121 employs transition layers to manage the growing feature map size and reduce the spatial dimensions. The transition layers help in reducing the computational complexity while maintaining the network’s ability to capture important ECG signal characteristics. The output of a transition layer can be expressed as
m trans = AvgPool ( Conv ( m , θ , 1 × 1 ) )
where m is the input to the transition layer, and θ represents the reduction factor used to decrease the feature map size. For our study, we used θ = 0.5 , in accordance with previous implementations of DenseNet [20].

2.2.3. Hidden States

After processing through multiple dense blocks and transition layers, the final feature maps undergo global average pooling. The final global pooling step then aggregates this information into a fixed-length hidden state vector, which serves as a compact representation of the ECG frame’s key characteristics. This hidden state vector can be mathematically represented as
h = G ( F L ( x ) )
where h is the hidden state vector, G is the global pooling operation, F L represents the composite function of all dense blocks and transition layers, and x is the input ECG frame [10]. The hidden state vector encapsulates several crucial ECG attributes such as temporal relationships within the ECG signal, waveform shapes (including P-waves, QRS complexes, and T-waves), and potential anomalies (such as subtle deviations from normal patterns indicating arrhythmias or other cardiac abnormalities) [21].

2.3. Decoders (LSTM, Transformer, GRU)

2.3.1. LSTM Decoder

After encoding, we feed these hidden states into a single-layer LSTM decoder, which uses a learning rate of 4 × 10⁻⁴ and a teacher forcing probability of 1 during training. These values were chosen because of their optimal performance in a prior study by Bleich et al. that utilized ResNet [2]. The decoder then models temporal dependencies among frames, refining the feature vectors into a coherent output sequence such as an arrhythmia classification or waveform annotation. An attention layer of size 512 further enhances this process by highlighting the most relevant aspects of the encoder’s features [22,23].
For our LSTM-based decoder, each step the hidden state is updated by incorporating both the previous hidden state and a context vector that summarizes relevant portions of the encoded ECG features. This context vector is computed through an attention mechanism, which assigns varying degrees of importance to different segments of the encoder’s outputs. By integrating the decoder’s previous state with these weighted ECG representations, the LSTM continually refines its hidden state, ensuring that each token it generates aligns with the most pertinent signal details. As the decoder progresses through the sequence, each newly updated hidden state feeds into a linear classification layer, ultimately producing the next token in the text report. This cyclical process continues until the model predicts an end-of-sequence marker, yielding a coherent, context-informed description of the data.
To prevent overfitting and ensure reliable convergence, a moderate dropout value of 0.5 is applied within the LSTM decoder. Randomly zeroing a fraction of its hidden units during training helps the network learn more robust representations. Additionally, each training iteration employs gradient clipping at a threshold of 5.0, capping excessively large gradients so that parameter updates remain stable and do not destabilize the learning process. Furthermore, we apply a doubly stochastic attention penalty set to a strength of 1.0. This penalty term is added to the primary cross-entropy loss, pushing each attention map to sum closer to 1 across time steps and preventing the model from over-concentrating on a single segment of the signal.
Furthermore, we employ padding placeholders to ensure that sequences of different lengths can be combined into uniform batches without confusing the training process. When a sequence is shorter than needed, extra markers are appended but do not represent any real information. Excluding these markers from the loss calculation allows the model to concentrate on meaningful inputs and avoid penalizing itself for the artificially inserted regions. For example, “Left ventricular hypertrophy” and “Complete left bundle branch block” are differently sized. To batch these differently sized texts together, the shorter one is padded with extra tokens that do not convey clinical meaning. Because these padded tokens are ignored during the loss calculation, the model focuses on the actual descriptive words. It then treats both short and long reports fairly, yielding consistent performance across varying report lengths.

2.3.2. Transformer Decoder

Similar to the LSTM approach, the hidden states from DenseNet121 are fed into a Transformer decoder. In our best configuration, we use 12 layers with 8 attention heads, a learning rate of 1 × 10⁻⁴, and an ECG input size of K = 1, as supported by previous research [2]. By stacking multiple self-attention operations over 12 layers, the decoder progressively refines the DenseNet121 embeddings, capturing both local waveform features and global rhythm characteristics. The multi-head attention mechanism attends to different segments of the encoder’s output, enabling richer context modeling and facilitating robust sequence-level predictions from the preprocessed ECG frames [24,25].
In our Transformer decoder, the incoming hidden states undergo multiple rounds of attention and feed-forward transformations. First, the decoder applies self-attention to previously generated tokens using the values mentioned earlier, enabling it to model dependencies between decoded words. Next, it employs cross-attention, where each token’s hidden state is refined based on how well it aligns with the encoder’s outputs, ensuring essential information from the original sequence is integrated. A position-wise feed-forward network follows these attention steps to further transform and stabilize the hidden representation, preparing it for the final projection layer that predicts the next token. This process repeats for each decoding step until the sequence is fully generated.
Similar to with the LSTM, we utilized a dropout rate of 0.5 and clipping threshold of 5.0. Here, it was integrated into multi-head attention blocks and feed-forward sublayers as mentioned earlier. We also used a doubly stochastic attention penalty of 1.0. We also added padded masking to this decoder.

2.3.3. GRU Decoder

Here, we feed the generated hidden states into a single bidirectional GRU layer decoder. GRU effectively handles sequential patterns using its gating mechanism, as first described by Cho et al. [26]. We use the following parameters from another study that reported the best configuration of the GRU decoder on an ECG dataset [27]. We use 256 hidden units, a learning rate of 5 × 10⁻⁴, a teacher forcing probability of 1 during training, and an attention layer size of 512 for refined context modeling. By continuously updating and resetting its internal state, the GRU manages the morphological cues from each ECG frame while filtering out less critical information [26]. This combination of gated propagation (input and forget gates) with attention allows the decoder to focus on the most relevant aspects of the DenseNet121 embeddings at each timestep, ultimately supporting robust sequence generation and enhanced interpretability, as illustrated in Figure 1.
For our bidirectional GRU approach, the hidden states in both directions integrate the previous step’s hidden state along with context vectors computed via attention on the encoder outputs. This attention mechanism weighs each encoded ECG segment according to its importance for predicting the next word. By merging the decoder’s prior state with these weighted ECG features, the decoder continuously refines its forward and backward hidden states. Once updated, these states are passed to a linear layer that produces the next token in the sequence. This process repeats at every decoding step until an end-of-sequence marker is reached resulting in a cohesive, data-driven narrative of the ECG signal.
Keeping consistent with LSTM and Transformer decoder, we utilized a clipping threshold of 5.0 and dropout rate of 0.5. We also used doubly stochastic attention penalty of 1.0 to encourage the model to distribute its attention more evenly over the ECG features. We also used padded masking to keep it consistent among all the decoders.

2.4. Evaluation

After passing through the decoder (whether GRU, LSTM, or Transformer), the model produces a sequence of tokens or labels intended to describe or annotate the ECG signal. This text output is used to measure how closely these generated sequences match a set of reference annotations (e.g., expert cardiologist summaries). We used automated text-similarity metrics like METEOR (Metric for Evaluation of Translation with Explicit Ordering), BLEU (Bilingual Evaluation Understudy), and ROUGE-1 (Recall-Oriented Understudy for Gisting Evaluation). BLEU relies on comparing overlapping text in the prediction and reference to capture precision, while ROUGE-1 emphasizes recall by tracking the proportion of matching unigrams [28,29]. METEOR goes further by examining word alignments and factoring in both precision and recall, often displaying greater correlation with human judgment [30,31]. By aggregating these scores, we quantified how accurately the system captures key ECG features against actual interpretations by cardiologists.

3. Results

This section reports our experimental findings along with previous study findings that used the same PTB-XL dataset and the official split recommendation suggested by the authors of the PTB-XL dataset. We also include the heart conditions we used for training and evaluation.

3.1. Cardiovascular Pathologies in PTB-XL Dataset

Table 1 lists the cardiovascular pathologies included in the PTB-XL dataset, along with their occurrences and descriptions. The dataset contains a wide range of conditions, from normal ECGs to specific pathologies such as myocardial infarctions (MIs), bundle branch blocks, and hypertrophy. The most common condition is normal ECG (NORM), with 7185 instances, followed by ST-T changes (STTC) with 1713 instances. Rare conditions such as lateral myocardial infarction (LMI) and right atrial overload (RAO/RAE) are also included, with only 28 and 33 instances, respectively. This diversity ensures that the dataset is representative of various cardiac conditions, making it suitable for training and evaluating machine learning models.

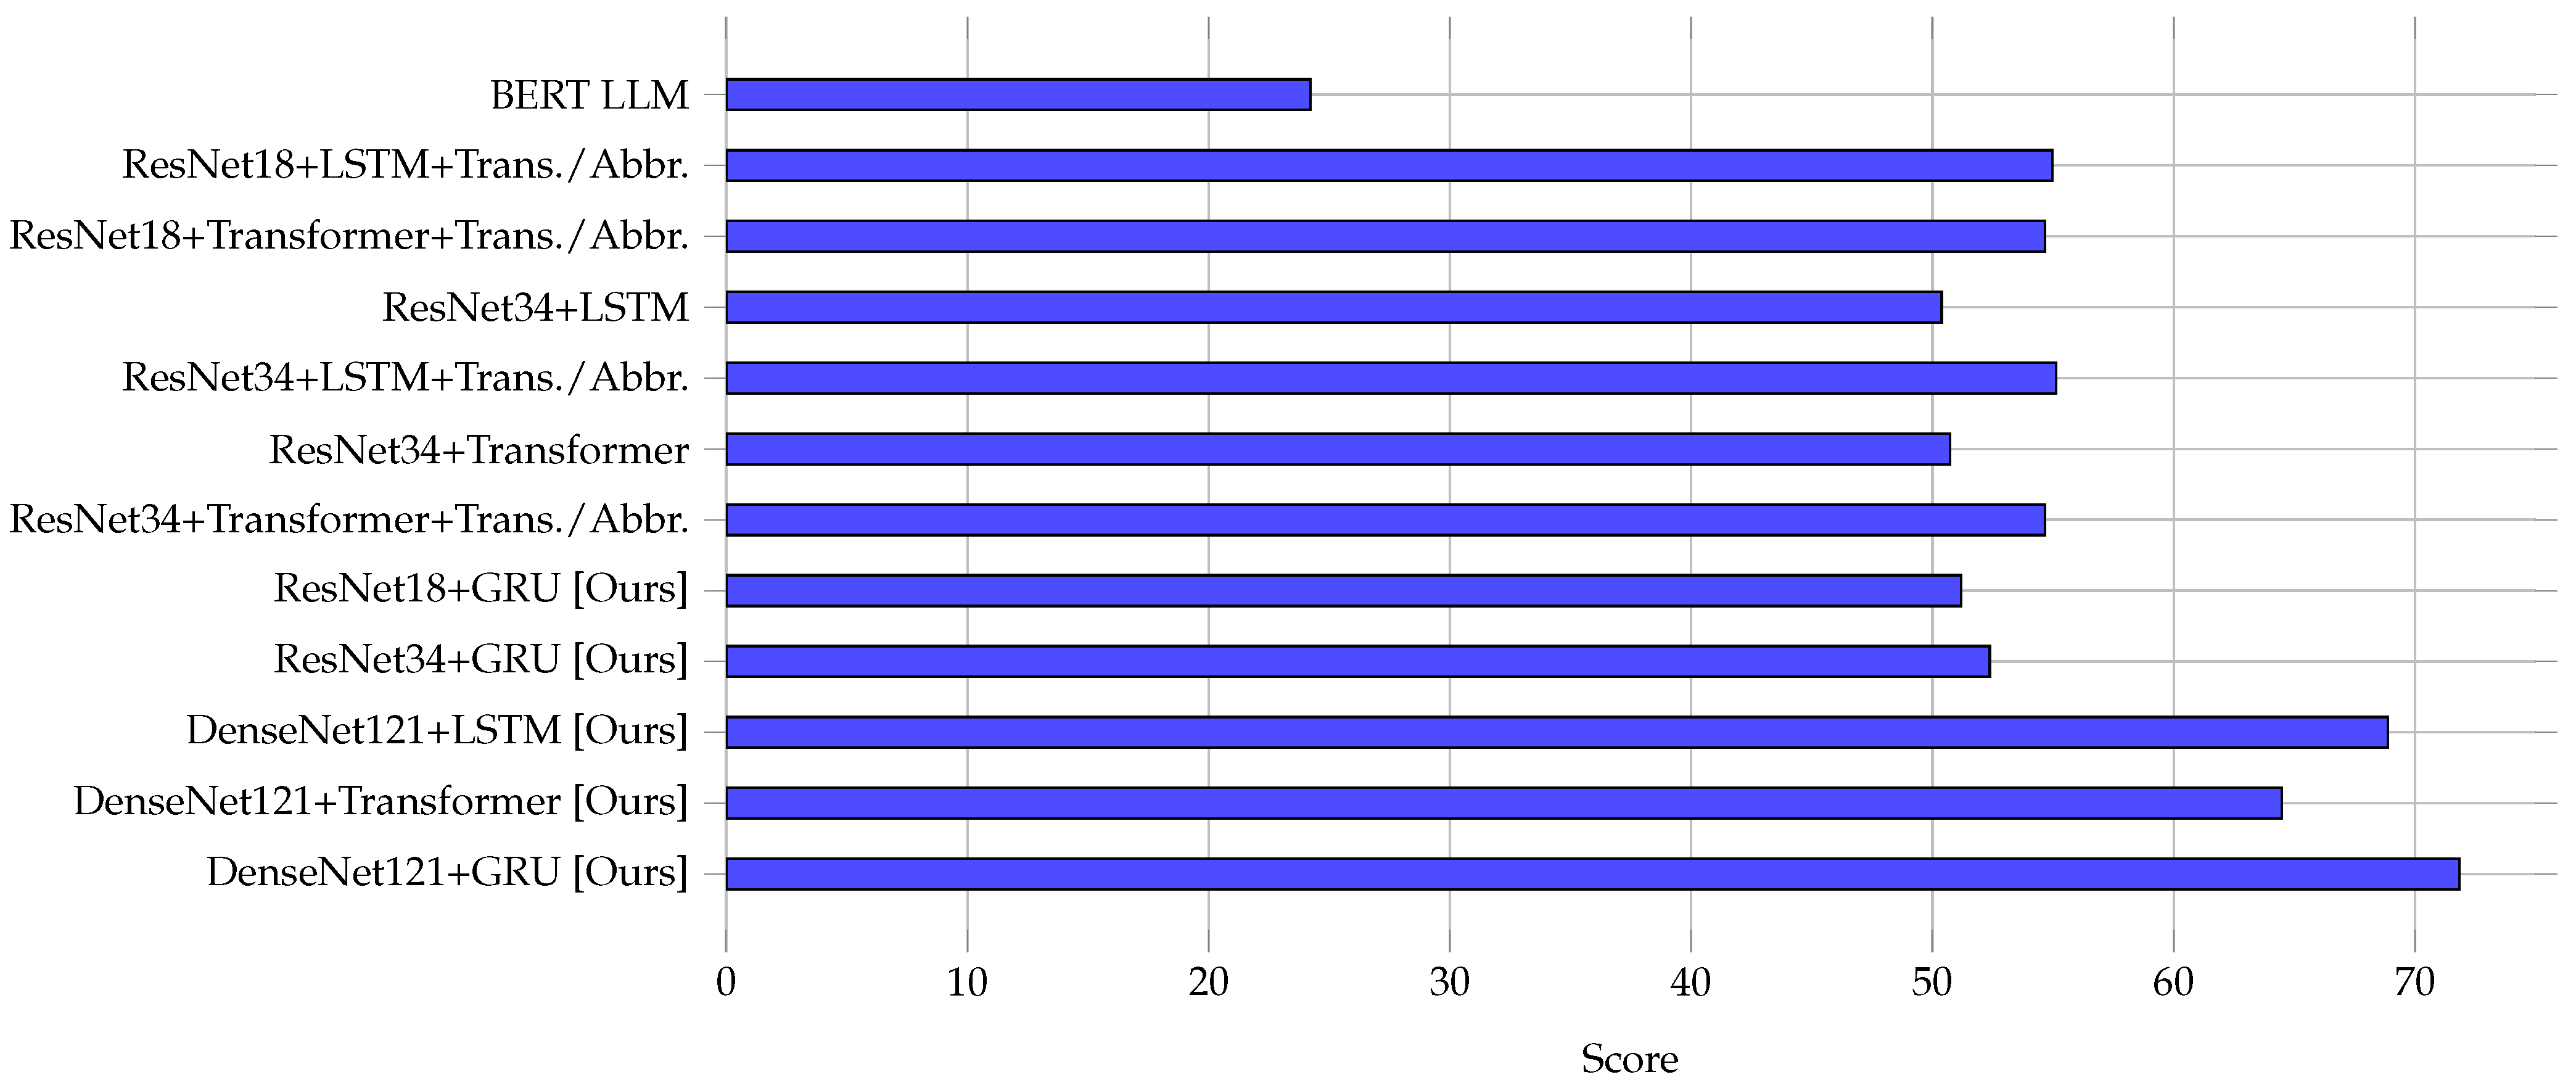
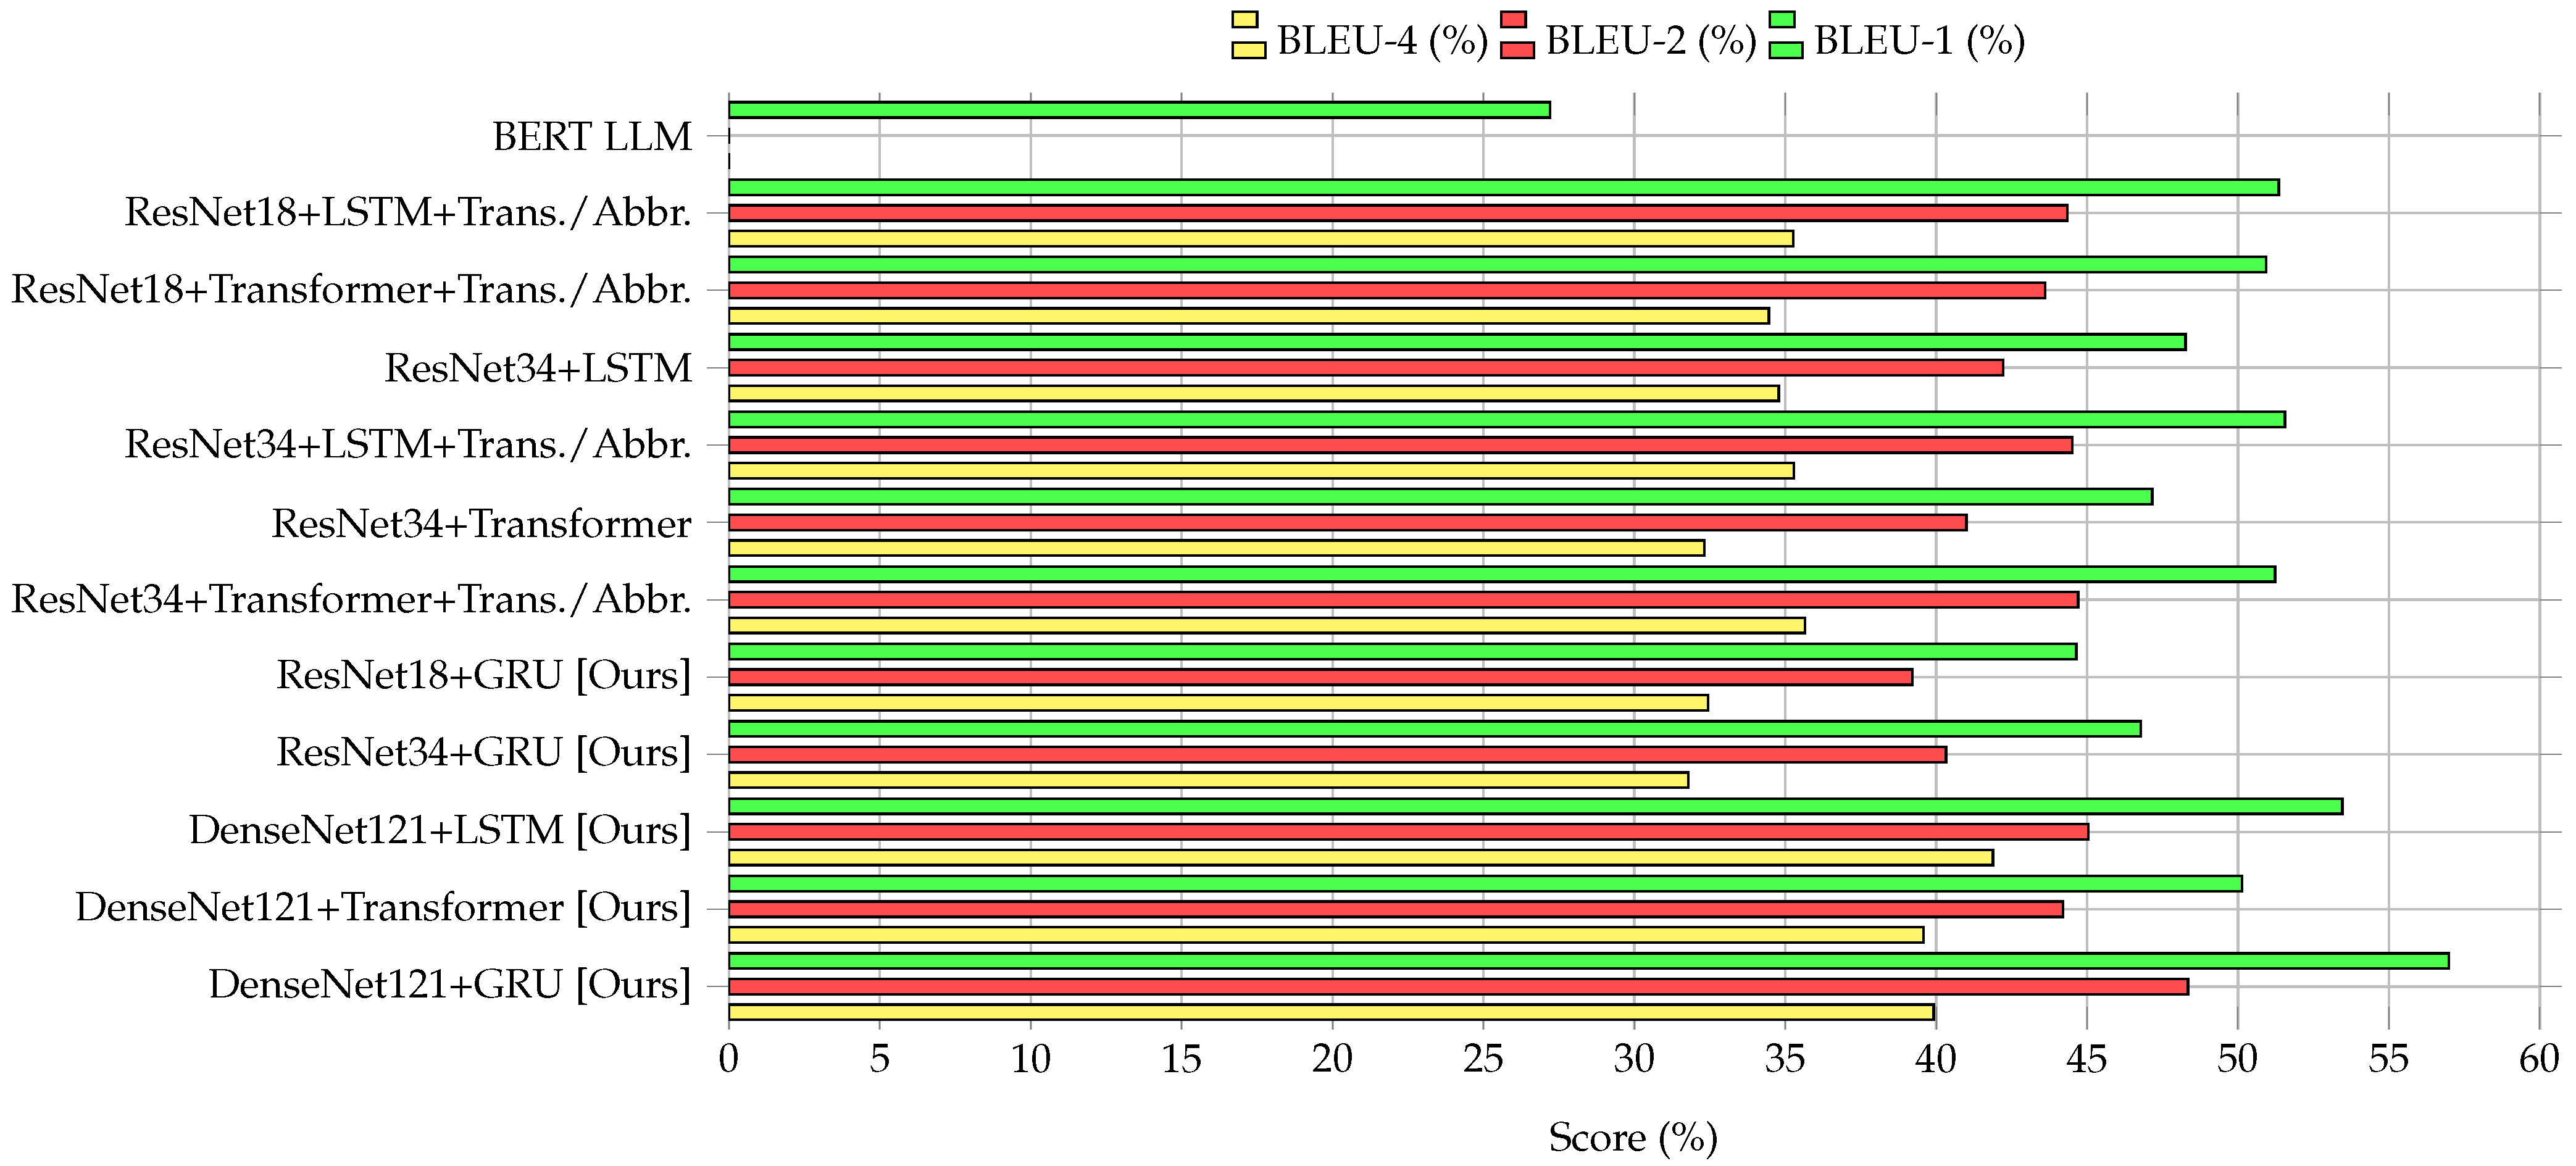
3.2. Performance Comparison of Encoder–Decoder Models

Table 2 compares the performance of various encoder–decoder models trained, tested, and validated on the PTB-XL dataset. The metrics used for evaluation include METEOR, BLEU (1, 2, and 4), and ROUGE-1 (precision, recall, and F1-score). The DenseNet121 encoder paired with the GRU decoder achieved the highest METEOR score of 72.19%, BLEU-1 score of 57.08%, BLEU-2 score of 48.33%, and ROUGE-1 F1-score of 64.33%. The DenseNet121+LSTM combination achieved the highest BLEU-4 score of 41.91%. These results demonstrate the superior performance of DenseNet121-based models compared to ResNet-based models and the BERT LLM baseline.

3.3. Visualization of Model Performance

Figure 2 illustrates the METEOR scores achieved by different encoder–decoder models. DenseNet121+GRU outperformed all other combinations, achieving a METEOR score of 72.19%. This highlights the effectiveness of DenseNet121 in capturing nuanced ECG features and the GRU decoder’s ability to generate accurate text descriptions.
Figure 3 presents the BLEU scores (BLEU-1, BLEU-2, and BLEU-4) for the models. DenseNet121+GRU achieved the highest BLEU-1 and BLEU-2 scores, while DenseNet121+LSTM achieved the highest BLEU-4 score. These results indicate that DenseNet121-based models are better at generating text sequences with high n-gram overlap with reference annotations.
Figure 4 shows the ROUGE-1 scores (precision, recall, and F1-score) for the models. DenseNet121+GRU achieved the highest scores across all three metrics, with a precision of 66.23%, recall of 62.54%, and F1-score of 64.33%. This demonstrates the model’s ability to capture relevant information from the ECG data and generate coherent and accurate text reports.
From Table 2 and Figure 2, Figure 3 and Figure 4, it is evident that the DenseNet121 encoder paired with the GRU decoder is the best-performing combination for automated ECG report generation. The dense connectivity of DenseNet121 allows it to capture detailed ECG features, while the GRU decoder effectively models sequential dependencies in the data. These findings highlight the potential of DenseNet121-based models for improving the accuracy and reliability of automated ECG interpretation systems.

3.4. Comparative Analysis

It is important to highlight another recent advancement in encoder–decoder-based approaches: ECG-GPT. It generates diagnostic text reports directly from ECG images by coupling a BEiT Vision Transformer encoder with a GPT-2 decoder. This model has demonstrated robust performance, with an overall ROUGE-1 score of 0.748, a BLEU-1 of 0.619, a BLEU-4 of 0.472, and a METEOR score of 0.750 on a different dataset than ours [1]. In contrast, our model achieved a BLEU-1 score of 0.5708, a BLEU-4 score of 48.33, a METEOR score of 72.19, and an overall ROUGE-1 of 64.33, highlighting different performance characteristics between the two approaches. Although not trained on the PTB-XL dataset, ECG-GPT was evaluated on a subset of the PTB-XL dataset encompassing only six cardiac conditions: Atrial fibrillation (AF), sinus tachycardia (ST), sinus bradycardia (SB), left bundle branch block (LBBB), right bundle branch block (RBBB), and atrioventricular block (AVb). For these conditions, ECG-GPT achieved remarkably high AUROC (area under the receiver operating characteristic curve) values: 0.985 for AF, 0.988 for ST, 0.910 for SB, 0.993 for LBBB, 0.988 for RBBB, and 0.941 for AVb [1]. The AUROC only comments on ECG-GPT’s impressive performance in distinguishing between classes (e.g., presence or absence of a specific cardiac condition). However, little is known regarding whether the generated text describing these six findings from PTB-XL is fluent, grammatically correct, clinically appropriate, or similar to a human expert’s (i.e., cardiologist) writing aside from the reported overall METEOR, BLEU, and ROUGE-1 scores. A model could theoretically classify conditions perfectly (high AUROC) but still produce a nonsensical or poorly worded report, which is key to ECG report automation. Moreover, these six conditions account for only 10,422 ECG recordings, representing 47.8% of the entire PTB-XL dataset, whereas our DenseNet121-GRU model was trained and evaluated on 17 distinct cardiovascular pathologies, as shown in Figure 2. Additionally, ECG-GPT was not evaluated using the official split recommendations of the PTB-XL curators, which could potentially introduce bias and diminish some of the dataset’s nuanced characteristics. Future studies can aim to standardize data-splitting methods to preserve these nuances and further compare both models’ performance head to head.

4. Discussion

Our study indicates the overall superior performance of DenseNet121 in general compared to the ResNet encoder based on higher METEOR, BLUE, and ROUGE scores. The reason for selecting these three metrics is that we believe these collectively reflect different facets of quality in text generation.
The METEOR (Metric for Evaluation of Translation with Explicit Ordering) score evaluates a generated text against a reference by aligning words that are based not only on exact matches but also on stem and synonym matches; thus, this aims to capture both precision and recall in a more flexible manner. In this way, the METEOR score can reward paraphrased language or alternative word choices when they convey the same meaning, making it especially relevant for assessing ECG interpretation [30]. The BLEU (Bilingual Evaluation Understudy) score, on the other hand, focuses on how many n-grams in the generated text overlap with a reference text [31]. Its variants (BLEU-1, BLEU-2, BLEU-4) assess 1-gram, 2-gram, and 4-gram overlaps, respectively, placing a strong emphasis on precision; that is, how many of the generated n-grams appear in the reference. The BLEU score remains popular because it is simple to compute and tends to correlate well with human judgments at a high level, even if it cannot account for synonymy or morphological variations as flexibly as the METEOR score [32].
Meanwhile, the ROUGE score (Recall-Oriented Understudy for Gisting Evaluation) measures the overlap between the generated output and the reference with a particular focus on recall. In other words, it calculates how much of the reference text’s content is captured by the ML algorithm. Different ROUGE variants (like ROUGE-1) look at unigrams, whereas others (like ROUGE-L) assess the longest common subsequence. ROUGE also breaks down into precision (P), recall (R), and a composite F-score (F), providing a fuller view of how much information from the reference is preserved, and how accurately it is reproduced [33]. These metrics collectively ensure that the generated text is assessed from multiple angles of precision (BLEU, P of ROUGE), recall (METEOR, R of ROUGE), and semantic flexibility (METEOR).
As shown in the results, this comprehensive encoding of the signal consistently translates into superior METEOR, BLEU, and ROUGE metrics, culminating in DenseNet121 (ours) + GRU reaching a METEOR score of 72.19%, compared to lower scores from ResNet-based and BERT-based models.
We believe this is because DenseNet121’s dense connectivity allows it to excel at extracting nuanced details from ECG data. Each layer in DenseNet has direct access to all preceding feature maps, which gives it a more holistic view of localized changes in the waveform [29]. These subtle variations in an ECG can be critical when generating accurate and clinically relevant reports. In contrast, the residual connections of ResNet limit how easily the model can combine features from different hierarchical levels by relying on skip connections. This results in less comprehensive representations, as evidenced by our findings in this study. By capturing the entire progression of signals better, DenseNet121 ensures more precise text descriptions about a patient’s cardiac status.
Although BERT LLM can produce high-quality text in many tasks, it is not inherently designed to handle continuous, time-series-style biomedical data without extensive customization [34]. DenseNet121, on the other hand, is designed for large-scale image (and related signal) data, which is more closely aligned with the shape and nature of ECG waveforms [7,10,29]. This may explain why BERT LLM achieved the lowest score in Figure 2, Figure 3 and Figure 4. This alignment in data format allows DenseNet121 to more readily capture subtle morphological or temporal details critical in diagnosing intricate cardiac conditions. By applying a DenseNet-style encoder to ECG signals, we retain richer waveform features throughout the network’s layers, reducing the need for complex, specialized bridging strategies between raw ECGs and clinically meaningful outputs. Consequently, our approach prioritizes nuanced signal interpretation and fosters consistent, high-quality text reports with fewer modifications than would be required for a language model designed primarily around token-based text inputs. Future studies could look at the impact of preprocessing the dataset in a more compatible way by converting the signals and annotations into a cleaner, longer textual format that BERT can readily understand. For instance, rather than feeding the model raw waveforms or minimal textual labels, researchers can transform each ECG into a set of descriptive phrases that capture important features rhythm type, waveform intervals, and any clinically significant changes.
When connected to a specialized decoder, such as GRUs in this instance, DenseNet121 performed the best compared to LSTM and Transformer decoder. This is because GRUs benefit from a simpler gating mechanism compared to LSTMs, combining the forget and input gates into a single update gate and making them less computationally intensive to train while preserving the ability to handle long-range dependencies [35]. One study comparing LSTM and GRU networks for industrial process prediction found that the GRU model achieved better overall performance with fewer parameters, pointing to reduced training requirements and improved efficiency under real-world constraints [36]. In our study, this streamlined structure most likely translated into faster convergence and less overfitting, thereby boosting evaluation metrics such as METEOR and BLEU scores.
Additionally, although Transformers have shown great advantages in capturing global context in purely textual tasks, they can be more resource-intensive and may require larger or more diverse datasets to surpass simpler recurrent architectures [37]. In scenarios where the encoder (e.g., DenseNet121) is already providing high-quality feature embeddings, a GRU-based decoder can more directly leverage these representations without the overhead of attention layers or the complexity of self-attention in the Transformer decoder. This efficiency advantage has been echoed in other research on sequence modeling, which notes that GRUs often match or exceed LSTMs’ and Transformers’ performance when dealing with moderate data sizes and when step-by-step gating control is sufficient or even preferable [38]. Hence, the combination of DenseNet121 with a GRU decoder strikes a favorable trade-off between representational capacity and parameter simplicity, leading to the superior performance observed in our study.
Despite the advantages, there are limitations to the DenseNet121 and GRU-based approach. DenseNet by its design uses more computational resources due to keeping all preceding layers. This overhead may become a limiting factor in practical scenarios where hardware constraints or real-time processing requirements are paramount. Furthermore, while DenseNet121 is effective at capturing detailed representations, its additional “dense” connections can increase the risk of parameter redundancy when repeatedly trained on highly similar data, which may make domain adaptation less straightforward in some cases.
The GRU decoder, on the other hand, can have limited capacity to capture extremely long-range dependencies compared to Transformers or multi-layer LSTM architectures [37,38]. The lack of a separate output gate can constrain the model’s ability to maintain intricate state information over extensive sequences, making it potentially less robust for contexts where the textual output depends on very distant elements in the input. Additionally, GRUs rely on recurrent processing and sequential unrolling, which can pose challenges for parallelization on modern hardware accelerators. This sequential nature contrasts with self-attention-based models, which are often more computationally efficient for long input sequences in other tasks [35,38].
Another limitation of our study is the use of a single dataset. Even though all our training and evaluation was performed on this single dataset, we felt strongly about using just the PTB-XL dataset for various reasons. It is a strong choice for ML because it offers a large and diverse set of ECGs recorded under a variety of clinical conditions, ensuring the data reflect a broad range of heart abnormalities and normal variants. Its standardized, high-quality labels and accompanying text reports enable clear benchmarking for algorithms across classification and caption-generation tasks. Furthermore, the other datasets we investigated for this project were not as strong mainly because of the vetting process PTB-XL went through. It was annotated by two trained cardiologists and has a total of 21799 ECGs. Additionally, the presence of multiple sampling rates supports method development at different resolutions, and the official splits help guarantee more realistic model evaluations without patient overlap. Moreover, PTB-XL’s public availability and transparent documentation promote reproducibility. Its use by other researchers in the evaluation of different encoder–decoder combinations encourages further comparison of different performance metrics. Future studies would benefit from complementing PTB-XL with additional large-scale datasets reflecting different populations and clinical settings, enabling more robust assessment of model performance and generalizability across diverse real-world scenarios.

5. Conclusions

In our study, we demonstrated that a DenseNet121-based encoder, originally designed for 2D image analysis, could be successfully adapted and outperform the previously best ResNet-based architectures for automated ECG reporting when paired with various decoders (GRU, LSTM, and Transformer). We converted DenseNet into a 1D model suitable for ECG time-series data, preserving dense connectivity so that each layer directly reused feature maps from all preceding layers. We found that DenseNet121 captured more nuanced signal features than ResNet, thereby achieving superior text-generation metrics for ECG report generation. Even though some earlier systems had employed advanced language models or different CNN encoders, we filled a gap by systematically combining a DenseNet encoder with multiple decoder types, and discovered that a GRU decoder, with its simpler gating mechanism, boosted both accuracy and efficiency when compared to currently tested algorithms in this task.
Future work could concentrate on integrating attention mechanisms or hybrid decoders (e.g., GRU plus Transformer layers) to capture both local and global signal dependencies. This would potentially improve the quality of automatically generated reports for tasks beyond ECG, such as EEG or respiratory waveform analysis. Researchers might also explore more domain-specific data augmentations and transfer learning strategies to stretch limited medical datasets, ensuring that dense connectivity networks and recurrent decoders adapt well across different clinical contexts.
Additionally, it is crucial to test these models on larger, more varied datasets to confirm their generalizability and robustness. ECG data can differ due to patient demographics, recording conditions, and labeling protocols. Proving consistent performance across multiple institutions or different biomedical signals would enhance confidence in these methods and help pave the way for broader automation, thereby accelerating clinical workflows in cardiology and other healthcare domains.

Author Contributions

Conceptualization, G.H., A.S. and M.T.; methodology, G.H., A.S. and M.T.; software, G.H. and A.S.; validation, G.H., A.S. and M.T.; formal analysis, G.H. and A.S.; investigation, G.H., A.S. and M.T.; resources, M.T.; data curation, G.H. and A.S.; writing—original draft preparation, G.H. and A.S.; writing—review and editing, G.H., A.S. and M.T.; visualization, G.H. and A.S.; supervision, M.T.; project administration, M.T. All authors have read and agreed to the published version of the manuscript.

Funding

This research received no external funding.

Institutional Review Board Statement

Not applicable.

Informed Consent Statement

Not applicable.

Data Availability Statement

The dataset used in this research is publicly available at the PTB-XL repository on https://doi.org/10.1038/s41597-020-0495-6 [15] (accessed on 24 April 2025).

Acknowledgments

During the preparation of this manuscript, the authors utilized some tools to check and enhance grammar, some of which may have been AI-powered. The authors have thoroughly reviewed and edited all outputs and take full responsibility for the accuracy and integrity of the content presented in this publication.

Conflicts of Interest

The authors declare no conflicts of interest.

Abbreviations

The following abbreviations are used in this manuscript:
AIArtificial intelligence
AMIAnterior myocardial infarction
AUCArea under the curve
AVAtrioventricular
BERTBidirectional Encoder Representations from Transformers
BLEUBilingual Evaluation Understudy
CC BYCreative Commons Attribution
CLBBBComplete left bundle branch block
CNNConvolutional neural network
ECGElectrocardiogram
GRUGated Recurrent Unit
ILBBBIncomplete left bundle branch block
IMIInferior myocardial infarction
IRBBBIncomplete right bundle branch block
ISCIschemic ST-T-wave changes
ISCIIschemic changes
LAFBLeft anterior fascicular block
LMILateral myocardial infarction
LLMLarge language model
LSTMLong Short-Term Memory
LVHLeft ventricular hypertrophy
METEORMetric for Evaluation of Translation with Explicit Ordering
MIMyocardial infarction
MLMachine learning
NORMNormal electrocardiogram
NSTNonspecific ST-wave changes
PTB-XLPhysioNet PTB-XL Dataset
RAERight atrial enlargement
RAORight atrial overload
ResNetResidual network
RNNRecurrent neural network
ROUGERecall-Oriented Understudy for Gisting Evaluation
STTCST-T changes
WPWWolff–Parkinson–White syndrome

References

  1. Khunte, A.; Sangha, V.; Oikonomou, E.K.; Dhingra, L.S.; Aminorroaya, A.; Coppi, A.; Vasisht Shankar, S.; Mortazavi, B.J.; Bhatt, D.L.; Krumholz, H.M.; et al. Automated Diagnostic Reports from Images of Electrocardiograms at the Point-of-Care. medRxiv 2024. [Google Scholar] [CrossRef]
  2. Bleich, A.; Linnemann, A.; Diem, B.H.; Conrad, T.O. Automated Medical Report Generation for ECG Data: Bridging Medical Text and Signal Processing with Deep Learning. arXiv 2024. [Google Scholar] [CrossRef]
  3. Nasef, D.; Nasef, D.; Basco, K.J.; Singh, A.; Hartnett, C.; Ruane, M.; Tagliarino, J.; Nizich, M.; Toma, M. Clinical Applicability of Machine Learning Models for Binary and Multi-Class Electrocardiogram Classification. AI 2025, 6, 59. [Google Scholar] [CrossRef]
  4. Basco, K.J.; Singh, A.; Nasef, D.; Hartnett, C.; Ruane, M.; Tagliarino, J.; Nizich, M.; Toma, M. Electrocardiogram Abnormality Detection Using Machine Learning on Summary Data and Biometric Features. Diagnostics 2025, 15, 903. [Google Scholar] [CrossRef]
  5. Toma, M.; Husain, G. Algorithm Selection and Data Utilization in Machine Learning for Medical Imaging Classification. In Proceedings of the 2024 IEEE Long Island Systems, Applications and Technology Conference (LISAT), Holtsville, NY, USA, 15 November 2024; IEEE: New York, NY, USA, 2024; pp. 1–6. [Google Scholar] [CrossRef]
  6. Johnson, L.S.; Zadrozniak, P.; Jasina, G.; Grotek-Cuprjak, A.; Andrade, J.G.; Svennberg, E.; Diederichsen, S.Z.; McIntyre, W.F.; Stavrakis, S.; Benezet-Mazuecos, J.; et al. Artificial intelligence for direct-to-physician reporting of ambulatory electrocardiography. Nat. Med. 2025, 31, 925–931. [Google Scholar] [CrossRef]
  7. Zhang, C.; Benz, P.; Argaw, D.M.; Lee, S.; Kim, J.; Rameau, F.; Bazin, J.C.; Kweon, I.S. ResNet or DenseNet? Introducing Dense Shortcuts to ResNet. In Proceedings of the 2021 IEEE Winter Conference on Applications of Computer Vision (WACV), Waikoloa, HI, USA, 3–8 January 2021; pp. 3549–3558. [Google Scholar] [CrossRef]
  8. Hou, Y.; Wu, Z.; Cai, X.; Zhu, T. The application of improved densenet algorithm in accurate image recognition. Sci. Rep. 2024, 14, 8645. [Google Scholar] [CrossRef]
  9. Qiu, J.; Han, W.; Zhu, J.; Xu, M.; Rosenberg, M.; Liu, E.; Weber, D.; Zhao, D. Transfer Knowledge from Natural Language to Electrocardiography: Can We Detect Cardiovascular Disease Through Language Models? arXiv 2023. [Google Scholar] [CrossRef]
  10. Huang, G.; Liu, Z.; Maaten, L.V.D.; Weinberger, K.Q. Densely Connected Convolutional Networks. In Proceedings of the 2017 IEEE Conference on Computer Vision and Pattern Recognition (CVPR), Honolulu, HI, USA, 21–26 July 2017; pp. 2261–2269. [Google Scholar] [CrossRef]
  11. Strodthoff, N.; Wagner, P.; Schaeffter, T.; Samek, W. Deep Learning for ECG Analysis: Benchmarks and Insights from PTB-XL. IEEE J. Biomed. Health Inform. 2021, 25, 1519–1528. [Google Scholar] [CrossRef]
  12. Palczynski, K.; Smigiel, S.; Ledzinski, D.; Bujnowski, S. Study of the Few-Shot Learning for ECG Classification Based on the PTB-XL Dataset. Sensors 2022, 22, 904. [Google Scholar] [CrossRef]
  13. Laghari, A.A.; Sun, Y.; Alhussein, M.; Aurangzeb, K.; Anwar, M.S.; Rashid, M. Deep residual-dense network based on bidirectional recurrent neural network for atrial fibrillation detection. Sci. Rep. 2023, 13, 15109. [Google Scholar] [CrossRef]
  14. Zhu, F.; Ye, F.; Fu, Y.; Liu, Q.; Shen, B. Electrocardiogram generation with a bidirectional LSTM-CNN generative adversarial network. Sci. Rep. 2019, 9, 6734. [Google Scholar] [CrossRef] [PubMed]
  15. Wagner, P.; Strodthoff, N.; Bousseljot, R.D.; Kreiseler, D.; Lunze, F.I.; Samek, W.; Schaeffter, T. PTB-XL, a large publicly available electrocardiography dataset. Sci. Data 2020, 7, 154. [Google Scholar] [CrossRef] [PubMed]
  16. Zorarpacı, E.; Özel, S.A. Privacy preserving classification over differentially private data. WIREs Data Min. Knowl. Discov. 2020, 11, e1399. [Google Scholar] [CrossRef]
  17. Yu, H.; Guo, P.; Sano, A. Zero-Shot ECG Diagnosis with Large Language Models and Retrieval-Augmented Generation. In Proceedings of the 3rd Machine Learning for Health Symposium, PMLR, New Orleans, LA, USA, 10 December 2023; Proceedings of Machine Learning Research. Hegselmann, S., Parziale, A., Shanmugam, D., Tang, S., Asiedu, M.N., Chang, S., Hartvigsen, T., Singh, H., Eds.; Volume 225, pp. 650–663. Available online: https://proceedings.mlr.press/v225/yu23b/yu23b.pdf (accessed on 14 April 2025).
  18. Tian, Y.; Li, Z.; Jin, Y.; Wang, M.; Wei, X.; Zhao, L.; Liu, Y.; Liu, J.; Liu, C. Foundation model of ECG diagnosis: Diagnostics and explanations of any form and rhythm on ECG. Cell Rep. Med. 2024, 5, 101875. [Google Scholar] [CrossRef]
  19. Irshad, M.S.; Masood, T.; Jaffar, A.; Rashid, M.; Akram, S.; Aljohani, A. Deep Learning-Based ECG Classification for Arterial Fibrillation Detection. Comput. Mater. Contin. 2024, 79, 4805–4824. [Google Scholar] [CrossRef]
  20. Babu, P.P.S.; Brindha, T. Deep Learning Fusion for Intracranial Hemorrhage Classification in Brain CT Imaging. Int. J. Adv. Comput. Sci. Appl. 2024, 15, 884–894. [Google Scholar] [CrossRef]
  21. Somani, S.; Russak, A.J.; Richter, F.; Zhao, S.; Vaid, A.; Chaudhry, F.; De Freitas, J.K.; Naik, N.; Miotto, R.; Nadkarni, G.N.; et al. Deep learning and the electrocardiogram: Review of the current state-of-the-art. EP Eur. 2021, 23, 1179–1191. [Google Scholar] [CrossRef]
  22. Habler, E.; Shabtai, A. Using LSTM encoder-decoder algorithm for detecting anomalous ADS-B messages. Comput. Secur. 2018, 78, 155–173. [Google Scholar] [CrossRef]
  23. Malhotra, P.; Ramakrishnan, A.; Anand, G.; Vig, L.; Agarwal, P.; Shroff, G. LSTM-based Encoder-Decoder for Multi-sensor Anomaly Detection. arXiv 2016. [Google Scholar] [CrossRef]
  24. Libovicky, J.; Helcl, J.; Marecek, D. Input Combination Strategies for Multi-Source Transformer Decoder. In Proceedings of the Third Conference on Machine Translation: Research Papers. Association for Computational Linguistics, Brussels, Belgium, 31 October–1 November 2018. [Google Scholar] [CrossRef]
  25. Li, Y.; Cai, W.; Gao, Y.; Li, C.; Hu, X. More than Encoder: Introducing Transformer Decoder to Upsample. In Proceedings of the 2022 IEEE International Conference on Bioinformatics and Biomedicine (BIBM), Las Vegas, NV, USA, 6–8 December 2022; IEEE: New York, NY, USA, 2022; pp. 1597–1602. [Google Scholar] [CrossRef]
  26. Cho, K.; van Merrienboer, B.; Gulcehre, C.; Bahdanau, D.; Bougares, F.; Schwenk, H.; Bengio, Y. Learning Phrase Representations using RNN Encoder–Decoder for Statistical Machine Translation. In Proceedings of the 2014 Conference on Empirical Methods in Natural Language Processing (EMNLP), Doha, Qatar, 25–29 October 2014; Association for Computational Linguistics: Stroudsburg, PA, USA, 2014. [Google Scholar] [CrossRef]
  27. Lynn, H.M.; Pan, S.B.; Kim, P. A Deep Bidirectional GRU Network Model for Biometric Electrocardiogram Classification Based on Recurrent Neural Networks. IEEE Access 2019, 7, 145395–145405. [Google Scholar] [CrossRef]
  28. van Halteren, H.; Teufel, S. Examining the consensus between human summaries: Initial experiments with factoid analysis. In Proceedings of the HLT-NAACL 03 Text Summarization Workshop, Stroudsburg, PA, USA, 31 May 2003; pp. 57–64. Available online: https://aclanthology.org/W03-0508/ (accessed on 14 April 2025).
  29. He, K.; Zhang, X.; Ren, S.; Sun, J. Deep Residual Learning for Image Recognition. In Proceedings of the 2016 IEEE Conference on Computer Vision and Pattern Recognition (CVPR), Las Vegas, NV, USA, 27–30June 2016; IEEE: New York, NY, USA, 2016. [Google Scholar] [CrossRef]
  30. Lavie, A.; Denkowski, M.J. The Meteor metric for automatic evaluation of machine translation. Mach. Transl. 2009, 23, 105–115. [Google Scholar] [CrossRef]
  31. Papineni, K.; Roukos, S.; Ward, T.; Zhu, W.J. BLEU: A method for automatic evaluation of machine translation. In Proceedings of the 40th Annual Meeting on Association for Computational Linguistics—ACL ’02, Philadelphia, PA, USA, 6–12 July 2002; Association for Computational Linguistics: Stroudsburg, PA, USA, 2002. ACL ’02. p. 311. [Google Scholar] [CrossRef]
  32. Wolk, K.; Marasek, K. Enhanced Bilingual Evaluation Understudy. Lecture Notes on Information Theory 2014, 2, 191–197. [Google Scholar] [CrossRef]
  33. Liu, F.; Liu, Y. Exploring Correlation Between ROUGE and Human Evaluation on Meeting Summaries. IEEE Trans. Audio, Speech Lang. Process. 2010, 18, 187–196. [Google Scholar] [CrossRef]
  34. Devlin, J.; Chang, M.W.; Lee, K.; Toutanova, K. BERT: Pre-training of Deep Bidirectional Transformers for Language Understanding. In Proceedings of the 2019 Conference of the North American Chapter of the Association for Computational Linguistics: Human Language Technologies, Minneapolis, MN, USA, 2–7 June 2019; Association for Computational Linguistics: Stroudsburg, PA, USA, 2019. [Google Scholar] [CrossRef]
  35. Tandale, S.B.; Stoffel, M. Recurrent and convolutional neural networks in structural dynamics: A modified attention steered encoder–decoder architecture versus LSTM versus GRU versus TCN topologies to predict the response of shock wave-loaded plates. Comput. Mech. 2023, 72, 765–786. [Google Scholar] [CrossRef]
  36. Mateus, B.C.; Mendes, M.; Farinha, J.T.; Assis, R.; Cardoso, A.M. Comparing LSTM and GRU Models to Predict the Condition of a Pulp Paper Press. Energies 2021, 14, 6958. [Google Scholar] [CrossRef]
  37. Zeyer, A.; Bahar, P.; Irie, K.; Schluter, R.; Ney, H. A Comparison of Transformer and LSTM Encoder Decoder Models for ASR. In Proceedings of the 2019 IEEE Automatic Speech Recognition and Understanding Workshop (ASRU), Singapore, 14–18 December 2019; IEEE: New York, NY, USA, 2019; pp. 8–15. [Google Scholar] [CrossRef]
  38. Gao, Y.; Glowacka, D. Deep Gate Recurrent Neural Network. In Proceedings of the 8th Asian Conference on Machine Learning, Hamilton, New Zealand, 16–18 November 2016; Proceedings of Machine Learning Research. Durrant, R.J., Kim, K.E., Eds.; The University of Waikato: Hamilton, New Zealand, 2016; Volume 63, pp. 350–365. Available online: http://proceedings.mlr.press/v63/gao30.pdf (accessed on 14 April 2025).
Figure 1. Overview of the encoder–decoder pipeline for PTB-XL dataset using DenseNet121 as the encoder and LSTM, GRU, or Transformer as the decoders.
Electronics 14 01837 g001
Figure 2. Comparison of METEOR scores across various encoder–decoder models trained and tested on PTB-XL dataset. The y-axis lists the models as follows: the BERT LLM model, developed by Qiu et al. [9], which achieved the lowest METEOR score of 24.23%; several ResNet-based models, including ResNet18 and ResNet34 paired with LSTM or Transformer decoders, evaluated by Bleich et al. [2], with METEOR scores ranging from 50.39% to 55.53%; and our proposed models, which utilize a DenseNet121 encoder paired with GRU, LSTM, or Transformer decoders, achieving the highest scores, with the DenseNet121+GRU model attaining the best METEOR score of 72.19%.
Electronics 14 01837 g002
Figure 3. Comparison of BLEU scores across various encoder–decoder models trained and tested and tested on PTB-XL dataset. The y-axis lists the models as follows: the BERT LLM model, developed by Qiu et al. [9], which achieved the lowest BLEU scores; several ResNet-based models, including ResNet18 and ResNet34 paired with LSTM or Transformer decoders, evaluated by Bleich et al. [2]; and our proposed models, which utilize a DenseNet121 encoder paired with GRU, LSTM, or Transformer decoders, achieving the highest scores.
Electronics 14 01837 g003
Figure 4. Comparison of ROUGE-1 scores various encoder–decoder models trained and tested and tested on PTB-XL dataset. The y-axis lists the models as follows: the BERT LLM model, developed by Qiu et al. [9], which achieved the lowest ROUGE-1 scores; several ResNet-based models, including ResNet18 and ResNet34 paired with LSTM or Transformer decoders, evaluated by Bleich et al. [2]; and our proposed models, which utilize a DenseNet121 encoder paired with GRU, LSTM, or Transformer decoders, achieving the highest scores.
Electronics 14 01837 g004
Table 1. List of cardiovascular pathologies and their occurrences in the PTB-XL dataset that were used for training and validation of the ML algorithms.
Cardiovascular PathologyClass ID in DatasetInstancesDescription
Normal ECGNORM7185Normal (non-pathologic)
ST-T changesSTTC1713T-wave abnormalities (non-diagnostic)
Anterior MIAMI1636Anterior myocardial infarction
Inferior MIIMI1272Inferior myocardial infarction
Fascicular blockLAFB/LPFB881Left anterior and posterior fascicular block
Incomplete RBBBIRBBB798Incomplete right bundle branch block
LV hypertrophyLVH733Left ventricular hypertrophy
Complete LBBBCLBBB527Complete left bundle branch block
Nonspecific STNST_478Nonspecific ST-wave changes (non-diagnostic)
Ischemic ST-TISC297Ischemic ST-T-wave changes
AV block_AVB204First-degree, second-degree, and third-degree AV block
Ischemic changesISCI147Changes in inferior and inferolateral leads
WPW syndromeWPW67Wolff–Parkinson–White syndrome
Atrial overloadLAO/LAE49Left atrial overload, left atrial enlargement
Incomplete LBBBILBBB44Incomplete left bundle branch block
Right atrial overloadRAO/RAE33Right atrial overload, right atrial enlargement
Lateral MILMI28Lateral myocardial infarction
Table 2. Comparison of encoder–decoder algorithms that were trained, tested, and validated on the PTB-XL dataset according to the recommended official splits. Stars denote the highest values for each metric. Crosses denote the second highest values. All metrics are reported as percentages.
ModelMETEORBLEU-1BLEU-2BLEU-4ROUGE-1
P R F
BERT LLM [9]24.5127.2126.1235.7129.56
ResNet18+LSTM+Trans./Abbr. [2]55.351.444.3935.3762.459.5758.33
ResNet18+Transformer+Trans./Abbr. [2]55.0150.9543.734.5363.47 59.3958.82
ResNet34+LSTM [2]50.7248.2542.2934.955.5354.9352.29
ResNet34+LSTM+Trans./Abbr. [2]55.5351.6344.5435.2961.4760.6558.33
ResNet34+Transformer [2]51.1147.2141.0632.3957.6452.0453.87
ResNet34+Transformer+Trans./Abbr. [2]5551.4144.7435.6963.2259.58 58.12
ResNet18+GRU [Ours]51.4844.6339.2732.5650.2647.9949.09
ResNet34+GRU [Ours]52.6846.9140.4231.8654.353.5753.93
DenseNet121+LSTM [Ours]69.2 53.51 45.09 41.91 *61.7458.0259.82 
DenseNet121+Transformer [Ours]64.8250.1744.2939.5656.2857.0156.64
DenseNet121+GRU [Ours]72.19 *57.08 *48.33 *40.02 66.23 *62.54 *64.33 *
Stars (*) denote the highest values for each metric. Crosses () denote the second highest values.
Disclaimer/Publisher’s Note: The statements, opinions and data contained in all publications are solely those of the individual author(s) and contributor(s) and not of MDPI and/or the editor(s). MDPI and/or the editor(s) disclaim responsibility for any injury to people or property resulting from any ideas, methods, instructions or products referred to in the content.

