Article

SOH Estimation Model Based on an Ensemble Hierarchical Extreme Learning Machine

1
School of Engineering, King Mongkut’s Institute of Technology Ladkrabang (KMITL), Bangkok 10520, Thailand
2
PEC Technology (Thailand) Co., Bangkok 10230, Thailand
3
School of Mechanical Engineering, Guangxi University, Nanning 530004, China
*
Authors to whom correspondence should be addressed.
Electronics 2025, 14(9), 1832; https://doi.org/10.3390/electronics14091832
Submission received: 5 April 2025 / Revised: 26 April 2025 / Accepted: 28 April 2025 / Published: 29 April 2025

Abstract

:
This paper addresses the challenges of accurately estimating the state of health (SOH) of retired batteries, where factors such as limited historical data, non-linear degradation, and unstable parameters complicate the process. We propose a novel SOH estimation model based on an Integrated Hierarchical Extreme Learning Machine (I-HELM). The model minimizes reliance on historical data and reduces computational complexity by introducing health indicators derived from constant charging time and charging current area. The hierarchical structure of the Extreme Learning Machine (HELM) effectively captures the non-linear relationship between health indicators and battery capacity, improving estimation accuracy and learning efficiency. Additionally, integrating multiple HELM models enhances the stability and robustness of the results, making the approach more reliable across varying operational conditions. The proposed model is validated on experimental datasets collected from two Samsung battery packs, four Samsung single cells, and two Panasonic retired batteries under both constant-current and dynamic conditions. Experimental results demonstrate the superior performance of the model: the maximum error for Samsung battery cells and packs does not exceed 2.2% and 2.6%, respectively, with root mean square errors (RMSEs) below 1%. For Panasonic retired batteries, the maximum error remains under 3%.

1. Introduction

Lithium-ion batteries are widely used in energy storage and power systems due to their high energy density, adaptability, and low self-discharge rates [1]. However, their performance degrades over time due to repeated charge/discharge cycles and complex operating factors, such as temperature fluctuations and high charge/discharge rates. A battery is typically considered retired when its usable capacity drops to 80% or less of its rated capacity, a widely accepted threshold in the industry [2]. Retired lithium-ion batteries often exhibit poor consistency in key parameters such as capacity, internal resistance, and voltage [3], compounded by “capacity fading”—the gradual loss of charge retention—further complicating their management [4]. The retired power batteries still retain a high capacity, and the echelon utilization of retired batteries can extend the life cycle of lithium-ion batteries, which has great environmental benefits and economic value. As a result, accurate estimation of a battery’s state of health (SOH) is critical for ensuring safe and efficient reuse, minimizing safety hazards, and improving overall system performance [5].
Accurate SOH estimation for retired lithium-ion batteries poses unique challenges, primarily due to scarce historical data, irregular degradation behavior, and non-linear capacity decay. Although various SOH estimation techniques have been developed for electric vehicle (EV) batteries, they typically rely on extensive, well-annotated datasets and consistent usage histories—assumptions seldom valid for retired battery systems. Prior research has predominantly employed single-model architectures coupled with intricate parameter identification procedures, thereby restricting their effectiveness in data-limited and uncertainty-prone retired battery scenarios [6]. This study aims to address this critical gap by proposing a novel Integrated Hierarchical Extreme Learning Machine (I-HELM) model for accurate SOH estimation in retired batteries. By combining data-efficient health indicators with ensemble learning, the proposed approach improves estimation accuracy, enhances robustness against degradation variability, and reduces reliance on historical usage data. The key contributions of this paper are as follows:
(1)
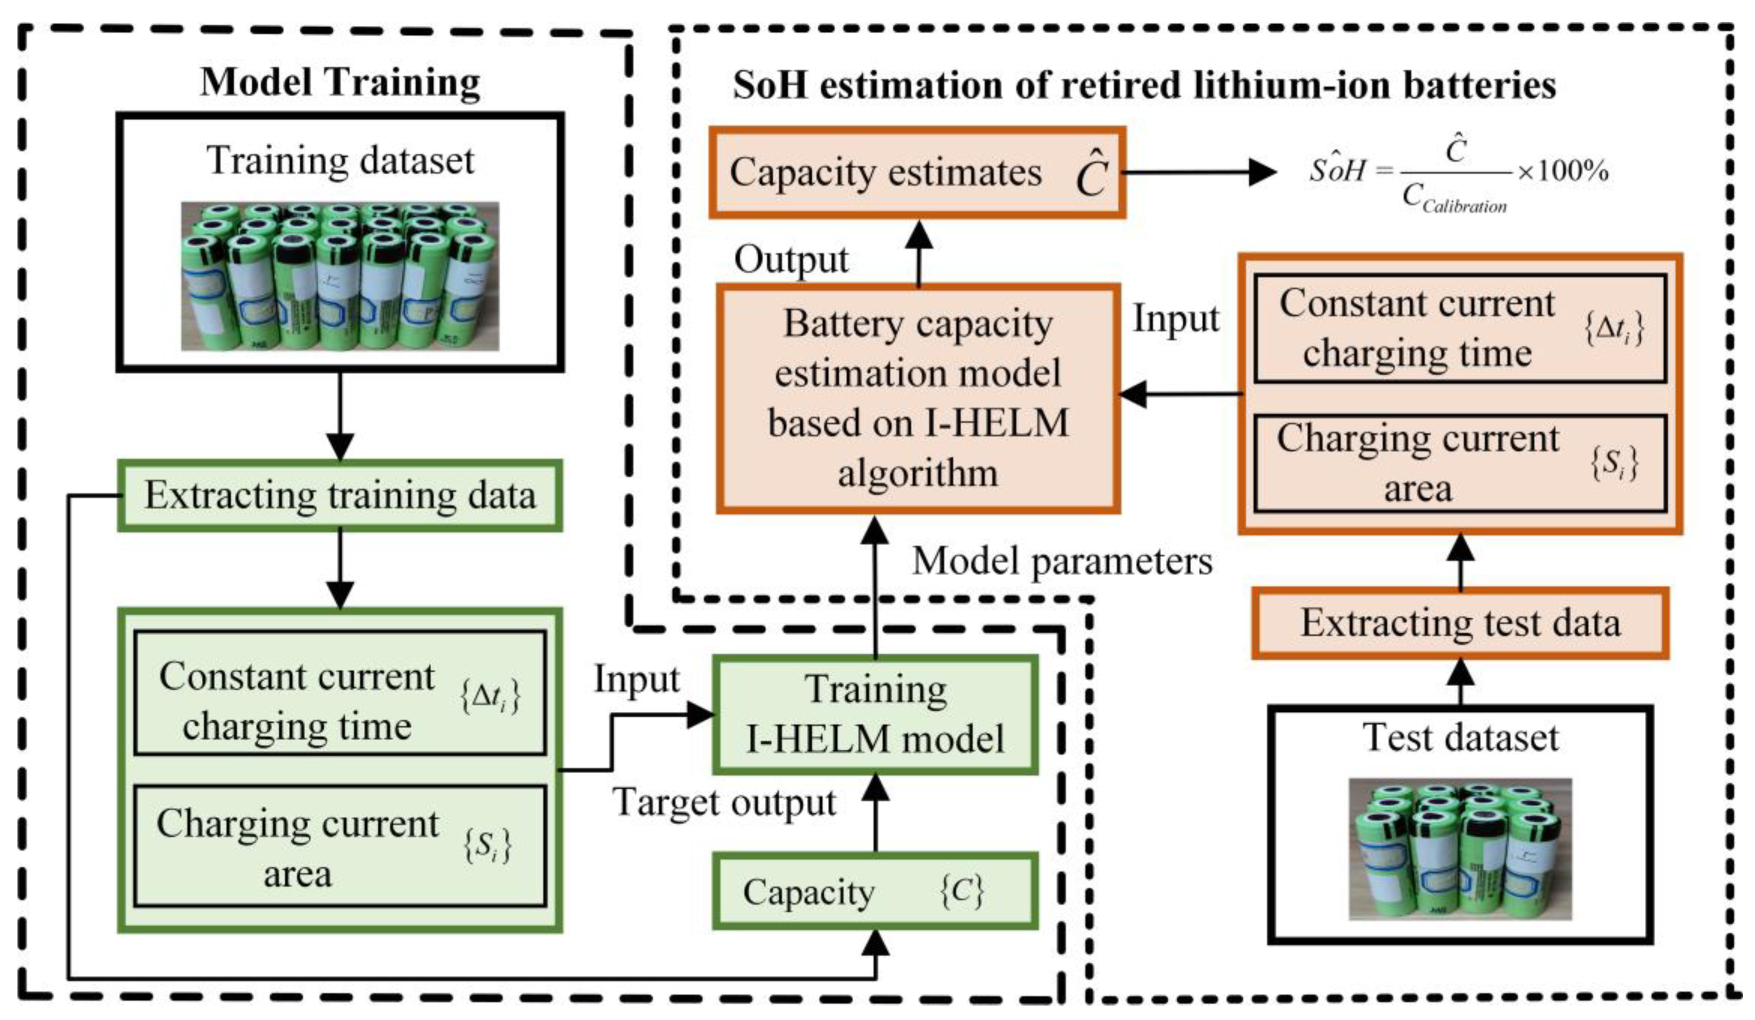
Innovative Health Indicator System: We propose a new feature extraction framework based on constant-current charging time and charging current area. This reduces the need for extensive historical data while enhancing the model’s ability to capture complex degradation dynamics.
(2)
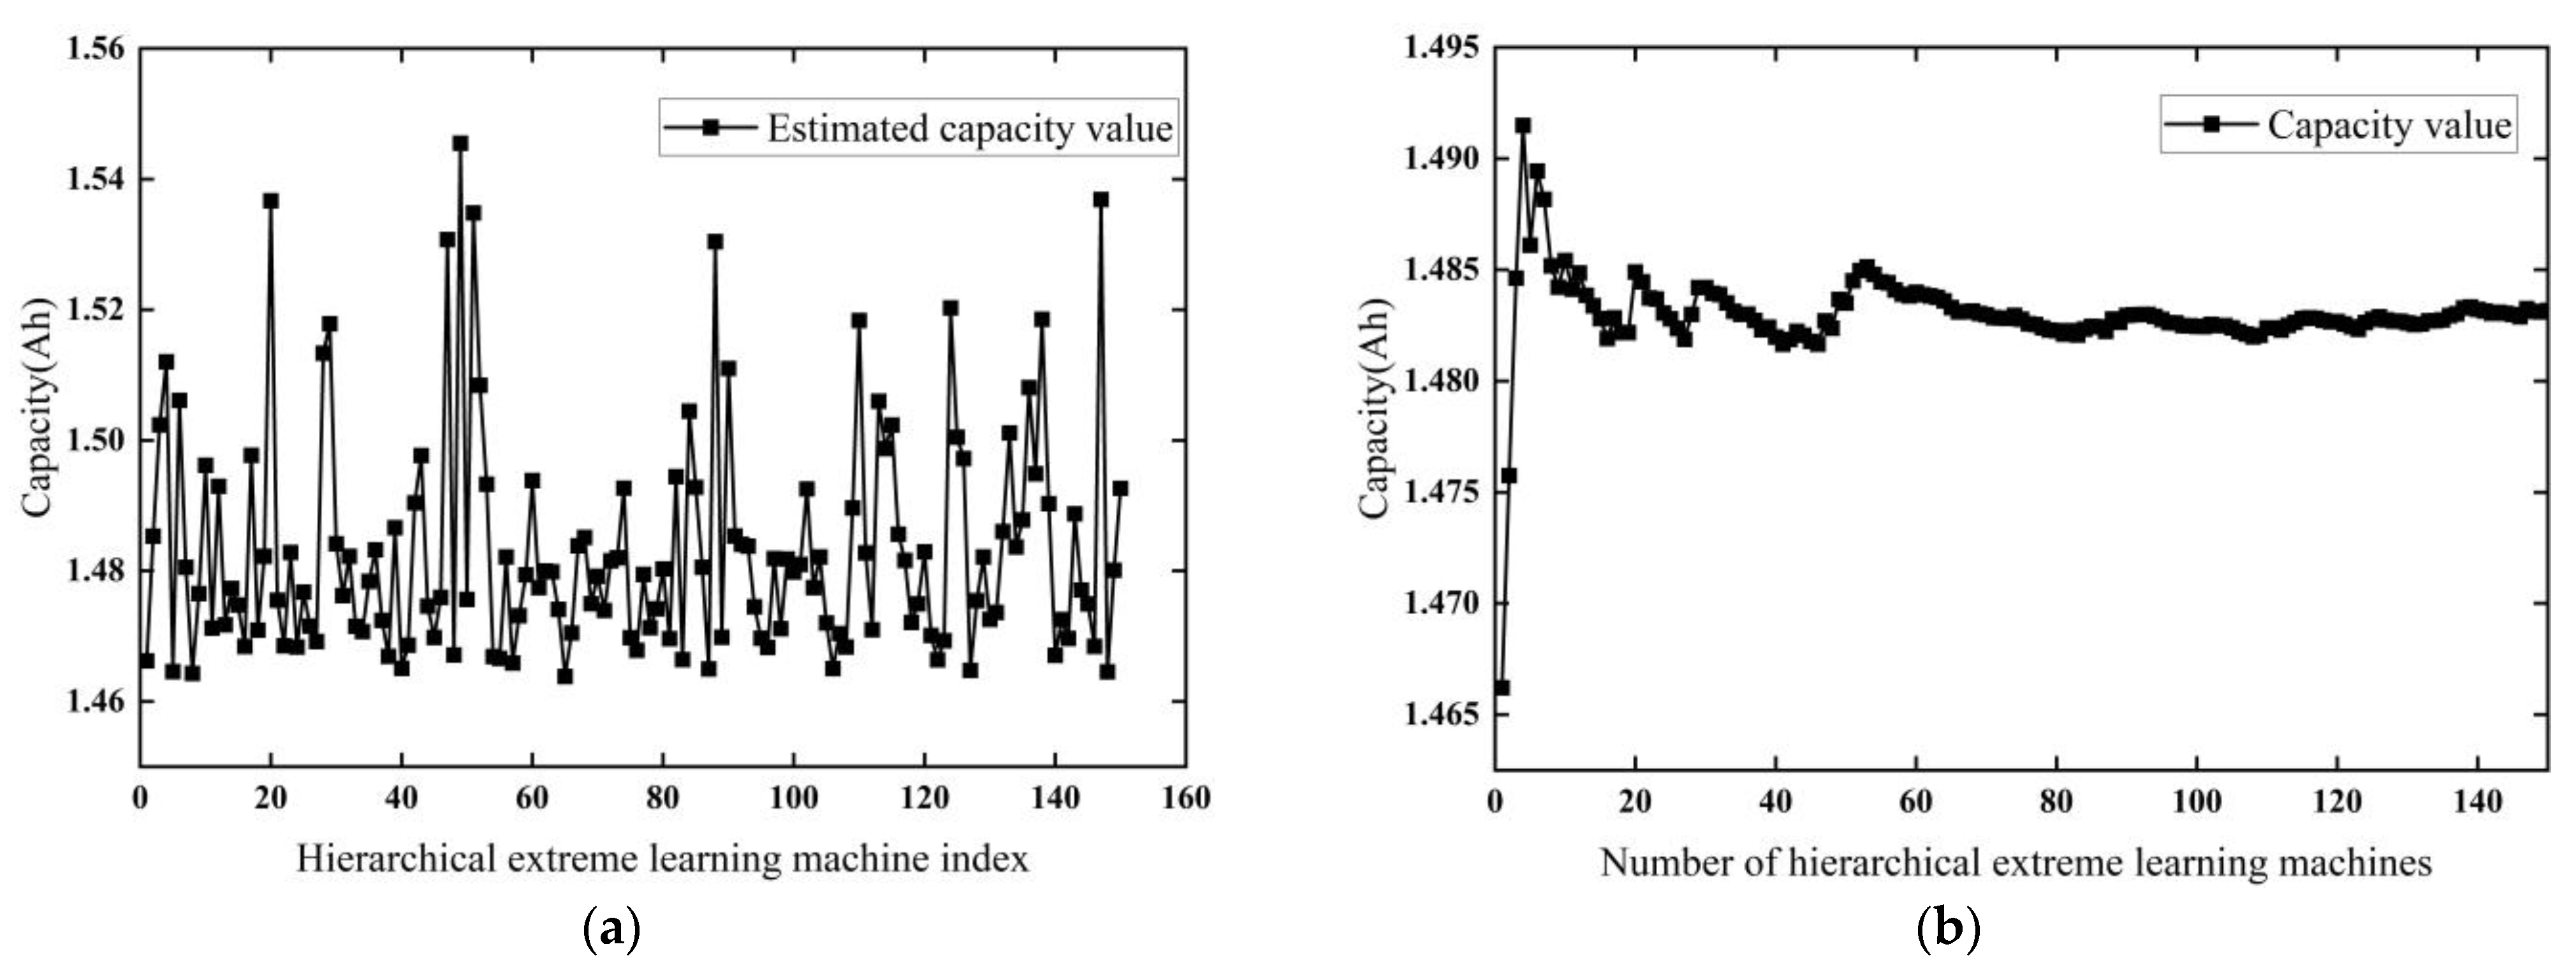
Ensemble I-HELM Model for Robustness: We introduce an ensemble of 80 HELM sub-models that reduces the volatility associated with single-model predictions. This ensemble structure improves the model’s robustness and accuracy in scenarios with inconsistent battery degradation.
(3)
Practical Applicability for Battery Reuse: Our model is specifically designed to support battery reuse industries, with applications in energy storage system optimization and second-life battery management, enabling cost reduction and more informed decision-making for battery repurposing.
This paper comprises six sections. Section 1 introduces the study’s background, motivation, and contributions. Section 2 reviews SOH estimation methods and identifies research gaps. Section 3 presents the proposed I-HELM-based estimation model. Section 4 details the experimental setup, including devices, battery selection, testing protocols, and data preprocessing. Section 5 analyzes results under varying conditions. Section 6 concludes the study and suggests future research directions.

2. Related Work

Currently, numerous researchers worldwide have conducted extensive and in-depth studies on the accurate estimation of battery SOH. Existing estimation methods can be broadly categorized into three approaches: experimental-based methods [7], model-based methods [8], and data-driven methods [9]. Each approach offers unique advantages and faces specific challenges in accurately capturing battery degradation behaviors under diverse operating conditions.
The experimental method estimates battery SOH by directly measuring SOH-related parameters—such as impedance, internal resistance, and cycle index—and calculating SOH using the ampere-hour integration method [10]. Mamadou et al. [11] developed a feature mapping technique that correlates discharge power characteristics with residual energy to estimate the state of energy (SoE). Barai et al. [12] proposed a power integration methodology for battery SoE estimation, demonstrating effectiveness in reducing computational time. However, the open-loop nature of this method introduces inherent susceptibility to cumulative errors, which may be exacerbated by the presence of uncertain noise disturbances. Qi et al. [13] developed a battery capacity estimation model using long-term charge/discharge data from electric buses, combining the ampere-hour integration method with least squares fitting to calculate the battery SOH at each charge/discharge cycle stage. In addition, since battery SOH is directly influenced by internal resistance, its variation can be assessed through changes in internal resistance. Rodriguez-Cea et al. [14] proposed a method for estimating the SOH of lithium-ion batteries based on data from the constant voltage charge phase, using experimentally obtained battery parameters to estimate internal resistance and capacity. The diagnostic results demonstrated a resistance-based SOH deviation of 2–5% from empirical reference values. Electrochemical impedance spectroscopy is a non-invasive, information-rich testing technique used for battery SOH estimation [15,16]. Wei et al. [17] proposed an integrated SOC–SOH estimation framework that combines an Autoregressive Equivalent Circuit Model (AR-ECM) with data-driven fusion, leveraging multi-strategy optimized HKELM and sliding-window-based feature selection. The method achieved SOH estimation errors below 1% and SOC deviations under 2% on public datasets. These methods provide accurate and interpretable insights into battery degradation but are often limited by the need for extensive laboratory testing and the complexity of parameter identification.
To overcome the limitations of direct experimental methods, some scholars advocate model-based methods. Model-based methods treat battery aging as a physical or empirical process, often based on electrochemical reactions or empirical observations, and develop mathematical models to describe these degradation mechanisms [18,19]. Yang et al. [20] proposed a fuzzy adaptive cubature Kalman filter (FACKF) integrating dual controllers and VFF-RLS parameter identification, resulting in a 52.17% improvement in SOC convergence speed and a 24.59% reduction in SOE maximum error under complex conditions. Building upon this, Liu et al. [21] introduced an adaptive fuzzy control-based RLS method combined with an adaptive extended Kalman filter, achieving an SoE estimation error of less than 1% under varying thermal conditions. Xu et al. [22] developed a fractional-order battery model combined with multi-scale dual extended Kalman filters, achieving 34.8–43.1% higher SOH estimation accuracy under dynamic currents. However, this method requires precise fractional-order modeling and complex parameter calibration. Gao et al. [23] improved real-time SOH tracking by integrating a simplified pseudo-2D electrochemical model with dual non-linear filters. Their system quantifies aging effects like lithium inventory loss and resistance growth, enabling lifespan-wide estimation accuracy. The framework achieved RMSEs below 0.5% for both SOC and SOH and demonstrated robustness across a 71–100% SOH range in lifespan experiments. Li et al. [24] proposed a multi-objective retired battery PV sizing framework for EVCS using NSGA-II, minimizing renewable waste, grid purchases, and 20-year NPV costs. Chen et al. [6] developed a degradation model using an Extreme Learning Machine (ELM), which maps degradation characteristics to battery performance dynamics, enabling cross-type SOH estimation with a maximum error of ≤1.93%. Wang et al. [25] proposed a health feature-driven SOH estimator for retired batteries, integrating resistive remaining capacity and internal resistance-capacity cross-validation, and achieved SOH estimation errors below 6% across 11 tested batteries. Building upon these foundational approaches, Cai et al. [26] employed Gaussian process regression to develop a health state estimation model that captures both local and global degradation trends, achieving RMSE and MAE below 2%, and MAPE around 3%, under both static and dynamic conditions.
The data-driven approach utilizes historical battery operation data to train machine learning models for SOH estimation. Data-driven approaches based on deep learning have several advantages, including low cost, wide applicability, and no need to understand complex electrochemical mechanisms [27]. Long short-term memory (LSTM) networks [28] have proven particularly effective in predicting battery degradation, as they can capture temporal dependencies and model the complex, time-varying degradation patterns under varying operating conditions [29,30]. Deng et al. [31] proposed a degradation pattern recognition and transfer learning framework for SOH estimation, leveraging LSTM networks and four discharge capacity features, and achieved a mean MAE/RMSE of 0.94%/1.13% across 124 cells. Lin et al. [32] incorporated ECM-derived internal resistance and thermoelectric coupling features into an ant colony-optimized EBM model, enabling SOH estimation with MAE below 1% on the Oxford dataset via electrochemical data fusion. Zhang et al. [33] developed a Bayesian deep neural network enhanced by Gramian angular field-based degradation features for few-shot SOH estimation. Lin et al. [34] introduced a random forest regression model that uses constant-current charging time as a key feature for accurate SOH estimation, achieving an average RMSE of 0.52% and a 41.6% accuracy improvement over ICA-based methods. ELM [35], a shallow neural network known for its fast convergence and acceptable accuracy, has also been successfully applied to SOH estimation due to its simplicity and efficiency in handling large datasets. Wu et al. [36] proposed a BiLSTM-SA framework that integrates bidirectional LSTM and self-attention mechanisms, addresses parameter coupling via sequential feature fusion, and achieves SOC estimation with an MAE of 0.84% and an RMSE of 1.20%. Chen et al. [37] integrate a Transformer-GRU parallel architecture with CEEMDAN-based IC curve reconstruction, reducing noise sensitivity while improving cross-dataset generalization. Their hybrid model achieves 0.0071 RMSE (61.4% accuracy gain over baselines), yet demands extensive labeled data and intricate architecture optimization.
While experimental methods are exact in estimating SOH, they rely on complex instruments and controlled testing environments, making them impractical for real-time or online applications in dynamic settings. While effective in certain contexts, model-based approaches often face limitations related to their complexity, computational demands, and limited robustness under varying operational conditions. These methods may struggle to adapt dynamically to real-time data, which is crucial for online applications. Traditional data-driven methods, such as Backpropagation Neural Networks (BPNNs) and Support Vector Machines (SVMs), also face challenges. They often struggle with the non-linear degradation patterns and unstable parameters exhibited by retired batteries, making them less suitable for the complex, real-world conditions encountered in energy storage systems.

3. SOH Estimation Model for Retired Lithium-Ion Batteries Based on I-HELM

To address the limitations identified in the previous sections—such as reliance on large-scale historical data, low interpretability, and vulnerability to inconsistent degradation patterns—we develop a novel I-HELM model for SOH estimation of retired lithium-ion batteries.

3.1. Hierarchical Extreme Learning Machine

Extreme Learning Machine (ELM) is a single-hidden-layer feedforward neural network known for its fast learning speed and strong non-linear approximation capability [38]. Unlike traditional backpropagation-based networks, ELM randomly generates input weights and analytically determines output weights, making it highly efficient for large-scale regression and classification tasks.
HELM extends ELM by stacking multiple sparse ELM autoencoders in a hierarchical structure, enabling unsupervised feature extraction in the early layers and supervised learning in the final output layer [39]. This two-phase architecture allows HELM to learn multi-level representations without the need for iterative fine-tuning. Each hidden layer in HELM acts as an independent module for extracting compact and discriminative features. Once the parameters of a layer are fixed, the extracted features are passed forward, enhancing robustness and reducing overfitting. Cross-layer representations also improve invariance to spatial transformations, making HELM suitable for handling complex, non-linear data [40].
In this study, we build upon the HELM framework and propose an Integrated HELM (I-HELM) model. By introducing novel health indicators and an ensemble structure, our approach enhances estimation stability and adapts more effectively to the data-scarce, heterogeneous conditions commonly seen in retired battery systems.

3.2. I-HELM Algorithm Framework

The structure of the I-HELM algorithm is shown in Figure 1. The I-HELM algorithm consists of N individual HELM models operating independently, processing input data, and generating output. All N models are trained simultaneously using the training data. During the testing phase, the trained models process the test data, and their outputs are combined through an integration strategy to generate the final output of the I-HELM model.
The SOH estimation model based on I-HELM is divided into two phases, training and testing, as shown in Figure 2. Each HELM sub-model adopts a three-layer sparse autoencoder architecture with the following key hyperparameters: the number of neurons per layer is set to N1 = 200, N2 = 200, and N3 = 3000; the regularization coefficient is fixed at C = 2 7 ; and the scaling factor is set to s = 100. Aging data for retired lithium-ion batteries are collected over 100 charge/discharge cycles in the experimental setup. The first 70 cycles are used for training, while the remaining 30 cycles are reserved for testing. Two health indicators—constant-current charge time and charge current area—are extracted from the training data and each cycle’s capacity. These indicators serve as inputs to the I-HELM model, with the capacity as the target output during training. During the testing phase, each cycle’s constant-current charge time and charge current area are extracted from the test data and input into the trained I-HELM model. The model then outputs the estimated capacity, which calculates the current cycle’s SOH.
The steps for estimating the SOH of retired lithium-ion batteries under energy storage conditions using the I-HELM model are as follows:
Step 1: Training the I-HELM Model. Data are collected from the experimental setup’s first 70 cycles under energy storage conditions for the retired lithium-ion batteries. From these data, two features—constant-current charge time Δ t i and charge current area S i —are extracted, forming the input feature sequence Δ t i 1 , Δ t i 2 , Δ t i 3 , , Δ t i 70 and S i 1 , S i 2 , S i 3 , , S i 70 . The capacity data for each of these 70 cycles is also extracted, creating the capacity sequence C 1 , C 2 , C 3 , , C 70 . The extracted features, including constant-current charge time and charge current area, are input into the HELM models, while the corresponding capacity sequence serves as the output. These data are used to train N individual HELM models.
Step 2: Estimating the Capacity using the I-HELM Model. In the second step, data from the remaining 30 cycles are collected. Features such as constant-current charge time Δ t i and charge current area S i are extracted from each cycle’s data and input into the trained I-HELM model. The model then outputs the estimated capacity C ^ 1 , C ^ 2 , C ^ 3 , , C ^ n , which is used to calculate the SOH for each cycle. The final capacity estimate C ^ is obtained by averaging the N output values:
C ^ = 1 n C ^ j n
where C ^ j represents the capacity estimation value from the j-th HELM output.
Step 3: Calculate SOH. The SOH is calculated based on its definition:
S o ^ H = C ^ C C a l . × 100 %
where S o ^ H represents the estimated health state for the current cycle, C C a l . denotes the nominal capacity of the retired battery, and C ^ represents the estimated capacity for the current cycle.

4. Experimental Design

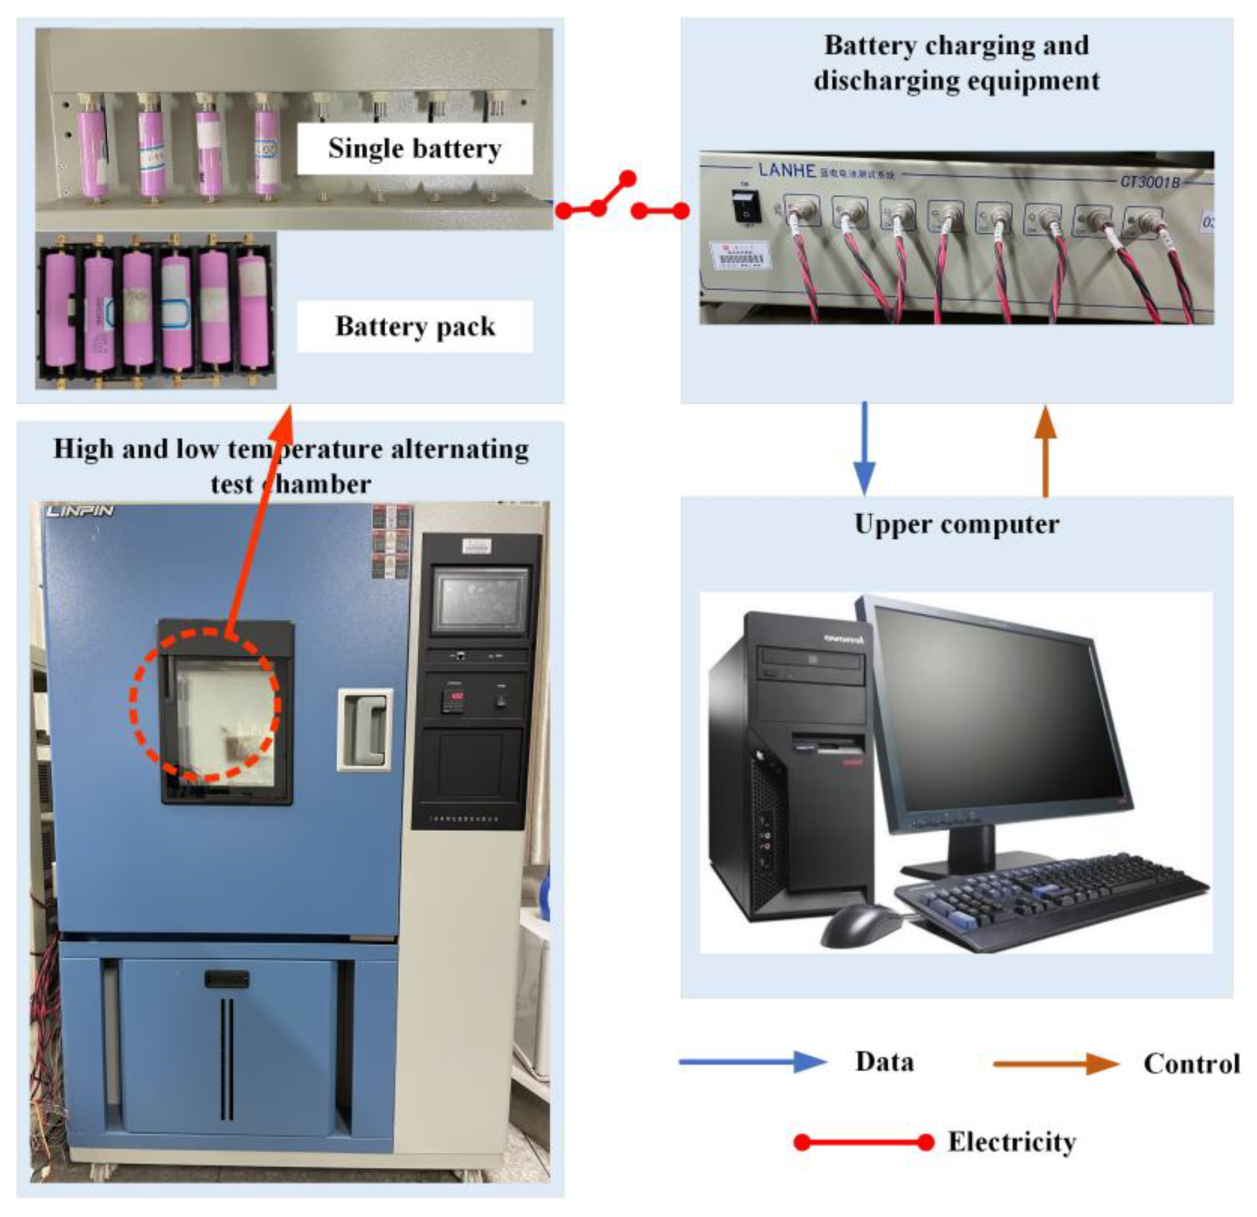
4.1. Experimental Setup and Equipment

To replicate the aging process of retired batteries under real-world operating conditions, we developed an experimental platform that simulates charge/discharge cycles at varying operating states. The platform, shown in Figure 3, consists of three main components:
(1)
A temperature cycling chamber for controlling environmental temperature from −20 °C to 50 °C.
(2)
Multi-channel battery charge/discharge equipment with a voltage range of 0–100 V, current range of 0–50 A, and maximum power ratings of 3000 W for charging and 5000 W for discharging.
(3)
A computer control system, responsible for programming charge/discharge cycles, real-time monitoring, and storing experimental data.
Figure 3. Experimental platform construction structure.
Electronics 14 01832 g003
To investigate the aging characteristics of retired batteries with different cathode materials, this study focuses on two types of cells: 139 Samsung ICR18650-26F cells (D1–D139) and 36 Panasonic NCR18650BD cells (R1–R36) initially collected for analysis. After preliminary screening for data completeness and stability—removing cells with missing voltage/current records, abnormal measurement noise, or severe degradation—131 Samsung cells and 34 Panasonic cells were retained for further analysis and experimental testing. The specifications for these two types of batteries are detailed in Table 1.
To investigate the aging characteristics of retired battery packs under different operating conditions (Condition 1 and Condition 2), the Adaptive Fuzzy C-Means (AFCM) algorithm [42] was used to cluster 131 retired Samsung batteries. The clustering was based on key operational features, including initial capacity, charge/discharge curve features, and SOH trends, which allowed us to identify batteries with similar degradation trajectories. Based on the clustering results, two battery packs were formed: Pack 1 (D6, D7, D32, D39, D85, D98) was tested under constant-current Condition 1, and Pack 2 (D24, D49, D58, D61, D79, D84) was tested under dynamic Condition 2. For additional testing, batteries D22 and D123 were selected from the remaining Samsung retired batteries for Condition 1, while D23 and D26 were chosen for Condition 2. From the Panasonic retired batteries, R2 was selected for Condition 1 testing and R19 for Condition 2 testing.

4.2. Battery Health Indicator Analysis

(1)
Capacity value. A battery’s SOH is typically defined by Equation (2). In this study, the SOH estimation is directly characterized by capacity, which serves as a key indicator of battery degradation.
(2)
Constant-current charging time feature extraction. Constant-current charging time refers to the duration it takes for a retired battery to charge under constant-current mode, from the start of charging until the voltage reaches the cut-off voltage. The method for extracting the constant-current charging time is described in Equation (3).
Δ t i = t I e n d t 0
where Δ t i represents the constant-current charging time during the aging test under energy storage conditions, t I e n d denotes the moment when the charging reaches the cut-off voltage (i.e., the end of the constant-current charging), and t 0 represents the start time of the constant-current charging. All units are in seconds (s).
(3)
Charging current area feature extraction. Charging current area refers to the area under the current curve during the entire charging process of the retired battery in an energy storage system. The method for extracting this feature is given by Equation (4).
S i = t 0 t e n d I t d t
where S i represents the charging current area, t 0 denotes the moment when the charging process begins, t e n d represents the moment when the entire charging process ends, and I ( t ) represents the current at time t .

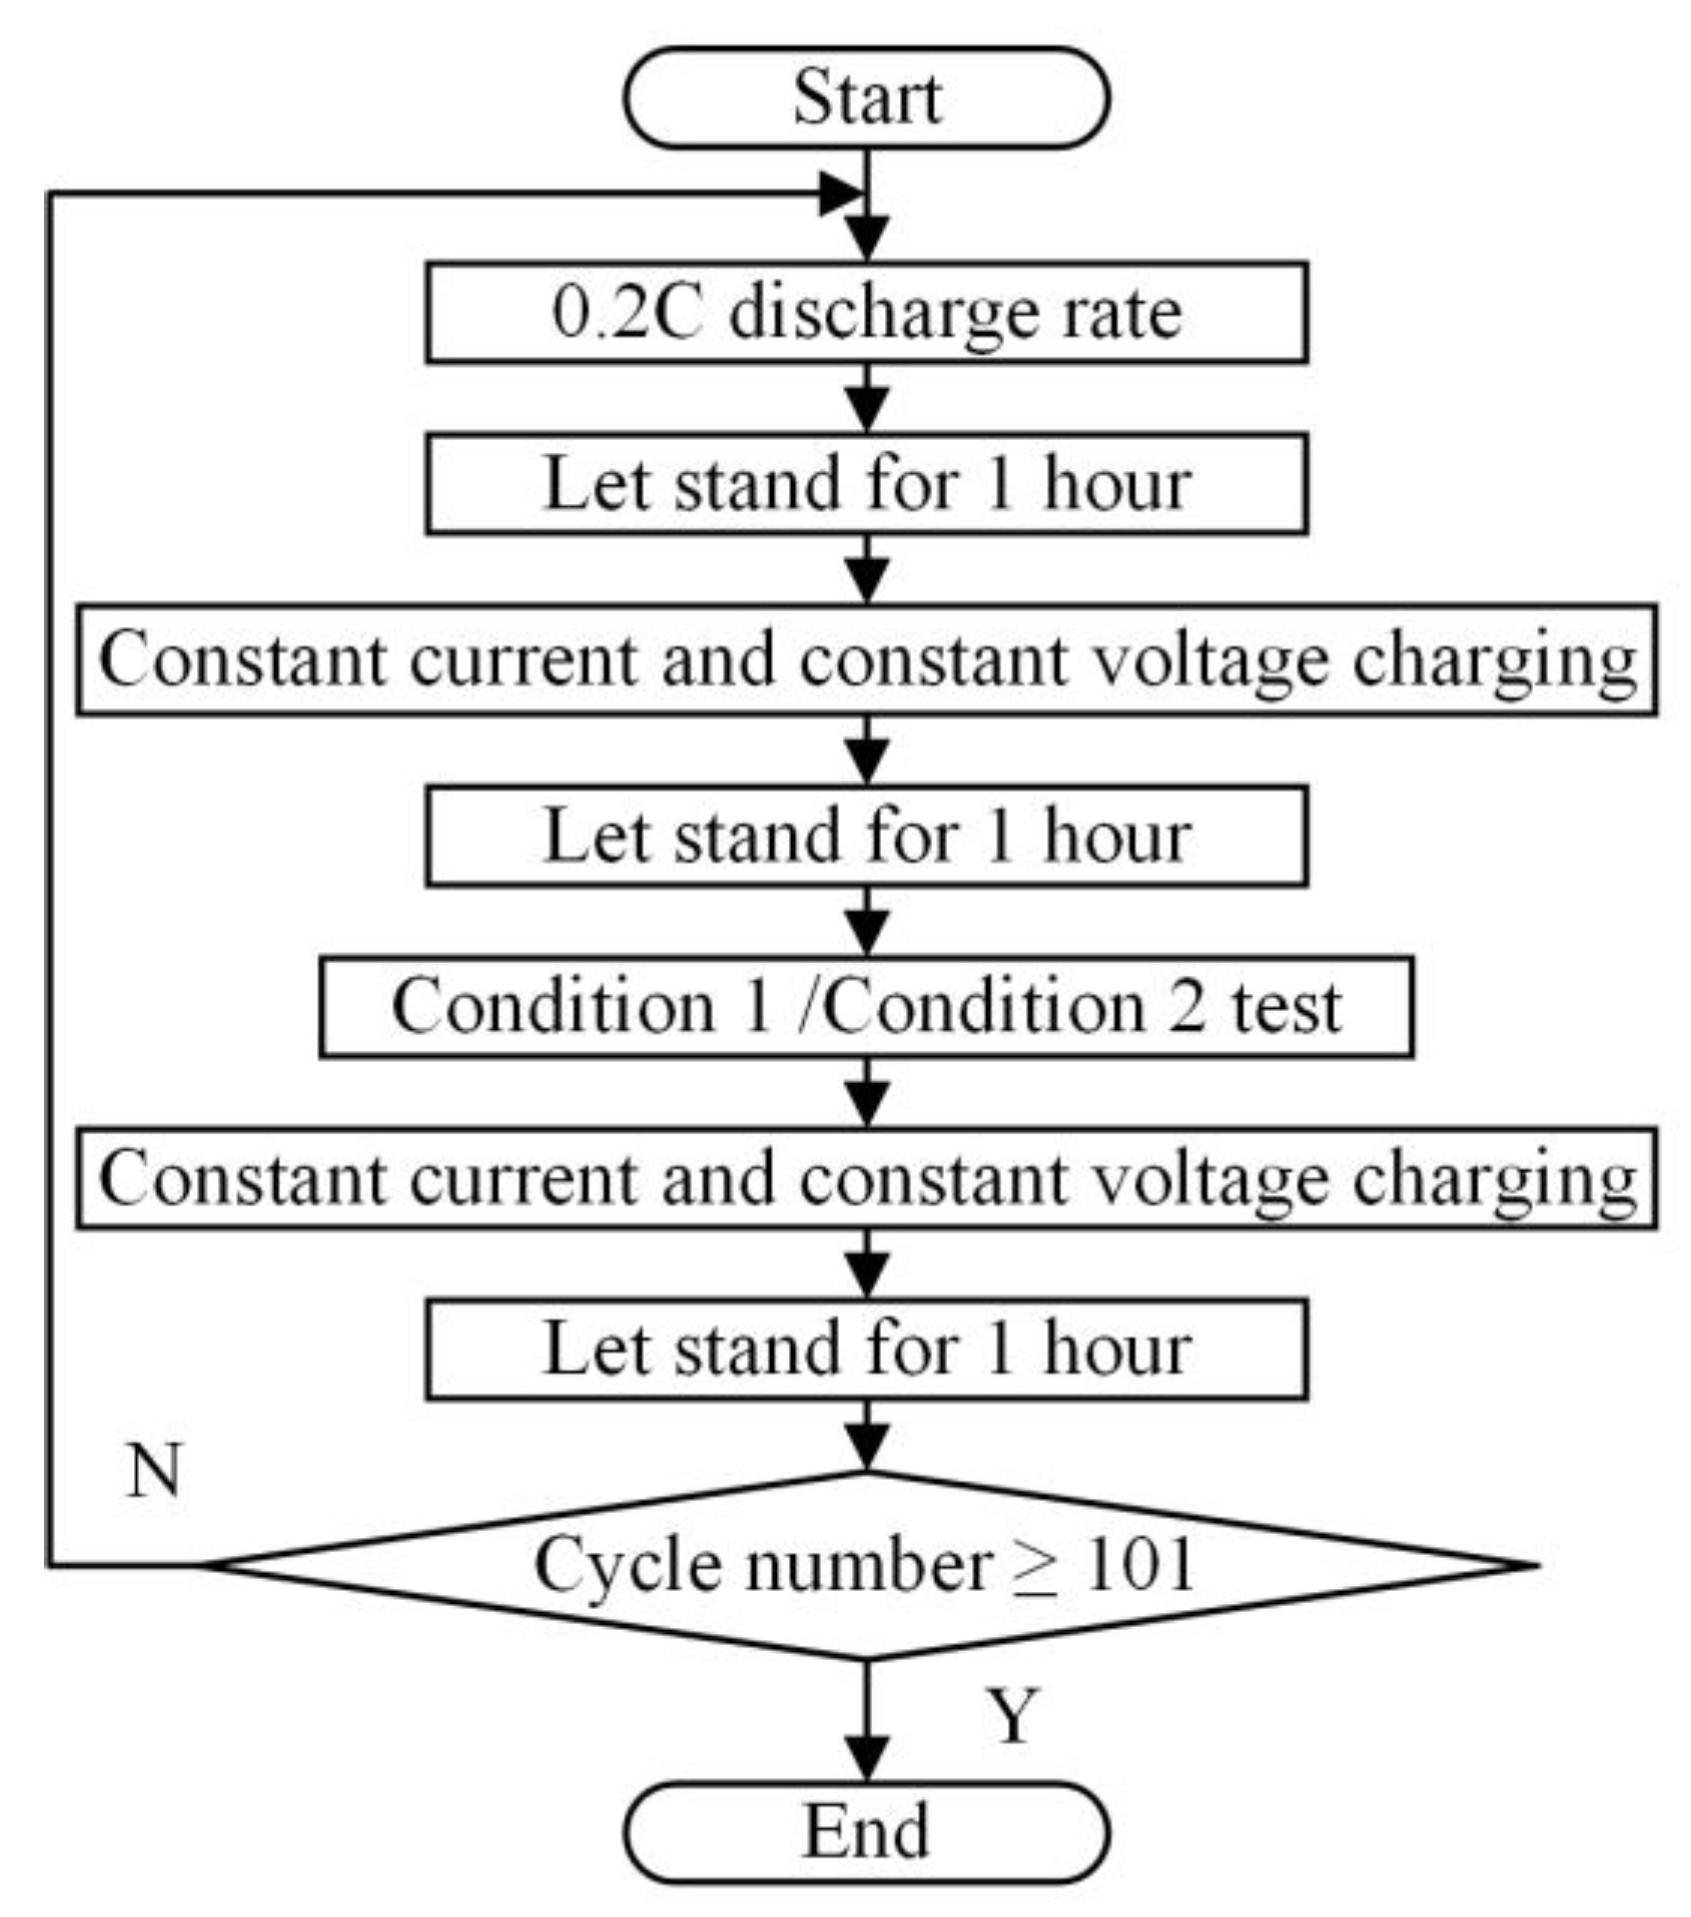
4.3. Experimental Procedure

Retired battery packs typically exhibit relatively stable charging and discharging current characteristics over a specific period. To accurately simulate the operating conditions of a home energy storage system, this study designed two typical operating conditions for further research on retired lithium-ion batteries.
Discharge Condition 1: Constant-Current Discharge. This condition applies a constant-current discharge at a 0.5 C rate, simulating battery behavior under a constant load.
Discharge Condition 2: Dynamic-Current Discharge. This condition uses varying discharge currents (0.2 C, 0.5 C, 1 C, 0.75 C, and 0.2 C) [43], each lasting 5 min, simulating battery discharge under changing load conditions.
An aging database was established to investigate the aging characteristics of retired battery packs and individual cells with different cathode materials. This database records the state parameter changes in retired batteries during energy storage operations. The aging experiments were conducted at room temperature (24 °C), and the aging test processes under constant- and dynamic-current conditions are illustrated in Figure 4. The detailed steps for cycling aging experiments are as follows:
(1)
Temperature setting and initial discharge. The temperature in the high/low-temperature test chamber was set to 24 °C. The batteries were discharged at a 0.2 C rate until reaching the cut-off voltage (2.75 V for Samsung cells, 2.5 V for Panasonic cells, and 16.5 V for battery packs). After discharge, the batteries rested for 1 h.
(2)
Energy storage condition testing. First, the batteries were charged at a 0.5 C rate until reaching the full charge voltage (4.2 V for cells, 25.2 V for packs). They then underwent constant voltage charging until the cut-off current (168 mA for Panasonic cells, 130 mA for Samsung cells and packs), followed by 1 h of rest. Next, the batteries were discharged under the corresponding energy storage condition (Condition 1 or Condition 2) to the cut-off discharge voltage and rested for 1 h. Finally, the batteries were charged again under constant current and voltage, followed by 1 h of rest.
(3)
Capacity testing. The batteries were discharged as described in Step 1, and discharge capacity data were recorded.
(4)
Repetition. Steps (1) through (3) were repeated until 101 cycles were completed under each condition.
Figure 4. Energy storage condition aging test process.
Electronics 14 01832 g004

5. Results and Discussions

5.1. Analysis of I-HELM Model Integration

To assess the stability of the individual HELM capacity estimation results, 150 HELMs were used to estimate the capacity of battery D26 during the 80th cycle. Battery type: Samsung ICR18650-26F battery (marked as D26). Test conditions: Obtained under constant-current discharge conditions (Condition 1). The results are shown in Figure 5a.
The estimation results from individual HELMs fluctuate significantly, with the maximum and minimum values differing by up to 0.09 Ah, as shown in Figure 5a. This instability can be attributed to two main factors: First, as the battery degrades, the charge and discharge processes become unstable, causing the health indicators derived from the charge/discharge curves to reflect the battery’s aging state inaccurately. Second, the battery’s aging process is non-linear, with more pronounced differences between later and earlier stages. This non-linearity causes individual HELMs to overfit during training and estimation, leading to inaccurate predictions of capacity degradation in later cycles.
To determine the optimal number of HELMs for the I-HELM model, various numbers of HELMs were tested for capacity estimation of battery D26. As shown in Figure 5b, the estimation results gradually stabilized as the number of HELMs increased. When 80 HELMs were used, the capacity estimation no longer exhibited significant fluctuations, indicating that an I-HELM model with 80 or more HELMs provides stable capacity estimations. Based on these results, the integration degree N of the I-HELM model was set to 80 to ensure stable capacity estimations.

5.2. SOH Estimation of Different Retired Lithium-Ion Batteries

To evaluate the performance and accuracy of the proposed I-HELM algorithm, this study applied it to estimate the SOH of different retired lithium-ion batteries. The tested batteries included individual Samsung retired cells, Samsung retired battery packs, and individual Panasonic retired cells. The estimation results were analyzed for errors.

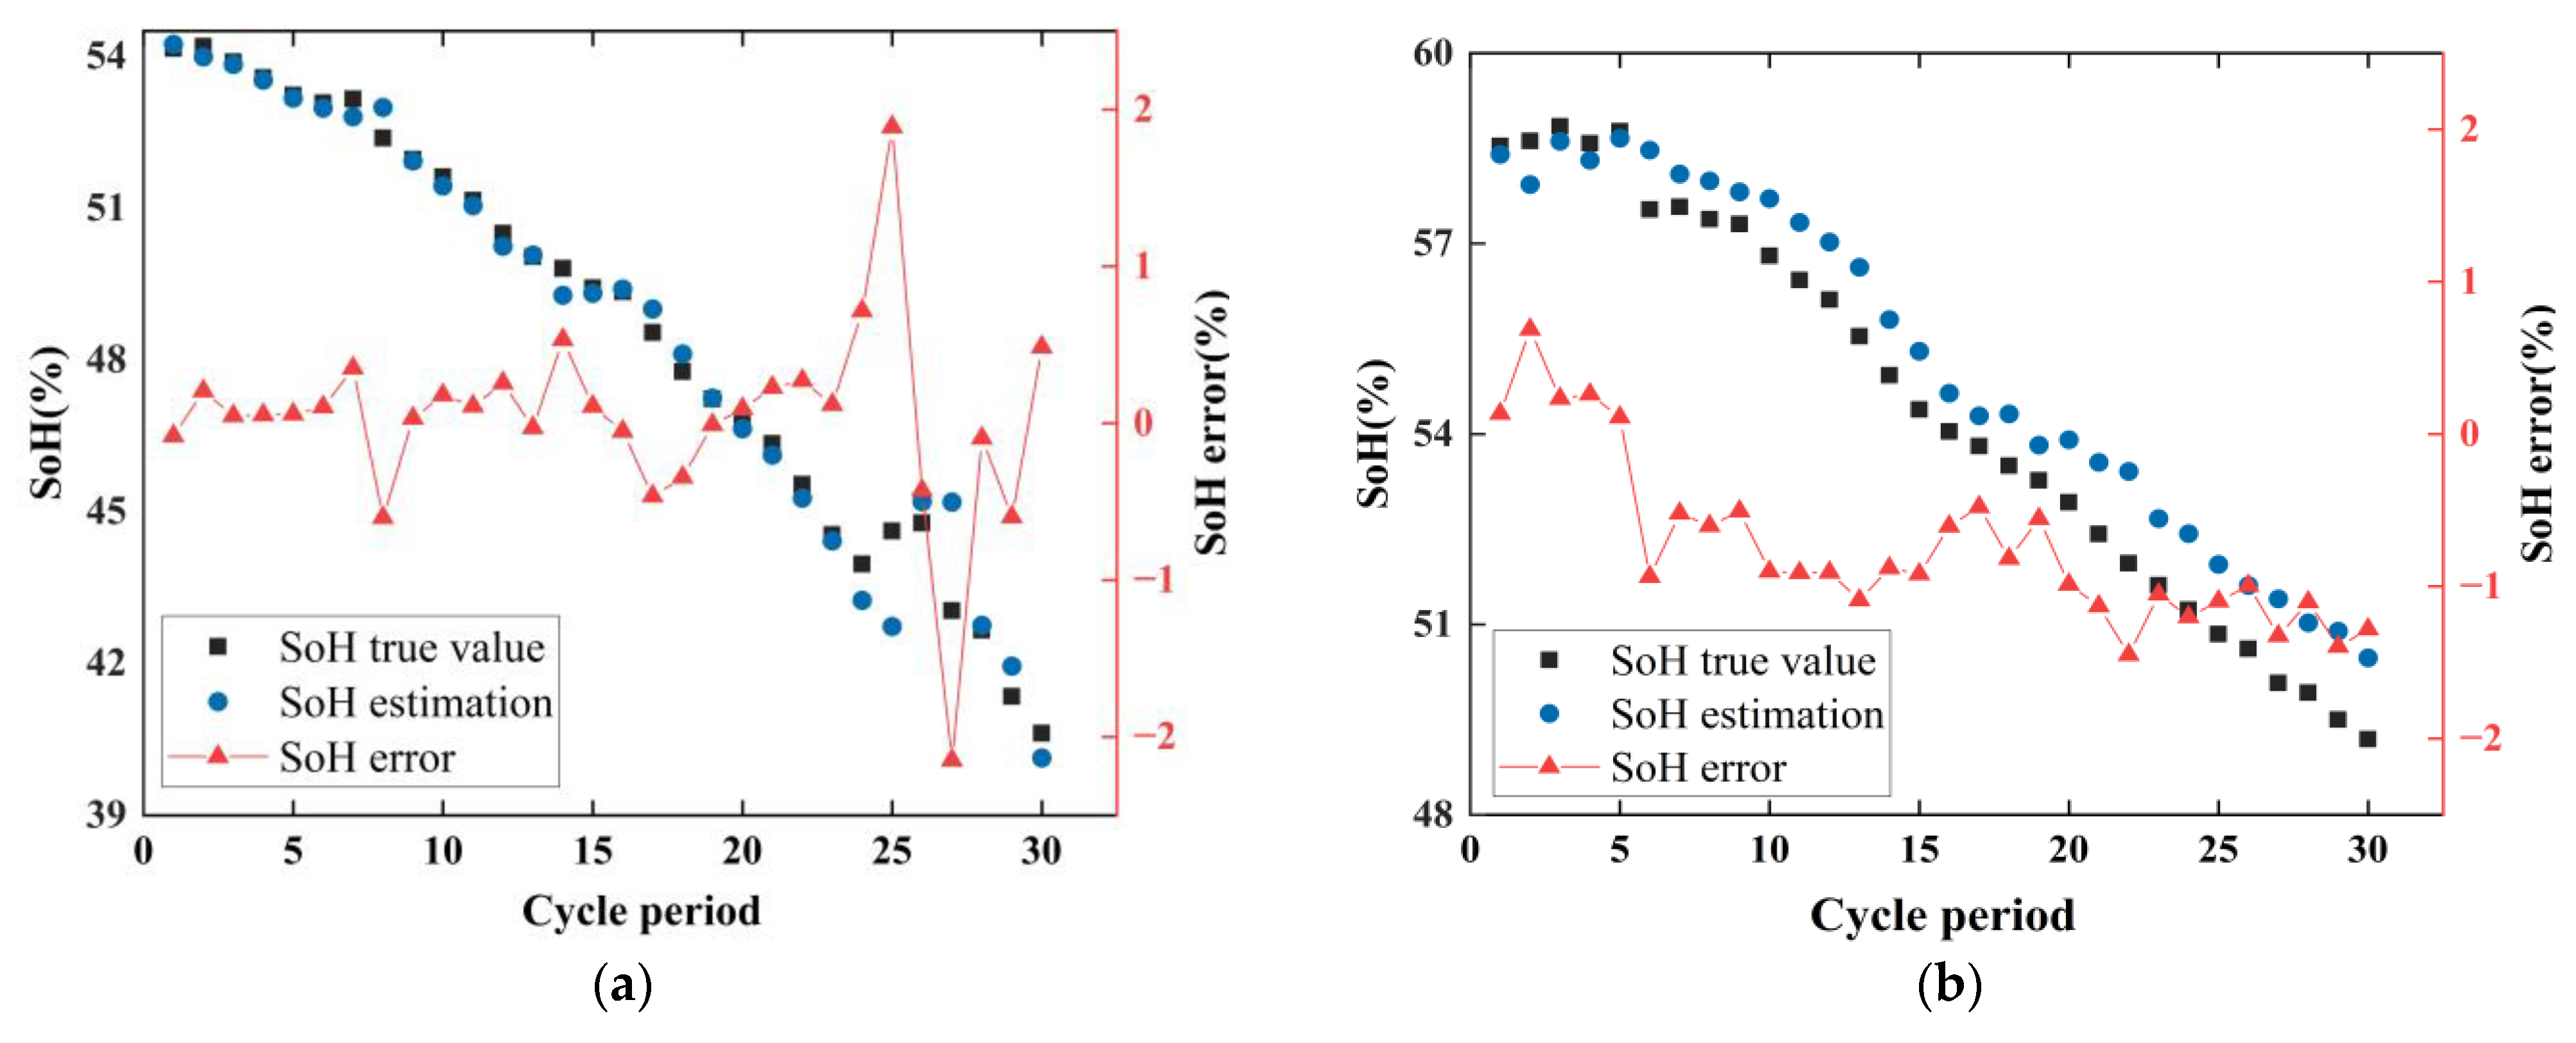
5.2.1. SOH Estimation of Samsung Retired Individual Cells

To evaluate the model’s estimation performance under constant-current conditions, we applied the I-HELM algorithm to Samsung retired batteries D22 and D26. The detailed SOH prediction results for these two cells are shown in Figure 6, where the estimated values are compared with the experimental data to assess accuracy.
Figure 6a shows that the SOH estimated by I-HELM closely matches the actual degradation curve, with overall estimation errors remaining small. Although the capacity of the D22 cell fluctuates significantly in the later stages of aging, leading to more significant estimation errors in some cycles, the maximum error remains around 2%. This indicates that the I-HELM algorithm can effectively track the SOH degradation trend of retired batteries. Figure 6b shows the estimation results for the D26 cell, where a rapid SOH decline is observed during the sixth cycle, followed by stabilization. The estimated SOH aligns closely with the actual values during the first five cycles. Despite a slight overestimation in later cycles, the error remains below 2%, further validating the effectiveness of I-HELM in predicting the SOH decline.
In addition, we tested the I-HELM model under dynamic load conditions using Samsung batteries D23 and D123. As illustrated in Figure 7, the model’s ability to track the degradation trend in Condition 2 is further validated, with attention to its generalization capability under non-constant-current operation.
Figure 7a presents the SOH estimation for the D23 cell. During the mid-life stage, the actual SOH shows considerable fluctuations, but the I-HELM algorithm still tracks these changes effectively, with estimation errors remaining below 3%. During periods of more stable SOH changes, the estimates become even more accurate. Figure 7b shows the SOH estimation for the D123 cell, where the estimated SOH is consistent with the actual values in the early and late stages, with minor errors. However, during the middle stage, the estimated SOH deviates slightly, with a maximum error of about 3%. Nevertheless, the I-HELM algorithm successfully tracked the degradation process of the D123 cell.
The experimental results demonstrate that the I-HELM algorithm can accurately estimate the SOH of retired batteries, with estimation errors staying within 3% even during performance fluctuations. This confirms that I-HELM is a precise and effective tool for SOH estimation and aging tracking of retired batteries.
To further evaluate the performance of the I-HELM algorithm in estimating the SOH of different batteries, three standard performance metrics were used: maximum absolute error (Max AE), mean absolute error (MAE), and root mean square error (RMSE) [44]. The calculation formulas for these metrics are provided in Equation (5). Table 2 presents the SOH estimation errors for the Samsung retired individual cells.
Max   AE = max y i y ^ i ( i = 1 , , n ) MAE = 1 n i = 1 n y i y ^ i ( i = 1 , , n ) RMSE = 1 n i = 1 n y i y ^ i 2 ( i = 1 , , n )
where y i represents the true value of SOH, y ^ i denotes the estimated value of SOH, and n represents the number of cycles used for estimation.
The table shows that for the D22 cell, the Max AE does not exceed 2.2%, the MAE is 0.3562%, and the RMSE is 0.6%. For the D26 cell, the Max AE is below 1.5%, the MAE is 0.836%, and the RMSE is 0.91%. These results demonstrate that the I-HELM algorithm can accurately estimate the SOH of Samsung retired individual cells under constant-current Condition 1.
Table 2 also shows that under dynamic-current Condition 2, the SOH estimation errors for the D23 and D123 cells are generally higher than under Condition 1. However, for the D23 cell, the Max AE remains below 2.6%, with an MAE of 0.6716% and an RMSE of 1.0469%, indicating that the I-HELM model is still effective. For the D123 cell, the Max AE is 3.2283%, with only four instances exceeding 3% and an MAE of 1.44%. These results demonstrate that the I-HELM model performs well in estimating the SOH of Samsung’s retired individual cells, even under dynamic conditions.
Although the I-HELM model achieves overall high accuracy with RMSE values consistently below 1% and maximum absolute errors generally under 3%, some localized deviations in SOH prediction—particularly errors exceeding 2%—are observed at certain mid-life stages (see Figure 6 and Figure 7). These discrepancies are likely due to non-linear and non-monotonic capacity behavior in retired batteries, which can arise from internal electrochemical fluctuations, intermittent capacity recovery effects, or external measurement noise under dynamic conditions. It is important to note that these points are not persistent and do not represent model drift. Nevertheless, to further validate the model’s robustness and distinguish between occasional estimation noise and potential prediction limitations, future work will incorporate longer-term cycling tests that extend into the late stages of battery aging.

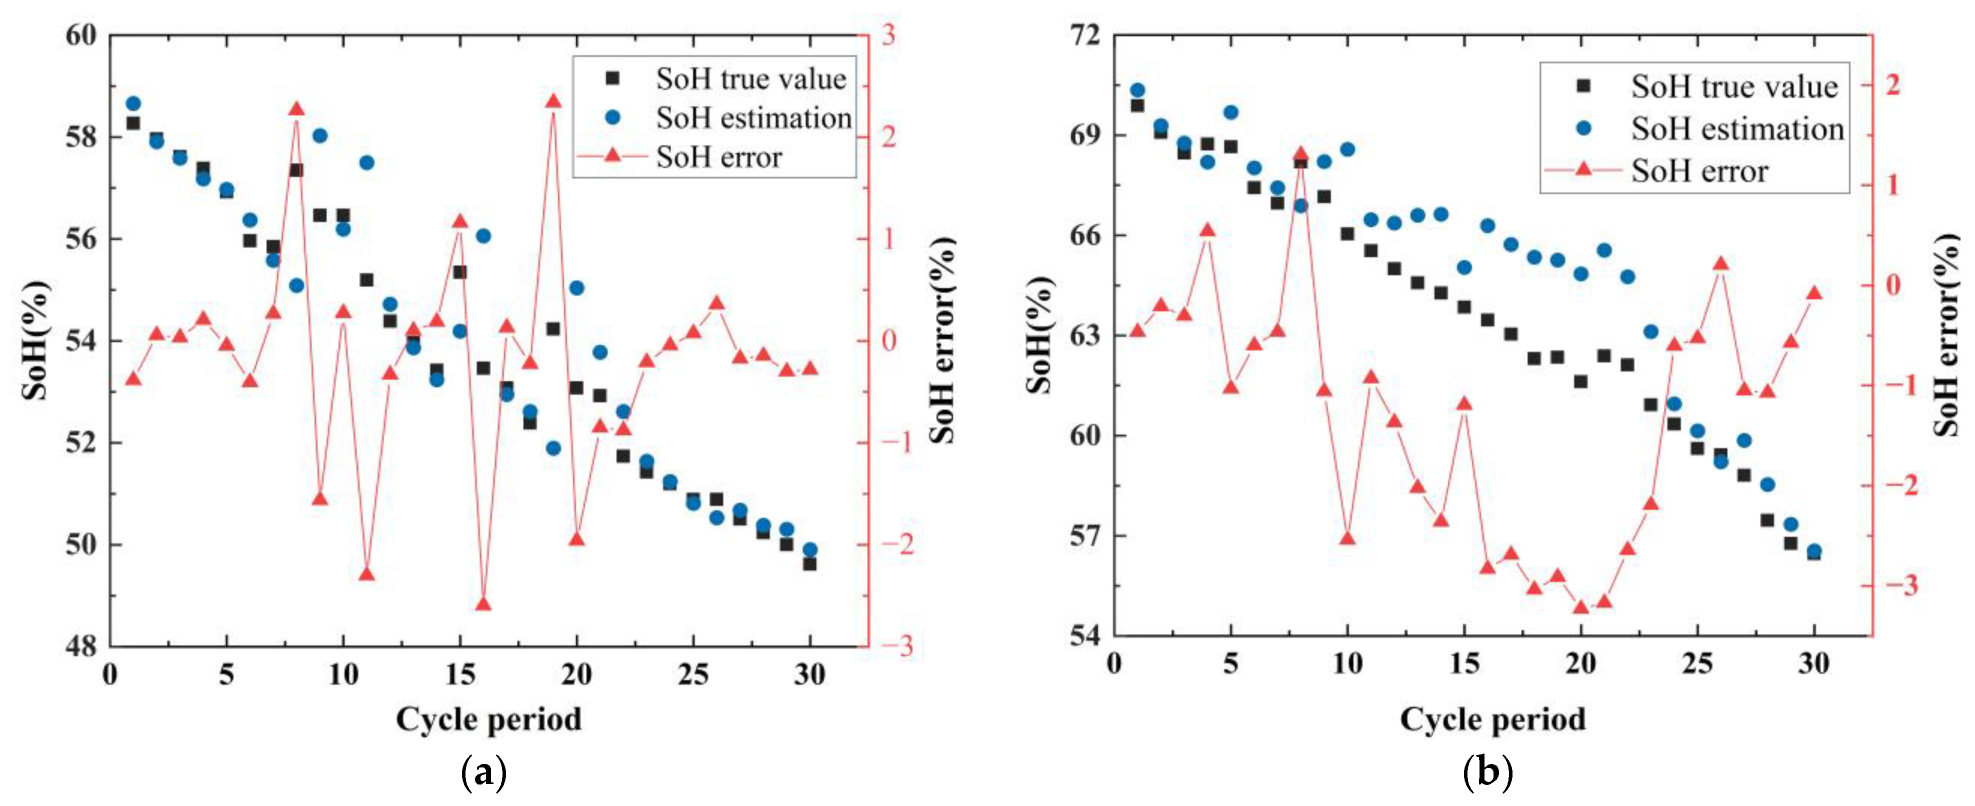
5.2.2. Estimation of SOH of Samsung’s Retired Battery Packs

To further validate the model at the battery pack level, we conducted experiments on two Samsung retired battery packs assembled from clustered cells. The SOH estimation results under constant (Pack 1) and dynamic (Pack 2) conditions are shown in Figure 8, illustrating the model’s performance under different operational loads. The numerical performance of SOH estimation for the Samsung battery packs is summarized in Table 3, including the Max AE, MAE, and RMSE for each condition.
As seen in Figure 8a, the estimated SOH closely tracks the true SOH, with the estimation error remaining within 3%, although it increases when the SOH of the Pack 1 battery group fluctuates. Figure 8b demonstrates that the estimated SOH is highly consistent with the true values, with minimal error. These results confirm that the I-HELM algorithm can accurately estimate the SOH of the Samsung retired battery packs under both constant-current Condition 1 and dynamic-current Condition 2.
Table 3 shows that the maximum estimation error for the Pack 1 battery group’s SOH is 2.5974%, with an MAE of 0.4642% and an RMSE of 0.681%. These results demonstrate minimal deviation between the estimated and true values, further confirming the effectiveness of the I-HELM model in estimating the SOH of retired battery packs. For the Pack 2 battery group, the Max AE, MAE, and RMSE are 0.4408%, 0.1622%, and 0.1875%, respectively, indicating very low errors. This highlights the I-HELM model’s ability to accurately estimate the SOH of Samsung retired battery packs under dynamic operating conditions.
Overall, this analysis shows that the I-HELM model performs exceptionally well in accurately estimating the SOH of retired battery packs. The superior performance can be attributed to battery packs’ more stable charge/discharge behavior than individual cells, allowing the health indicators to reflect the overall capacity more effectively. In conclusion, the I-HELM model can accurately estimate the SOH of retired battery packs, and the selected health indicators have been thoroughly validated.

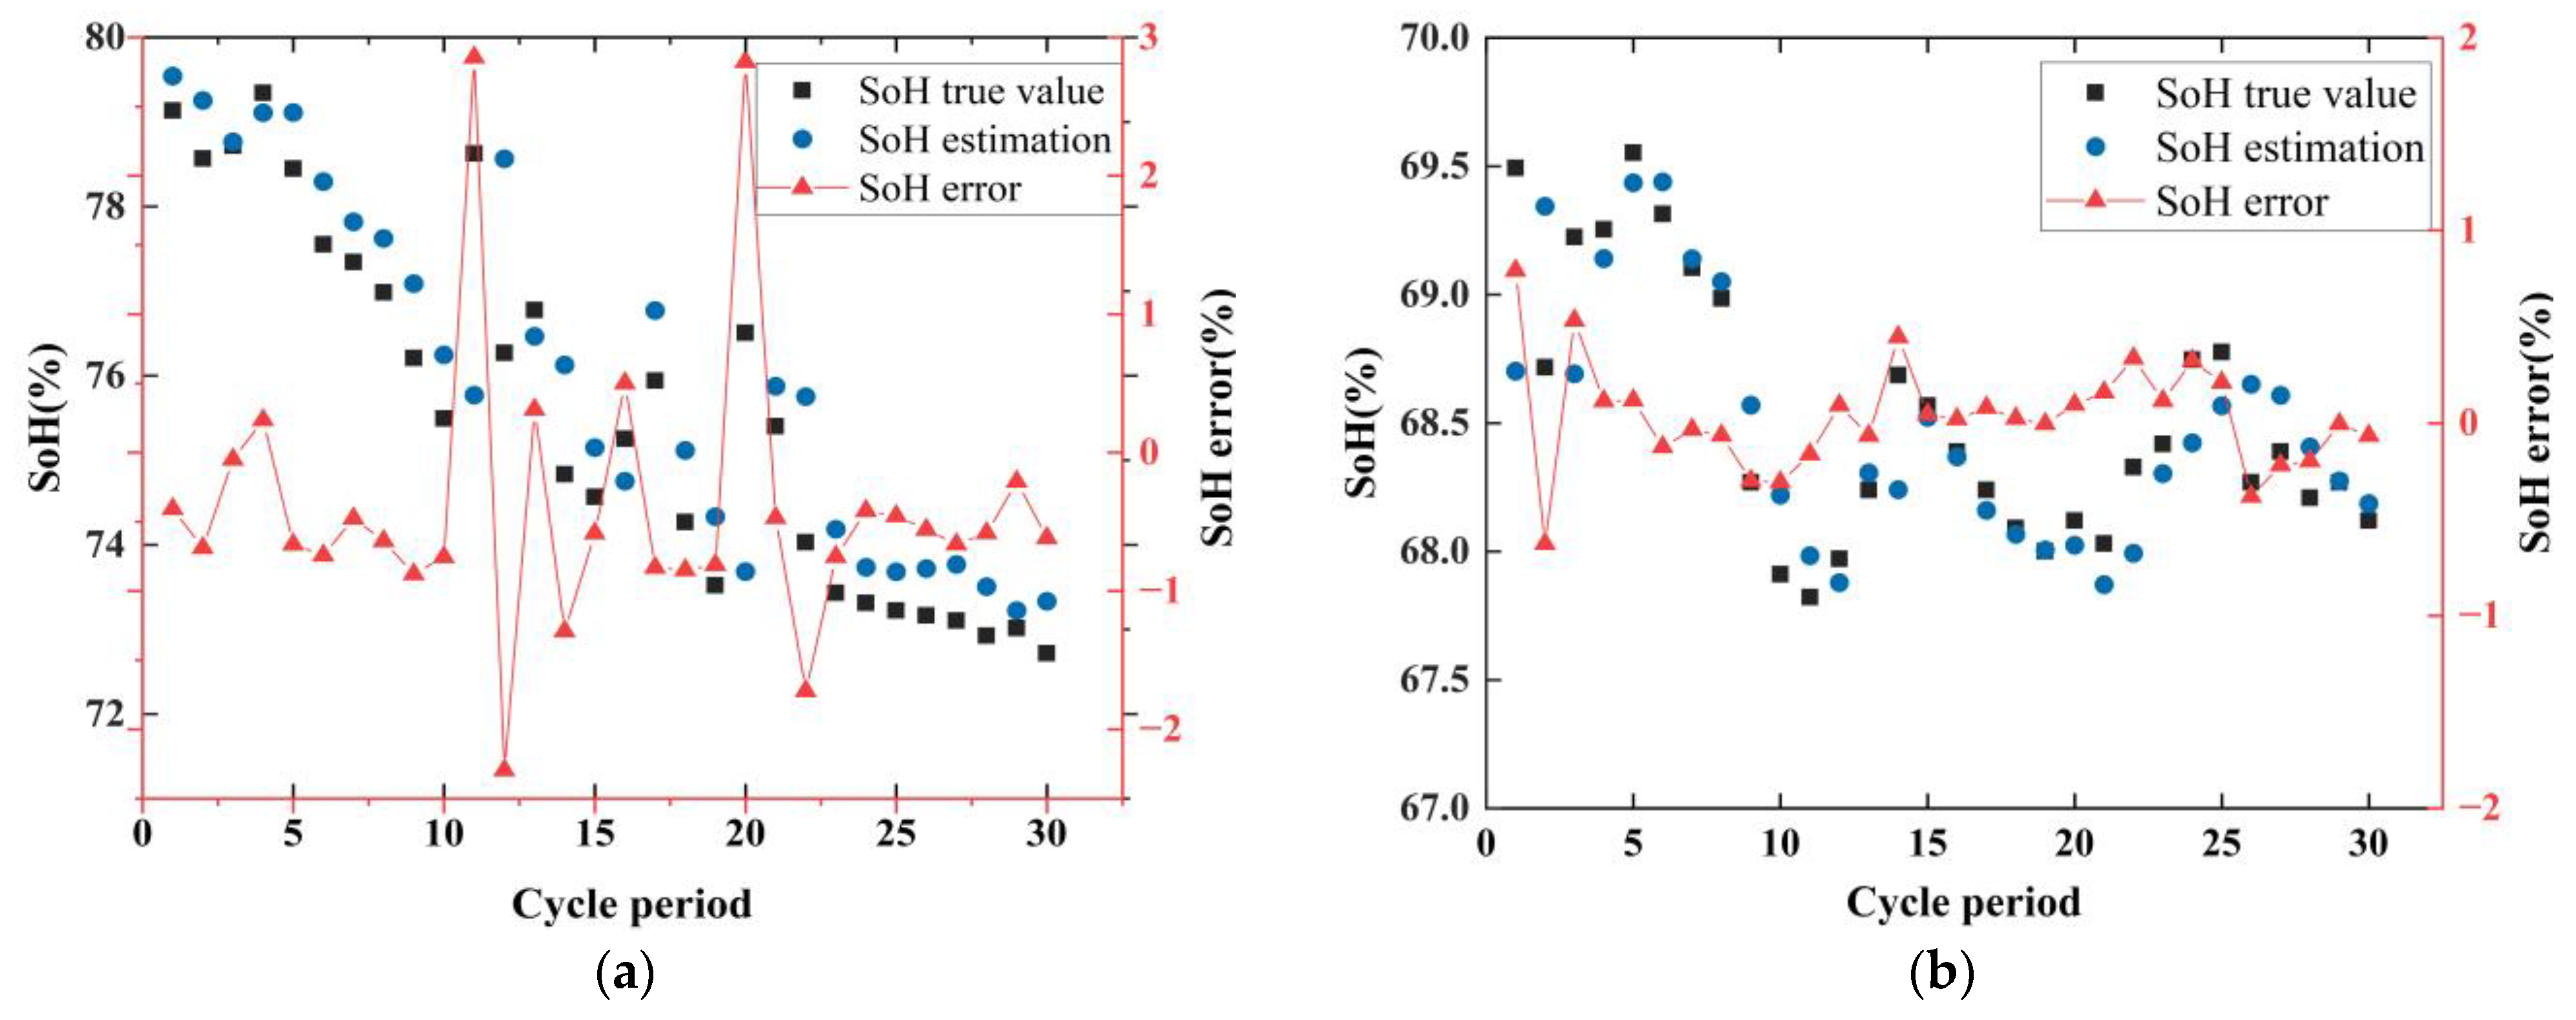
5.2.3. SOH Estimation for Panasonic Retired Battery Cells

To evaluate the performance of the I-HELM algorithm in estimating the SOH of retired batteries with different cathode materials, this study selected retired batteries R2 and R19 for testing. Battery R2 was evaluated under constant-current Condition 1, while R19 was tested under dynamic Condition 2. The estimation results are presented in Figure 9. The results for all test samples are presented in Table 4, providing a clear numerical comparison across different batteries and conditions.
As shown in Figure 9a, the SOH degradation trajectory of the R2 battery exhibits a notable decline with significant fluctuations. Despite this, the I-HELM estimates closely align with the actual SOH, with errors consistently remaining within 1%. Although deviations occur at certain abrupt change points in the degradation curve, the error never exceeds 3%. These findings suggest that the I-HELM algorithm effectively tracks the SOH degradation of the Panasonic R2 battery. Similarly, Figure 9b shows that the SOH degradation trajectory of the R19 battery also exhibits fluctuations. However, the I-HELM estimates closely follow the true degradation trend, with precise tracking at the points of change. The estimation error remains within 1%, with most errors staying below 0.5%.
Table 4 summarizes the estimation results for the R2 and R19 batteries. For the R2 battery, the Max AE is 2.8559%, with an MAE of 0.838% and an RMSE of 1.0822%, indicating that the I-HELM estimates are very close to the true values. For the R19 battery, the Max AE, MAE, and RMSE are 0.7912%, 0.2022%, and 0.2787%, respectively, all of which are below 1%, with MAE and RMSE well within 0.3%. These results demonstrate the high consistency between the estimated and actual SOH values.
Overall, the results confirm that the I-HELM model can accurately estimate the SOH of Panasonic retired batteries and exhibits strong generalizability. This further validates the high efficiency and effectiveness of I-HELM in SOH estimation.

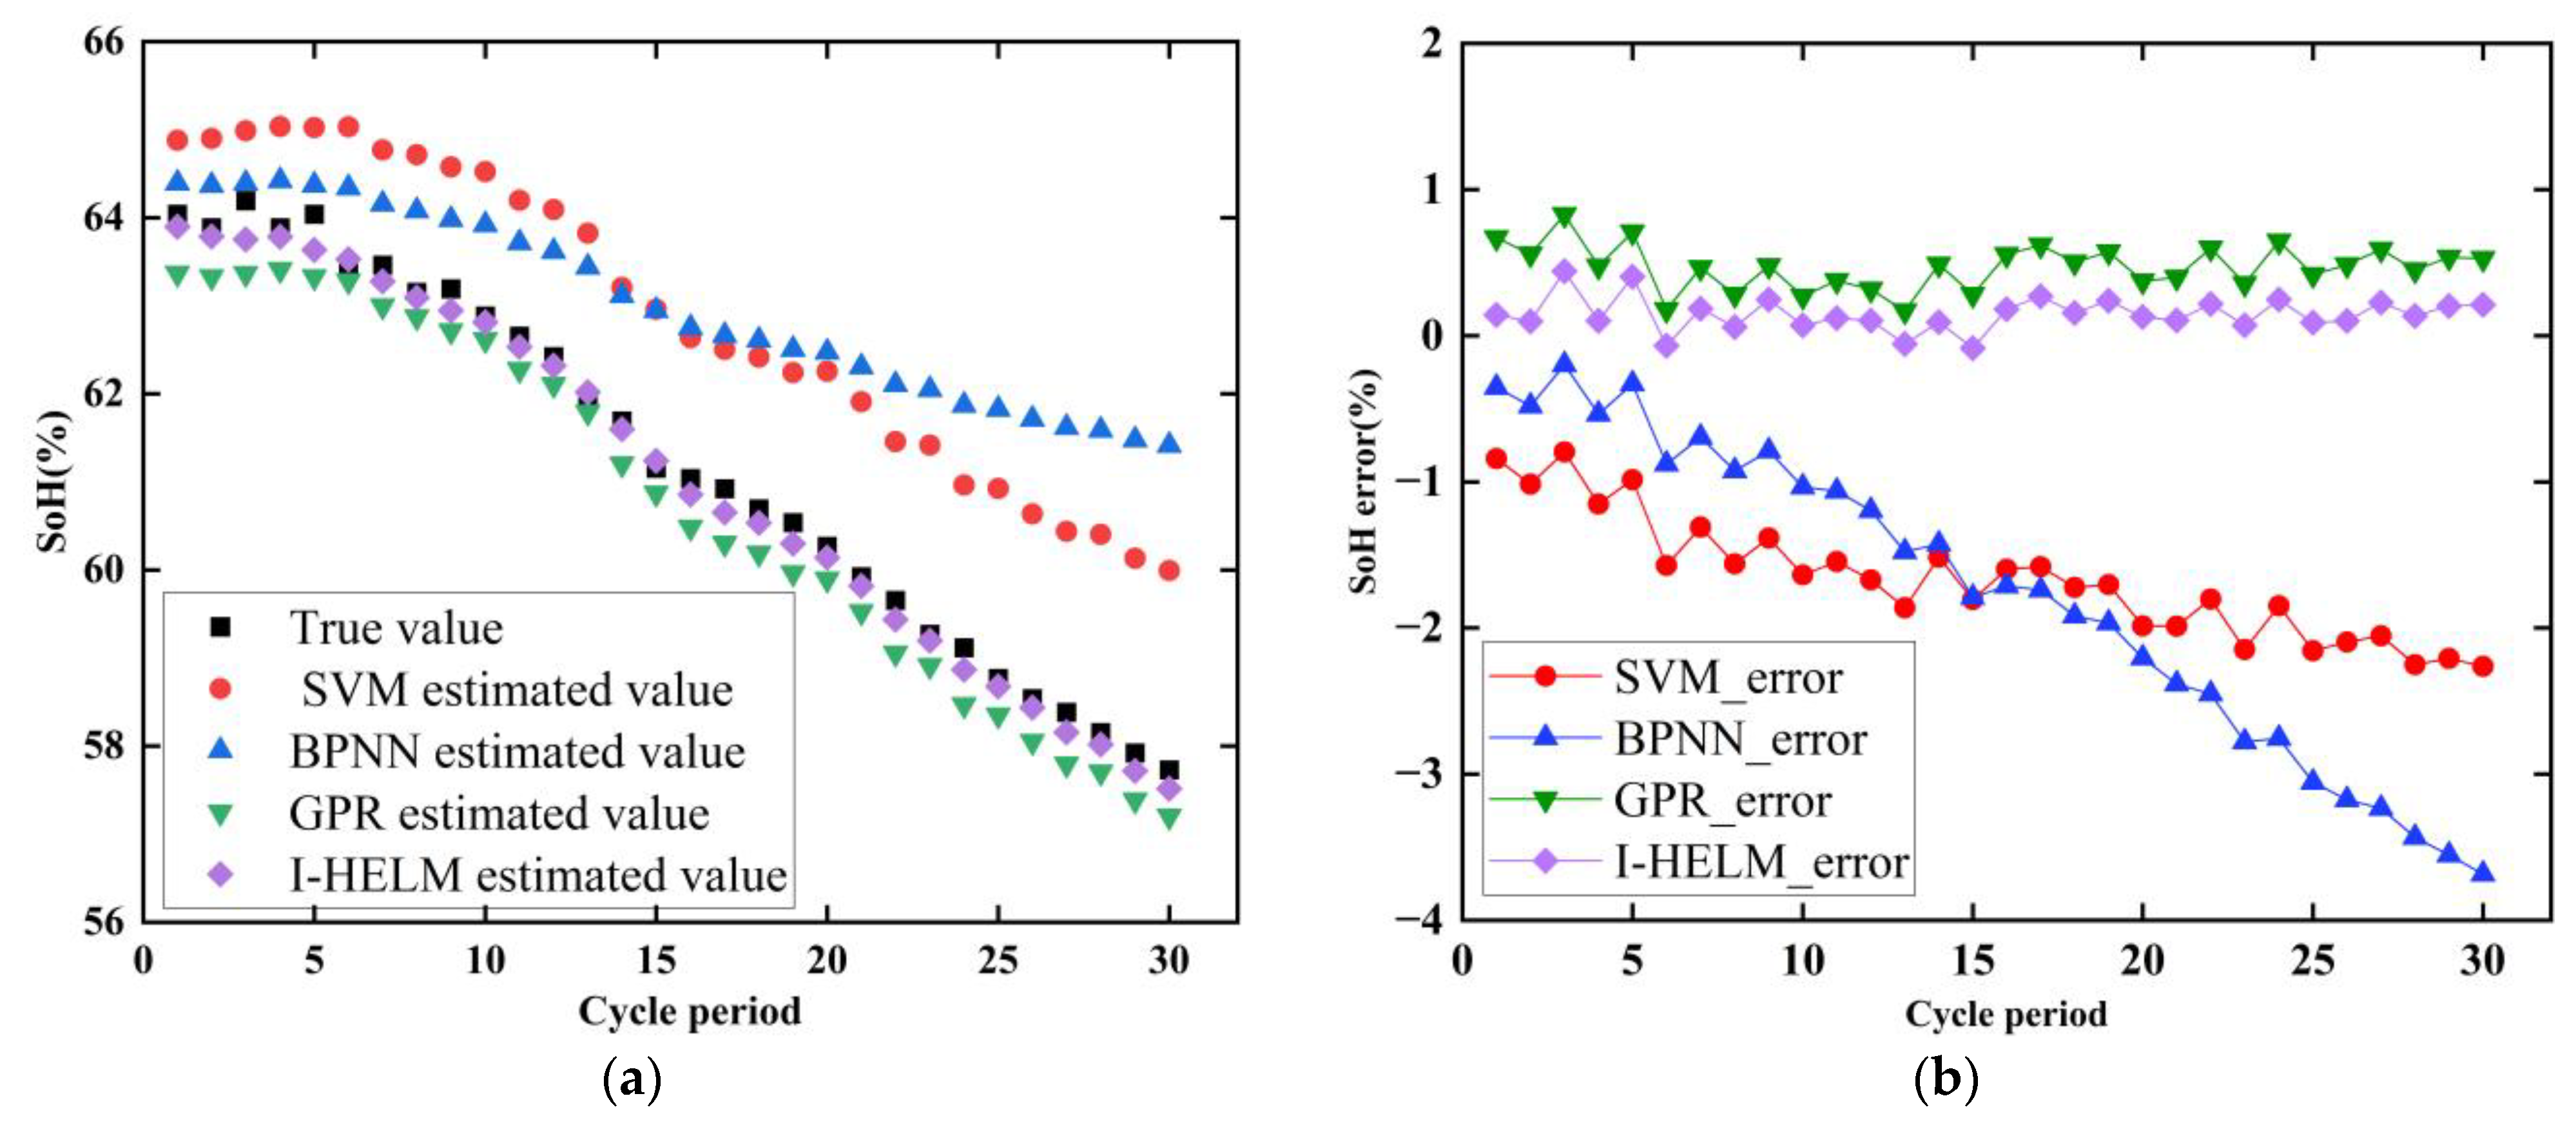
5.3. Comparison of I-HELM with Traditional Machine Learning Algorithms for SOH Estimation

To evaluate the superiority of the proposed I-HELM model in SOH estimation for retired batteries, we compared it with three traditional machine learning algorithms: Backpropagation Neural Network (BPNN), Support Vector Machine (SVM), and Gaussian Process Regression (GPR). BPNN is a classic neural network model consisting of an input, hidden, and output layer [45]. SVM is a robust algorithm used for both classification and regression tasks, known for its strong generalization ability, especially in high-dimensional spaces [46]. GPR, a non-parametric regression method, is widely applied in data modeling and prediction, offering flexibility and generalization capability [47].
The estimation results for the SOH of Samsung retired batteries using I-HELM and the comparison algorithms are shown in Figure 10 and Figure 11, with performance evaluation metrics summarized in Table 5. The results for Panasonic retired batteries are displayed in Figure 12, with the corresponding evaluation metrics presented in Table 6.
Figure 10 illustrates that the I-HELM model provides the most accurate SOH estimates for Samsung’s retired battery cells, followed by GPR. In contrast, the BPNN and SVM models exhibit significant deviations from the true SOH trajectory of the D26 battery, showing the largest errors. As seen in Table 5, both BPNN and SVM have a maximum absolute error (Max AE) greater than 4%, with SVM’s MAE and RMSE exceeding 3%, indicating poor overall estimation performance. In BPNN, the MAE and RMSE are 2.5257% and 2.79%, respectively, also reflecting suboptimal performance. The GPR model achieves a Max AE of 2.2546%, with MAE and RMSE values of 1.2937% and 1.3828%, respectively, showing a good estimation performance. However, I-HELM outperforms GPR, with a Max AE of 1.4502%, MAE of 0.836%, and RMSE of 0.9111%. These results demonstrate that I-HELM delivers superior estimation accuracy and stability performance.
Figure 11 illustrates the estimation results for the Samsung retired battery pack, Pack 2. Both BPNN and SVM exhibit significant deviations from the true SOH degradation trajectory, with notably larger errors. Specifically, the estimation error in BPNN increases over time, particularly in the later stages, where the deviation from the true SOH values becomes more pronounced. In contrast, the estimation results from GPR and I-HELM are closer to the true SOH trajectory, exhibiting more stable estimation curves without noticeable error escalation over time. Figure 11b further supports these findings by showing that I-HELM consistently delivers lower estimation errors than GPR.
As shown in Table 5, BPNN’s maximum estimation error (Max AE) is 3.6844%, indicating a relatively large deviation from the true SOH values. In comparison, SVM’s MAE and RMSE are 1.6685% and 1.7177%, respectively, suggesting that its overall estimation performance is subpar. While performing better than both BPNN and SVM, GPR still shows higher errors than I-HELM, with Max AE, MAE, and RMSE values of 0.8288%, 0.4729%, and 0.4968%, respectively. In contrast, I-HELM achieves a significantly lower Max AE of 0.4408%, with MAE and RMSE values of 0.1622% and 0.1875%, respectively, demonstrating its superior accuracy and stability.
Figure 12 presents the estimation results for the Panasonic retired battery (R19). The SVM model exhibits substantial deviations from the true SOH values, with the largest errors observed throughout the estimation. In contrast, the results from BPNN, GPR, and I-HELM show smaller and more consistent errors, with I-HELM continuing to demonstrate the best overall performance in accuracy and stability.
Table 6 confirms these findings, showing that GPR’s Max AE is 1.0382%, higher than both BPNN’s and I-HELM’s errors. Specifically, BPNN’s Max AE, MAE, and RMSE are 0.8145%, 0.2157%, and 0.2817%, respectively, with I-HELM’s errors being similar but slightly lower. While both BPNN and I-HELM deliver good results in estimating the SOH of the Panasonic retired battery, I-HELM consistently outperforms BPNN across all three evaluation metrics. These results highlight I-HELM’s superior accuracy and stability in estimating the SOH of Panasonic retired batteries.

6. Conclusions and Plans

This study introduces a novel SOH estimation model for retired batteries based on the I-HELM model. By incorporating health indicators derived from constant charging time and charging current area, the I-HELM model effectively captures the non-linear relationships between battery health and degradation. This approach improves both the estimation accuracy and learning efficiency. Experimental validation on Samsung ICR18650-26F and Panasonic NCR18650BD batteries demonstrates that the proposed I-HELM model achieves a maximum error of 2.2% (single cells) and 2.6% (battery packs)—outperforming conventional methods; maintains an RMSE below 1%, ensuring consistent and reliable performance across different aging stages and operational profiles; reduces the need for frequent battery testing; and supports scalable implementation for industrial battery reuse. By improving SOH prediction accuracy for retired batteries, the I-HELM model supports sustainable battery life cycle management and second-life applications.
To further verify the robustness and domain adaptability of the proposed method, we plan to benchmark the I-HELM model using a publicly available dataset that includes retired lithium-ion batteries with varying degrees of capacity degradation. In addition, we will explore model interpretability to provide insights into feature contributions and improve the transparency and trustworthiness of SoH predictions in practical applications.

Author Contributions

Conceptualization, N.P. and Y.H.; methodology, Y.H., N.P. and L.C.; software, Y.H., L.L. and N.P.; validation, Y.H., L.L. and L.C. formal analysis, Y.H.; investigation, Y.H. and N.P.; resources, Y.H. and N.P.; data curation, Y.H., L.L. and L.C.; writing—original draft preparation, Y.H.; writing—review and editing, Y.H., L.L., N.P. and K.S.; visualization, Y.H. All authors have read and agreed to the published version of the manuscript.

Funding

This research received no external funding.

Data Availability Statement

The original contributions presented in this study are included in the article. Further inquiries can be directed to the corresponding author.

Conflicts of Interest

The author Kasian Sukemoke was employed by the company PEC Technology (Thailand) Co. The remaining authors declare that the research was conducted in the absence of any commercial or financial relationships that could be construed as a potential conflict of interest.

References

  1. Diouf, B.; Avis, C. The potential of Li-ion batteries in ECOWAS solar home systems. J. Energy Storage 2019, 22, 295–301. [Google Scholar] [CrossRef]
  2. Ren, D.; Feng, X.; Liu, L.; Hsu, H.; Lu, L.; Wang, L.; He, X.; Ouyang, M. Investigating the relationship between internal short circuit and thermal runaway of lithium-ion batteries under thermal abuse condition. Energy Storage Mater. 2021, 34, 563–573. [Google Scholar] [CrossRef]
  3. Wang, Q.; Wang, Z.; Zhang, L.; Liu, P.; Zhang, Z. A novel consistency evaluation method for series-connected battery systems based on real-world operation data. IEEE Trans. Transp. Electrif. 2021, 7, 437–451. [Google Scholar] [CrossRef]
  4. Vermeer, W.; Mouli, G.R.C.; Bauer, P. A comprehensive review on the characteristics and modeling of lithium-ion battery aging. IEEE Trans. Transp. Electrif. 2022, 8, 2205–2232. [Google Scholar] [CrossRef]
  5. Zhang, Y.; Li, Y. Prognostics and health management of Lithium-ion battery using deep learning methods, A review. Renew. Sustain. Energy Rev. 2022, 161, 112282. [Google Scholar] [CrossRef]
  6. Chen, L.; Wang, H.; Liu, B.; Wang, Y.; Ding, Y.; Pan, H. Battery state-of-health estimation based on a metabolic extreme learning machine combining degradation state model and error compensation. Energy 2021, 215, 119078. [Google Scholar] [CrossRef]
  7. Wang, Z.; Zhao, X.; Fu, L.; Zhen, D.; Gu, F.; Ball, A.D. A review on rapid state of health estimation of lithium-ion batteries in electric vehicles. Sustain. Energy Technol. Assess. 2023, 60, 103457. [Google Scholar] [CrossRef]
  8. Zhang, C.; Tu, L.; Yang, Z.; Du, B.; Zhou, Z.; Wu, J.; Chen, L. A CMMOG-based lithium-battery SOH estimation method using multi-task learning framework. J. Energy Storage 2025, 107, 114884. [Google Scholar] [CrossRef]
  9. Jiang, L.; Deng, Z.; Tang, X.; Hu, L.; Lin, X.; Hu, X. Data-driven fault diagnosis and thermal runaway warning for battery packs using real-world vehicle data. Energy 2021, 234, 121266. [Google Scholar] [CrossRef]
  10. Zhang, X.; Hou, J.; Wang, Z.; Jiang, Y. Study of SOC estimation by the ampere-hour integral method with capacity correction based on LSTM. Batteries 2022, 8, 170. [Google Scholar] [CrossRef]
  11. Mamadou, K.; Lemaire, E.; Delaille, A.; Riu, D.; Hing, S.E.; Bultel, Y. Definition of a state-of-energy indicator (SoE) for electrochemical storage devices: Application for energetic availability forecasting. J. Electrochem. Soc. 2012, 159, A1298. [Google Scholar] [CrossRef]
  12. Barai, A.; Uddin, K.; Widanalage, W.D.; McGordon, A.; Jennings, P. The effect of average cycling current on total energy of lithium-ion batteries for electric vehicles. J. Power Sources 2016, 303, 81–85. [Google Scholar] [CrossRef]
  13. Qi, G.; Li, D.; Duan, M.; Guan, W.; Ma, J. Echelon division of battery status considering on-road characteristics of electric buses. China J. Highw. Transp. 2022, 35, 44–54. [Google Scholar]
  14. Rodriguez-Cea, A.I.; Morinigo-Sotelo, D.; Tinaut, F.V. A procedure for evaluating the SOH of Li-ion batteries from data during the constant voltage charge phase and the use of an ECM with internal resistance. J. Energy Storage 2025, 108, 115074. [Google Scholar] [CrossRef]
  15. Liu, Y.; Wang, L.; Li, D.; Wang, K. State-of-health estimation of lithium-ion batteries based on electrochemical impedance spectroscopy: A review. Prot. Control Mod. Power Syst. 2023, 8, 41. [Google Scholar] [CrossRef]
  16. Zhang, B.; Wang, L.; Zhang, Y.; Wang, X.; Qiao, Y.; Sun, S. Reliable impedance analysis of Li-ion battery half-cell by standardization on electrochemical impedance spectroscopy (EIS). J. Chem. Phys. 2023, 158, 054202. [Google Scholar] [CrossRef]
  17. Wei, Z.; Sun, X.; Li, Y.; Liu, W.; Liu, C.; Lu, H. A Joint Estimation Method for the SOC and SOH of Lithium-Ion Batteries Based on AR-ECM and Data-Driven Model Fusion. Electronics 2025, 14, 1290. [Google Scholar] [CrossRef]
  18. Cai, L.; Lin, J.; Liao, X. An estimation model for state of health of lithium-ion batteries using energy-based features. J. Energy Storage 2022, 46, 103846. [Google Scholar] [CrossRef]
  19. Akbar, K.; Zou, Y.; Awais, Q.; Baig, M.J.A.; Jamil, M. A Machine Learning-Based Robust State of Health (SOH) Prediction Model for Electric Vehicle Batteries. Electronics 2022, 11, 1216. [Google Scholar] [CrossRef]
  20. Yang, X.; Wang, S.; Xu, W.; Qiao, J.; Yu, C.; Takyi-Aninakwa, P.; Jin, S. A novel fuzzy adaptive cubature Kalman filtering method for the state of charge and state of energy co-estimation of lithium-ion batteries. Electrochim. Acta 2022, 415, 140241. [Google Scholar] [CrossRef]
  21. Liu, D.; Wang, S.; Fan, Y.; Liang, Y.; Fernandez, C.; Stroe, D.I. State of energy estimation for lithium-ion batteries using adaptive fuzzy control and forgetting factor recursive least squares combined with AEKF considering temperature. J. Energy Storage 2023, 70, 108040. [Google Scholar] [CrossRef]
  22. Xu, P.; Hu, X.; Liu, B.; Ouyang, T.; Chen, N. Hierarchical estimation model of state-of-charge and state-of-health for power batteries considering current rate. IEEE Trans. Ind. Inform. 2021, 18, 6150–6159. [Google Scholar] [CrossRef]
  23. Gao, Y.; Liu, K.; Zhu, C.; Zhang, X.; Zhang, D. Co-estimation of state-of-charge and state-of-health for lithium-ion batteries using an enhanced electrochemical model. IEEE Trans. Ind. Electron. 2021, 69, 2684–2696. [Google Scholar] [CrossRef]
  24. Li, J.; He, S.; Yang, Q.; Ma, T.; Wei, Z. Optimal design of the EV charging station with retired battery systems against charging demand uncertainty. IEEE Trans. Ind. Inform. 2023, 19, 3262–3273. [Google Scholar] [CrossRef]
  25. Wang, Y.; Huang, H.; Wang, H.; Wu, X. A fast estimation method for state-of-health of retired batteries based on health features. J. Energy Storage 2023, 72, 108677. [Google Scholar] [CrossRef]
  26. Cai, L.; Lin, J. A charging-feature-based estimation model for state of health of lithium-ion batteries. Expert Syst. Appl. 2024, 238, 122034. [Google Scholar] [CrossRef]
  27. Gou, B.; Xu, Y.; Feng, X. State-of-health estimation and remaining-useful-life prediction for lithium-ion battery using a hybrid data-driven method. IEEE Trans. Veh. Technol. 2020, 69, 10854–10867. [Google Scholar] [CrossRef]
  28. Hochreiter, S.; Schmidhuber, J. Long short-term memory. Neural Comput. 1997, 9, 1735–1780. [Google Scholar] [CrossRef]
  29. Li, P.; Zhang, Z.; Xiong, Q.; Ding, B.; Hou, J.; Luo, D.; Rong, Y.; Li, S. State-of-health estimation and remaining useful life prediction for the lithium-ion battery based on a variant long short term memory neural network. J. Power Sources 2020, 459, 228069. [Google Scholar] [CrossRef]
  30. Ma, Y.; Shan, C.; Gao, J.; Chen, H. A novel method for state of health estimation of lithium-ion batteries based on improved LSTM and health indicators extraction. Energy 2022, 251, 123973. [Google Scholar] [CrossRef]
  31. Deng, Z.; Lin, X.; Cai, J.; Hu, X. Battery health estimation with degradation pattern recognition and transfer learning. J. Power Sources 2022, 525, 231027. [Google Scholar] [CrossRef]
  32. Lin, M.; Yan, C.; Wang, W.; Dong, G.; Meng, J.; Wu, J. A data-driven approach for estimating state-of-health of lithium-ion batteries considering internal resistance. Energy 2023, 277, 127675. [Google Scholar] [CrossRef]
  33. Zhang, S.; Liu, Z.; Su, H. State of health estimation for lithium-ion batteries on few-shot learning. Energy 2023, 268, 126726. [Google Scholar] [CrossRef]
  34. Lin, C.; Xu, J.; Shi, M.; Mei, X. Constant current charging time based fast state-of-health estimation for lithium-ion batteries. Energy 2022, 247, 123556. [Google Scholar] [CrossRef]
  35. Zhang, C.; Wang, S.; Yu, C.; Xie, Y. Fernantery state of health estimation and high-adaptability remaining useful life prediction. J. Electrochem. Soc. 2022, 169, 31. [Google Scholar] [CrossRef]
  36. Wu, L.; Chen, C.; Li, Z.; Chen, Z.; Li, H. The Joint Estimation of SOC-SOH for Lithium-Ion Batteries Based on BiLSTM-SA. Electronics 2025, 14, 97. [Google Scholar] [CrossRef]
  37. Chen, B.; Zhang, Y.; Wu, J.; Yuan, H.; Guo, F. Lithium-Ion Battery State of Health Estimation Based on Feature Reconstruction and Transformer-GRU Parallel Architecture. Energies 2025, 18, 1236. [Google Scholar] [CrossRef]
  38. Kasun, L.L.C.; Zhou, H.; Huang, G.; Vong, C.M. Representational learning with ELMs for big data. IEEE Intell. Syst. 2013, 28, 31–34. [Google Scholar]
  39. Tang, J.; Deng, C.; Huang, G. Extreme learning machine for multilayer perceptron. IEEE Trans. Neural Netw. Learn. Syst. 2016, 27, 809–821. [Google Scholar] [CrossRef]
  40. Zhu, W.; Miao, J.; Qing, L.; Huang, G. Hierarchical extreme learning machine for unsupervised representation learning. In Proceedings of the 2015 International Joint Conference on Neural Networks (IJCNN), Killarney, Ireland, 12–17 July 2015; IEEE: New York, NY, USA, 2015; pp. 1–8. [Google Scholar]
  41. He, Y.; Pattanadech, N.; Sukemoke, K.; Pan, M.; Chen, L. The State of Health Estimation of Retired Lithium-Ion Batteries Using a Multi-Input Metabolic Gated Recurrent Unit. Energies 2025, 18, 1035. [Google Scholar] [CrossRef]
  42. Askari, S. Fuzzy C-Means clustering algorithm for data with unequal cluster sizes and contaminated with noise and outliers, Review and development. Expert Syst. Appl. 2021, 165, 113856. [Google Scholar] [CrossRef]
  43. Chen, L.; He, M.; Wu, S.; Chen, D.; Zhao, M.; Pan, H. Multi-algorithm fusion-based state of energy assessment of retired lithium-ion batteries. J. Energy Storage 2025, 105, 114690. [Google Scholar] [CrossRef]
  44. Deng, Z.; Xu, L.; Liu, H.; Hu, X.; Wang, B.; Zhou, J. Rapid health estimation of in-service battery packs based on limited labels and domain adaptation. J. Energy Chem. 2024, 89, 345–354. [Google Scholar] [CrossRef]
  45. Wen, J.; Chen, X.; Li, X.; Li, Y. SOH prediction of lithium battery based on IC curve feature and BP neural network. Energy 2022, 261, 125234. [Google Scholar] [CrossRef]
  46. Wu, T.; Huang, Y.; Xu, Y.; Jiang, J.; Liu, S.; Li, Z. SOH prediction for lithium-ion battery based on improved support vector regression. Int. J. Green Energy 2023, 20, 227–236. [Google Scholar] [CrossRef]
  47. Wang, J.; Deng, Z.; Yu, T.; Yoshida, A.; Xu, L.; Guan, G. A Abudula. State of health estimation based on modified Gaussian process regression for lithium-ion batteries. J. Energy Storage 2022, 51, 104512. [Google Scholar] [CrossRef]
Figure 1. Structure of the I-HELM algorithm.
Electronics 14 01832 g001
Figure 2. I-HELM algorithm SOH estimation framework.
Electronics 14 01832 g002
Figure 5. HELM capacity estimation: (a) 150 individual HELM capacity estimates; (b) estimation results for different numbers of HELMs.
Electronics 14 01832 g005
Figure 6. SOH estimation results for Samsung batteries under Condition 1: (a) cell D22; (b) cell D26.
Electronics 14 01832 g006
Figure 7. SOH estimation results for Samsung batteries under Condition 2: (a) cell D23; (b) cell D123.
Electronics 14 01832 g007
Figure 8. SOH estimation results for Samsung battery packs: (a) Pack 1, Condition 1; (b) Pack 2, Condition 2.
Electronics 14 01832 g008
Figure 9. SOH estimation results for Panasonic batteries: (a) cell R2, Condition 1; (b) cell R19, Condition 2.
Electronics 14 01832 g009
Figure 10. SOH estimation comparison for D26 using different algorithms: (a) predicted values; (b) estimation errors.
Electronics 14 01832 g010
Figure 11. SOH estimation comparison for Pack 2 using different algorithms: (a) predicted values; (b) estimation errors.
Electronics 14 01832 g011
Figure 12. SOH estimation comparison for R19 using different algorithms: (a) predicted values; (b) estimation errors.
Electronics 14 01832 g012
Table 1. Specifications of retired lithium-ion batteries used for testing [41].
ParameterSamsung Retired BatteriesPanasonic Retired Batteries
Nominal capacity2600 mAh3350 mAh
Minimum capacity2400 mAh3250 mAh
Standard charging current1300 mAh1625 mAh
Maximum charging current2600 mAh2400 mAh
Maximum discharge current5200 mAh7200 mAh
Nominal voltage3.7 V3.6 V
Charge cut-off voltage4.2 V4.2 V
Discharge cut-off voltage2.75 V2.5 V
Table 2. SOH estimation metrics for Samsung retired batteries.
Evaluation IndicatorsD22 BatteryD26 BatteryD23 BatteryD123 Battery
Max AE (%)2.14921.45022.59593.2283
MAE (%)0.35620.8360.67161.44
RMSE (%)0.60350.91111.04691.7684
Table 3. SOH estimation metrics for Samsung retired battery packs.
Evaluation IndicatorsPack 1 Battery PackPack 2 Battery Pack
Max AE (%)2.59740.4408
MAE (%)0.46420.1622
RMSE (%)0.6810.1875
Table 4. SOH estimation metrics for Panasonic retired batteries.
Evaluation IndicatorsR2R19
Max AE (%)2.85590.7912
MAE (%)0.8380.2022
RMSE (%)1.08220.2787
Table 5. Performance comparison of SOH estimation algorithms for Samsung batteries.
MethodD26Pack 2
Max AE (%)MAE (%)RMSE (%)Max AE (%)MAE (%)RMSE (%)
SVM4.34133.12193.23372.26361.66851.7177
BPNN4.50252.52572.793.68441.77382.064
GPR2.25461.29371.38280.82880.47290.4968
I-HELM1.45020.8360.91110.44080.16220.1875
Table 6. Performance comparison of SOH estimation algorithms for Panasonic batteries.
MethodR19
Max AE (%)MAE (%)RMSE (%)
SVM1.22420.61260.663
BPNN0.81450.21570.2817
GPR1.03820.25730.345
I-HELM0.79120.20220.2787
Disclaimer/Publisher’s Note: The statements, opinions and data contained in all publications are solely those of the individual author(s) and contributor(s) and not of MDPI and/or the editor(s). MDPI and/or the editor(s) disclaim responsibility for any injury to people or property resulting from any ideas, methods, instructions or products referred to in the content.

