Article

A Graphene Nanoribbon Electrode-Based Porphyrin Molecular Device for DNA Sequencing

1
School of Physical Science and Technology, Soochow University, 1 Shizi Street, Suzhou 215006, China
2
Department of Physics, Concordia University, 7141 Sherbrooke West, Montréal, QC H4B 1R6, Canada
3
College of Physics, Nanjing University of Aeronautics and Astronautics, Nanjing 211106, China
4
College of Electronic and Information Engineering, Changshu Institute of Technology, Changshu 215500, China
*
Authors to whom correspondence should be addressed.
Electronics 2025, 14(9), 1814; https://doi.org/10.3390/electronics14091814
Submission received: 22 March 2025 / Revised: 19 April 2025 / Accepted: 25 April 2025 / Published: 29 April 2025

Abstract

:
We propose a DNA nucleobase sequencing device composed of zigzag graphene nanoribbon electrodes connected with a porphyrin molecule via carbon chains (GEPM). The connecting geometry between the nanoribbons with an even width number and the carbon chains is laterally symmetric to filter out electrons of specific modes. Various properties of the GEPM and of the GEPM + nucleobase systems, such as interaction energies, charge density differences, spin-differential electronic densities, and electric currents, are investigated using the density functional theory (DFT) combined with the non-equilibrium Green’s function (NEGF) method. The results show that the GEPM device holds promise for DNA sequencing with the measurement of the electric signals through it. The four nucleobases—adenine (A), cytosine (C), guanine (G), and thymine (T)—can be efficiently distinguished based on the conductance and current sensitivity when they are located on the porphyrin molecule of the GEPM device. The symmetry of the connecting geometry between the carbon chains and the nanoribbons selects Bloch states with specific symmetry to pass through the device and results in broad transmission valleys or gaps. In addition, the edge magnetism of graphene nanoribbons can further manipulate the transmission and then the sequencing effects. The device exhibits extremely high conductance sensitivity in the parallel magnetic configuration. This study explores the possible advantage of this technology compared with conventional nanopore sequencing devices and potentially expands the variety of available sequencing structures.

1. Introduction

Next-generation sequencing (NGS) has significantly influenced the fields of biochemistry and biomedicine, leading to numerous technological advancements, applications, and innovations [1,2,3,4]. NGS offers an efficient method for sequencing various biological molecules, such as DNA, RNA, and proteins [5,6]. In particular, the COVID-19 pandemic highlighted the importance of NGS, showcasing its immense potential in addressing global health crises [7]. Despite its promise, the current development and wide application of NGS technology are still limited. A substantial development of NGS could be significant in saving lives [1,2,5,6]. In this context, the use of nanostructures is prevalent due to their unique structural features and excellent electronic and transport properties. Jun-Ho et al. systematically investigated the adsorption of four DNA nucleobases on graphene and hexagonal boron nitride (h-BN) sheets. They found that the variation in vdW interactions depends on the substrate molecule [8]. Vivekanand et al. exhibited the possibility of the lateral heterostructure of graphene and h-BN to effectively discriminate among four target nucleotides, and Rameshwar et al. demonstrated the performance of a boron carbide (BC₃)-based nanogap setup, successfully distinguishing four target nucleotides, too. They also proposed a nanodevice based on a two-dimensional HB sheet for the individual identification of amino acids, and investigated an extended line defects (ELDs)-based graphene nanodevice for distinguishing all four DNA nucleobases [9,10,11,12,13,14]. Currently, the most popular models for sequencing involving nanostructures include nanopore- [2,15,16,17,18,19,20,21,22,23,24,25,26], nanogap- [1,9,10,11,12,27,28,29,30,31,32] and nanochannel- [13,14,33,34,35] based techniques. These structures are relatively stable in various environments. However, sequencing devices based on nanogap structures, despite their high sensitivity in single-molecule sequencing, often exhibit low currents [36]. This limitation applies whether the DNA is single-stranded (ss) or double-stranded (ds). In addition, both ssDNA and dsDNA molecule sequencing face challenges, such as the residence time of the DNA molecule and potential blockages in nanoscale devices [19]. Therefore, an effective solid-state nanoscale device is needed to address these issues.
Therefore, we propose a model based on zigzag graphene nanoribbon electrodes with a porphyrin molecule as the sequencing device (GEPM). The porphyrin molecule is connected to the left and right electrodes of graphene nanoribbons with an even width number through the carbon chains using the three-membered ring structure [37,38,39]. Graphene, as a widely researched two-dimensional material, exhibits exceptional physical properties. Under ideal conditions, it possesses an intrinsic carrier mobility exceeding 200,000 cm²/V·s [40], and its thermal conductivity ranges from 4800 to 5300 W/m·K [41]. Additionally, graphene has a Young’s modulus of approximately 1.0 TPa [42]. These outstanding physical characteristics make it highly suitable for applications in electronics, energy storage, and biomedicine [43,44,45,46]. Graphene and graphene-like materials are widely used in sequencing devices [36,47,48,49,50]. The porphyrin molecule is a class of large molecule with nitrogen-containing heterocycle, which is known for its strong adsorption and photosensitivity, finding applications in many fields, and its interaction with DNA molecules has also been extensively studied [51,52,53]. The carbon chain can be used as a connecting unit in devices and greatly reduce the size of the device. The transport properties of carbon chains have been intensively studied [37]. By combining the high electrical conductivity of graphene and the carbon chain with the adsorption properties of porphyrin, the electron transport performance of the system can be enhanced. Due to the higher electrical conductivity, the combination mitigates the limitation of the low currents and provides an excellent platform for nucleobase adsorption. By using porphyrin molecules as the adsorption substrate instead of graphene, the interaction energy between the systems is significantly reduced [8], which decreases the residence time of the base molecules in the system [54]. Moreover, by using a carbon chain to connect the porphyrin with the graphene electrode, the lateral tunneling current of the system reaches the microampere level, which is much higher than that of nanogap-based sequencing structures [12].
Accordingly, considering the excellent structural and electrical properties of GEPM, we utilize it as the device for DNA nucleobases sequencing. We employ DFT to optimize the structures and calculate the interaction energy Ei of the GEPM and GEPM + nucleobase systems [nucleobase: adenine (A), cytosine (C), guanine (G), and thymine (T)]. Furthermore, we combine DFT with the NEGF method to derive electronic transmission spectra and currents, considering the edge magnetism of the graphene electrodes. We also calculate transmission spectra T(E) through the structures for both parallel (P) and anti-parallel (AP) spin configurations.

2. Model and Computational Details

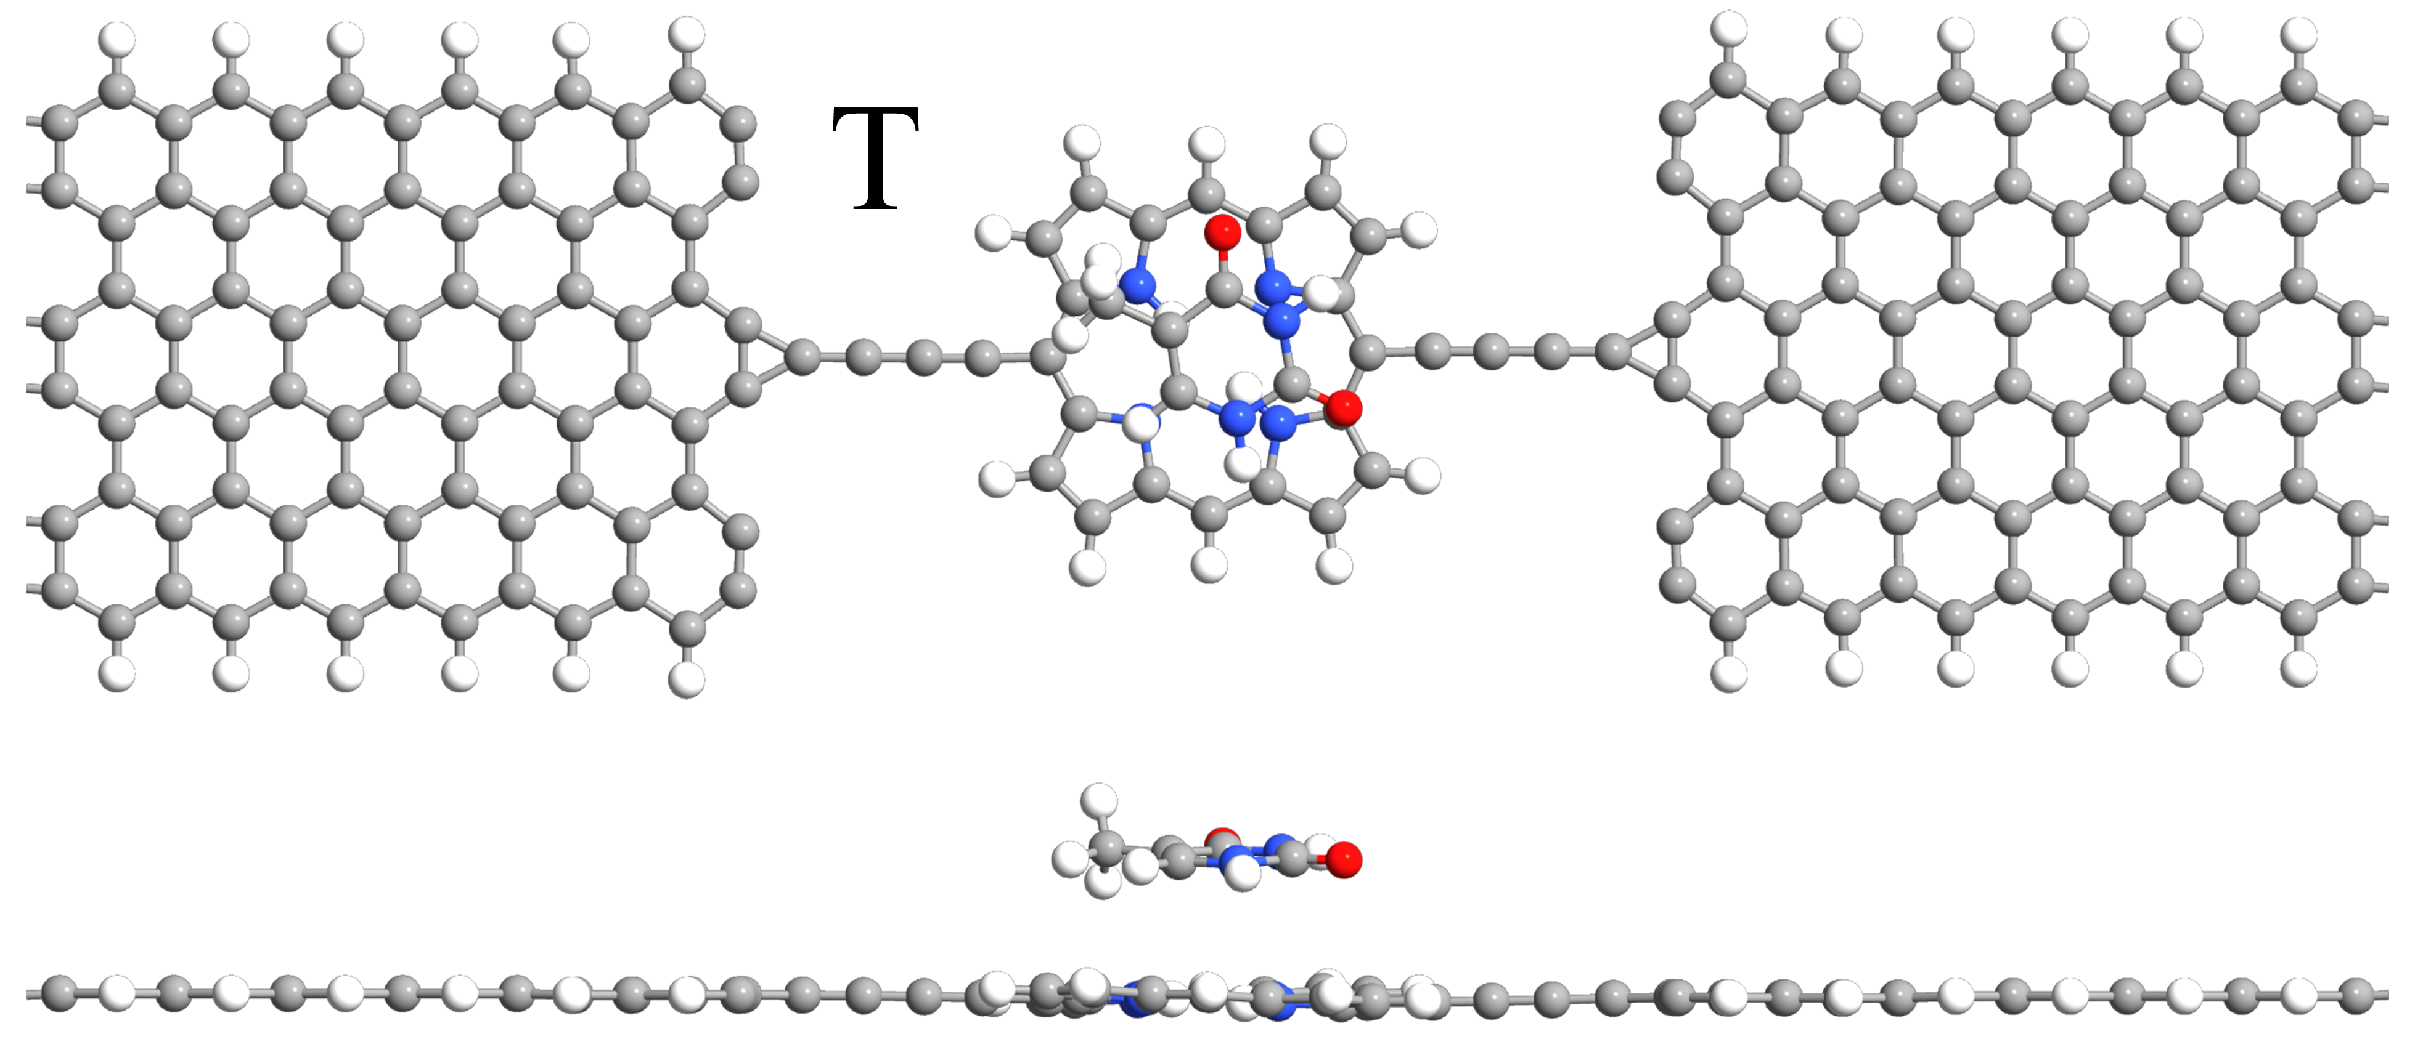
In our simulations, the graphene nanoribbons (GNRs) are passivated with hydrogen atoms to eliminate the edge dangling bonds, thereby stabilizing the structure and removing localized states that may otherwise affect the electronic properties. This treatment restores sp² hybridization at the edges and reflects common experimental practices. Such hydrogen passivation is a widely adopted approach in first-principles studies to ensure physically meaningful and reliable results [55]. The GEPM device has a planar structure as shown in Figure 1a, where the porphyrin molecule is linked to the graphene electrodes left (L) and right (R) with straight carbon chains. The connection configuration between the electrodes and the carbon chain is the same as in Ref. [37]. Both the left and the right graphene nanoribbon electrodes are composed of a 6-zigzag chain (have a width number of 6) and are semi-infinite along the z-direction, which is the direction of electron transport. The straight carbon chains are connected to the electrodes along their central axis to form three-term connections, as shown by the shadows in Figure 1. Figure 1b–e display the four nucleobases A, C, G, and T, respectively. The C–C bond length is 1.42 Å in graphene, and the C–C bond lengths in the carbon atomic chain attached to the porphyrin core vary from the edge to the center as 1.32 Å, 1.30 Å, 1.26 Å, and 1.40 Å, respectively. These results are consistent with values reported in the literature for similar systems [37]. Notably, these nucleobases do not contain the sugar-phosphate backbone unit. However, although Jariyanee and co-workers have shown that though the backbone might affect the transport characteristics, it should not have an impact on the sequencing performance of the system [29].
All calculations presented in this study were carried out by the Atomistix ToolKit (ATK) package based on density functional theory (DFT) combined with the non-equilibrium Green’s function method (NEGF) [10,12,56,57,58,59,60]. The spin-dependent generalized gradient approximation with the Perdew–Burke–Ernzerhof parametrization (SGGA-PBE) was used for the exchange-correlation functional [60]. A set of medium PseudoDojo pseudopotentials was employed to accurately describe the interaction between valence electrons and atomic nuclei, and Dirichlet boundary conditions were used to define the electrostatic potential [61,62]. The long-range dispersion correction to the van der Waals (vdW) interaction is considered under the DFT-D2 framework [63]. We optimize the geometry structures of the device until the maximum residual force on each atom is below 0.01 eV/Å. A vacuum layer thickness exceeding 20 Å along the x and y directions is maintained to prevent coupling between images. In the calculations of transport properties, the cutoff energy is set to be 150 Hartree [64], the temperature is set to be 300 K, and the k-point mesh in the electrodes is chosen to be 1 × 1 × 150 [9,10,38]. The convergence criteria for all computational results are set as 10−5 eV. The structures with a target nucleobase molecule adsorbed onto the porphyrin of the device are fully optimized and the optimized geometries for the four nucleobases are shown in Figure 2. The interaction energy (Ei) between a nucleobase and the GEPM was defined previously [65]
E i = ( E GEPM + E nucleobase ) E GEPM + nucleobase
where EGEPM and Enucleobase represent the energies of isolated GEPM and target nucleobase molecule, respectively, and EGEPM+nucleobase is the total energy of the combined system. We use the approximate central scattering region of the GEPM device as shown in Figure 1 in the energy calculation.
The transmission coefficient T ( E , V b ) = T σ σ ( E , V b ) describes the probability of electron transmission from the left to the right electrode at a specific energy E and an applied voltage bias Vb. Its component of spin σ (spin-up ↑ or spin-down ↓) is estimated using the formula [57]:
T σ ( E , V b ) = T r [ Γ σ L ( E , V b ) G σ R ( E , V b ) Γ σ R ( E , V b ) G σ A ( E , V b ) ] ,
where Γ σ L ( R ) is the coupling matrix between the central region and the left (right) electrode region and G σ R ( A ) is the retarded (advanced) Green’s functions of the central region. The current passing through the device can be calculated from the Landauer–Büttiker formula [57,66,67]:
I ( V b ) = I σ σ ( V b ) = e h + σ T σ ( E , V b ) [ f ( E μ L ) f ( E μ R ) ] d E ,
where μ L = e V b / 2 and μ R = e V b / 2 are the electrochemical potentials of the left and the right electrodes, respectively. f ( E μ L ( R ) ) is the Fermi–Dirac distribution function. The current is mainly determined by integrating the transmission coefficient over the transport window [ μ R , μ L ] with a zero-temperature linear conductance G ( V b = 0 ) = G σ σ ( 0 ) = e 2 h T ( 0 ) = e 2 h T σ σ ( E , 0 ) .
The sensitivity SG(I) is usually utilized to characterize the sequencing performance. The sensitivity of the transmission spectrum (or current) is calculated using the formula [19]:
S G ( I ) = G ( I ) N G ( I ) GEPM G ( I ) GEPM × 100 %
Here, SG(I) is the sensitivity of the conductance (current) G(I)N and G(I)GEPM represents the conductance (current) of the GEMP device with (N = A, C, G, or T) and without the target nucleobase molecule, respectively.
We explicitly state that this work represents a theoretical exploration of the device’s sensing capability under idealized, simplified environment to probe the intrinsic sensing capability of the proposed device structure.

3. Results and Discussion

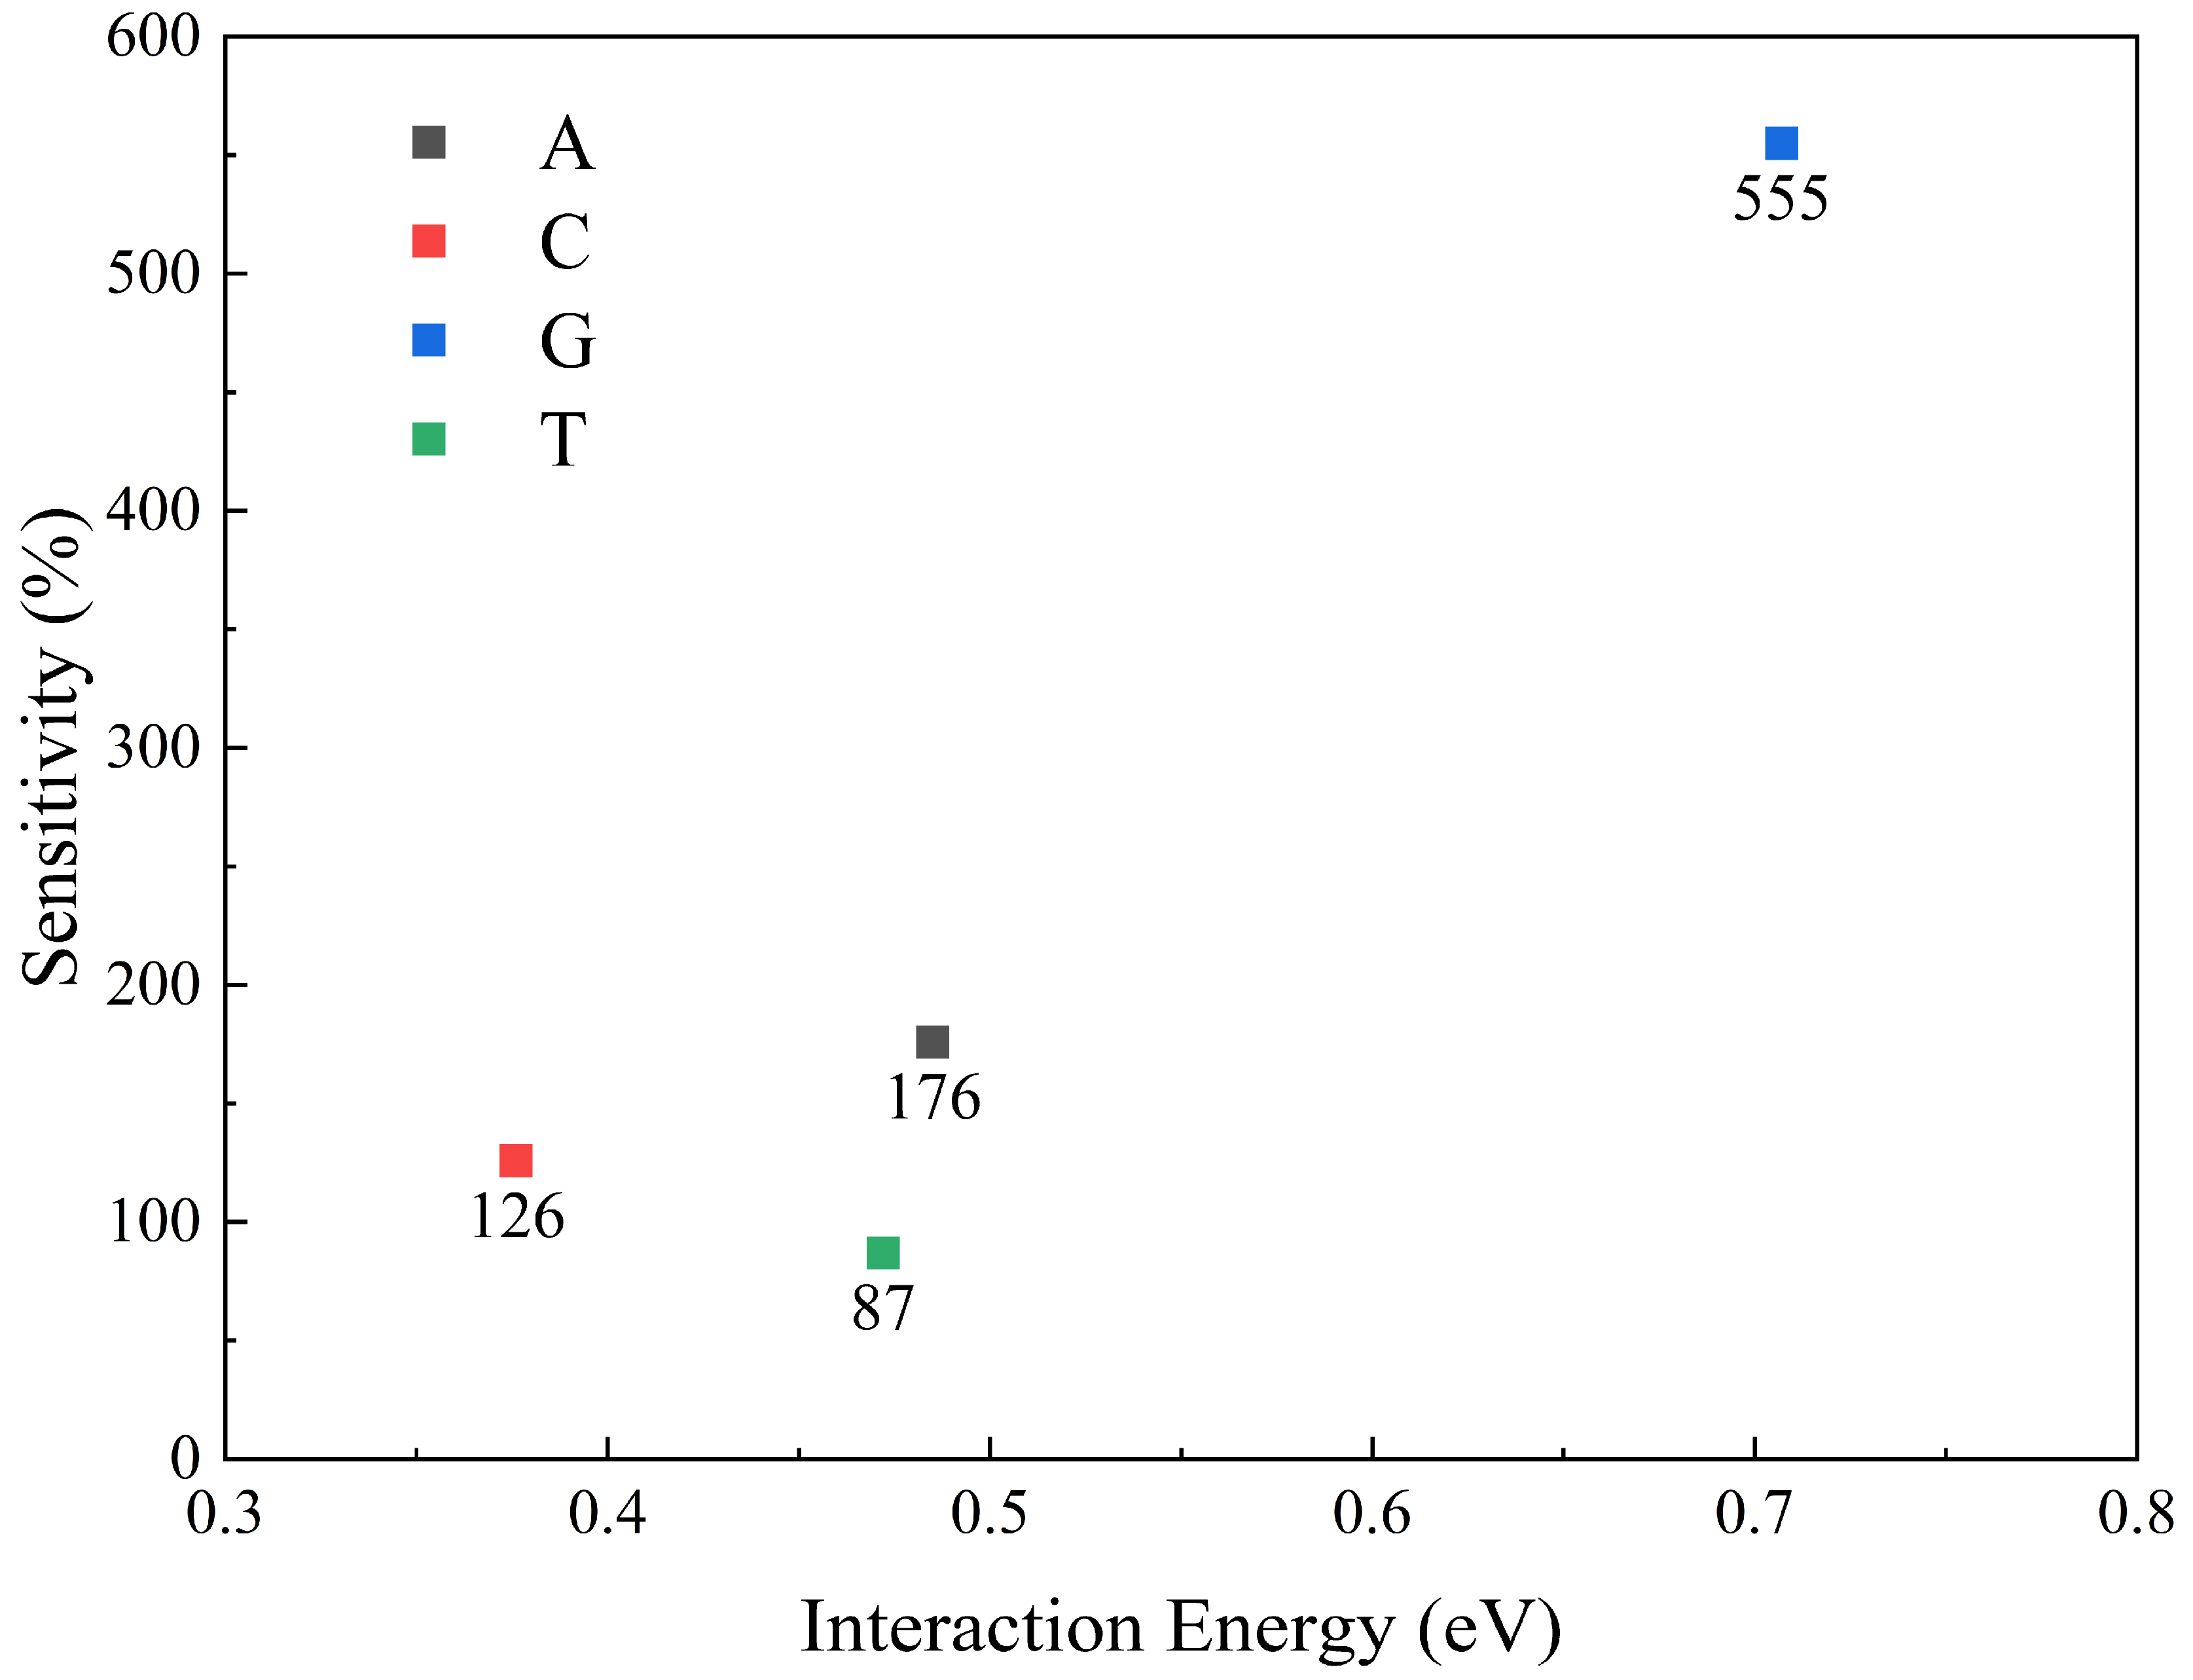
First, each target nucleobase molecule is located on the porphyrin molecule in the device for full structural optimization. The optimal geometries of the four nucleobase + GEPM systems are denoted as A, C, G, and T devices, respectively, as shown in Figure 2. The distances between the target nucleobases and the GEPM, defined as the distance between their atomistic coordinate average centers, are all around 3 Å, as detailed in the Supporting Information (SI). The interaction energy Ei between the nucleobase and GEPM is obtained from Equation (1) as 0.485, 0.376, 0.707, and 0.472 eV, respectively, for devices A, C, G, and T. We observe that Ei in our case is similar to that in the graphdiyne nanopore case [54], and the order of interaction energies is as follows: G > A > T > C, which is consistent with the known literature [8,56]. A larger Ei indicates a stronger interaction, which may lead to a longer duration of the target nucleobase on the porphyrin molecule. For smaller Ei, on the other hand, the target molecule may easily and quickly pass through the GEPM. The distance and the interaction energy are list in Table 1.
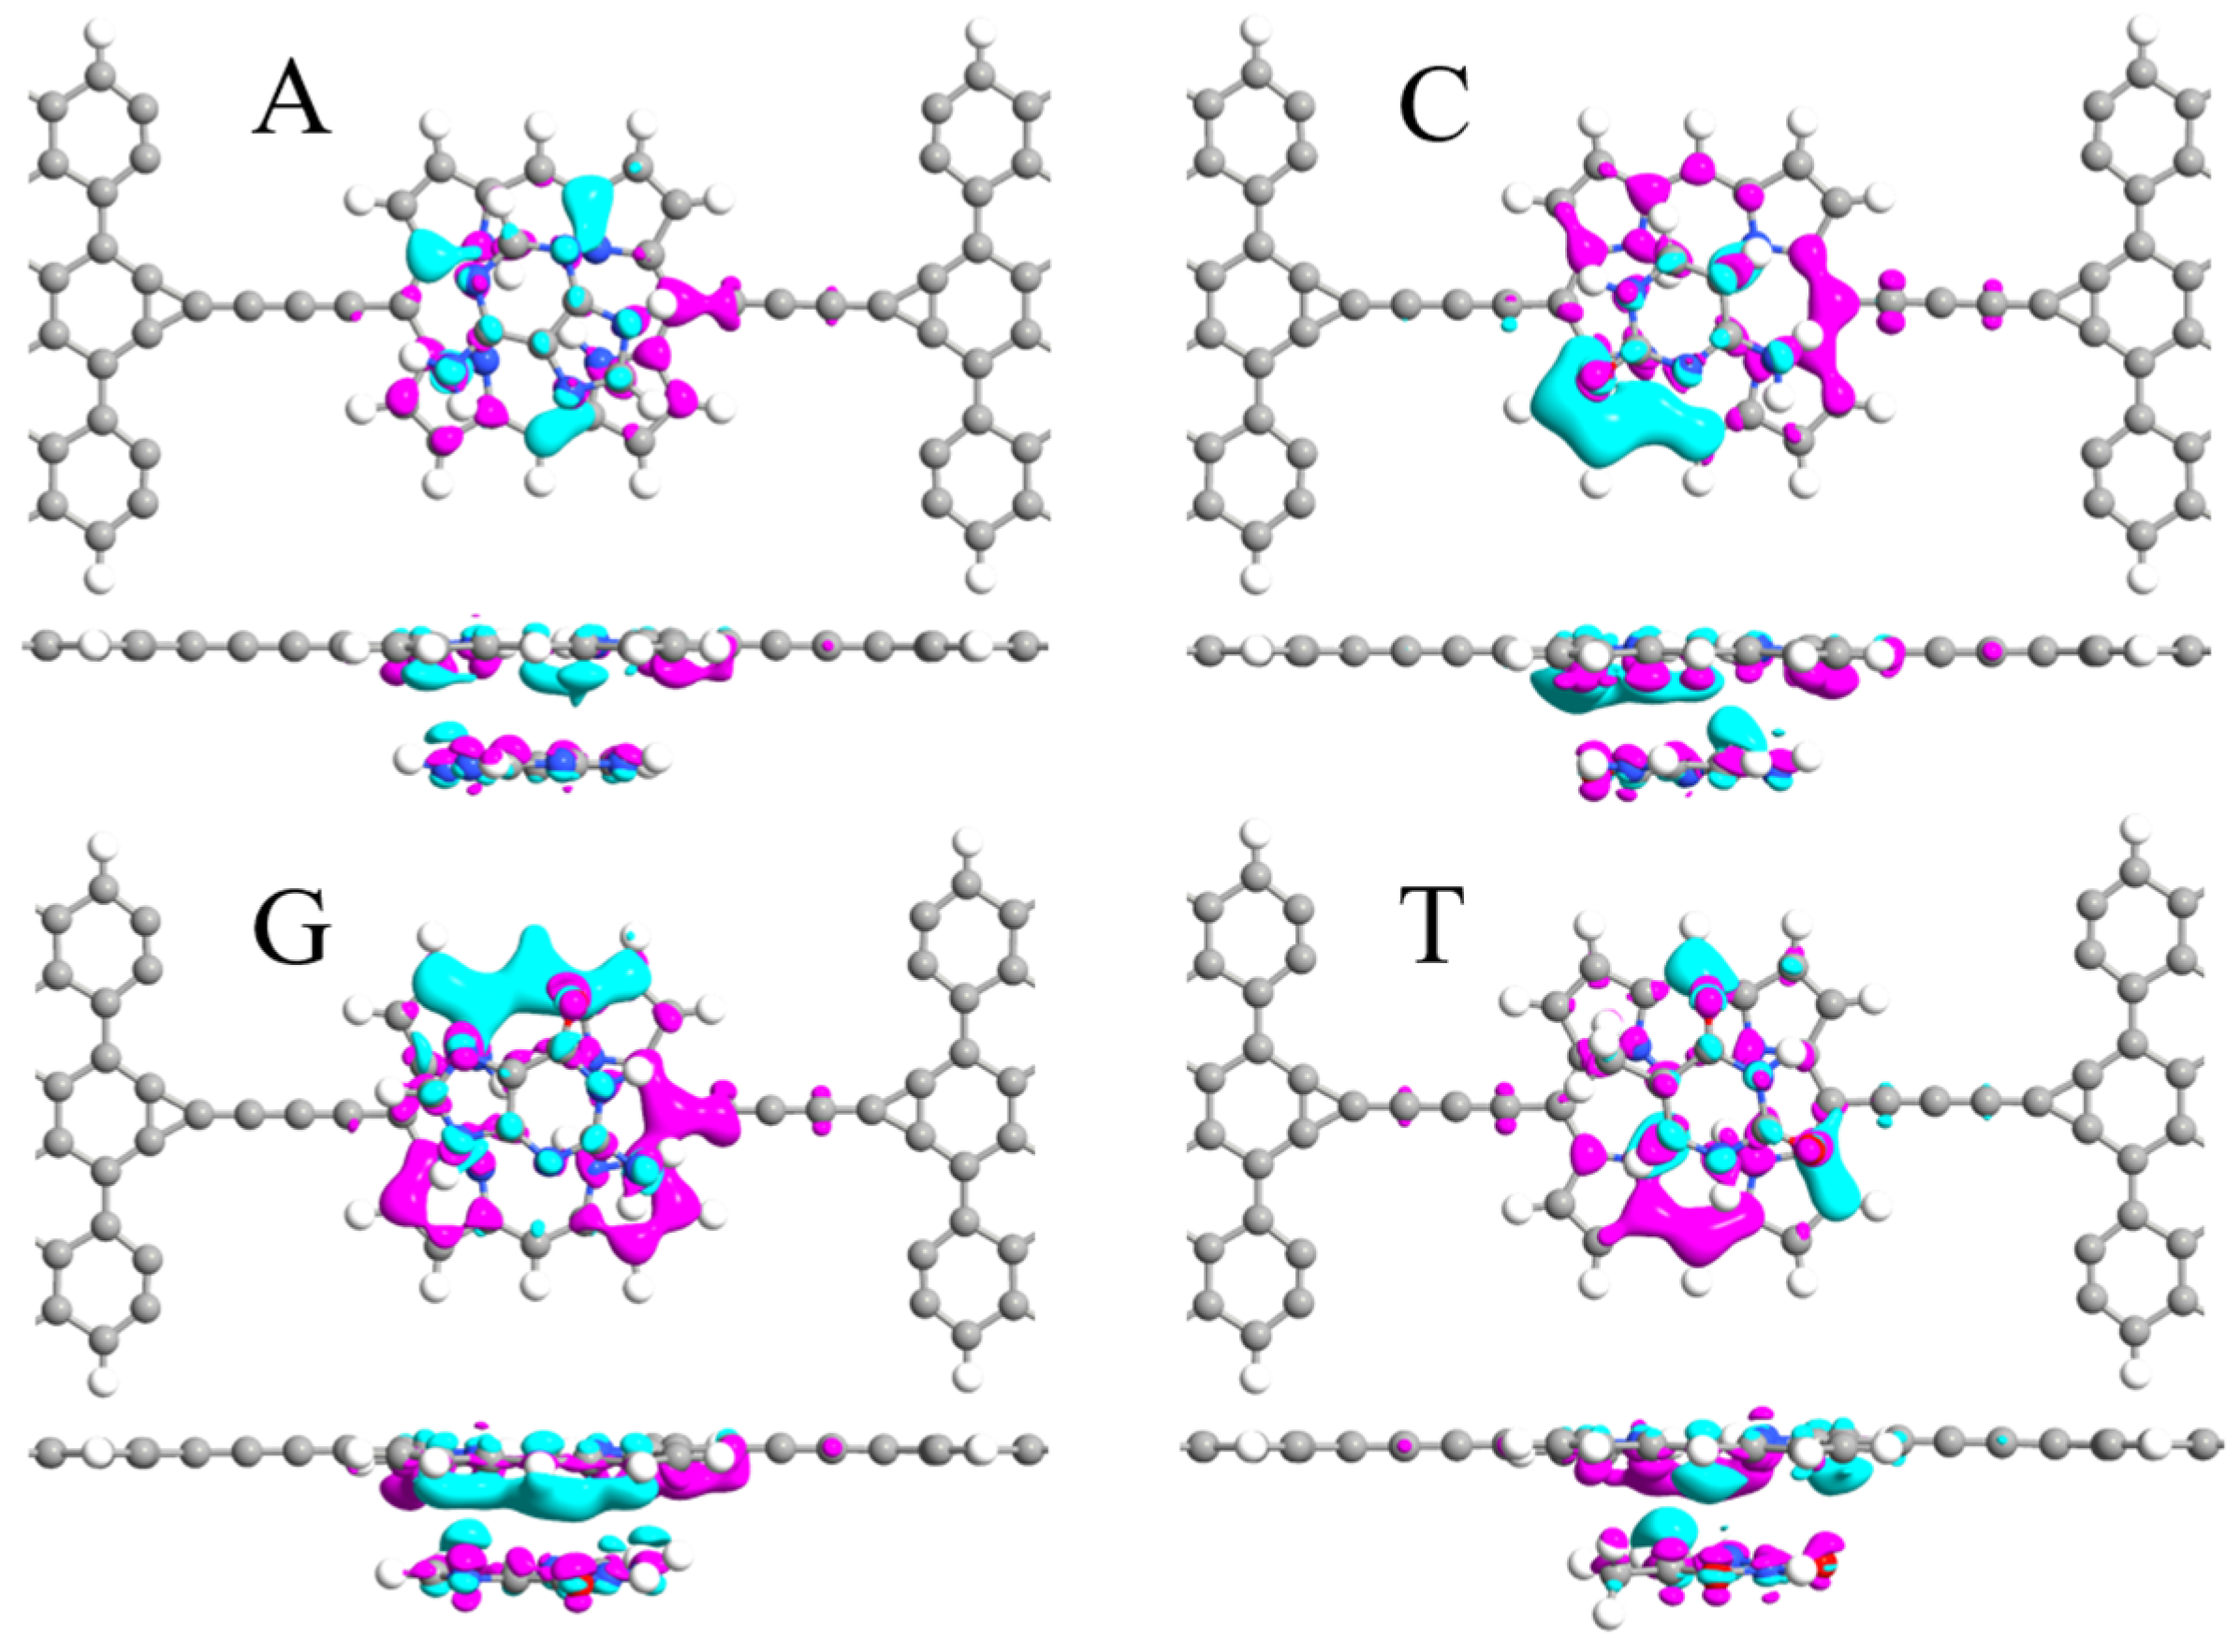
The interaction may result in charge transfer in the adsorption process of nucleobases on the GEPM device which can be revealed from the Mulliken Population analysis. For nucleobases A, C, G, and T, we observe charge accumulations of 0.015 e , 0.013 e , 0.016 e , and 0.013 e , respectively, indicating that all four nucleobases act as charge acceptors or electron donors here. To have an atomistic view of the interaction between the porphyrin molecule and the target nucleobase, we show in Figure 3 the charge density difference (CDD) of the GEPM + target nucleobase systems [36]. For systems A, C, and T, the main contributions are from some carbon atoms and minor contributions from some nitrogen atoms in the porphyrin ring. In system G, however, all the carbon and nitrogen atoms in the entire porphyrin ring contribute to the charge transfer, which may explain the maximal value of E i and charge transfer in the system G. To ensure the completeness of our work, we also calculate the interaction energies between the nucleobases and the graphene nanoribbon. The results are shown in Table 1, which shows agreement with the previously reported literature value [8].
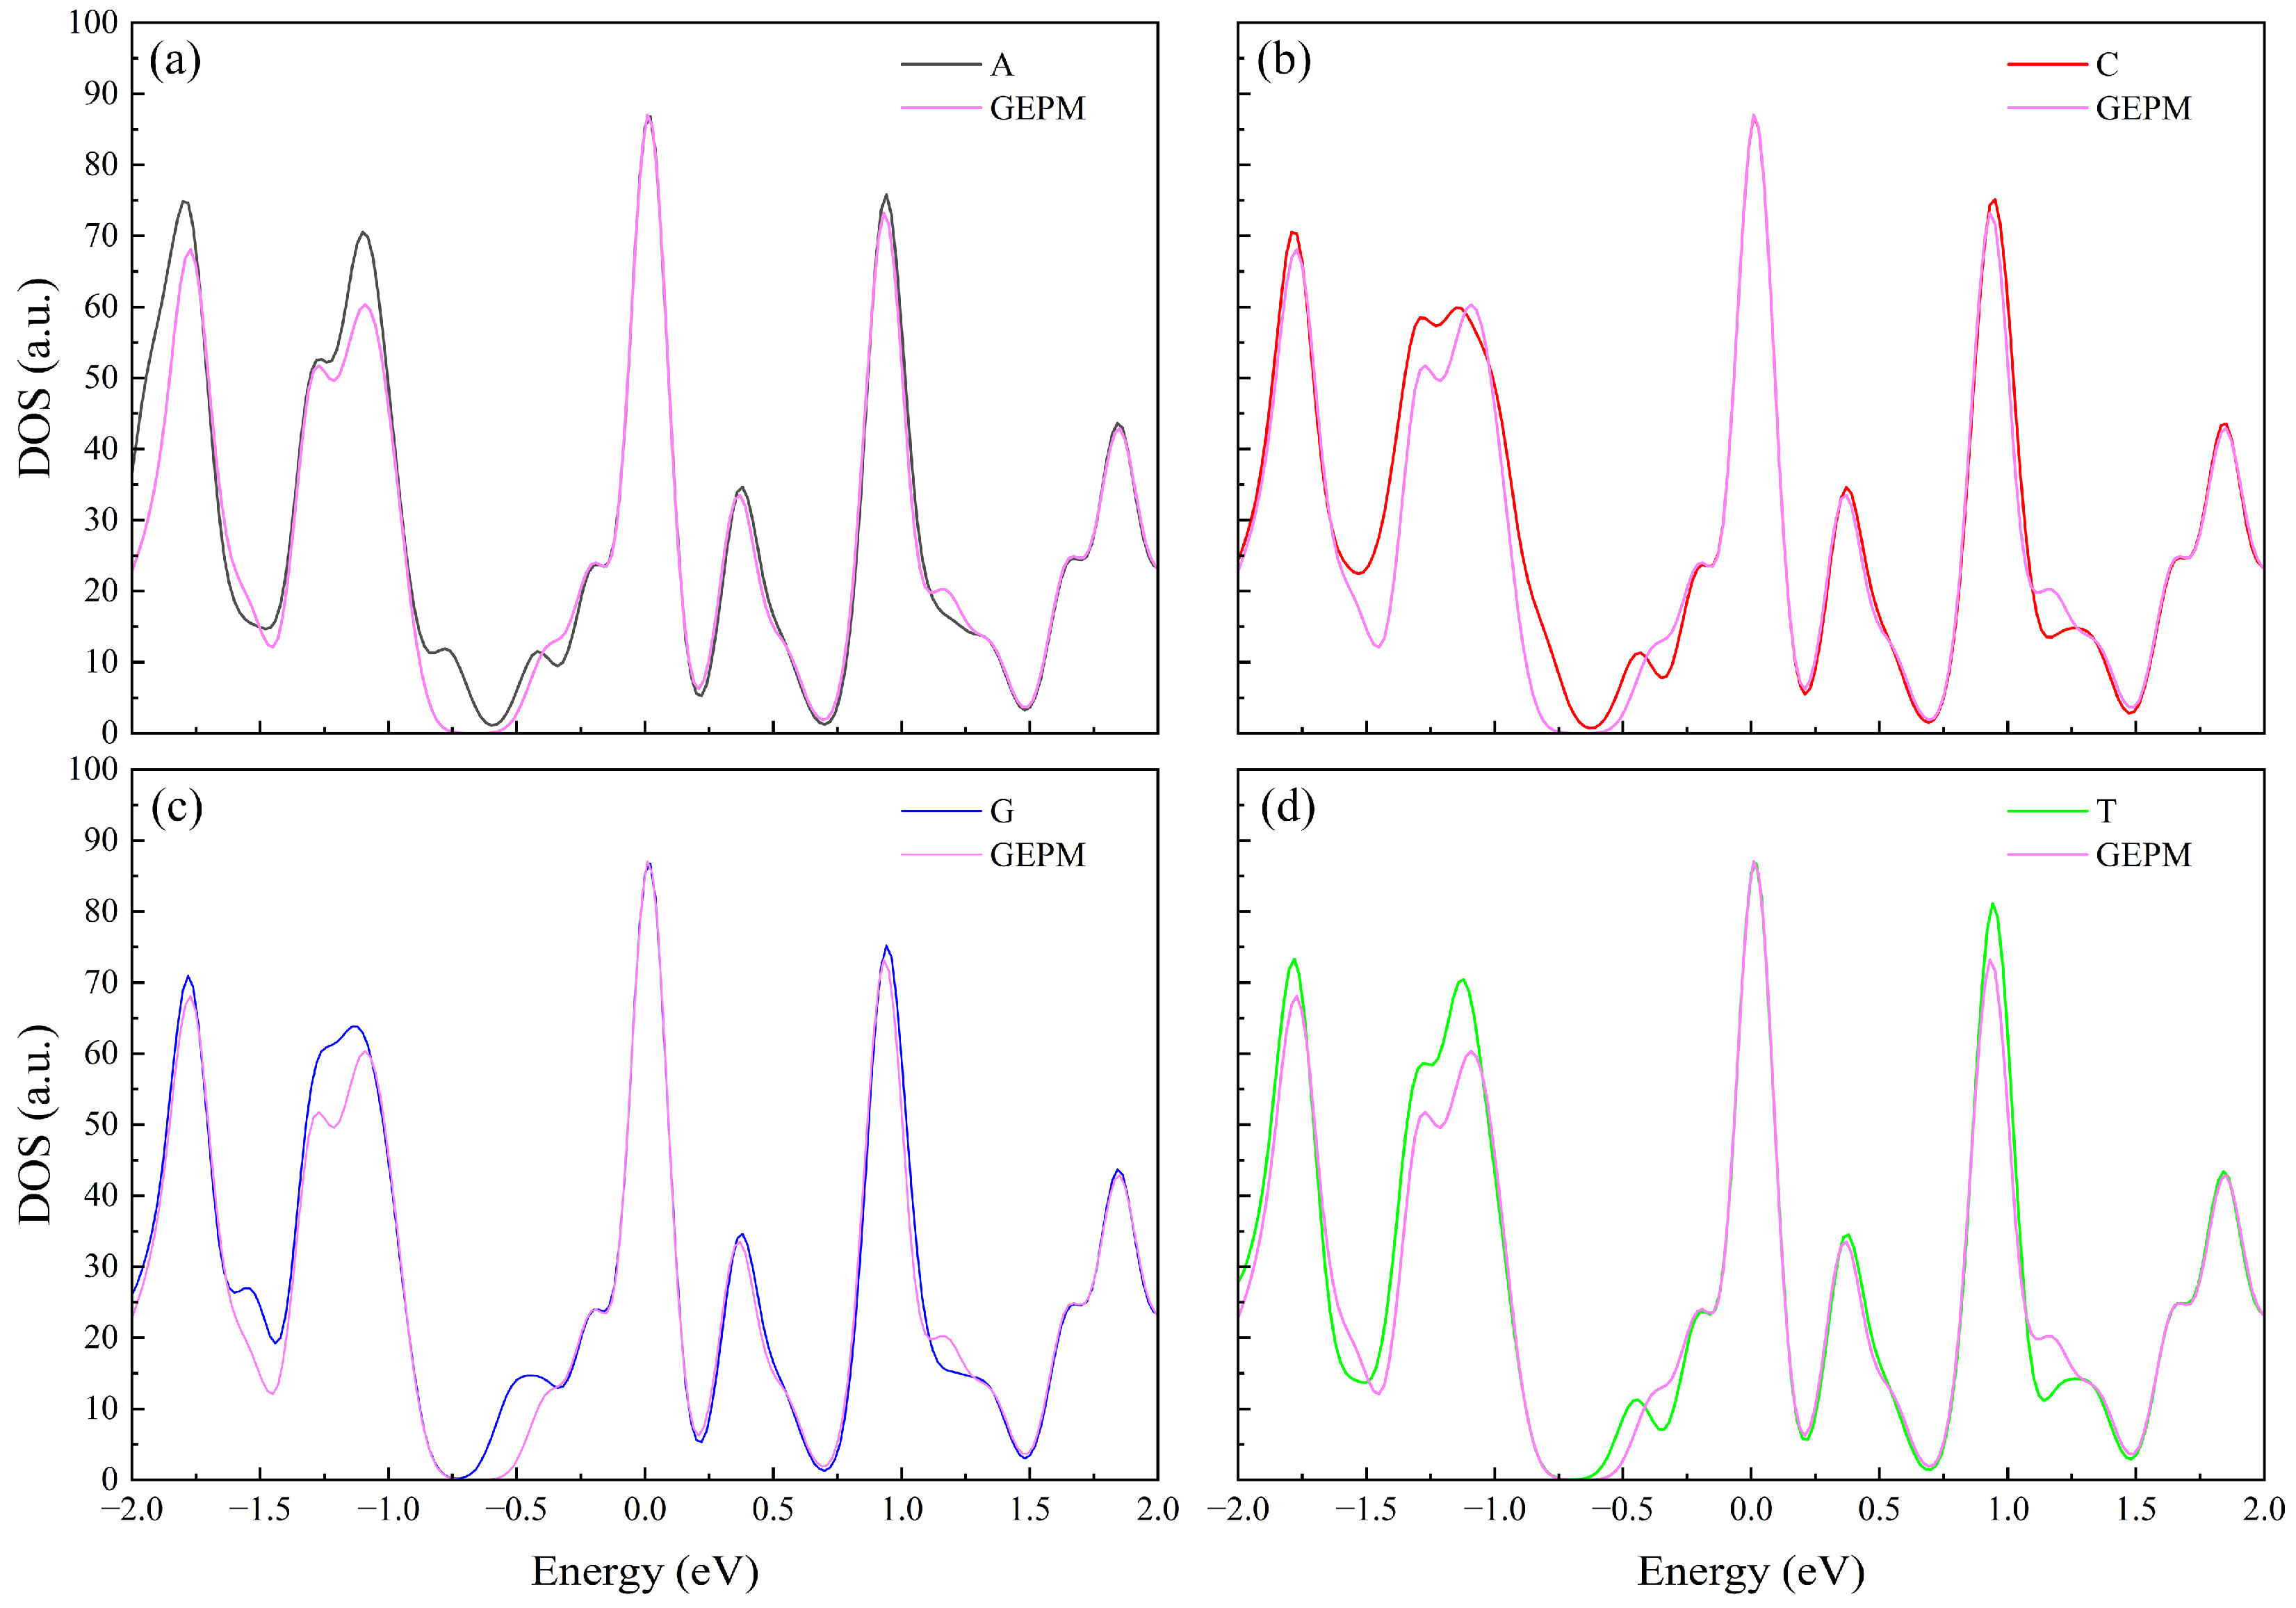
In Figure 4 we illustrate the change in density of states (DOS) of the GEPM device after the adsorption of the four nucleobases. It can be observed that the main changes are around 1.5 eV below the Fermi energy, where the four nucleobases contribute to the DOS distinctly, indicating that the system may be capable of distinguishing these nucleobases.
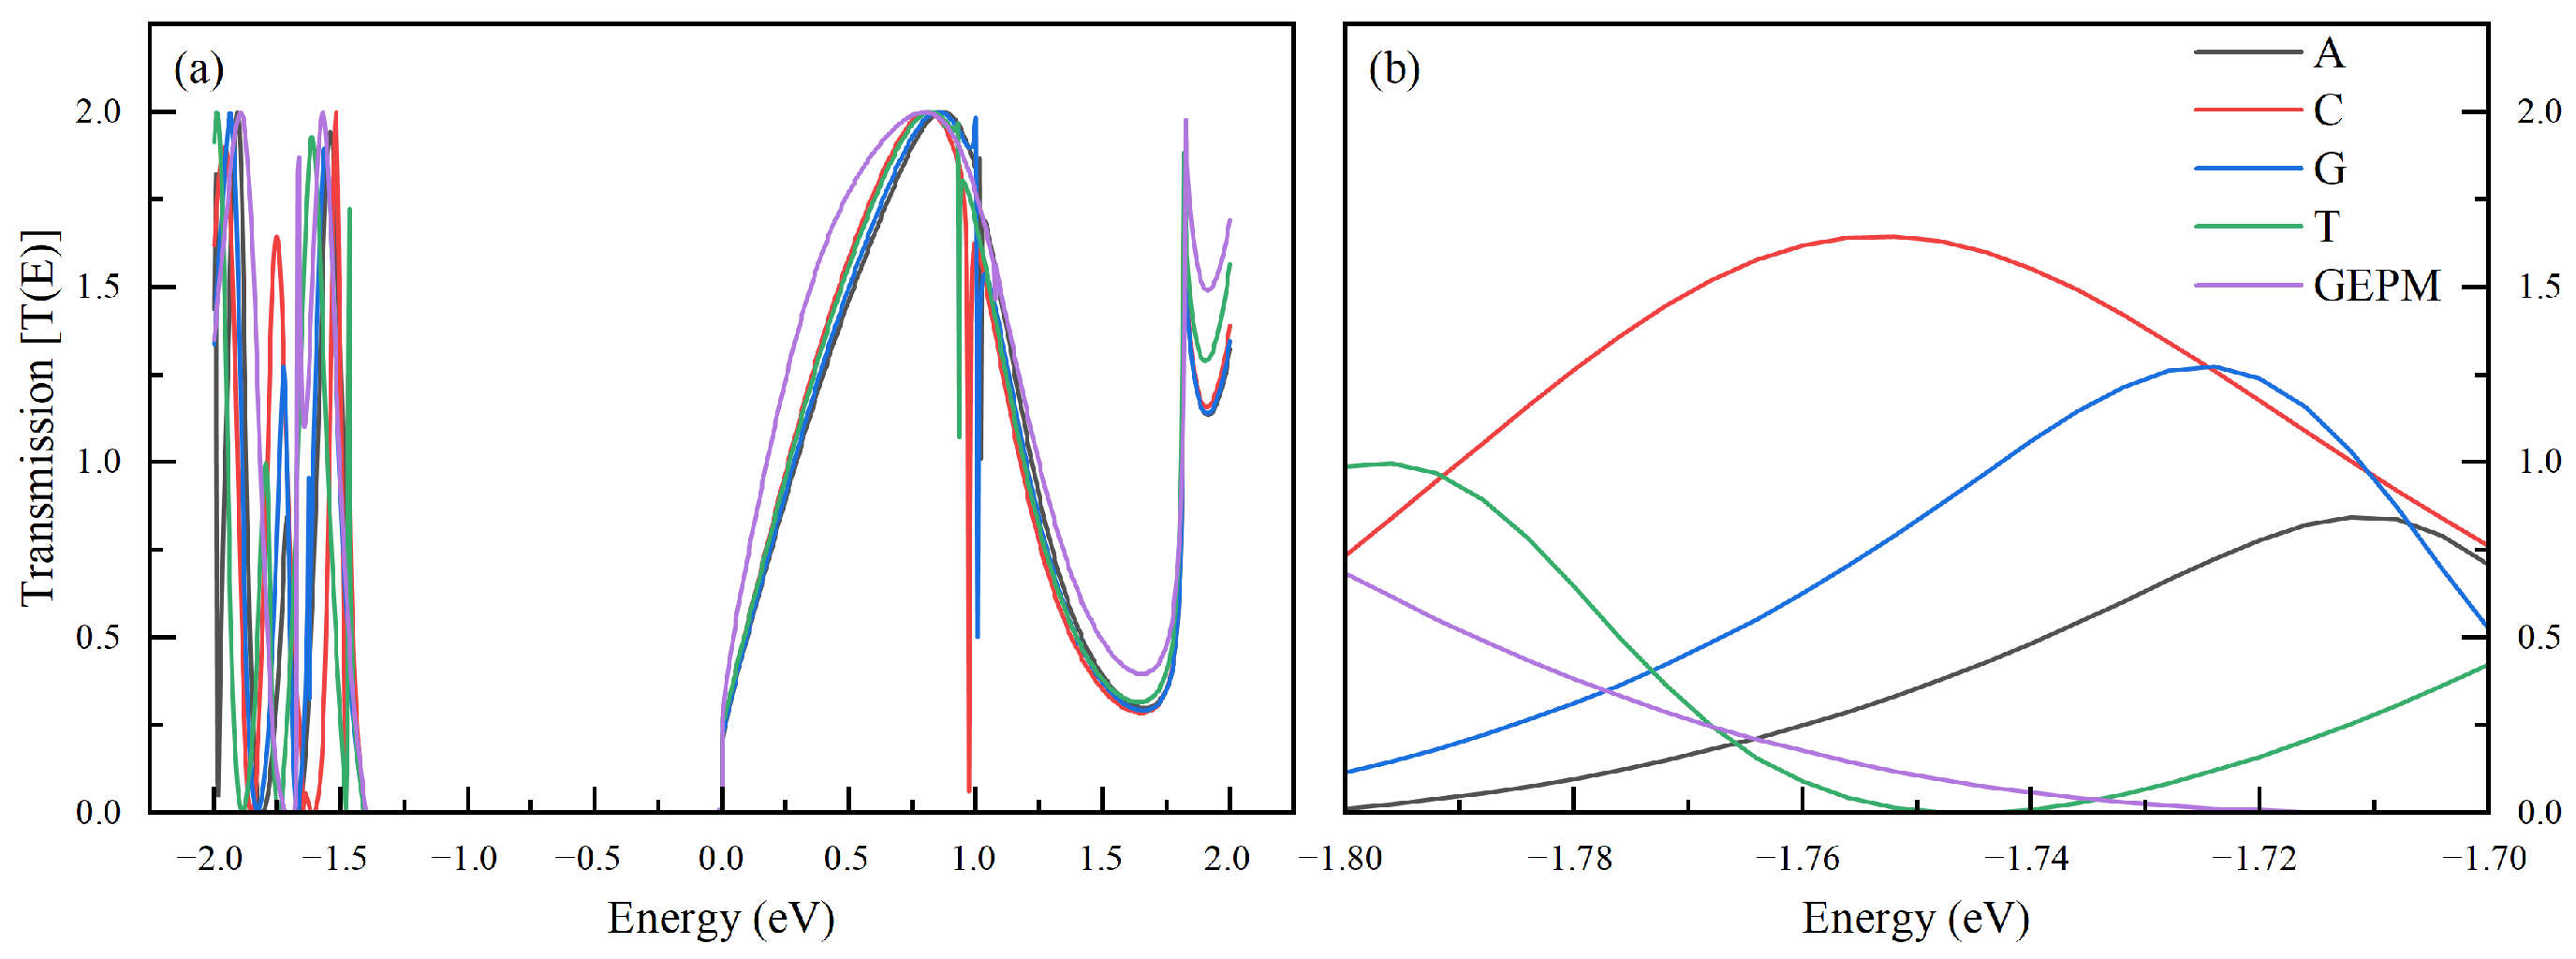
The transmission spectra T(E) of the bare GEPM device and devices A, C, G, and T based on Equation (2) are presented in Figure 5a. All five devices exhibit a roughly similar overall behavior. Nevertheless, the differences between the systems are quite evident in some energy range, as shown in the zoomed view of Figure 5b. Employing a gate voltage bias and measuring the linear conductance of the device, we can distinguish systems with a different nucleobase adsorbate based on transmissions at different energies. The conductance sensitivity SG at zero bias can then be determined from Equation (4). SG values of different systems at energy E = −1.752 eV are listed in Table 1.
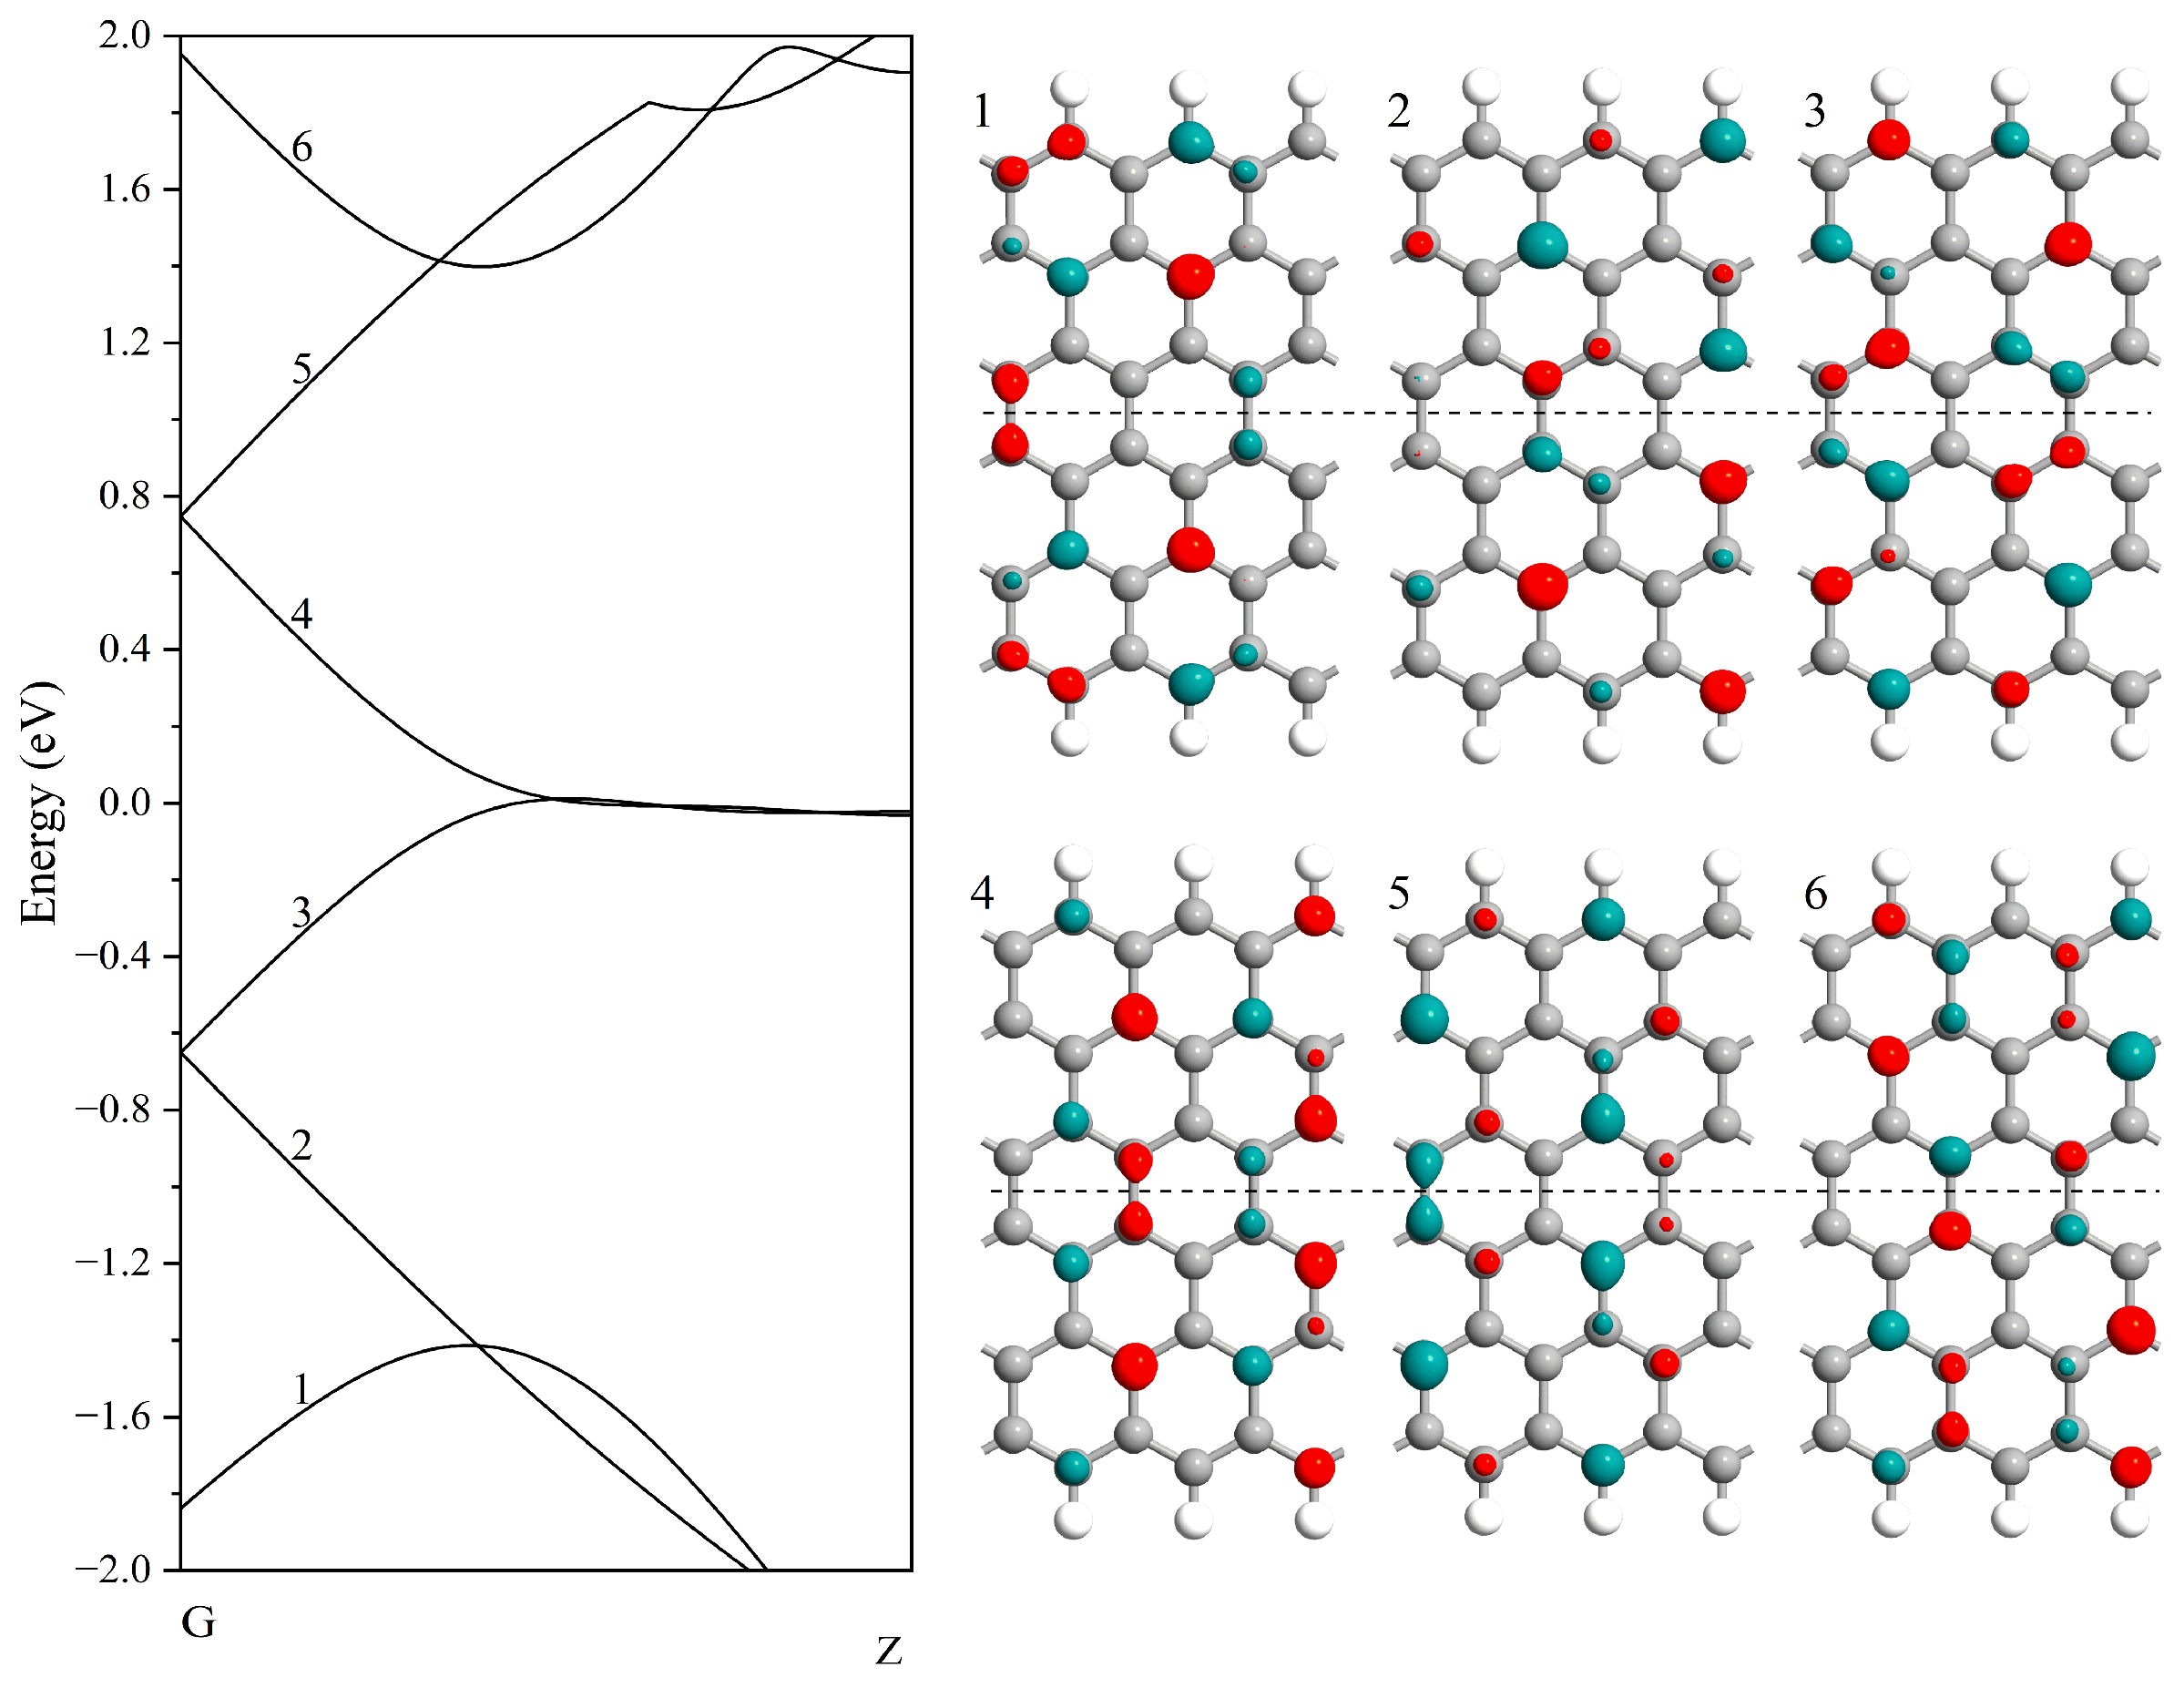
A broad transmission gap appears just below the Fermi energy in the energy range from about −1.47 to 0 eV, as shown in Figure 5a, in contrast to the corresponding continuous DOS spectra shown in Figure 4. This transmission gap origin from the filtering effect due to the mismatch of wave functions between the carbon atomic chain and the nanoribbon is addressed in Ref. [37]. The electrons near the Fermi energy in the carbon chains are in px or py orbitals, which are symmetric or antisymmetric with respect to the x-z and y-z planes through the axis. On the other hand, the electrons in the nanoribbons of electrodes are in px orbitals, which are antisymmetric with respect to the y-z plane of the nanoribbon. Because the carbon chains are connected to the nanoribbons along their symmetric axis, as illustrated in Figure 1a, only electrons in states symmetric with respect to the x-z plane can transport through the three-membered contacts between them. In Figure 6 we present the energy bands 1–6 and the corresponding wave function distributions in the nanoribbons of electrodes near the Fermi energy. The wave functions of states in bands 2 and 3 are antisymmetric with respect to the x-z plane through the axis (dashed line). As a result, electrons from bands 2 and 3 cannot transport through the GEPM device and do not contribute to the transmission. The transmission gap then appears since there is only band 2 or 3 in that energy range. To further confirm the above understanding, we present the molecular energy spectrum of the central scattering region and the corresponding electronic wave functions in the energy range [−0.9 eV, 0.9 eV] in the Supporting Information (SI). There we can see that none of the states below the Fermi energy are distributed over both the carbon chain and the nanoribbon regions, suggesting blocking of electronic transfer through the device in that energy range.
The sensing capability of a biosensor relies on the changes in electronic conductance. In Figure 7 we show the conductance sensitivity versus the interaction energy at E = −1.752 eV. The GEPM device exhibits good capability to distinguish different nucleobases compared to some other graphene-based devices, which are about 29%, 76%, 59%, and 52% for A, G, T, and C, respectively [13]. Vasudeo et al. recently proposed the use of a MoSH monolayer for DNA nucleobase sequencing, achieving a transmission spectrum sensitivity of around 10% and a current sensitivity of approximately 1% [68]. Moreover, many results with higher sensitivity exhibit very small current signals (in the nanoampere range) [11,12]. Our simulation results suggest that the transverse tunneling currents in our proposed graphene nanoribbon-based device can reach the microampere scale, while still maintaining reasonable sensitivity, which may offer an advantage in terms of signal strength and detection reliability. A much higher conductance sensitivity for the G base than the others is observed. There is no monotonic dependency of the conductance sensitivity on the interaction energy, suggesting other characteristics have also affected the conductance sensitivity [14]. In addition, as observed in Figure 5, the conductance sensitivity can vary significantly at a different energy or gage voltage, which can further help distinguish the bases from each other.
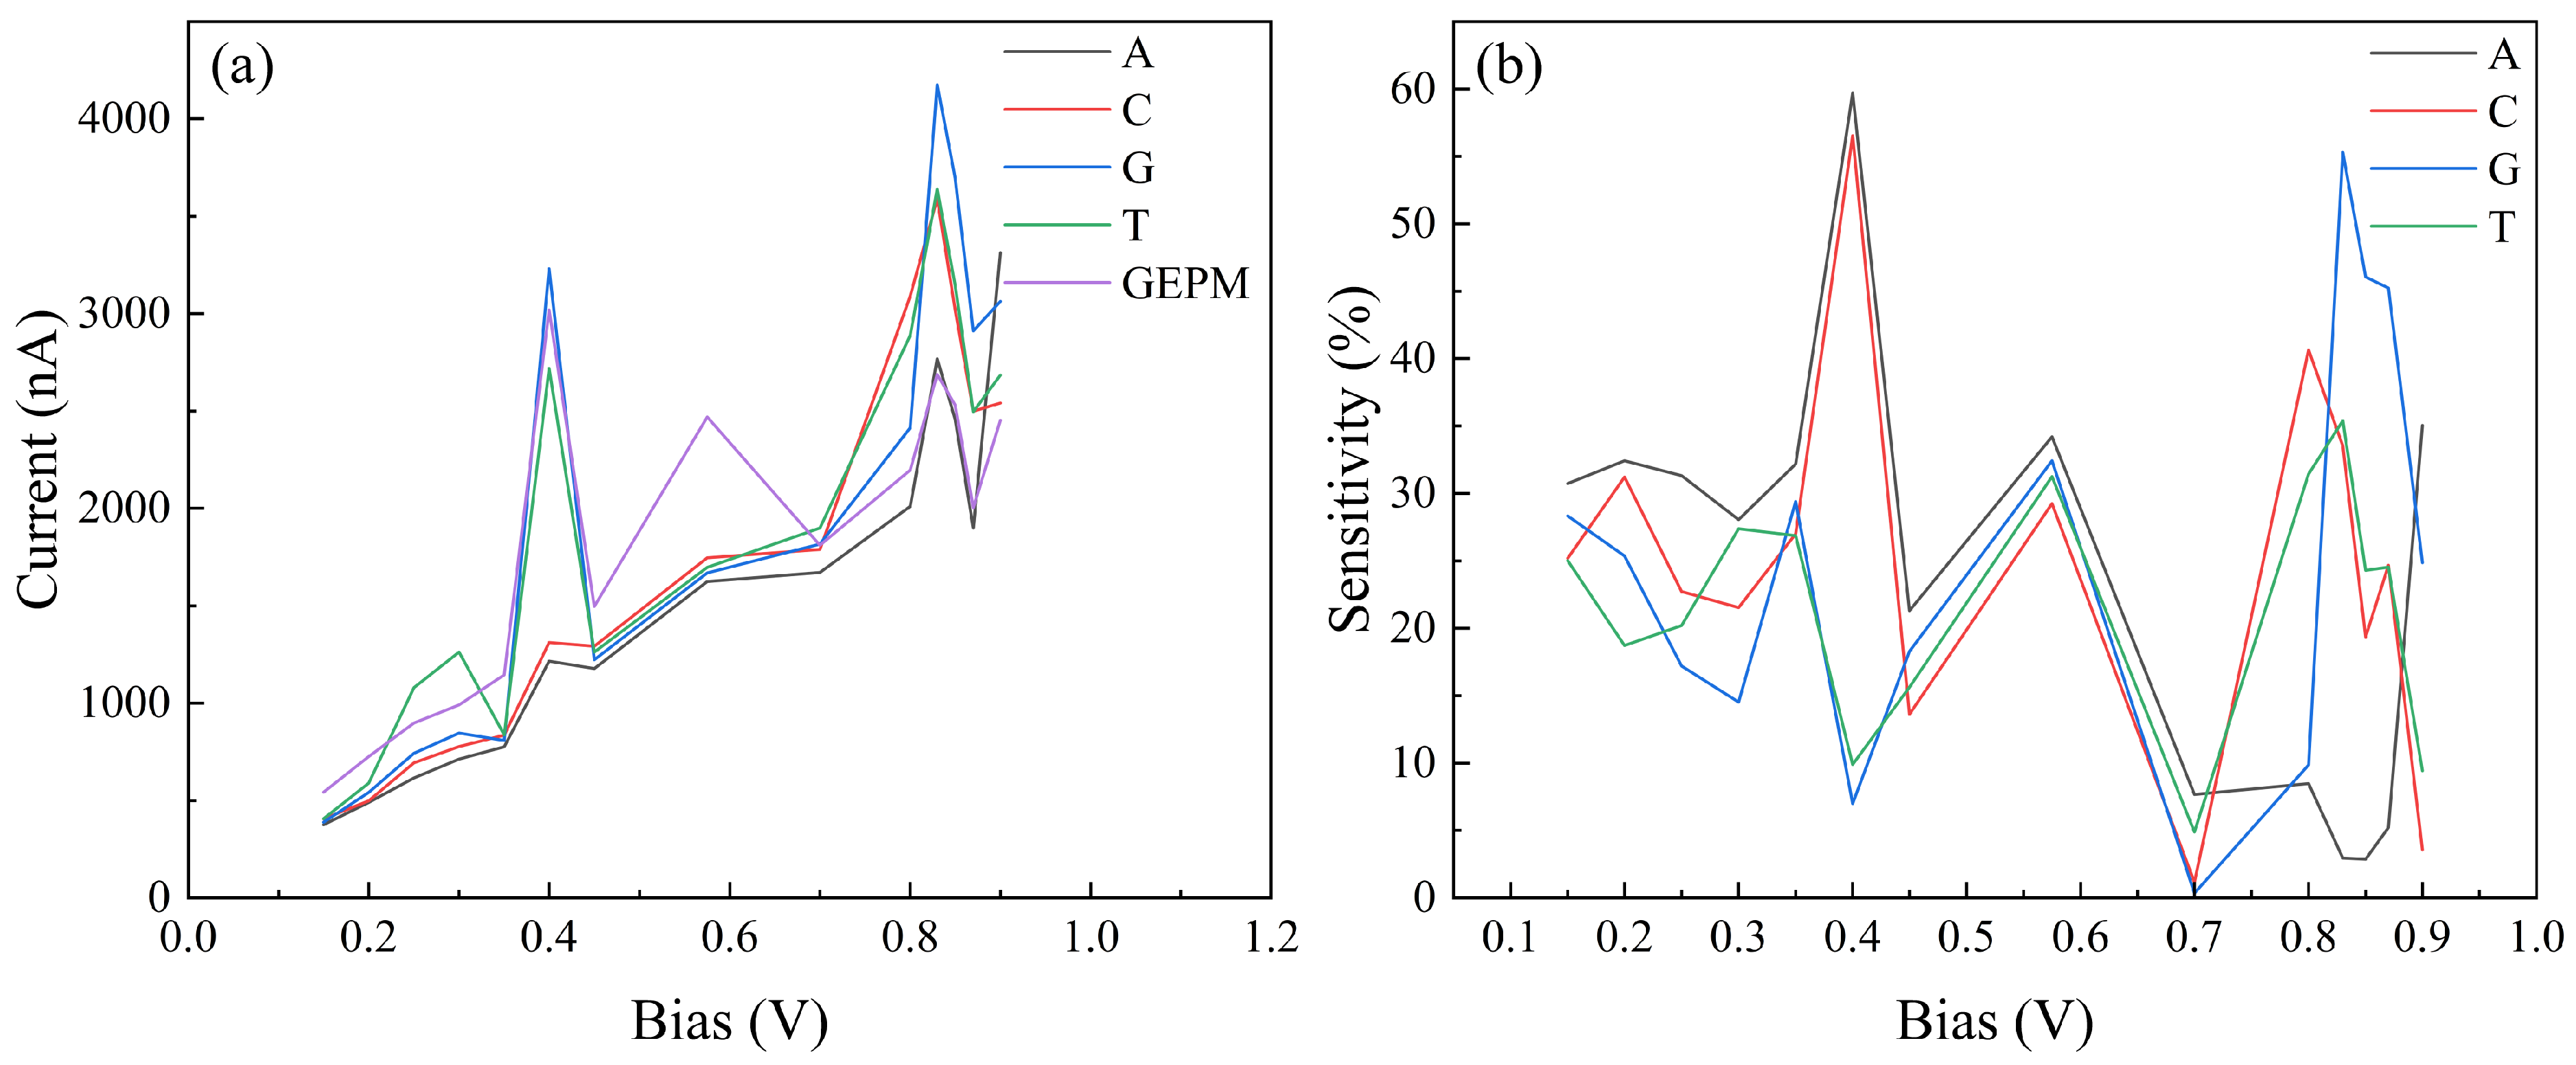
By applying a varying voltage bias across the GEPM device, we can collect additional information for the identification of individual bases. Here we use the NEGF method to simulate the I-V characteristics of the bare GEPM and the GEPM + nucleobase devices. Figure 8a displays the I-V curves of the five devices in the bias range of 0–1 V. Obvious negative differential resistance (NDR) effects can be observed around 0.4 V and 0.85 V, which can be attributed to the evolution of the transmission spectrum under applied bias. As the bias voltage increases, the alignment between the transmission peaks and the bias window changes. Transmission peaks that initially contribute to the current move outside the bias window, resulting in a decrease in current with increasing voltage. The transmission spectra under bias are shown in SI. This phenomenon leads to the appearance of NDR. Such bias-dependent shifting of transmission features is a common origin of NDR in nanoscale transport systems. Notably, significant differential resistance effects are observed around 0.4 V and 0.85 V. The detailed transmission spectra T(E) around these two voltages are given in SI. Under bias of 0.4 V, the I-V curves can be categorized into two groups: larger currents for devices G, GEPM, and T, and smaller currents for devices C and A. While there is a marked difference in current signal between these groups, distinguishing the devices within each group based on their current alone is challenging. Interestingly, from 0.8 V, all current curves show a sharp growth, making distinctions among the currents more evident. We calculate the current sensitivity of the devices using Equation (4), as shown in Figure 8b. It can be observed that at 0.85 V, except for device A, the GEPM + nucleobase systems exhibit high and well-separated current sensitivities, with a dataset of 3% (A), 19% (C), 46% (G), and 24% (T), as shown in Figure 8 Though device A has a relatively low sensitivity of 3%, it has a high sensitivity of 60% at 0.4 V. This suggests that a two-step measurement approach could be employed to effectively differentiate the four bases.
Since the zigzag-shaped edges of graphene can be easily magnetized [69,70], we may also take advantage of the magnetic properties of the devices for the identification of the bases. The spin-differential electric density of the GEPM, as shown in the SI, indicates that the device can be magnetized due to the spin polarization of carbon atoms at the zigzag edges and the carbon chains. We can set up the device in parallel (P) or antiparallel (AP) magnetization configurations of the electrodes, as shown in Figure 9, and measure the spin-polarized conductance or current over the device as well as the effects of the bases. This can characterize further the GEPM devices with and without bases.
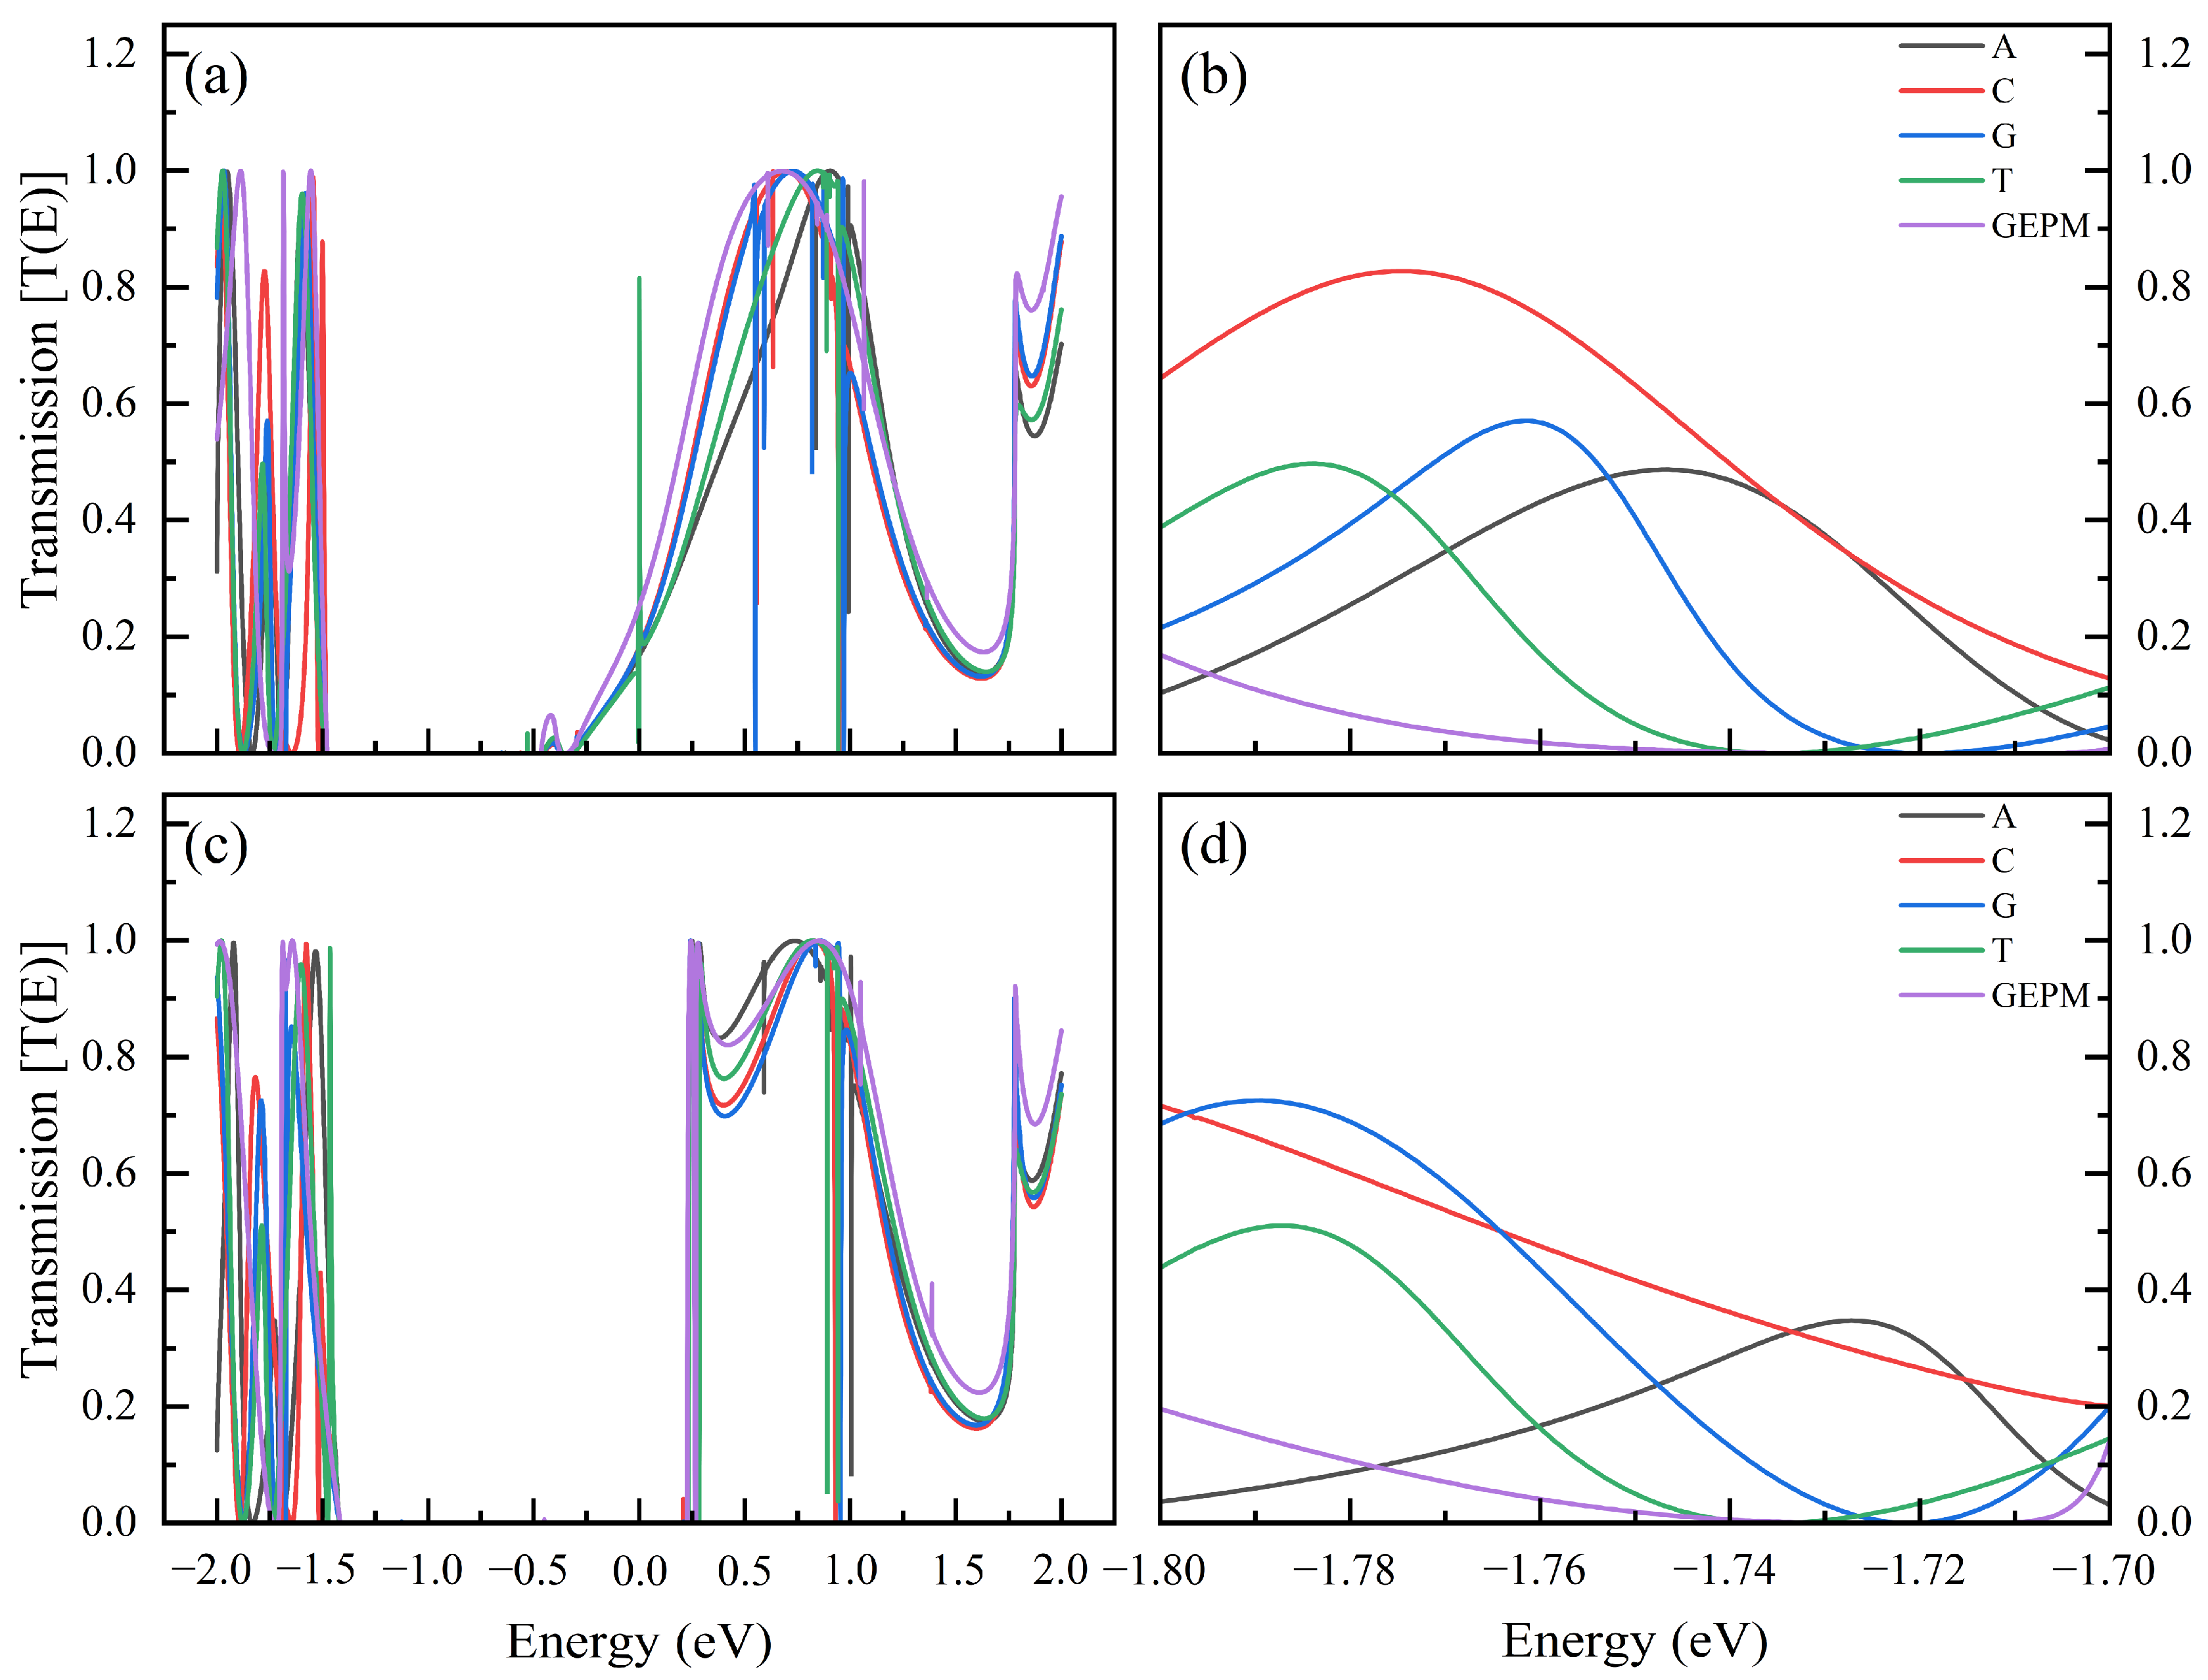
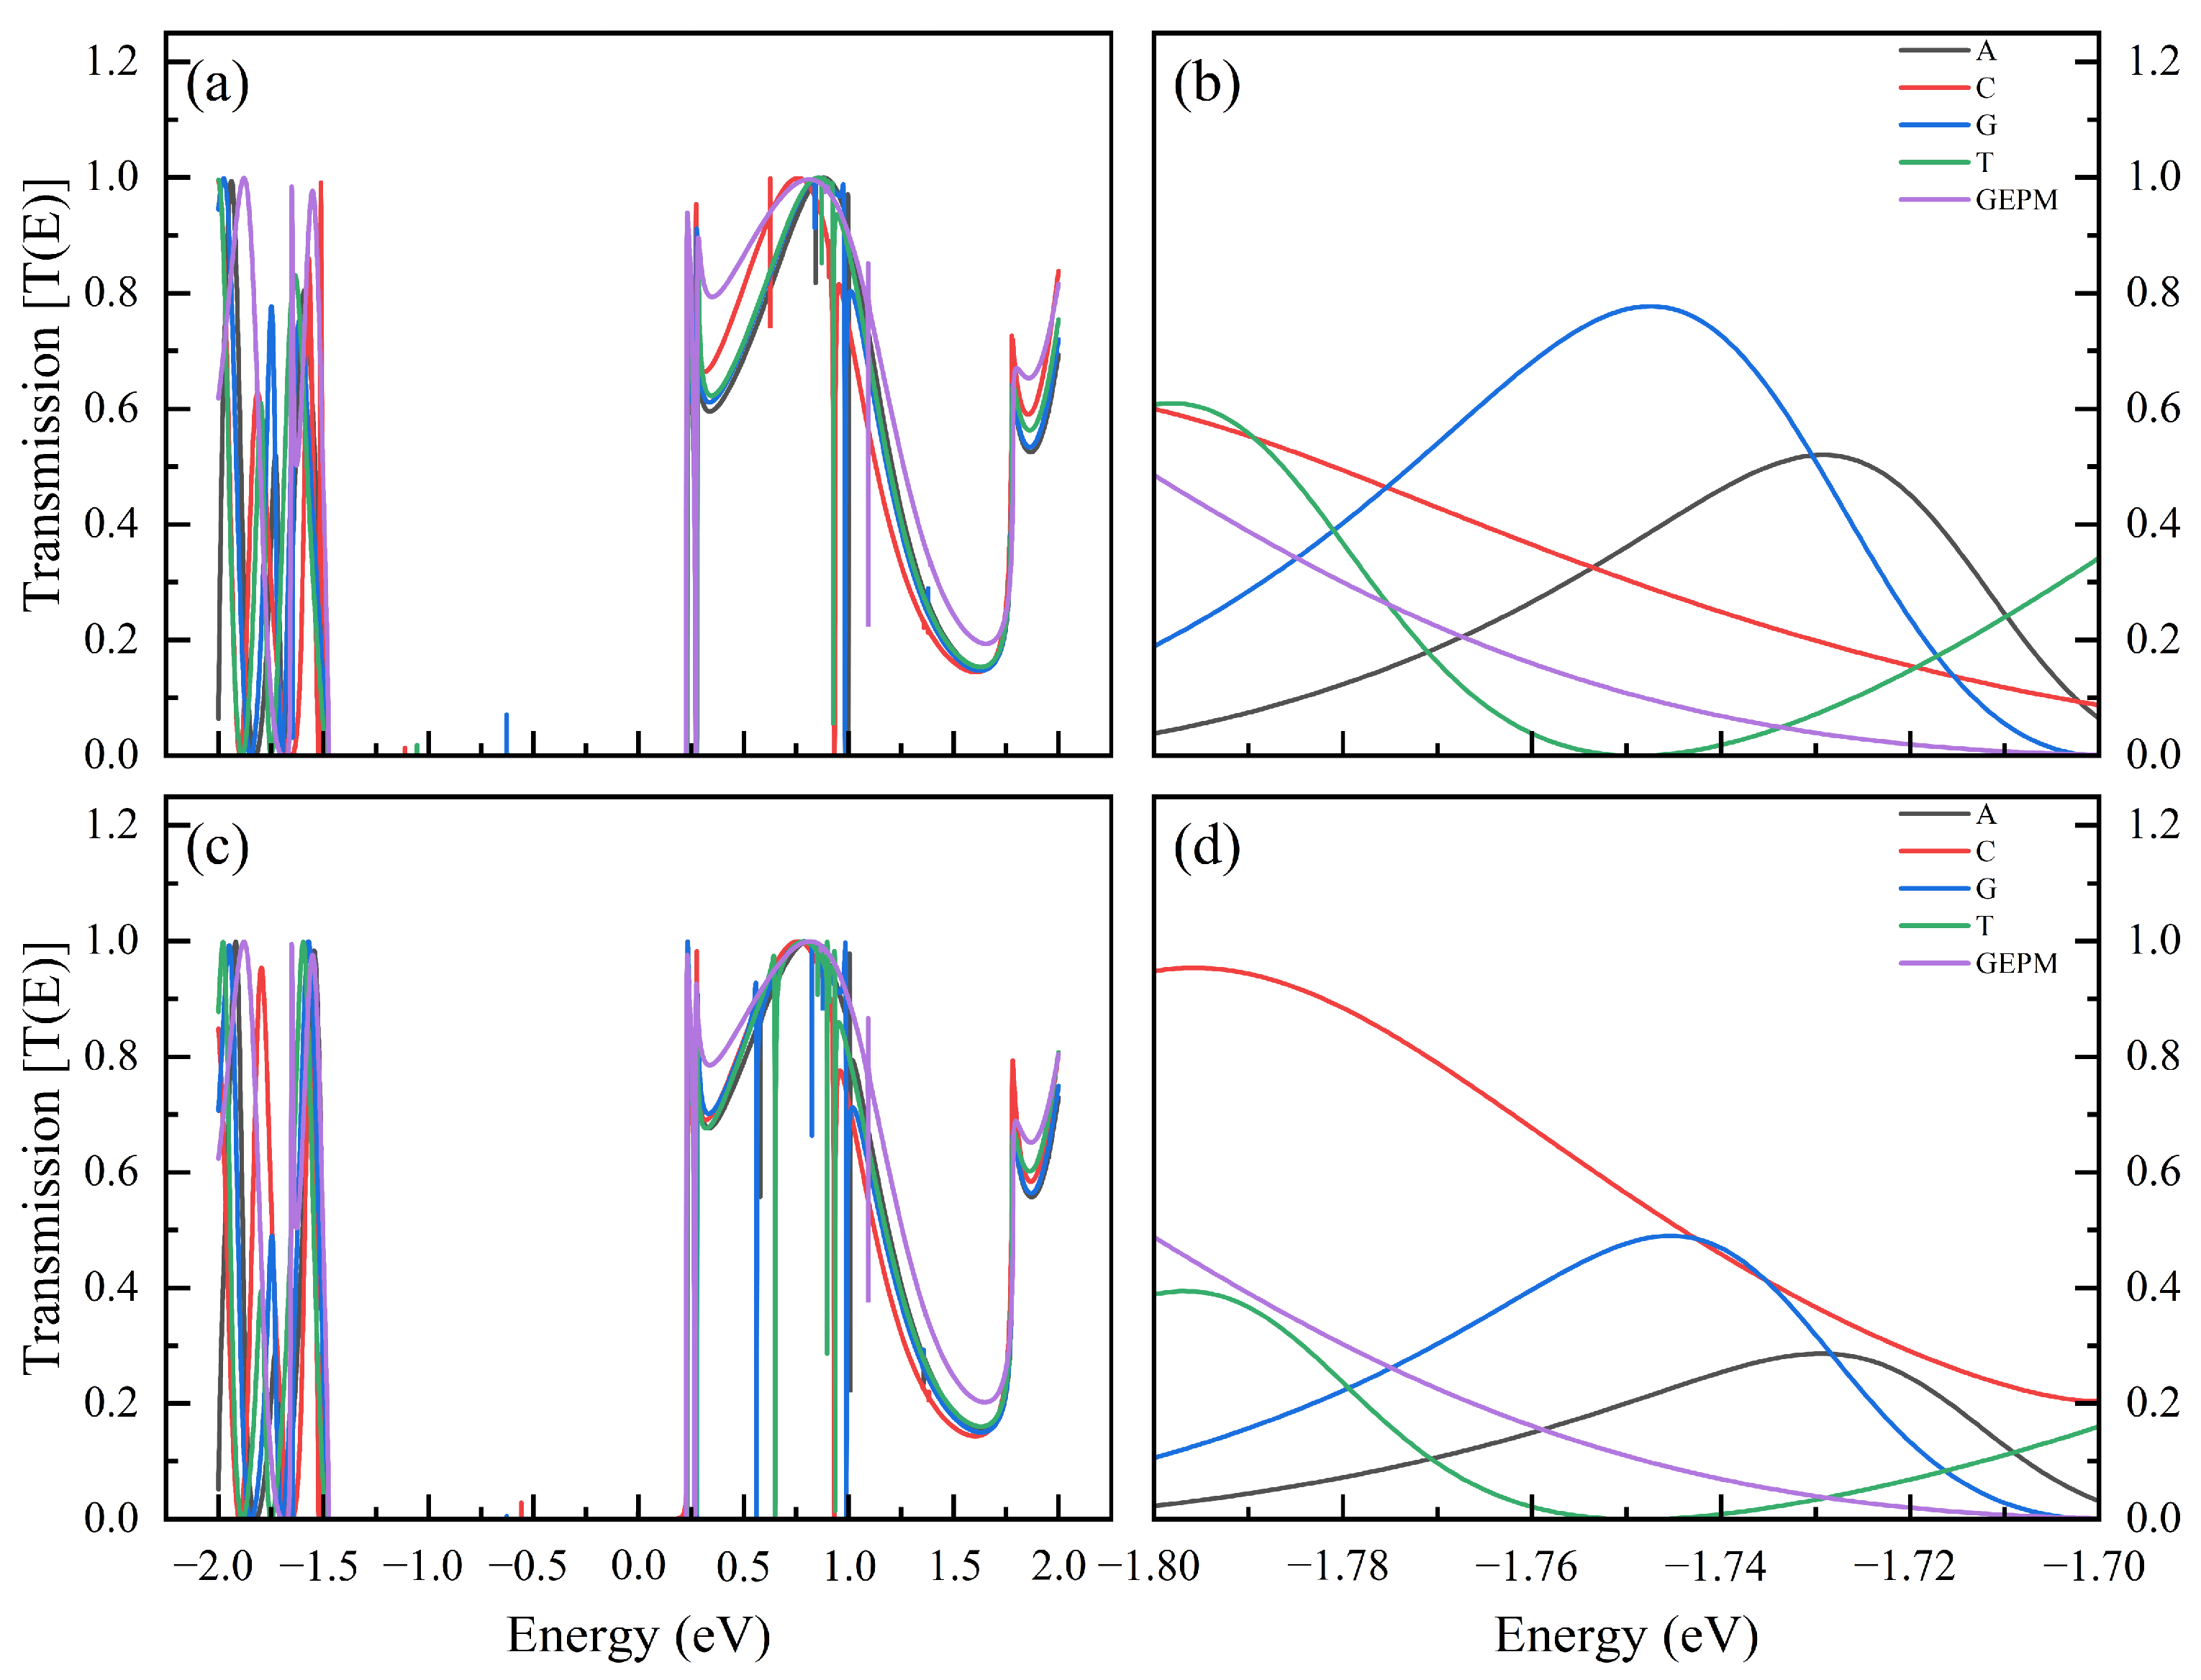
In Figure 10 we present the zero-bias transmission spectra of the GEPM and GEPM + nucleobase devices in the P configuration of electrode magnetization. The transmission gap below the Fermi energy narrows for spin-up electrons as shown in Figure 10a,b, while it widens for spin-down electrons as shown in Figure 10c,d. This happens because energy bands 2–5 of the edge states in Figure 6 shift downward (upward) for spin-up (spin-down) electrons due to the Zeeman effect of the edge magnetization in the electrodes. The transmission profiles outside the gap also differ greatly for the opposite spins. Based on Equation (4), we can calculate the conductance sensitivity similar to the no-spin analysis in Figure 5. Here we find both spin-up and spin-down electrons exhibit high sensitivity at energies around −1.77 eV. For instance, the conductance sensitivities of detecting A, C, G, and T bases are 10,457%, 12,444%, 6356%, and 430%, respectively, for spin-up electrons at E = −1.746 eV, and are 1099%, 2111%, 1332%, 153% for spin-down electrons at E = −1.7496 eV.
In the AP magnetization configuration of the electrodes, the transmission spectra T(E) have wider gaps below the Fermi energy compared to those in the nonmagnetic cases for both spin-up and spin-down electrons, as shown in Figure 11. This happens because energy bands 2–5 of the edge states in Figure 6 shift up in one electrode and shift down in the other electrode for both spins. The obtained conductance sensitivities of devices A, C, G, and T are 2847%, 1100%, 822%, and 1835%, respectively, for spin-up electrons at E = −1.713 eV and 1121%, 1348%, 566%, 243% for spin-down electrons at E = −1.720 eV. Note that the devices might be arranged in other magnetization configurations by setting the spin polarization σ 1 , σ 2 , σ 3 , and σ 4 on edge with different combinations. However, the obtained conductance sensitivities are quite low in configurations other than P and AP and are not presented.

4. Conclusions

We propose a device based on zigzag graphene nanoribbon electrodes combined with a porphyrin molecule (GEPM) for DNA nucleobase sequencing. This is achieved by examining the electronic conductivity and current characteristics of the pristine GEPM and GEPM + N (N = A, C, G, and T) systems using DFT and NEGF calculation methods. Carbon atomic chains are used to connect the porphyrin to the electrodes via a symmetric three-membered ring structure, which can filter electrons from specific electrode bands, resulting in a broad transmission gap near the Fermi energy in the transmission spectra. For system GEPM + G, the more electronegative nitrogen atoms in the porphyrin molecule make significant contributions to the interactions, resulting in the maximum interaction energy. The electronic conductance sensitivities for the device to detect bases A, C, G, and T under a gate voltage near −1.752 V can reach 176%, 127%, 556%, and 88%, respectively. Under a lower bias voltage of 0.4V, the device can categorize the four bases into two classes: A and C, and G and T. Then it can distinguish individual bases under a higher voltage of 0.85 V with current sensitivities of 3%, 19%, 46%, and 24%, respectively.
We also investigate the spin effects on the nucleobase identification in different magnetization configurations of zigzag graphene electrodes. The parallel configuration exhibits higher electrical conductivity sensitivity (10,457%, 12,444%, 6356%, and 430% for A, C, G, and T, respectively). These results demonstrate that, in theory, the proposed system can effectively distinguish between DNA nucleobases. Our study offers a novel structural design that enriches the landscape of DNA sequencing technologies and provides researchers in the field with a new theoretical approach. It also highlights that our investigation is purely theoretical at this stage, and we acknowledge that realizing such a device experimentally may face significant practical challenges.

Supplementary Materials

The following supporting information can be downloaded at https://www.mdpi.com/article/10.3390/electronics14091814/s1, Figure S1: Transmission spectra T(E) of bare GEPM obtained using different k-point schemes; Table S1: Detailed data of the geometric structures of GEPM + nucleobase (A, C, G, and T) systems; Figure S2: Top and side views of fully relaxed GEPM + nucleobase (A, C, G, and T) systems; Figure S3: The density of states (DOS), molecular energy spectrum (MES) of the central region, transmission spectrum of the bare GEPM device, and electron wave functions corresponding to those labeled 1–16 in MES; Figure S4: The transmission spectrum of the bare GEPM device under bias; Figure S5: Spin density distribution in the bare GEPM device; Figure S6: The top view of the geometric structure of a porphyrin molecule connected to two straight carbon chains.

Author Contributions

Conceptualization, Y.-K.L., L.-P.Z. and X.-F.W.; methodology, Y.-K.L.; formal analysis, Y.-K.L.; writing—original draft preparation, Y.-K.L.; writing—review and editing, Y.-K.L., L.-P.Z., X.-F.W., P.V., W.-L.Y. and Y.-S.L.; funding acquisition, L.-P.Z. and X.-F.W. All authors have read and agreed to the published version of the manuscript.

Funding

This research was funded by National Natural Science Foundation of China (Grant Nos. 62274113, 62174016, and 61674110).

Data Availability Statement

The original contributions presented in the study are included in the article/Supplementary Materials; further inquiries can be directed to the corresponding authors.

Conflicts of Interest

The authors declare no conflicts of interest.

References

  1. Shendure, J.; Ji, H. Next-Generation DNA Sequencing. Nat. Biotechnol. 2008, 26, 1135–1145. [Google Scholar] [CrossRef]
  2. Steinbock, L.J.; Radenovic, A. The Emergence of Nanopores in Next-Generation Sequencing. Nanotechnology 2015, 26, 074003. [Google Scholar] [CrossRef] [PubMed]
  3. Rabbani, B.; Mahdieh, N.; Hosomichi, K.; Nakaoka, H.; Inoue, I. Next Generation Sequencing: Implications in Personalized Medicine and Pharmacogenomics. Mol. BioSyst. 2016, 12, 1818–1830. [Google Scholar] [CrossRef] [PubMed]
  4. Zhong, Y.; Xu, F.; Wu, J.; Schubert, J.; Li, M.M. Application of Next Generation Sequencing in Laboratory Medicine. Ann. Lab. Med. 2021, 41, 25–43. [Google Scholar] [CrossRef] [PubMed]
  5. Chen, X.; Kang, Y.; Luo, J.; Pang, K.; Xu, X.; Wu, J.; Li, X.; Jin, S. Next-Generation Sequencing Reveals the Progression of COVID-19. Front. Cell. Infect. Microbiol. 2021, 11, 632490. [Google Scholar] [CrossRef]
  6. Seo, G.; Lee, G.; Kim, M.J.; Baek, S.H.; Choi, M.; Ku, K.B.; Lee, C.S.; Jun, S.; Park, D.; Kim, H.G.; et al. Rapid Detection of COVID-19 Causative Virus (SARS-CoV-2) in Human Nasopharyngeal Swab Specimens Using Field-Effect Transistor-Based Biosensor. ACS Nano 2020, 14, 5135–5142. [Google Scholar] [CrossRef]
  7. Ciotti, M.; Angeletti, S.; Minieri, M.; Giovannetti, M.; Benvenuto, D.; Pascarella, S.; Sagnelli, C.; Bianchi, M.; Ciccozzi, M.; Bernardini, S. The COVID-19 Pandemic. Crit. Rev. Clin. Lab. Sci. 2020, 57, 365–388. [Google Scholar] [CrossRef]
  8. Lee, J.-H.; Choi, Y.-K.; Kim, H.-J.; Scheicher, R.H.; Cho, J.-H. Physisorption of DNA Nucleobases on h-BN and Graphene: vdW-Corrected DFT Calculations. J. Phys. Chem. C 2013, 117, 24242–24249. [Google Scholar] [CrossRef]
  9. Prasongkit, J.; Grigoriev, A.; Pathak, B.; Ahuja, R.; Scheicher, R.H. Theoretical Study of Electronic Transport through DNA Nucleotides in a Double-Functionalized Graphene Nanogap. J. Phys. Chem. C 2013, 117, 15421–15428. [Google Scholar] [CrossRef]
  10. Kumawat, R.L.; Garg, P.; Bhattacharyya, G.; Pathak, B. Electronic Transport through DNA Nucleotides in BC3 Nanogap for Rapid DNA Sequencing. ACS Appl. Electron. Mater. 2020, 2, 1218–1225. [Google Scholar] [CrossRef]
  11. Kumawat, R.L.; Pathak, B. Functionalized Carbon Nanotube Electrodes for Controlled DNA Sequencing. Nanoscale Adv. 2020, 2, 4041–4050. [Google Scholar] [CrossRef] [PubMed]
  12. Shukla, V.; Jena, N.K.; Grigoriev, A.; Ahuja, R. Prospects of Graphene-hBN Heterostructure Nanogap for DNA Sequencing. ACS Appl. Mater. Interfaces 2017, 9, 39945–39952. [Google Scholar] [CrossRef] [PubMed]
  13. Kumawat, R.L.; Pathak, B. Extended Topological Line Defects in Graphene for Individual Identification of DNA Nucleobases. Mater. Adv. 2020, 1, 2908–2916. [Google Scholar] [CrossRef]
  14. Kumawat, R.L.; Jena, M.K.; Pathak, B. Individual Identification of Amino Acids on an Atomically Thin Hydrogen Boride System Using Electronic Transport Calculations. J. Phys. Chem. C 2020, 124, 27194–27202. [Google Scholar] [CrossRef]
  15. Hayden, E.C. Technology: The $1000 Genome. Nature 2014, 507, 294–295. [Google Scholar] [CrossRef]
  16. Pathak, B.; Löfås, H.; Prasongkit, J.; Grigoriev, A.; Ahuja, R.; Scheicher, R.H. Double-Functionalized Nanopore-Embedded Gold Electrodes for Rapid DNA Sequencing. Appl. Phys. Lett. 2012, 100, 023701. [Google Scholar] [CrossRef]
  17. Mardis, E.R. A Decade’s Perspective on DNA Sequencing Technology. Nature 2011, 470, 198–203. [Google Scholar] [CrossRef]
  18. Siwy, Z.S.; Davenport, M. Graphene Opens up to DNA. Nat. Nanotechnol. 2010, 5, 697–698. [Google Scholar] [CrossRef]
  19. Arjmandi-Tash, H.; Belyaeva, L.A.; Schneider, G.F. Single Molecule Detection with Graphene and other Two-Dimensional Materials: Nanopores and Beyond. Chem. Soc. Rev. 2016, 45, 476–493. [Google Scholar] [CrossRef]
  20. Liu, H.; He, J.; Tang, J.; Liu, H.; Pang, P.; Cao, D.; Krstic, P.; Joseph, S.; Lindsay, S.; Nuckolls, C. Translocation of Single-Stranded DNA Through Single-Walled Carbon Nanotubes. Science 2010, 327, 64–67. [Google Scholar] [CrossRef]
  21. Branton, D.; Deamer, D.W.; Marziali, A.; Bayley, H.; Benner, S.A.; Butler, T.; Ventra, M.D.; Garaj, S.; Hibbs, A.; Huang, X.; et al. The Potential and Challenges of Nanopore Sequencing. Nat. Biotechnol. 2008, 26, 1146–1153. [Google Scholar] [CrossRef] [PubMed]
  22. Nelson, T.; Zhang, B.; Prezhdo, O.V. Detection of Nucleic Acids with Graphene Nanopores: Ab Initio Characterization of a Novel Sequencing Device. Nano Lett. 2010, 10, 3237–3242. [Google Scholar] [CrossRef] [PubMed]
  23. Traversi, F.; Raillon, C.; Benameur, S.M.; Liu, K.; Khlybov, S.; Tosun, M.; Krasnozhon, D.; Kis, A.; Radenovic, A. Detecting the Translocation of DNA through a Nanopore Using Graphene Nanoribbons. Nat. Nanotechnol. 2013, 8, 939–945. [Google Scholar] [CrossRef] [PubMed]
  24. Garaj, S.; Hubbard, W.; Reina, A.; Kong, J.; Branton, D.; Golovchenko, J.A. Graphene as a Subnanometre Trans-Electrode Membrane. Nature 2010, 467, 190–193. [Google Scholar] [CrossRef]
  25. Liu, K.; Feng, J.; Kis, A.; Radenovic, A. Atomically Thin Molybdenum Disulfide Nanopores with High Sensitivity for DNA Translocation. ACS Nano 2014, 8, 2504–2511. [Google Scholar] [CrossRef]
  26. Saha, K.K.; Drndić, M.; Nikolić, B.K. DNA Base-Specific Modulation of Microampere Transverse Edge Currents through a Metallic Graphene Nanoribbon with a Nanopore. Nano Lett. 2012, 12, 50–55. [Google Scholar] [CrossRef]
  27. Prasongkit, J.; Grigoriev, A.; Pathak, B.; Ahuja, R.; Scheicher, R.H. Transverse Conductance of DNA Nucleotides in a Graphene Nanogap from First Principles. Nano Lett. 2011, 11, 1941–1945. [Google Scholar] [CrossRef]
  28. Kumawat, R.L.; Garg, P.; Kumar, S.; Pathak, B. Electronic Transport through DNA Nucleotides in Atomically Thin Phosphorene Electrodes for Rapid DNA Sequencing. ACS Appl. Mater. Interfaces 2018, 11, 219–225. [Google Scholar] [CrossRef]
  29. Prasongkit, J.; Martins, E.F.; Souza, F.A.L.; Scopel, W.L.; Amorim, R.G.; Amornkitbamrung, V.; Rocha, A.R.; Scheicher, R.H. Topological Line Defects Around Graphene Nanopores for DNA Sequencing. J. Phys. Chem. C 2018, 122, 7094–7099. [Google Scholar] [CrossRef]
  30. Chang, S.; Huang, S.; He, J.; Liang, F.; Zhang, P.; Li, S.; Chen, X.; Sankey, O.; Lindsay, S. Electronic Signatures of all Four DNA Nucleosides in a Tunneling Gap. Nano Lett. 2010, 10, 1070–1075. [Google Scholar] [CrossRef]
  31. Postma, H.W.C. Rapid Sequencing of Individual DNA Molecules in Graphene Nanogaps. Nano Lett. 2010, 10, 420–425. [Google Scholar] [CrossRef] [PubMed]
  32. He, H.; Scheicher, R.H.; Pandey, R.; Rocha, A.R.; Sanvito, S.; Grigoriev, A.; Ahuja, R.; Karna, S.P. Functionalized Nanopore-Embedded Electrodes for Rapid DNA Sequencing. J. Phys. Chem. C 2008, 112, 3456–3459. [Google Scholar] [CrossRef]
  33. Min, S.K.; Kim, W.Y.; Cho, Y.; Kim, K.S. Fast DNA Sequencing with a Graphene-Based Nanochannel Device. Nat. Nanotechnol. 2011, 6, 162–165. [Google Scholar] [CrossRef]
  34. Rajan, A.C.; Rezapour, M.R.; Yun, J.; Cho, Y.; Cho, W.J.; Min, S.K.; Lee, G.; Kim, K.S. Two Dimensional Molecular Electronics Spectroscopy for Molecular Fingerprinting, DNA Sequencing, and Cancerous DNA Recognition. ACS Nano 2014, 8, 1827–1833. [Google Scholar] [CrossRef]
  35. Cho, Y.; Min, S.K.; Kim, W.Y.; Kin, K.S. The Origin of Dips for the Graphene-Based DNA Sequencing Device. Phys. Chem. Chem. Phys. 2011, 13, 14293–14296. [Google Scholar] [CrossRef]
  36. Mittal, S.; Pathak, B. A Step toward Amino Acid-Labeled DNA Sequencing: Boosting Transmission Sensitivity of Graphene Nanogap. ACS Appl. Bio Mater. 2023, 6, 218–227. [Google Scholar] [CrossRef]
  37. Dong, Y.-J.; Wang, X.-F.; Zhai, M.-X.; Wu, J.-C.; Zhou, L.; Han, Q.; Wu, X.-M. Effects of Geometry and Symmetry on Electron Transport through Graphene-Carbon-Chain Junctions. J. Phys. Chem. C 2013, 117, 18845–18850. [Google Scholar] [CrossRef]
  38. Ke, S.H.; Yang, W.; Baranger, H.U. Quantum-Interference-Controlled Molecular Electronics. Nano Lett. 2008, 8, 3257–3261. [Google Scholar] [CrossRef]
  39. Kim, W.Y.; Choi, Y.C.; Min, S.K.; Cho, Y.; Kim, K.S. Application of Quantum Chemistry to Nanotechnology: Electron and Spin Transport in Molecular Devices. Chem. Soc. Rev. 2009, 38, 2319–2333. [Google Scholar] [CrossRef]
  40. Bolotin, K.I.; Sikes, K.I.; Jiang, Z.; Klima, M.; Fudenberg, G.; Hone, J.; Kim, P.; Stormer, H.L. Ultrahigh electron mobility in suspended graphene. Solid State Commun. 2008, 146, 351–355. [Google Scholar] [CrossRef]
  41. Balandin, A.A.; Ghosh, S.; Bao, W.; Calizo, I.; Teweldebrhan, D.; Miao, F.; Lau, C.N. Superior Thermal Conductivity of Single-Layer Graphene. Nano Lett. 2008, 8, 902–907. [Google Scholar] [CrossRef] [PubMed]
  42. Lee, C.; Wei, X.; Kysar, J.W.; Hone, J. Measurement of the Elastic Properties and Intrinsic Strength of Monolayer Graphene. Science 2008, 321, 385–388. [Google Scholar] [CrossRef] [PubMed]
  43. Cao, C.; Chen, L.; Huang, W.; Xu, H. Electronic Transport of Zigzag Graphene Nanoribbons with Edge Hydrogenation and Oxidation. Open Chem. Phys. J. 2012, 4, 1–7. [Google Scholar] [CrossRef]
  44. Hou, Z.; Yee, M. Electronic and Transport Properties of Graphene Nanoribbons. In Proceedings of the 2007 7th IEEE Conference on Nanotechnology (IEEE NANO) 2007, Hong Kong, China, 2–5 August 2007; pp. 554–557. [Google Scholar]
  45. Treske, U.; Ortmann, F.; Oetzel, B.; Hannewald, K.; Bechstedt, F. Electronic and Transport Properties of Graphene Nanoribbons. Phys. Status Solidi (a) 2010, 207, 304–308. [Google Scholar] [CrossRef]
  46. Xiao, H.P.; Yu, Z.; Peng, X.Y.; Sun, L.Z.; Zhong, J. Zigzag Graphene Nanoribbons: Flexible and Robust Transparent Conductors. Solid State Sci. 2012, 14, 711–714. [Google Scholar] [CrossRef]
  47. Mittal, S.; Jena, M.K.; Pathak, B. Amplifying Quantum Tunneling Current Sensitivity through Labeling Nucleotides Using Graphene Nanogap Electrodes. ACS Appl. Nano Mater. 2022, 5, 9356–9366. [Google Scholar] [CrossRef]
  48. Qiu, H.; Zhou, W.; Guo, W. Nanopores in Graphene and Other 2D Materials: A Decade’s Journey toward Sequencing. ACS Nano 2021, 15, 18848–18864. [Google Scholar] [CrossRef]
  49. Cao, Z.; Yadav, P.; Farimani, A.B. Which 2D Material is Better for DNA Detection: Graphene, MoS2, or MXene? Nano Lett. 2022, 22, 7874–7881. [Google Scholar] [CrossRef]
  50. Jena, M.K.; Pathak, B. Development of an Artificially Intelligent Nanopore for High-Throughput DNA Sequencing with a Machine-Learning-Aided Quantum-Tunneling Approach. Nano Lett. 2023, 23, 2511–2521. [Google Scholar] [CrossRef]
  51. Xue, X.; Lindstrom, A.; Li, Y. Porphyrin-Based Nanomedicines for Cancer Treatment. Bioconjug. Chem. 2019, 30, 1585–1603. [Google Scholar] [CrossRef]
  52. Asselin, P.; Harvey, P.D. Visible-Light-Driven Production of Solar Fuels Catalyzed by Nanosized Porphyrin-Based Metal-Organic Frameworks and Covalent-Organic Frameworks: A Review. ACS Appl. Nano Mater. 2022, 5, 6055–6082. [Google Scholar] [CrossRef]
  53. Mathew, D.; Sujatha, S. Interactions of Porphyrins with DNA: A Review Focusing Recent Advances in Chemical Modifications on Porphyrins as Artificial Nucleases. J. Inorg. Biochem. 2021, 219, 111434. [Google Scholar] [CrossRef] [PubMed]
  54. Kumawat, R.L.; Pathak, B. Electronic Conductance and Current Modulation through Graphdiyne Nanopores for DNA Sequencing. ACS Appl. Electron. Mater. 2021, 3, 3835–3845. [Google Scholar] [CrossRef]
  55. Majumder, C.; Mahadevan, P.; Mizuseki, H.; Kawazoe, Y. Binding of DNA Nucleobases and Nucleosides with Graphene. J. Phys. Chem. C 2009, 113, 15182–15188. [Google Scholar]
  56. Taylor, J.; Guo, H.; Wang, J. Ab Initio Modeling of Quantum Transport Properties of Molecular Electronic Devices. Phys. Rev. B 2001, 63, 245407. [Google Scholar] [CrossRef]
  57. Brandbyge, M.; Mozos, J.L.; Ordejón, P.; Taylor, J.; Stokbro, K. Density-Functional Method for Nonequilibrium Electron Transport. Phys. Rev. B 2002, 65, 165401. [Google Scholar] [CrossRef]
  58. Ordejón, P.; Artacho, E.; Soler, J.M. Self-Consistent Order-N Density-Functional Calculations for Very Large Systems. Phys. Rev. B 1996, 53, R10441–R10444. [Google Scholar] [CrossRef]
  59. Sánchez-Portal, D.; Ordejón, P.; Artacho, E.; Soler, J.M. Density-Functional Method for Very Large Systems with LCAO Basis Sets. Int. J. Quantum Chem. 1997, 65, 453–461. [Google Scholar] [CrossRef]
  60. Perdew, J.P.; Burke, K.; Ernzerhof, M. Generalized Gradient Approximation Made Simple. Phys. Rev. Lett. 1996, 77, 3865. [Google Scholar] [CrossRef]
  61. Setten, M.J.; Giantomassi, M.; Bousquet, E.; Verstraete, M.J.; Hamann, D.R.; Gonze, X.; Rignanese, G.M. The PseudoDojo: Training and Grading a 85 Element Optimized Norm-Conserving Pseudopotential Table. Comput. Phys. Commun. 2018, 226, 39–54. [Google Scholar] [CrossRef]
  62. Borlido, P.; Doumont, J.; Tran, F.; Marques, M.A.L.; Botti, S. Validation of Pseudopotential Calculations for the Electronic Band Gap of Solids. J. Chem. Theory Comput. 2020, 16, 3620–3627. [Google Scholar] [CrossRef] [PubMed]
  63. Grimme, S.; Antony, J.; Ehrlich, S.; Krieg, H. A Consistent and Accurate Ab Initio Parametrization of Density Functional Dispersion Correction (DFT-D) for the 94 Elements H-Pu. J. Chem. Phys. 2010, 132, 154104. [Google Scholar]
  64. Chadi, D.J.; Cohen, M.L. Special Points for Brillouin-Zone Integrations. Phys. Rev. B 1977, 16, 1746–1747. [Google Scholar] [CrossRef]
  65. Chen, D.; Zhang, X.; Tang, J.; Cui, Z.; Cui, H. Pristine and Cu Decorated Hexagonal InN Monolayer, a Promising Candidate to Detect and Scavenge SF₆ Decompositions Based on First-Principle Study. J. Hazard. Mater. 2019, 363, 346–357. [Google Scholar] [CrossRef]
  66. Das Sarma, S.; Adam, S.; Hwang, E.H.; Rossi, E. Electronic Transport in Two-Dimensional Graphene. Rev. Mod. Phys. 2011, 83, 407–470. [Google Scholar] [CrossRef]
  67. Büttiker, M.; Imry, Y.; Landauer, R.; Pinhas, S. Generalized Many-Channel Conductance Formula with Application to Small Rings. Phys. Rev. B 1985, 31, 6207–6215. [Google Scholar] [CrossRef]
  68. Babar, V.; Sharma, S.; Shaikh, A.R.; Oliva, R.; Chawla, M.; Cavallo, L. Sensing Hachimoji DNA Bases with Janus MoSH Monolayer Nanodevice: Insights from Density Functional Theory (DFT) and Non-Equilibrium Green’s Function Analysis. ACS Omega 2024, 9, 48173–48184. [Google Scholar] [CrossRef]
  69. Gao, F.; Zhang, Y.; He, L.; Gao, S.; Brandbyge, M. Control of the Local Magnetic States in Graphene with Voltage and Gating. Phys. Rev. B 2021, 103, L241402. [Google Scholar] [CrossRef]
  70. Li, Z.; Li, S.; Xu, Y.; Tang, N. Recent Advances in Magnetism of Graphene from 0D to 2D. Chem. Commun. 2023, 59, 6286–6300. [Google Scholar] [CrossRef]
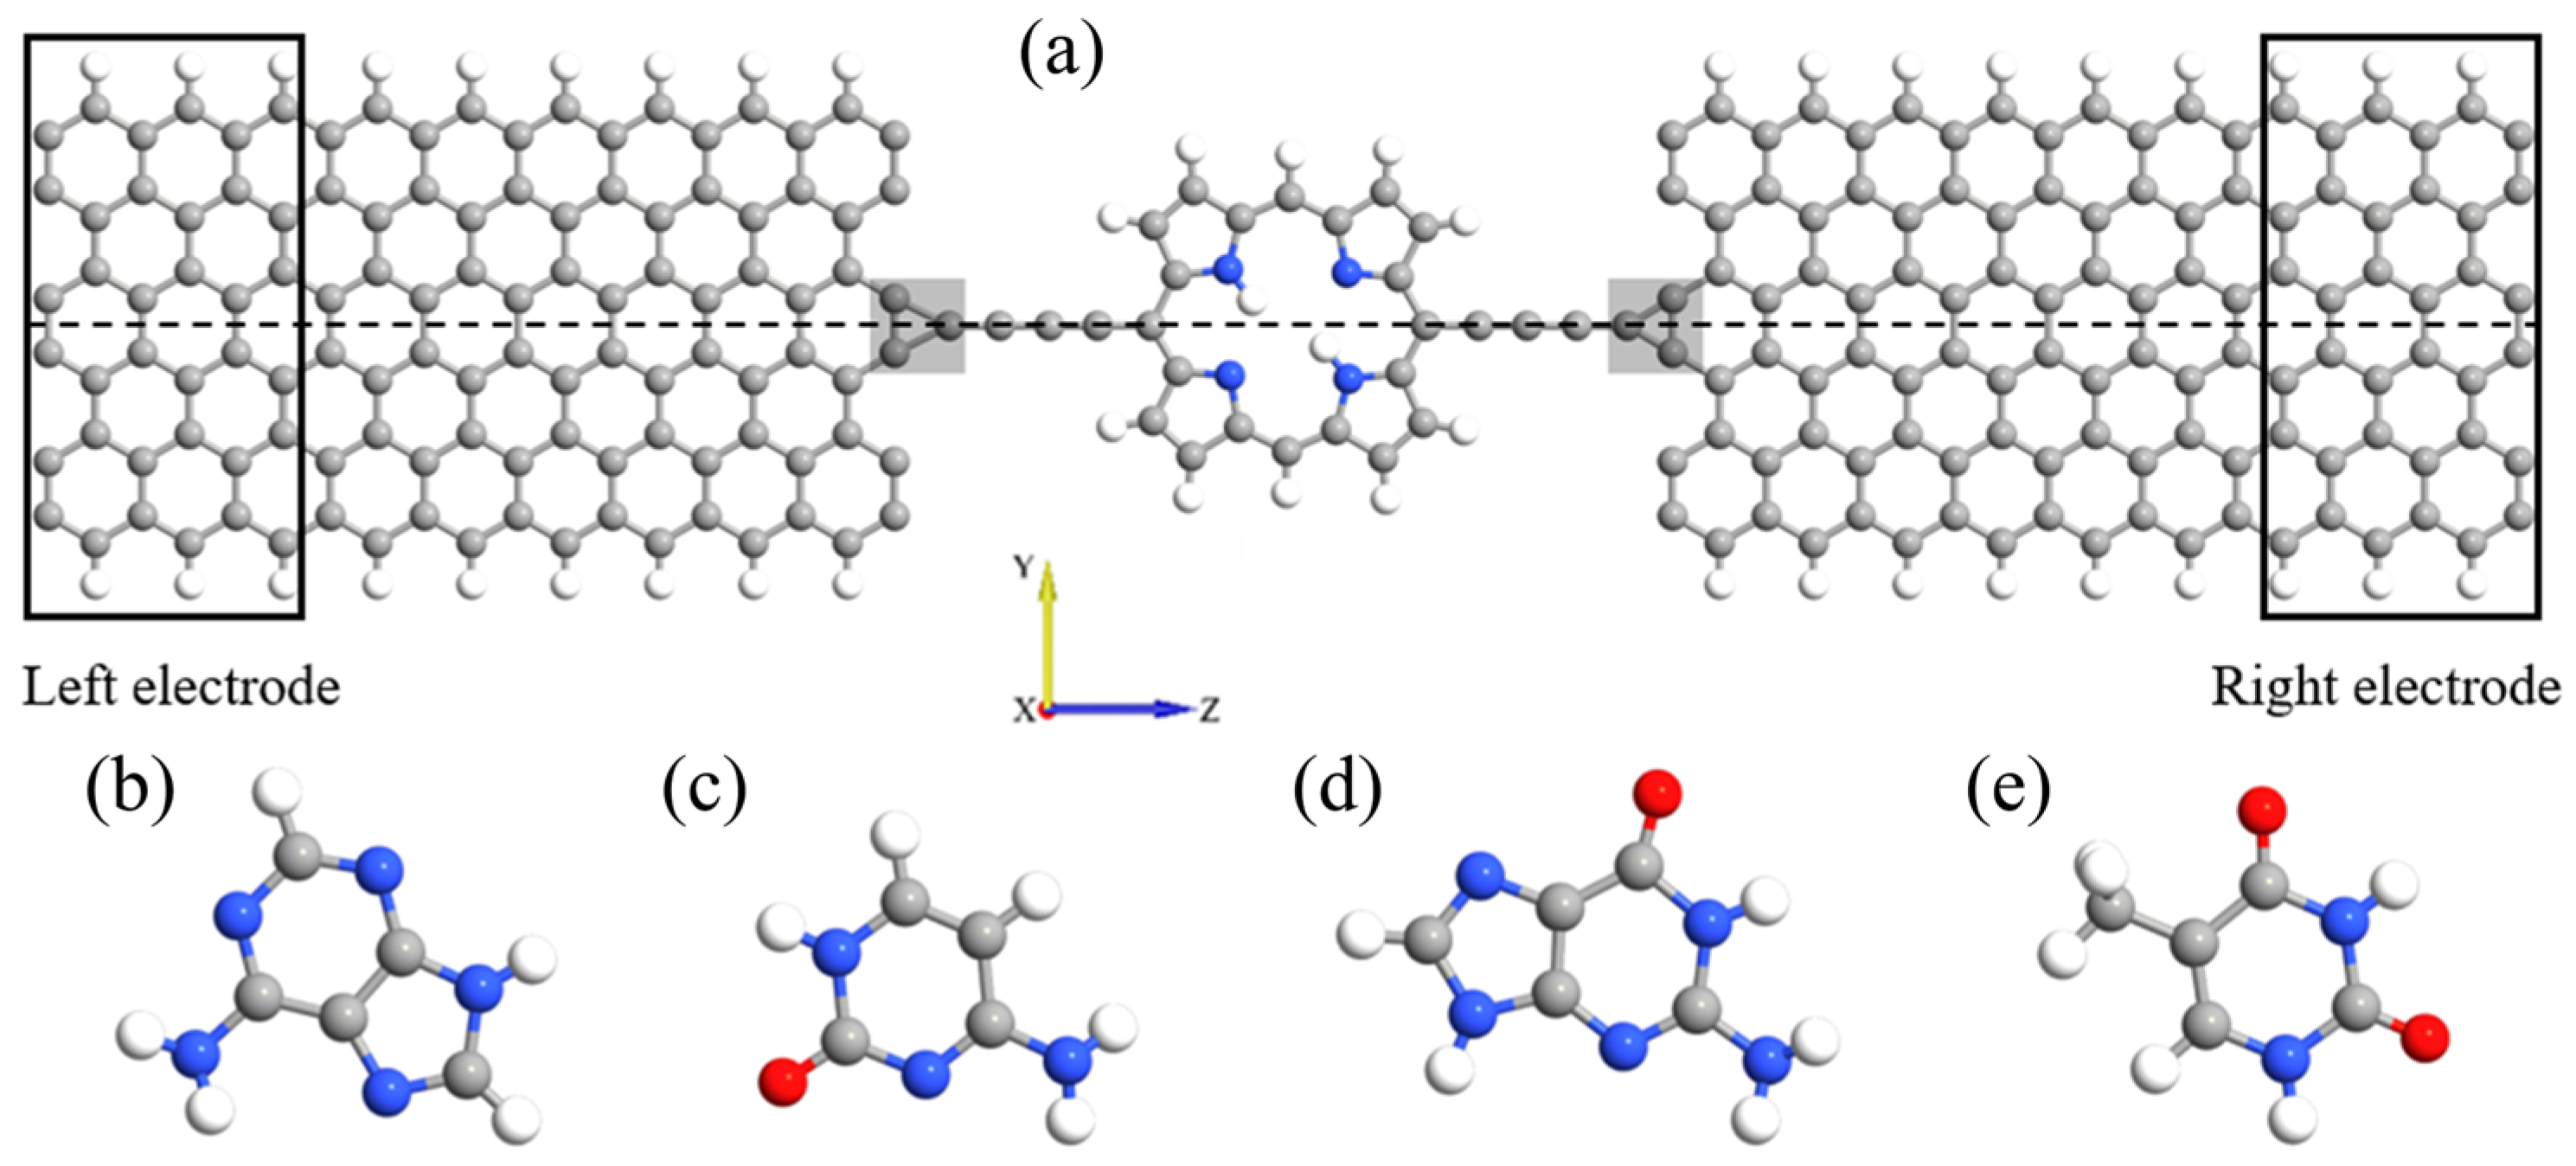
Figure 1. (a) The atomic structure of the GEPM device. The regions enclosed in the solid rectangles represent the supercells of the left and the right semi-infinite electrode regions, respectively. In between the electrode regions is the central scattering region, where the porphyrin molecule is connected to the electrodes through a carbon chain, as shown by the shaded areas that are referred to as three-membered contacts. The electrodes are mirror symmetric about their axis marked by the dashed line, along which the carbon atomic chains are laid. The DNA nucleobases studied in the simulation: (b) adenine, (c) cytosine, (d) guanine, and (e) thymine. Atomic colors codes: H (white), C (gray), N (blue), and O (red).
Electronics 14 01814 g001
Figure 2. Top and side views of the atomic diagram of the fully relaxed GEPM + adenine (A), cytosine (C), guanine (G), and thymine (T) systems.
Electronics 14 01814 g002aElectronics 14 01814 g002b
Figure 3. The top and side views of the CCD profiles for systems A, C, G, and T at the isosurface value of 0.0006 e/Å3. The blue region indicates charge accumulation or electron loss and the purple shows charge depletion.
Electronics 14 01814 g003
Figure 4. Density of state plots of bare GEPM and GEPM + nucleobase systems for (a) A, (b) C, (c) G, and (d) T.
Electronics 14 01814 g004
Figure 5. (a) Electronic transmission spectra of the bare GEPM device and devices A, C, G, and T. (b) Zoomed-in view of (a).
Electronics 14 01814 g005
Figure 6. Energy bands 1–6 (left) and corresponding wave functions (right) of electrons in the electrode nanoribbons. The dashed lines indicate the symmetry axis of nanoribbon.
Electronics 14 01814 g006
Figure 7. The conductance sensitivity (%) versus the interaction energy for devices A, C, G, and T at energy E = −1.752 eV.
Electronics 14 01814 g007
Figure 8. (a) The I-V curves of the bare GEPM device and devices A, C, G, and T. (b) The current sensitivity (%) of devices A, C, G, and T under diffenent bias voltages.
Electronics 14 01814 g008
Figure 9. Spin distribution diagrams for different magnetization configurations of electrodes. The regions enclosed in the solid rectangles represent the supercells of the left and right electrodes. The spin orientations (up↑ or down↓) of the four edges (marked in yellow) are indicated as σ 1 , σ 2 , σ 3 , and σ 4 , respectively. We set σ 1 = σ 2 = σ 3 = σ 4 = in the parallel (P) configuration, and σ 1 = σ 3 = with σ 2 = σ 4 = in the antiparallel (AP) configuration.
Electronics 14 01814 g009
Figure 10. Transmission spectra of spin-up (a) with its magnification (b) and spin-down (c) with its magnification (d) in the P configuration.
Electronics 14 01814 g010
Figure 11. Transmission spectra of spin-up (a) with its magnification (b) and spin-down (c) with its magnification (d) in the AP configuration.
Electronics 14 01814 g011
Table 1. Distance between the geometric centers of the nucleobase and the porphyrin, conductance sensitivity (SG) at E = −1.752 eV, and current sensitivity (SI) under Vb = 0.85 V. Interaction energies between DNA nucleobases and the GEPM device (Ei GEPM), as well as those between nucleobases and graphene nanoribbons, including our theoretical results (Ei Theo) and reference values from the literature (Ei Ref).
NucleobaseDistance (Å)SG (%)SI (%)Ei GEPM (eV)Ei Theo (eV)Ei Ref [8] (eV)
A3.06176.22.90.4851.101.00
C2.92126.619.40.3760.970.93
G2.97555.746.10.7071.301.18
T3.0787.9724.30.4721.010.95
Disclaimer/Publisher’s Note: The statements, opinions and data contained in all publications are solely those of the individual author(s) and contributor(s) and not of MDPI and/or the editor(s). MDPI and/or the editor(s) disclaim responsibility for any injury to people or property resulting from any ideas, methods, instructions or products referred to in the content.