Abstract
This study deals with a fuel-cell-based power supply system created from a fuel cell stack with a proton exchange membrane fuel cell (PEMFC) and controller monitoring system (Horizon Fuell Cell Technologies (HFCT)). In the fuel cell (FC) stack H60, the reactants are air and hydrogen. Reactants are used for the generation of electricity. The reactants supply fuel cell stacks with hydrogen through the hydrogen supply valve, and redundant reactants are extruded from the region of the 20 fuel cells of the H60 stack through the purge valve, both controlled by an FC controller. The main contribution of this study is the proposal, practical design and integration of an embedded monitoring system into the function of a fuel-cell-based power supply system for monitoring its operation parameters in mobile applications (such as in UGVs—Unmanned Ground Vehicles). The next contribution is the usage of INA226 power monitors for the measurement of input/output parameters in selected parts of the fuel-cell-based power supply system for the evaluation of electrical efficiency or power loss in the system. The third contribution is the integration of Bluetooth technology for the transfer of data from a fuel-cell-based power supply system in a mobile platform to a smartphone or PC for monitoring and data processing. At the end of this study, the computed efficiency values of the fuel cell stack, controller and switching power supply outputs are analysed, and the advantages, disadvantages and practical experience are summarized.
1. Introduction and Literature Review
While internal combustion engines are a significant technological achievement, the widespread use of automobiles is harming the environment and depleting fossil fuel resources. Air pollution, global warming and dwindling oil supplies pose serious threats. To address these issues, stricter emissions and fuel efficiency standards are driving the development of cleaner and more efficient vehicles, such as electric, hybrid electric and fuel-cell-based vehicles.
Currently, 96% of hydrogen production relies on fossil fuels (natural gas) [1]. This process is about 75% efficient but produces a significant amount of CO2 (9–12 kg of CO2 per one kg of hydrogen). Nowadays, only 4% of hydrogen is produced through water electrolysis, which is emission free. However, in the next decade, the focus is expected to shift towards producing hydrogen primarily through water electrolysis, reducing CO2 emissions. To produce 1 kg of hydrogen through water electrolysis, 55 kWh of electrical energy is required. Conversely, 33 kWh can be extracted from 1 kg of hydrogen.
Various hydrogen production processes, as in [2,3], can be used for hydrogen production, including the following: electrolysis, gasification, pyrolysis, fermentation, photosynthetic algae, emerging photo- and thermo-electrochemical methods, high-temperature fuel cells, nuclear cycle-assisted systems, and others [4,5].
Fuel cells (FCs) are sophisticated galvanic cells designed to efficiently transform the free energy released from chemical reactions into electrical energy, with minimal environmental impact. The performance of a fuel cell can be quantitatively assessed through the relationship between the Gibbs free energy change in the reaction (in Joules) and the resultant cell voltage. This is a critical parameter for determining the efficiency of fuel cells in practical applications. This relationship is expressed as follows [4,6]:
where n represents the number of electrons that participate in the reaction, F is the Faraday constant in C∙mol−1 (a physical constant that represents the amount of electric charge carried by one mole of electrons) and indicates the voltage (in Volts) of the cell when it is at thermodynamic equilibrium without any current flowing.
In fuel cell technology, oxidation–reduction reactions occurring at the anode and cathode are pivotal for the generation of electrical energy. Anode reactions can vary depending on the type of fuel cell being utilized. The anode reactions can be divided into, for example [6,7], the following categories:
- Direct Oxidation of Hydrogen: This process involves the conversion of hydrogen gas directly into protons and electrons.
- Oxidation of Methanol: Alternatively, some fuel cells utilize methanol as a fuel source.
- Indirect Oxidation via Reforming: In certain cases, an indirect oxidation process can occur, where hydrocarbons are reformed into hydrogen before being utilized in the fuel cell.
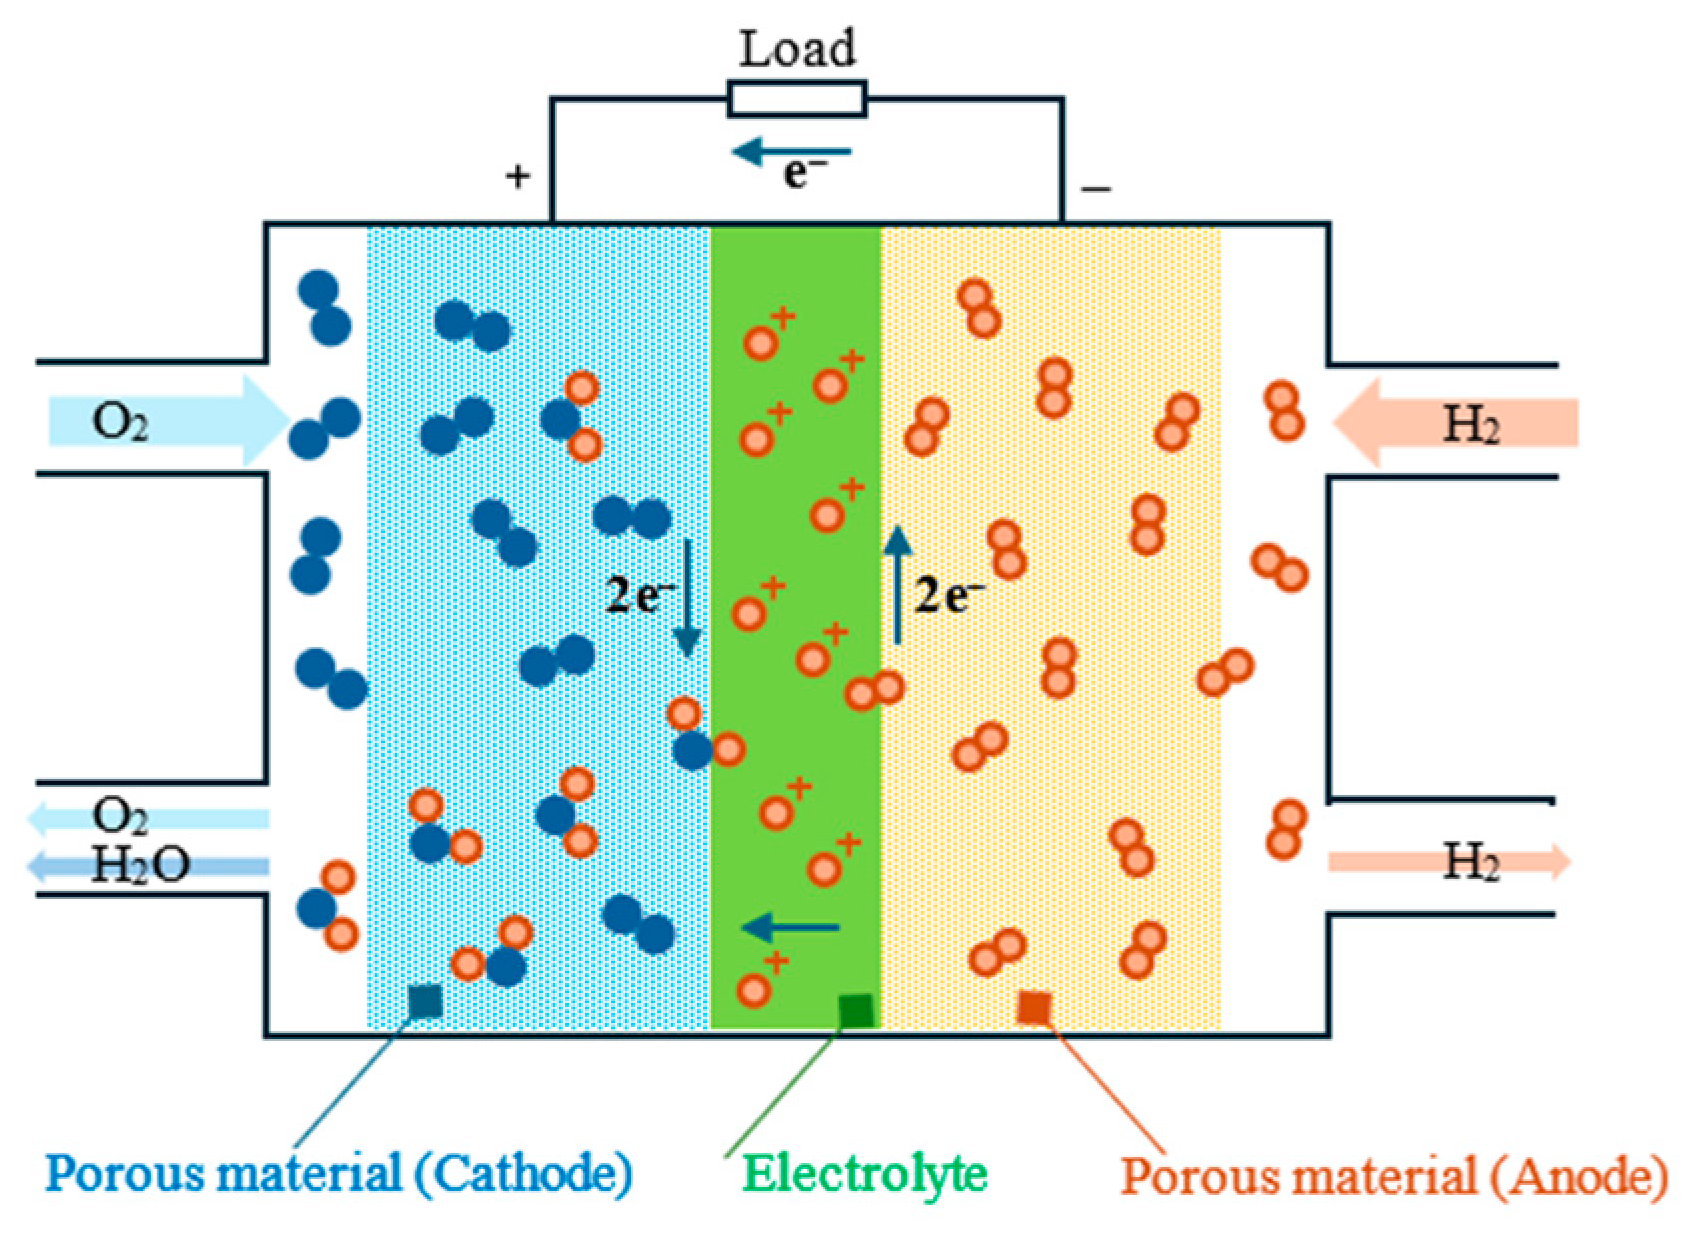
Cathode reactions predominantly involve the reduction of oxygen, typically sourced from ambient air. This process is essential for the completion of the electrochemical reaction. Understanding these reactions is crucial for optimizing fuel cell performance and efficiency, providing insight into the mechanisms that drive this clean energy technology. In the context of a hydrogen–oxygen fuel cell, as illustrated in Figure 1, the overall reaction involves the combination of hydrogen and oxygen to produce water, along with the release of energy [6,8,9]:
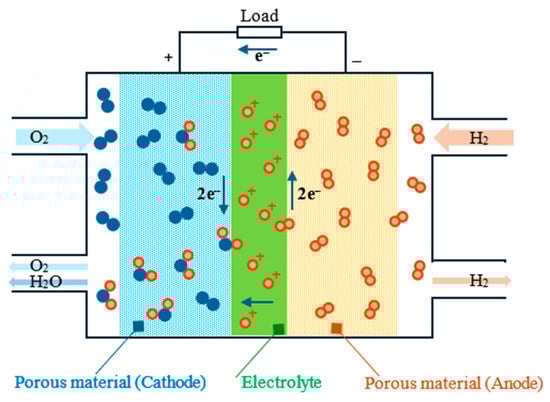
Figure 1.
Illustration of hydrogen and oxygen reactions involved in a proton exchange membrane fuel cell (PEMFC). Adapted from [6].
At 298.15 K, the equilibrium cell voltage under normal circumstances is:
Equilibrium cell voltage (in Volts), also known as equilibrium potential, is defined as the electric potential difference across an electrochemical cell at equilibrium. This state occurs when the rates of the forward and reverse electrochemical reactions are equal, resulting in no net change in the concentrations of reactants and products over time. In our case, it is given by the difference in cathode and anode potentials [6]:
The fundamental structure of fuel cells is consistent across various types; each cell involves two electrodes separated by an electrolyte and linked through an external circuit. These electrodes interface with gas or liquid flows to provide the necessary fuel or oxidant, such as hydrogen or oxygen.
To facilitate this interaction, the electrodes must be permeable and exhibit a porous design. The configuration and composition of gas diffusion electrodes are intricate, necessitating extensive optimization for effective application. Additionally, the electrolyte should maintain minimal gas permeability. In fuel cells utilizing a proton-conducting electrolyte, such as the proton exchange membrane fuel cell (PEMFC), hydrogen undergoes oxidation at anode (platinum on carbon support Pt/C), prompting protons to migrate through the electrolyte to the cathode [6,10]:
The cathode is created from platinum alloys to enhance the electrocatalytic activity and decrease the Pt loading and overall cost as well. Depending on the transition metal arrangement in the Pt-M (where M is the metallic species) catalyst surface, it is broadly classified in [8].
The provided oxygen at the cathode reacts in accordance with
During these reactions, electrons flow through the external circuit (load). Oxygen ions recombine with protons to generate water:
In fuel cells featuring proton-conducting membranes, water is produced at the cathode. Conversely, in high-temperature fuel cells utilizing an oxygen ion (or carbonate) conducting electrolyte, water can be formed at the anode. Fuel cells can be categorized by operating temperature and electrolyte type. Current fuel cell categorizations are mentioned in [1,2,3,6,10] and Table 1.

Table 1.
Overview of selected fuel cell technologies [1,2,6].
The MCFC (molten carbonate fuel cell) and SOFC (solid oxide fuel cell) are not mentioned in Table 1.
An evaluation of FC system efficiency is necessary for a comparison with the efficiency of other power source systems and for needs with specific applications. Efficiency could be compared with internal combustion engines (ICEs) where efficiency is defined according to exothermic reaction parameters, defined as in [6,9]:
where T1 and T2 (in Kelvins) are the two absolute temperatures for the operation of the heat engine, ΔH is the enthalpy change of the reaction (in Joule) and Wr is electrical work carried off (in Joule). Efficiencies are lower than 50% for the most efficient engines.
FC efficiency can be calculated according to Gibbs free energy (ΔG) and the change (ΔH) in the enthalpy in the FC electrochemical reaction as thermodynamic efficiency [6,9]:
where We is electrical work performed (in Joule), and ΔS is the isothermal entropy change of the reaction (in Joule∙Kelvin−1). TΔS corresponds to the reversible heat exchanged with the external environment. The change in entropy of the reaction (ΔS) depends strongly on reactants and their products.
In some cases, fuel cell efficiencies could be greater than 1 if the entropy change is a positive value. This means that the temperature coefficient (∂(ΔU)/∂T = ΔS/nF) of the FC is positive and the supplemental electrical energy is derived from the heat of the external thermal source (e.g., the oxidation reactions of carbon monoxide to carbon dioxide are characterized by = 1.24). In practice, however, electrode overpotentials cause the practical efficiencies to be lower than 1.
Other efficiency terms such as electrochemical efficiency εV and total efficiency εFC provide more detailed information about FC than thermodynamic efficiency as they are directly related to the performance of the cell. Overall efficiency and its contributions are defined according to [6]:
where is Faradaic efficiency (defined as the ratio of the experimental current Iexp (in Ampers) and the maximal possible current Imax (in Ampers)), with being the utilization of the fuel, and εH is the heating value efficiency given by [6]:
where ΔHr is the heating value (in Joule∙kg−1) of all fuel components that are converted electrochemically (hydrogen), and ΔHC is the heating value of all fuels (e.g., including CH4 or CO) in Joule∙kg−1. Despite all these important factors, the electrical efficiencies of fuel cells are superior to that of heat engines [1,2,5,6].
Analysis of the state of art is based on research results mentioned by authors in [8,9,10,11,12,13,14]. Researchers at the present time focus on the discovery of prospective materials and manufacturing methods to improve fuel cell performance and simplify components of fuel cells. Designs of fuel cell systems are utilized to reduce the costs of the membrane and improve cell efficiency, reliability and durability. These improvements allow them to compete with combustion engines.
Recent advancements, as in [8], describe the standard design of a grid-connected fuel cell system and the advantages and disadvantages of different groups of fuel cells. Research in [9] focused on improvements in electrodes and electrolyte materials of different types of fuel cells (polymer electrolyte membrane fuel cells, direct methanol fuel cells and solid oxide fuel cells). The authors in [10] describe science and technology for a new type of electrocatalyst consisting of a single atomic layer of platinum on suitable supports. This research can solve problems with high costs, activity, and stability, for a broad range of fuel cell applications. The authors in [11] deal with catalysts based on carbon-supported platinum nanoparticles (Pt/C) for PEMFC. The main goal was analysis of mesoporous carbon structures and their influence on the durability of PEMFC catalysts.
The usage of embedded systems for monitoring various types of FC has been addressed recently, for example, in [12,13,14]. The author [12] deals with the design of an embedded monitoring system powered by FC, which is capable of measuring/logging. Only the FC voltage and monitoring system code are optimized to reduce the power consumption. The authors of [6] focused on the application of an active Fault-Tolerant Control (FTC) strategy and experiments with PEMFC. The author’s goal was to solve a (PEMFC) problem with water management/drying issues by coupling a Fault Detection and Isolation (FDI) algorithm, a reconfiguration mechanism, and an adjusting embedded system (controller). The FDI process uses a neural network; then, a self-tuning PID is used as the control element. The authors of [14] used the Electrochemical Impedance Spectroscopy method and its implementation in an embedded system to monitor PEMFC fuel cell states.
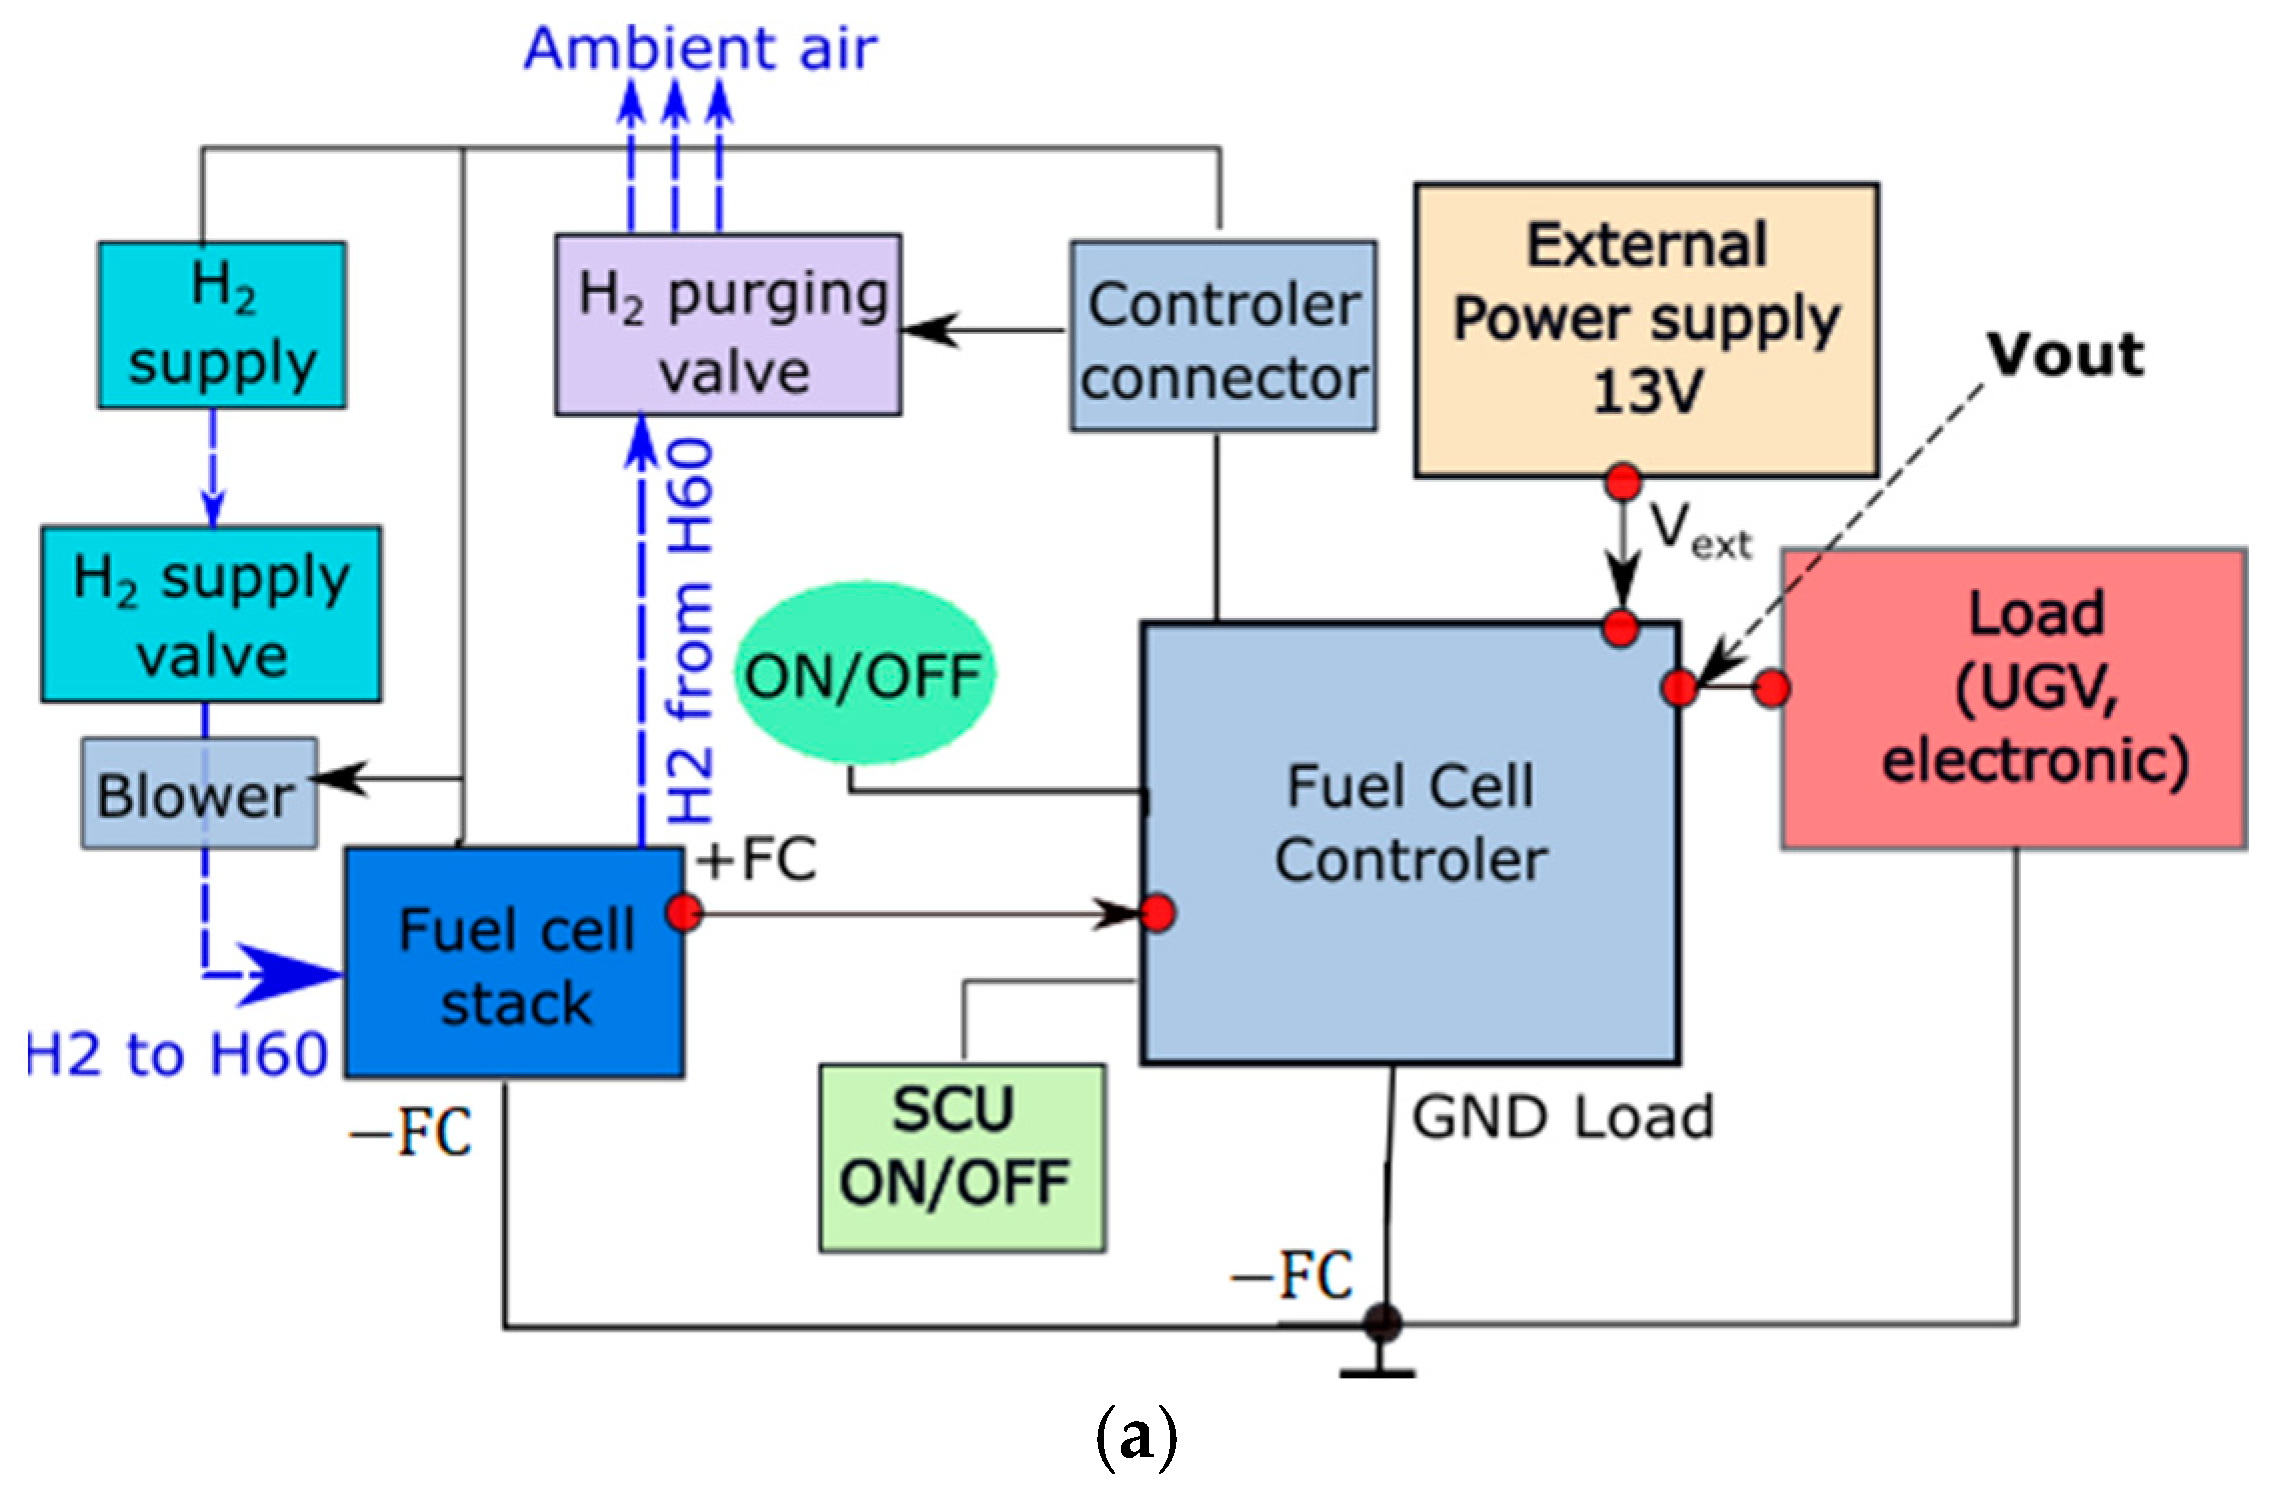
The PEMFC-based power supply system, as shown in Figure 2, is a system consisting of a PEMFC. It also includes a PEMFC controller and ventilation: fan-based system, input and purge electromagnetic ventils, pressure reductors (H2 supply valve controls hydrogen pressure), temperature sensors, external power modules (switching regulators), etc. Therefore, the efficiency η of the overall PEMFC-based power supply system could be evaluated from the view of power sources and power consumers. In Figure 2, the embedded monitoring system described below is used for the first time.


Figure 2.
Principal connection of PEMFC-based power supply system [15,16,17,18] at the Department of Mechanical engineering (a) and the first real measurement site picture (b).
This point of view allows us to evaluate the values of the external power PEXT, required for the operation of the PEMFC system, the amount of power converted from the fuel (hydrogen) PCELL, power at the controller output POUT, and the value of the power at the load PLOAD.
Based on the idea mentioned in [5], the so-called mathematically defined thermal efficiency is . It represents the ratio between the output and input powers of the fuel cell system (in Watts). From this point of view, the efficiency of the PEMFC controller can be evaluated as
and the efficiency of switching the regulator can be evaluated as
The equation
evaluates the ratio of the power of the PEMFC that is transformed at the controller output () under the condition of the delivery of the power (PEXT) from an external DC power supply. All powers are expressed in Watts.
This will allow us to evaluate the value of the created power for an application PLOAD and individually evaluate the achieved efficiency in the PEMFC complex system. At the same time, it is not necessary to perform a series of independent experiments to assess the impact of partial efficiencies defined in Relationships (8)–(11). These are interdependent, and the common variable is the temperature of the cell or reactants (hydrogen and air). Important variables that are difficult to evaluate can be, e.g., the fuel amount at the cell inlet and amount of fuel used during the reaction in an FC.
In this study, we focus on the measurement and evaluation of the overall electrical power created at the PEMFC output, the PEMFC controller output and DC-DC converter output that can feed an electric load in a mobile application (e.g., small UGV).
The microcontroller-based platform Arduino MEGA 2560 was used for these experiments [19]. INA226 sensors (described in detail below, according to [20]) were selected as sensing elements. The designed circuit is capable of wirelessly transmitting data (voltage and current) to a smartphone or a tablet using the HC-05 Bluetooth module [21]. Based on partial efficiencies (12)–(14), it is possible to compute the overall FC power supply system efficiency, as mentioned in [7].
2. Materials and Methods
Proton exchange membrane fuel cell (PEMFC) from Horizon Fuell Cell Technologies (HFCT), fuel cell H60, is a device that converts hydrogen H and oxygen O into water H2O and electricity. Reactant is a material used to start chemical reactions. Air and hydrogen are in fuel cell reactants. Humidity created by FC operation is necessary for fuel cell operation. Air supplied to fuel cells is a reactant of the electrochemical reaction, which simultaneously decreases the temperature of the stack. Short circuit unit (SCU) is used for improvement in stack performance [18]. The purging valve is used for purging out the redundant water and air from the fuel cell stack.
The core of PEM fuel cell stack H60 includes 20 fuel cells. One stack is made up of plate-like cells with air channels to allow for the flow of air across the membrane. The membrane allows for easy flow of hydrogen and release of electrons. Electrically conductive separator plates between each pair of cells enable the flow of electrons. Hydrogen supply valve controls its flow into the stack (under a pressure 0.45–0.55 Bar, flow rate 840 mL/min), when fuel cells work. The ventilation fan is used for decreasing the temperature of H60 stack under 338.15 K. PEMFC controller (HFCT) is used for controlling the stack temperature (measured by T-sensor), ventilation, hydrogen input valve, purging–output valve and SCU of the stack according to control signals passing through block controller connector, as shown in Figure 2. SCU is used for switch on/off full operation (power) of the PEMFC H60.
According to producer, basic characteristics of the stack H60 (Table 2) include its output voltage 12 V/up to 5 A (60 W). Stack PEMFC controller needs, for its operation, external power supply 13 V (±1 V), up to 5 A, and producer mentioned efficiency of stack up to 40% (for 12 V).
Table 2.
Technical specification of PEMFC H60. Adapted from [18].
Based on Table 2, it is not clear how much power exactly fuel cell controller PEMFC needs for its operation. Further, it is not clear how the depends on the load conditions (). In general, the producer does not state the conditions of the PEMFC efficiency determination.
Therefore, the next goal of the experiment is to measure and state electrical efficiencies in selected parts of PEMFC-based power supply system, as shown in Figure 3 in laboratory conditions. There, blue dashed lines express the flow of the hydrogen into the FC stack.
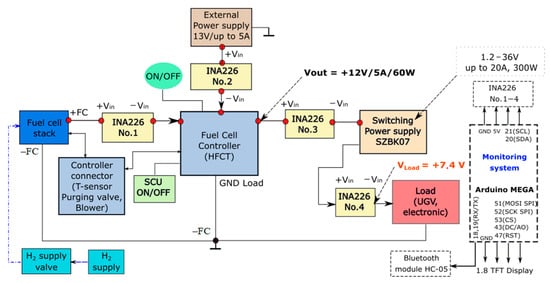
Figure 3.
Measuring site with PEMFC power supply system.
Important operational parameters of PMEFC type H60 are H input pressure, purity, ambient temperature and rate flow for maximum output power (60 W). The manufacturer’s recommendations are important for PEMFC operation, as well. Measurements were realized for the PEMFC H60 that was put into operation after previous long-term non-use (several months). Therefore, only experiments related to the commissioning of the PEMFC and its loading up to 10 W power are presented in this study.
Measuring site in Figure 3 consists of above-mentioned elements of the H60 fuel cell, which are needed for its operation. Previous electrical connection according to producers’ documents [18] was supplemented by circuits (modules from Texas Instruments, Dallas, TX, USA) INA226 for bi-directional power and voltage monitoring.
INA226 monitors are used for monitoring of voltage, current and power between PEMFC stack–PEMFC controller (HFCT)–switching power supply SZBK07, and in front of the load. One of the INA226 modules measures external power supply parameters, which are necessary for H60 PEMFC controller (HFCT) operation.
In a measurement site, the Step-Down Buck Converter SZBK07 (Shenzhen Weichuangda Technology, Shenzhen, China) is used for setting and controlling the output current, which flows from PEMFC controller output into the load.
Switching power supply module SZBK07 (adjustable DC-DC Buck Converter) is a constant current voltage regulator utilized in power supplies of LED drivers or in photovoltaic technologies [22]. The module operates at a switching frequency of 180 kHz. The module uses DC-DC Step-Down Buck Converter based on integrated circuit LM5116 (from Texas Instruments, Dallas, TX, USA) and NCE8580 MOSFET power transistors (Wuxi NCE Power Semiconductor Co., Wuxi City, China). For reliable operation, it needs an input voltage range of 6 V up to 40 V. The module can provide an output voltage from 1.2 V to 36 V, load currents up to 20 A and maximal output power 300 W. The manufacturer defines SZBK07 module efficiency up to 96%, measured at 20 A, converting 24 V to 12 V.
3. INA226 Monitor Application and Settings
The INA226 in Figure 4 is a current shunt monitor and power monitor, which senses bus voltages from 0 V to 36 V with an I2C or SMBUS-compatible interface. The INA module monitors both the shunt voltage and bus supply voltage. The programmable calibration value, conversion times, and averaging, combined with an internal multiplier, enable direct readouts of current in Amperes and power in Watts [23,24].
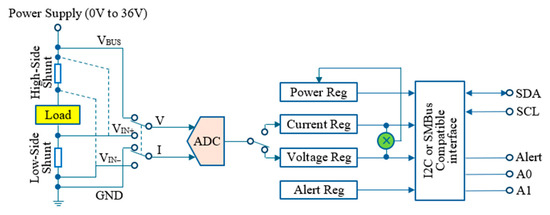
Figure 4.
INA226 internal structure. Adapted from [15].
INA226 modules use 16-bit native ADC for the conversion of the measured analogue input voltage to its digital representation for writing its values for current and voltage registers. Analogue voltage represents the measured analogue bus voltage UBUS (in Volts). The voltage drop (in Volts) at the INA226 module’s shunt resistor RShunt represents current value ILoad flows through the load [23,24].
The shunt resistor value RShunt (in Ohms) ultimately determines the limits of the current measurement. Maximum and minimum shunt values must be calculated to ensure that we choose a suitable shunt for our application. The maximum shunt value RShunt max is computed according to the maximum input voltage range Usence max of the shunt (in Volts) listed in the INA226 datasheet [20] and in [23]. According to [20], the INA226 Ushunt range is ±81.92 mV; therefore
where Isense max is the maximum expected sensed current value (in Amperes).
The minimum shunt value (in Ohms) is determined by the shunt voltage resolution (1LSB). To find the ideal RShunt min, we must divide the shunt step size of 1 LSB by the minimum expected current value according to our application. For the INA226, 1LSB represents a value of 2.5 µV; therefore
where Isense min is the minimum expected sensed current value (in Amperes).
The next steps are determinations of the current LSB (in Amperes·LSB−1) and calibration factor according to [20,23]. The main principle to understand is that all power monitors measure voltage. These voltages can then be used to calculate the current and power, provided the user knows the value of the used shunt resistor.
Voltage registers have fixed determined LSB values mentioned in the manufacturer datasheet (LSBV = 1.25 mV·LSB−1); however, current and power registers have flexible LSBs based on designer criteria. The user must determine what these LSB values are. The producer recommends scaling the LSBs according to the n-bits of the ADC register and the maximal current that users plan to measure. For our experiment, it was defined as follows:
The next step is the determination of the appropriate calibration coefficient CAL, depending on the chosen current monitor type for device INA226 [20]:
where 0.00512 is the fixed internal set value for appropriate INA226 function, as in [20,23]. After programming the calibration register, the current register (04hex, that is register designation in hexadecimal code) and the power register (03hex) are updated. The current register (04hex) is then calculated by multiplying the decimal value of the shunt voltage register (01hex) contents by the decimal value of the calibration register and then dividing by 2048, as shown in the following equation:
The output value of the power register (03hex, in Watts) is then calculated by multiplying the number of bits in the current register by the number of bits in the bus voltage register (02hex), according to their resolution and then dividing by 20,000, as defined in [20,23]:
Communication with multiple INA226 power monitors according to Figure 3 was realized by I2C two-wire communications, where individual I2C addresses for each INA226 module were chosen according to [20].
The master device was represented by Arduino MEGA 2560 Rev3 development board (from Arduino S.r.l., Monza, Italy), where its main goals were communications with power sensing monitors, powering them by +5 V supply voltage and receiving data from INA226 power monitors via I2C channels.
Arduino MEGA 2560 has multiple UARTs for asynchronous communication. One of them was used for communication with an Arduino IDE serial monitor, and the second was used for communication with Bluetooth module HC-05. Data from INA226 modules were sent by Arduino MEGA via the UART(RX/TX) channel to Bluetooth module HC-05 (Shenzhen Weichuangda Technology, Shenzhen, China). The UART protocol and data-stream details are mentioned in [21].
4. Results
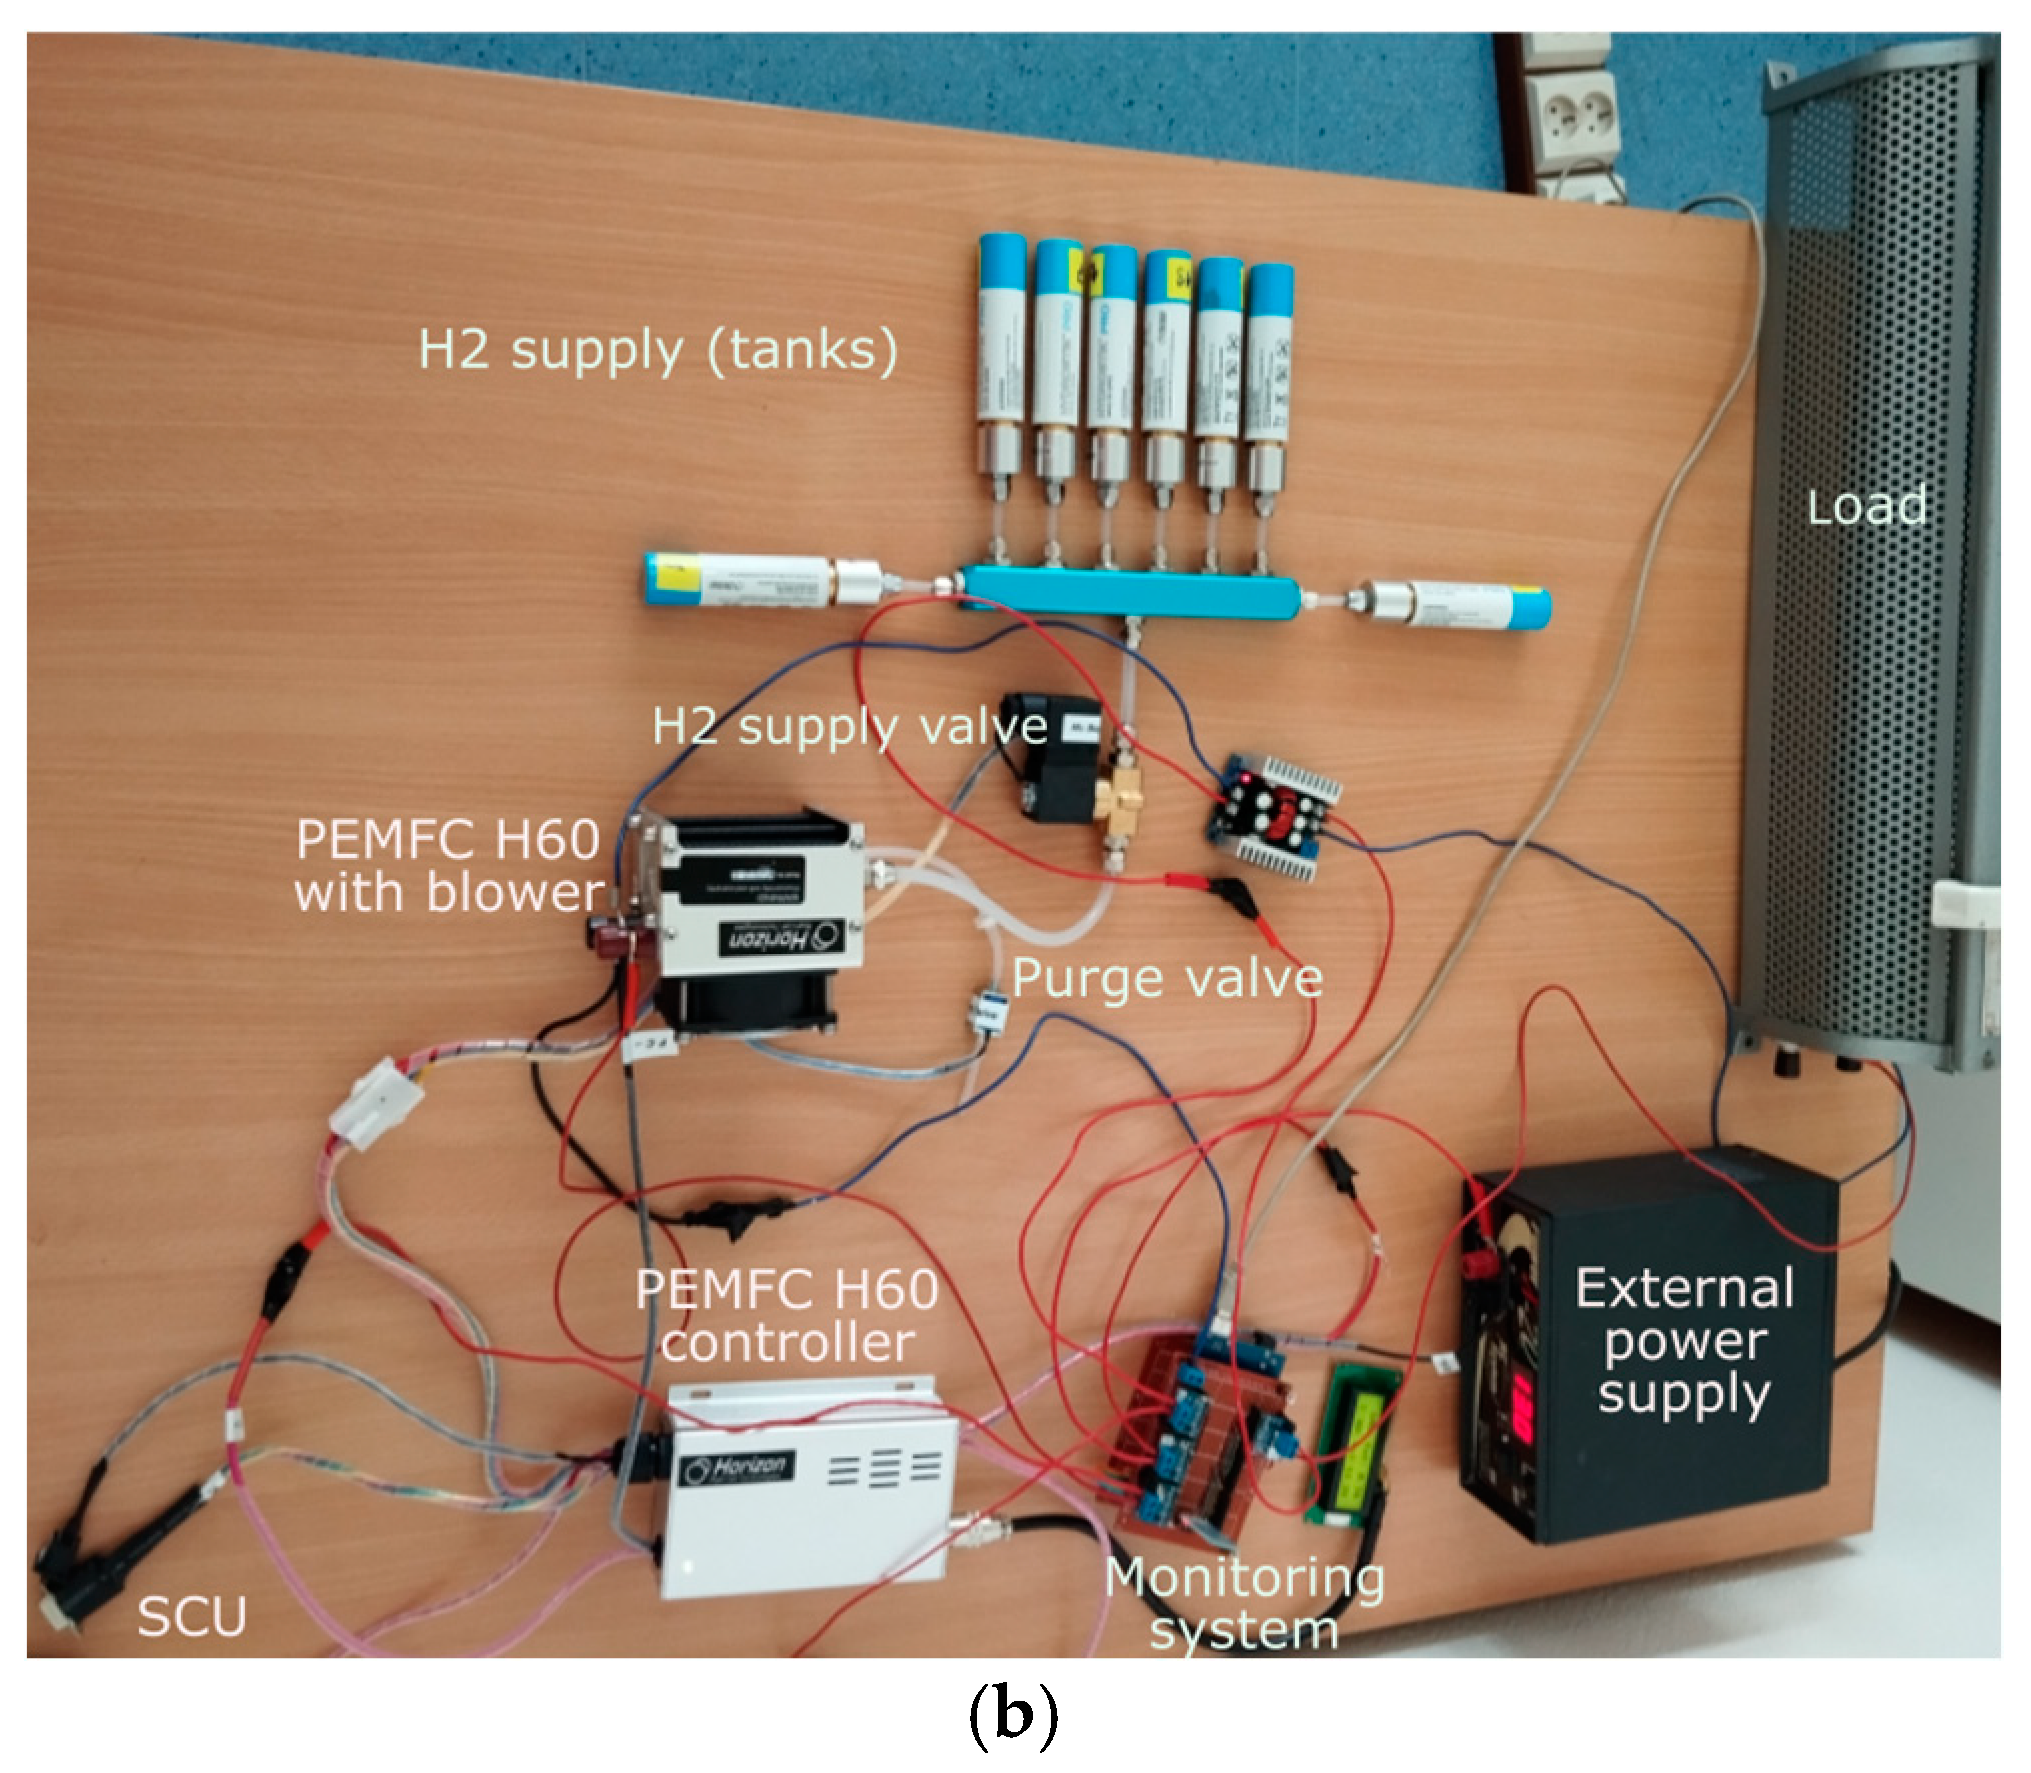
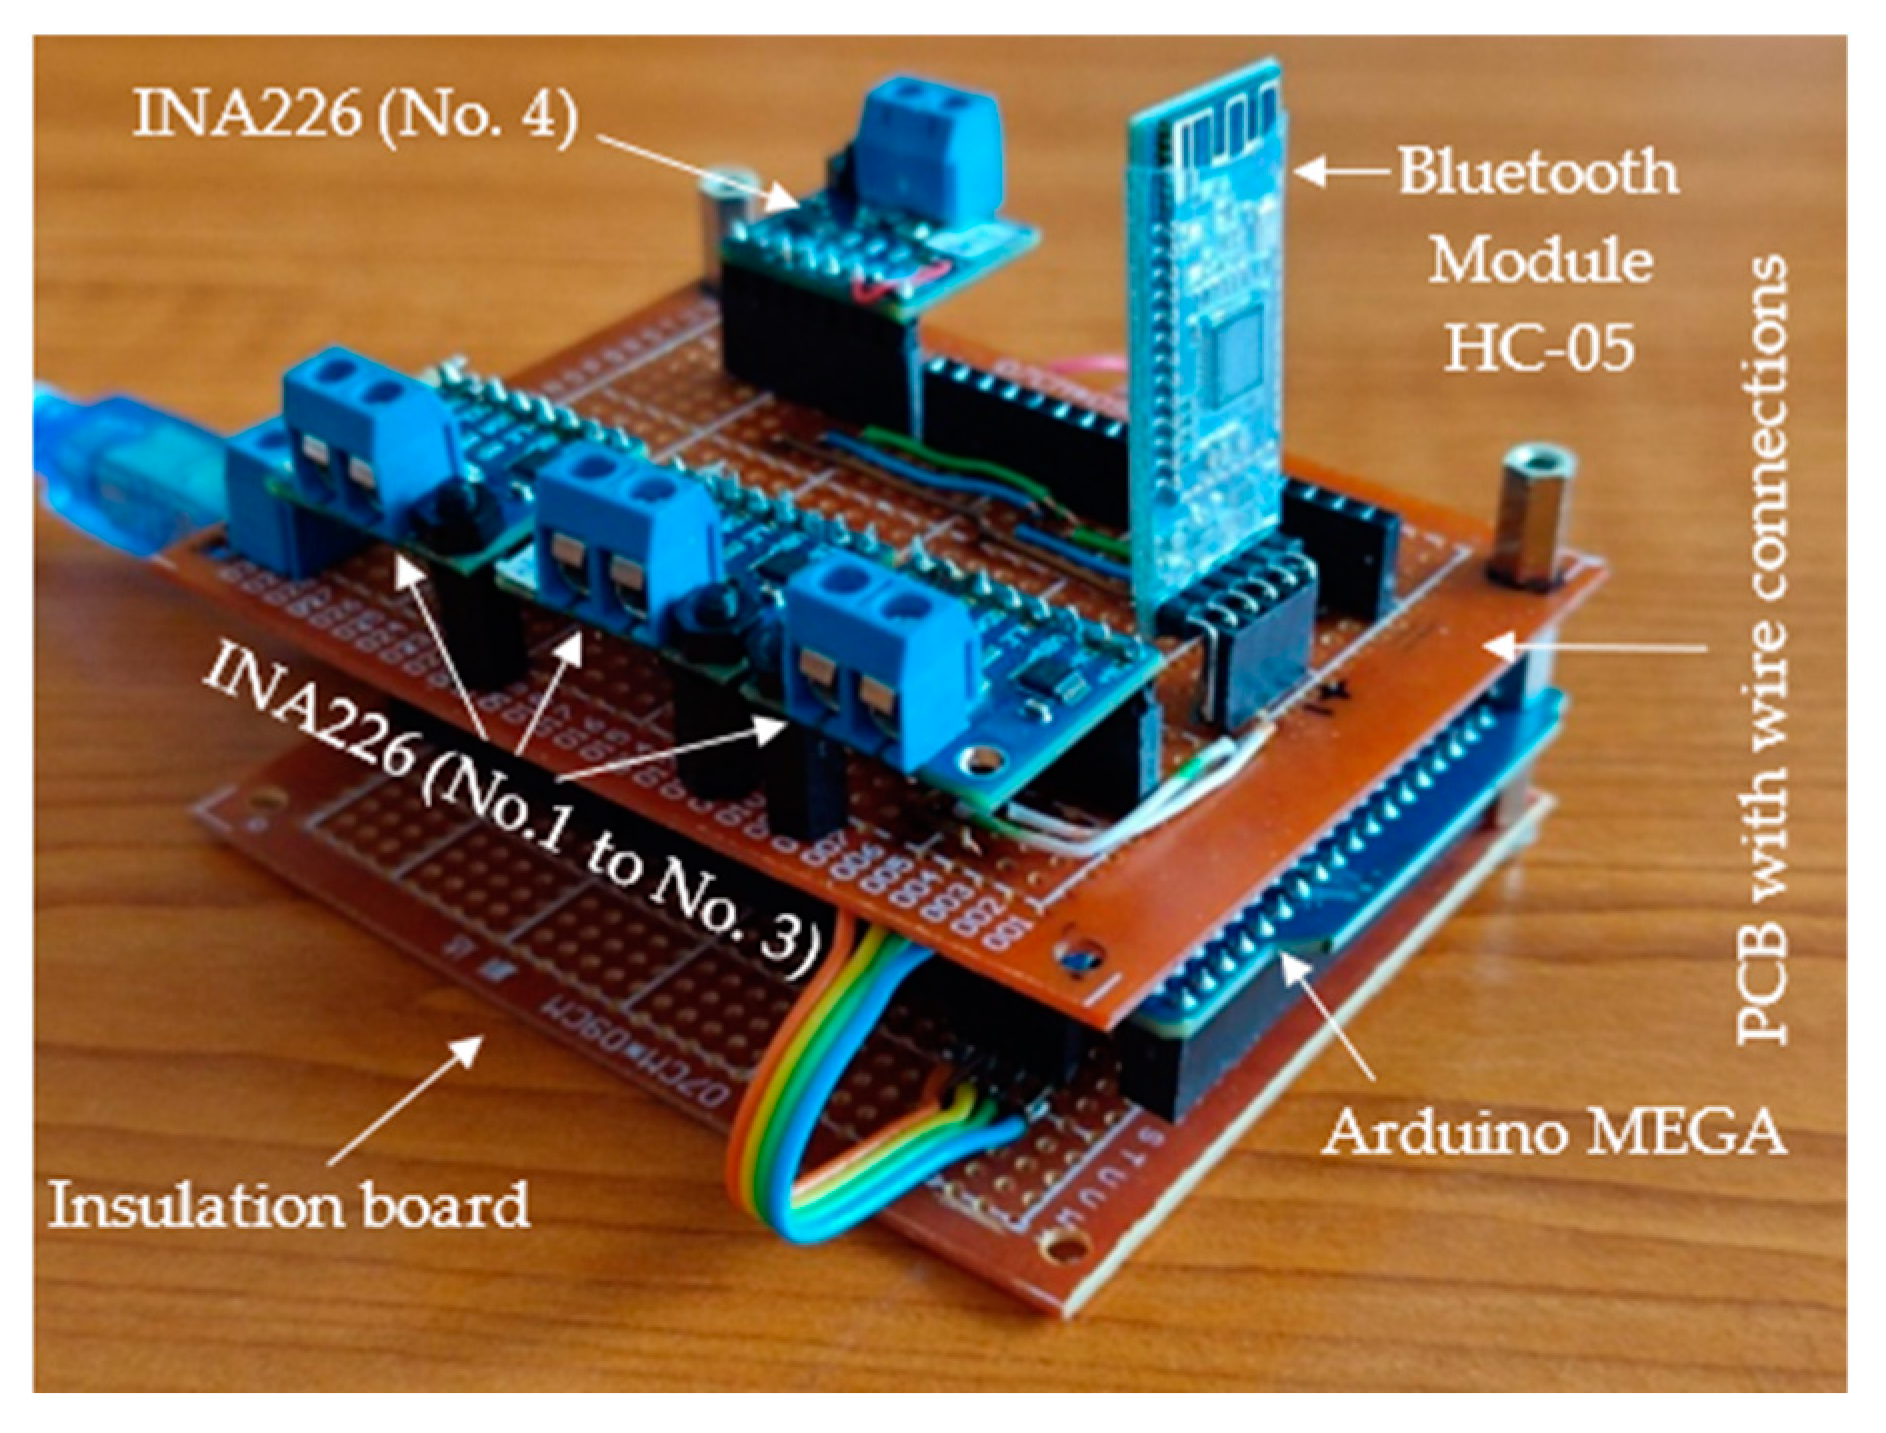
This section is focused on the realization of measurements at the measurement site. The measurement site was created according to the block diagram representation in Figure 3. The design of the embedded monitoring system with Arduino MEGA for monitoring the PEMFC power supply system can be seen in Figure 5. The upper PCB module consists of four modules, INA226 power monitors and Bluetooth module HC-05. At the lower PCB (used as an insulation board), the Arduino MEGA evaluation board is placed. The interconnection of the modules and Arduino MEGA is indicated in Figure 3.
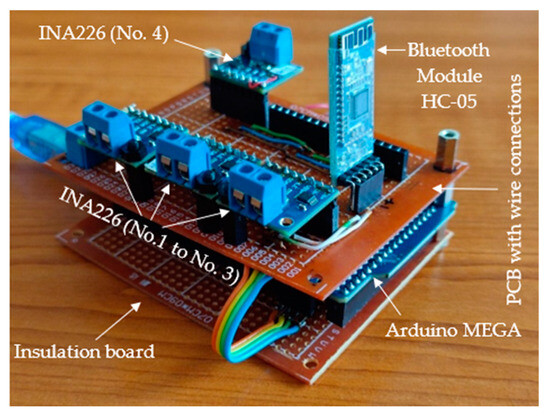
Figure 5.
Designed embedded monitoring system for FC-based power supply system.
The resistor load (rheostat 100 Ω/2 A max.) was used in our experiments. Power (current, voltage) monitors INA226, originally with their range up to 0.8 A, were equipped with other 0.004 Ω shunt resistors and calibrated according to the procedures and above-mentioned Equations (15)–(20) for a current measurement range up to 20 A.
The INA226 calibration process was started with the replacement of shunts according to the application requirements for measuring currents up to 20 A. The calibration itself consisted of experimentally setting the resistance value of individual shunts (to 0.004 Ω) in the Arduino MEGA script. During the calibration, the current values between individual INA226 were monitored and compared. This methodology was applied for current values up to 100 mA and up to 1 A. The error in the current values measured by individual INA226 did not exceed 2.55%.
Individual INA226 modules had a precisely defined measurement purpose. The first INA226 module No. 1 was used for the measurement of the fuel cell output voltage/current UCELL and ICELL.
INA226 No. 2 was used for the measurement of external voltage UEXT and external current IEXT from the external power supply needed for PEMFC controller operation itself.
INA226 No. 3 was used for the measurement of the PEMFC controller output voltage UOUT and current IOUT, which were connected to switching power supply.
INA226 No. 4 was used for the measurement of ULOAD voltage and ILOAD current values used for supplying the resistive load.
The first start of the fuel cell was characterized by the abnormal operation of the fuel cell because the fuel cell voltage was not stable, and the controller switched off the fuel cell for load currents ILOAD below 100 mA. This state is characteristic according to [18] for situations where the FC has been out of operation for a long time (or stored for more than two weeks). In the case of very long storage, it is necessary to rehydrate the PEM membrane according to the manufacturer’s recommendations [18].
However, in our case, it was necessary to realize slow start loading cycles. PEMFC was supplied by hydrogen and started without load-up to the moment when the cell stack voltage was increased above a level of 10 volts. In the next step, we gradually increased the load value. When the PEMFC stack was able to create voltage 12 V and continuous currents 700 mA, the next experiments were started.
Fuel cell voltage measurement and fuel cell current analysis are based on measurements of the FC power supply for ILOAD 100 … 700 mA with step of 100 mA, as seen in Figure 6 and Figure 7. The measurement process starts with a measurement at ILOAD = 200 mA, continuing to 100, 300 … 700 mA. The main reason for this procedure was to restore and ensure the stable operation of the PEMFC after a longer period of operational inactivity. The first measurement when the PEMFC operation was stable was really for ILOAD = 200 mA. The timeline in Figure 6, Figure 7, Figure 8, Figure 9, Figure 10 and Figure 11 and their colour legend demonstrate the above-mentioned measurement process. All measurements were realized at ambient temperature, 298.15 K.
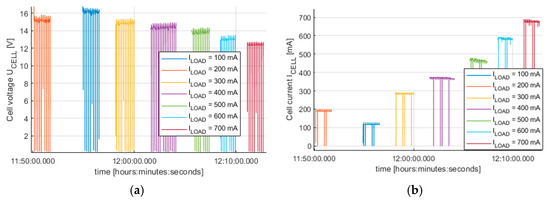
Figure 6.
Measurement at (a) the output voltage UCELL and (b) current ICELL of PEMFC type H60.
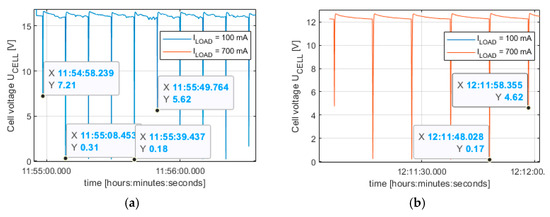
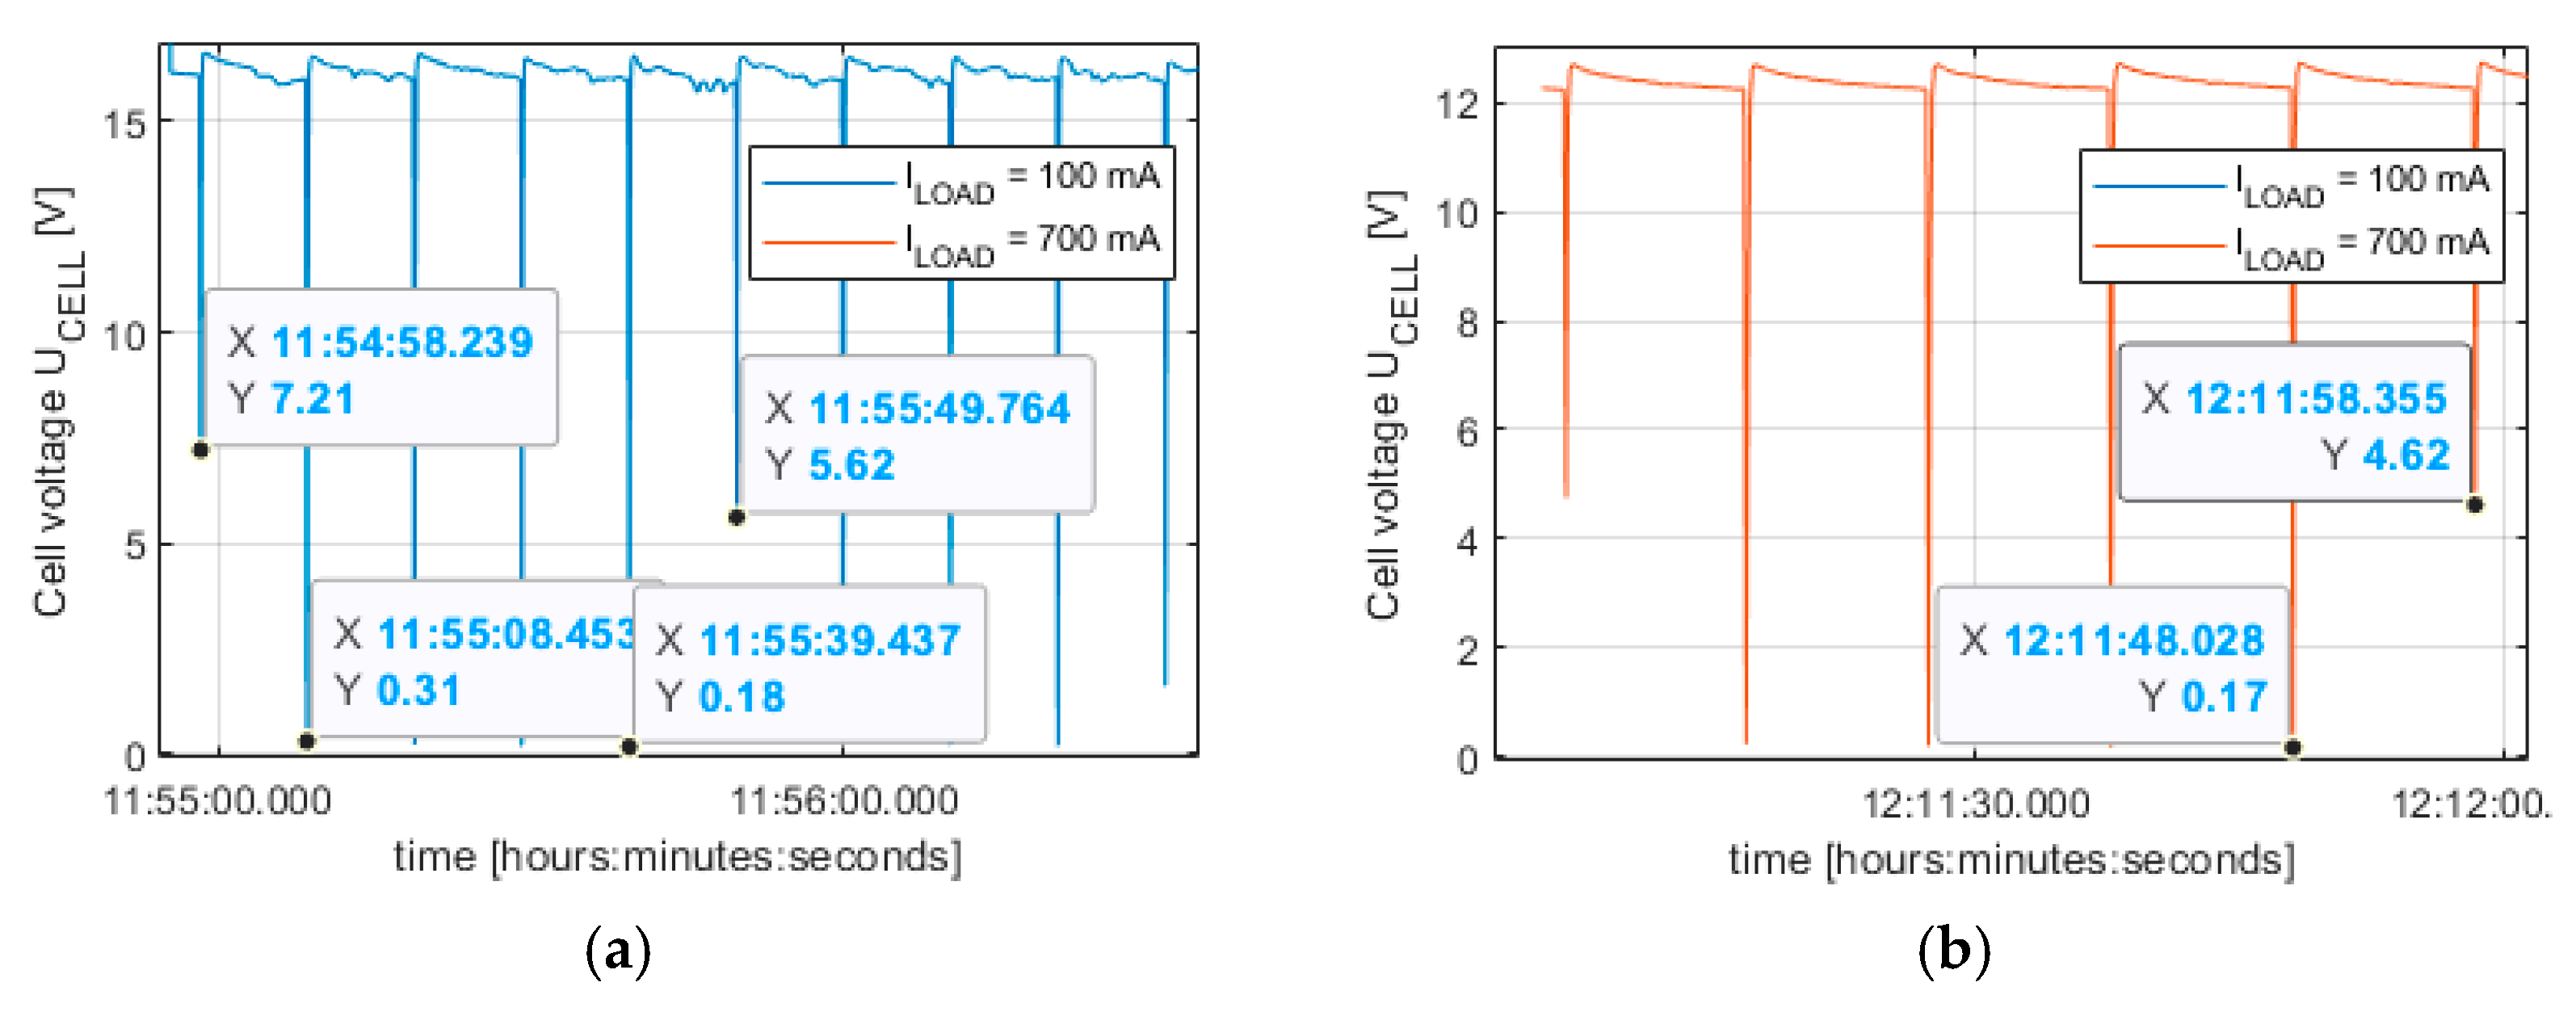
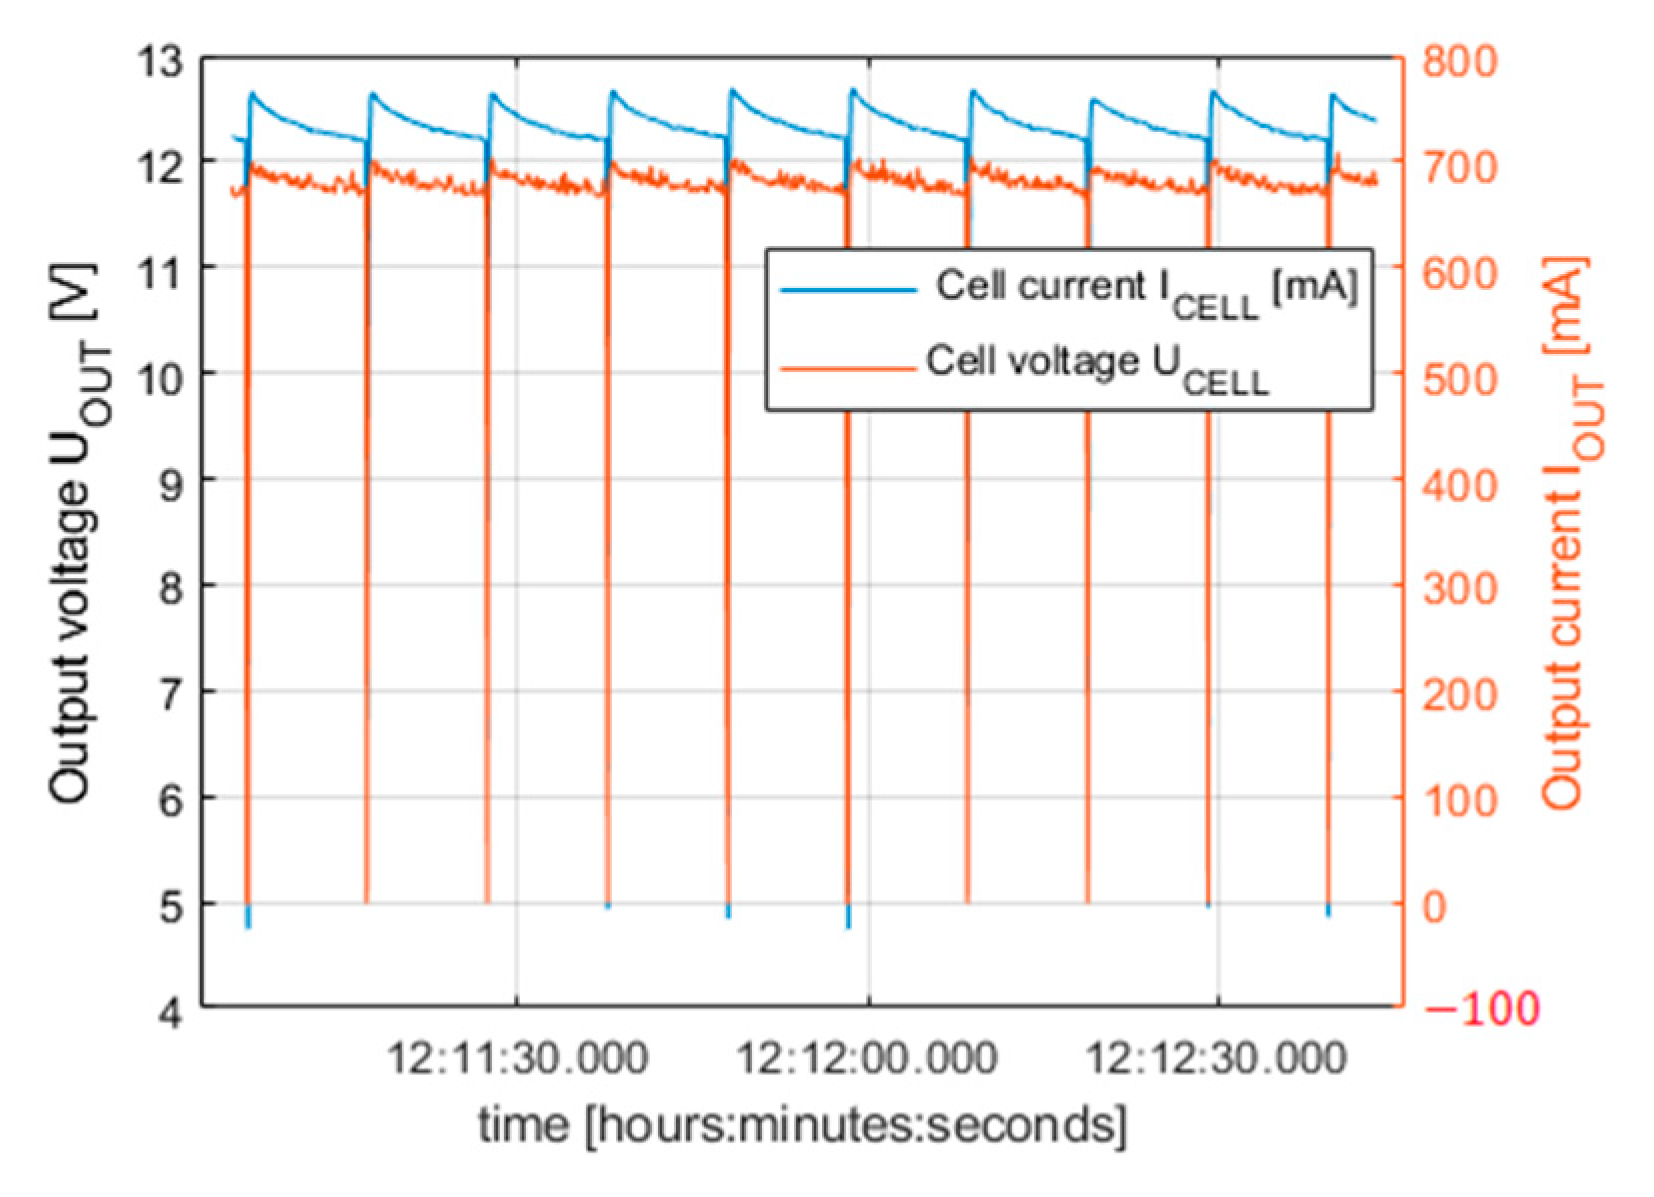
Figure 7.
UCELL voltage in length-constant PEMFC cycles for (a) ILOAD = 100 mA and (b) ILOAD = 700 mA.
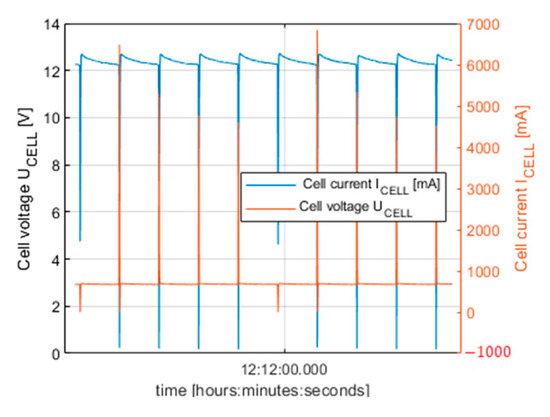
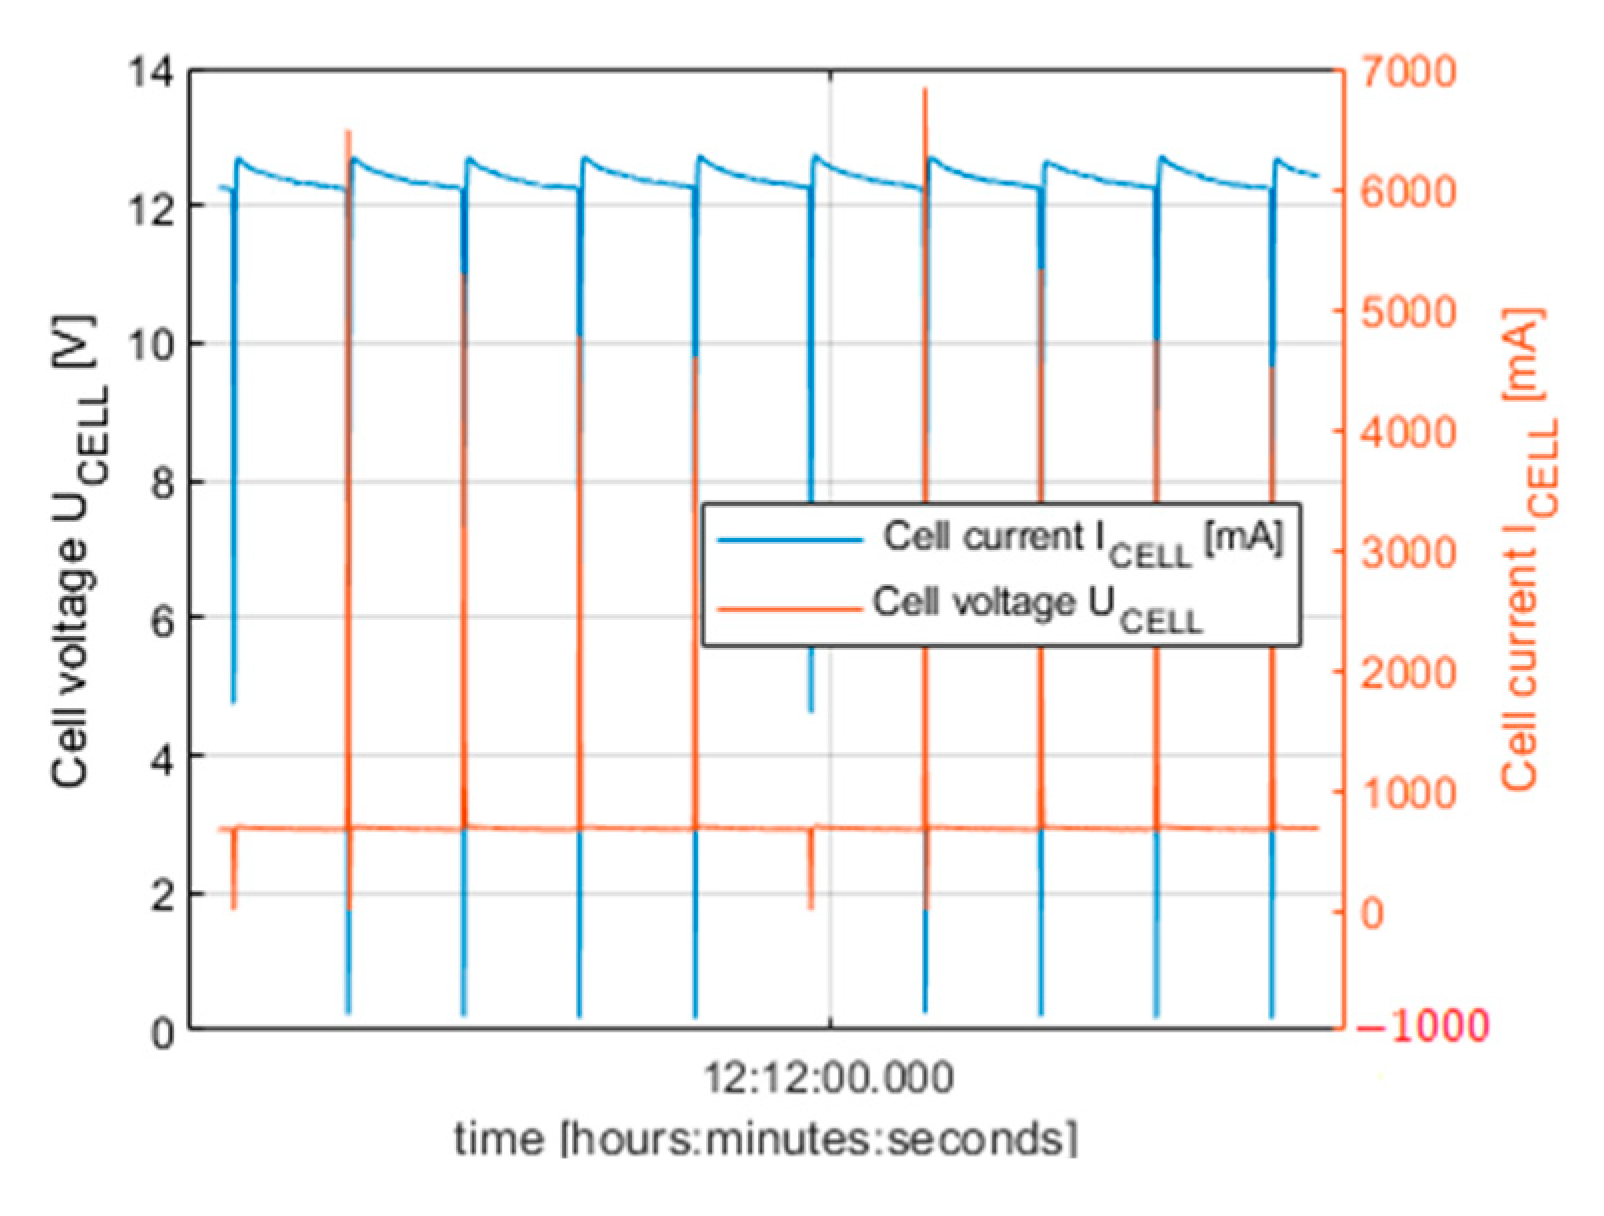
Figure 8.
Current and voltage peaks are created during hydrogen-supplying intervals.
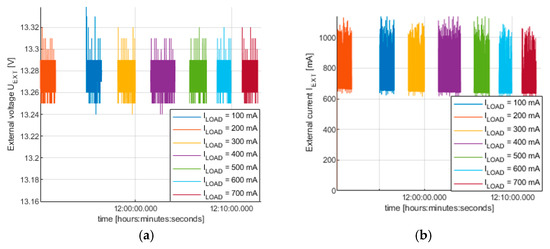
Figure 9.
External power supply parameters for (a) UEXT voltage and (b) IEXT current.
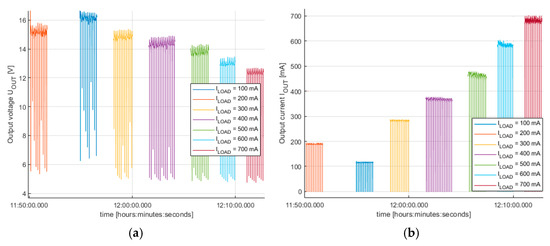
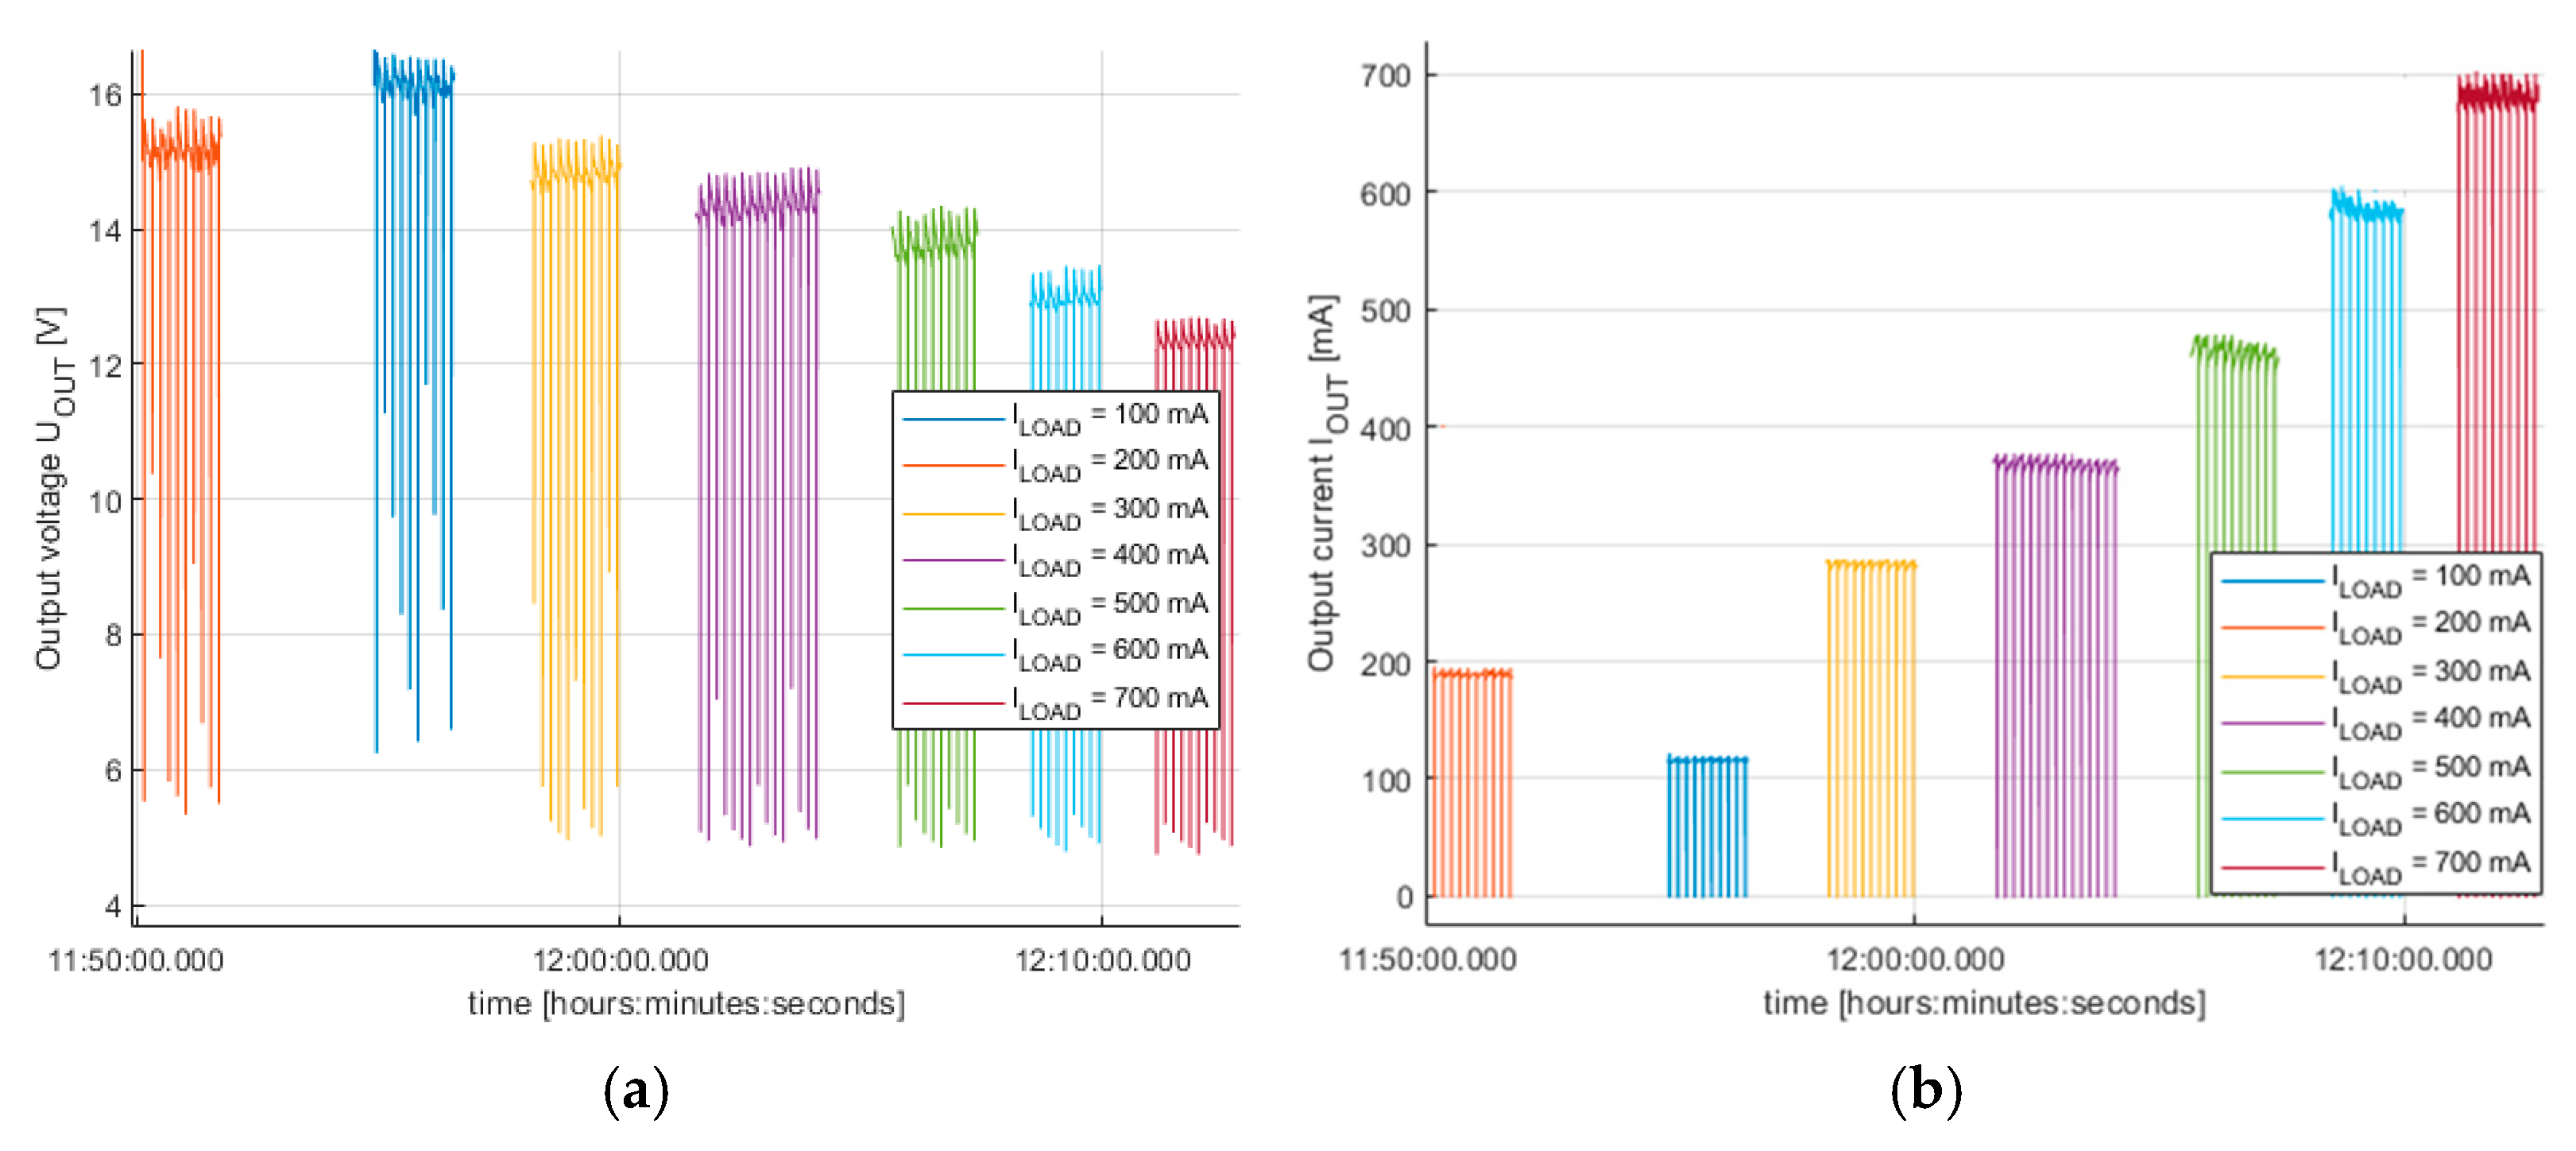
Figure 10.
PEMFC controller output parameters of (a) UOUT voltage and (b) IOUT current.

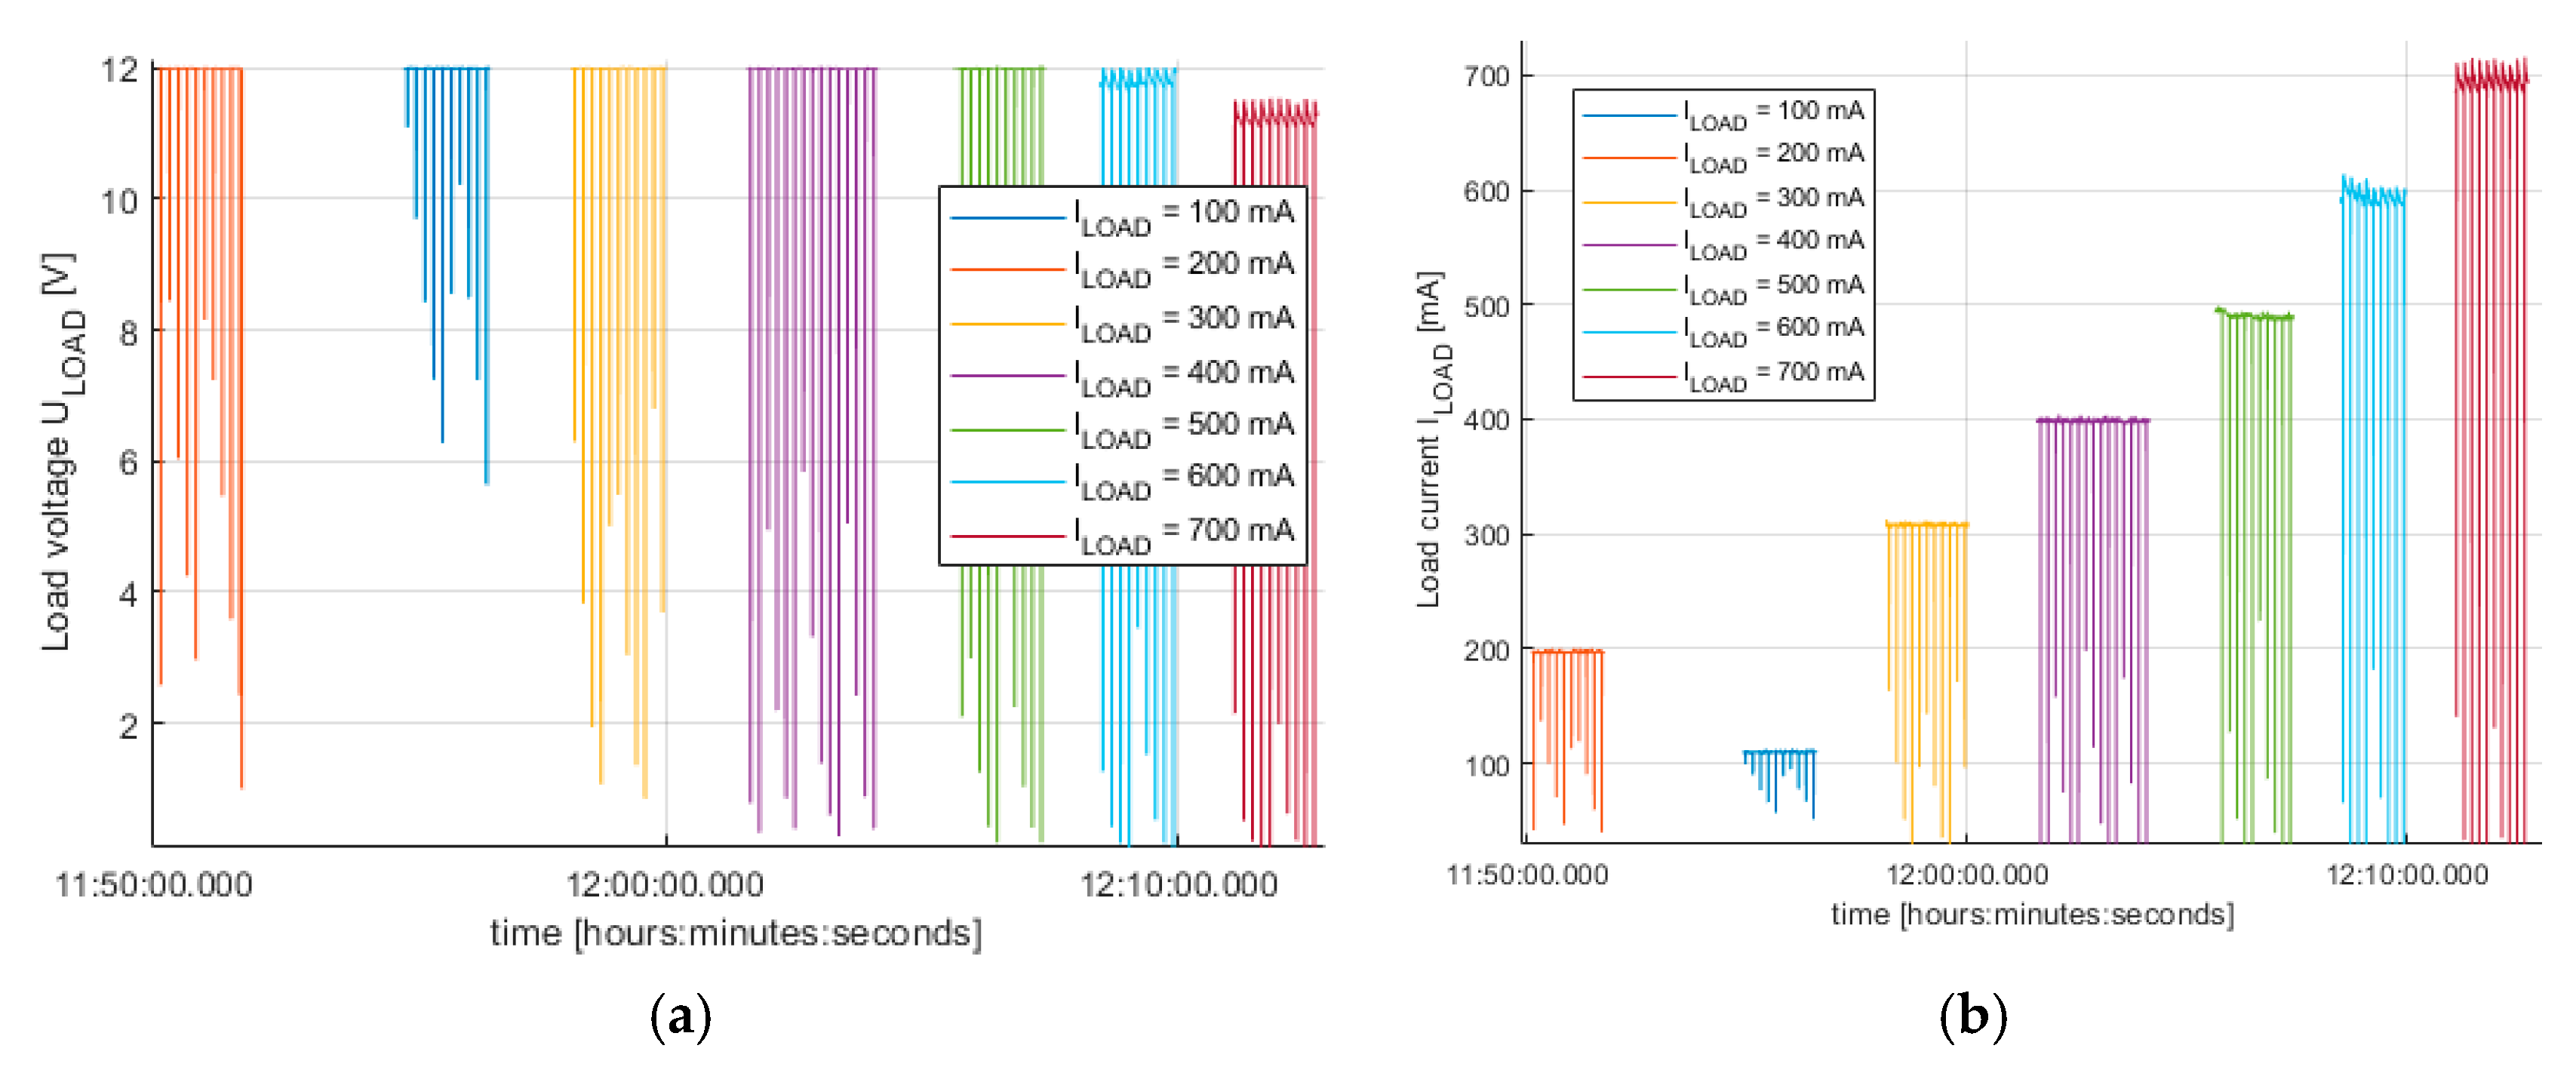
Figure 11.
Load voltages (a) and load currents (b) at SZBK07 converter output.
The UCEEL voltages (in Volts) shown in Figure 6 are values depending on the load (ILOAD) connected through the PEMFC controller. When the load increased, the FC current ICELL (in Amperes) increased too, and the FC voltage UCELL values (in Volts) decreased faster.
The PEMFC operation cycles in Figure 6 and Figure 7 consist of times (10 s intervals) when H60 PEMFC creates voltages UCELL. They are characterized by sawtooth-like decreasing voltage time curves and current with sudden drops in their values.
After each 10 s interval, the microcontroller through the opened hydrogen H-supply valve refilled new H to the H60 stack. At this moment, the purge valve is opened, and redundant hydrogen and water residues are forced out of the fuel cell. These situations are characterized by decreasing the output FC voltages and currents, as in Figure 7, for time intervals less than 200 ms. These intervals work in the same way that 10 s operation cycle times are approximately constant for PEMFC H60. The FC operation cycle is characterized by the decreasing UCELL voltage by approximately 0.65 V (for 100 mA) or by 0.45 V (for 700 mA load current ILOAD).
In Figure 8, there are recorded positive/negative ICELL current peaks, with 10 s periods corresponding to intervals where hydrogen was supplied to the PEMFC through the input supply purge, and the FC voltages decreased for less than 200 ms.
External voltage analysis and external current analysis are described according to Figure 9, where the external voltage from the external DC power supply UEXT for controller operation is constant at approximately 13 V. The current IEXT decreases when load currents ILOAD are increasing. Waveforms of IEXT are peak free because these variables are not directly dependent on the PEMFC H60 output variables. External current values IEXT are changing in interval from 600 mA (continuous value) up to 1.26 A (peak values with duration time 200 ms).
Output voltage UOUT analysis and output current IOUT analysis according to Figure 10 express that the FC controller output voltage UOUT (in Volts) is decreasing (from 16.6 V to 12.2 V), and it depends on the load resistance and load current. The PEMFC H60 controller output current IOUT values reach a value from 100 mA up to 700 mA for different load currents ILOAD. Waveforms UOUT and IOUT are characterized by the specific shape connected with the PEMFC duty cycle (10 s intervals), like the UCELL waveform in Figure 7.
Output voltage UOUT and output current IOUT waveforms are shown in Figure 12. As can be seen, the drop in output volage ΔUOUT is approximately 0.45 V within the selected duty cycle of PEMFC H60 (for ILOAD = 0.7 A).
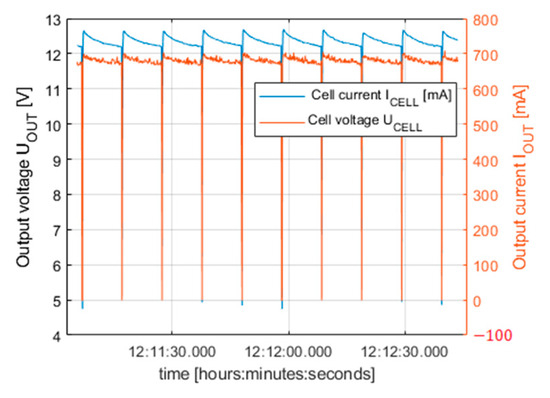
Figure 12.
Output voltage UOUT analysis and output current IOUT waveforms ILOAD = 0.7 A.
The load voltages ULOAD and load currents ILOAD, as can be seen in Figure 11, depend on the PEMFC controller output as well as the switching power supply (SZBK07), where one can set the voltage and current level, both necessary for the supply and safety function of the load.
The load voltage ULOAD is strictly regulated to the 12 V level by the SZBK07 (adjustable DC-DC Buck Converter) for load currents ILOAD up to 500 mA. For load currents ILOAD greater than 500 mA, load voltages ULOAD lower than 12 V occur. UOUT voltage values for ILOAD = 600 mA and 700 mA are changing in intervals 11.7–12 V and 11.1–11.5 V, respectively. The reason is that a lower voltage value UOUT at the input of SZBK07 does not allow one to regulate the voltage to the 12 V level. As can be seen in Figure 11, voltage (ULOAD) and current (ILOAD) waveforms lack the previously mentioned positive amplitude peaks thanks to filtering in SZBK07. Negative voltage and current (ULOAD, ILOAD) peaks connected with PEMFC operation cycles are present in their waveforms, as in Figure 11.
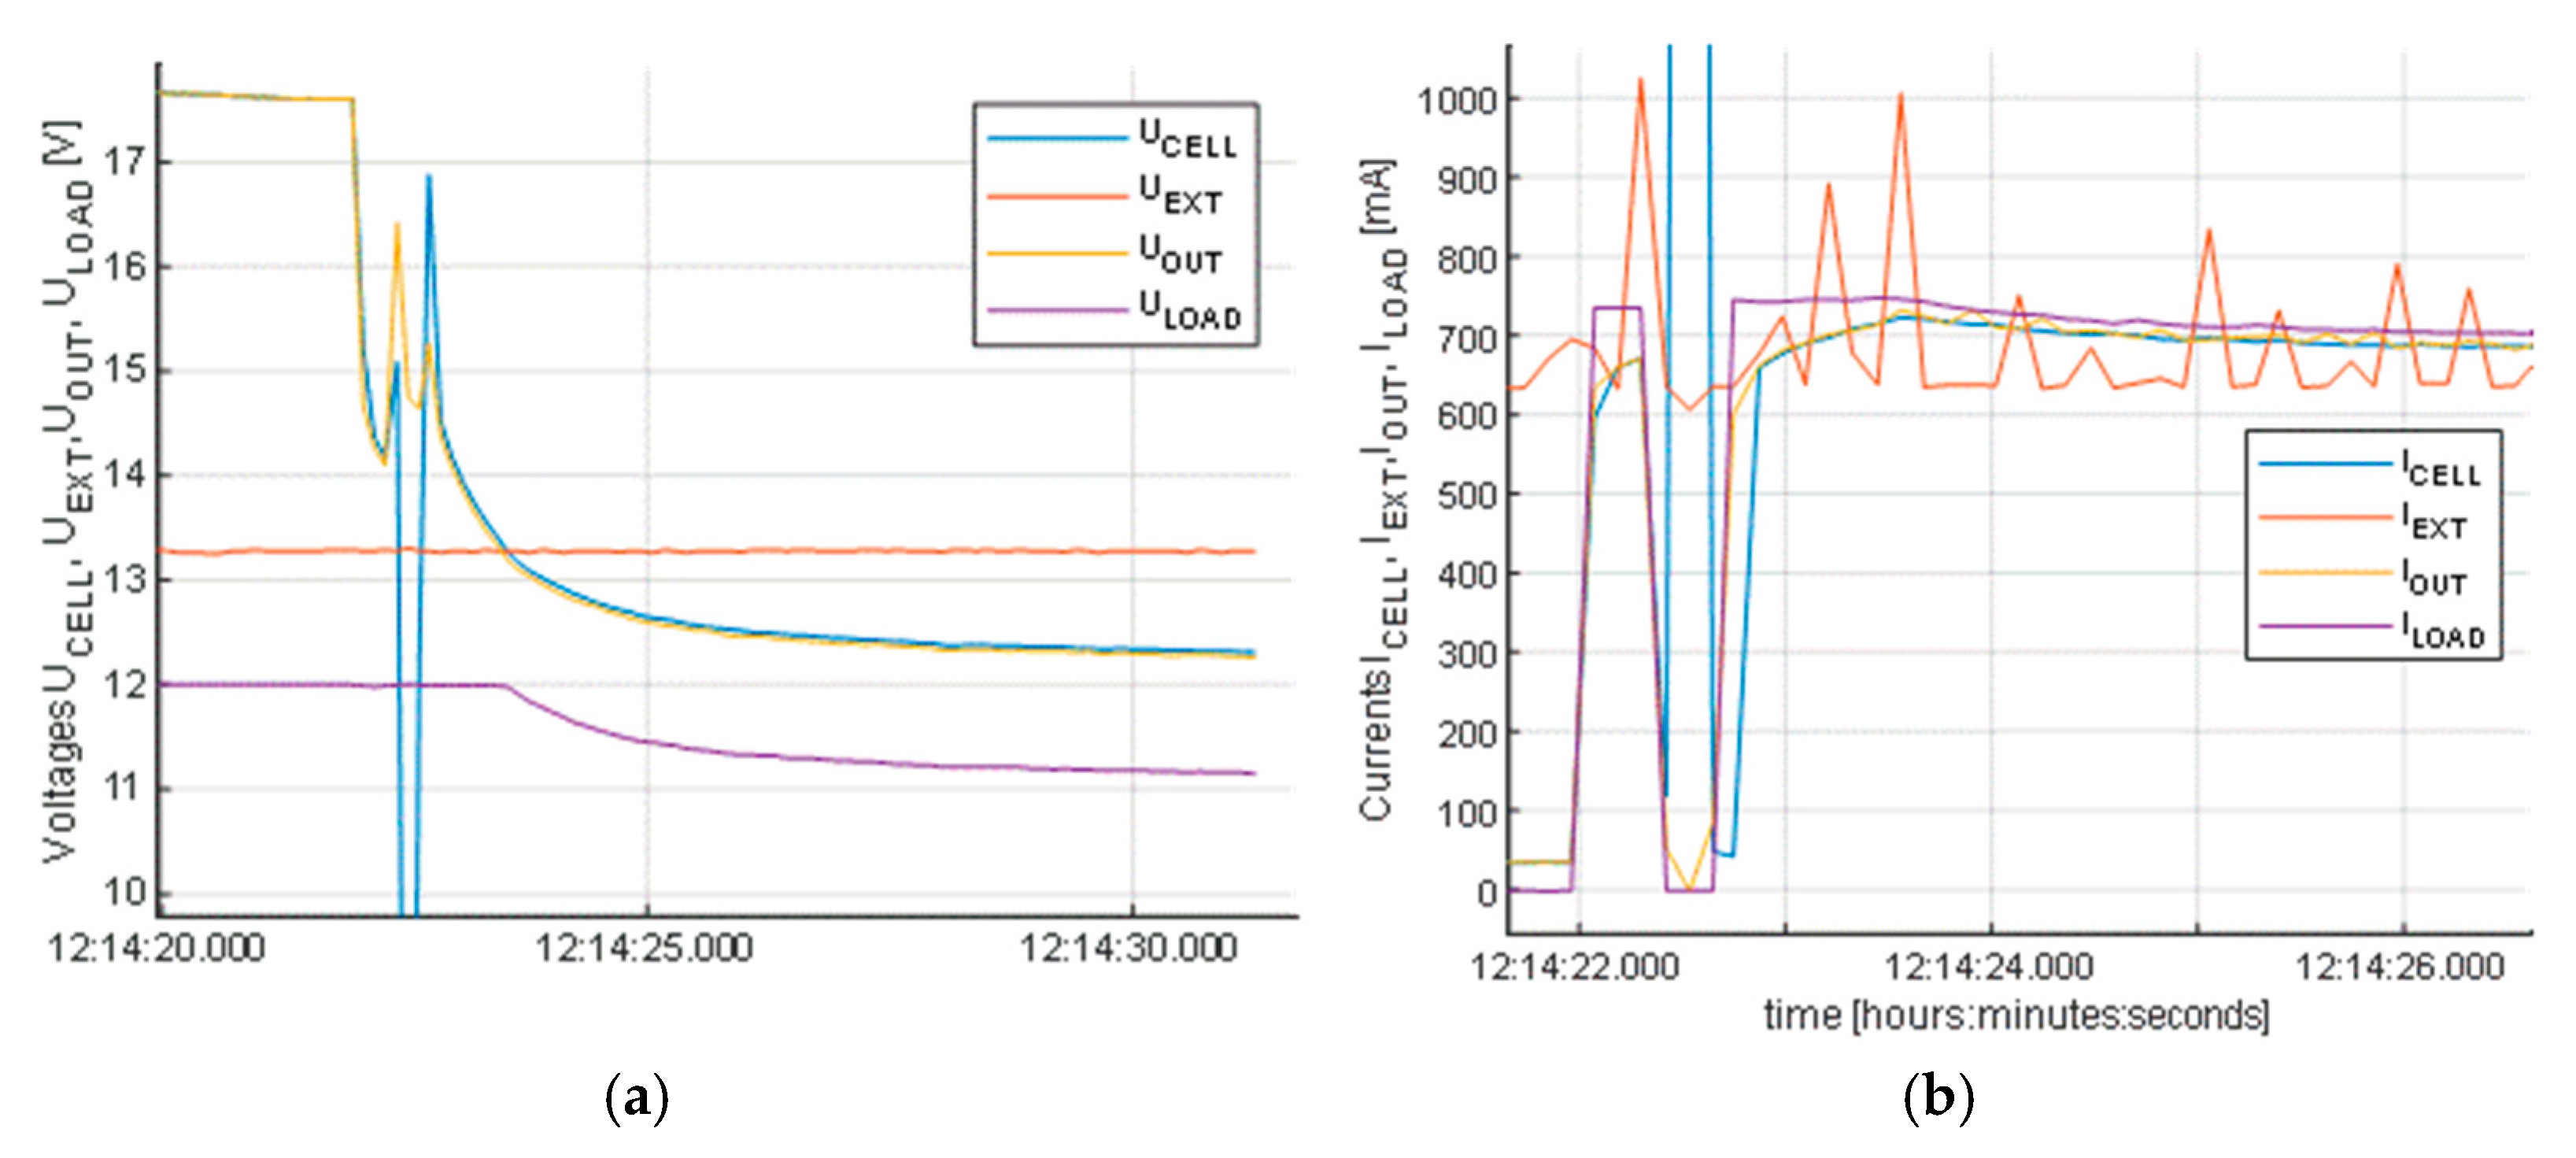
The influence of the load on PEMFC operation can be seen in Figure 13. The load was connected to the PEMFC–based power supply, and the current reached ILOAD = 700 mA. FC voltages after load connection decreased from 17.7 V to 12.26 V. Voltages UCELL, UOUT and ULOAD exponentially decreased during 7 s intervals. At the same time, currents from the FC stack ICELL, PEMFC controller IOUT, and load current ILOAD increased up to values of 703 mA, 685 mA and 670 mA, respectively.
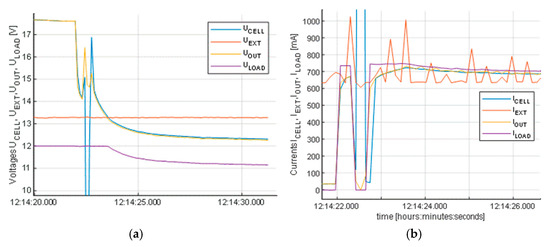
Figure 13.
Voltages (a,b) currents after switching on the load to PEMFC power supply (ILOAD = 0.7 A).
Figure 14 shows the influence of the load on FC power supply operation. The load was switched off (for ILOAD = 700 mA). FC voltages UCELL and UOUT increased from 12.2 V to 17.7 V and ULOAD values to 12 V in less than 2 s.
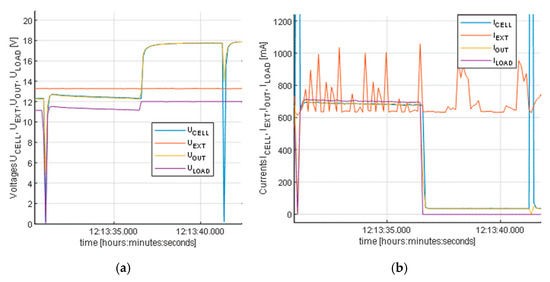
Figure 14.
Voltage (a,b) currents after switching off the load (ILOAD = 0.7 A).
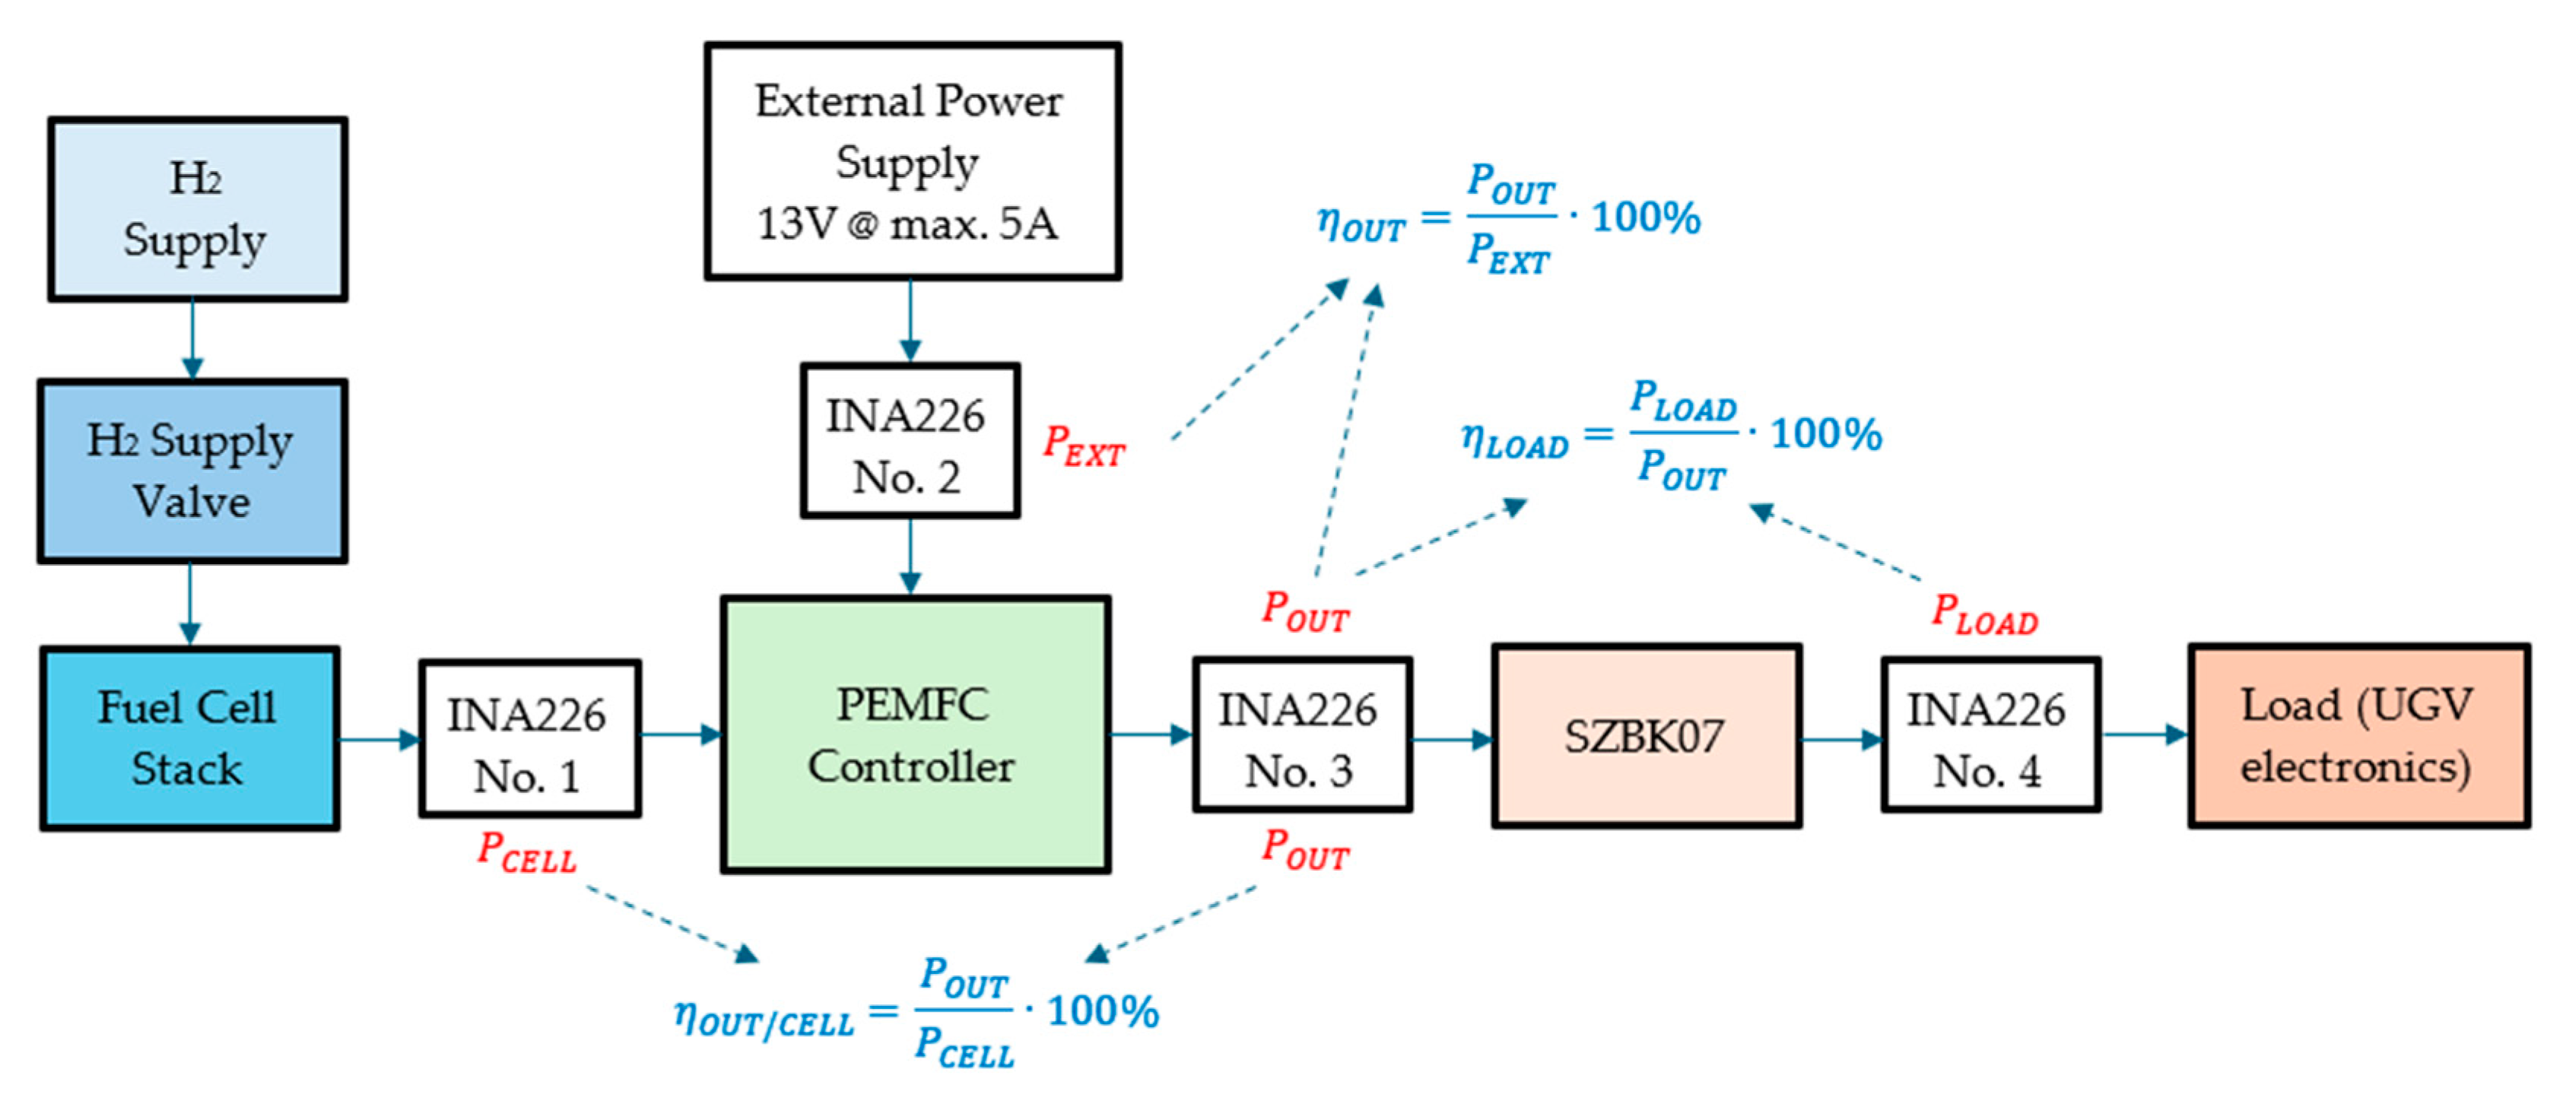
For a better understanding, the power measured by individual INA226 in selected parts of the PEMFC power supply is shown in Figure 15.
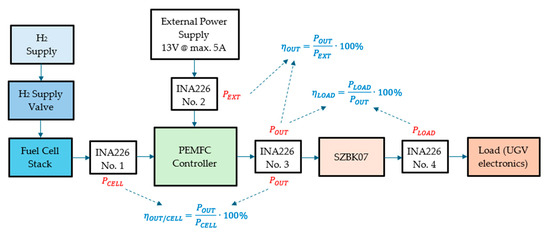
Figure 15.
Schematics of power measurement by INA226 sensors and efficiencies calculation.
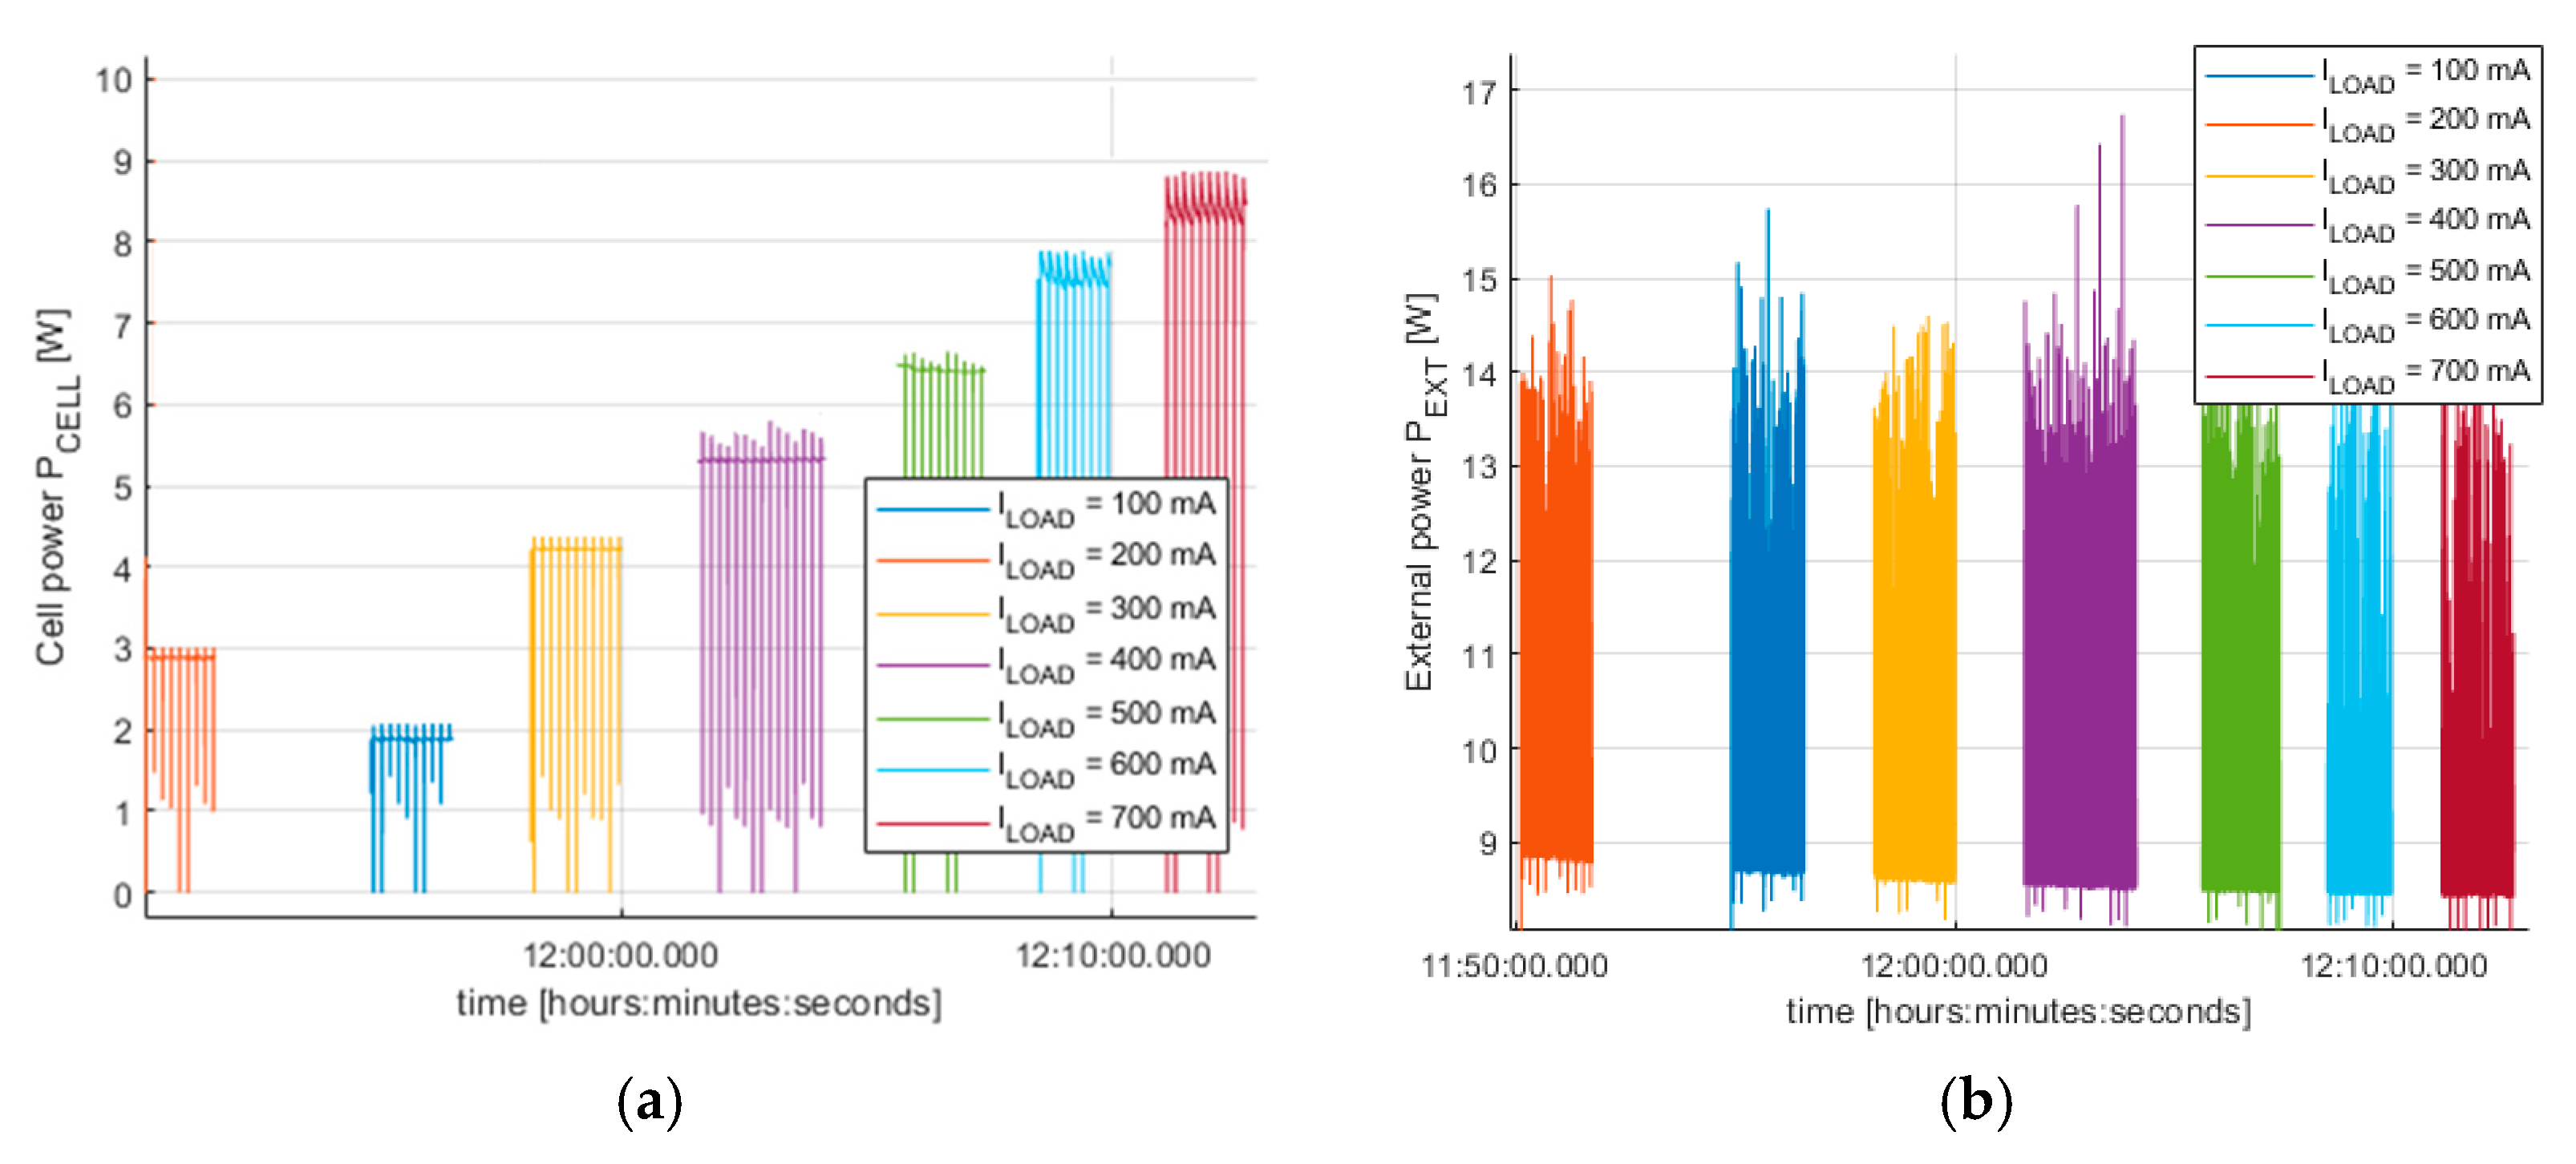
According to Figure 16, PEMFC creates power PCELL of approximately 1.9 W, 2.9 W, 4.2 W, 5.3 W, 6.5 W, 8 W and 9 W for ILOAD from 100 mA up to 700 mA. The overall power PEXT, necessary for the PEMFC controller decreases when ILOAD increases.
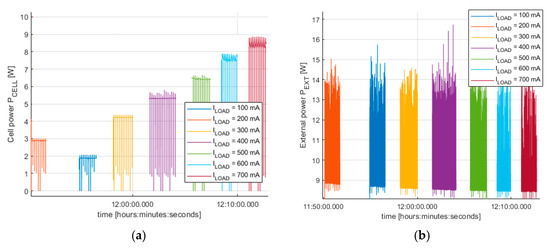
Figure 16.
Powers PCELL (a) and PEXT (b).
In any case, the PEMFC controller needs a minimal continuous value of PEXT = 8.8 W or more to ensure the operation of the FC controller system and its elements (ventilation fan, valves, etc.). The initial comparison of power values PEXT against POUT was the starting point of the experiments.
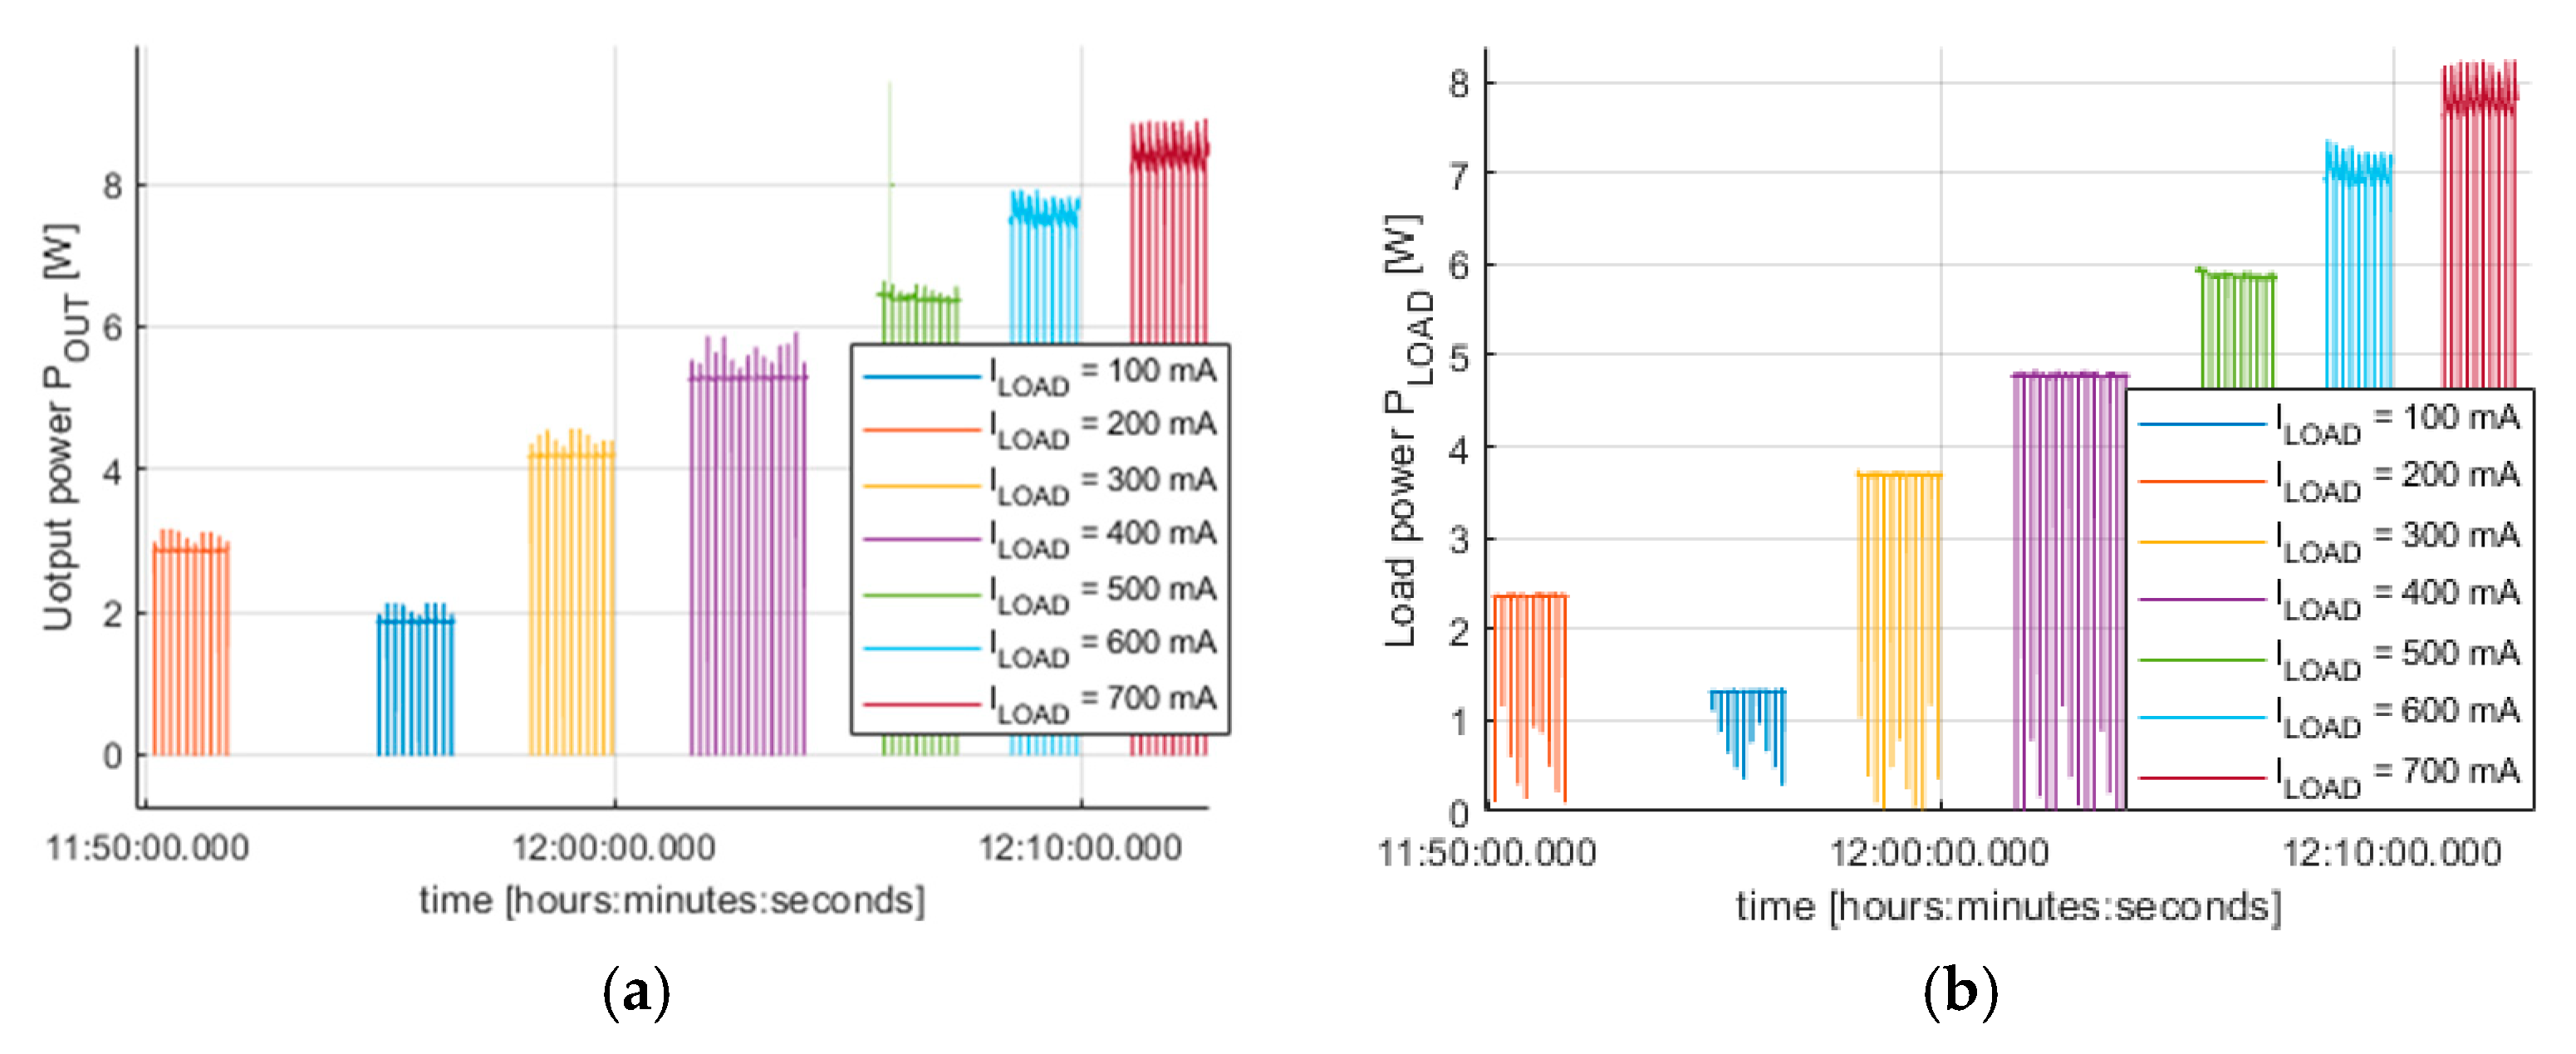
Controller output powers POUT are almost the same, compared with PCELL values, namely 1.9 W, 2.9 W, 4.22 W, 5.3 W, 6.4 W, 7.9 W and 8.9 W, for load currents from 100 mA up to 700 mA, respectively (see Figure 17).
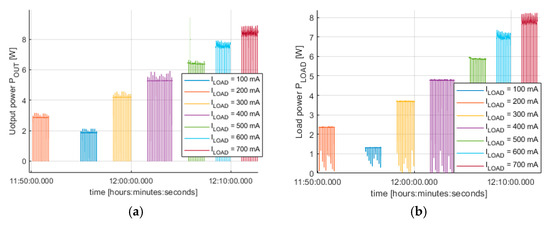
Figure 17.
Powers POUT (a) and PLOAD (b).
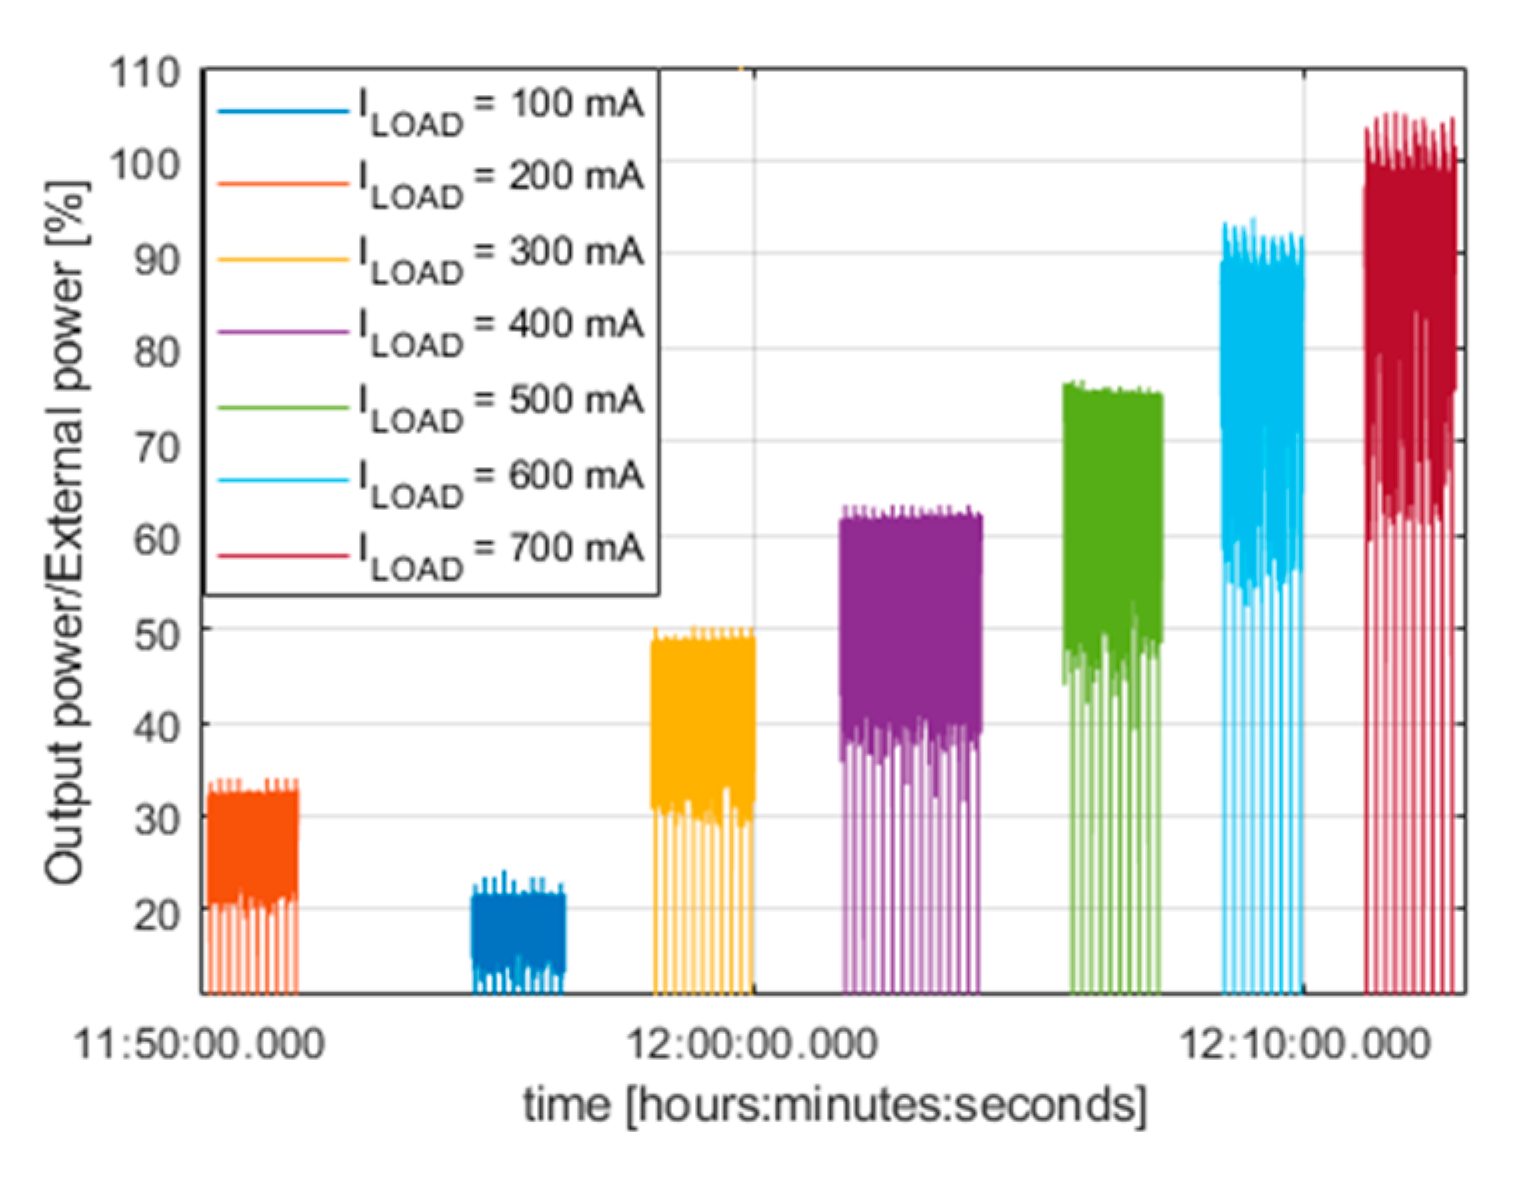
It is possible to evaluate efficiency (expressed in percentages) from the point of view of the output power POUT created by the PEMFC controller related to the external power PEXT necessary for PEMFC controller operation (see Figure 15 and Figure 18) as is in (12).

Figure 18.
PEMFC controller efficiency computed according to (12).
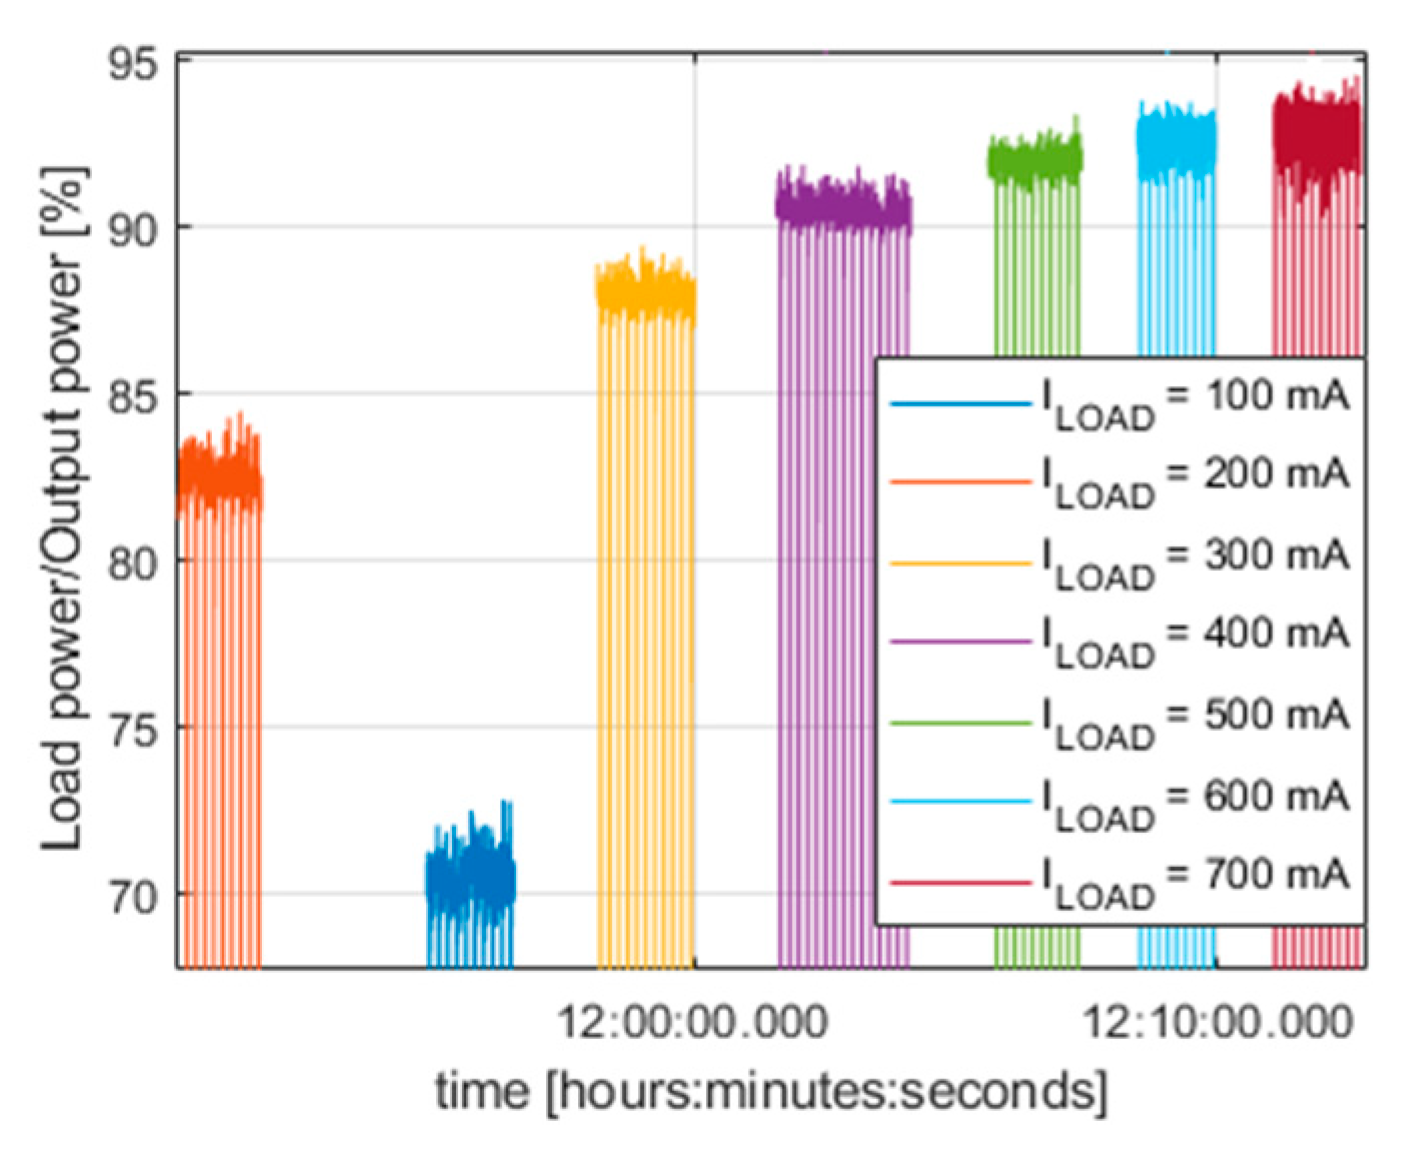
The efficiency of SZBK07 (expressed in percentages) used in the PEMFC power supply (see Figure 15 and Figure 19) can be expressed by (13).

Figure 19.
Efficiency of SZBK07 computed according to (13).
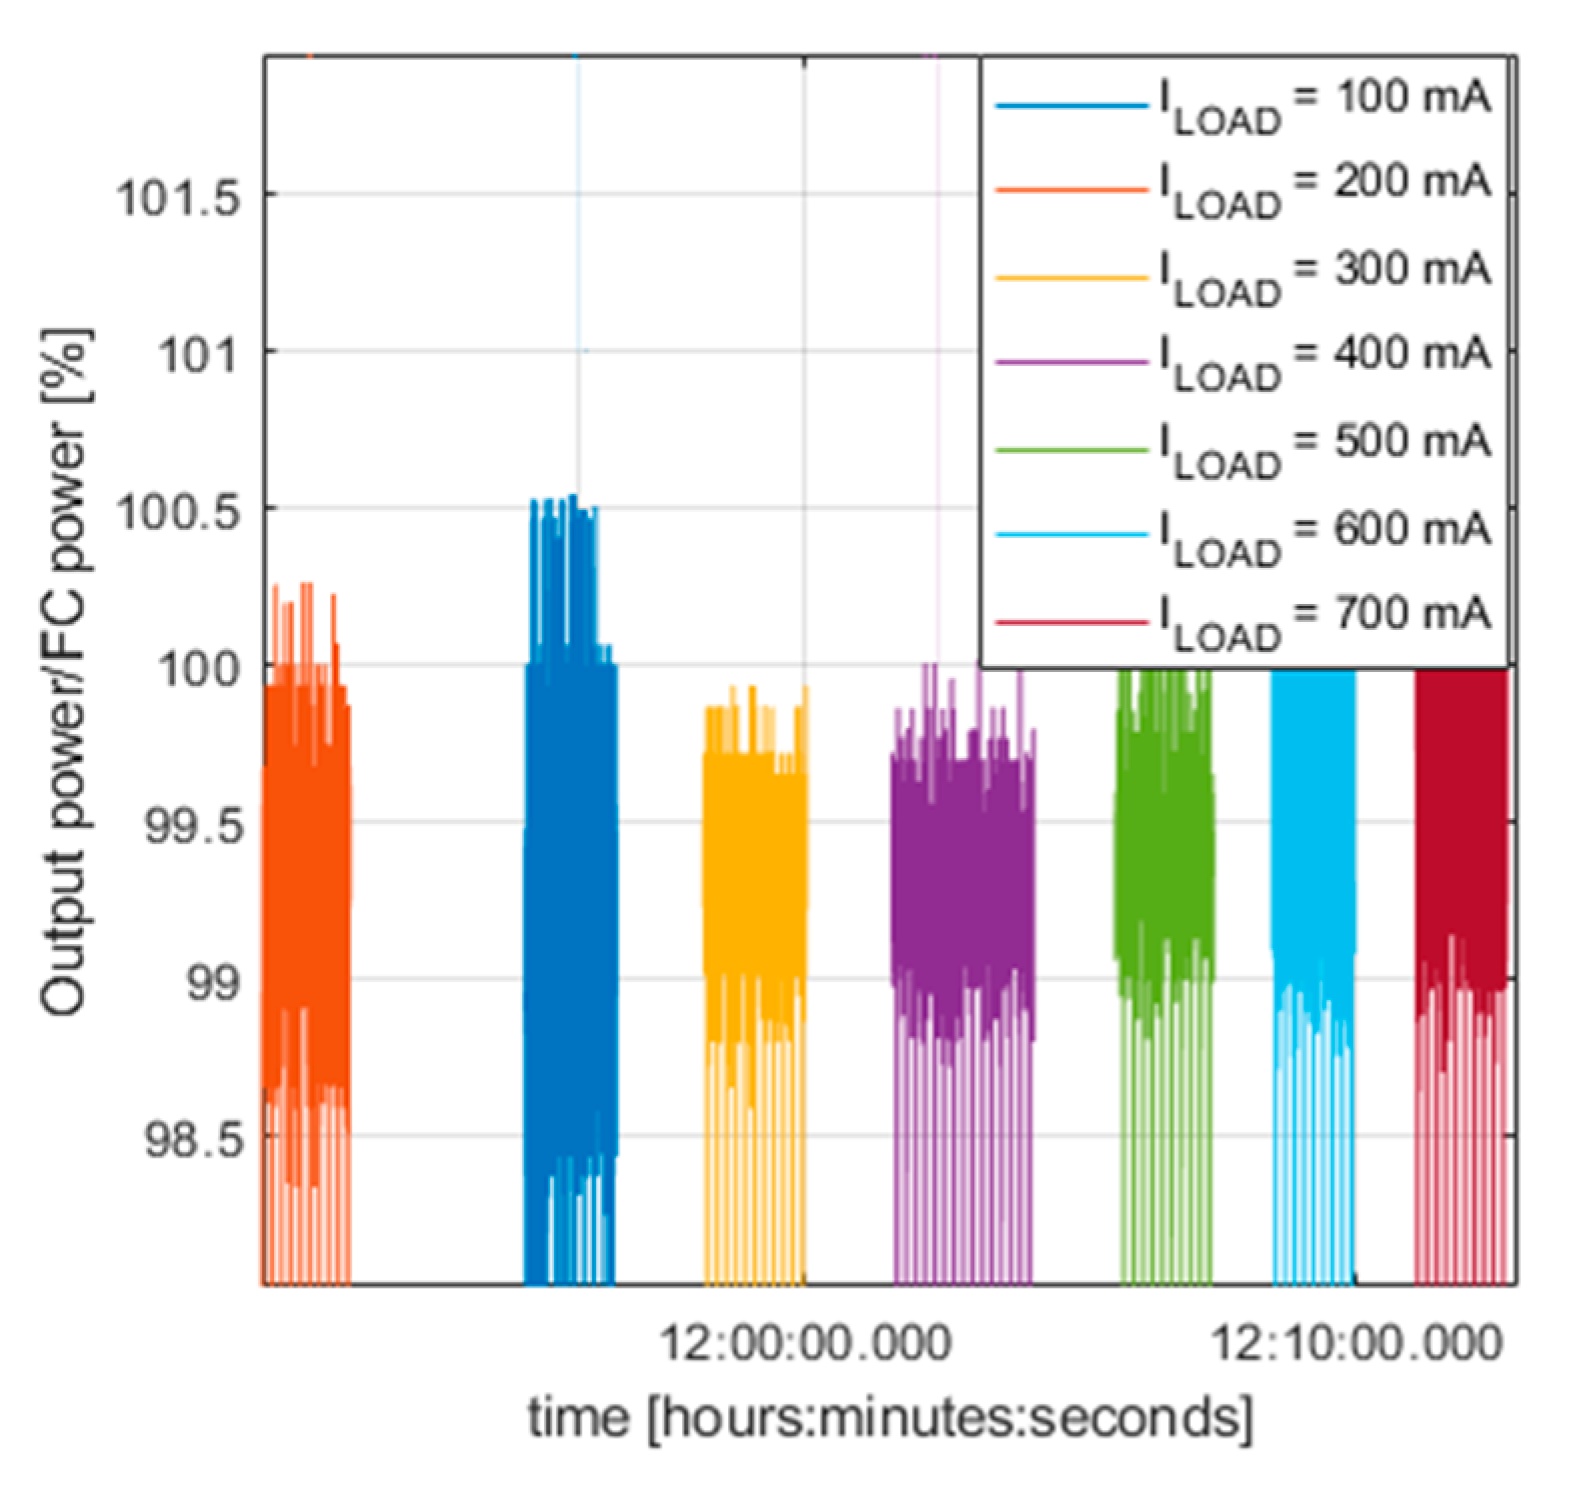
The efficiency of the PEMFC controller (expressed in percentages) from the point of view of the FC stack power is shown in Figure 20 and given by (14).

Figure 20.
Efficiency computed according to (14).
Table 3 summarizes all the efficiencies of the PEMFC power supply system in corresponding intervals.
Table 3.
Summarized efficiency values.
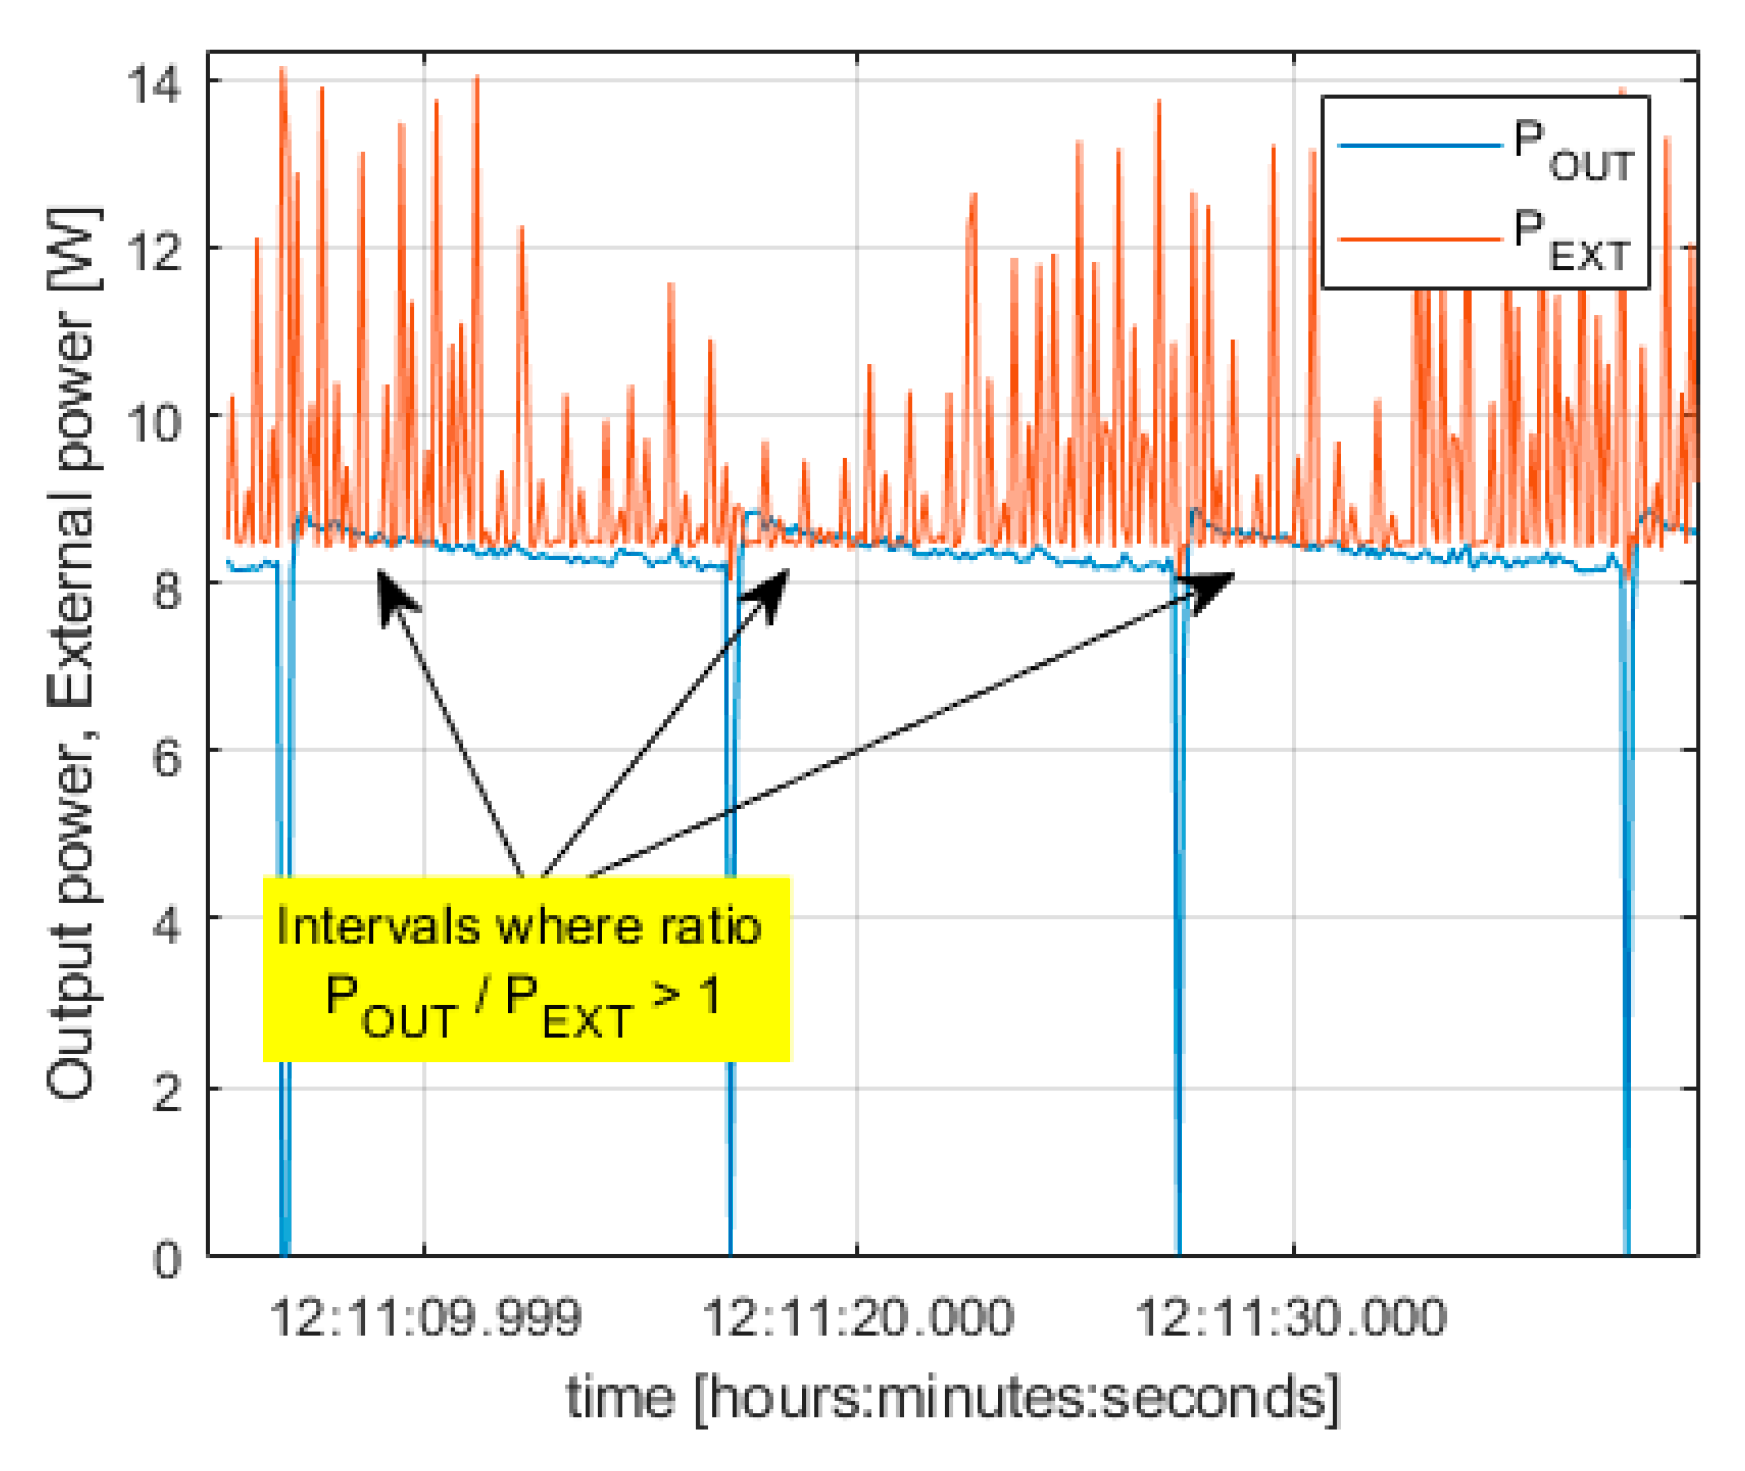
The positive energetic balance of the PEMFC controller occurs, when the PEMFC controller creates power POUT (from hydrogen) that is greater than the electric power PEXT that is necessary for its operation (POUT > PEXT). This situation can be seen for ILOAD ≥ 700 mA (in the first row of Table 3). Details of the measurement where this situation was observed are provided in Figure 21.

Figure 21.
PEMFC duty cycles where POUT > PEXT occurs for ILOAD ≥ 700 mA.
The other reason why the positive balance (POUT > PEXT) occurs is the decreasing power consumption of the PEMFC controller PEXT (when POUT is approximately constant). This statement is valid when the load currents are greater (in our case 700 mA).
As shown in Table 3 (second row), the efficiency of SZBK07 is relatively high, and for currents over 700 mA, it reaches 94%.
Figure 20 and Table 3 (third row) evaluate the efficiency of the PEMFC controller , that is, the power ratio, according to (14). As mentioned earlier, the positive balance occurs for load currents greater than 700 mA. In other words, the PEMFC controller can pass approximately 100% of power POUT (created by FC stack) to SZBK07 under the condition that the PEMFC controller itself is supplied with at least 8.8 W (see Figure 9).
According to the previously mentioned design and experiments, the PEMFC power supply for small UGVs (or mobile applications) was created. The system is ready for its integration into a small UGV and can provide 12 V/0.7 A for a combined battery/PEMFC-powered UGV system. The microcontroller monitoring system communicates with INA226 power monitors, and data are collected with a sampling frequency of more than 10 Hz and transferred to a mobile device through the Bluetooth module.
5. Discussion
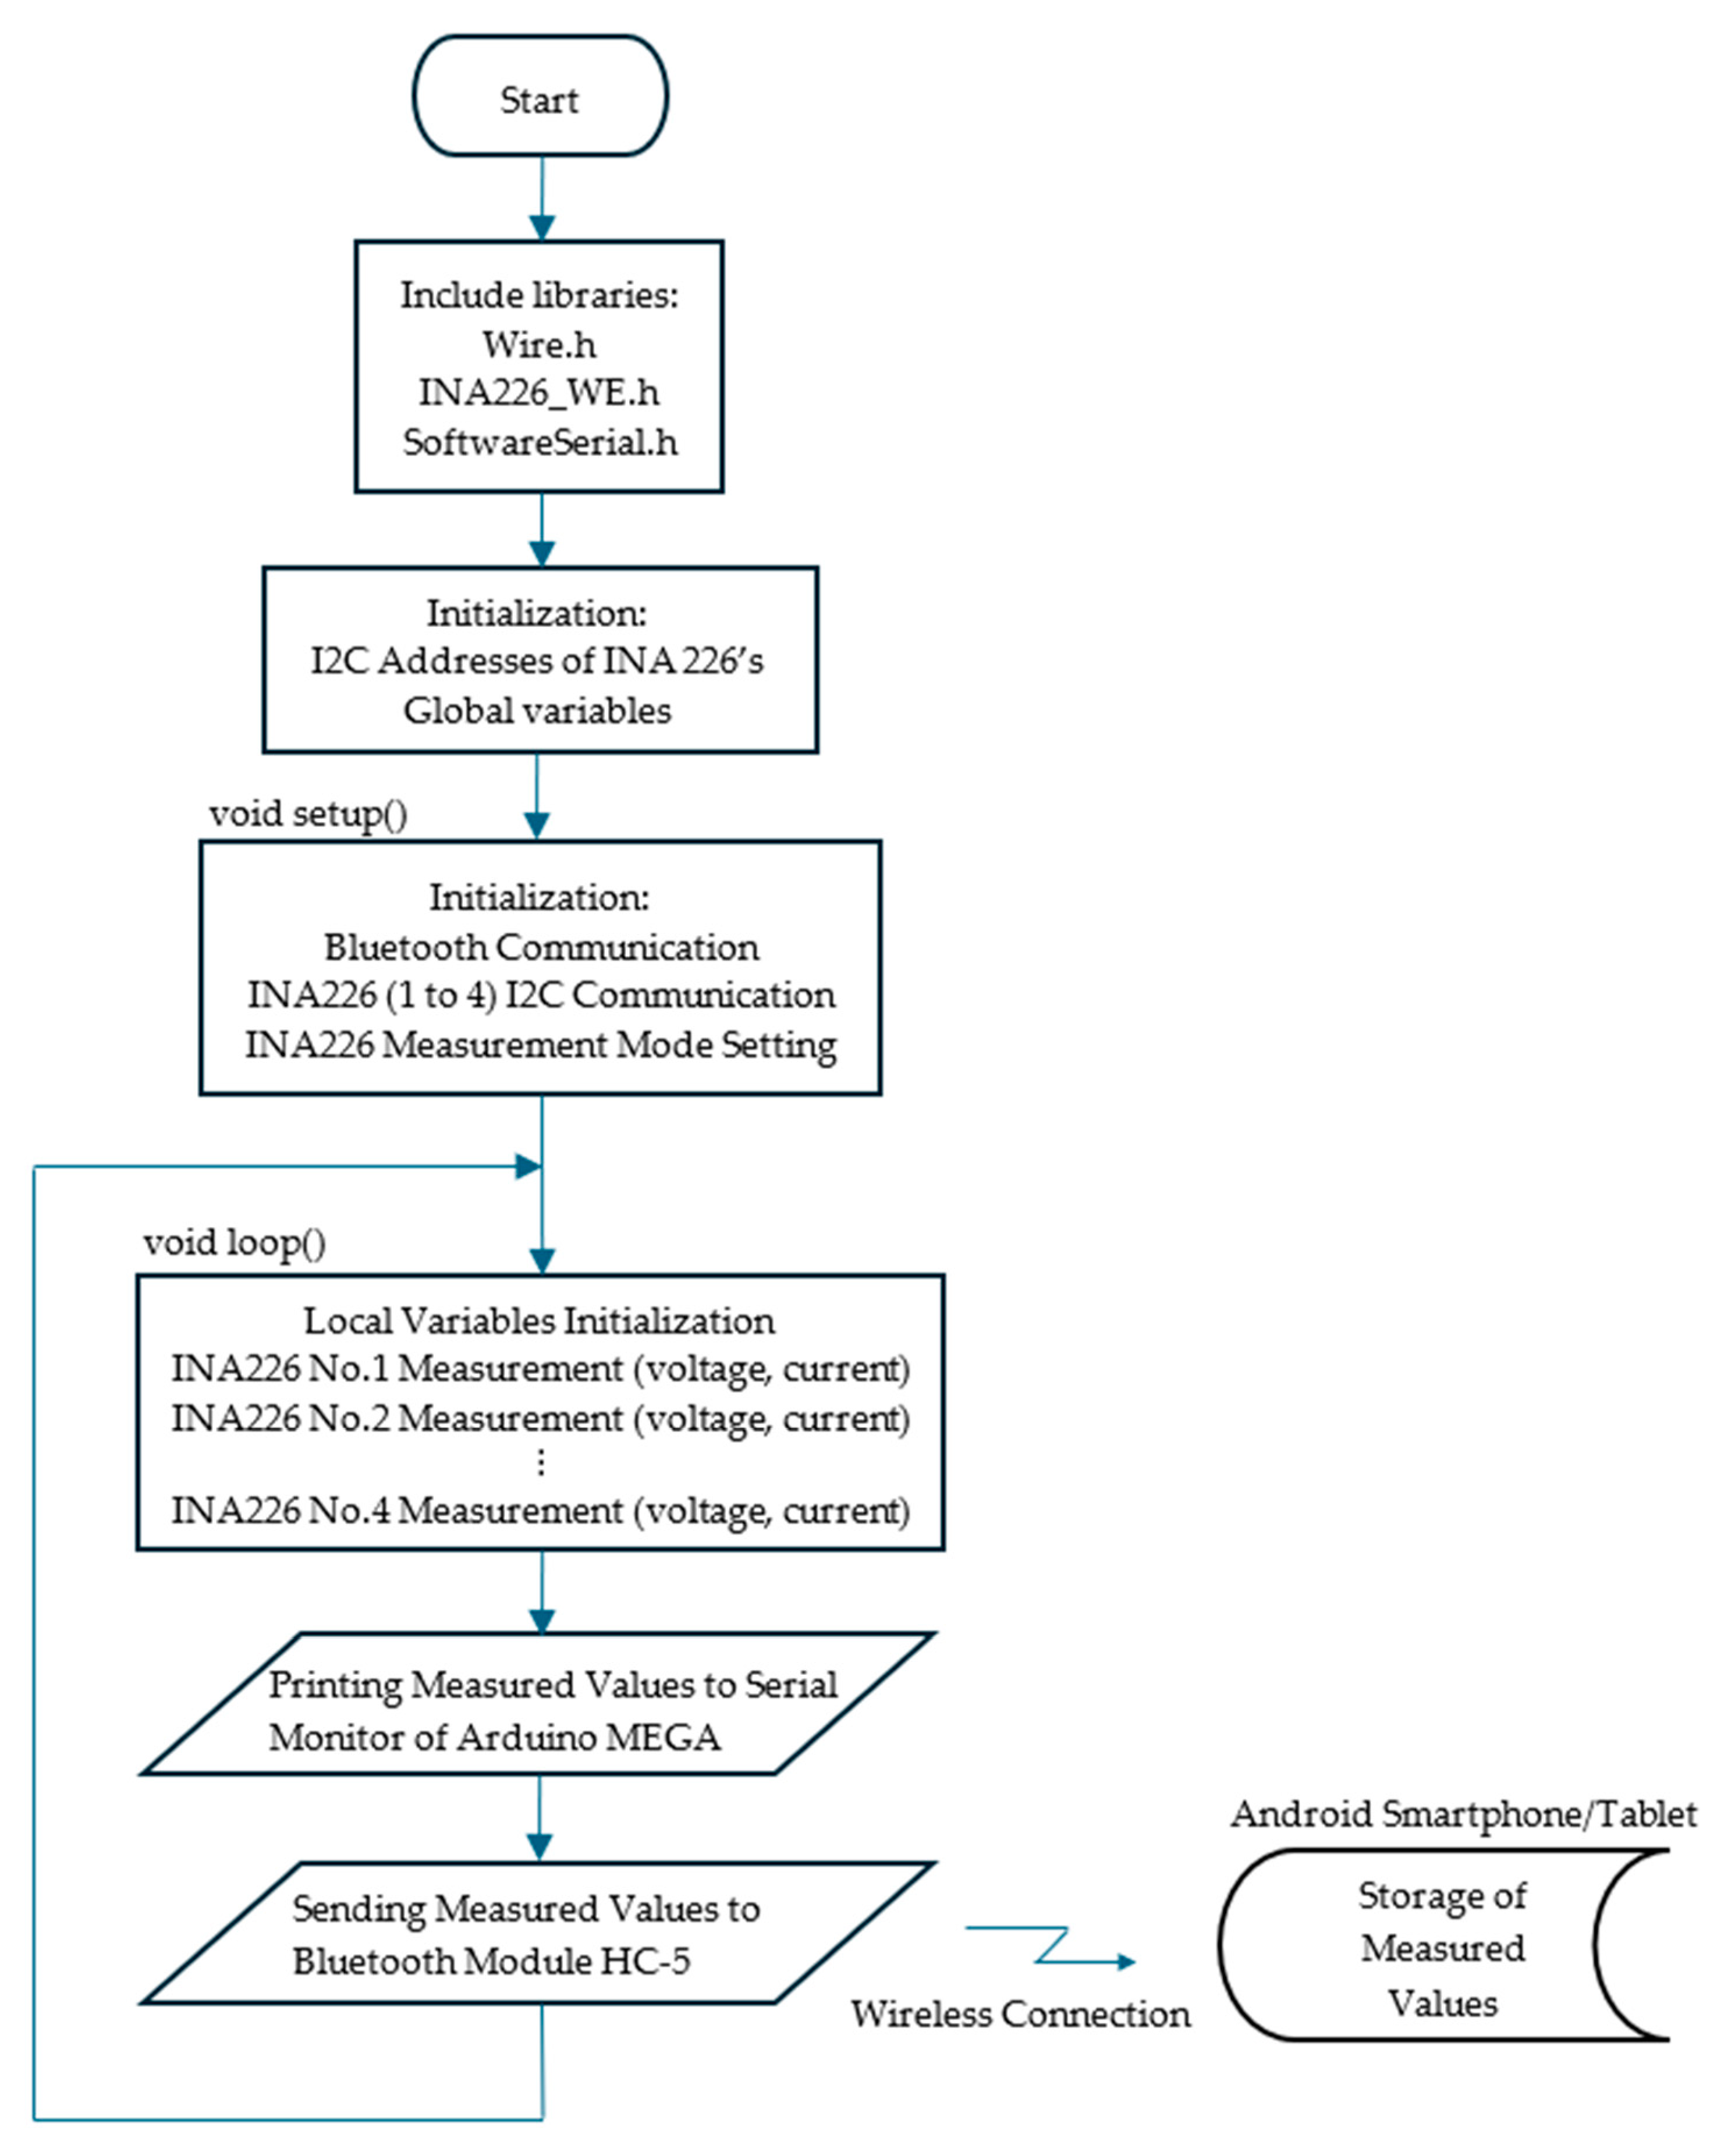
This section deals with more information related to the measurement script used in the monitoring system based on the Arduino MEGA platform. The measurement script created in Arduino IDE (Integrated Development Environment) consists of the first script part in Figure 22, where libraries are included [25]. Libraries were used for serial communication with Arduino MEGA 2560, library for Bluetooth communication, and library for power monitors INA226.
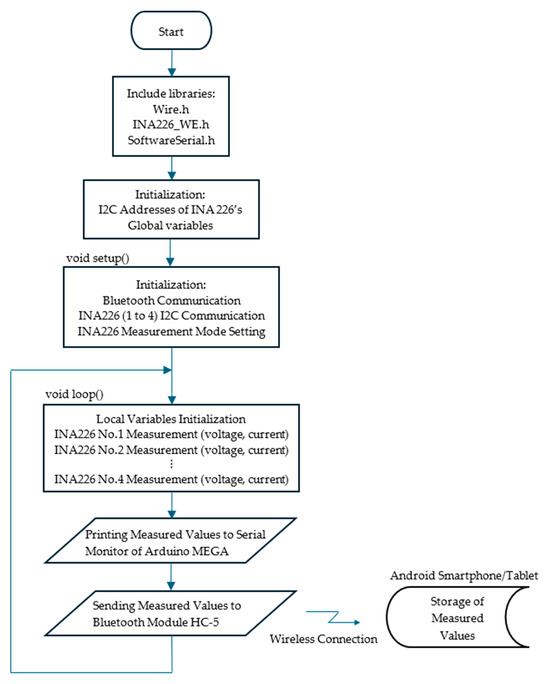
Figure 22.
The flowchart of the Arduino MEGA 2560 Rev3 with Bluetooth module HC-05 operation.
The second step was the definition and initialization of I/O ports and global variables, which are used and visible for all mentioned functions, as in [25]. I2C addresses of INA226 power monitors had to be defined there according to [20], too.
A one-time running function called setup() was used for the initialization of serial communication between Arduino IDE—Arduino MEGA 2560, between Arduino MEGA 2560—Bluetooth and between Arduino MEGA 2560–INA226 power monitors.
We used default settings for all INA226 power monitors, where one measured value (of voltage, current or power) was used for averaging each overall measurement (one-sample measurements). The conversion time in this mode was 1.1 milliseconds. We used a continuous measurement mode for all measurements realized in loop() function.
The loop() function starts with a function called micros(). First, it is used for time measurements at the start of the loop function. The second time is micros() at the end of the loop(). The difference between these times represents the loop period TLOOP in microseconds, and from periods TLOOP, we were able to compute the sampling frequency fLOOP = 1/(TLOOP∙10−6) in Hz.
Measurements from each individual INA226 power monitor were realized, and actual values were transmitted via the UART/serial communication link to Arduino IDE. The same data from each INA226 monitor were transmitted via Bluetooth to a smartphone for data storage.
The first Arduino-based monitoring system sampling frequency value was relatively low, lower than approximately 0.5 Hz. For this reason, several changes had to be made. All unnecessary delays were removed.
Some text descriptions of variables and their volume of transmission through the Arduino IDE were reduced. Based on these corrections, the sampling frequency was increased to more than 10 Hz despite communicating with multiple I2C, UART devices and double data transmission. As a possible future research direction, the authors see increasing the frequency of the Arduino-based monitoring system as well as the integration of PEMFC power supply systems into applications, as mentioned in [26,27,28].
The architecture of the monitoring system with the Arduino MEGA platform can also be created using 8-bit or 32-bit STM32 controller platforms, where the manufacturer (ST) offers a set of microprocessors to solve various application tasks. These are also intended for general usage, for signal processing, for the usage of machine learning (ML) or security applications.
The practical issue of creating new architecture for a monitoring system is associated with other questions, such as what development environment the platform manufacturer provides for developers, the number and types of interfaces the development platform has available, the connectivity of the platform and wireless technologies, the compatibility of the platform and expansion modules from other manufacturers, and others. In case we would like to take advantage of the Arduino platforms with which we have broader experience, the simplicity of designs and the compatibility of existing modules, it is possible to lean towards 32-bit variants, for example, Arduino UNO R4 or Arduino DUE (with several UARTs).
The proposed script used in the Arduino MEGA platform is not available as an open-source code in the FC community, yet. The final data analysis (efficiencies computing, etc.) was performed in the MATLAB R2022b (Update 10) program environment.
The proposed monitoring system is expandable for large fuel cell stacks thanks to the large number of I2C-connected power monitors, thanks to the high connectivity options of the Arduino MEGA platform. In addition, 54 input and output (I/O) digital pins and 16 analogue pins could be used for the temperature, vibration or concentration of leaked hydrogen sensing functions, etc. The proposed PEMFC monitoring system can also be used in other renewable sources of electricity generation, for example, in hydro or wind turbines. The advantages of embedded systems include their functional reconfiguration and the composition of the monitoring system based on multiple external interrupt-controlled embedded platforms.
The primary limitation of the overall PEMFC power supply system is the necessity of an external power supply capable of supplying a voltage of 13 V and current of more than 0.6 A for the needs of the PEMFC controller FC H60. An interesting finding of the experiments is that the FC controller’s consumption (IEXT) decreases with increasing values of the generated current (ILOAD) flowing through the load. Therefore, it can be expected that in the case of generating the maximum nominal current ICELL ≈ IOUT ≈ ILOAD ≈ 5 A, the ratio between the current produced by the PEMFC ICELL and the current IEXT consumed by the PEMFC controller will be significantly higher.
The primary limitation of the proposed PEMFC monitoring system is given by choosing a suitable embedded system, Atmega2560. From this point of view, the monitoring system is limited by the number of UART interfaces of the Atmega 2560 platform (4 UARTs), which can be used for Bluetooth communication. Its next (Atmega 2560) limitation is the number of I2C interfaces, where a finite number (128) of I2C-connectable devices can be connected. When the number of used I2C devices (INA226) increases, the frequency of monitoring functions will decrease rapidly. The Arduino MEGA 2560 platform is usable over a wide operating temperature range, from 233 K to 358 K.
The next limitation is represented by the chosen power monitor type INA226 and its basic characteristics, as previously mentioned (1 LSB resolution is for shunt voltage 2.5 μV, bus voltage 1.25 mV). INA226 is equipped with a 16-bit native ADC with a minimal (one) conversion time of 150 microseconds. When using averaging options for consecutive measurements with INA226, the conversion time increases up to 9 milliseconds. INA226 is capable of sensing PEMFC voltages up to 36 V (in hight-side/low-side sensing configuration). INA226 is usable over a wide operating temperature range, from 233 K to 398 K, with a current consumption of less than 0.5 milliamperes.
The Bluetooth module HC-05 limitation is given by its basic characteristics: Bluetooth version V2.0 + EDR, 3 Mbps, 2.4 GHz, transmit power is +4 dBm default baudrate/configuration 9600/38,400 8N1, range up to 100 m, receiver sensitivity −80 dBm, communication voltage level 3.3 V.
During experiments, the communication distance between the HC-05 and the Xiaomi Redmi 12 smartphone was more than 100 m (in the building environment and direct radio sight); however, the maximum distance for wireless communication was not exactly determined in our experiments. The HC-05 module requires an operating current of at least 30 mA.
The estimated cost of the proposed system is approximately EUR 80, but we expect that future tests associated with the integration of the monitoring system will also require additional costs.
Compared to embedded systems and their software development environments, we can state that the cost of Arduino platform solutions is several-times cheaper than solutions using embedded systems from other manufacturers (STMicroelectronics, Analog Devices or NXP Semiconductor). Of course, a cost-effective solution also brings the necessity of compromises regarding the selected technical parameters of cheaper variants of embedded system development platforms.
It is difficult to compare the price of our designed monitoring system with its own functionalities for small UGVs with other monitoring systems that could have different features. We have not found any identical or similar monitoring system for a comparison with our proposed monitoring system.
6. Conclusions
As the demand for clean and sustainable energy solutions continues to grow, fuel cells appear to be a promising technology that leverage chemical reactions to provide a reliable source of electricity. These systems can play a pivotal role in the transition towards greener energy systems. Compared to other technologies, the PEMFC provides several advantages, which are a relatively environmentally friendly source of electricity generation using hydrogen and oxygen as fuel. FC systems are characterized by their high energy efficiency and high-power density, which have dramatically improved in recent years.
The disadvantages of FC systems are the cost of this technology, fuel hydrogen gas is not widely available, and it is difficult to store hydrogen. Other applicable fuels, for example, gasoline, methanol, formic acid, must be reformed before they are used in FCs.
FC systems have specific operation limitations and specifics, connected with the operation conditions. These include external environmental influences (temperature, pressure, vibrations, air pollution, etc.). This usage relates to pressure and fuel purity, FC humidity and specific safety regulations. Because we used hydrogen as fuel, specific FC design materials had to be used.
In this study, we summarized basic information about PEM fuel cells’ principle and the division of FC technologies based on the operating temperature and electrolyte type. In the Introduction, we defined necessary terminology connected with our experiments. The most important parameter for power supplies is efficiency (η), which can be simply defined as the ratio of overall output to input power of the power supply system [4,5].
The main contribution of the experiments is the analysis of PEMFC power supply operation. We created a block scheme of the PEMFC power supply system for UGV application, where measuring points were defined. Individual quantities (voltage, current) in these points were measured by INA226 circuits. The monitoring system design was based on the Arduino MEGA 2560 platform. Wireless connection with a smartphone (portable PC) was realized through a Bluetooth module (and proper application) to store data.
According to the data received from power monitors INA226 by the smartphone, corresponding efficiencies were computed. Based on measurement by INA226 sensors, the PEMFC duty cycle and its parameters were measured, stored, and analysed, and their waveforms were displayed.
The experimental results help to evaluate the working cycle of H60. It was time invariant, and the load value had no influence on it. Output PEMFC power supply voltages, currents and powers changed according to load changes. The PEMFC power supply system was initialized from long-term storage to operation, tested for created voltage values from 12 V up to 0.7 A currents to load.
At the end of the experimental analysis, we can state that the PEMFC monitoring system was fully operational, and, according to its data, individual efficiencies were computed.
The PEMFC controller has efficiency values in a range of 12–103%, when we compared the ratio of output power to external power (POUT/PEXT). The efficiency values of the switching power supply SZBK07 changed in the range of 69% up to 94%. Efficiency values represent a power ratio (POUT/PCELL) that reaches, in our case, up to 100%. The PEMFC controller is supplied by a necessary external power supply (more than 8.8 W continuous or 17 W peak value PEXT).
Experiments state that IEXT = 5 A for the FC controller supply is not necessary. Only 0.6 A (or 1.2 A–peak values) was recorded. The producers’ information was not precisely mentioned in the datasheet [18].
Current FC investigation methods provide a picture of efficiency and monitoring from the perspective of electrochemical processes in relation to new FC technologies. In our study, we offer a more detailed picture of the electrical efficiency of a complex FC system. This view is not often available for end users.
The environmental impact of the proposed system can be assessed in terms of the energy required to produce hydrogen using the Hydrofill Pro station from the manufacturer of PEMFC H60 (by Horizon Fuel Cell Technologies, Shanghai, China). This filling station requires a power supply of 10–19 V and power up to 23 W. The filling speed is approximately 3 litres of hydrogen per hour, with a consumption of deionized distilled water of 20 mL/h. The hydrogen purity was 99.99%.
During the 23 min experiments, 19.3 L of hydrogen was used (not counting the hydrogen used for the initial restart of the cell). At a hydrogen tank filling rate of 3 L/h, the required filling time would be 6.4 h. The energy consumed for the filling equipment would be approximately 148 W·h. Another 8 W or more was required from an external power source for the needs of the manufacturer’s H-60 PEMFC controller. This value corresponds to 3.1 W·h.
The power consumption of the Arduino MEGA 2560 platform depends on the selected supply voltage, the number and load status of the I/O pins, but it does not exceed 0.5 A (built-in protection function). At a supply voltage of 12 Volts for the Atmega 2560 and current of half an ampere, the energy expended will be equal to 6.4 W∙h.
The total energy consumption during our experiment was approximately 162.4 W·h. From this energy value, 91% of the energy was consumed by hydrogen production. Each Watt per second represents one Joule.
The IPCC (Intergovernmental Panel on Climate Change)-designated carbon emission factor, as in [29], is used to calculate the equivalent carbon emissions. CO2 emissions from water electrolysis-based hydrogen production powered by grid power, wind energy, and solar energy are 39.74 kg, 2.04 kg, and 0.68 kg CO2-eq, respectively. Because 1 kg hydrogen is 14.13 L, we used 1.37 kg for our experiments, which corresponds to 54.3 kg CO2 for the filling system supplied from the public electricity grid.
A comparison of the proposed system with traditional power supply systems can be found in our previous research [30], where different voltage regulators were evaluated from the point of view of their efficiencies. There, one can find that the traditional continuous (LDO) regulator efficiency is in intervals 30–50%, but the switching regulators’ efficiency can reach up to 94–98%.
Further research in this area will focus on integrating the PEMFC power supply with a monitoring system into the small UGV. We plan to focus on dynamic measurements in the interiors and exteriors. We will prepare the measurement where the electric load will change due to UGV dynamic movement. These experiments did not include the effects of connecting inductive, capacitive or mixed loads, which, in UGVs, are represented by the electric motors used or the onboard battery. The effect of the load also represents an area for further research. New experiments on the combined battery/PEMFC onboard power supply system will provide new research results, too.
The PEMFC can also be tested using the VT7004 temperature chamber located in our department, which, with its temperature range from 223 to 423 K, covers the entire operating range of the PEMFC H60. During these tests, it will be necessary to monitor the concentration of unconsumed hydrogen in the temperature chamber using gas measurement modules (for example, the MQ-2, MQ-7 series or others). Many similar modules are compatible with the Arduino MEGA 2560 platform.
The manufacturer’s PEMFC controller (HFCT) and monitoring system in our study were not equipped with a hydrogen concentration sensor. Safety during operation was ensured by sufficient ventilation.
The integration of the PEMFC monitoring system with other onboard systems is possible. However, its complexity will also depend on the functionalities of the PEMFC controller (HFCT), which controls the operation and monitors key parameters of the H60, as shown in Figure 3. Depending on the available documentation from the HFCT manufacturer, the monitoring system would be able to monitor the operation of the PEMFC controller and simultaneously monitor the power ratios at its input, output, and onboard power supply of UGVs.
The possibility of intervening in HFCT controller software (ECO-Marathon Serial Port Monitor, version 1.0) is also the key to expanding the functionality of the monitoring system. If necessary, a GPS module (e.g., NEO-6M), which is compatible with most Arduino development platforms, can be integrated into the monitoring system.
In the future, the monitoring system will be supplemented according to the requirements of the sensors integrated into small UGVs. This will also require intervention in the measurement cycle controlled via Arduino MEGA 2560 according to the requirements, depending on the application and devices located in small UGVs.
Author Contributions
Conceptualization, M.M., M.Š., V.P., E.P. and M.B.; methodology, M.M.; software, M.M. and M.Š.; validation, M.M., M.Š. and M.B., formal analysis, M.M. and M.Š.; investigation, M.M.; resources, M.M. and M.Š.; writing—original draft preparation, M.M. and M.Š.; writing—review and editing, M.M. and M.Š. All authors have read and agreed to the published version of the manuscript.
Funding
This research received no external funding.
Data Availability Statement
We can share measured data for education and research purposes according to email requests.
Conflicts of Interest
The authors declare no conflicts of interest.
References
- Lipman, T.E.; Weber, A.Z. Fuel Cells and Hydrogen Production: A Volume in the Encyclopedia of Sustainability Science and Technology, 2nd ed.; Encyclopedia of sustainability science and technology series; Springer: New York, NY, USA, 2019; ISBN 978-1-4939-7788-8. [Google Scholar]
- Ferencey, V. Sources and Reservoirs of Electrical Energy for Mobile Means (sk. Zdroje a Zásobníky Elektrickej Energie pre Mobilné Prostriedky), 1st ed.; STU Bratislava: Bratislava, Slovakia, 2016; ISBN 978-80-89597-51-2. [Google Scholar]
- Sivasankar, V.; Mylsamy, P.; Omine, K. Microbial Fuel Cell Technology for Bioelectricity; Springer Science+Business Media: New York, NY, USA, 2018; ISBN 978-3-319-92903-3. [Google Scholar]
- O’Hayre, R.P.; Cha, S.-W.; Colella, W.G.; Prinz, F.B. Fuel Cell Fundamentals, 3rd ed.; John Wiley & Sons Inc.: Hoboken, NJ, USA, 2016; ISBN 978-1-119-11415-4. [Google Scholar]
- Albarbar, A.; Alrweq, M. Proton Exchange Membrane Fuel Cells: Design, Modelling and Performance Assessment Techniques; Springer: Cham, Switzerland, 2018; ISBN 978-3-319-70726-6. [Google Scholar]
- Carrette, L.; Friedrich, K.A.; Stimming, U. Fuel Cells-Fundamentals and Applications. Fuel Cells 2001, 1, 5–39. [Google Scholar] [CrossRef]
- Shekhawat, D.; Spivey, J.J.; Berry, D.A. (Eds.) Fuel Cells: Technologies for Fuel Processing; Elsevier: Amsterdam, The Netherlands; Boston, MA, USA, 2011; ISBN 978-0-444-53563-4. [Google Scholar]
- Sazali, N.; Wan Salleh, W.N.; Jamaludin, A.S.; Mhd Razali, M.N. New Perspectives on Fuel Cell Technology: A Brief Review. Membranes 2020, 10, 99. [Google Scholar] [CrossRef] [PubMed]
- Sajid, A.; Pervaiz, E.; Ali, H.; Noor, T.; Baig, M.M. A Perspective on Development of Fuel Cell Materials: Electrodes and Electrolyte. Int. J. Energy Res. 2022, 46, 6953–6988. [Google Scholar] [CrossRef]
- Adzic, R.; Marinkovic, N. Electrochemical Energy Conversion in Fuel Cells. In Platinum Monolayer Electrocatalysts; Springer International Publishing: Cham, Switzerland, 2020; pp. 19–25. ISBN 978-3-030-49565-7. [Google Scholar]
- Perrin, E.; Heitzmann, M.; Celle, C. Role of Carbon Support Structure on PEMFC Durability. Meet. Abstr. 2024, MA2024-02, 2631. [Google Scholar] [CrossRef]
- Morgan, D. Application of Embedded Systems for Microbial Fuel Cell Management. 2024. Available online: https://www.researchgate.net/publication/384487812_Application_of_embedded_systems_for_microbial_fuel_cell_management (accessed on 21 April 2025).
- Dijoux, E.; Steiner, N.Y.; Benne, M.; Péra, M.-C.; Grondin-Perez, B. Experimental Validation of an Active Fault Tolerant Control Strategy Applied to a Proton Exchange Membrane Fuel Cell. Electrochem 2022, 3, 633–652. [Google Scholar] [CrossRef]
- Bouaicha, A.; Trabelsi, A.; Allagui, H.; Mami, A.; Aglzim, E.-H.; Rouane, A. Study and Design of a Controlled Oscillator for an Embedded System to Measure the Complex Impedance of PEM Fuel Cell. In Proceedings of the 2017 18th International Conference on Sciences and Techniques of Automatic Control and Computer Engineering (STA), Monastir, Tunisia, 21–23 December 2017; IEEE: Piscataway, NJ, USA, 2017; pp. 173–178. [Google Scholar]
- Inamuddin; Mohammad, A.; Asiri, A.M. Organic-Inorganic Composite Polymer Electrolyte Membranes: Preparation, Properties, and Fuel Cell Applications; Springer: Cham, Switzerland, 2017; ISBN 978-3-319-52739-0. [Google Scholar]
- Yuan, X.-Z.; Song, C.; Wang, H.; Zhang, J. Electrochemical Impedance Spectroscopy in PEM Fuel Cells: Fundamentals and Applications; Springer: London, UK, 2010; ISBN 978-1-84882-845-2. [Google Scholar]
- Barbir, F. Compendium of Hydrogen Energy; Woodhead publishing series in energy; Elsevier, Woodhead: Amsterdam, The Netherlands, 2015; ISBN 978-1-78242-363-8. [Google Scholar]
- Horizon Fuel Cell Technologies. H-60 Fuel Cell Stack User Manual. V1.1, H-60_UM_V1.1_EN, Updated April 2013. Available online: https://www.horizoneducational.com/h-60-pem-fuel-cell-60w/p1466 (accessed on 19 February 2025).
- Arduino.cc, Arduino Mega 2560 Rev3. Available online: https://store.arduino.cc/en-sk/products/arduino-mega-2560-rev3 (accessed on 19 February 2025).
- Texas Instruments. INA226 High-Side or Low-Side Measurement, Bi-Directional Current and Power Monitor with I2C Compatible Interface. Available online: https://www.ti.com/lit/ds/symlink/ina226.pdf?ts=1739252193073&ref_url=https%253A%252F%252Fwww.google.se%252F (accessed on 19 February 2025).
- Shenzhen SHSD Technology Co., Ltd. Bluetooth Modul HC-05. Data Sheet. Available online: https://img.gme.cz/files/eshop_data/eshop_data/10/774-003/dsh.774-003.1.pdf (accessed on 19 February 2025).
- Texas Instruments LM5116 Wide Range Synchronous Buck Controller. SNVS499I, 2/2007, REVISED 11/2023. Available online: https://www.ti.com/lit/ds/symlink/lm5116.pdf (accessed on 19 April 2024).
- Texas Instruments; Simmons, P. Application Report, Getting Started with Digital Power Monitors, SBOA511A. Available online: https://www.ti.com/lit/an/sboa511a/sboa511a.pdf?ts=1739277081885&ref_url=https%253A%252F%252Fwww.google.com%252F (accessed on 19 February 2025).
- Texas Instruments. An Engineer’s Guide to Current Sensing e-Book A Collection of Technical Content on Current Sensing Designs. SBOA561, 2016, revised 2021. Available online: https://www.ti.com/lit/eb/slyy154b/slyy154b.pdf (accessed on 19 April 2024).
- Matejček, M.; Šostronek, M. Arduino Programming in Examples; Armed Forces Academy of General Milan Rastislav Štefánik: Liptovský Mikuláš, Slovakia, 2023; ISBN 978-80-8040-649-3. [Google Scholar]
- Šmelko, M.; Kašper, P.; Blažek, J.; Hudák, J.; Mikita, I.; Lipovský, P.; Draganová, K.; Kán, V.; Kliment, T. From Košice to the Orbit. A Successful Story of Applied Magnetism. IEEE Trans. Magn. 2024; in print. [Google Scholar] [CrossRef]
- Starý, V.; Křivánek, V. Integrating Mechatronics Principles in Modern Air Defence Systems. In Proceedings of the 2024 21st International Conference on Mechatronics-Mechatronika (ME), Brno, Czech Republic, 4–6 December 2024; IEEE: Piscataway, NJ, USA, 2024; pp. 1–6. [Google Scholar]
- Ehsani, M.; Gao, Y.; Emadi, A. Modern Electric, Hybrid Electric, and Fuel Cell Vehicles: Fundamentals, Theory, and Design, 2nd ed.; Power electronics and applications series; CRC Press: Boca Raton, FL, USA, 2010; ISBN 978-1-4200-5398-2. [Google Scholar]
- Hu, T.; Song, Y.; Zhang, X.; Lin, S.; Liu, P.; Zheng, C.; Gao, X. A Mini Review for Hydrogen Production Routes toward Carbon Neutrality. Propul. Energy 2025, 1, 1. [Google Scholar] [CrossRef]
- Matejček, M.; Šostronek, M. Microcontroller Based Evaluation of Voltage Regulators Efficiency and Their Noise Performance Estimation by Fast Allan Variance Method. Electronics 2024, 13, 2144. [Google Scholar] [CrossRef]


Disclaimer/Publisher’s Note: The statements, opinions and data contained in all publications are solely those of the individual author(s) and contributor(s) and not of MDPI and/or the editor(s). MDPI and/or the editor(s) disclaim responsibility for any injury to people or property resulting from any ideas, methods, instructions or products referred to in the content. |
© 2025 by the authors. Licensee MDPI, Basel, Switzerland. This article is an open access article distributed under the terms and conditions of the Creative Commons Attribution (CC BY) license (https://creativecommons.org/licenses/by/4.0/).