1. Introduction
Synthetic Aperture Radar (SAR) [
1] is an active microwave imaging device capable of operating under all weather and lighting conditions, day and night, making it crucial for monitoring ship targets in both military and commercial sectors [
2]. Consequently, ship detection based on SAR imagery has become a focal point of research. Traditional methods for ship detection in SAR imagery primarily include the Constant False Alarm Rate (CFAR) algorithm [
3] and feature extraction-based algorithms [
4]. In nearshore areas, ship detection must contend with the dense arrangement of ships, as well as numerous man-made targets in terrestrial environments, such as buildings, whose characteristics are similar to those of ships, posing significant difficulties and challenges for precise target detection. Looking ahead, with the development of intelligent maritime surveillance systems, SAR-based nearshore ship target recognition technology will become an indispensable component thereof.
Remote sensing imagery is a key technological means of acquiring surface information through aerial or satellite platforms. It provides significant assistance to researchers in scientific research, but its drawbacks are becoming increasingly apparent. On one hand, remote sensing imagery has high requirements for photographic equipment; on the other hand, there is a scarcity of labeled raw image samples, which necessitates a substantial amount of manual time for annotation. Data augmentation, as an effective means to address the aforementioned issues, is widely applied by researchers [
5]. Depending on the principles of image generation, data augmentation can be divided into methods based on traditional image processing and methods based on neural networks. Data augmentation based on image processing mainly includes geometric transformation models [
6], noise perturbation models [
7], and photometric conversion models [
8]. Data augmentation based on neural networks primarily utilizes image information for data expansion, mainly divided into Variational Auto Encoding (VAE) models [
9] and Generative Adversarial Network (GAN) models [
10]. The research team from Southwest Jiaotong University [
11] constructed a position-aware conditional generative adversarial network (PCGAN) to generate high-quality and robust SAR ship imagery, thereby enhancing ship detection accuracy. This approach demonstrated the effectiveness of adversarial generation strategies in addressing data scarcity challenges, while highlighting the potential application of GANs in maritime target detection through synthetic SAR data augmentation.
In recent years, the rapid development of deep learning technology has led to its widespread application in the field of image recognition, achieving significant results. Many researchers have begun to apply deep learning technology to the task of SAR ship recognition [
12,
13]. Deep learning-based object detection is divided into two major categories: region proposal-based methods, such as the R-CNN [
14,
15,
16] series and regression-based methods such as SSD [
17], YOLO [
18,
19,
20,
21] series, and Retina Net [
22]. In deep learning technology, Convolutional Neural Networks (CNNs) [
23] can automatically extract features through hierarchical learning, making full use of image information, breaking the limitations of traditional methods, and demonstrating strong robustness in various complex environments. For example, a team from the Academy of Military Science [
24] proposed a feature reconstruction network combined with an attention mechanism for ship target detection. This method reduced noise interference caused by dense targets by introducing attentional rotation anchor boxes and enhanced the precision of features through a feature reconstruction module. A team from Nanjing Agricultural University [
25] applied CIoU-Loss and DIoU-NMS to the original model, reducing the interference of background information on target detection and improving the model’s detection performance in occlusion scenarios. These studies indicate that deep learning technology has great potential and application value in the field of ship recognition.
Attention mechanisms [
26], which have emerged as a core technology in recent years driven by advances in deep learning, have been widely applied in fields such as natural language processing, computer vision, speech recognition, and statistical learning. Inspired by human cognitive processes, these mechanisms abstract the biological concept of attention into machine learning, where their essence lies in intelligently allocating limited computational resources to prioritize critical information, akin to how humans “focus on the important and ignore the trivial”. In the domain of object detection, attention mechanisms enhance performance by dynamically allocating feature weights, enabling models to focus on key regions of an image, much like human vision. Typical applications include integrating channel attention modules into backbone networks to enhance target feature representation [
27] and incorporating cross-scale attention mechanisms into feature pyramids to improve small object detection [
28], among others. These approaches not only boost detection accuracy but also effectively address challenges such as occlusion and scale variations in complex scenarios.
This paper addresses the small-sample learning issue of SAR nearshore ship datasets characterized by a scarcity of samples and poor diversity. By employing a Concurrent Single-Image GAN (ConSinGAN), which includes the generator and discriminator network’s game theory and multi-scale feature extraction mechanisms, high-quality synthetic samples are generated to enhance data diversity and ensure the consistency of generated samples at different resolutions. This approach strengthens the anti-overfitting capability of the ship recognition model. To improve the detection performance of nearshore ship targets against complex backgrounds, structural improvements are made to the YOLOv7 model. The Squeeze-and-Excitation (SE) [
29] module is utilized, which leverages global information to enhance informative positive sample features while suppressing unimportant negative sample features. By integrating the SE module with the backbone network layer of the YOLOv7 model, the model’s feature extraction capability for nearshore ships is enhanced. Finally, through comparative experiments with various attention modules and the analysis of detection results for ship targets in SAR images under complex environments, the practicality and effectiveness of the proposed algorithm in detecting nearshore ship targets in complex backgrounds of SAR images are validated.
2. Related Work
2.1. Data Enhancement
The Generative Adversarial Network (GAN) was proposed by Goodfellow and colleagues in 2014 [
10]. A GAN consists of a generator network and a discriminator network; the generator combines original images with random noise to generate synthetic samples, aiming to produce images indistinguishable from real ones. The discriminator helps the generator optimize its generation capabilities by classifying real and generated images as true or fake. With the rapid development of deep learning, GAN has been widely applied in the field of data augmentation, leading to the derivation of various types of GAN models, such as Wasserstein GAN [
30], Progressive GAN [
31], and Conditional GAN [
32]. However, the aforementioned data augmentation methods are only applicable when there is an abundance of training samples and are not suitable for small-sample or single-sample data generation. Currently, only a few models can achieve training based on a single original image or perform transfer learning between small samples, among which Single-Image GAN (SinGAN) [
33] and Concurrent Single-Image GAN (ConSinGAN) [
34] are relatively outstanding performers. The team from Liaoning Technical University [
35] utilized the ConSinGAN model to generate images of varying resolutions through scale transformation, thereby increasing the volume of image data. The team from Central South University for Nationalities [
36] tackled the problem of limited image samples by enhancing images with the ConSinGAN model, thereby augmenting the training sample set and enhancing the stability of image detection tasks.
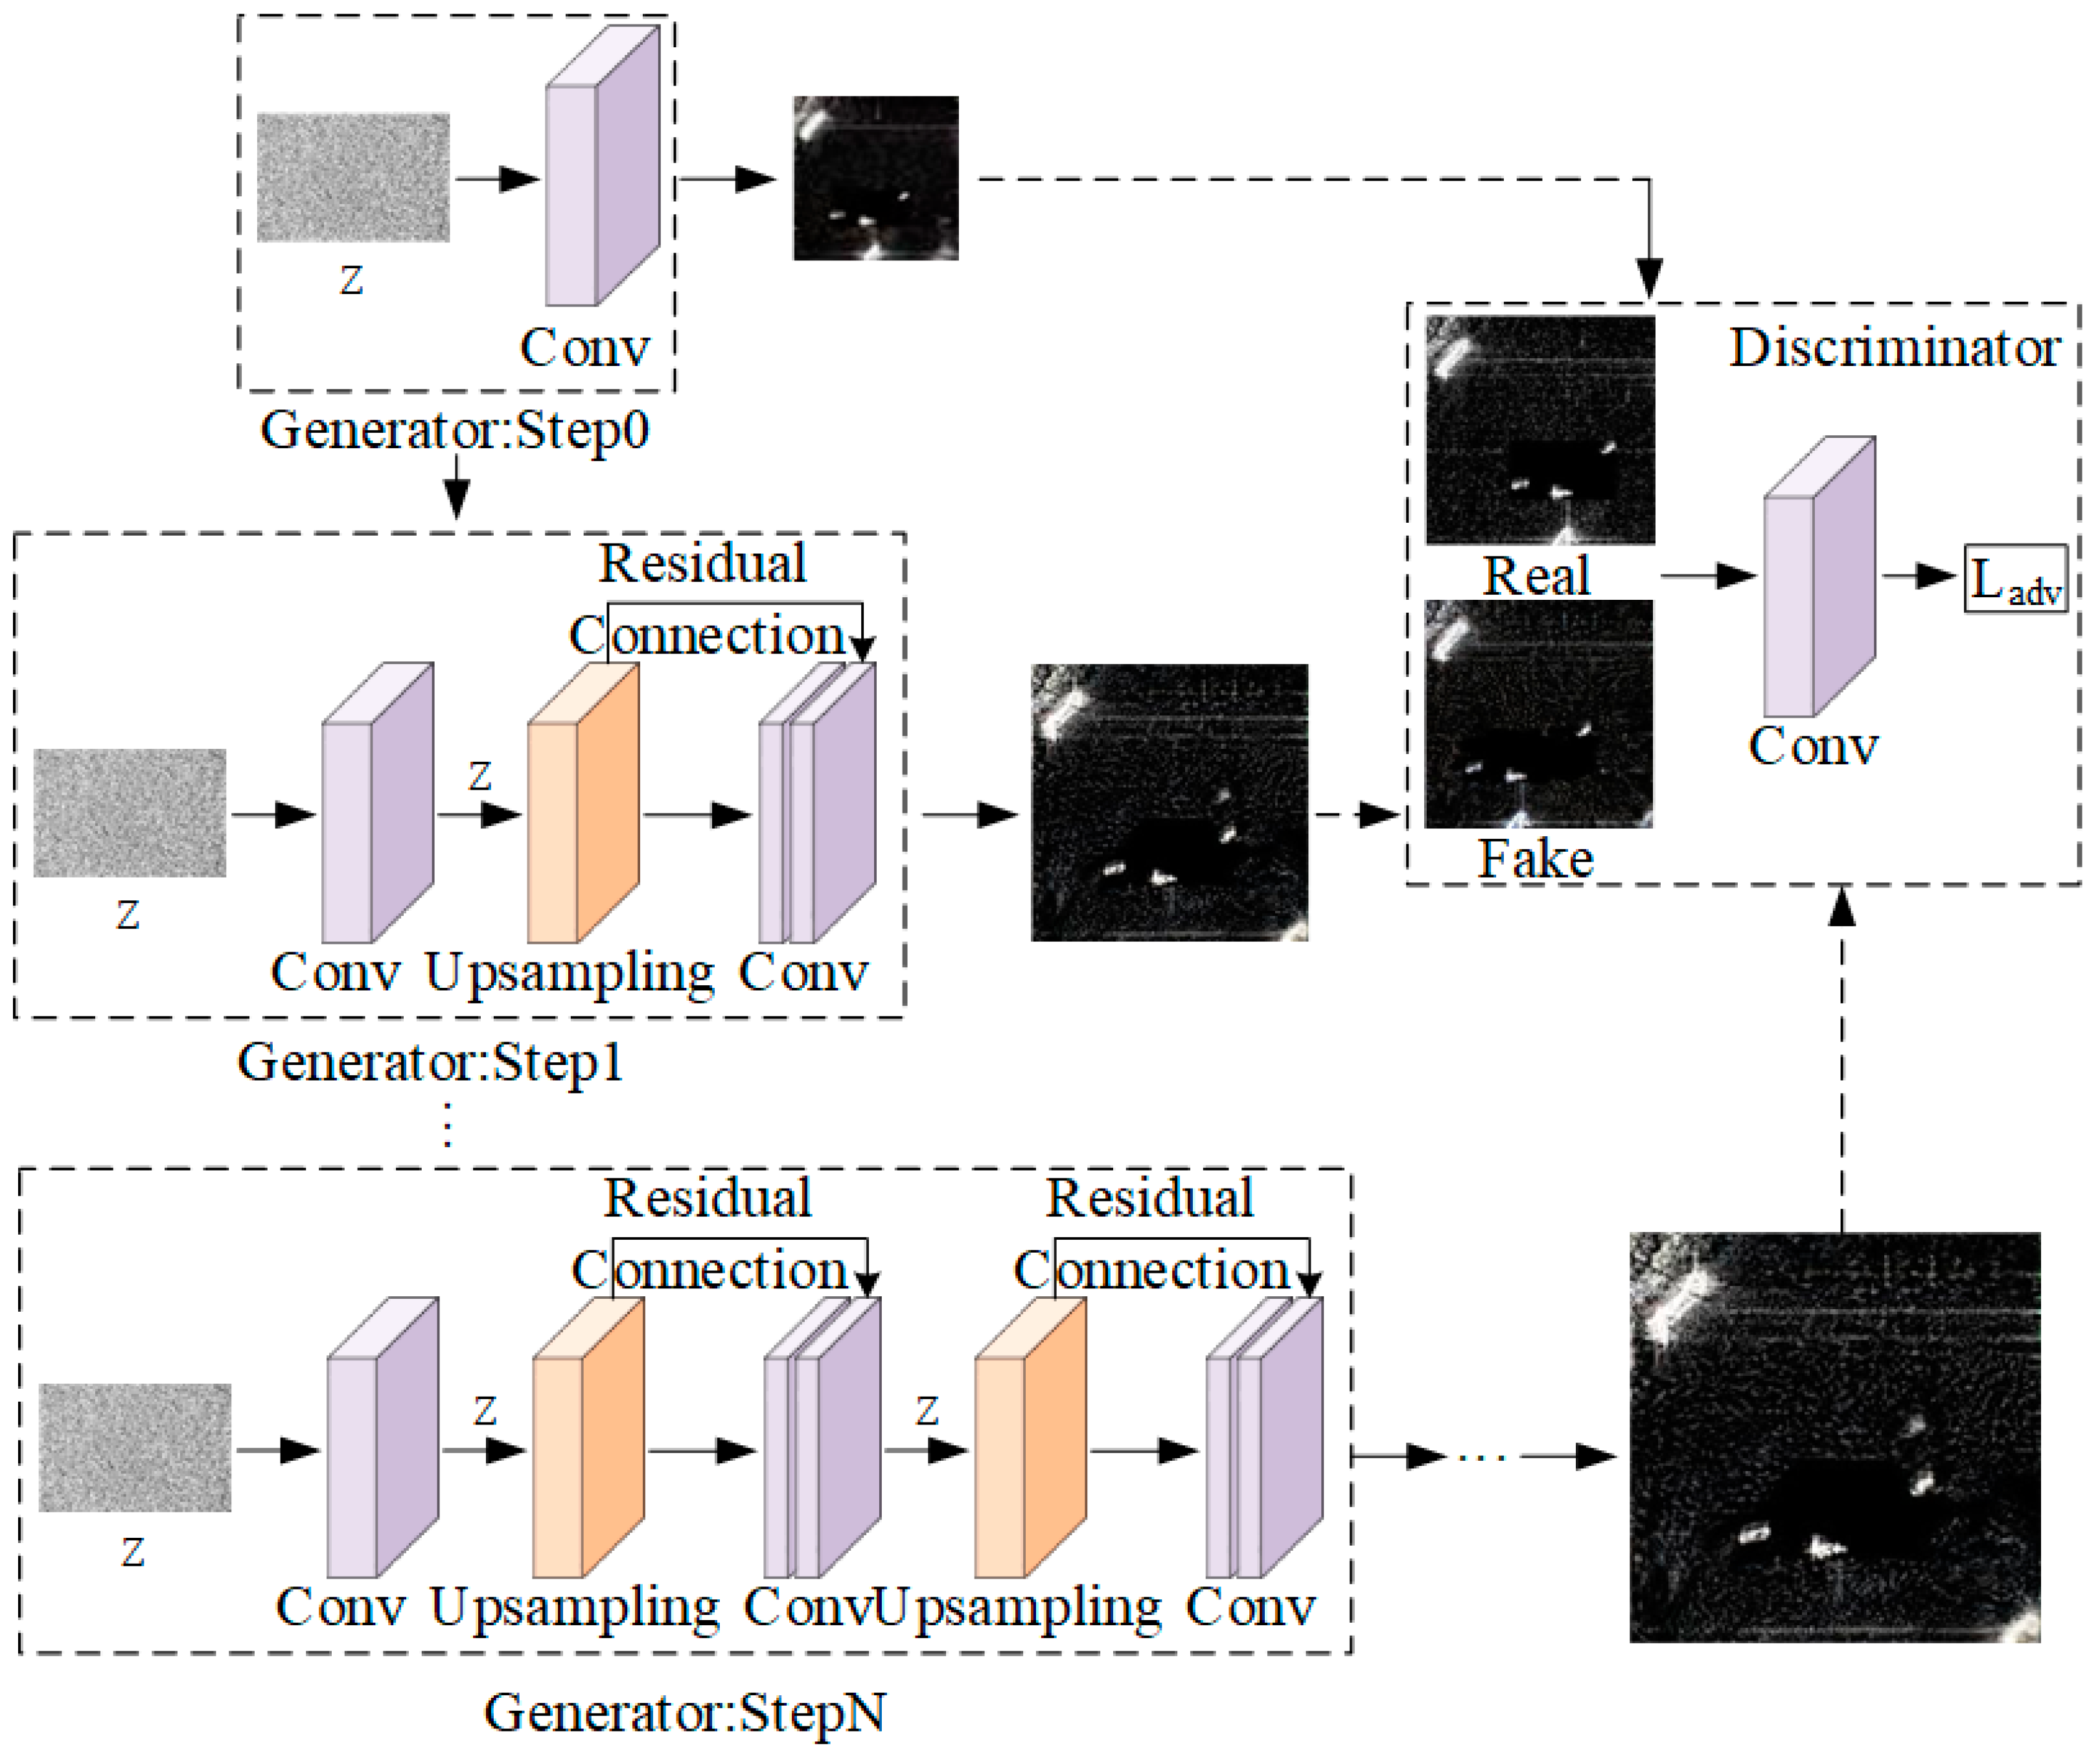
The ConSinGAN model takes a single real image as input and, during training, scales the image proportionally to serve as input for the discriminator, thereby supporting training across multiple iterative stages, which is why it is called the Concurrent Single-Image GAN (ConSinGAN). As shown in
Figure 1, the model consists of N proportionally scaled generators, each corresponding to a training stage.
The ConSinGAN features a multi-stage iterative training characteristic. To achieve end-to-end image generation, each stage of the ConSinGAN utilizes the raw features from the previous stage as input, distinct from conventional iterative generators that produce intermediate images. This design avoids the overfitting issues associated with using generated intermediate images as input for subsequent generators in conventional methods, which can lead to the model’s inability to generate GAN models with rich feature representations, thereby causing mode collapse.
In the later stages of training, the dimensions of the random noise vector increase as the training progresses, leading to a corresponding increase in the size of the generated images. Throughout this process, the size of the generated images remains consistent with the proportionally scaled single input image. Concurrently, as the image size increases, the model’s convolutional receptive field decreases, which is more conducive to extracting shallow-level image information. However, in each stage, the number of feature channels and the size of the feature maps remain constant, with only the image resolution changing.
For the discriminator, the parameter count remains the same at each stage. At any given stage n, the discriminator weights from the previous stage are employed. The optimization process aims to minimize the adversarial loss and the reconstruction loss, ensuring robust and accurate image generation:
employs WGAN-GP for adversarial loss, and the reconstruction loss is used to enhance training stability (α = 10 for all experiments). For the reconstruction loss, the generator
takes the downsampled version (
) of the original image (
) as input and reconstructs the image at stage n:
In each stage, the discriminator is trained identically, with both generated and authentic images as inputs, and is optimized to maximize the objective function
.
2.2. Object Detection Model
The currently popular detection algorithms are the NanoDet algorithm [
37] and DETR algorithm [
38]. Although the NanoDet algorithm has a fast computational speed, its detection accuracy is relatively low. Although DETR has the advantage of detection accuracy, it has a fast inference speed and a large amount of model computation. The YOLOv7 [
39] model not only maintains high detection accuracy and inference speed but also has a unique improvement in small object detection accuracy, which is more in line with the requirements of nearshore ship detection in our work. Although the performance indicators of subsequent algorithms based on YOLOv7 have been improved, YOLOv7 has unique advantages in algorithm improvement [
40]. Adding the same attention module has achieved better results in F1 score and confidence threshold compared to subsequent versions. Based on this, YOLOv7 model was used for research and algorithm improvement in this work.
YOLOv7 is a single-stage object detection algorithm developed based on YOLOv4 [
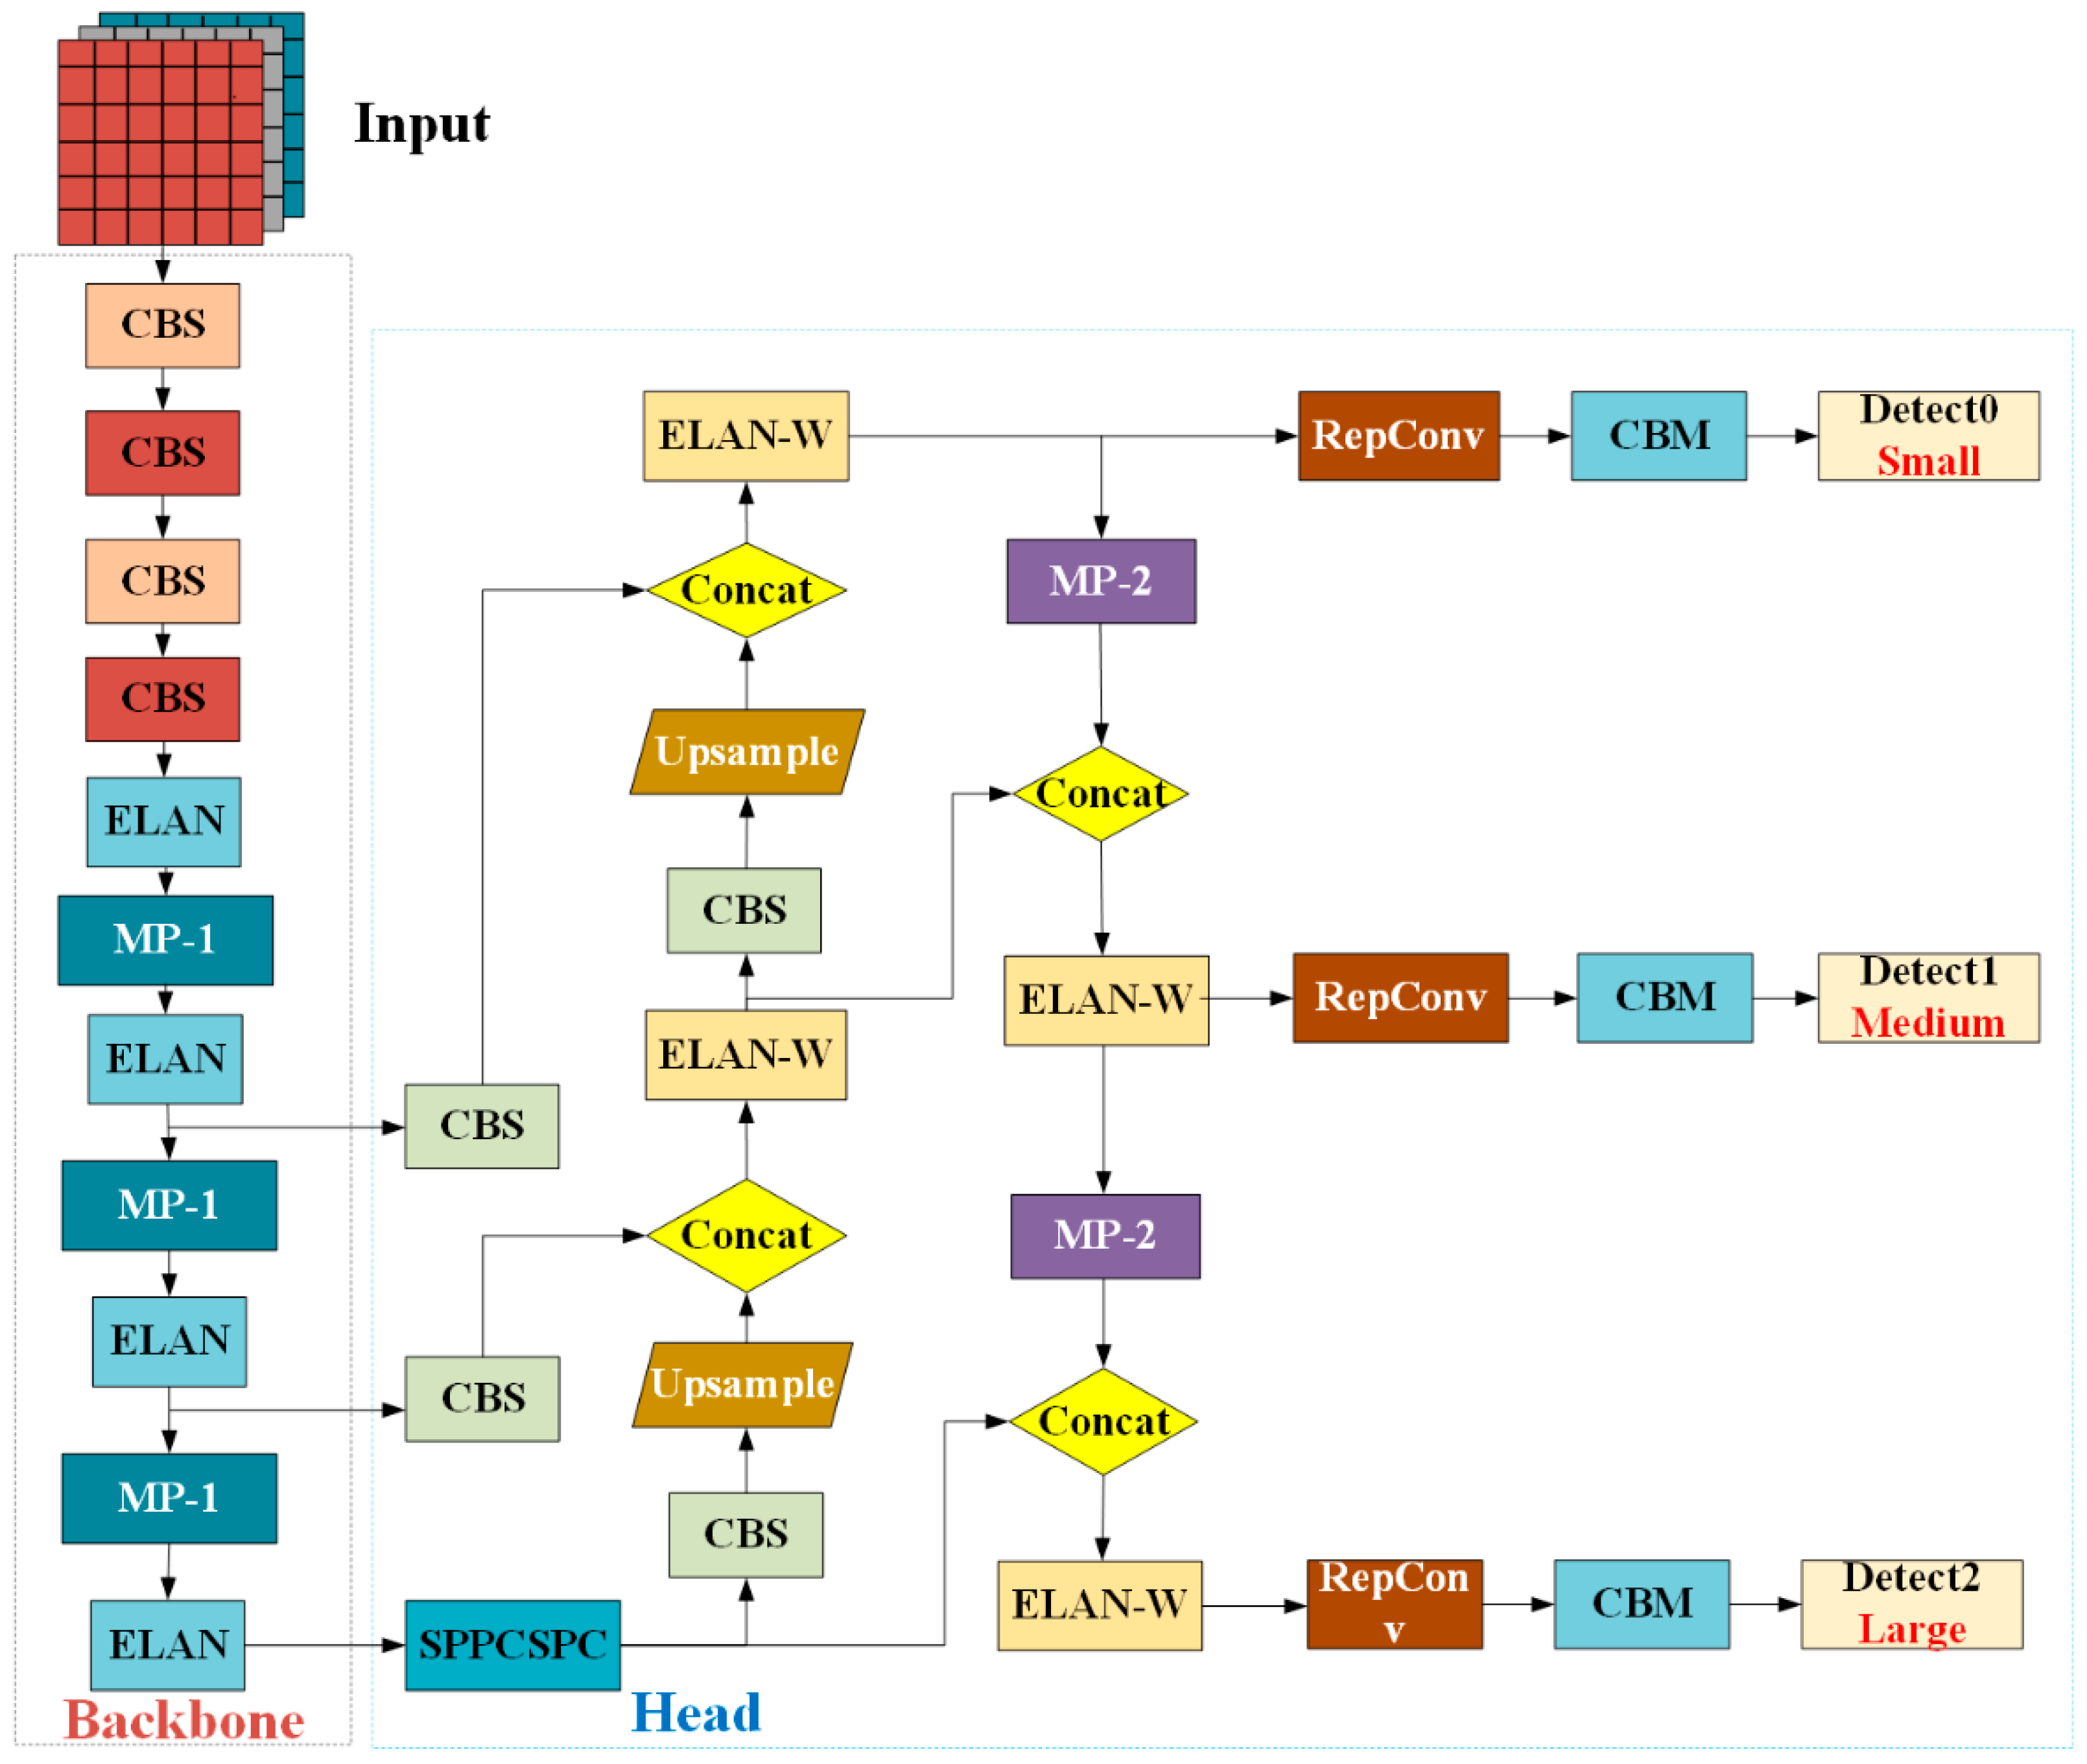
41] and YOLOv5, effectively balancing detection speed and accuracy, providing strong technical support for detecting nearshore ship targets in complex environments. The object detection process relies on the YOLOv7 network model, which includes four main levels: the input layer, the backbone network (Backbone), the neck network (Neck), and the output detection layer. Specifically, the input layer is responsible for receiving image data; the backbone network is used for extracting image features; the neck network further processes and fuses features; finally, the output detection layer is responsible for generating the detection results of the targets. The network structure design of YOLOv7 is shown in
Figure 2, aimed at improving the efficiency and effectiveness of detection.
Figure 3 delineates the architectural framework of the YOLOv7 network model. The input layer (Input) is tasked with resizing the incoming three-channel raw images to a uniform dimension of 640 × 640 pixels, employing Mosaic data augmentation techniques. This methodology enhances dataset variability and intricacy through random scaling, cropping, and rearrangement, amalgamating four distinct images into a single composite image.
The backbone network layer is primarily constituted by the Extended Efficient Layer Aggregation Network (E-ELAN) [
42] and Max Pooling (MP) [
43] modules, which synergistically engage in deep convolution to extract multi-scale feature information from the imagery.
The neck network (Neck), alternatively referred to as the feature fusion layer, integrates Spatial Pyramid Pooling (SPP) with Cross-Stage Partial Connections (CSPC) within the SPPCSPC [
44] module, alongside Conv-BN-Sigmoid (CBS) configurations, an enhanced variant of ELAN termed ELAN-W, and upsampling mechanisms. These components are pivotal in the profound integration of feature maps across disparate scales, culminating in the generation of three-tiered feature maps of varying dimensions—small, medium, and large—to facilitate subsequent analytical processes.
The output detection layer (Head) assumes the responsibility of processing the extracted features, refining the predicted anchor box coordinates, classifying categories, and ascertaining confidence levels. It subsequently yields the conclusive detection outcomes following the application of Non-Maximum Suppression (NMS), thereby ensuring the precision and dependability of the detection results.
2.3. Attention Mechanism
The Squeeze-and-Excitation Network (SENet), as a representative of channel attention mechanisms, won the classification project in the 2017 ImageNet competition. This network models the importance of different channels by capturing the interrelationships between convolutional layer features, using global information to enhance informative positive sample features while suppressing unimportant negative sample features, thereby optimizing network performance. The SE attention mechanism significantly improves the performance of existing networks with only a slight increase in computational load. SE first simplifies the feature map to a feature vector through a squeeze operation, then learns the weights of each channel through an excitation operation, and these weights are subsequently used to adjust the channels in the original feature map, achieving dynamic feature recalibration.
The SE [
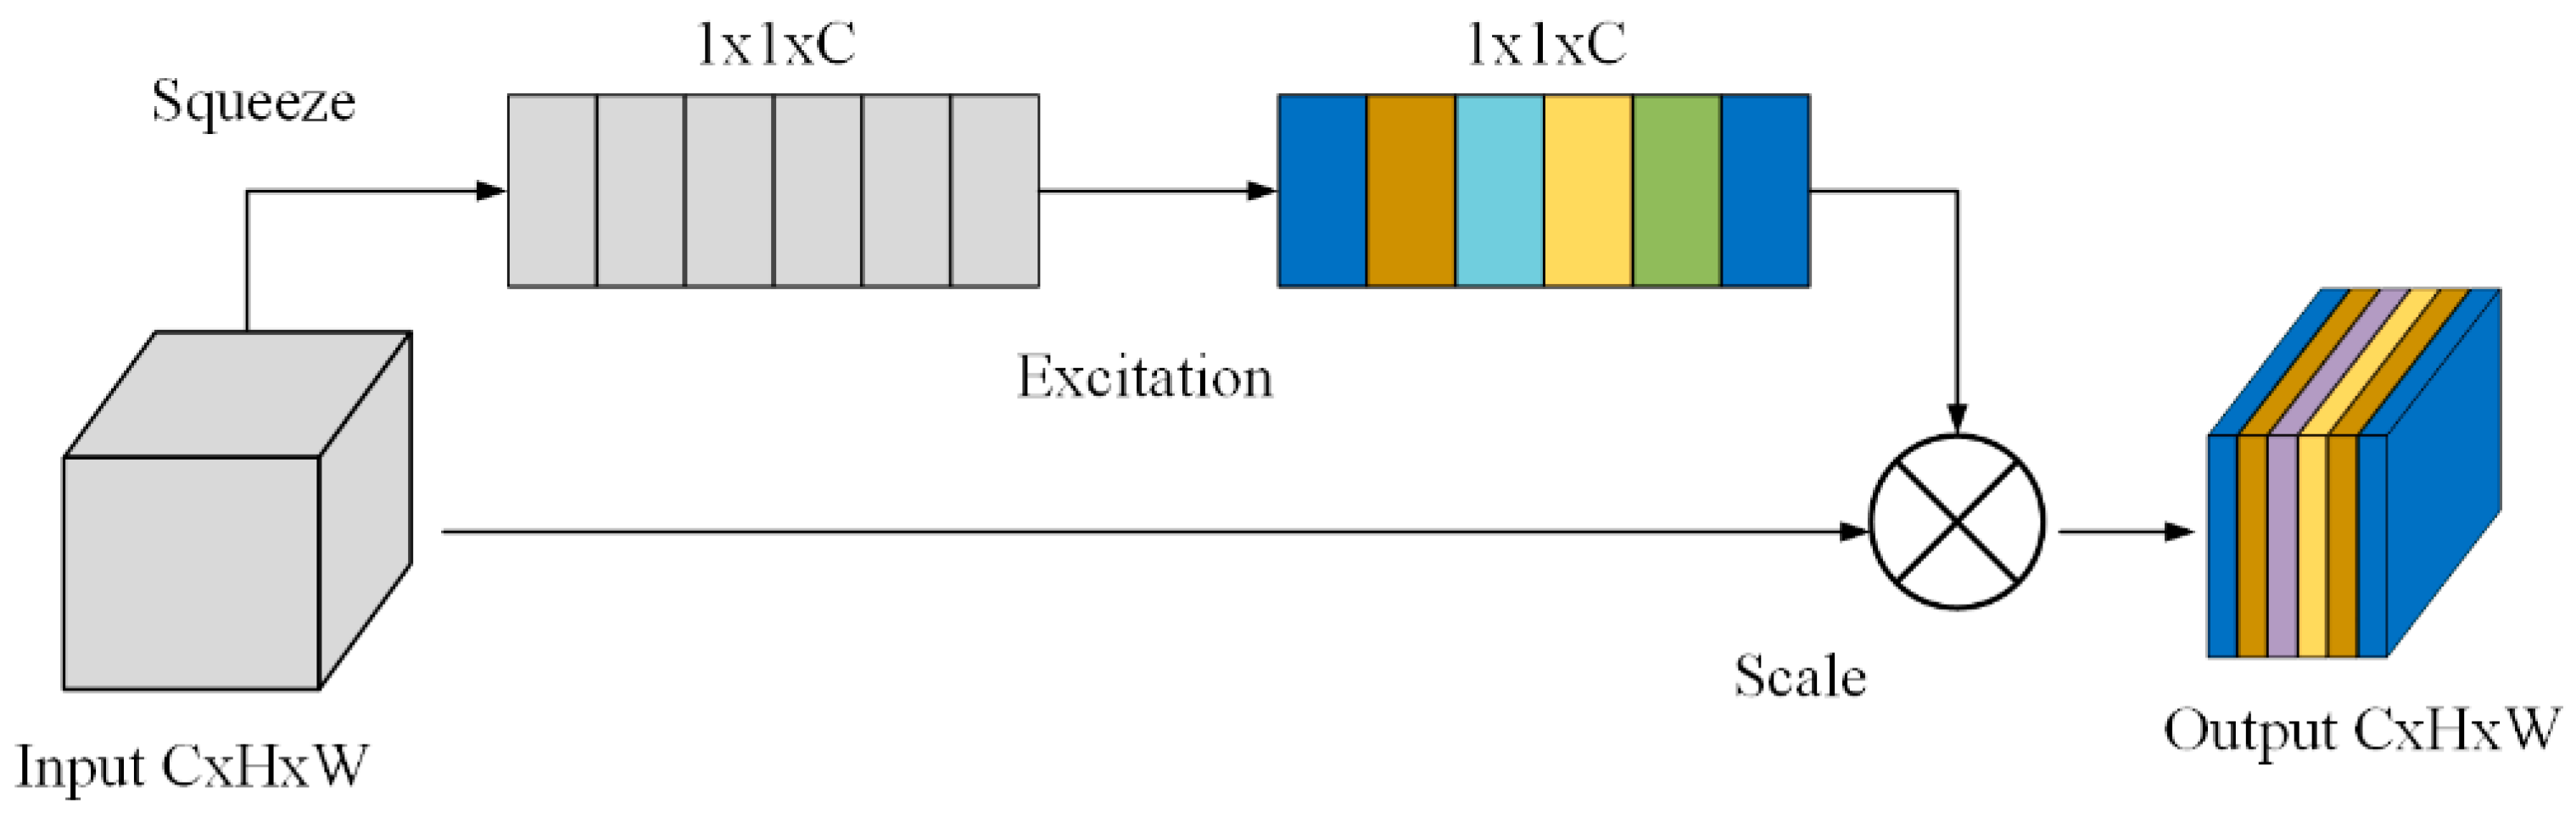
29] attention mechanism primarily enhances key features while suppressing less important ones by dynamically adjusting the weights of feature channels. This is achieved by performing three key steps on convolutional feature maps: Squeeze, Excitation, and feature reweighting, as shown in
Figure 3.
The Squeeze step, aimed at addressing channel dependencies, employs global average pooling across channels to compress global spatial information into a channel descriptor. Specifically, it reduces a feature map of size W × H × C to a 1 × 1 × C feature vector Z, where each of the C channels is compressed into a single value. This results in channel-level statistics Z that incorporate contextual information, thereby mitigating the issue of channel dependencies. This process is defined as follows:
Among them, Z
c is the c-th element of Z.
The Excitation step consists of two fully connected layers. The first fully connected layer compresses the C channels into C/r channels to reduce computational complexity, followed by a ReLU non-linear activation layer. The second fully connected layer restores the number of channels back to C, and a Sigmoid activation is applied to generate the weights s. The resulting s has dimensions 1 × 1 × C, where each element represents the importance weight for the corresponding channel in the feature map. The parameter r denotes the compression ratio.
Feature reweighting uses the weights obtained from the Excitation step to recalibrate each channel of the original input feature maps. By weighting specific channel features, it enhances or suppresses them, ultimately producing the output
.
Due to its plug-and-play nature, the SE module is widely applied across various network architectures and significantly enhances model performance. Through this attention mechanism, networks can focus more on features that are critical for object recognition tasks while ignoring unimportant information, thereby improving feature representation and model recognition accuracy.
3. Material and Method
3.1. Experimental Setup and Parameter Metrics
All experiments were conducted on a server with the following hardware setup: NVIDIA GeForce RTX 3090 GPUs, 64 GB of RAM, and an Intel X5 CPU. The software environment consisted of Ubuntu 18.04, Python 3.9, PyTorch 2.2.1, and CUDA 12.1.
The ConSinGAN model, during the data augmentation training process for SAR nearshore ship images, employed a learning rate of 0.3, with each image undergoing 10 training epochs and 2000 iterations per epoch, utilizing the Adam optimizer.
In assessing the object detection performance of the YOLOv7 model, this study employed four core metrics, including precision, recall, average precision (AP), mean average precision (mAP), and F1 score (F1-Score). The calculation methods for these metrics are as follows:
In this context: True Positives (TP) denote the number of instances where the model correctly identifies positive samples, False Positives (FP) represent the instances where the model erroneously classifies negative samples as positive, and False Negatives (FN) indicate the cases where the model mistakenly labels positive samples as negative. Precision is the likelihood that a detection box marked as a positive class by the model is indeed a positive class, while recall is the probability that a positive sample is accurately predicted among all actual positive samples. Mean average precision (mAP) is derived from the average of average precision (AP) values across all classes, serving as a critical metric for evaluating the performance of the object detection network model. AP, in this case, refers to the mean precision at various levels of recall. The total number of classes is represented by N. Since this experiment involved a single target class, namely, ships, the evaluation metric was simplified to AP. An elevated AP value signifies superior detection capabilities of the model. The F1 score ranges between 0 and 1, with an ideal value of 1, indicating that the model has perfect precision and recall. A high F1 score reflects a good balance between precision and recall, and it is commonly used in tasks that involve imbalanced datasets or require a trade-off between accuracy and completeness.
In the experiments, we adhered to the principle of controlled variables. Specifically, the model training epochs were set to 400, the batch size was 16, the input image batch dimensions were 640 × 640 pixels, the optimizer used was SGD, and the warm-up epochs were 3.
3.2. Dataset Creation
The SAR-Ship dataset [
45] consists of 102 Gaofen-3 (GF-3) images and 108 Sentinel-1 images from China. These images were processed into 43,819 image patches of 256 × 256 pixels, each containing one or more ship targets, totaling 59,535 annotated ship instances. The spatial resolution of the images ranges from 22 m, 8 m, 3 m, 5 m, and 10 m to 25 m. The annotation files are in XML format, recording the position and category information of each ship within the image patches. The dataset includes a variety of offshore and nearshore images. This paper filtered the nearshore data images from the SAR-Ship dataset, extracting a total of 3644 images.
During the construction of the dataset, annotating images with bounding boxes is a critical step. This study employed the LabelImg annotation tool for marking sample images, with annotation files adhering to the YOLO format.
Figure 4a depicts an unannotated image, while
Figure 4b shows an image annotated in the YOLO format, where the annotation file is in text format, containing a total of five parameters following the format {label, x-coordinate, y-coordinate, width, height}. The label represents the class identifier of the object within the bounding box; the x-coordinate and y-coordinate indicate the center coordinates of the object; and the width and height refer to the length and width of the annotation box, respectively.
3.3. Improvement of Backbone Layer Based on SE
For the task of ship target detection under complex nearshore backgrounds, the YOLOv7 algorithm was adopted and optimized. We strengthened the model’s backbone network for more efficient feature extraction and integrated the SE module with the backbone network to enhance the detection capability of nearshore ships in complex backgrounds.
Given that the primary function of the SE (Squeeze-and-Excitation) module is to reinforce important channel features, it was integrated into the Backbone module, particularly at the position responsible for feature fusion. ELAN (Efficient Layer Aggregation Network) improves feature extraction capabilities through depthwise separable convolutions and progressive feature aggregation, effectively enhancing feature representation. In the YOLOv7 model, the feature map output by the ELAN module contains crucial semantic information at the current layer. The SE module can dynamically adjust channel weights to enhance target-relevant features by boosting key features and suppressing noise or irrelevant features, thereby improving the overall performance and accuracy of the network. This improvement not only strengthens feature discriminability but also aids the network in better recognizing and localizing targets in object detection tasks.
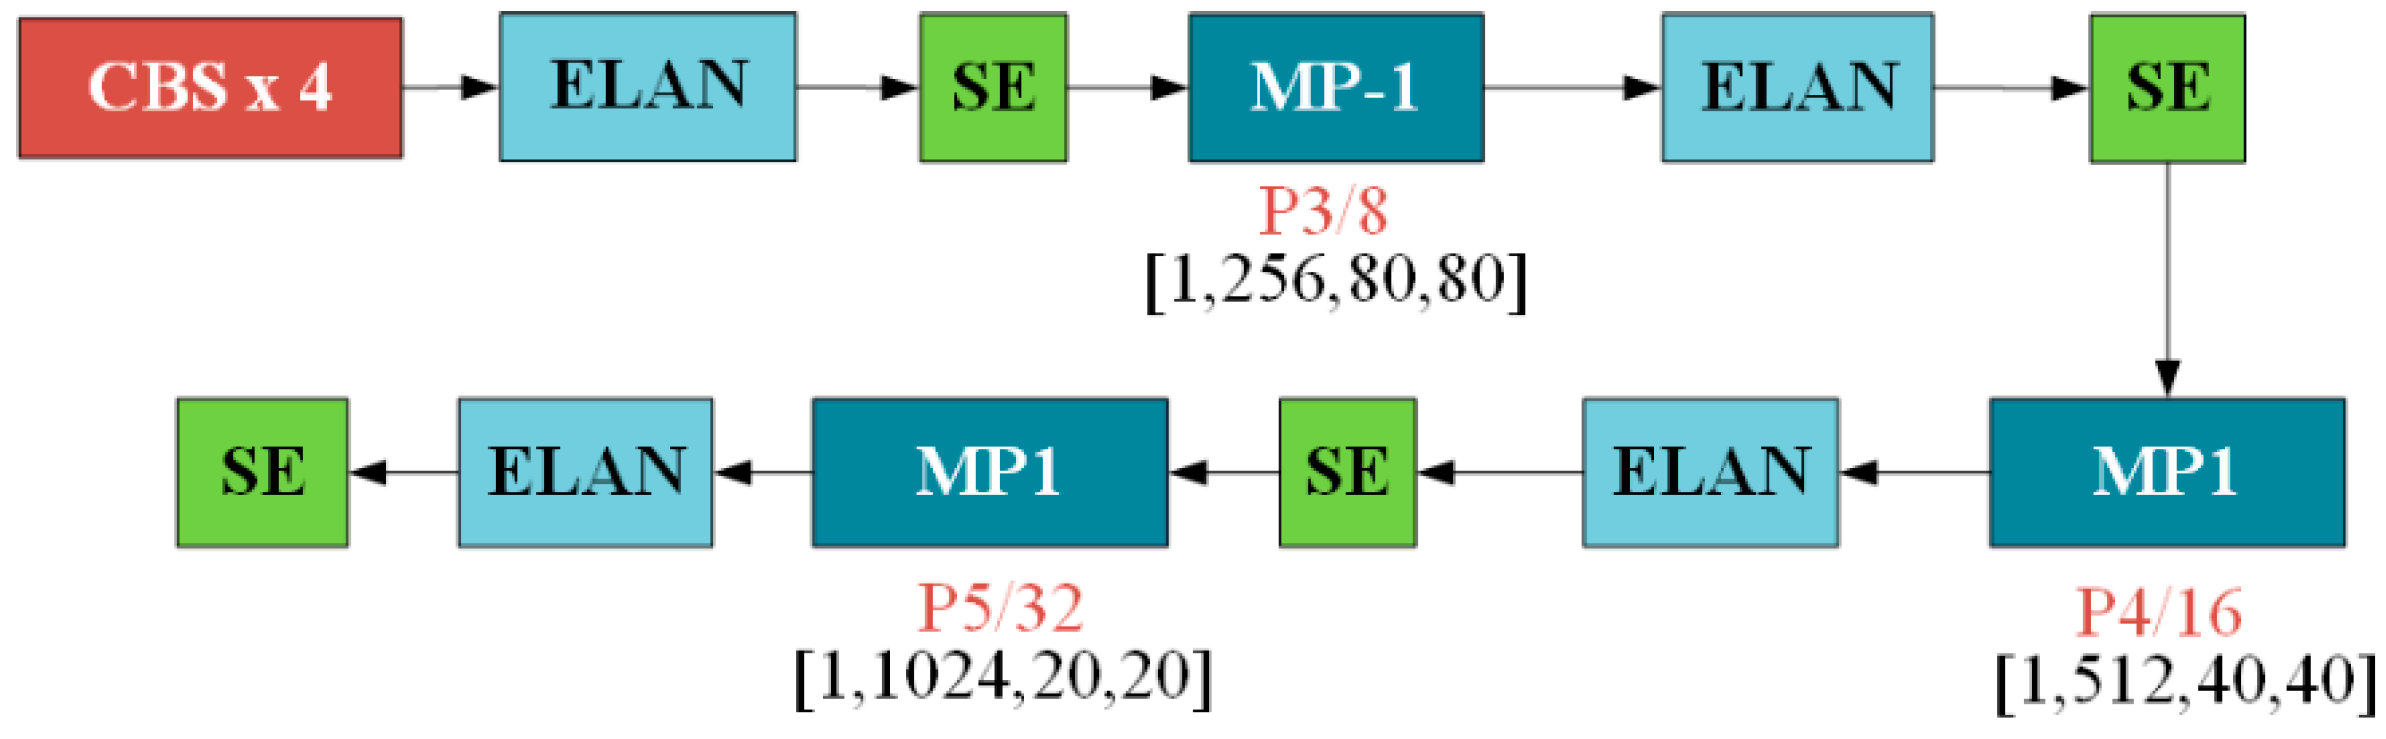
The YOLOv7 model’s Backbone network is composed of key components such as CBS layers, ELAN layers, and MP-1 layers. In YOLOv7 + SE, we introduced the SE module after the four ELAN structures within the Backbone network, as shown in
Figure 5. By doing so, we enhanced the feature representation capability at the intermediate stages of the Backbone network.
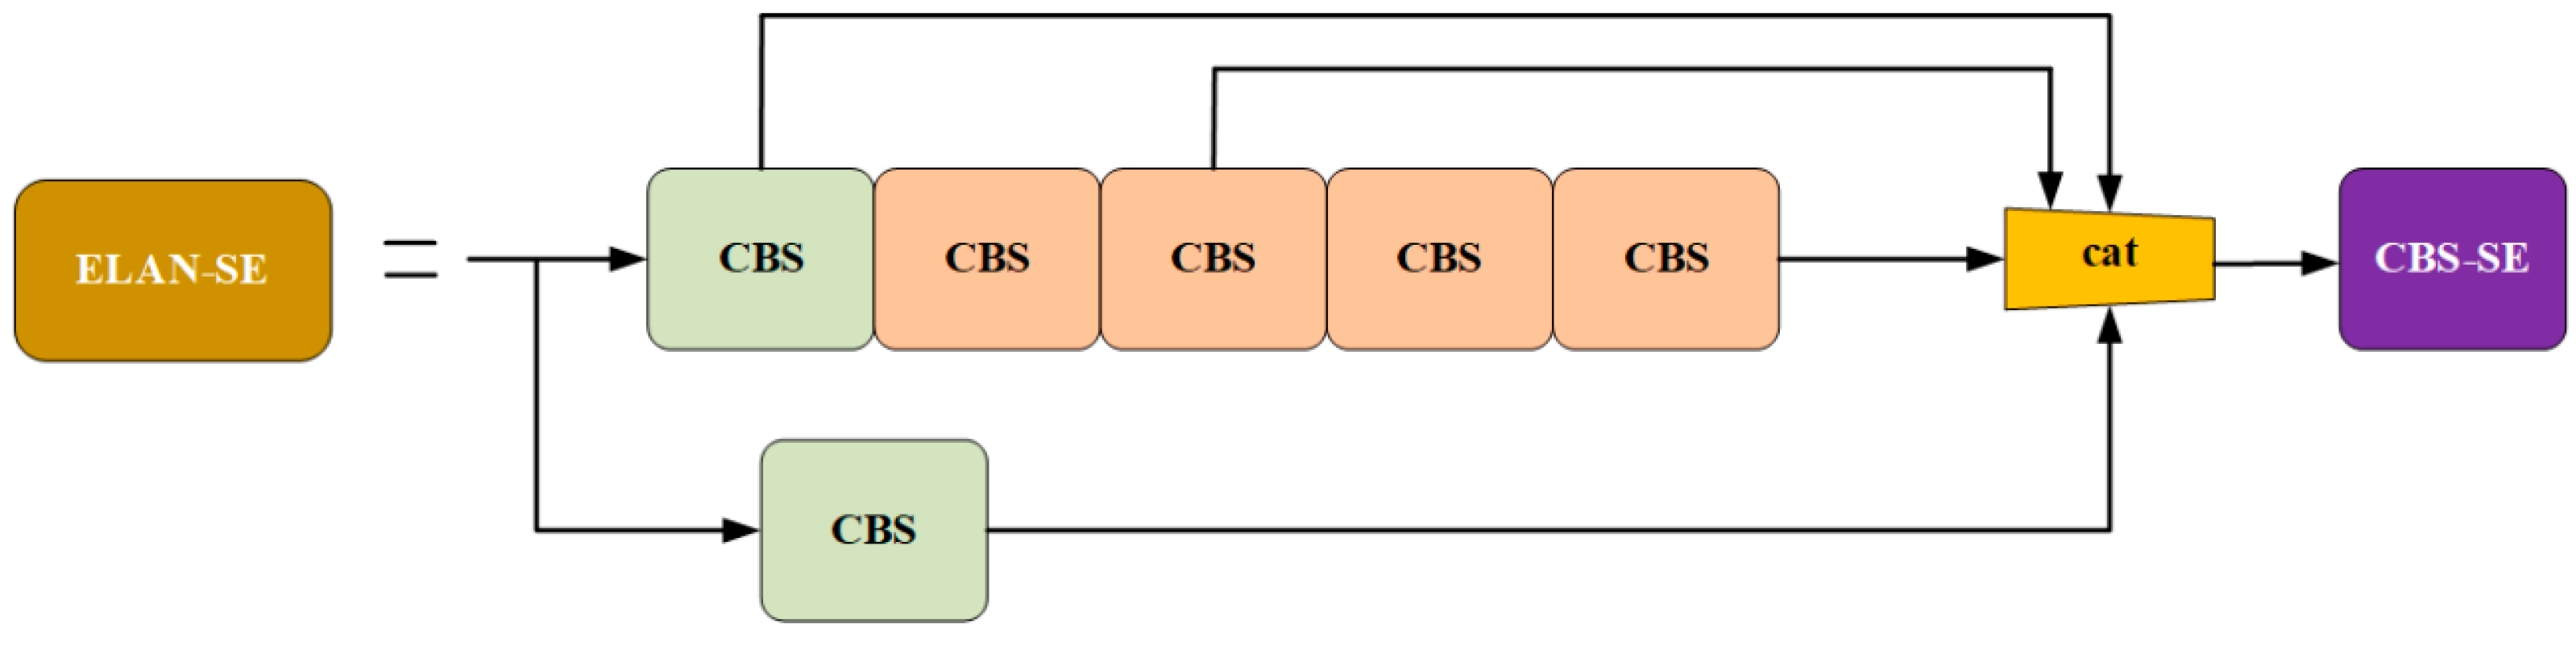
3.4. YOLOv7 Model Integrating ELAN and SE
The ELAN module is an efficient network design that captures richer feature sets by managing the shortest and longest gradient paths. It consists of two branches: one adjusts the number of channels using a 1 × 1 convolution, and the other combines a 1 × 1 convolution with four 3 × 3 convolutional modules to adjust the number of channels and then extract features. These features are eventually merged. The SE module was integrated into the last CBS of ELAN to form CBS-SE, replacing the conventional CBS module. The improved ELAN network structure is shown in
Figure 6.
By combining the ELAN module with the SE attention mechanism, an enhanced network structure, referred to as the ESE network in this paper, was formed. The core task of this network was to extract multi-level features from input images and integrate them to obtain comprehensive ship images, thereby improving the detection accuracy of ship targets.
4. Result
4.1. Data Augmentation Experiment Results
After training, this experiment utilized 300 original dataset images to generate 3000 nearshore ship images.
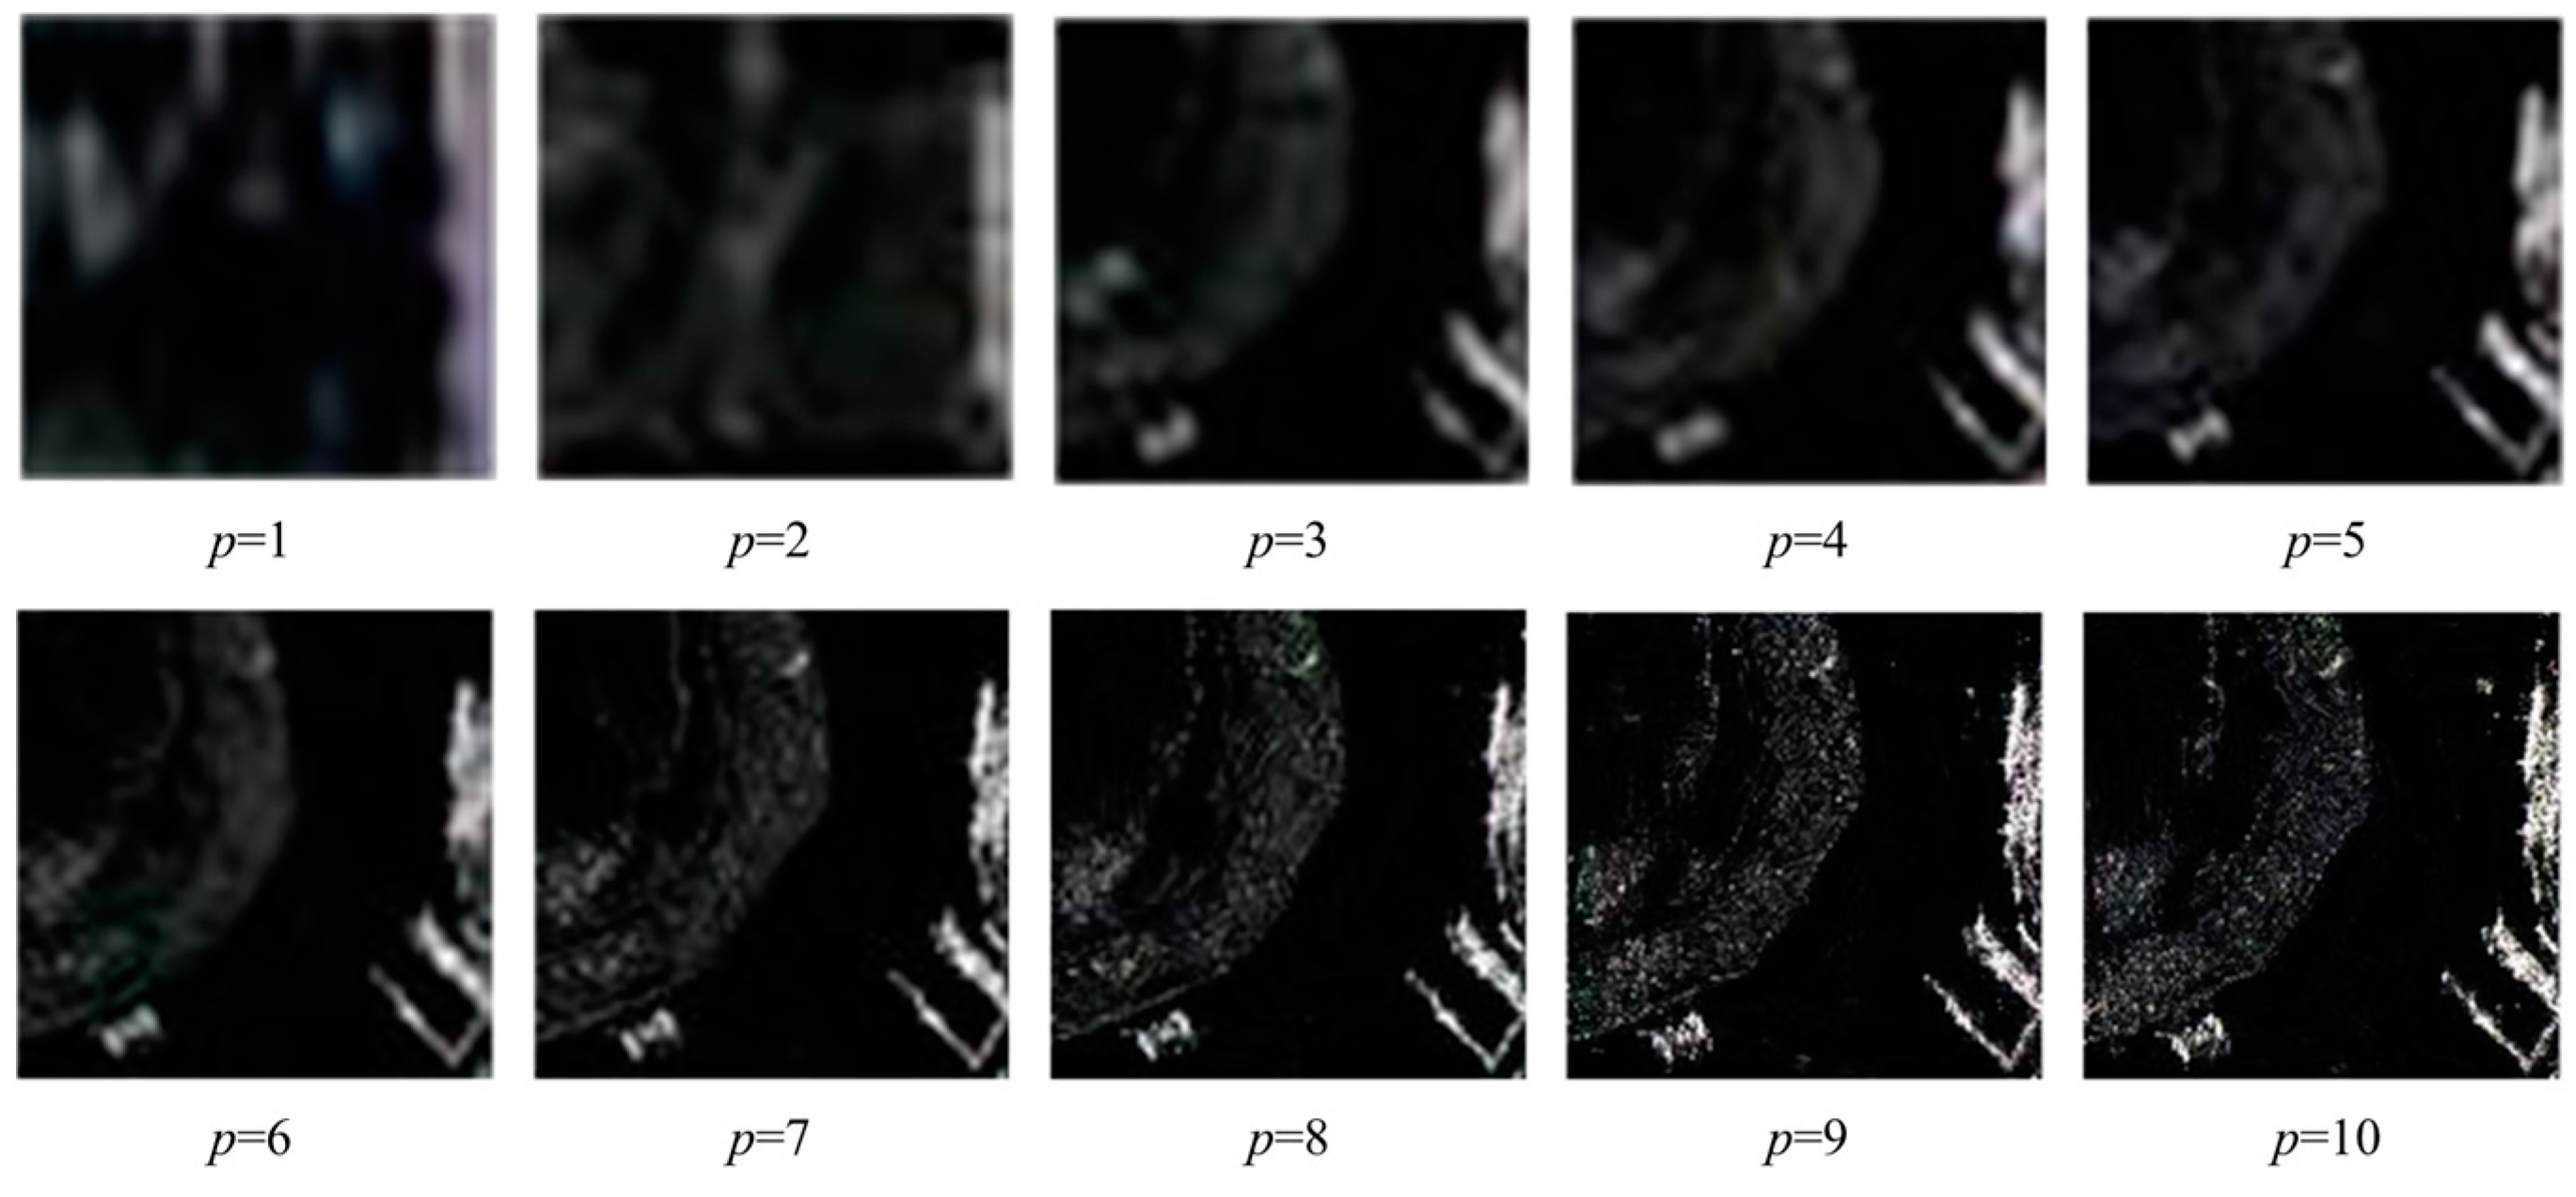
Figure 7 illustrates the image generation process at different stages, revealing that ConSinGAN introduced more detailed variations at each stage of the nearshore ship image generation.
In the experiment, p represented different training stages ranging from 1 to 10, indicating that ConSinGAN iteratively refined a single image through multiple iterations, gradually generating clearer images with increasing resolution.
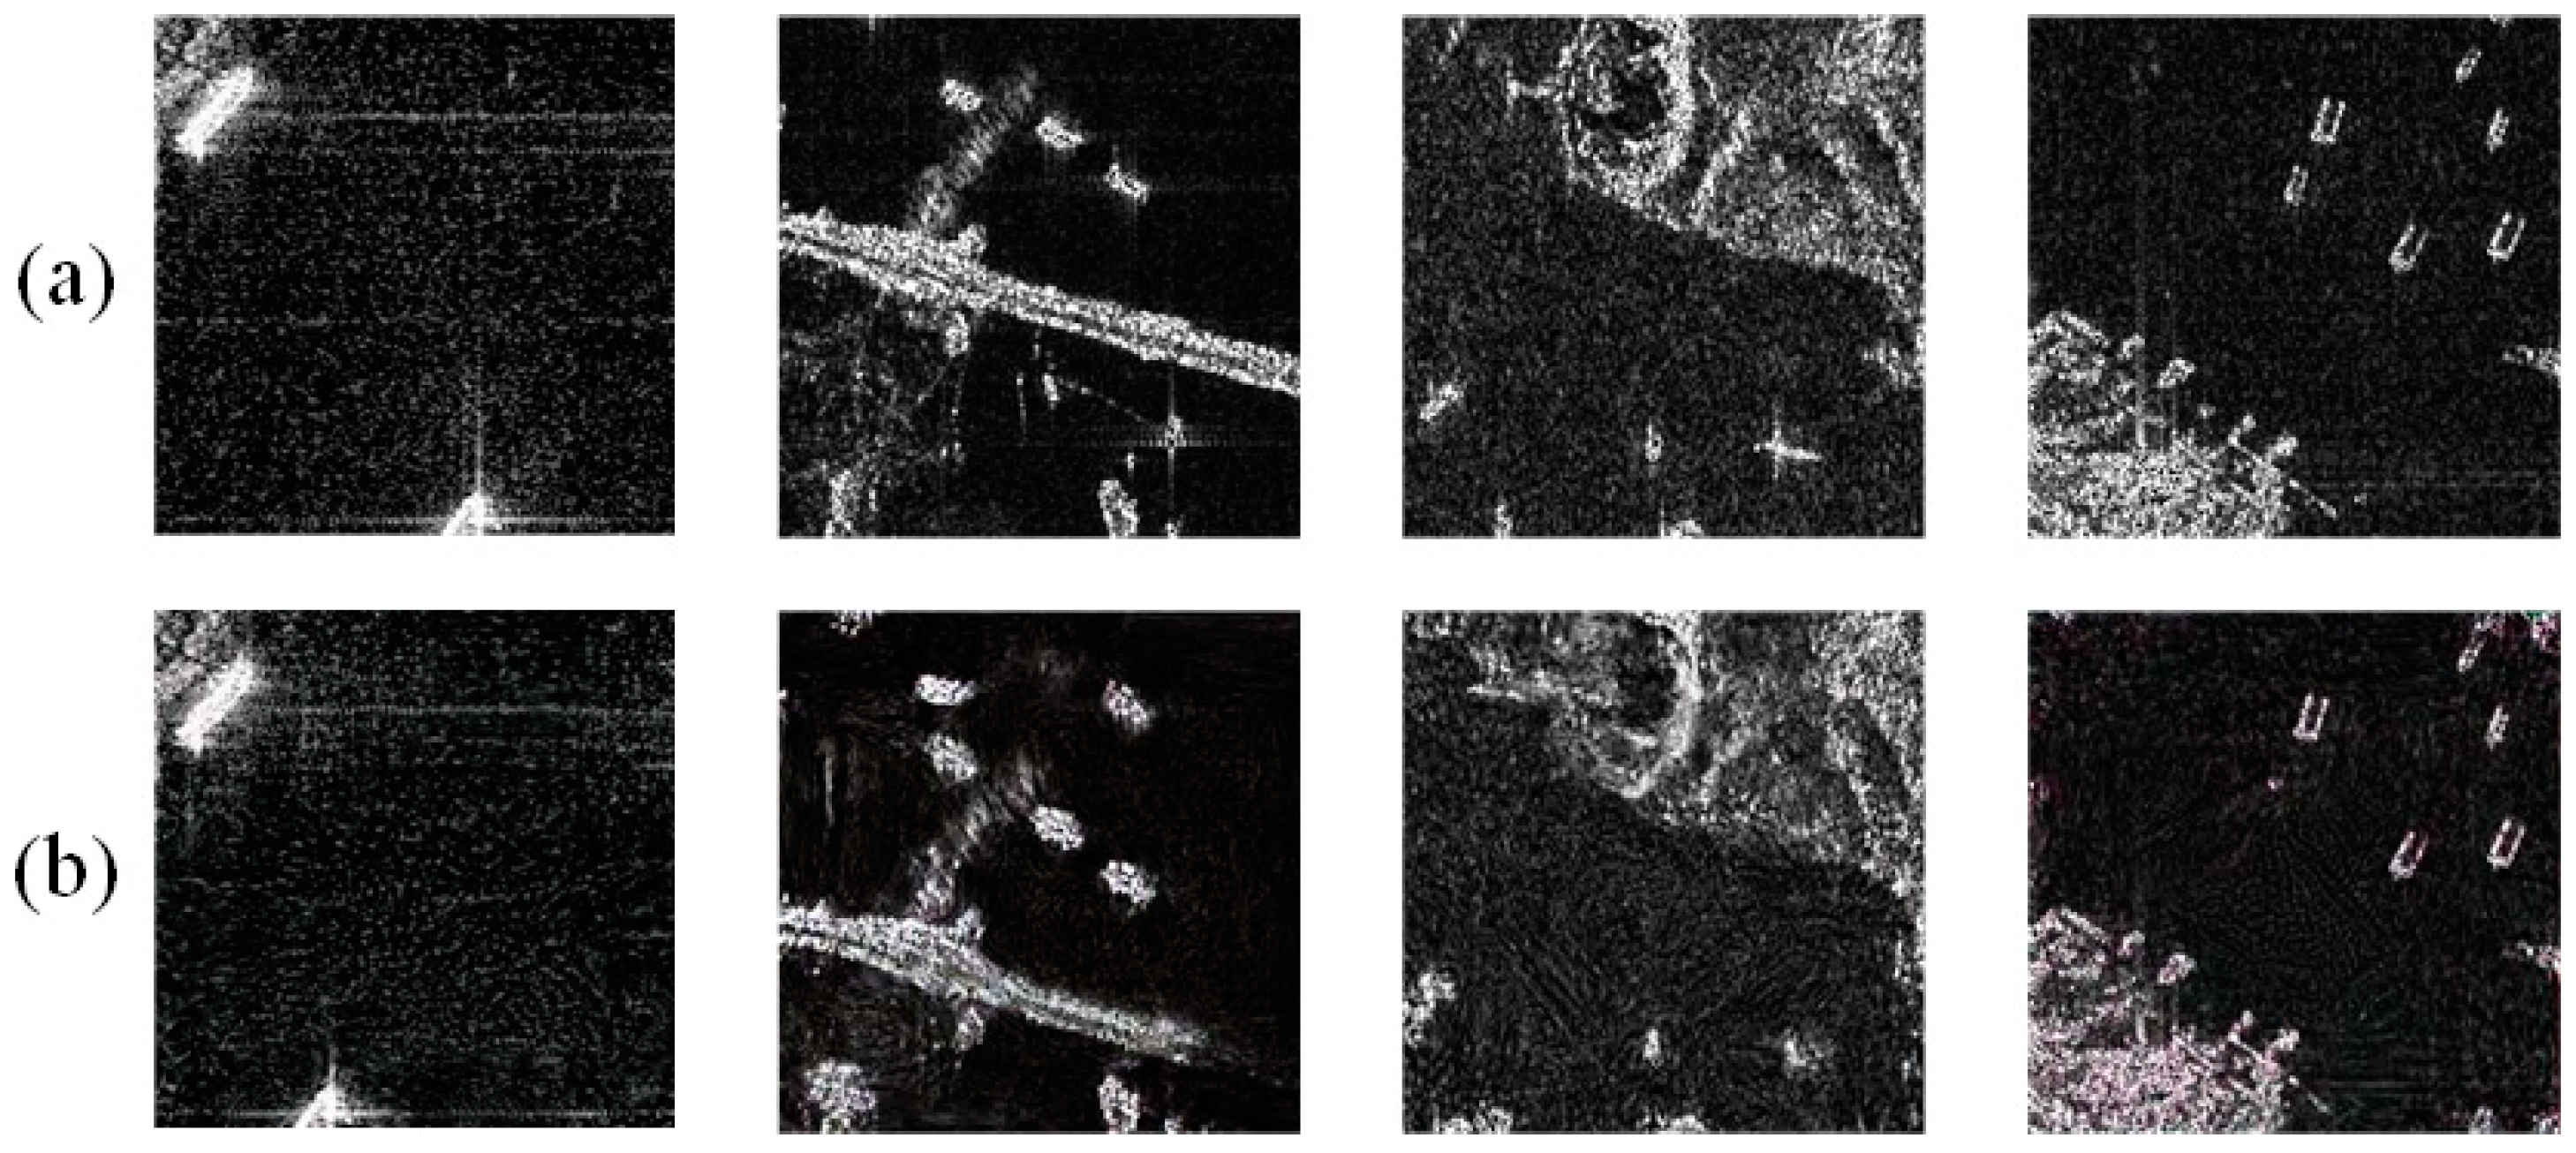
Figure 8 displays the final generated images, which, by introducing random noise, exhibited noticeable detail differences compared to the original images, thereby enhancing the diversity of the nearshore ship images produced by ConSinGAN.
In image generation tasks, the Fréchet Inception Distance (FID) [
46] is a metric used to evaluate the quality of images generated by models. A lower score correlates strongly with higher-quality images, and the smaller the value, the higher the “realism” of the generated images. The FID metric is the squared Wasserstein distance between two multidimensional Gaussian distributions and is given by the following formula:
Among them, represent the mean of the features of the real image and the generated image, respectively, and represent the covariance matrix of the features of the real image and the generated image, respectively.
Since the images were generated from single-sample sampling, the Single FID (SIFID) was used as the improvement evaluation metric. The value calculated here was the average of multiple images generated by the model after successful training. The formula was as follows:
The statistical distributions of real images and generated image data were compared one-to-one and then summed and averaged to obtain the SIFID evaluation index. With a calculated SIFID of 25.24 with the original SAR nearshore ship image training set and 3000 generated images, it was evident that the image generation quality was high, with a certain variability present.
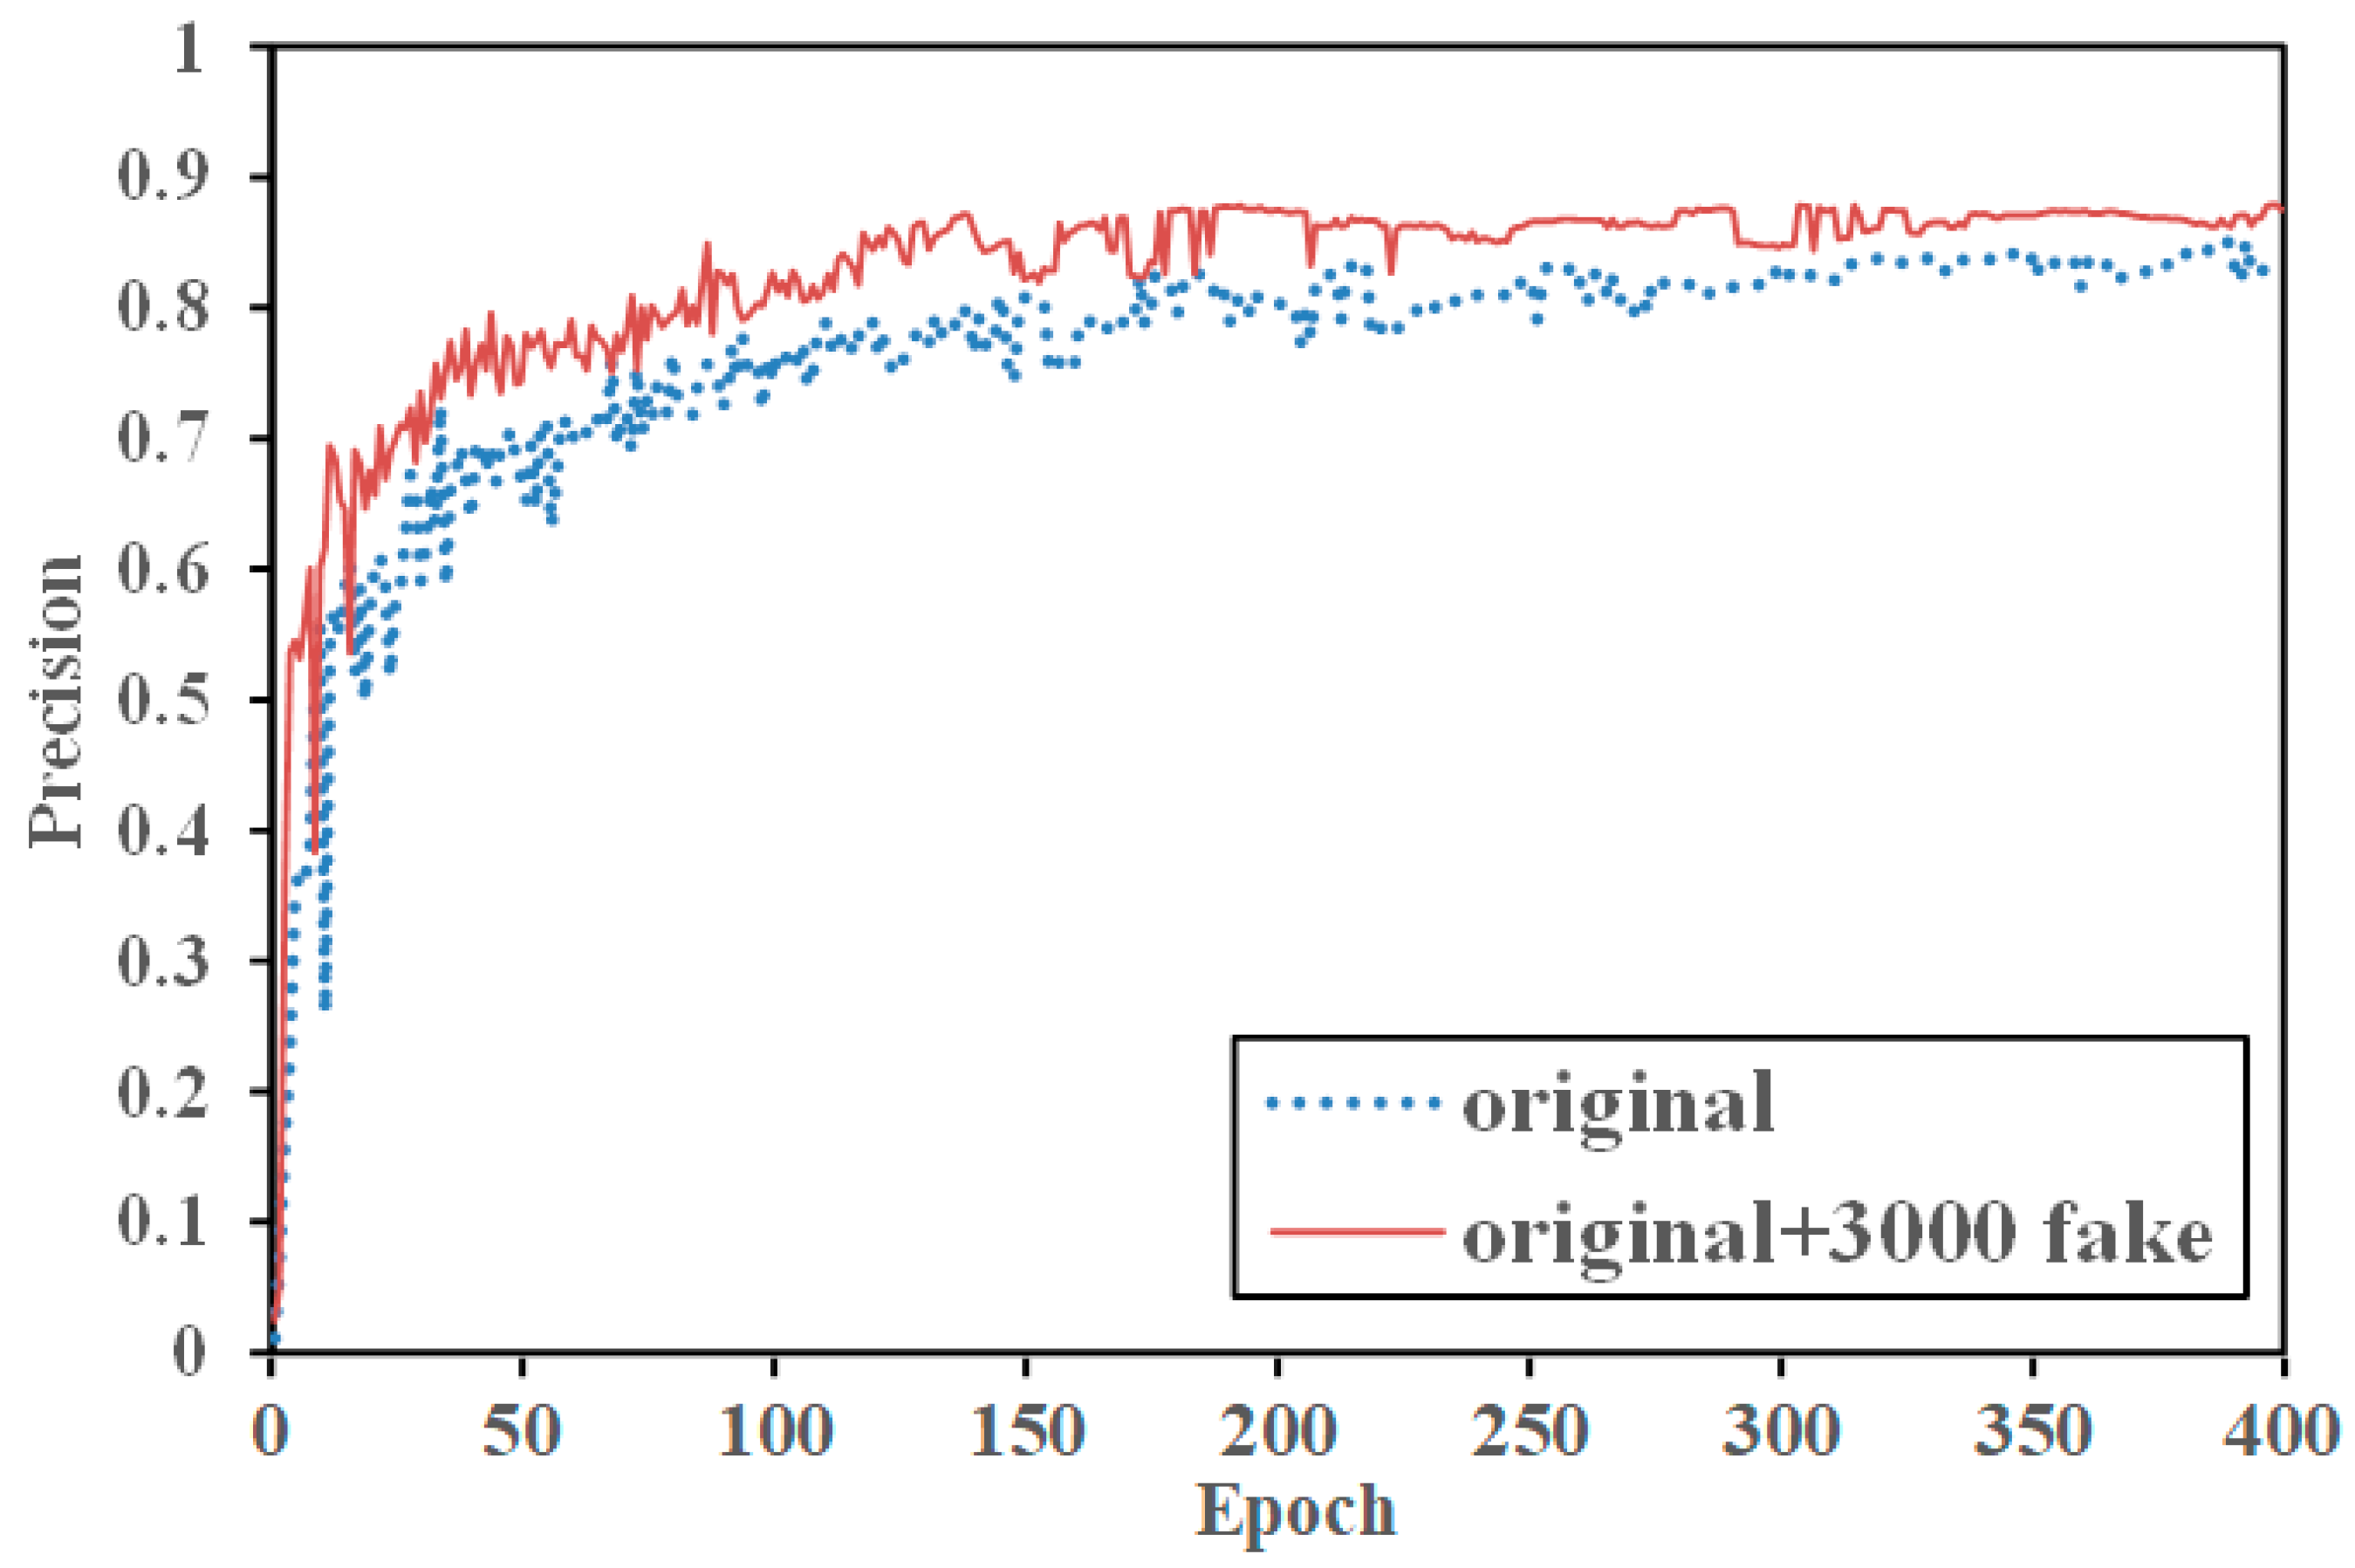
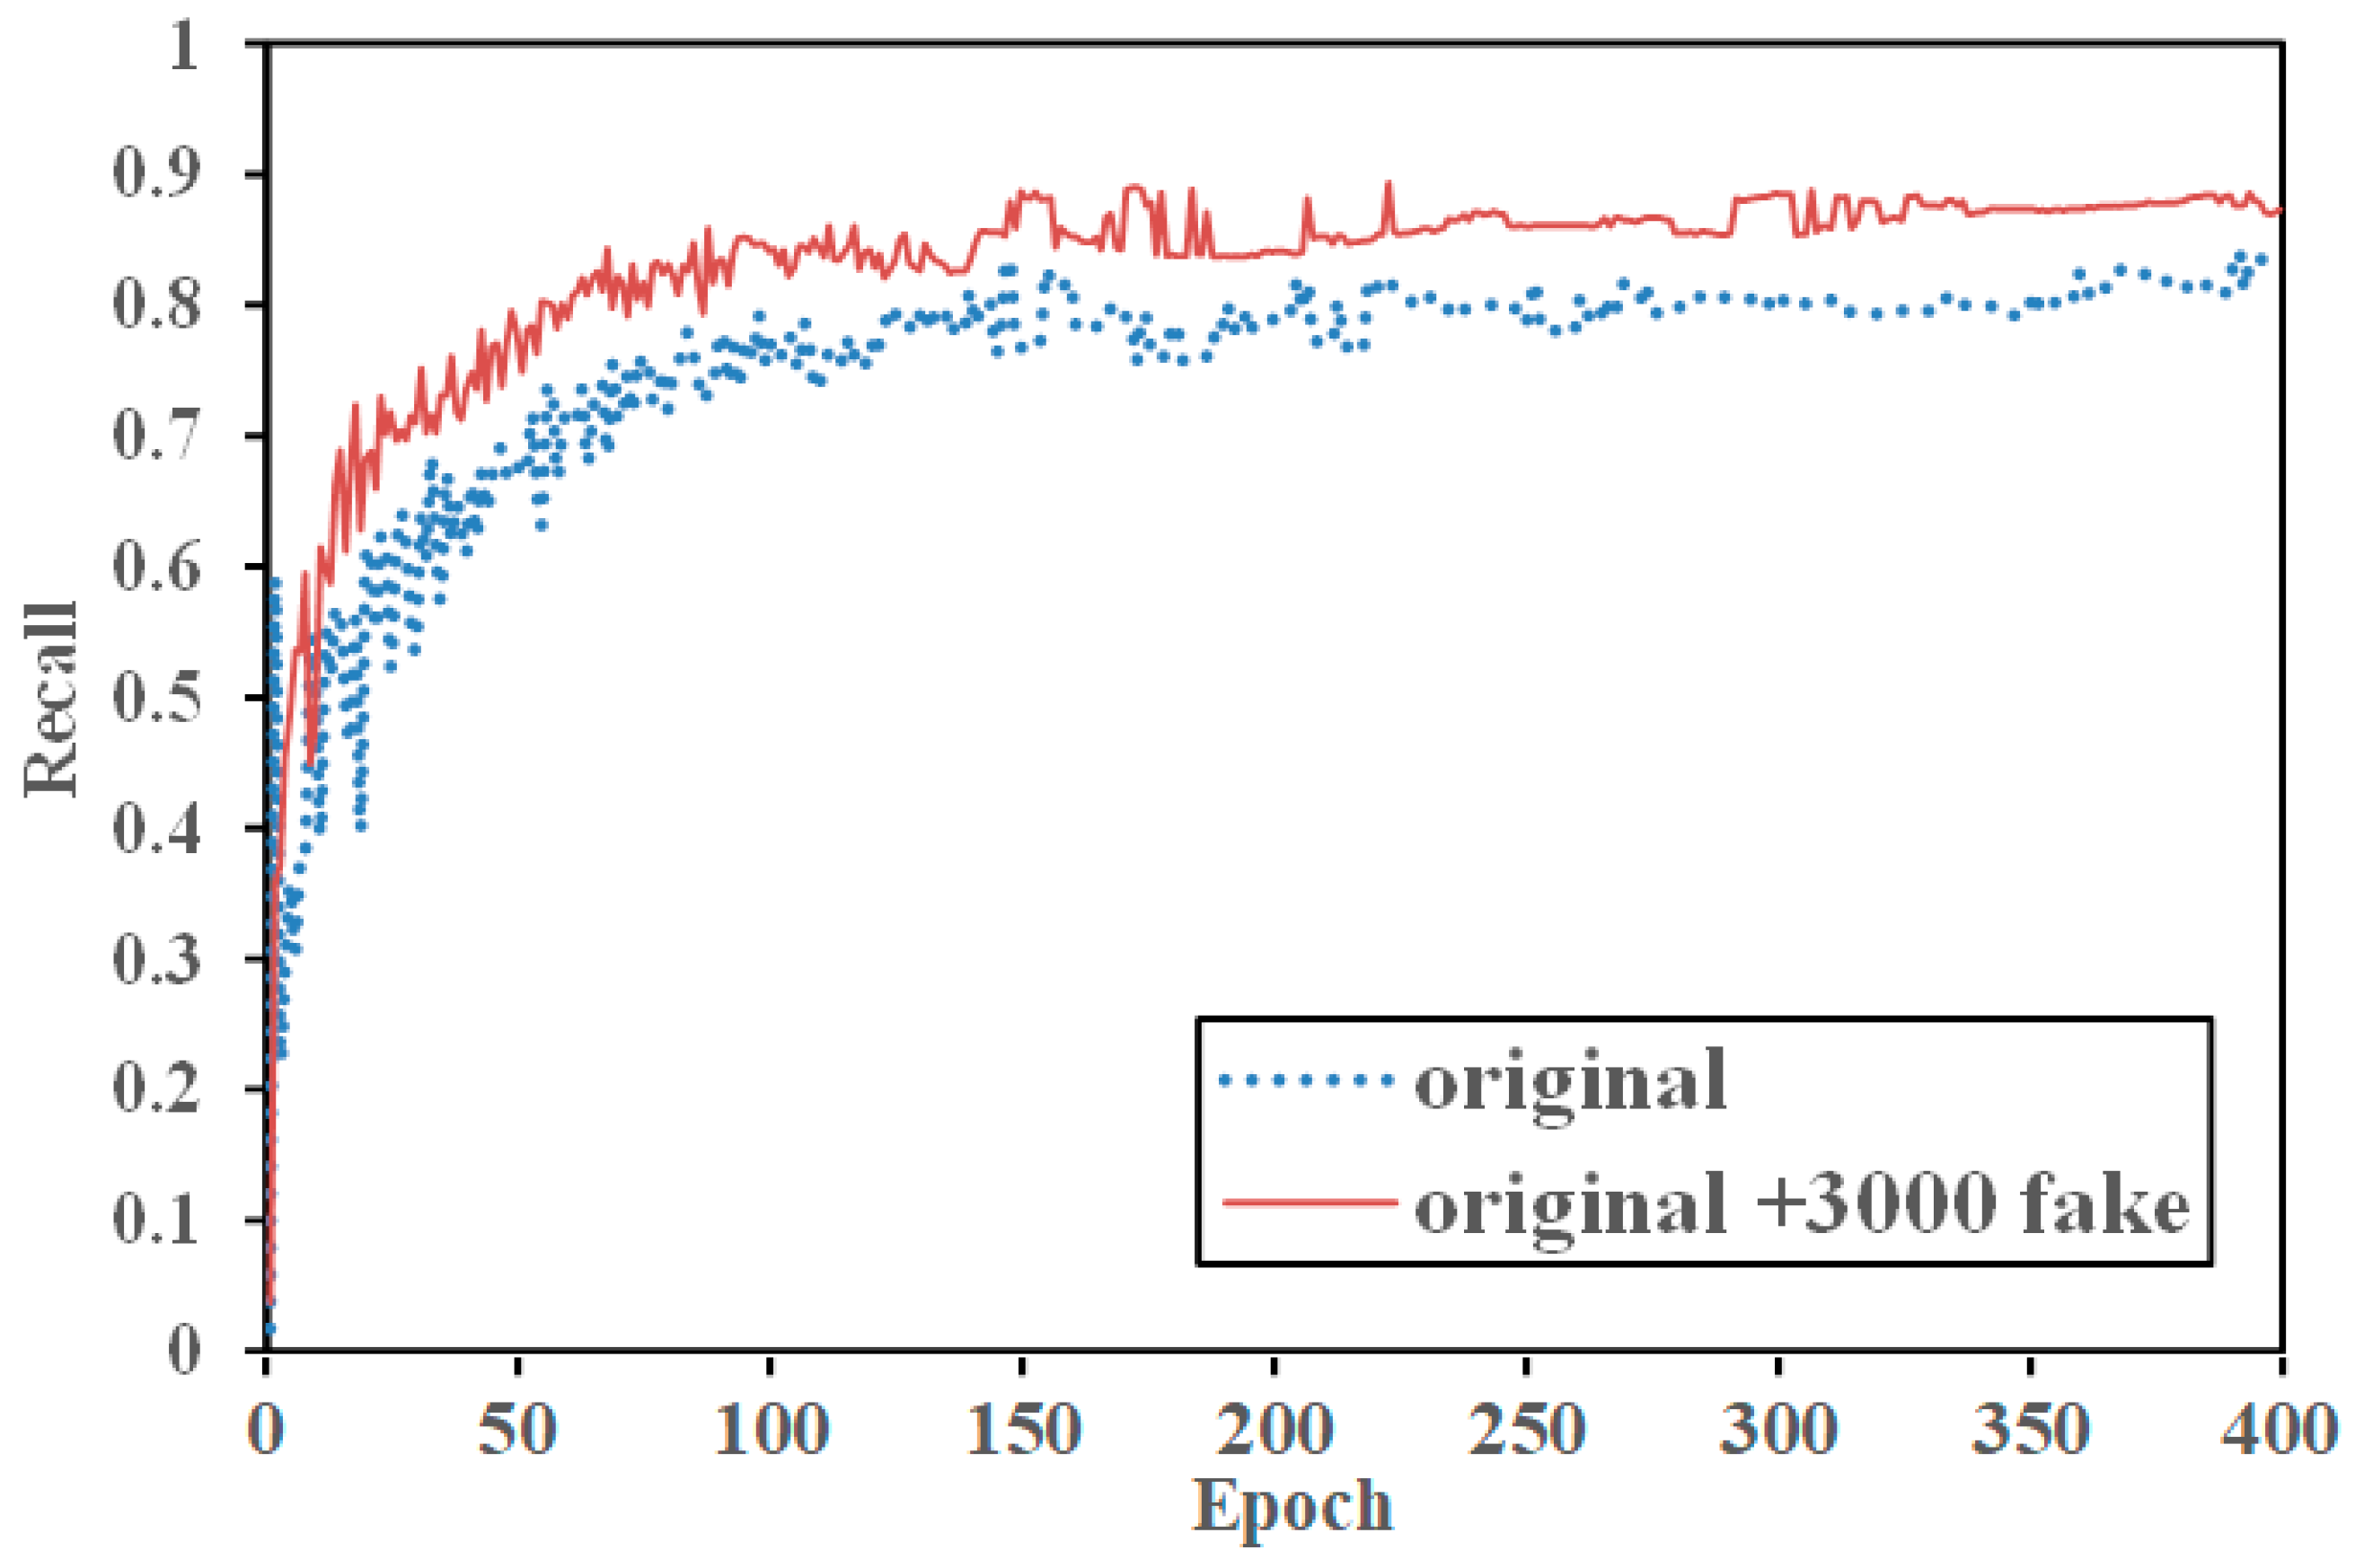
To validate the effectiveness of the work, 3000 generated nearshore ship images were annotated and merged with the original SAR-Ship dataset containing 3644 nearshore images. The combined dataset was then used to train the original YOLOv7 model, with training results compared using precision, recall, and average precision (AP@0.5) as metrics. The specific experimental results are shown in
Table 1.
In the experimental results table, “original” refers to the original dataset, and “fake” represents the generated dataset. From the experimental results, it can be observed that precision, recall, and AP@0.5 increased to varying degrees. Compared to the original nearshore dataset, the model training precision increased by 4.66%, recall increased by 3.68%, AP@0.5 increased by 3.24%, AP@0.5:0.95 increased by 3.11%, and the F1 score increased by 3.17%. The comparison between the original nearshore data and “original + 3000 fakes” is illustrated in the data curves shown in
Figure 9,
Figure 10 and
Figure 11.
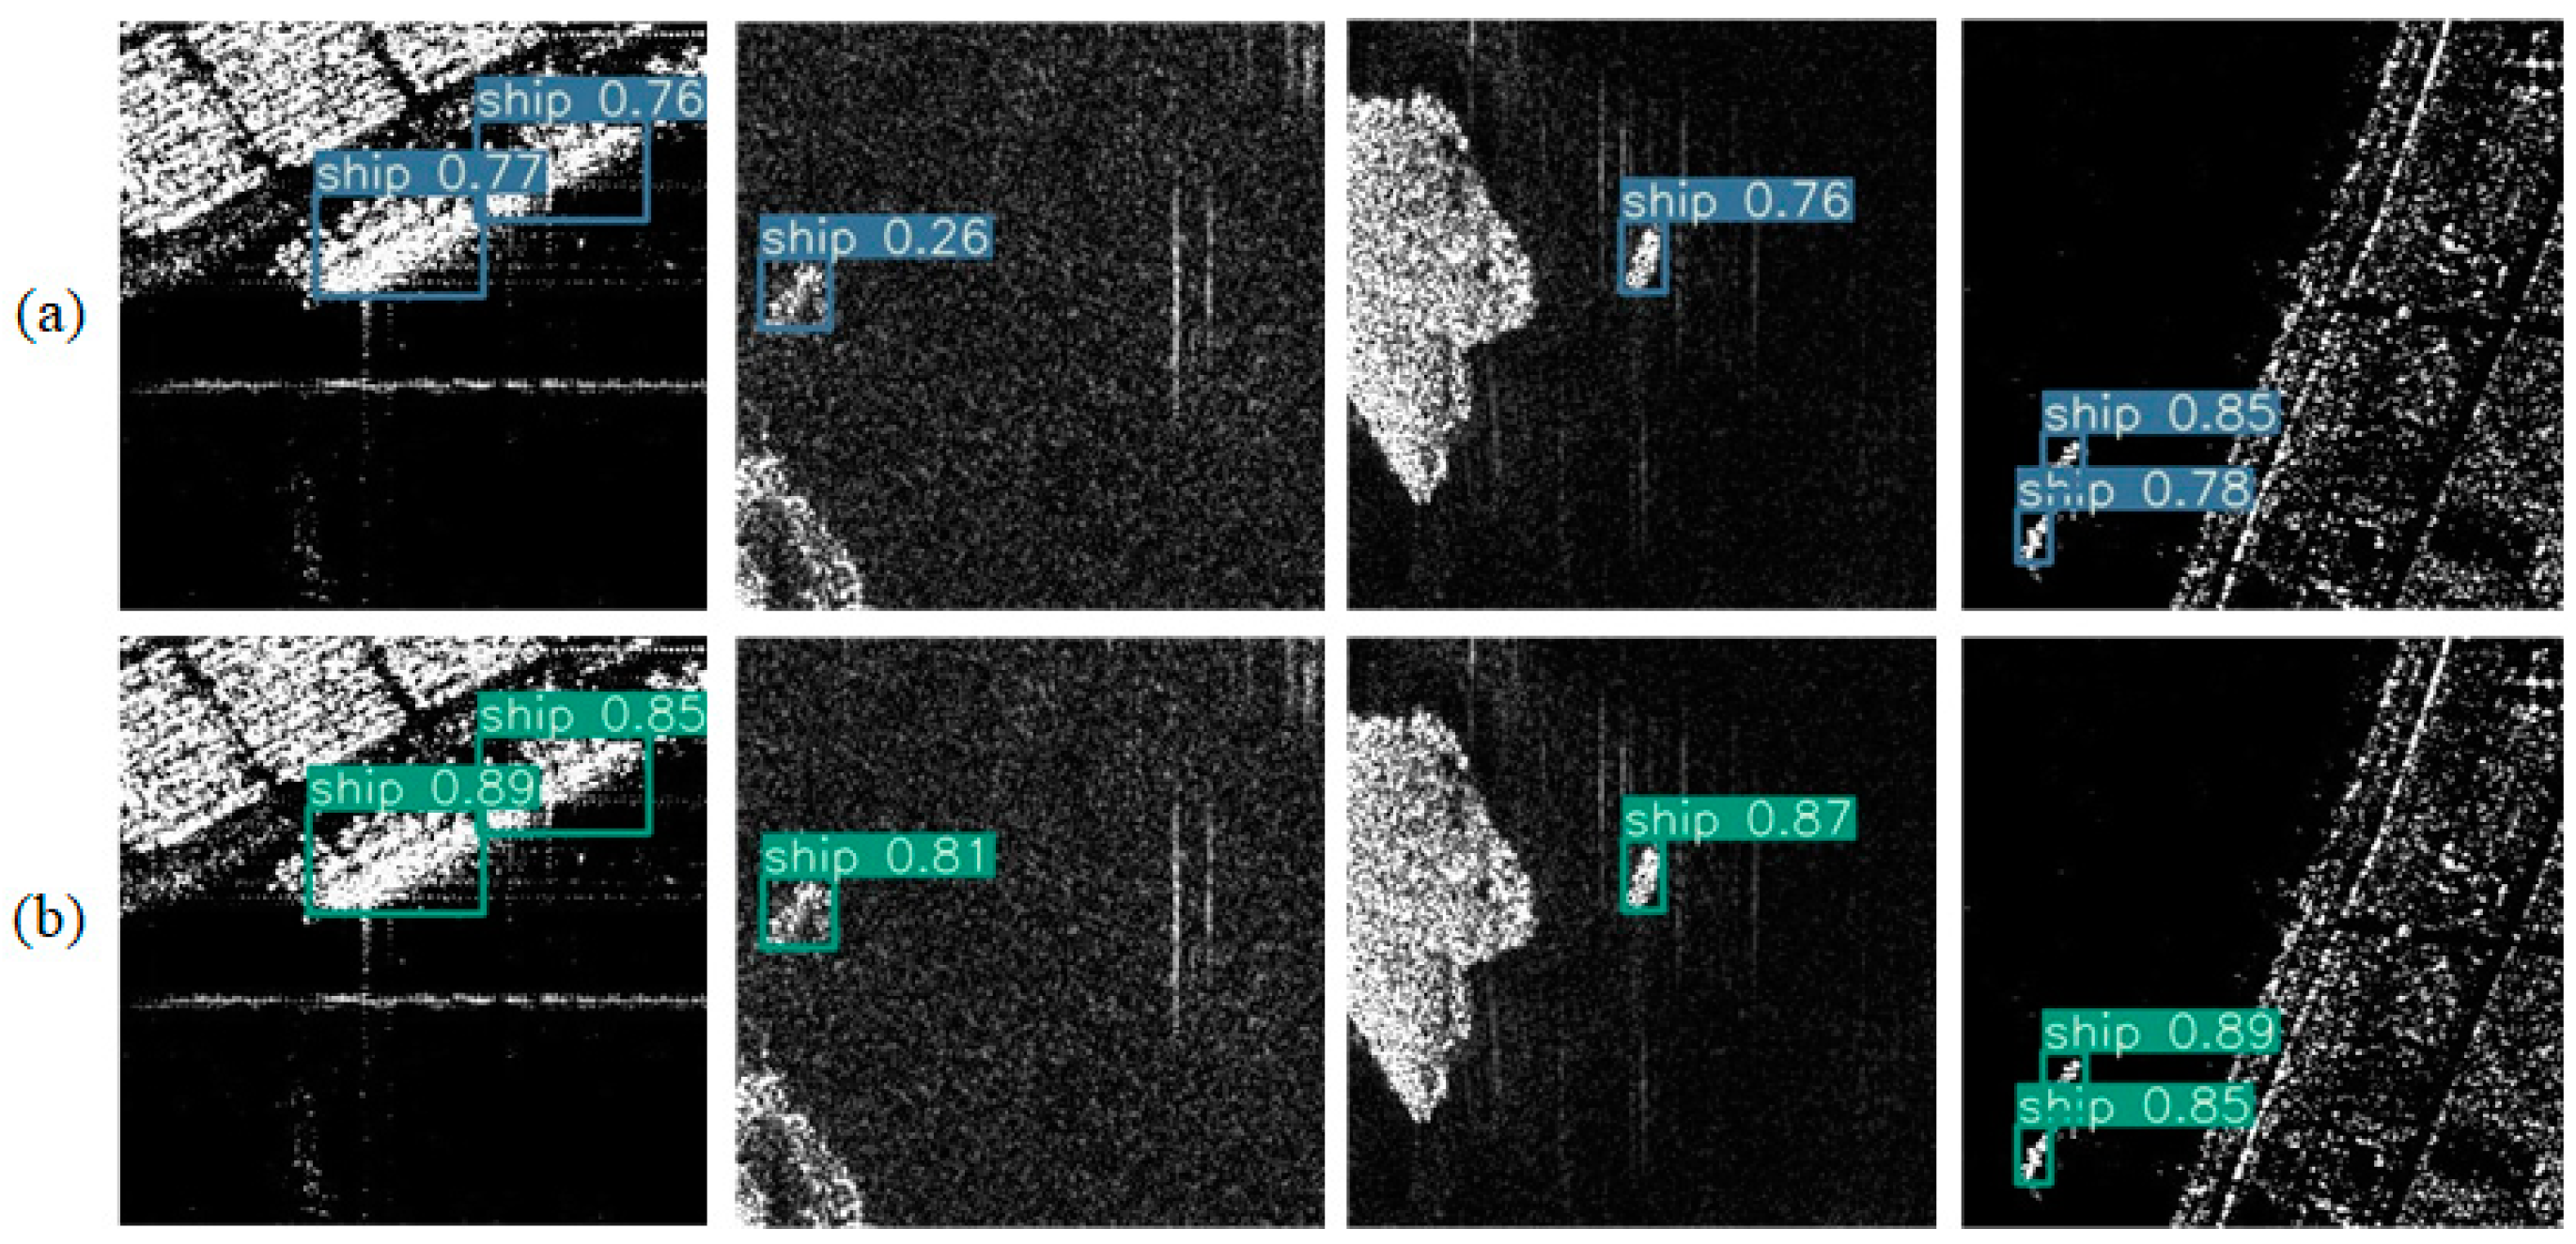
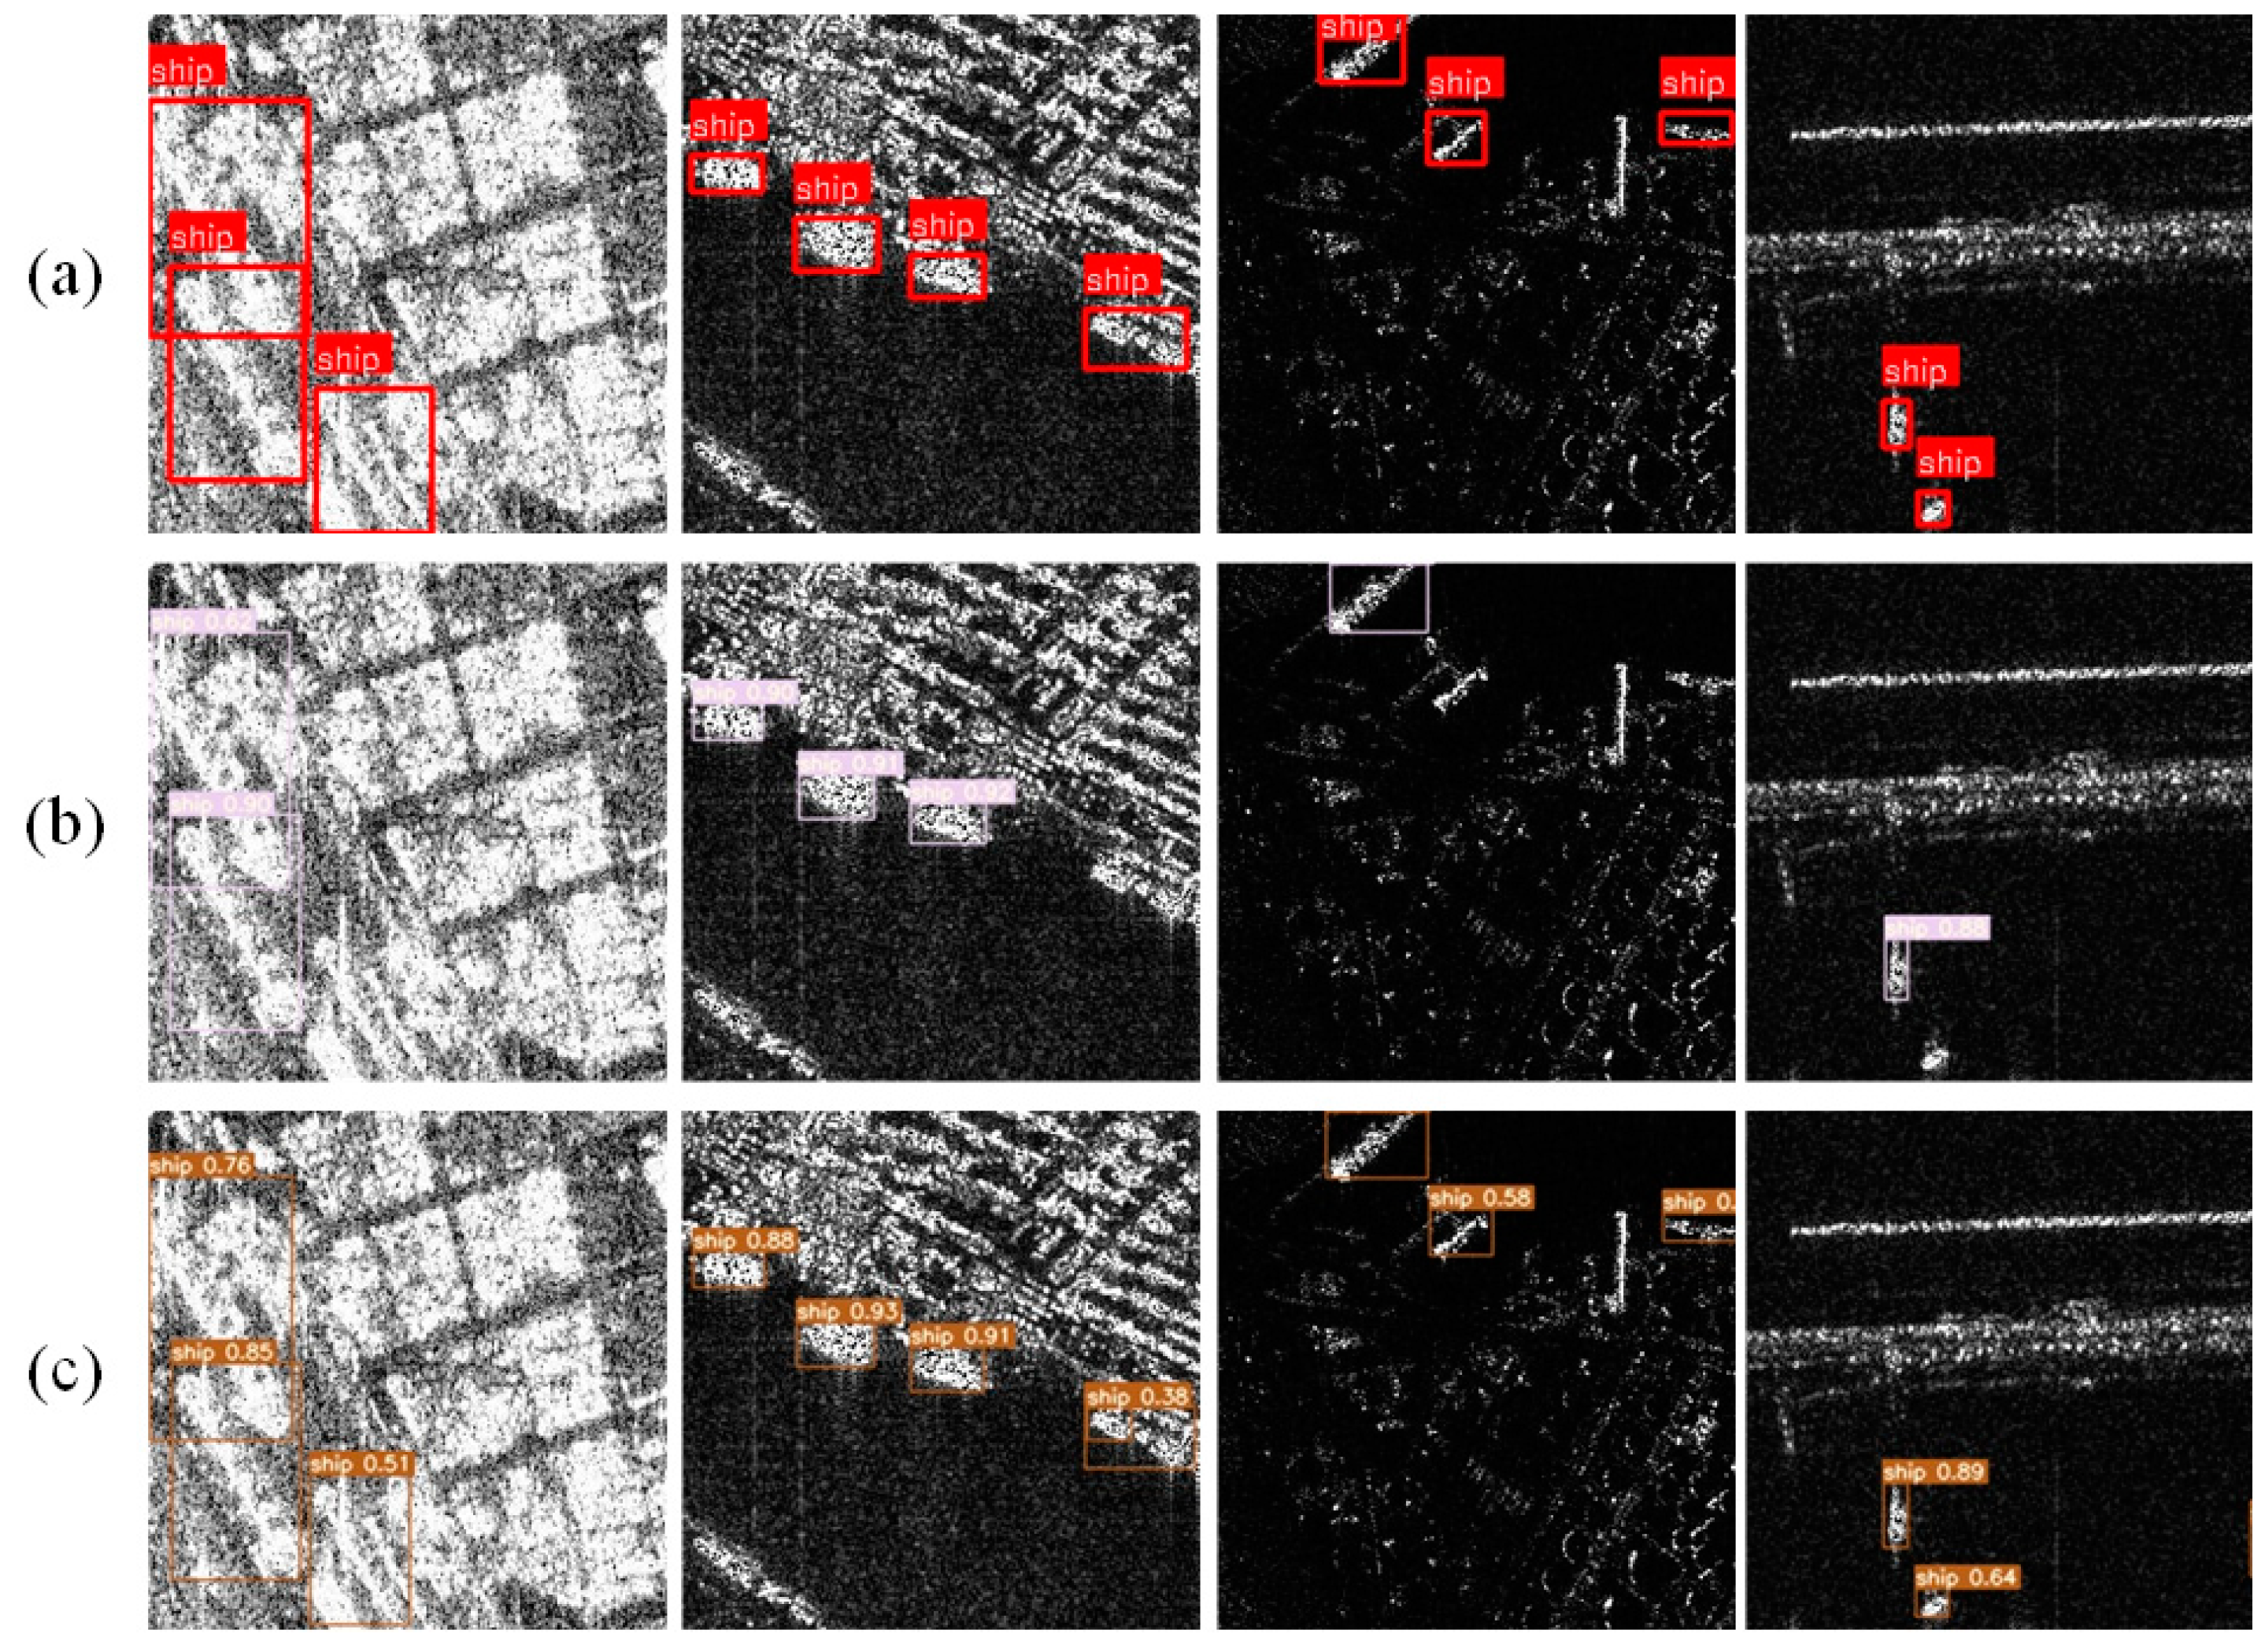
Figure 12 presents some representative SAR images with ship detection results. The rectangular boxes in the images indicate the predicted boundaries of the ships by the algorithm, and the numbers above the boxes represent the confidence level that the target is a ship. These results demonstrate the effectiveness of GAN data augmentation in ship detection tasks. It can be observed from the images that GAN data augmentation improved the detection performance for complex-background nearshore ship SAR images.
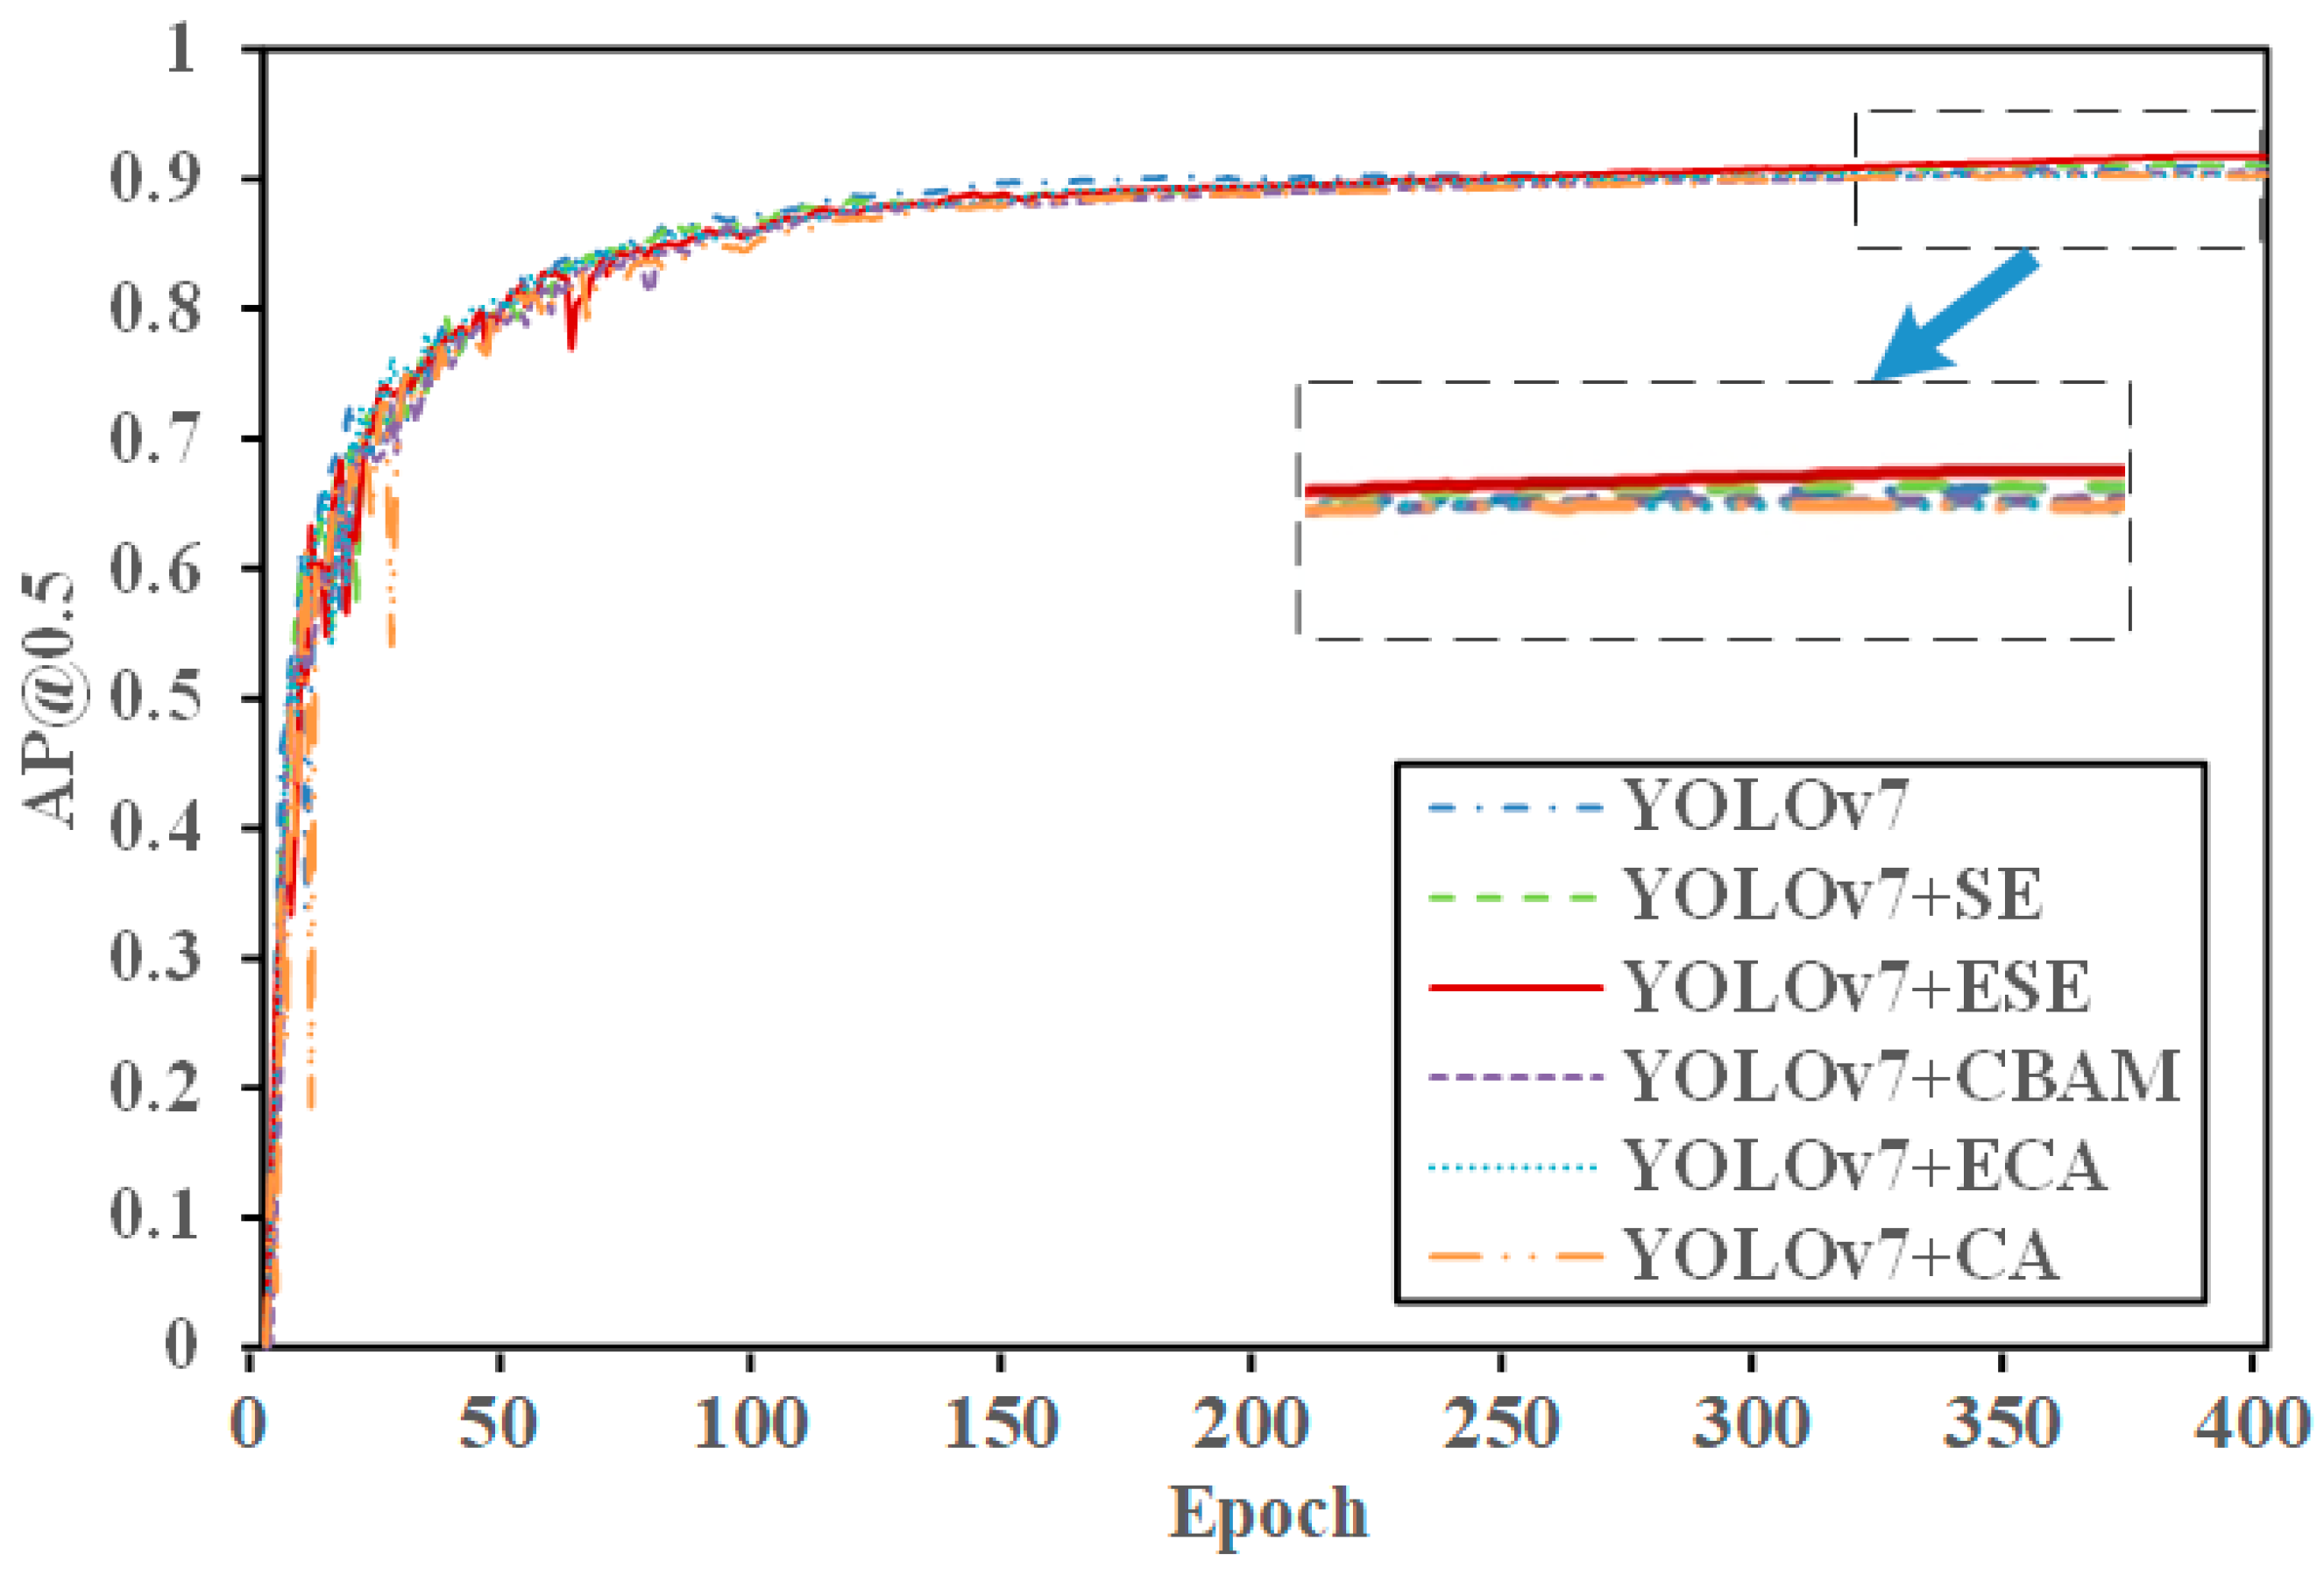
4.2. Experimental Results of Attention Mechanism Ablation
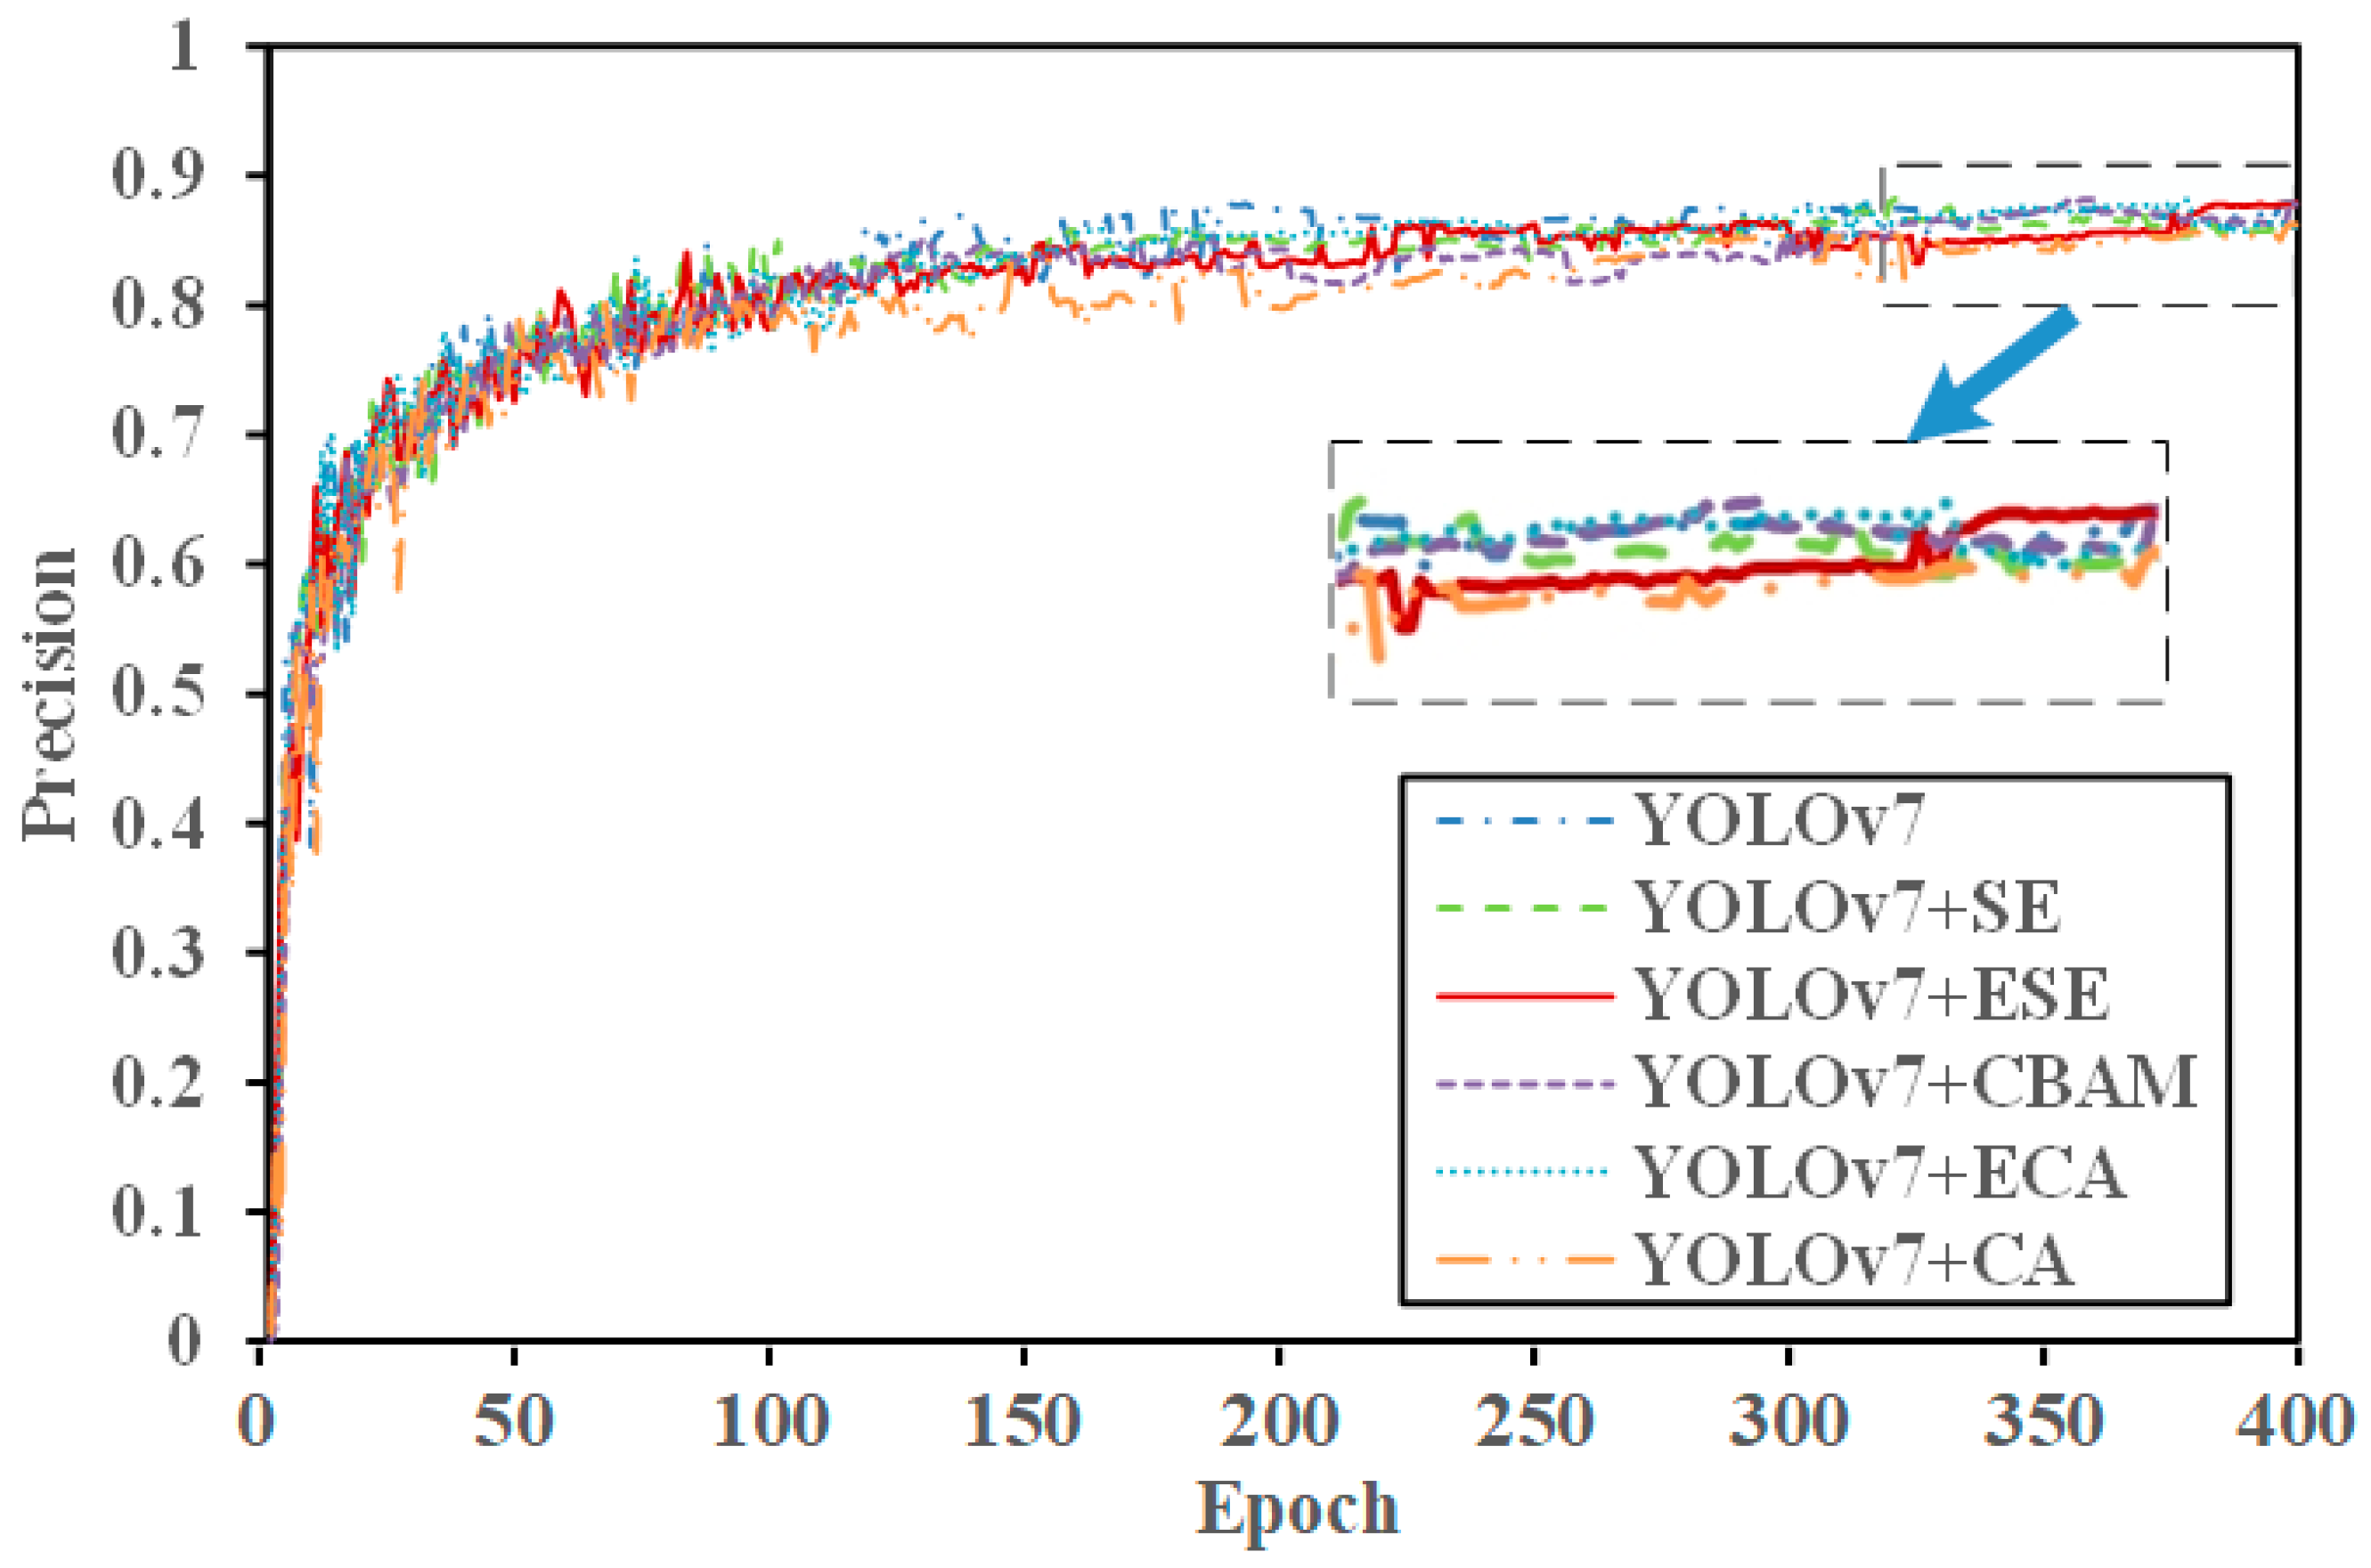
To evaluate the enhancement effects of the SE attention mechanism on the YOLOv7 network, we implemented improvements to the YOLOv7 network based on CBAM, CA, and ECA attention mechanisms, respectively. After training the modified networks, we assessed the performance of these three attention mechanisms. The specific experimental results are presented in
Table 2, which compares the performance of the original model with those incorporating CBAM, CA, SE, and ECA attention mechanisms.
From the experimental results, it is evident that after adding the CBAM and ECA attention mechanisms, although precision improved, the overall metrics showed a declining trend. Similarly, after adding the CA attention mechanism, although recall improved, the overall metrics also exhibited a decline, indicating poor results. Therefore, this demonstrated that the SE attention mechanism placed greater emphasis on the ship’s features. Despite a decrease in accuracy, recall improved by 2.47%, AP@0.5 increased by 0.09%, AP@0.5:0.95 increased by 0.14%, and the F1 score increased by 0.22%.
4.3. Experimental Results of ESE Network Ablation
The YOLOv7 + ESE and YOLOv7 + SE models were trained separately on the dataset, and the two attention mechanism-based models were then evaluated. The detailed experimental results are presented in
Table 3, which compares the performance of the YOLOv7 + ESE and YOLOv7 + SE models.
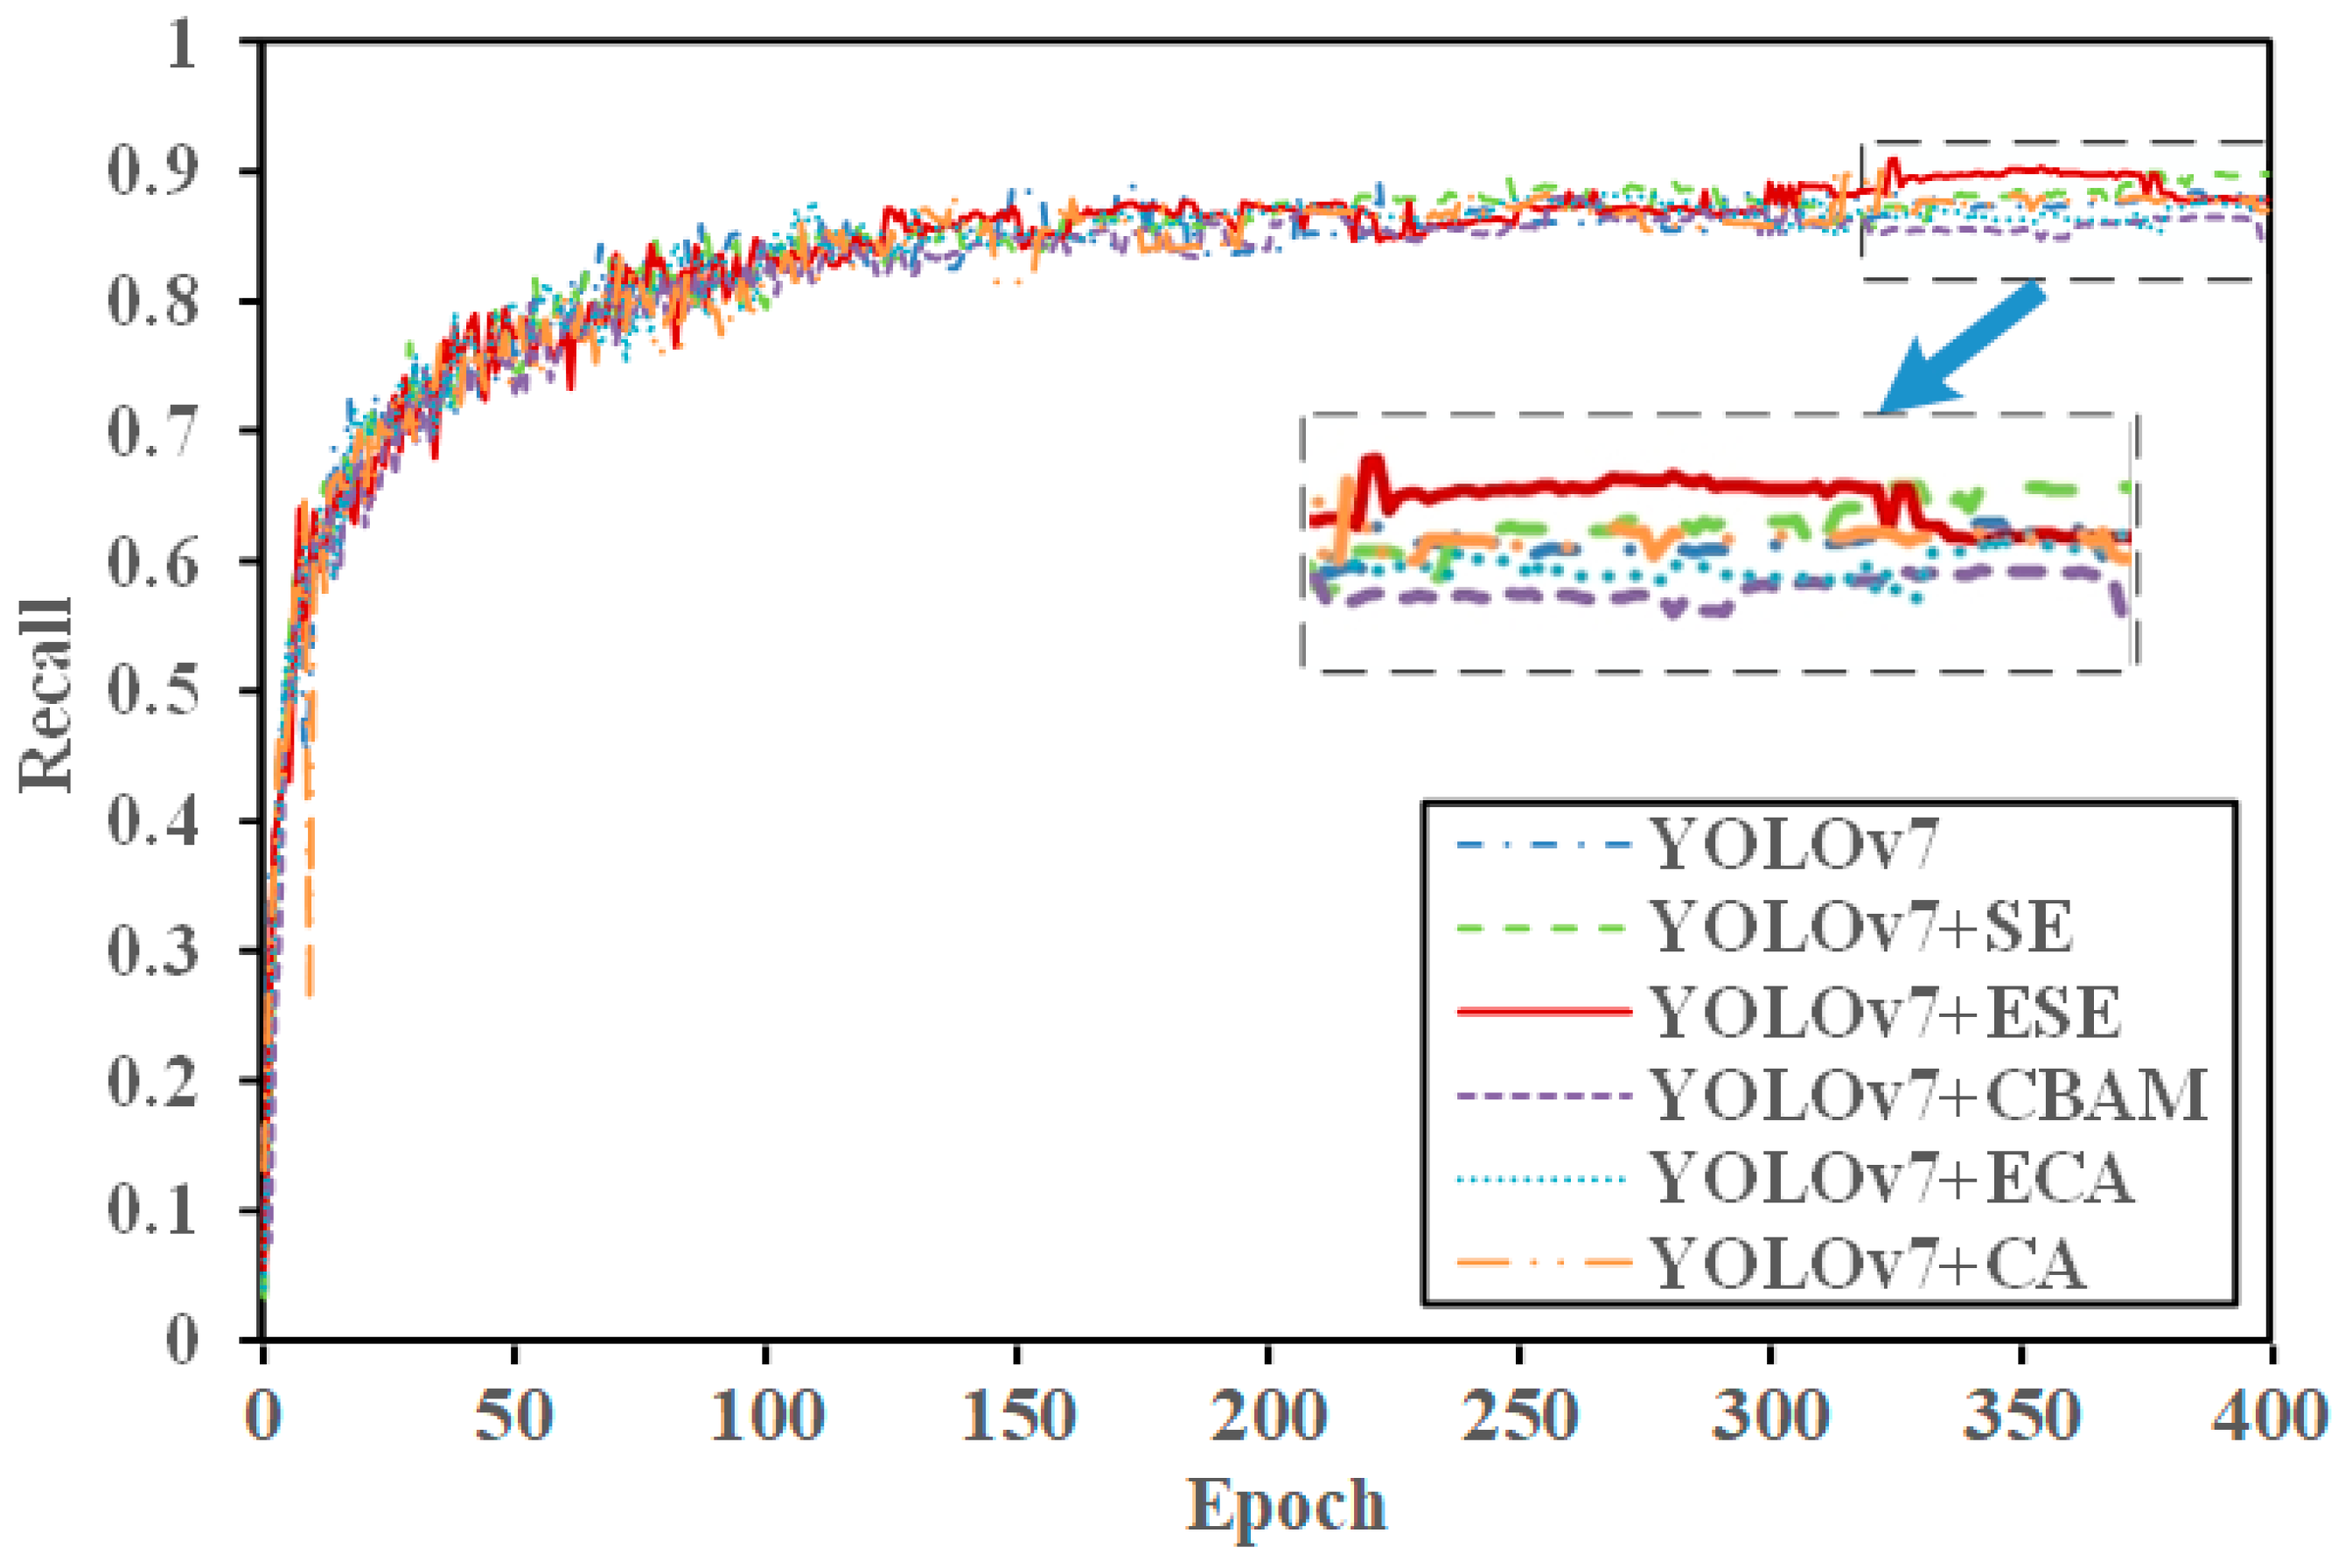
From the experimental results, it can be seen that the fusion of SE and ELAN modules improved the accuracy by 0.36%, recall rate by 0.52%, and average accuracy compared to the original YOLOv7 model’s AP@0.5 increase of 0.65%. This demonstrates that incorporating the SE attention mechanism effectively addressed complex nearshore scenarios, enhanced the rich features of nearshore ships in SAR images, and improved the detection of nearshore ships by capturing more ship-related information. As shown in
Figure 13,
Figure 14 and
Figure 15, the red solid line represents the YOLOv7 + ESE model. After integrating the SE module with the ELAN module, both precision and AP@0.5 improved.
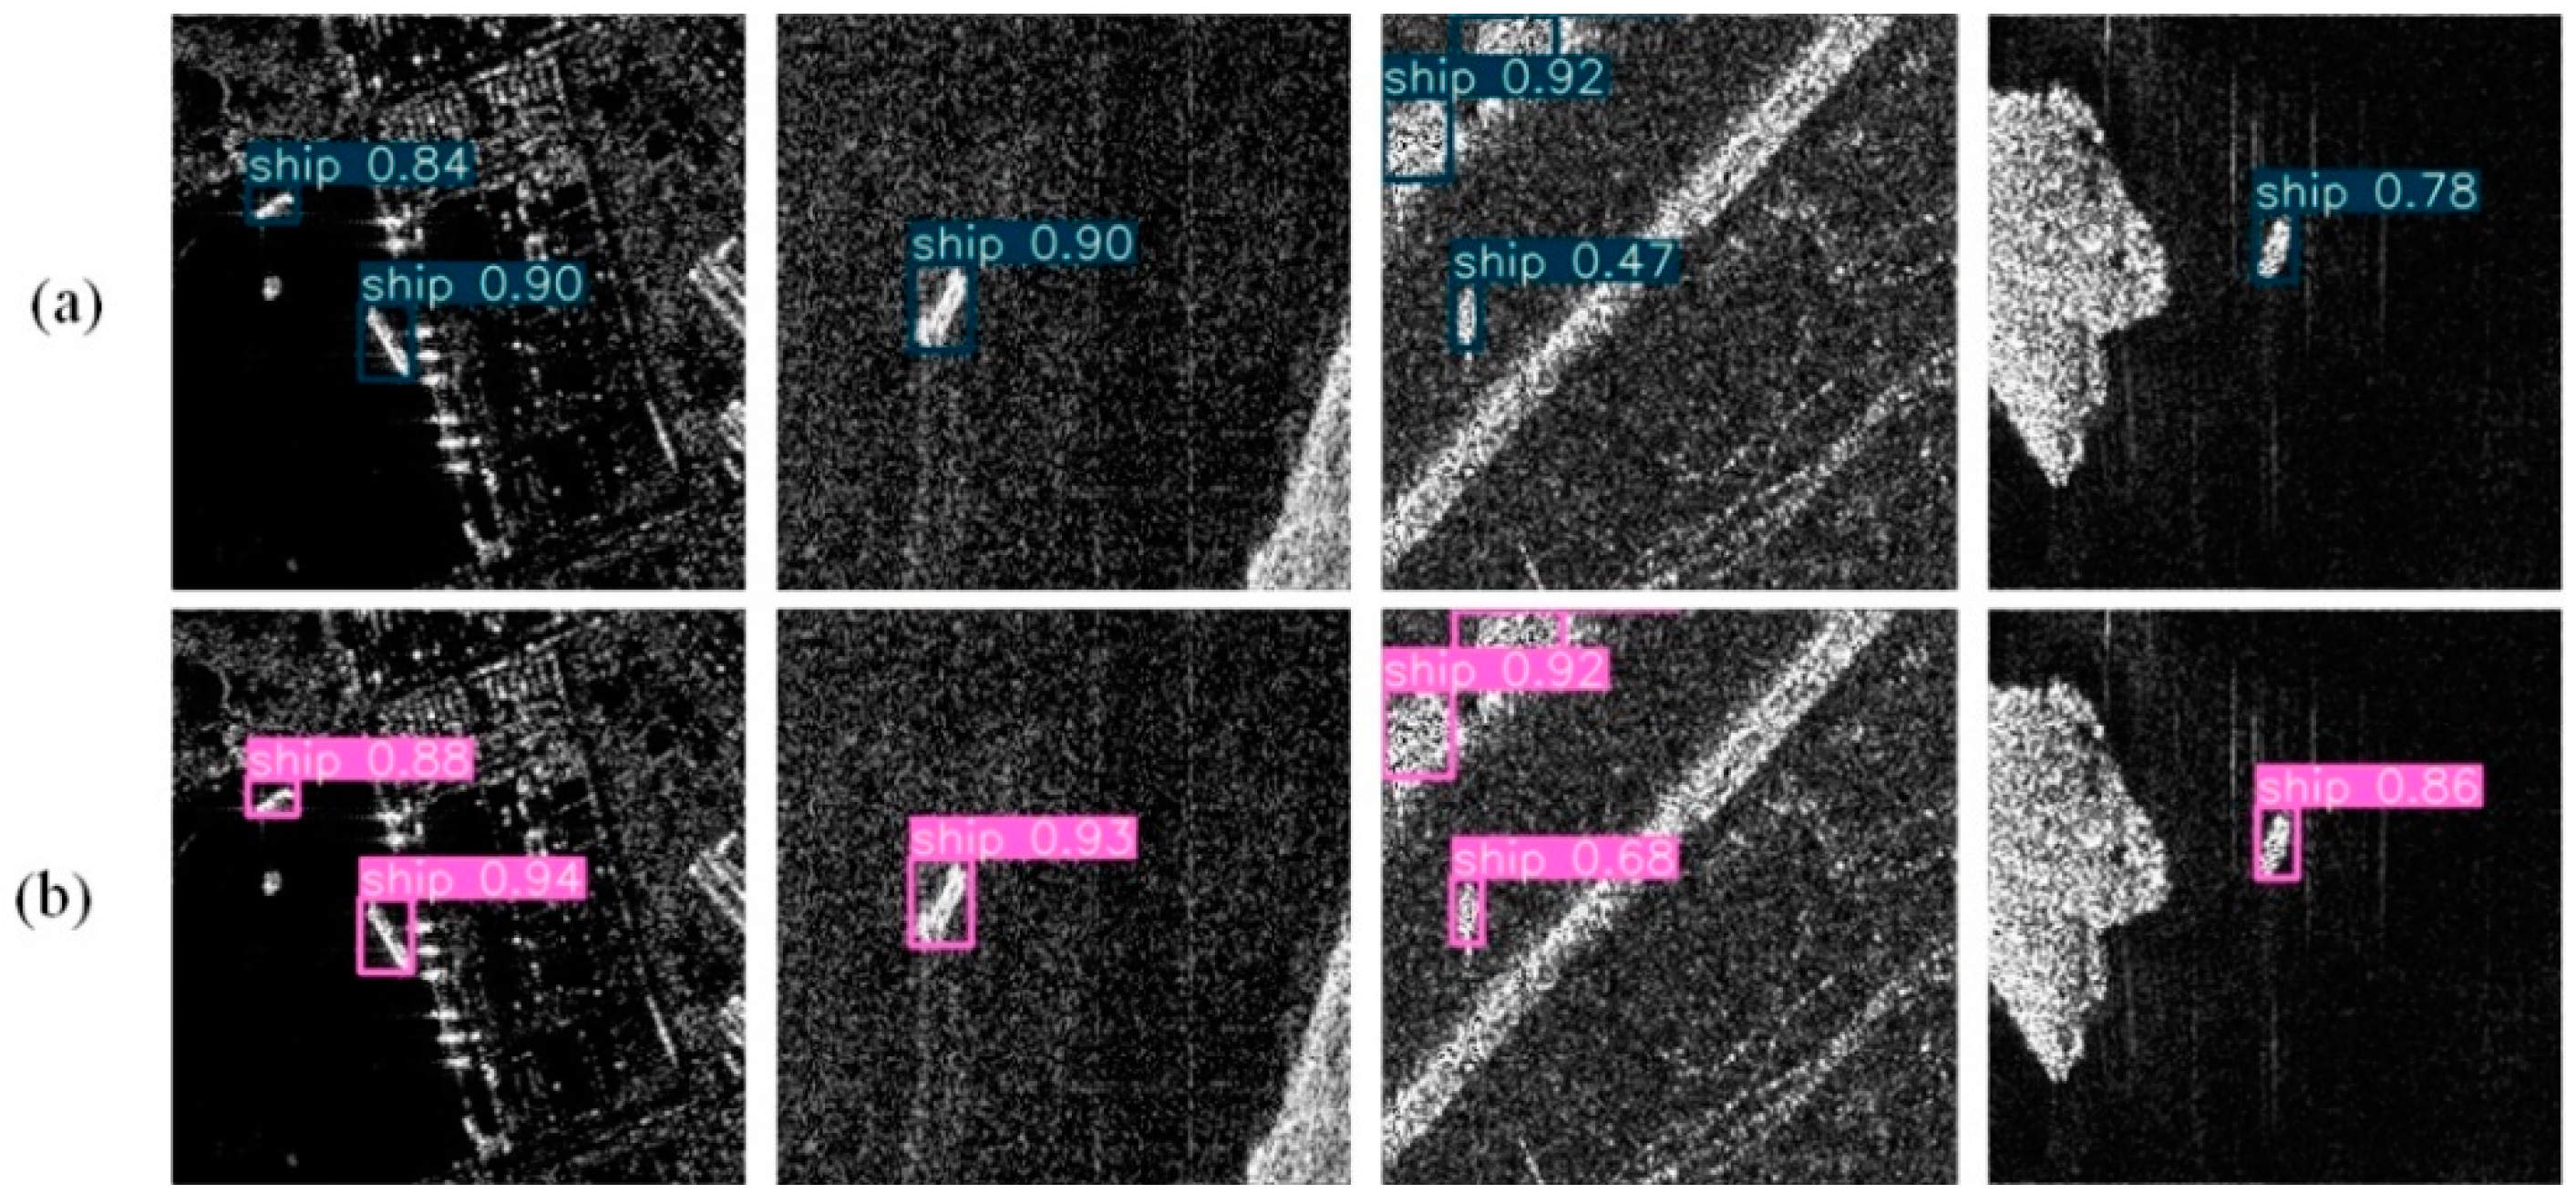
Figure 16 presents the detection results on the test set using the SE and ESE modules. Rectangular boxes indicate the ship boundaries predicted by the algorithm, and the numbers above the boxes represent the confidence levels of the detected ships. Compared to
Figure 4a and
Figure 16a, the confidence level improved in
Figure 4b and
Figure 16b. The YOLOv7 + ESE model demonstrated enhanced feature acquisition capabilities for nearshore ship SAR images with complex backgrounds. These results confirmed the effectiveness of the YOLOv7 + ESE model in ship detection tasks.
6. Conclusions
This paper addressed the challenges of acquiring SAR nearshore ship images, which are difficult to obtain and have a limited number of samples. By employing ConSinGAN single-image data generation technology, we augmented nearshore ship images to generate a large number of rich and effective nearshore ship data image samples. The training results of the algorithm validated the effectiveness of the generated images in nearshore ship image detection.
In response to the significant impact of densely packed nearshore ships and numerous man-made targets in terrestrial environments, such as buildings, on the detection of nearshore ship targets, we proposed an improved YOLOv7 algorithm based on the SE attention mechanism. We also verified the effectiveness of the algorithm and compared the performance differences of various attention mechanisms. Among them, the SE attention mechanism showed a more significant comprehensive performance advantage, increasing the object detection accuracy without affecting the model’s portability, which was more conducive to the model’s recognition of ship targets in complex nearshore backgrounds.


