1. Introduction
Decision support systems have evolved tremendously since their first creation, growing into very complex tools that can be applied to various situations. Simulation DSSs are designed to deal with large data sets and allow decision-makers to interact with complex, dynamic scenarios that mirror real-world ambiguities and incomplete data. Simulation-based DSSs, especially those using business games, provide a unique decision-making platform, testing of strategies, and skills acquisition in environments low in risk and high in fidelity. The general objective of this work, compared to the current state of the art of decision support systems used in the museum sector, is to provide a solution that does not simply offer the best decision, but rather the decision-making path to be followed in order to achieve a specific goal of museum governance.
Business games are becoming more central in training programs and strategic planning within corporations as a subset of simulation-based DSSs. Replicating competitive market dynamics, customer behaviors, and operational challenges allows the users of business games to experience and respond realistically to market pressures and organizational constraints. The scenario-based learning in business games is interactive and quite different from traditional decision-support methods that emphasize data analysis. Such an experiential approach is indispensable in the development of strategic insight and decision-making capabilities in environments mirroring the complexity of real-life situations [
1]. Organizations can train employees in decision-making, resource allocation, and risk analysis through participants’ engagement in realistic game-like situations, all while reducing the financial or operational risks associated with real-life market decisions [
2]. For instance, in business simulations, one has to analyze information, negotiate with various stakeholders, and make strategic decisions to meet set goals. Most simulations of this nature are usually complex, assuming characteristics of negotiation, competition, and cooperation, thus inducing players to assume an integrated approach toward their business strategies. By contrast, other business simulations replicate competitive markets in which participants manage resources, estimate market evolution, and react to competitors’ actions—recreating challenges resembling those found in real-life markets [
3]. Real-time interaction with simulated business cases leads to a better appreciation by decision-makers of the implications of their actions, not in isolation but in the context of a complex web of interrelated actions and reactions. This develops analytical thinking and adaptive approaches, preparing leaders to navigate nimbly through the ambiguities found in real markets [
4]. Besides skill-building at the individual level, business games within DSS frameworks also nurture teamwork and collaborative decision-making. To succeed in game-based scenarios, participants have to communicate effectively, reconcile diverse viewpoints, and align on strategic goals. These are invaluable elements within the organizational context, where alignment across departments and unified approaches to decision-making are critical to success. Team-based business games simulate intra- and inter-organizational dynamics and provide a way for practitioners to fine-tune both leadership and cooperative skills. Studies have shown that through simulated business challenges, team members can strengthen their ties, and improve their communication, and problem-solving capabilities [
5]. Moreover, using simulation models like Monte Carlo simulations, system dynamics, and agent-based models allows business games to sustainably achieve high levels of tailoring and reality. Monte Carlo simulations introduce variability and risk by using randomized inputs, allowing decision-makers to understand the range of possible outcomes and to better estimate risk [
6]. From a business games perspective with the present study, museum experts will have access to a simulator that allows them to assess in advance the impact of a given decision-making strategy before implementing it. This enables the identification of potential critical issues that may arise during the execution of the strategy. This solution considers the museum as a dynamic system that can be modelled through its critical success factors (CSFs). System dynamics’ models are instrumental in developing the feedback mechanisms and time lags involved in a business context simulation; hence, important for strategic planning and long-term decision-making [
7]. On the other hand, agent-based models mimic the behaviors of individual agents or entities within a system to gain insight into consumer behavior, competitive behavior, or employee responses under different scenarios [
8]. Hybridization of DSS models has increased over the past few years, and many systems now combine business games with simulation models like system dynamics and game theory. Combining all these elements makes for a rich decision-making platform where strategic interactions and competitive dynamics may be explored in great depth. For example, a hybrid DSS model might use the game theory to simulate strategic decisions of competitor firms, while system dynamics provides a wider time horizon perspective of these decisions’ implications on market stability or growth. Hybrid models can therefore be used for assessing complex situations and provide a holistic decision-making environment that can accommodate the micro-level complexities of local decisions and the macro-level consequences on the overall business ecosystem [
9]. In the design of these advanced DSS, a very important role is played by complexity theory. Drawing inspiration from thermodynamics and statistical mechanics, DSS models of late conceptualize systems as a collection of “micro-states” and “macro-states”, hence simplifying the great number of variables into manageable dimensions. This approach enhances computational efficiency and allows for nuanced simulations that remain relevant to real-world applications. In this respect, in a business simulation game modelling supply chain logistics, complexity theory contributes to the cascading effects of a single delay or bottleneck by showing players a realistic view of how micro-decisions can influence the larger system [
10,
11].
In other words, the confluence of simulation models and business games in DSS can be summed up to provide a framework through which decisions can be made effectively, skills developed, and strategies planned. Such systems not only mimic the dynamics of competitive markets but also provide comprehensive insights to decision-makers as to how various strategies may unfold over time. As DSS technology continues to advance, it will most certainly grow in importance for hybrid models and complex simulations to prepare business leaders for the multi-challenge facade in tomorrow’s market space. Consequently, it becomes clear that a long way has been traversed since the first publication on decision support systems (DSSs) was written by Keen and Scott Morton in 1978 [
12]. We now proceed to briefly review the history of DSSs. It is commonly acknowledged that the concept of DSSs was first presented by M.S. Scott Morton who presented a management decision system (MDS) [
13]; however, over the following years, this class of solution has gradually been developed into an interactive computer-based system aimed at supporting decision makers who deal with large amounts of data and information to solve unstructured problems, as well as situations involving uncertainty or incomplete information [
14]. As reported in [
15], a possible way of classifying DSSs is if they are one or all of the following: (i) document driven, (ii) model driven, (iii) communication driven, (iv) data driven, and (v) knowledge driven.
We will now shift our attention to the modelling that occurs within the umbrella of the complexity theory, which borrows heavily from thermodynamics and statistical mechanics. Just as in thermodynamics, the state variables such as entropy and energy are defined to represent many variable systems. Also, in [
11] and in this work, we will project states represented by several variables in a space with two variables, calling the first micro-states and the second macro-states of the system under study. While in [
11], the modelling aspects were commented on, in this work, we will examine algorithms to make the computation in the 2-dimensional space feasible but most of all, those for achieving the optimal solution in the end n-dimensional space, coinciding with the initial space of the problem, in the particular and tailored context of technology for museum and art environments driven by business games. As we will see in the present study, we will apply a strategy derived from optimization methodologies used in Industry 4.0. The technological solution first performs a dimensionality reduction in the decision space, followed by its re-expansion. As we will see, this approach methodologically reduces computational complexity, making the solution accessible on any desktop computer or laptop without a loss of generality.
Beyond the introductory section,
Section 2 presents a structured review of business games, with a particular focus on their application in museum contexts. This section explores their cognitive and strategic relevance, emphasizing how such simulations enhance decision-making skills and problem-solving abilities in museum management.
Section 3 delves into the identification and evaluation of critical success factors (CSFs), target functions, states, and scenarios that define the dynamics of business games within museums. This section not only categorizes these elements but also discusses their impact on cognitive load, strategic foresight, and adaptive decision-making in complex environments.
Section 4 explains the fundamental mechanism of the platform designed for business games, providing insights into its interactive features and the way it facilitates experiential learning. It highlights how decision-makers can cognitively engage with different strategies and dynamically adjust their approach based on simulated feedback loops.
Section 5 presents several practical use cases, demonstrating the application of the proposed framework in real-world museum management scenarios. These case studies illustrate how the system supports data-driven decision-making, mitigates cognitive biases, and optimizes resource allocation through strategic experimentation. Finally,
Section 6 concludes by discussing the implications of this research and outlining future prospects, including potential enhancements, scalability considerations, and interdisciplinary applications in broader cultural, applied context, and educational domains.
2. A Brief Analysis of Business Games and Business Games in the Museum Context
In research and academic studies concerning museums, archaeology, and the arts, business games serve as vital instruments for connecting theoretical knowledge with practical abilities in the management of cultural heritage and artistic organizations. Both as teaching tools and research methods, business games allow students and researchers to experience complex competitive situations by simulating real problems typical of cultural institutions. These may range from decision-making ability improvement within the management of exhibitions to the study of stakeholder behavior in unclear or uncertain contexts and the assessment of resource allocation strategies in complex networks of museums, archaeological sites, or cultural centers [
16,
17]. What are the basic constituents of business games in the fields of cultural heritage and the arts? Business games, especially for the cultural and artistic sectors, create a simulated setting that incorporates cultural management approaches, conservation strategies, and optimization models in giving the players an exciting experience. A basic characteristic of such games is their ability to mimic dynamic and variable situations, allowing players to practice real-time decision making in situations that may reflect economic volatility, changing visitor demographics, or uncertain funding streams. Immediate feedback and high variability—enabled through detailed analysis of adaptive decision-making—enable the exploration of non-linear strategies including iterative planning and risk-based methodologies [
18]. In the context of research, business games in the cultural heritage sector provide an excellent tool to test the effectiveness of management policies, visitor attraction measures, and funding allocation under controlled and reproducible simulations. They give researchers a chance to test theories extracted from cultural management, behavioral economics, and institutional theory in real-life environments but ones that are systematically structured to give valuable insights for understanding social interactions, visitor behaviors, and phenomena emerging in complex systems, which are hard to seize otherwise [
19,
20].
What are possible categories of business games in the fields of cultural heritage and the arts? Business games specifically designed for museums, archaeological, and art fields can be structured in various categories, each for different educational and research purposes. The main categories are listed below. Competitive business games about cultural institutions: These simulate competitive environments where cultural institutions, such as museums and galleries, compete for funds, visitors, or partners. Focusing on resource management, marketing strategies, and program innovation, competitive games involve participants in making fast, strategic decisions under conditions of uncertainty while adapting to changes, hence they are ideal for the study of responsiveness and adaptability underfunding or resource constraints [
21]. Cooperative Heritage Preservation Business Games: In this respect, cooperative games permit institutions—museums, archives, and archaeological sites—to cooperate for a common conservation or education goal. Players engage in joint activities, share resources, and tune budget allocations to improve collective outcomes, such as optimum preservation methods or develop joint exhibitions. These types of games are particularly appropriate for analyzing cooperative management of resources, stakeholder involvement, and partnership building between institutions [
22,
23]. Managerial business simulations, in the context of operations in museum and site settings, are performed to mimic the internal functioning of a cultural institution. Participants in these simulations are assigned roles—such as curatorial, marketing, financial management, and visitors’ services—that must cooperate for the better performance of the institution. The simulation demonstrates valuable insights into internal decision-making processes; for example, people show the necessity of departments coordinating their actions to achieve common strategic objectives, such as raising visitor engagement and effective resource utilization [
24]. Financial Simulation Games for Cultural Funding and Grants: These games specifically address financial management in the cultural sector, with a special emphasis on grant writing, budgeting, and funding allocation. Players are challenged to optimize the management of financial resources while responding to project needs, expectations of stakeholders, and regulatory frameworks. These games fulfil the purpose of testing financial models unique to cultural institutions and are usually observing decision-making under conditions of restricted or unstable funding; the result may provide intelligence on effective funding strategies and risk management [
25,
26]. Scenario and crisis simulation games for cultural institutions simulate crises or unexpected events impacting these organizations, such as sudden decreases in funding, environmental hazards to heritage, or changing regulatory environments. Players must develop plans for crisis management, plan for resilience, and be able to respond quickly to changing conditions. Often used to prepare cultural managers to work in environments with high levels of uncertainty, the games give researchers the ability to explore strategic adaptability and the effectiveness of institutional responses to crises [
27]. Regarding the applications and implications, it can be asserted that within academic environments, business games serve as a link connecting theoretical comprehension with practical competencies. This allows students to implement concepts derived from cultural management, finance, and organizational theory in a simulated context that is both controlled and realistic. Such games promote an experiential learning methodology, allowing students to test ideas and strategies within a secure, low risk setting [
28]. In terms of research, business games in the cultural and artistic fields are very good platforms for studying complex institutional behaviors and empirically testing management theories. They contribute significantly to the innovation of cultural and heritage studies [
29]. The business games of museums, archaeology, and the arts provide not only educational tools but also highly structured simulation environments that allow for conducting research and testing. In so far as they can reproduce realistic dynamics, in-depth analyses of decision processes, or usher experiential learning, they do indeed become one of the most vital focuses for academics and professionals who want to study complex problems related to cultural management in a scientifically rigorous and controlled environment. The proposed business game solution is based on a combination of an advanced DSS model developed by the authors in previous works, as in [
11], and its consequential works as described in [
14,
30]. This DSS here is adapted, finalized, and contextualized by the authors to build a specific advanced solution to the museum context. A systematic classification specifically for museums has not been formally established. This research aims to fill that gap by adapting DSS technologies in [
11,
30] to simulations and in particular to business game typologies for the museum context. The educational benefits of business games are widely documented across various fields. A reference overview of gamification is in [
31].
3. Analysis and Selection of Critical Success Factors, Target Functions, States, and Scenarios for Business Games in a Museum Context
After the previous background section, this section focuses on key parameters in the context of a business game within the museum sector. Here, we find a possible comprehensive set of parameters that we can use for our technological solution as base for the platform for business games: (1) type and number of digitized museum assets, (2) cost and access methods to content, (3) user experience and immersive technologies, (4) structure of the technological platform, (5) marketing and audience acquisition strategies, (6) management of financial and economic resources, (7) community interaction and engagement, (8) partnerships with other institutions or cultural organizations, (9) audience loyalty and conversion, (10) training and skills of museum staff, (11) technological infrastructure and cybersecurity, (12) data analysis and success metrics, (13) monetization through virtual merchandising, (14) inclusivity and accessibility policies, (15) environmental and digital sustainability, (16) legal regulations and copyright, (17) content interactivity, (18) experience immersiveness, (19) content variability and adaptability, (20) platform usability, and (21) personalization of user experience. Based on the above parameter analysis, we identified seven predominant independent parameters as follows. This subsection emphasizes a subset of the above parameters, or those derivable from them, with a specific focus on the critical success factors (named CSFs) of a DSS for a business game based on the DSS solution presented in [
11], customized and evolved for the museum and art context.
CSF1: Content variability and adaptability. The platform has the ability to customize the paths and recommend user content based on their preferences. This element is important so that the users do not lose interest in the platform and the experience is better.
CSF2: Experience immersiveness. It comprises augmented, virtual, and other technologies that give an extra immersive feel. This element is very important when it comes to providing an interesting experience with the museum other than just looking at the existing static works.
CSF3: Platform usability. The level of intuitiveness and general ease of use of the platform for virtually all user types. An unnavigable interface may put users off, and therefore usability is critical for the accessibility and success of the platform.
CSF4: Content interactivity. Actual engagement with the works (watching details, answering quizzes, and taking virtual tours) raises the level of user engagement. Increased interactivity enhances the educational and engagement value of the experience.
CSF5: Classification and quantity of digital museum assets. The diversity and volume of digitized works are essential for engaging a varied audience. A diverse portfolio enhances perceived value and maintains continuous interest over time.
CSF6: Marketing and Audience commissions strategies. Ways and methods of recruiting new users through advertisements, social media, and by exercising the influence of cultural figures through marketing campaigns. This element is important to increase the traffic to the quiet or enlarge the number of users.
CSF7: Personalization of user experience. The provided personalization of the content and paths according to the user’s preference is a platform feature. It improves the satisfaction of the user and supports loyalty.
The selection of these seven parameters was intended to take into consideration a wide range and variety of the basic elements of virtual accessibility to the assets of the museum. Although a general analysis could include all 21 parameters identified above, this would go beyond the objectives of the present study. In fact, this study aims to explore museum valorization concerning enabling IT technologies, digital content, and, more generally, personalization and usability. Evidently, other choices with different objectives from the present study are possible. To ensure a more objective assignment of the intensities of the various critical success factors (CSFs), rather than expressing a percentage value—which would not allow for a homogeneous and objective comparison of two similar but slightly different results, such as 53% and 57%—we have chosen to use a five-level discretization system as explained below. They stem from the following: (i) user experience, such as immersiveness, usability, or interactivity, which guarantees an effective and seamless experience that not only attracts users but retains them as well; (ii) museum offering—what types and what quantity of assets are on offer? This is extremely important in maintaining interest and cultural equity; (iii) adaptation to individual needs such as personalization or versatility, which enhances the relevance or context of the experience, making it adequate for each user and therefore, more engaging and distinctive in style or nature; (iv) marketing and promotion which enables the museum to broaden its audience base, enhance its visibility and diversifying its income streams. Therefore, this selection exemplifies the equilibrium between technology, user experience, and strategic management which are all essential for the success of a business game in virtual environments of access to online museum assets.
The present section represents a different application instance of the DSS described in [
11,
30]. While the aforementioned studies provide a detailed description of the model (e.g., [
11]) and the algorithms (e.g., [
30]), this work presents a distinct application instance both conceptually—as a business game use case—and in terms of the application domain, specifically the museum context. It also includes model customizations and critical success factors (CSFs) tailored to the museum domain, which can be easily extended to the artistic, cultural, and archaeological sectors. Let us consider the space of the problem to solve with the DSS as a seven-dimensional space. For more compactness, we call and enumerate the parameters of decision CSFs (critical success factors): X1—CSF 1, X2—CSF 2, X3—CSF 3, X4—CSF 4, X5—CSF 5, X6—CSF 6, and X7—CSF 7. These CSFs represent the independent variables of the computational model; therefore, their values will be collected or emulated for analysis and study. The CSFs can take on six distinct values, namely Xi = 0,1,2,3,4,5 with i = 1, …, 7; these values are fixed by the expert or the learner during the work with the DSS for making the business game. The values assumed by the CSFs will have the following meanings, providing the following semantic modelling values: 0—not acquired/not emulated, 1—low, 2—low-medium, 3—medium or normal, 4—medium-high, and 5—high. The n-tuple (X1, X2, X3, X4, X5, X6, X7,) precisely represents the state of the system at a given time. The value 3 corresponds to a situation where the considered parameter is balanced and leads to equilibrium laws and conservation of dynamic systems. Values 2 and 4, on the other hand, represent a system with alteration and energy dissipation and a relative increase in its entropy, the first with implosive trends (i.e., 2) and the second (i.e., 4) with explosive trends. Finally, values 1 and 5 represent systems characterized by parameters far from equilibrium, strongly anharmonic, and dissipative, and thus with high entropy, the first (i.e., 1) being close to implosion/freezing and the second (i.e., 5) being close to explosion. Zero indicates a lack of information; therefore, the proposed method and the implemented computational system will manage partial and incomplete information through target functions by formulating hypotheses for statistical inference to support decisions. As represented in [
30], the system here proposed is very general and it can be applied in different contexts just by defining different system target functions (STFs) and by choosing domain-specific critical success factors (CSFs). In [
30], the solution was inspired by a specific need, i.e., the monitoring and supervision of a specific area of interest like a Province or a Municipality to create a decision support system for physical security, the analysis of potential criminogenic phenomena, and the enhancement of the urban territory. Here, we consider the engine for the educative question, that is for realizing business games in a museum context. In fact, in this specific application of the methodology that we will analyze in this work, the 7 CFS are those indicated above especially selected for museums’ management and their valorization, respectively. Moreover, as will be discussed later, the uniqueness of this work and its distinction from other solutions lie in the engine’s capacity to deliver not only individual decisions or goals but importantly, entire sequences of decisions. This is achieved by creating a decision path, formed by integrating multiple micro-paths, which outline the steps needed to reach the desired target.
The strategy that we will follow is as follows: (i) to start from a decision space in 7-discrete dimensions, (ii) move to a 2-dimensional discrete space (i.e., energy–entropy space), where we will build degenerate decision paths, with lower complexity than the initial space, (iii) to come back to the original 7-dimensional space to also solve the degenerative question and by obtaining the optimal solution in the initial 7-dimensional space of the business game/problem. Thanks to the previous seven parameters, i.e., CSFs, for describing the museum context let us define a function
that has the target of translating the problem from the 7-dimensional micro-state variables
to the 2-dimensional micro-state variables E, S. The function f is defined as follows in (1):
where E represents the internal energy of the system represented by the considered state; S is its entropy;
is the median; and the coefficients
are suitable normalization coefficients defined as follows in (2):
with the
activation parameter (or relative weight) and such that
∈ [0,1] ⊂ R. By taking into account that
it follows that S = [0,12] ⊂
, E = [7,35] ⊂
. From a mathematical standpoint, the number of possible results of the business game is very high, and the number of micro-state transitions is even higher. This number is expressed in terms of permutations with repetition of length 7 of the elements from the set {1,2,3,4,5}. In other words, the total number of possible micro-states, corresponding to 7-tupla of 7--
is 78,125 =
. For completeness of reasoning, it is useful to observe that if we jointly consider the 78,125 micro-states with their distribution and the 6.665 × 10
24 trajectories produced by the unit of decision-making strategies, it can be deduced, after some calculations, that the system in its entirety, to suggest the optimal operational strategy in the business game concerning the user’s requests, can manage a total number of cases (micro-trajectories) equal to 1.18 × 10
311 That is a big number, thanks to which we understand the strength of this solution for business games in the museum sector, not only for educational or training purposes but also for research objectives or real-world applications in the management of museum or artistic institutions.
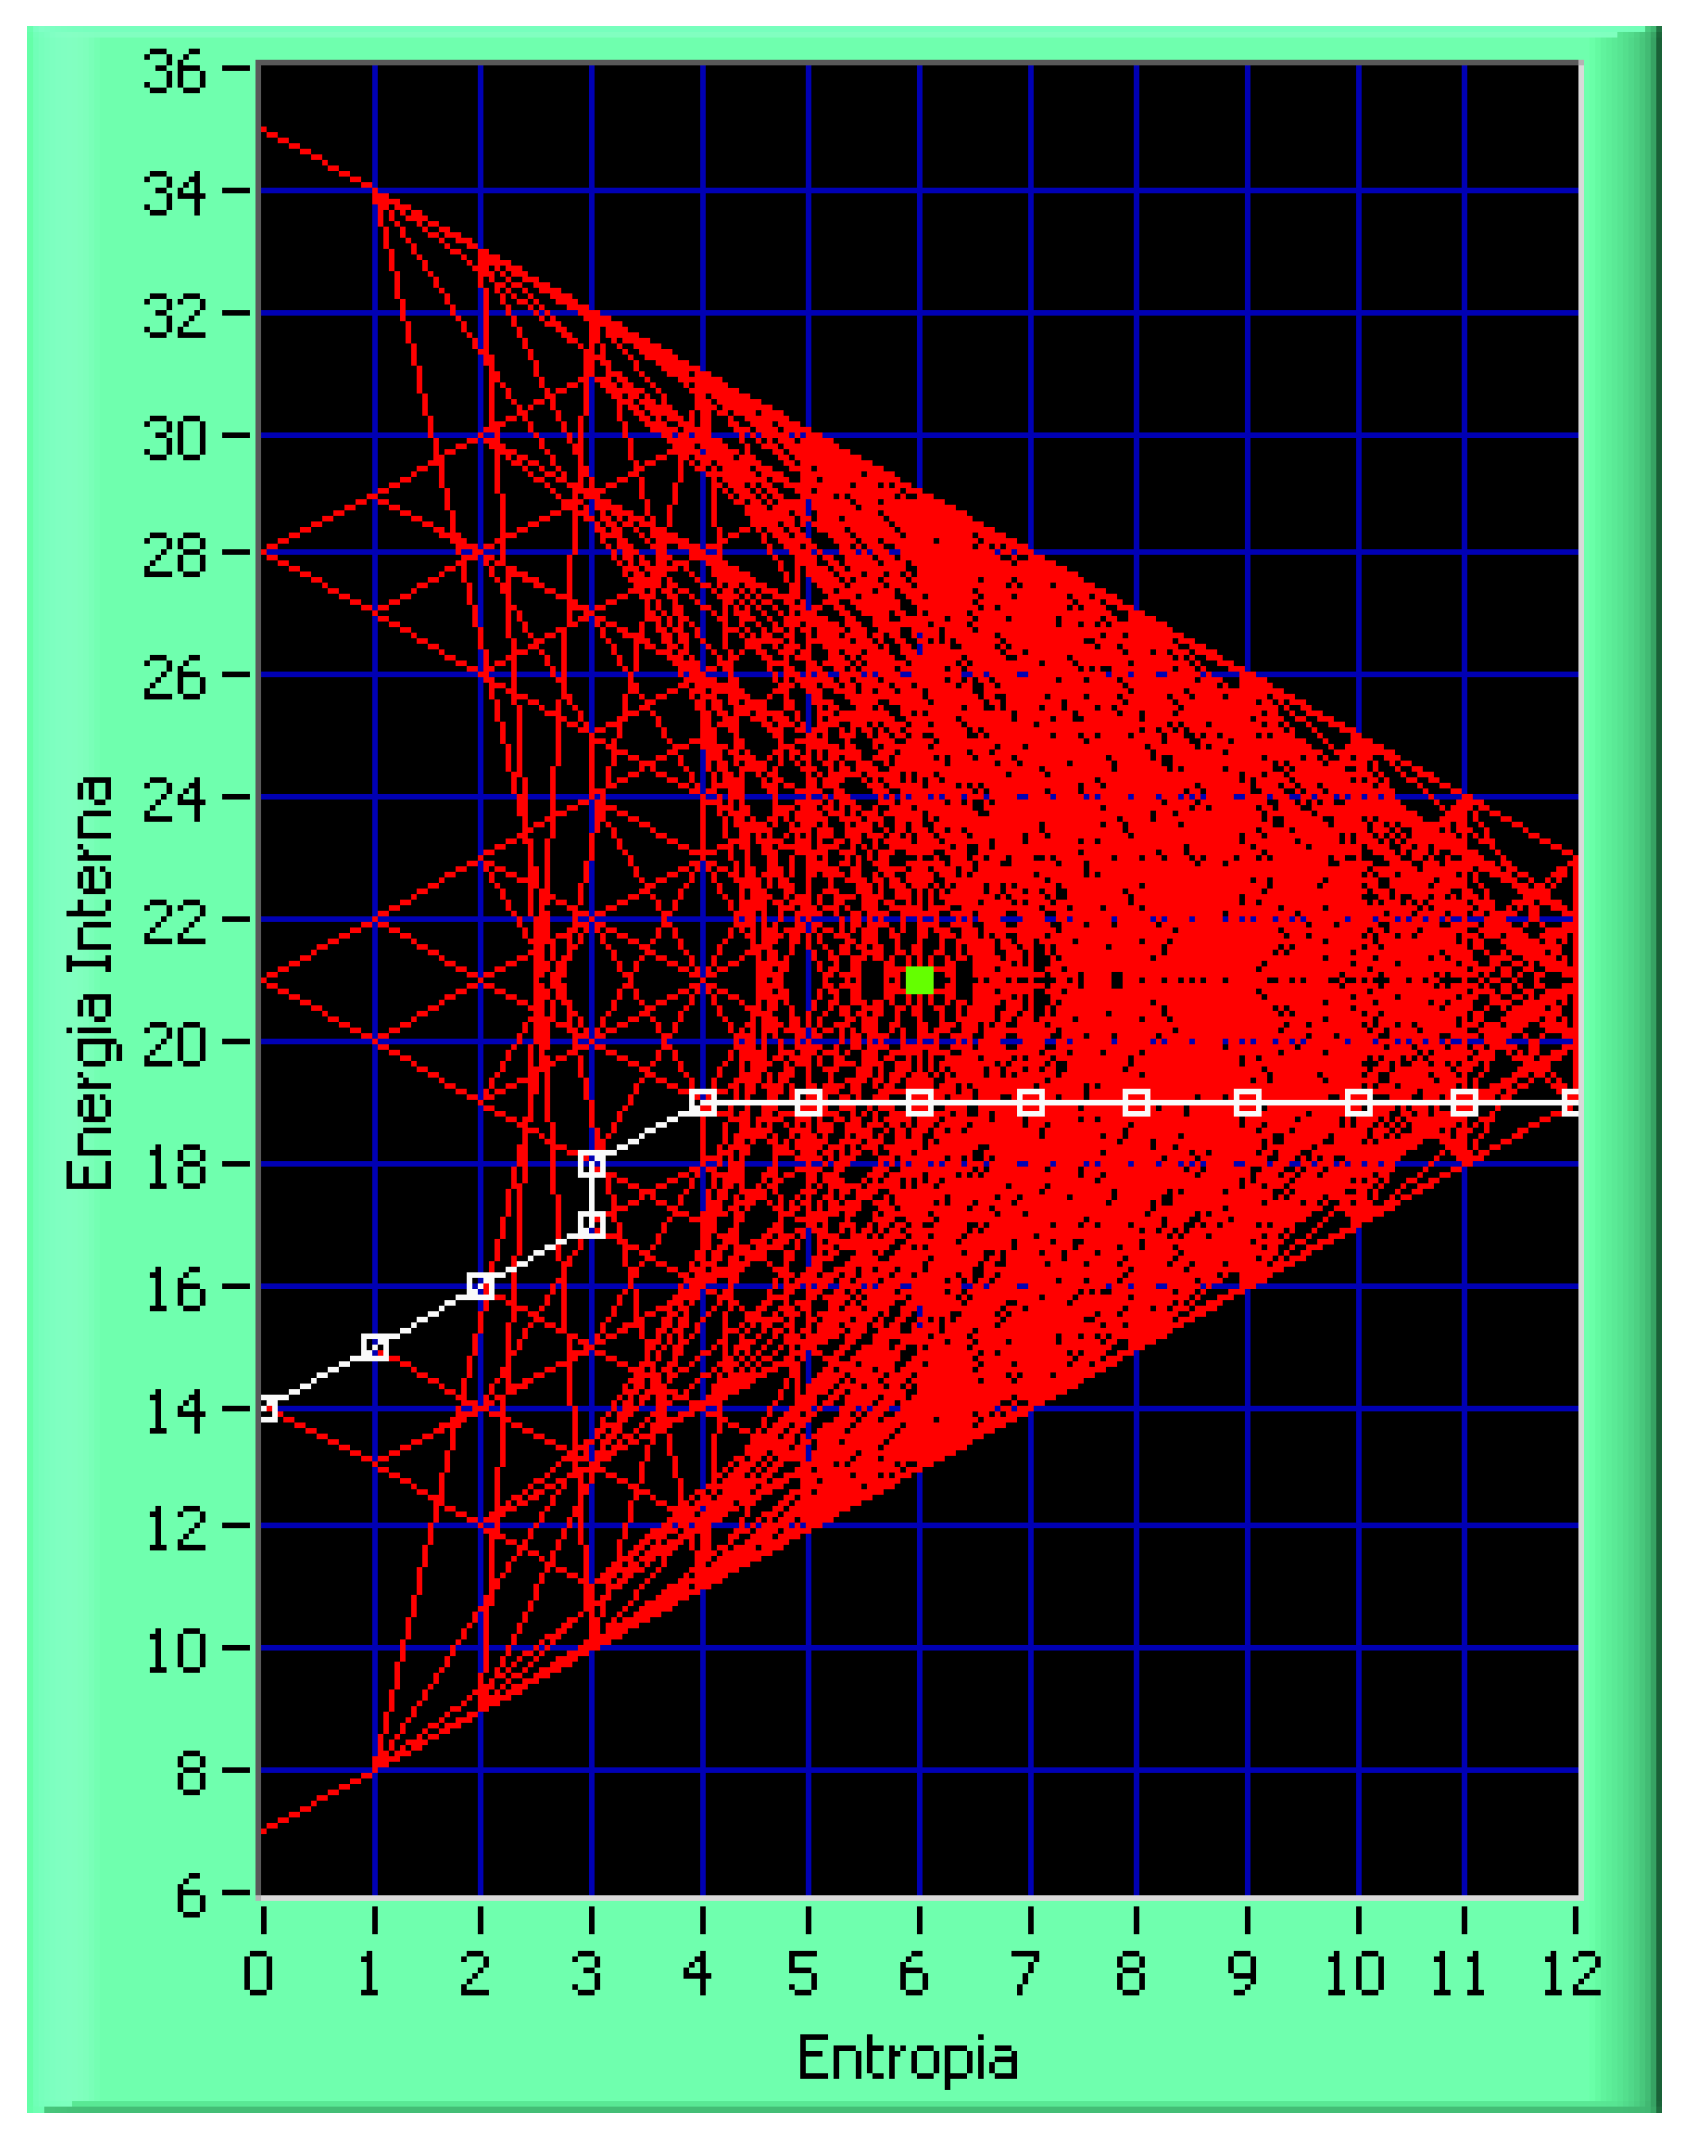
Figure 1 shows an example of a trajectory in 2-dimensional space S-E where the business game shows a transition from a micro-state A with high entropy, that is the maximum value 12, and so with high disorder to a better one, with the minimal value 0, but with a payoff in terms of energy that during the transition is dissipated.
As in [
11], we can make different clusters of micro-states so that the totality of 78,125 possible output of the business game in the 2-dimensional E-S space is clearly understandable. Consequently, we can consider nine areas as in
Figure 1, that is: (I) low entropy, low energy (blue color); (II) low entropy, medium energy (light blue color); (III) low entropy, high energy (green color); (IV) medium entropy, low energy (purple color); (V) medium entropy, medium energy (white color); (VI) medium entropy, high energy (pink color); (VII) high entropy, low energy (yellow color); (VIII) high entropy, medium energy (orange color); (IX) high entropy, high energy (red color). Green (III) area, displayed above, represents high energy with low entropy and is certainly the best from the analytical point of view. This indicates that a well-tuned system in motion always requires orders of lower magnitude than what is being provided to it. In contrast, the least preferred states area VII (yellow) and IX (red) are located which are infeasible for entirely different reasons. Area VII (yellow) corresponds to low energy but high entropy, which is difficult when the intention is to make the system stable. This weakly held equilibrium with high entropy requires a lot of time to bring the system back to equilibrium after it has been altered. Rather, on the other hand, area IX (red) corresponds to high energy and high entropy dynamics; thus, they are high speed but chaotically ordered continuing to incompletely mixed. In such situations, moves should be made decisively because the system is evolving fast but those high energy states can be controlled. Duncan area VII is a low system where the entropy is high. The last extreme area I (blue) is the position of both energy and entropy; thus, systems are slow and passive low order is indiscriminate. This represents conditions of inactivity and lack of activity. Beyond these extremes, there are hybrid areas that mix varying levels of energy and entropy, namely II (light blue), IV (purple), VI (pink), and VIII (orange). Among these, areas II and VI are preferable, with energy levels higher than entropy, supporting moderately dynamic states. On the other hand, sectors IV and VIII are closer to higher entropy concerning energy, with area VIII being the least favorable just after VII and IX. Area V (white) depicts an equilibrium condition of moderate energy and entropy, where both are equal. Further investigation illustrates areas VII and IX are outside the borders marked by acceptable states, signifying low-energy chaos (VII) and high-energy chaos (IX). The summary that follows, which was extracted from [
11], brings to the fore some important aspects relevant to the transitions between these states and guides the corresponding strategies for the governance and management of energy and entropy in the systems. Going from left to right will increase the entropy while the shift from more ordered to more disordered states increases the energy, whereas moving from the top to bottom will reduce the energy.
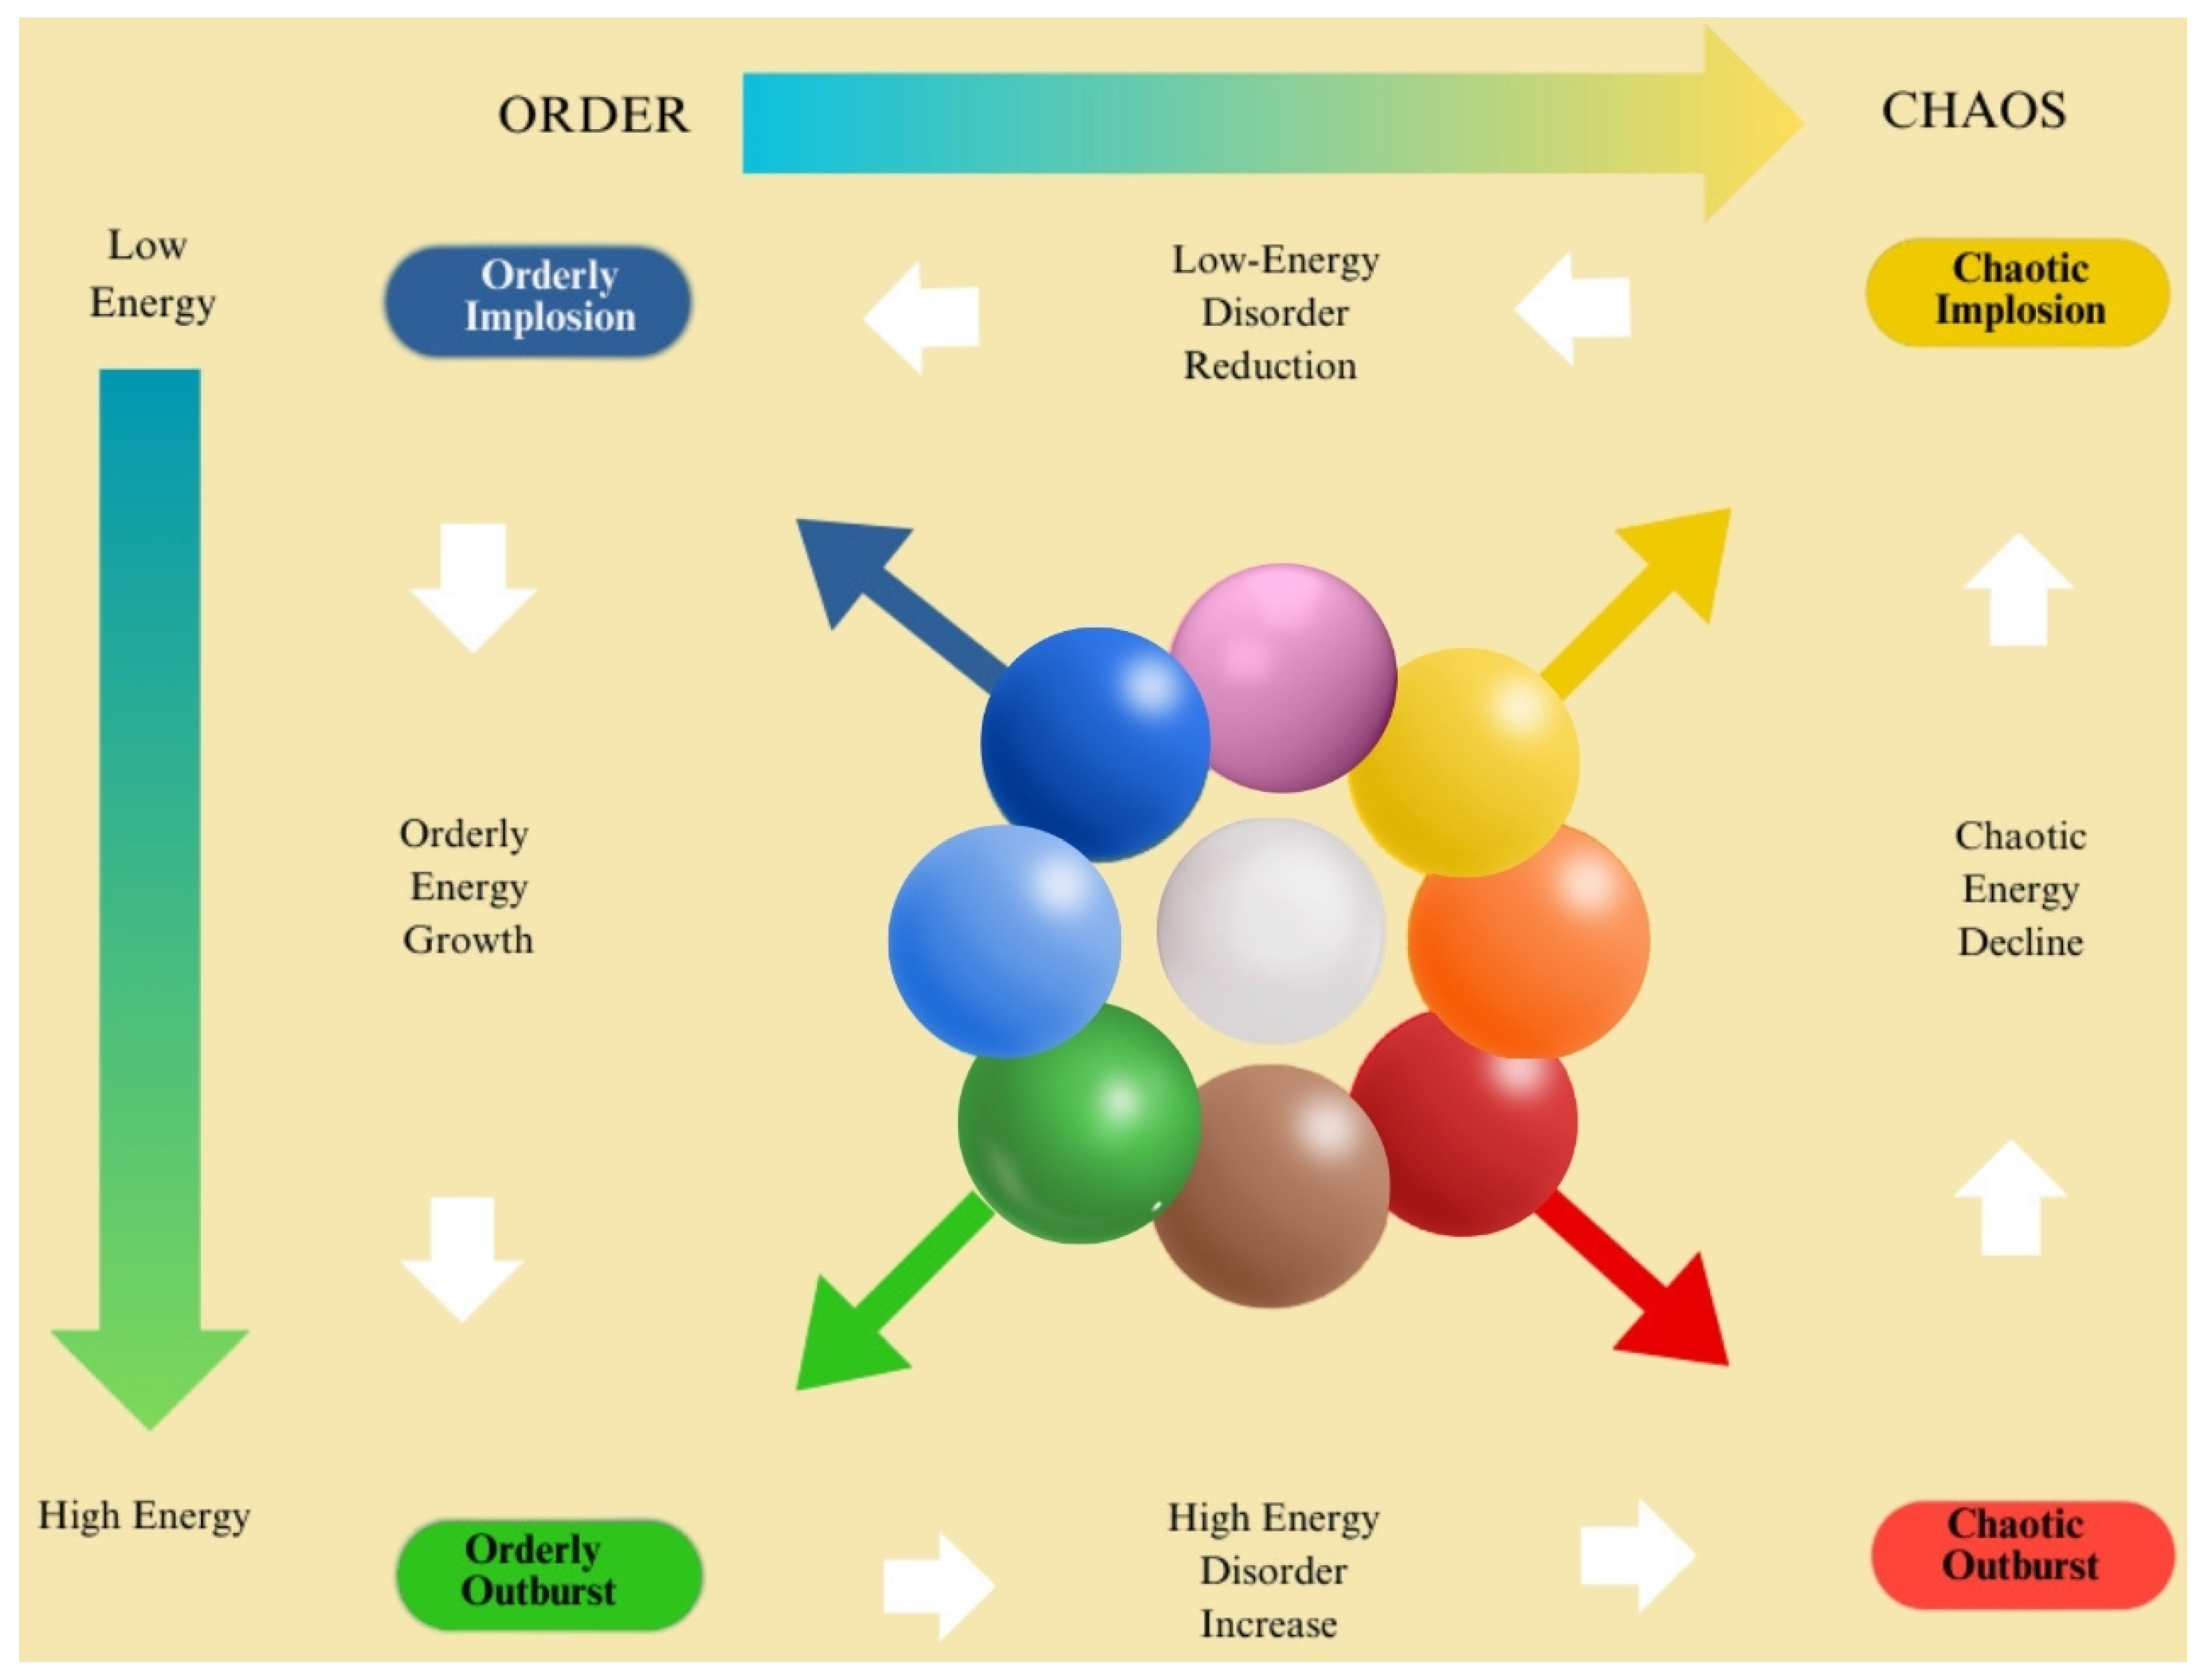
The overall framework can be summarized as follows (see
Figure 2):
Blue: Low energy, ordered states, close to stasis;
Light Blue: medium energy, ordered states;
Green: high energy, ordered states; an optimal state;
Purple: low energy, moderately ordered states;
White: medium energy, moderately ordered, balanced;
Pink: high energy, moderately ordered;
Yellow: low energy, highly disordered; cold chaos;
Orange: medium energy, highly disordered;
Red: high energy, highly disordered; hot chaos.
The blue zone captures states close to a “frozen” state concerning energy and entropy levels, similar to the winter. It is common to observe that transitions from this area are slow and laborious. There is much work involved in increasing system dynamism.
On the other hand, the green area depicts a very highly energetic state of well-ordered livelihoods which are spring-like conditions.
The red area denotes high-energy, chaotic states, comparable to summer, where swift action is essential to reduce entropy due to the rapid feedback of a high-energy system. This state is already chaotic, with certain parameters reaching critical levels, indicating a loss of control.
With the absence of order but the existence of low energy, the yellow area emerges as even more difficult due to system stabilization requiring plenty of time and resources. This zone is also defined by the average scale of chaos which is categorically represented as autumn in the seasonal metaphor.
The rest of the areas depict transitional stages and possess mixed features subject to their position concerning the four extreme zones. For example, the white area represents certain neutral conditions where everything is balanced.
4. Decision Support System and Decision Strategies for Business Games
Based on the analysis in the previous sections, each state, defined as a micro-state characterized by seven indices, can be associated with a macro-state, represented by a pair of state variables (S, E). Once the macro-state is identified, the decision support system (DSS) aims to recommend a strategy that guides the transition of this system state, defined by a particular (S, E) pair, toward a more favorable state in terms of entropy and/or energy. As noted in [
11,
30], it is important to clarify that this model does not address transitions between micro-states within a single macro-state, as these are iso-entropic and iso-energetic changes, and thus fall outside the focus of this work. Rather, the DSS emphasizes the ways of reducing disorder and maximizing the energy within systems.
Various algorithms targeted toward different strategic pathways can also be applied to render these goals achievable. The process ensures the shifts from the existing conditions into the designated outcome, which in this context is one of the five primary attractors.
To illustrate further, let us have some pseudocode from a business game designed to increase a museum’s productivity which, starting from defined seven CSFs, attempts to reduce entropy S (the distance between the CSFs) and increase energy E (see Algorithm 1).
| Algorithm 1. An example of pseudocode from a business game designed to increase a museum’s productivity. |
Input: enter the micro-state (i.e., the 7 CSFs, e.g., 3452135); Calculate energy as in (3):
Calculate the median of the values in the micro-state (i.e., the median of values 3, 4, 5, 2, 1, 3, 5); Calculate entropy as in (4):
Define the initial macro-state as in (1), i.e., f1 = (S1, E1); Output: Using one of the algorithms available on the DSS platform (e.g., one that selects among possible micro-states corresponding to each macro-state, choosing the micro-state where individual CSFs vary minimally—by an incremental unit—and prioritizes maximizing the first three of the seven CSFs when macro-states are equal), provide the chosen micro-states for each macro-state along the path, as well as the final micro-state associated with the final macro-state (final attractor).
|
Here, in the following, we find a sketch of Python 3.x code.
import NumPy as np
def calculate_energy(CSF_values, alpha):
“““Calculate the Energy E as the weighted average of CSF values”.““
return np.dot(alpha, CSF_values)/len(CSF_values)
def calculate_median(CSF_values):
“““Calculate the median of the CSF values”.““
return np.median(CSF_values)
def calculate_entropy(CSF_values, median_value, alpha):
“““Calculate the Entropy S based on the absolute deviation from the median”.““
return np.dot(alpha, np.abs(CSF_values-median_value))/len(CSF_values)
def define_initial_macro_state(CSF_values, alpha):
“““Define the initial macro-state based on energy and entropy”.““
energy = calculate_energy(CSF_values, alpha)
median_value = calculate_median(CSF_values)
entropy = calculate_entropy(CSF_values, median_value, alpha)
return (energy, entropy)
def choose_optimal_algorithm(preference, initial_state):
“““
Placeholder for choosing the optimal DSS algorithm based on user preference.
This would normally select an algorithm tailored to minimize entropy or maximize energy.
“““
if preference == “minimize_entropy”:
print(“Algorithm chosen: Entropy Minimization”)
elif preference == “increase_energy”:
print(“Algorithm chosen: Energy Maximization”)
else:
print(“Default algorithm applied”.)
# Placeholder path calculation logic, to be replaced with DSS-specific algorithms
# Moving toward a target state with higher energy and lower entropy
target_state = (initial_state [0] + 5, 0) # Example target: increased energy, zero entropy
return target_state
def simulate_dss_path(CSF_values, alpha, preference):
“““Simulate the path from initial state to a final attractor based on DSS strategy”.““
# Define initial macro-state
initial_macro_state = define_initial_macro_state(CSF_values, alpha)
print(“Initial Macro-state (E1, S1):”, initial_macro_state)
# Choose optimal DSS algorithm based on user preference and determine target state
target_macro_state = choose_optimal_algorithm(preference, initial_macro_state)
# Simulated path (for demonstration purposes only)
path = [initial_macro_state]
while path[-1] != target_macro_state:
# Incrementally approach the target based on preference
next_energy = path[-1][0] + 1 if path[-1][0] < target_macro_state [0] else target_macro_state [0]
next_entropy = path[-1][1] - 1 if path[-1][1] > target_macro_state [1] else target_macro_state [1]
path.append((next_energy, next_entropy))
# Output the path of macro-states and the final macro-state (attractor)
print(“Macro-state Path (E-S):”, path)
print(“Final Macro-state (Attractor):”, target_macro_state)
# Placeholder for micro-state selection
final_micro_state = select_micro_state(path[-1], CSF_values)
print(“Final Micro-state corresponding to the final Macro-state:”, final_micro_state)
def select_micro_state(final_macro_state, CSF_values):
“““
Select a micro-state with minimal variation in CSFs based on a given macro-state.
Prioritizes maximizing the first three CSFs in case of similar macro-states.
“““
# For demonstration, adjust CSFs incrementally towards a target
adjusted_CSFs = np.copy(CSF_values)
for i in range(len(adjusted_CSFs)):
adjusted_CSFs[i] = min(adjusted_CSFs[i] + 1, 5) # Example adjustment within limit
# Prioritize the first three CSFs in maximizing logic
sorted_indices = np.argsort(adjusted_CSFs[:3])[::-1] # Sort first 3 CSFs in descending order
adjusted_CSFs[:3] = adjusted_CSFs[sorted_indices] # Apply prioritization for max values
return adjusted_CSFs
# Example usage
CSF_values = np.array([3, 4, 5, 2, 1, 3, 5]) # Micro-state (7 CSF values)
alpha = np.ones(7) # Example weighting factors for simplicity
preference = “increase_energy” # User preference to increase energy
simulate_dss_path(CSF_values, alpha, preference)
|
The previous Python code has the following explanation.
Calculate_energy: Computes the energy E as a weighted average of the CSF values.
Calculate_median: Finds the median of the CSF values.
Calculate_entropy: Computes the entropy SSS, based on deviations from the median value.
Define_initial_macro_state: Initializes the first macro state that consists of a pair of energy and entropy as a tuple.
Choose_optimal_algorithm: Placeholder function that automatically chooses the DSS algorithm that best aligns with users’ wishes. This function would be tailored to implement proven methods of entropy minimization or energy incrementation.
Simulate dss_path: Utilizes the algorithm that was selected to perform the simulation of the desired dss_path from the starting macro state to the desired macro-state.
Select_micro_state: For the intended macro-state, choose the micro-state while contending with the variation in the CSFs, which is preferred to be minimum, but trying to first optimize three CSF variables which are important.
In addition, we can note the following:
Path Simulation: the path from the initial to final macro-state is simulated incrementally to approximate a trajectory toward the target attractor.
Micro-state Selection: this function adjusts CSFs minimally and prioritizes the first three CSFs to optimize the final state based on the DSS strategy.
Consequently, the algorithms we will analyze have the aim of reaching one of the five attractors, i.e., minimizing entropy, while concerning the energy, they have different options: (a) medium-energy attractor; (b) energy-reinforcing attractor; (c) energy-reducing attractor; (d) maximal energy attractor; (e) minimal-energy attractor. This can be achieved through different decision-making strategies corresponding to different paths to follow in the S-E plane. The objective is achieved by imposing the minimization of entropy until it is equal to zero. Since there are five fundamental attractors, there will be five privileged directions (global dominance). However, once a coordinate point (S, E) is fixed, we will have eight possible directions (local dominance) concerning the three-by-three matrix centered on the state of interest and called eight-connected (see
Figure 3).
When considering each of these directions, several insights emerge regarding their strategic value and priority in moving the system toward an optimal state. As the most preferable direction, direction 1 can steer the system toward a state of decreased disorder, entropy, and increased energy. This direction best matches the ultimate object since it increases energy and decreases entropy. Direction 2 is also a rather strong strategy but is one step down in order of preference. It manages to steer the system to a state of lower entropy, but keeps the energy level constant, thus achieving an isometric shift with decreased entropy. New disorder is not created, and so while it does not increase energy, it brings so much value that it is indeed astounding. It does not invigorate the system, but it helps in much-needed endeavors.
Although the third route is a constructive one, it is not as favorable as the prior two. While it achieves lower entropy, this is at the expense of decreasing energy. It is acceptable for managing inefficiency, but that is why it is not as good as direction 2. Direction 4 can be seen as a temporary or localized strategy, ranking lower than the first three in terms of priority. While it does not change entropy, it decreases energy, making it an isentropic transformation with energy reduction. It is still more effective than directions 5, 6, and 7 and is considered equally beneficial to direction 8. This direction, while not contributing directly to the final objective, can play a supportive role in moving the system incrementally forward.
Direction 5 is the most unfavorable strategy overall as it increases disorder as well as reducing productive energy expended towards achieving the counterproductive goal. However, this strategy can still be applied on a limited basis under certain situations as a last resort measure to escape a deadlock, providing just enough change to the system to allow it to shift into an adjacent state, albeit at a minimum and undesirable direction. Direction 6 is also generally a poor choice, though it fares slightly better than direction 5. It serves as a transitional local strategy that increases entropy while keeping energy constant, which is why it is also known as an isoenergetic transformation with entropy increase. With impasses, it is sometimes useful as an escape mechanism in single-step situations, just like in direction 5. Direction 7, which is not very favorable, comes before directions 5 and 6. It represents both an increase and a rise in entropic energy and is therefore transitional. Increasing entropy is unfavorable, but the increase in energy is sufficient to attain subgoals and set the stage for quick decisions—higher energy states increase external dynamics.
Finally, direction 8 serves as a localized, transitory approach that ranks below directions 1, 2, and 3, yet is preferable to directions 5, 6, and 7. Like direction 4, it maintains constant entropy, but unlike direction 4, it increases energy. This energy increase can benefit the system’s responsiveness and decision agility, much like direction 7.
Our earlier analysis delved into the central decision-making tactics essential for achieving prioritized goals within the S-E plane, linked to the context of governance in the museum. The focus here is directed towards energy (E) which reflects inertia, also activity expenditures, and the entire sphere of governing which is in control over the institution—essentially managing entropy (S). This might be perceived as elementary but the system in question is exceptionally powerful and efficient at making decisions while analyzing many alternatives.
In what follows, we explore the business game platform’s computational framework more closely. Information management within the system considers a vast array of states driven by characteristic indices. Applying a thermodynamic approach, we simplify and dissect the systemic complexity, revealing that varying indices yield a 7-dimensional state space (micro-states), representing 78,125 potential system states. This model affords a real-time snapshot of the studied system.
To facilitate governance decisions, the decision support system provides, sequentially: (i) a decision strategy (DS); (ii) a management strategy (MS); and (iii) an operational strategy (OS).
In depth, the decision strategy (DS) simulates the system, shifting from static to dynamic perspectives. Based on decision-maker choices (such as those of a governance body), it outlines a pathway within the S-E (Entropy–Energy) plane to meet specific goals, typically minimizing system entropy and optimizing system energy per stated needs. This is represented mathematically as a path, a segmented trajectory in the S-E plane, where each point segment connects the current system macro-state to the next. The very first state is regarded as the starting analysis point of the system and the last state is defined as the one which needs to be optimized. This strategy, however, maps 78,125 micro-states to 146 macro-states in the S-E plane with each micro-state individually mapping to macro-states. The decision-making process within the S-E plane becomes less complex, as there is algorithmic movement between macro-states and micro-states in 7-dimensional space.
These foundational insights enable the development of management strategies that guide experts or the governance body in implementing optimal strategies. The system indicates a trajectory to follow without specifying which parameters or indices to modify, thus providing broad decision-making autonomy for the user and maximizing the system’s general applicability. These approaches are implemented in configurations at the micro-state level which provides a closer level of control. In addition, the system can make use of management strategies at the micro-state level, which in turn transforms into operational strategies geared towards achieving a defined objective such as maximizing a specific CSF. In this case, an operational specific strategy aims at maximizing energy expenditure while minimizing entropic changes. This allows to deploy refinement at the micro-state and macro-state levels. The management strategy (MS) informs which adjustments to execute regarding energy and entropy levels. Finally, the operational strategy (OS) provides suggestions concerning actions on the level of micro-states, explaining how to adjust the indices within the business game to directly affect the seven user-selected dimensions. Thus, the governance body receives operational information which is accompanied by models and plans of the museum’s management so that it can be guided through the complex management challenges with accuracy and insight based on experience as well as systematized structural reasoning. To finish this part, it is necessary to focus on the internal intricacy of the system. We have seen that this system operates 78,125 micro-states which are encapsulated in 146 macro-states in the S-E plane. While the next section will cover the subsystems and operational subsystems’ computational intricacies, here we tackle the design system module, more precisely, the part of the module that deals with the decision-making strategy formulation. In the context of museum governance objectives, designing a decision-making strategy translates to constructing a path, or trajectory, in the S-E plane. To fully understand systemic complexity, we must assess how many unique trajectories can be created under the following conditions:
Open Curves: The endpoints of each trajectory do not overlap, which means that they need to be captured by a single open curve;
Non-Redundant Paths: Every location marked on the non-redundant path is visited only once and is thus, non-recursive;
Node-Linked Arcs: The macro states are linked, and each one of the 146 nodes is connected forming a geo-scheme S-E with all the traffic arcs under condition;
Directional Order: Each uniquely determined and directed path is an encompassing trajectory of macro states which are ordered in terms of their entropy and end with a goal node of attractor type and zero entropy;
Distinct Sequences: The sequences with different orders will also be looked to as distinct, most especially if they cover the same area.
Based on these approaches, the number of potentially defined trajectories is almost incomprehensible somewhere around 6.665 × 1024. Having this magnitude of options is impossible in personal computer decision support systems, and is borderline unfathomable, but does show how the system can tremendously manage an unprecedented number of decision paths.
This system is amongst the world’s first designs of sophisticated decision-making systems wherein the system skillfully handles an enormous volume of data by employing a hierarchical order of structured processes logic to determine rational paths within the given data set chaos. This makes the system a notable decision-making asset since it allows for quick and well-informed decisions to be made concerning the administration of museums. When deciding on a strategy, a member of the Governance body or any other specialist would be able to target precise criteria and choose the best solution out of trillions of strategies available. This distinction clarifies the difference between complexity and chaos: without a decision support module, selecting a strategy from such a vast pool would require unfeasibly long processing times, leading to reliance on subjective judgment and thus potentially chaotic decision-making within a finite—though overwhelmingly large—set of choices.
However, with the DS module, after setting the required conditions and objectives, the system can recommend one or more viable paths, transforming systemic complexity into a manageable, deterministic process rather than an overwhelming one. Later, we will explore how even at finer levels of complexity, the system allows for the selection of management and operational strategies, which bring the added granularity of micro-state and index-based reasoning.
The decision-making strategies module produces an optimal trajectory as its output, guided by the governance’s target of minimizing entropy and maximizing energy according to the specified decision strategy (DS). While this mathematical solution is rigorous, it may be challenging to interpret for those less technically inclined. Thus, at this stage, the management strategies (MSs) module attempts to distil this intricate mathematical work into a set of recommendations that provides the governance with generic steps to follow while allowing the discretionary latitude concerning the particulars of “how” to modify the indexes. Going forward, improvements in natural language processing (NLP) along with transformer technology should allow these results to be presented more verbally in ways that are sophisticated and easier for the users to comprehend.
The management strategy’s structure comprises statements derived from the DS outputs, with the number of statements aligning with the steps needed to reach one of five attractors, starting from the system’s current state. For each transition, the system also provides the number of micro-states leading to the destination macro-state, giving governance insights into the range of options for improving the system’s condition. Additionally, the MS module marks “Objective Achieved” upon completion of the strategy, detailing the final state, the type of attractor reached, the number of steps taken, and the stable equilibrium energy level achieved.
If governance or an expert desires more granular guidance—in particular, actions linked to specific indices—the operational strategies module (OSs) steps in, working directly with micro-states via a suite of target functions, which are further explained below. The MS module’s output is inherently degenerate; along with the management strategy, it lists possible micro-states, and, in advanced views, all micro-states associated with each macro-state. Each micro-state, though equivalent in energy and entropy, is unique in its characteristics.
The OS module resolves this degeneracy by selecting the most suitable micro-state for each step, aligning with the governance’s overarching strategy. To create these operational, or micro-state level, strategies, we must disaggregate the macro-state level’s degeneracy by selecting the micro-state that best represents each step’s prospective goal, driving toward the ultimate strategy goal. In essence, the OS module determines which micro-states the system should traverse from the current state toward one of the five equilibrium attractors. Achieving this involves identifying rules—expressed as target functions—that guide the system’s transitions in a way that is smooth and palatable to stakeholders, prioritizing specific objectives such as rapid progress in one key factor, steady growth in another, or a deliberate decrease in a third.
The primary guideline for all operational strategies is to avoid abrupt or drastic changes, meaning that each transition the DSS proposes should be gradual. In systems dynamics terms, this equates to smooth, continuous transitions. From an information theory perspective, this translates to selecting contiguous states, i.e., where possible, micro-states between macro-states should differ by no more than one unit across indices. For instance, in transitioning from macro-state A to macro-state B, if two candidate micro-states, y1, and y2, have equal entropy and energy, we will choose the one closest to the starting state, minimizing the sum of index differences. Take, for instance, a hypothetical DSS for regional management. Assume the demographic index for state x is 3, while y1 is 2 and y2 is 5. In that case, we would favor y1 over y2; however, if the aim is to increase the demographic index, y2 would be preferred as this strategy best fulfils the aim. To put this strategy into full force, micro-states should be ordered concerning a target that is defined as the function that arranges micro-states in the contiguity optimization goal defined as the difference between starting micro-state indices and destination micro-states.
Formally, if x is the starting micro-state corresponding to macro-state A and to a macro-state B, there are associated n micro-states y
i with i = 1, … , n then among these the best y will be the one for which the sum of the absolute values of the deviations between the different indices is minor, or formally as in (5):
where the index j characterizes the different indices, i.e., for j = 1 we have a CSF1 index, for j = 2 a CSF2 index, etc.
Each micro-state is assigned a new parameter known as “deviation” which measures its divergence from a defined optimization target. Within each macro-state, labelled here as B, the associated micro-states yi are ranked by ascending deviation, and the system selects the initial element representing the closest fit to the “contiguity optimization objective”. This targeting function allows the system, at each transition point to a new macro-state, to pinpoint the optimal micro-state relative to the previous objective, effectively resolving micro-state degeneracy.
By implementing this approach, the system can offer an operational strategy that delves down to the micro-state and index level, specifically targeting CSFs. It provides incremental guidance on the system’s reconfiguration across seven indices, suggesting adjustments at each step.
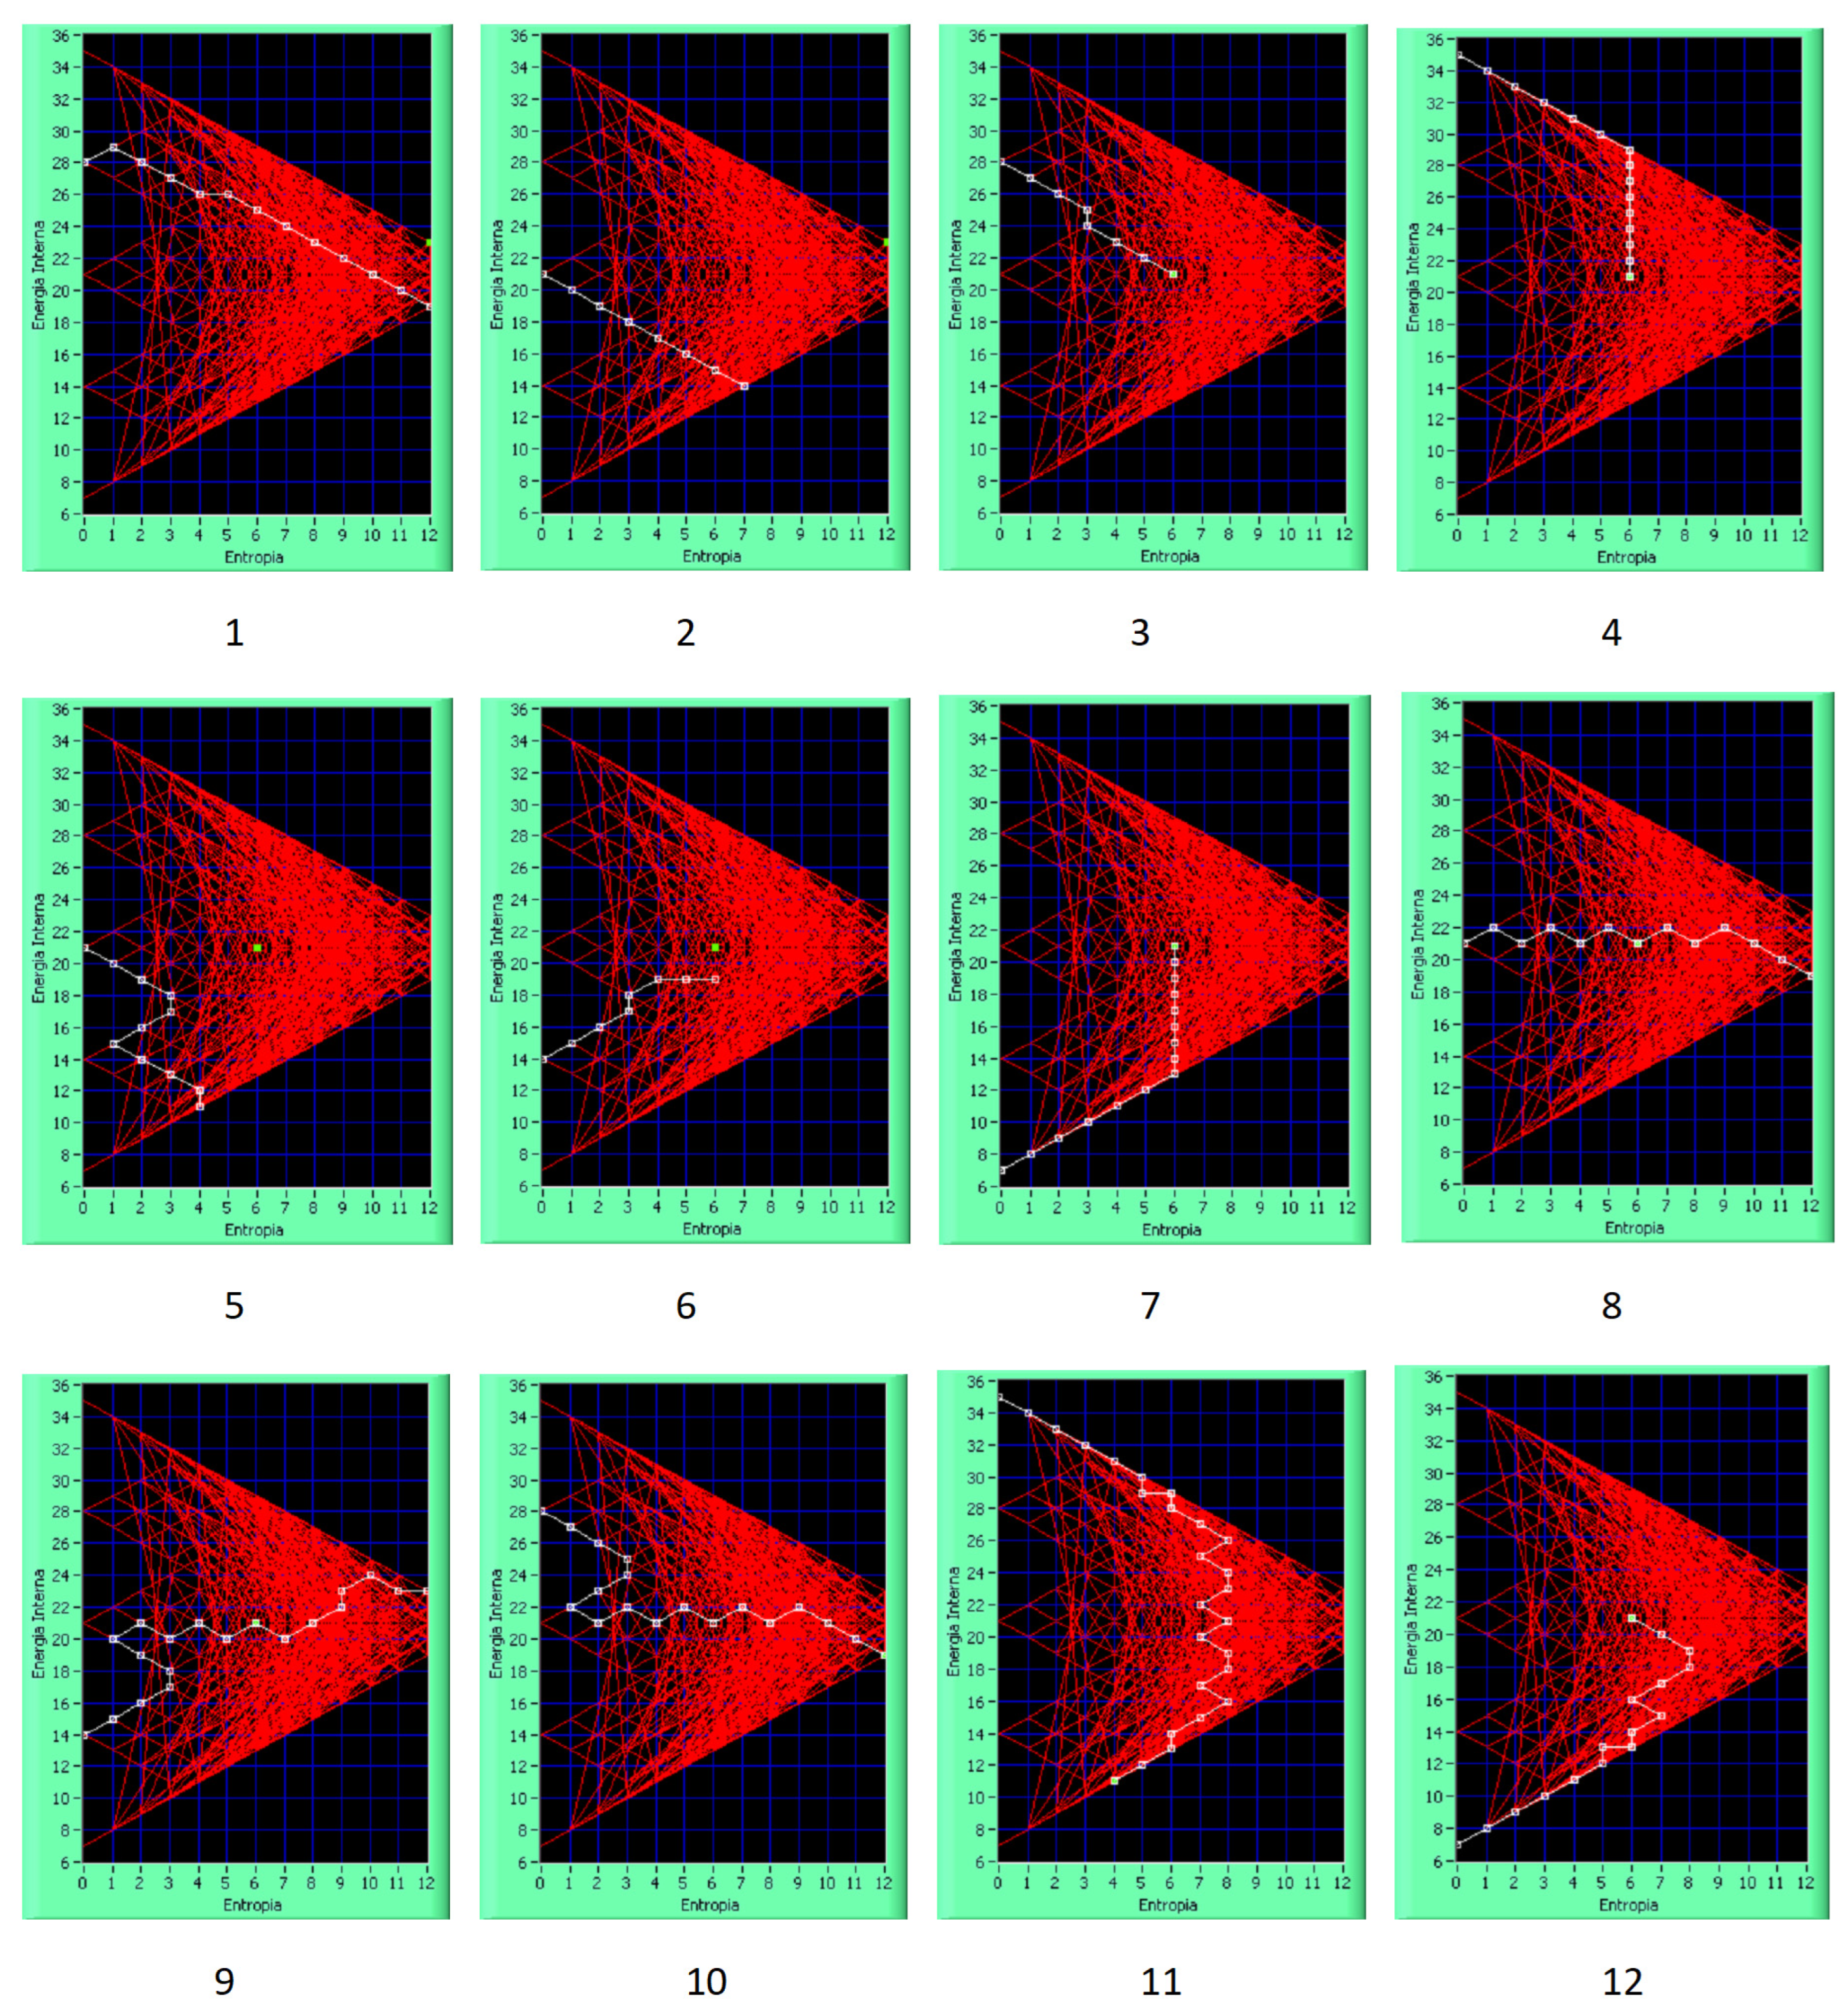
Figure 4 visualizes the progression of these indices through successive steps until the overall goal is reached, concluding at one of five attractor points defined by the chosen decision-making strategy. This representation includes the selected micro-state of interest (highlighted in green) and the trajectory of successive states (marked in red).
This structured process completes the information processing continuum, delivering an integrated decision-making, management, and operational strategy to guide the territorial system from imbalance to equilibrium. This final module also serves as a practical advisor, offering governance-specific action recommendations for direct implementation in the museum environment.
In other words,
Figure 4 shows an example of CSFs’ results, representing the dynamics in time (i.e., step-by-step). Consequently, we find the suggested behavior for each of the CSFs and, therefore, for the micro-states which are the variation towards reaching the final state. For each CSF, the system indicates not only the final decision, i.e., the value in the range [1, 5] to be achieved, but also the decision-making trajectory, i.e., the changes in the value that each CSF must comply with to achieve the final decision/target.
Without prejudice to the interest in the use of the previous operational strategy, it may be necessary to intend to achieve a given global objective (decision-making strategy), through an operational strategy that makes one parameter evolve more rapidly than another. To respond to this type of request, the system provides the following eight operational strategies (OS) in which the strictly hierarchical priority order of the indices to be optimized is defined:
OS_1 = (X1, X5, X4, X3, X2, X7, X6);
OS_2 = (X2, X5, X4, X7, X3, X1, X6);
OS_3 = (X3, X4, X5, X2, X1, X6, X7);
OS_4 = (X4, X5, X3, X1, X6, X2, X7);
OS_5 = (X5, X1, X6, X4, X3, X7, X2);
OS_6 = (X6, X4, X2, X1, X5, X3, X7);
OS_7 = (X7, X6, X5, X2, X1, X3, X4);
OS_L = SORT BY USER’S CHOICE.
Giving priority to one index over another means generating the conditions in the system that allow the implementation of a given evolution plan of one factor rather than another.
6. Conclusions and Perspectives
This work, which presents a decision support system (DSS), and its algorithms tailored for museum contexts and artistic and archaeological institutions, builds upon the definition of a new methodology for modelling and analyzing information in highly intricate contexts provided in [
11]. The DSS begins from the n-dimensional space of possible scenarios. It synthesizes the information into a two-dimensional space where it derives macro-indicative analyses that portray the system’s dynamism as energy and its organizational level as order and entropy. The analysis is then transformed back to the problem space for specific support.
Despite standard computers having issues with computational feasibility in the n-dimensional scope, the solution enables intricate decision-making processes on commonplace CPUs that are typically found in standard laptops. The model can suggest decision-making strategies for the institution by using anthropo-thermodynamics, which allows the logic of governance systems in museums to be developed and be based on much more than simple experience alone.
After the model and its subsystem are analyzed, its users can set management goals and transform the information into a non-structured form that fits their unique requirements and recommends appropriate management actions. If this model provides too much flexibility, the computational model can also serve up specific operational strategies and set micro-states that define a pathway through the system without violating the terminal objective of reaching the set equilibrium state.
Conceptual framework for cultural institutions:
Scenario modelling;
Contextualization of the scenario in the space of all possible states;
Identification of critical success factors (CSFs);
Definition and identification of decision-making strategies;
Definition of management strategies;
Definition of operational strategies.
This framework ensures that decision-makers in museums and cultural institutions have the analytical capacity to make the best choices based on the specific needs posed by various stakeholders.
Considering the 78,125 micro-states and the 6.665 × 1024 trajectories generated by the decision-making strategies unit, it can be deduced that the entire system, in suggesting the optimal operational strategy based on the user’s requests, processes a total number of cases (micro-trajectories) equal to 1.18 × 10311. The computational complexity is not reduced merely to the creation of decision paths by connecting micro-paths; one might be misled into thinking there could be other similar or better solutions for constructing the decision path. The problem tackled, reduced to the two-dimensional entropy–energy space, is not about solving equations in the real-number space R × R, but in the discrete space N × N, involving sequences of Diophantine equations, with optimal integer-valued solutions for entropy minimization and energy optimization. The use of integer solutions, as opposed to real-valued ones, makes this approach highly effective, even considering that it is computable on commercial computing systems without the need for quantum computation.
To date, there are no methodologies or technologies internationally capable of handling such a vast set of decision micro-path possibilities using desktop computers and laptops with standard computational capabilities. While the literature presents various techniques for identifying decisions even in highly complex cases, the goal of this work is to highlight not only the best decisions but also the best decision paths, analyzing even the micro-paths that compose these paths. With this solution, the decision-maker in a museum or cultural institution has a tool that not only supports decision-making by defining the best goals to achieve (targets) but also how to achieve them (decision paths), identifying micro-goals and micro-paths for the transition. When faced with such a number of possibilities, one can rely on common sense or personal experience, or one can turn to an advanced decision support system like the one proposed. The first approach is inevitable in the absence of such a system, which transforms a potentially subjective decision into a deterministic and rational one in a context that might seem chaotic but is, in fact, extremely complex.
A system like the one proposed is an extremely powerful tool for analyzing complex systems within museums and archaeological and artistic institutions. It is flexible, multi-resolution, and adaptable to specific decision-support needs, providing effective support at the decision-making, management, and operational levels based on the expressed needs, the choices made, and the intended objectives.
In the future, it may be valuable to design and implement a component for conducting a quantitative SWOT analysis to enable an objective, non-expert-driven approach for selecting parameters to be considered as critical success factors (CSFs). In this work, we initially considered 21 potentially relevant parameters, ultimately narrowing it down to 7 on which to build the business game of interest. The selection was guided by the specific goals of the game and the type of outcomes desired, such as usability, immersiveness, adaptability of content, accessibility of museum assets on online platforms, and by the authors’ expertise. Conversely, in the future, it could be beneficial to have an initial filtering component that once objectives are set, uses a quantitative SWOT analysis to reduce redundant or less relevant parameters. The business games developed here are based on the DSS described in [
11,
30] and they utilized seven CSFs. It would be interesting to explore a technological solution incorporating a greater number of CSFs, despite the increased computational complexity, which might no longer be manageable in real time on standard desktop or laptop computers. Another cognitive challenge is the ability to disseminate the results of these business games to encourage the adoption of a DSS like the one used in this study, integrating both simulated activities and real governance processes in museum context. Given the generality of this study, we can conclude that it is immediately applicable to business games in the artistic, cultural, and heritage sectors, theatres, art houses, galleries, libraries, bookstores, etc. Looking ahead, it would be valuable to investigate how this research could inspire new business games in other fields beyond those considered here. In addition, with respect to the study in [
14], in which the authors of the present work examined the modelling of systems in contexts of information uncertainty or incompleteness, an interesting future development of the study presented here could involve extending the system to handle cases of incomplete or uncertain information. Finally, a further development of this solution could involve the use of artificial intelligence to enhance data adaptability and homogenization, user immersion and engagement in the business game, and the overall usability of the technological solution. This could be achieved by introducing a text-based command prompt powered by natural language processing for the auto-completion of input fields, as well as a chatbot for voice-controlled interaction with the system.


