3.2. Similar Wind Turbine Data Matching Module
In terms of natural environment, “similar wind turbines” should meet geographical and climatic conditions including [
23] whether they are located in the same wind farm; have similar terrain and topography; have comparable surface roughness; or involve environmental factors like temperature, humidity, and air pressure. This ensures the turbines operate under similar external environments and avoids data bias caused by environmental factors.
Regarding turbine operation, “similar wind turbines” should have identical technical parameters such as turbine model, rated power, rotor diameter, and hub height. Additionally, we emphasize the impact of operational status (e.g., load level, maintenance condition) on data matching to ensure the selected turbines operate under similar working conditions.
Furthermore, the spatiotemporal correlation between different wind turbines is a highly complex concept that is influenced not only by operational conditions among turbines, but also by natural factors such as terrain, topography, wind speed, and regional microclimate [
24]. The wind turbines selected in this study are located in flat plain areas with relatively uniform wind speed distribution and minimal regional climatic variations. Therefore, the spatiotemporal correlation primarily considers the operational conditions between different wind turbines. Based on this, the SWDM module (Similar Wind Turbine Data Matching Module) is employed to screen the operational status of wind turbines, ensuring the accuracy and reliability of data matching. The SCADA data from the selected wind farm will be described in the experimental section (
Section 4).
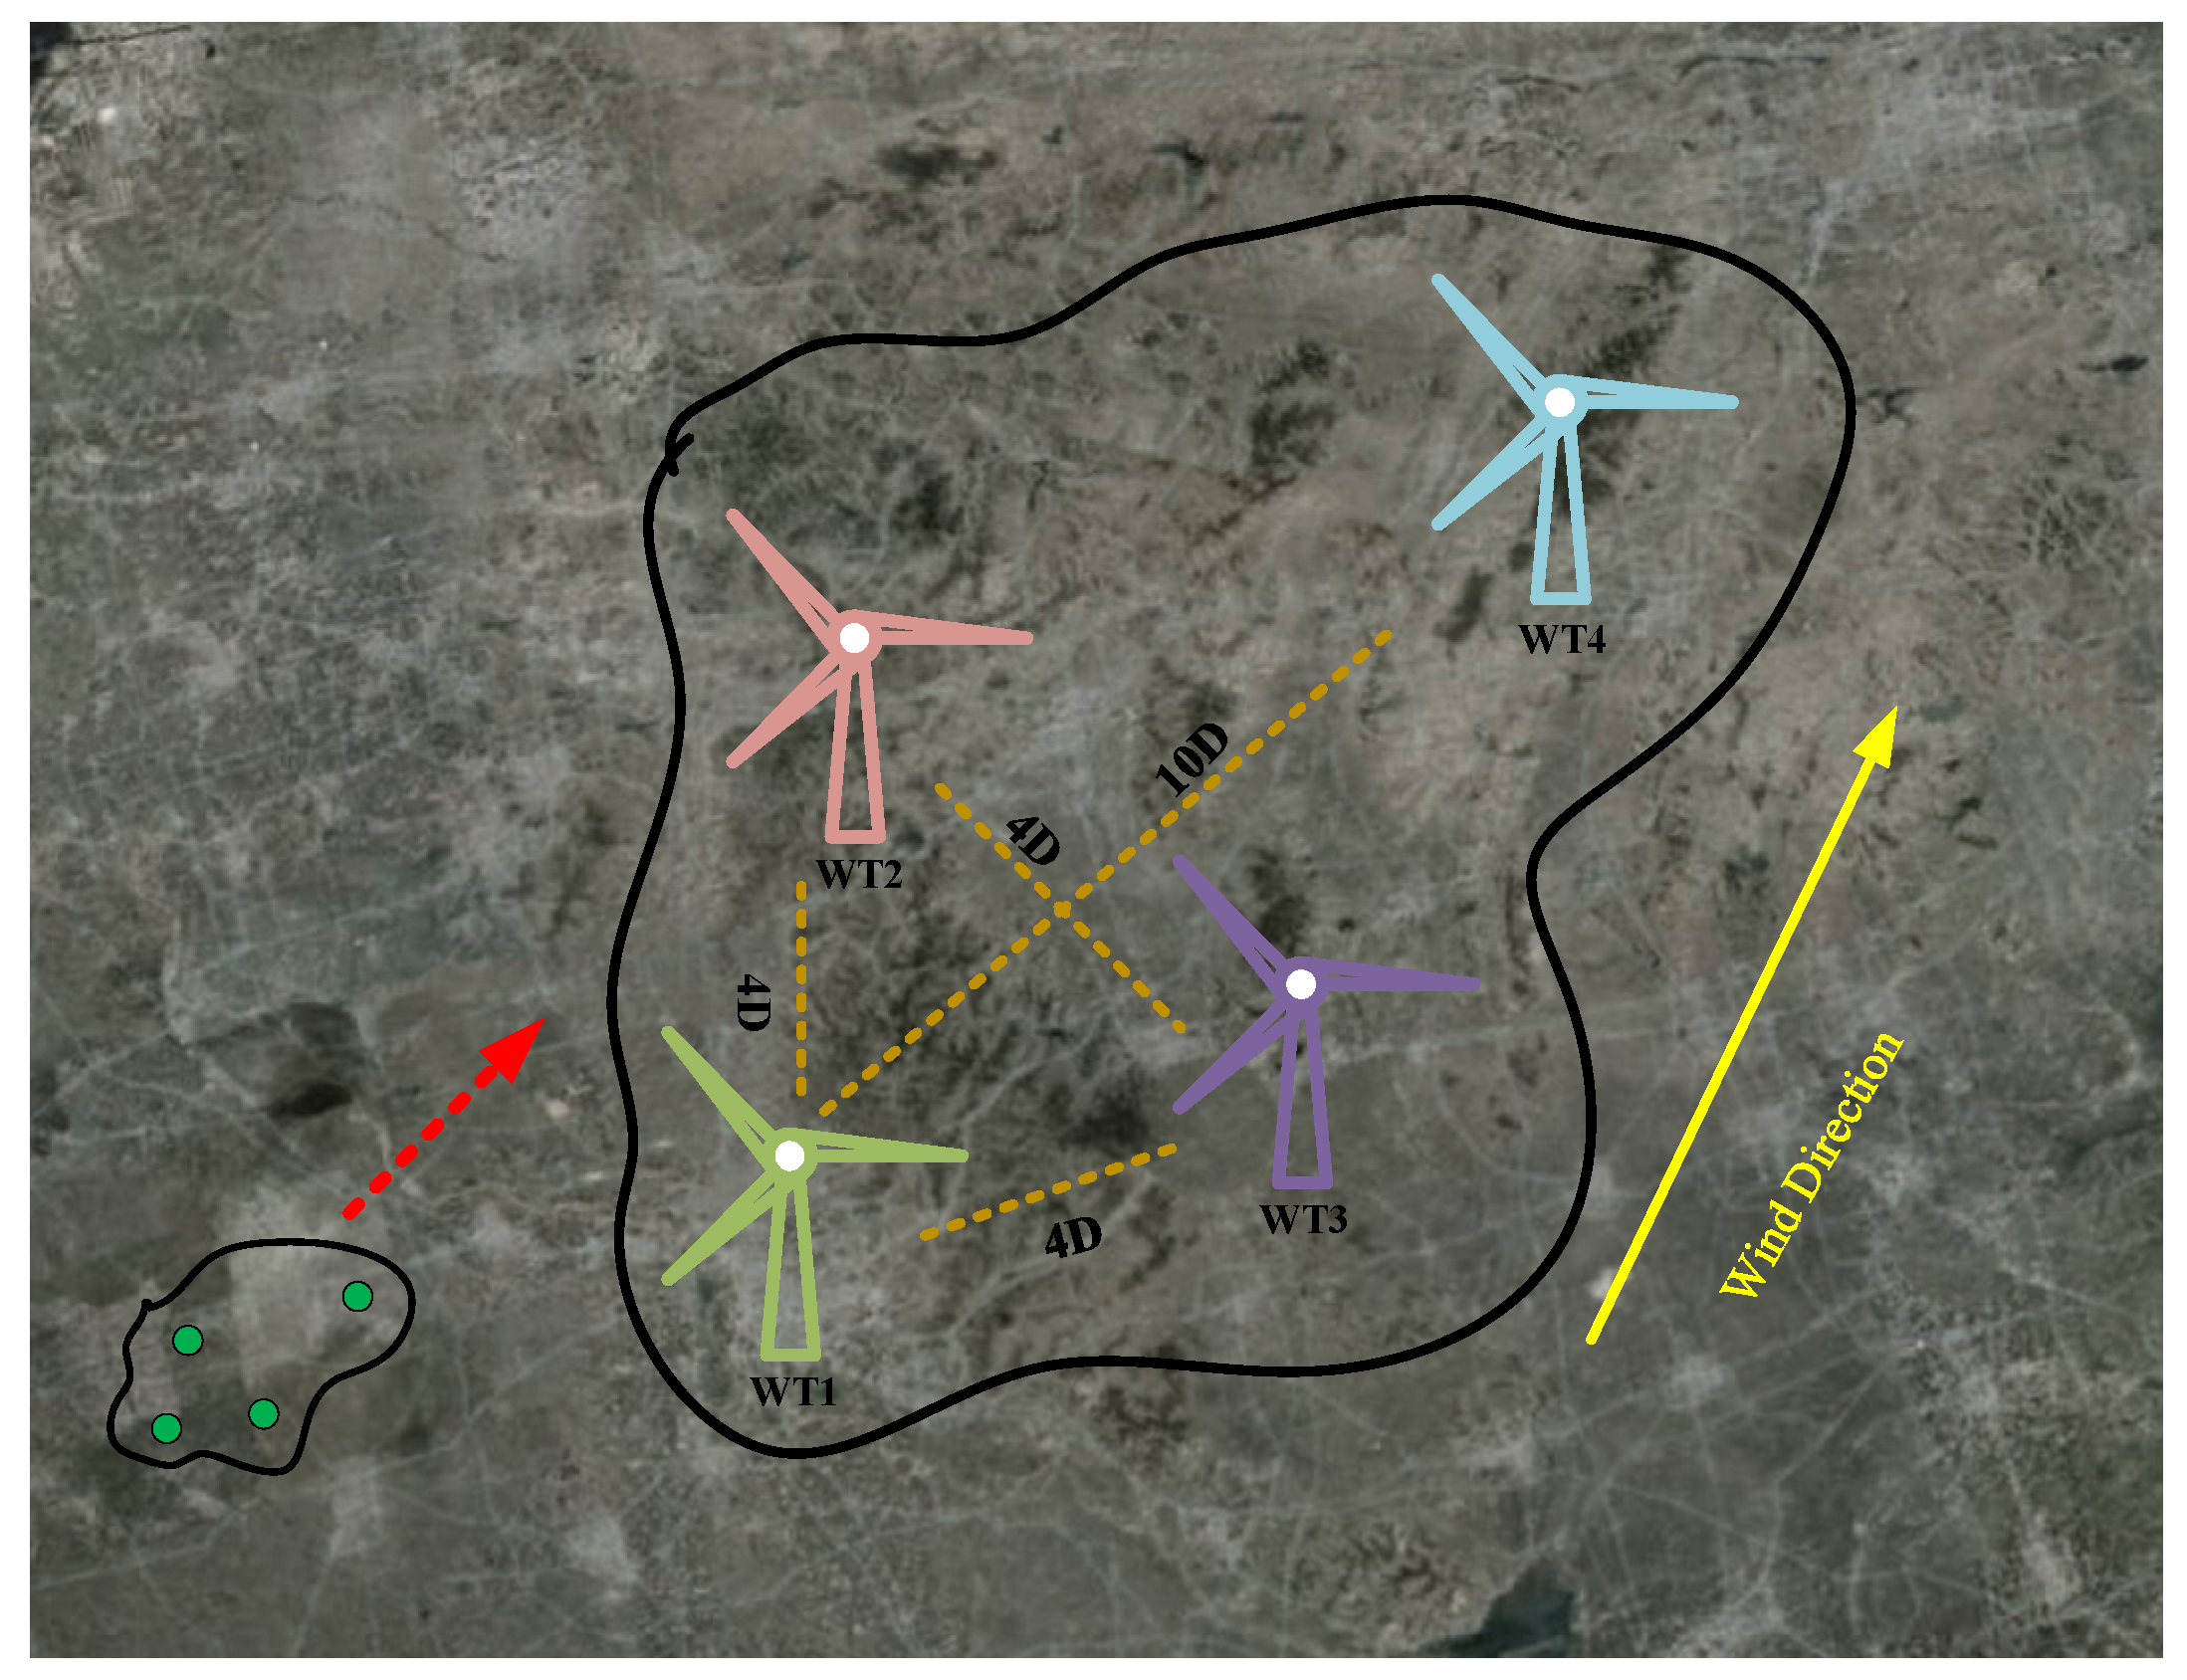
In the task of wind power data imputation, spatiotemporal correlation is a key factor in building efficient models. Temporal correlation helps predict the future variation trends of electrical data in wind turbines, while spatial correlation can extract similar data patterns from neighboring wind turbines, thereby improving the accuracy of data interpolation.
Figure 3 illustrates the spatiotemporal correlation of active power data between any two wind turbines in a wind farm.
From a temporal perspective, the feature data of wind turbines at adjacent time points typically exhibit strong similarity and correlation, but this correlation gradually weakens as the time interval increases. This temporal dependency can be quantified using the temporal autocorrelation coefficient [
25]. For example, the temporal autocorrelation coefficient for active power can be calculated using the following formula:
where
represents the temporal autocorrelation coefficient of the wind turbine’s features;
represents the time lag;
represents the average value of active power;
and
represent the active power data at times
and
, respectively; and
and
represent the initial and final moments, respectively.
From a spatial perspective, neighboring turbines within a wind farm, due to being in similar geographical environments, exhibit high similarity in their wind power characteristics, reflecting spatial correlation. The strength of this correlation can be quantified using the Spearman rank correlation coefficient. A higher coefficient indicates greater similarity in the feature data of the turbines and stronger spatial correlation.
In the formula, represents the Spearman rank correlation coefficient between two wind turbines; and represent the th feature data (e.g., active power) of wind turbine and wind turbine , respectively; is the number of data samples; and and represent the ranks and average ranks.
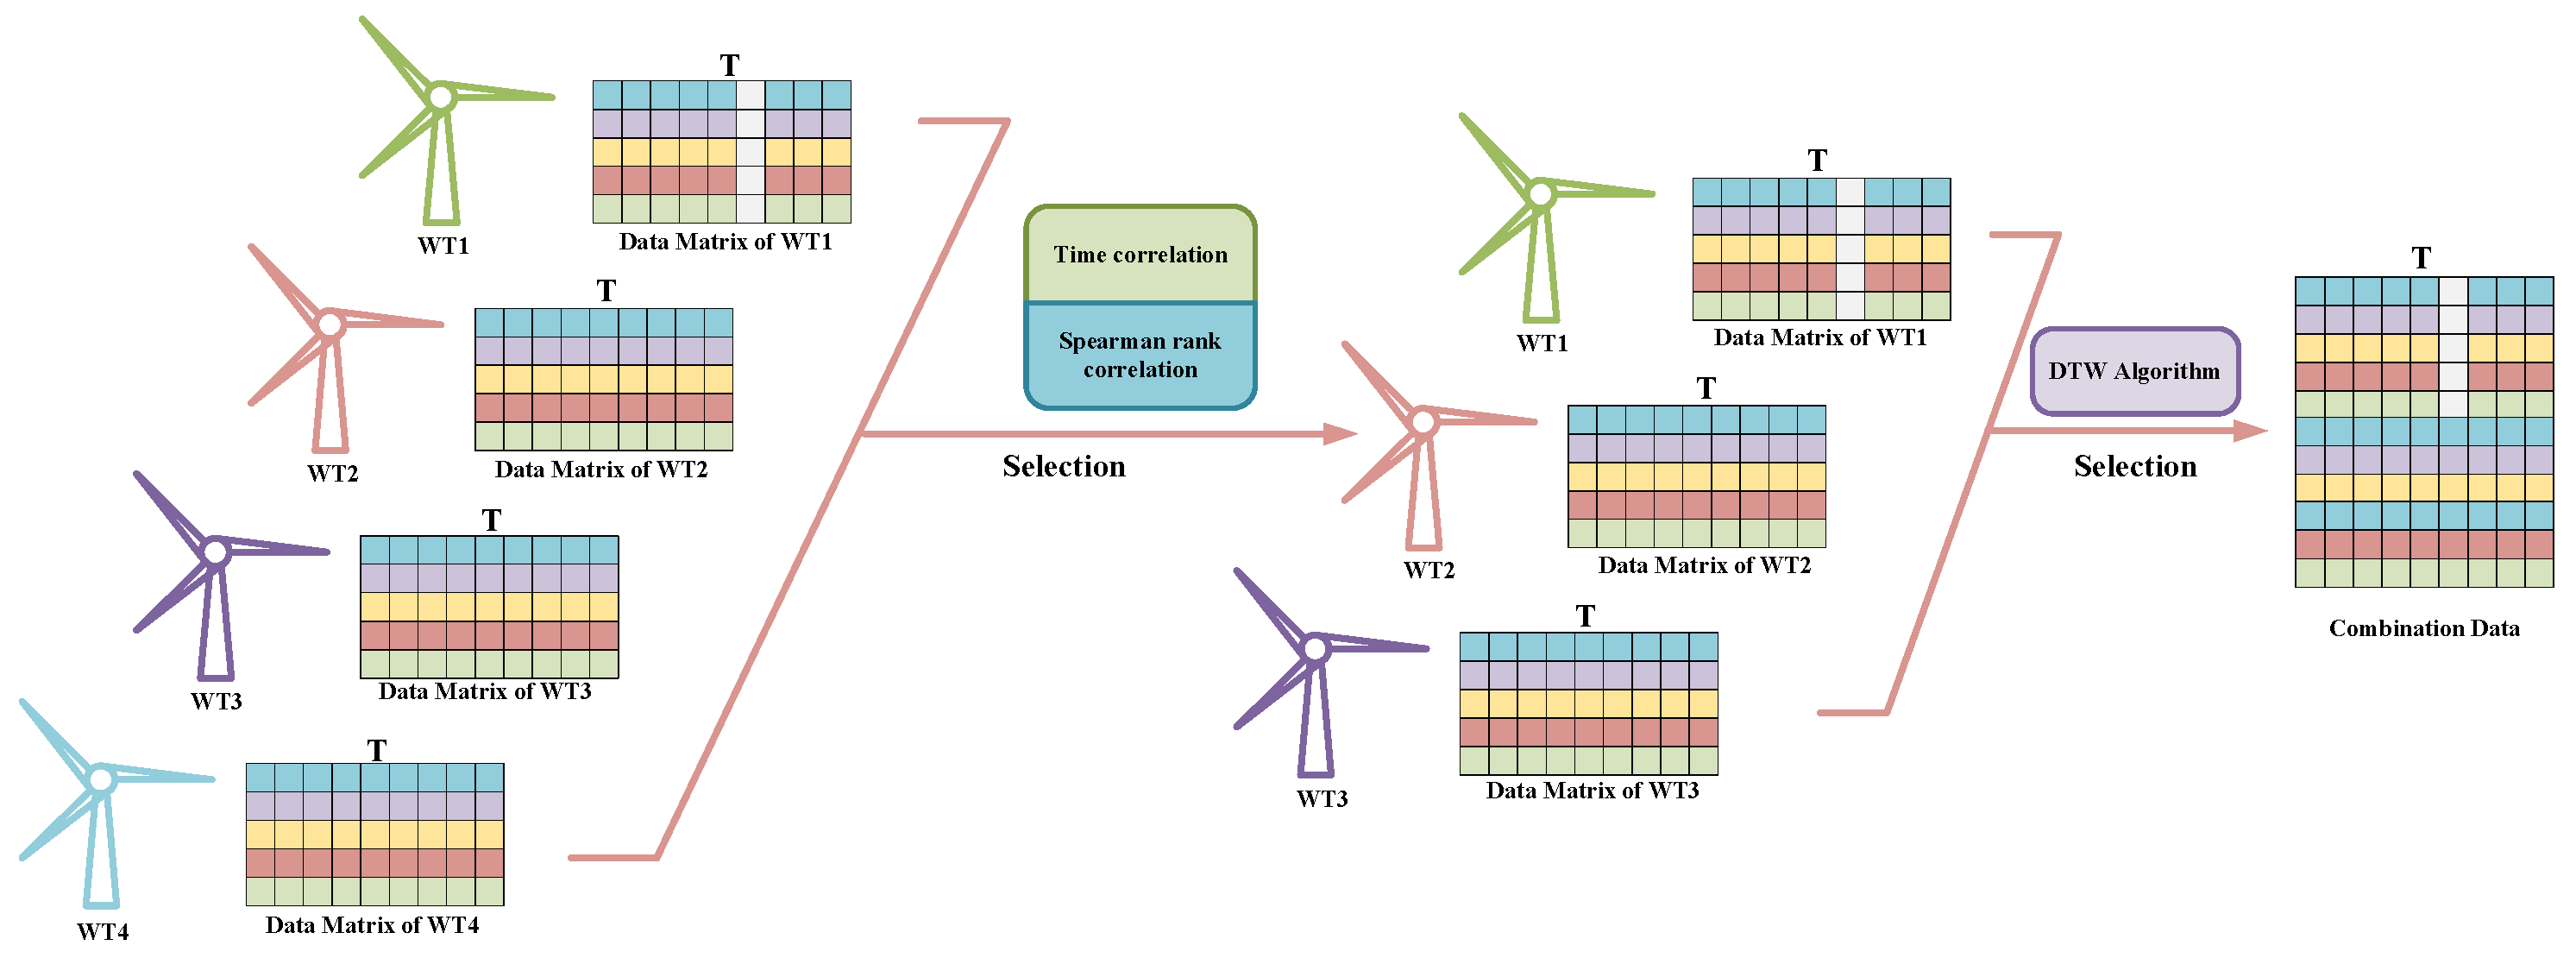
For the convenience of theoretical analysis, this paper defines the turbine with missing data as the target turbine, its electrical data as the target data, and the turbines with high spatiotemporal correlation to the target turbine as reference turbines, with their electrical data defined as reference data. After initially screening the reference turbine data through spatiotemporal correlation, to enhance the reliability of DT-DCGAIN model training, it is necessary to further screen the reference turbine data with higher correlation to the target turbine using the Dynamic Time Warping (DTW) algorithm [
26]. The following elaborates on this process in two steps.
Step 1: Construct a cumulative distance matrix .
First, represent the target turbine data and reference turbine data in matrix form:
where the reference wind turbine
data matrix and the target wind turbine
data matrix contain all the feature data sequences;
and
represent the
-th feature of the reference and target wind turbines, respectively; and
and
represent the time series lengths of the
-th feature for the reference and target wind turbines, respectively, and they may not be equal.
Then, construct a cumulative distance matrix
of dimension
, where each element is calculated using the following formula:
where
and
represent the data of
and
, respectively;
denotes the matrix element; and
,
indicate the row and column numbers.
After constructing the cumulative distance matrix , the equation can be obtained: , where is the minimum warping path distance, and is the last element of .
Step 2: Construct a similarity contribution matrix of dimension and set a reasonable threshold. By performing a weighted average on the elements of each row in matrix , a similarity contribution vector is obtained, where each element represents the similarity score between a specific feature data of the target wind turbine and the corresponding feature data of the reference wind turbine. Subsequently, each element in the vector is compared with a preset threshold, and elements greater than the threshold are selected to form a new reference wind turbine feature dataset , which serves as the conditional input data for training the DT-DCGAIN model.
The similarity contribution matrix
can be constructed using the following formula:
where
is the original similarity contribution matrix
.
Furthermore, each element of the similarity contribution vector
can be calculated as follows:
where
is the element of the similarity contribution vector
.
Finally, the data filtered for similarity to each electrical feature data of the target wind turbine is combined to form the reference dataset:
where
is the feature data of the reference wind turbine obtained after the final screening.
Figure 4 illustrates the schematic diagram of the data screening process for the Similar Wind Turbine Data Matching (SWDM) module. Through the processing of this module, data with higher similarity to the target turbine can be screened and used as training inputs for the DT-DCGAIN model.
3.3. Strongly Correlated Feature Selection Module
The feature data of wind turbines are interdependent; for example, changes in wind speed and direction directly affect power output and generator speed, reflecting correlations among features. Therefore, when a specific feature (such as active power) is missing in SCADA data, feature correlation becomes crucial for imputation. Given the large volume of SCADA data, to improve imputation efficiency and accuracy, it is necessary to screen variables highly correlated with the missing feature. This paper employed the Pearson correlation coefficient and the maximal information coefficient methods to select strongly correlated features, optimizing the imputation process.
First, the Pearson Correlation Coefficient (PCC) method is used to perform an initial screening of all feature data of the target turbine:
where
and
represent two turbine features in the target wind turbine data.
After the initial feature screening using the PCC method, the Maximal Information Coefficient (MIC) method is further applied for secondary feature screening to identify key features that are highly correlated with the missing feature (such as nonlinear, exponential, and periodic features):
where
and
represent the number of interval divisions for target wind farm features
and
,
represents the total number of interval divisions (
,
are the total number of samples),
represents the mutual information between
and
,
and
represent the entropy of features
and
, and
represents their joint entropy.
Figure 5 illustrates the schematic diagram of the data screening process for the Strongly Correlated Feature Selection Module (SCFS). Through the processing of this module, feature variables with higher correlation to the missing feature data of the target turbine can be screened and used as training inputs for the DT-DCGAIN model, thereby enhancing the model’s imputation accuracy and reliability.
3.4. The DT-DCGAIN Model
The GAIN model is an improved version of the Generative Adversarial Network (GAN), specifically designed for imputing missing values in time series data [
16]. By introducing a mask matrix
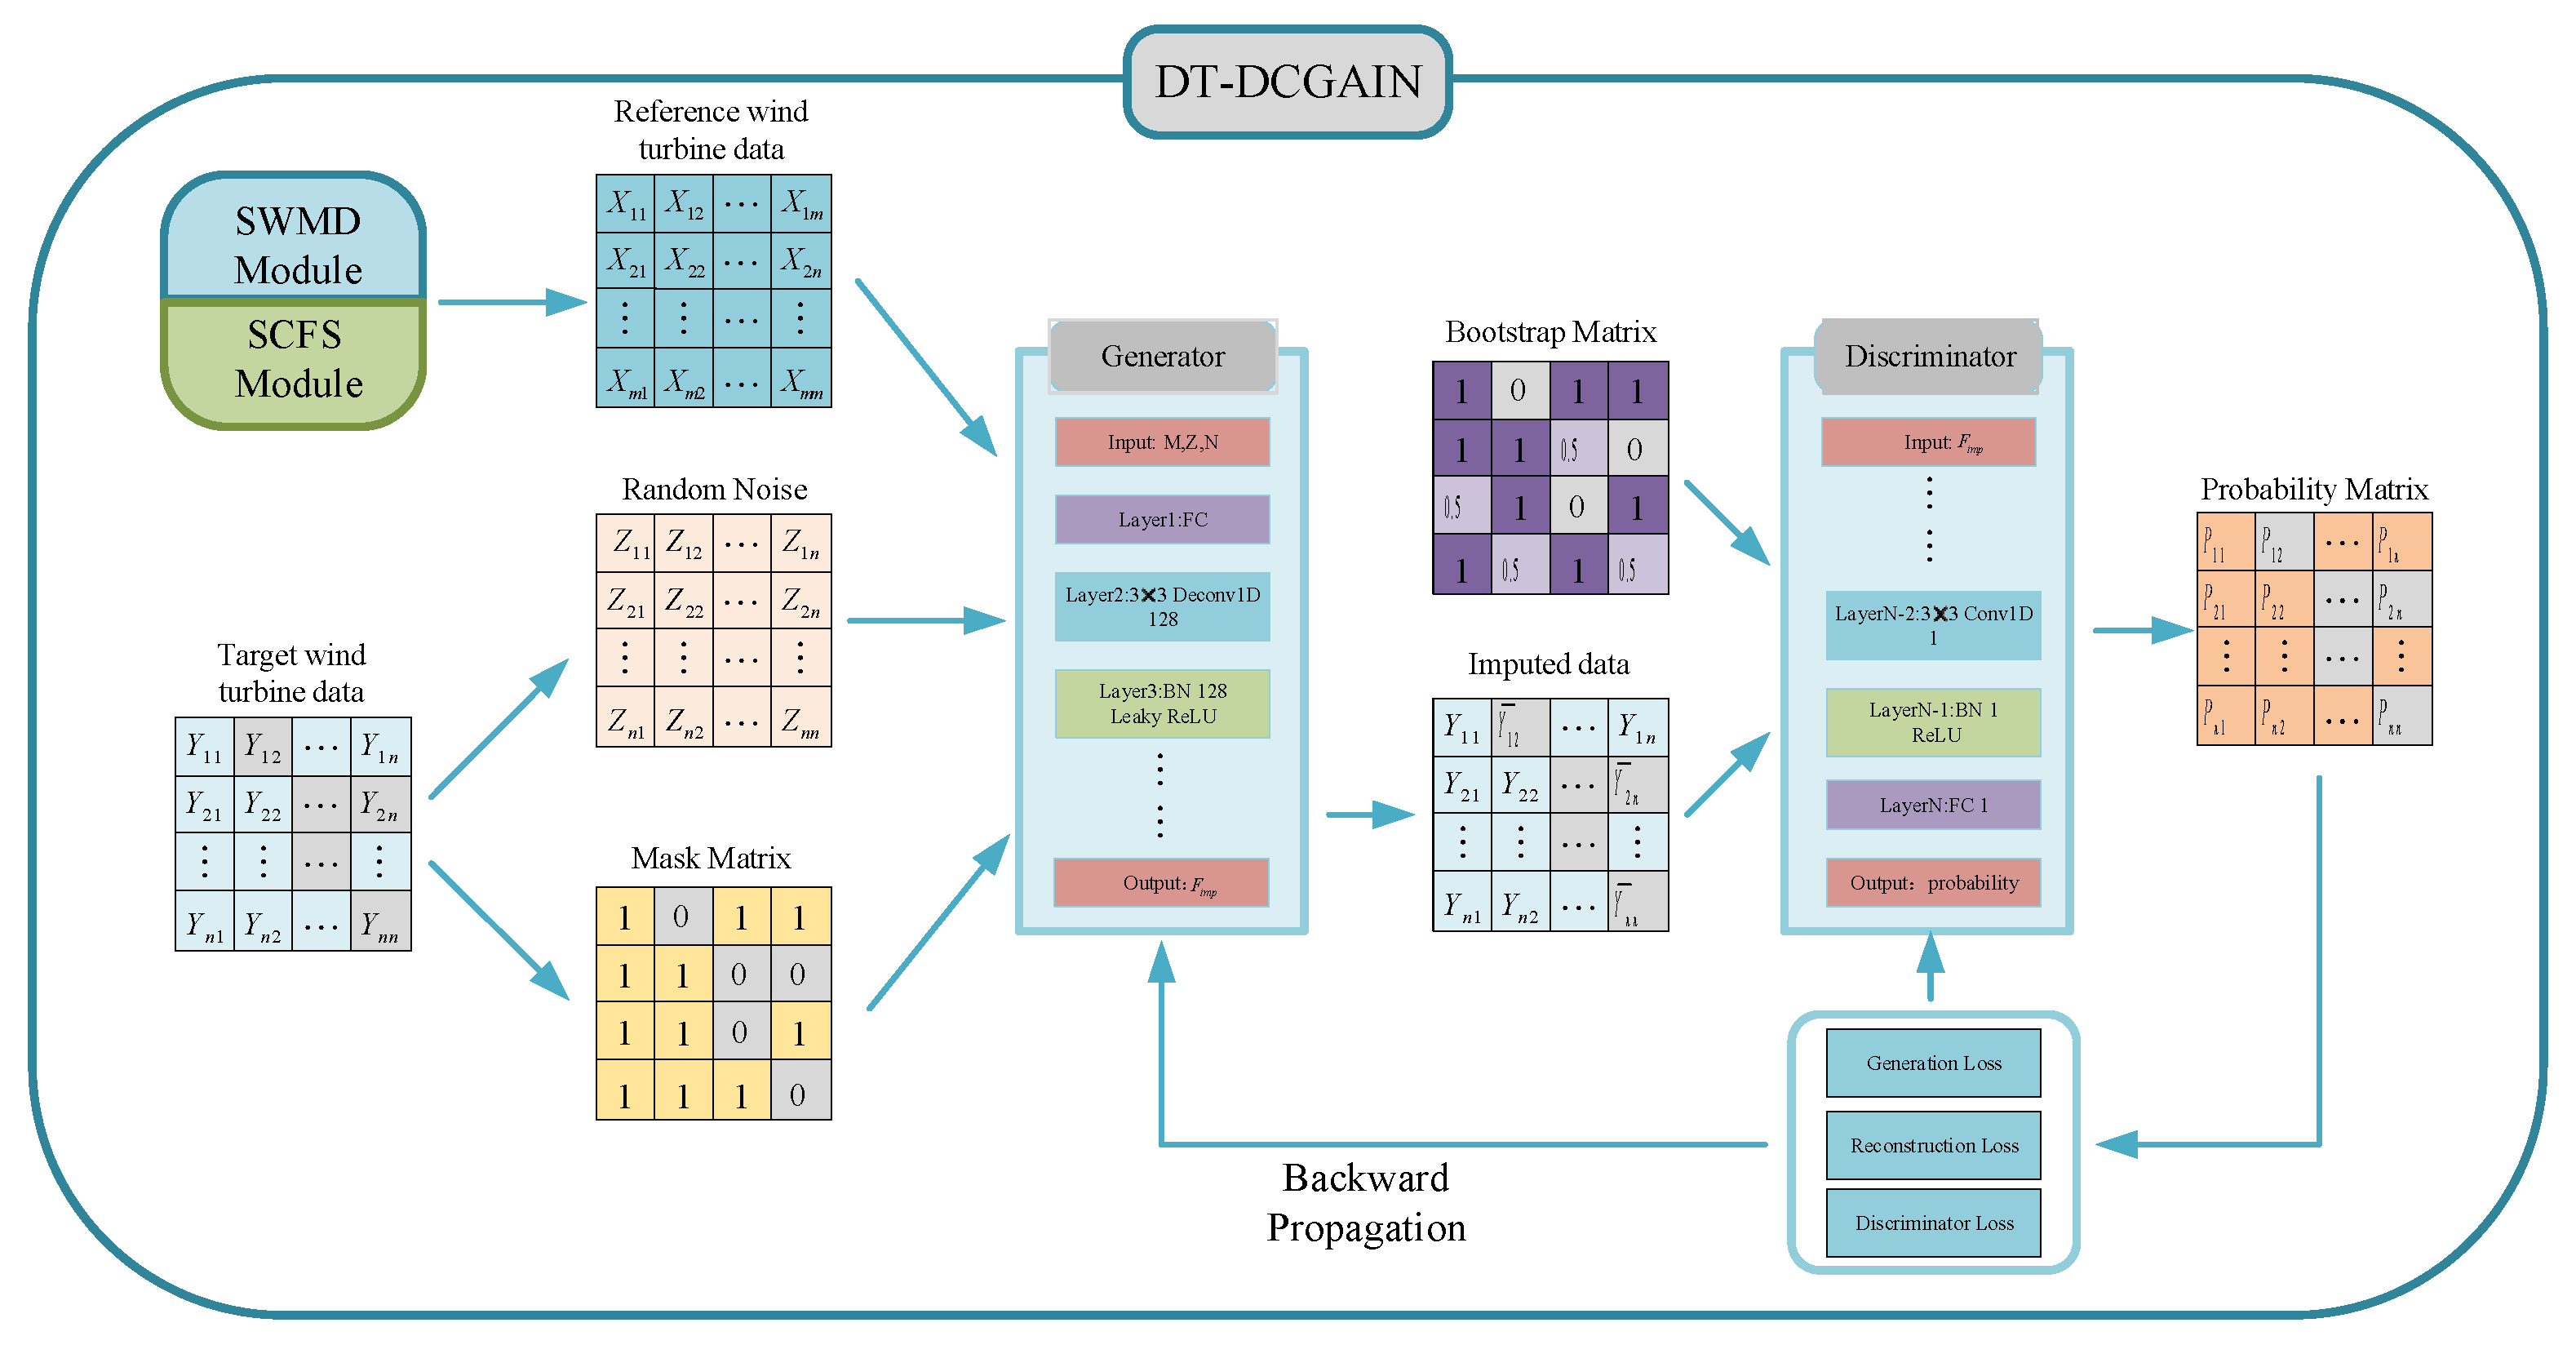
(mask matrix) to identify missing and observed values in the data, this mechanism significantly enhances the efficiency and accuracy of traditional GANs in missing data imputation tasks. However, as mentioned in the introduction, the GAIN model still has certain limitations when applied to wind farm data imputation tasks. Therefore, this paper proposes the DT-DCGAIN model, whose structure is illustrated in
Figure 6.
The model further improves upon the GAIN model, with its core idea derived from the zero-sum game theory in game theory and applies this theory to the adversarial training framework between the generator and the discriminator. The mathematical theoretical foundation of the model will be elaborated in detail below.
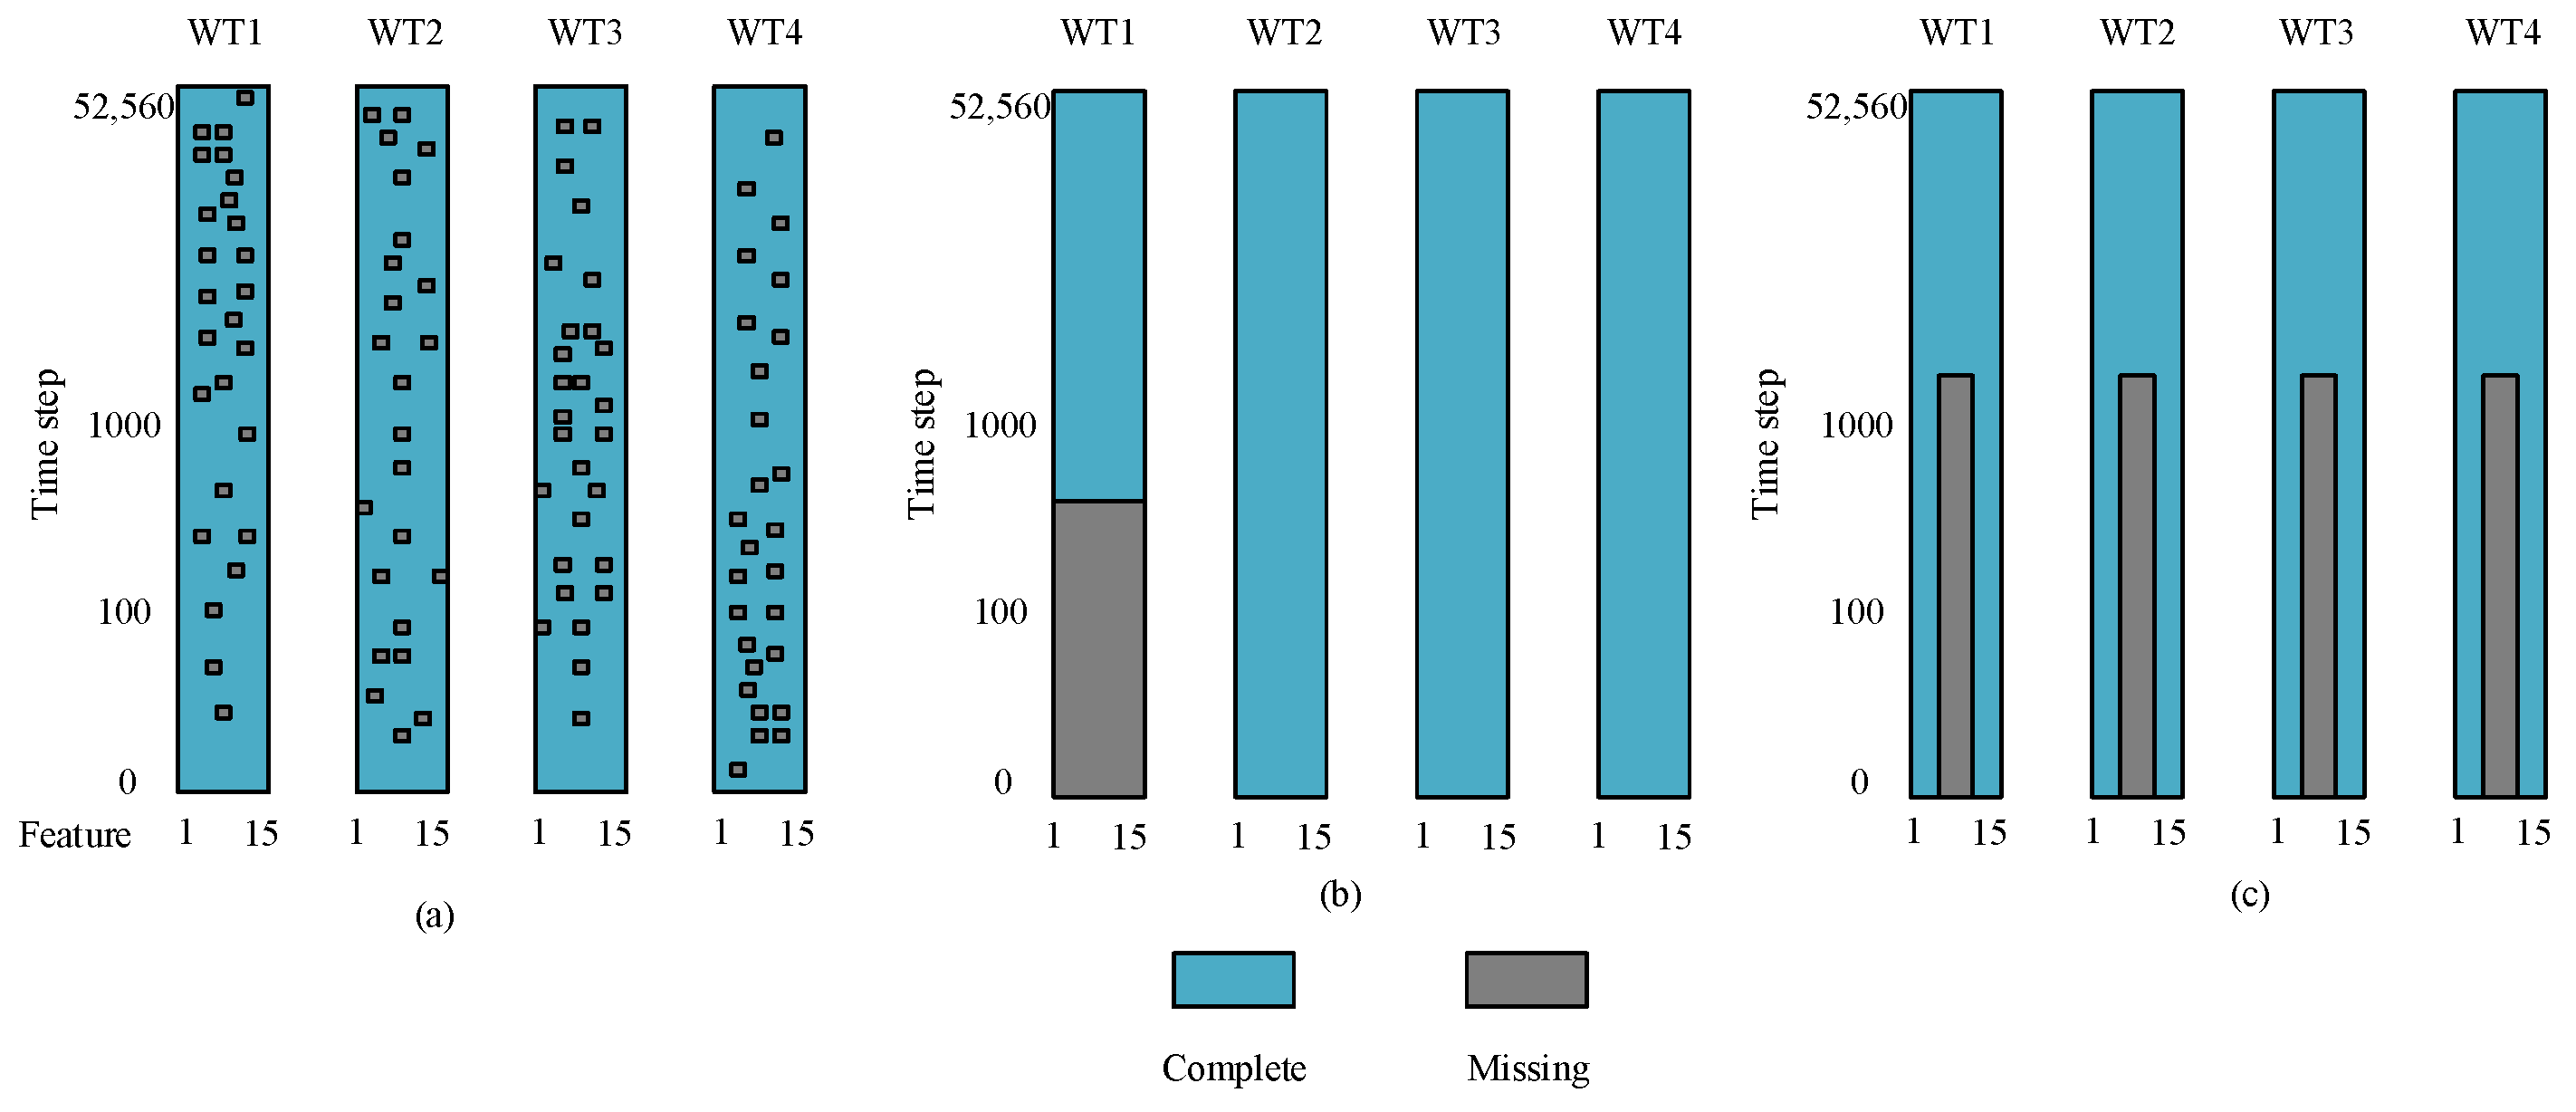
When the wind farm data are missing in a band pattern, the relationship between the real data of the target wind turbine and the mask matrix is . When the data are missing in a feature pattern, the relationship is , where is the matrix after mask processing, and represents the Hadamard product.
When imputing band missing data, the generator of the DT-DCGAIN model takes the similarity contribution matrix , the mask matrix , and a Gaussian-distributed white random noise matrix as inputs, combined with the feature data of the reference wind turbines, to generate estimates of the missing data. At this point, the output of the generator is defined as . If the model is imputing data under the feature missing pattern, the output of the generator is defined as .
The generator imputes the missing data for the target wind turbine based on
and
:
where
represents the data imputed for the target wind turbine.
Additionally, GAIN introduces a hint matrix
as one of its core components. The inclusion of the hint matrix
aims to help the discriminator more effectively distinguish whether the data originate from real data or generated data. The definition of the hint matrix
is as follows:
where
is the predicted value of the mask matrix
.
After obtaining the reference turbine data that matches the target turbine or the strongly correlated features, these data will be used to train the DT-DCGAIN model. Meanwhile, the historical data of the target turbine are still included in the training set to enhance the authenticity and reliability of the imputation results. Both the generator and discriminator of the DT-DCGAIN model are based on deep convolutional networks [
27], consisting of multiple convolutional layers, activation function layers, and batch normalization layers. Depending on the missing scenarios, the inputs and training processes of the generator and discriminator are adjusted and optimized.
In the case of the band missing, the generator takes the similarity contribution matrix
, random noise
, and mask matrix
as inputs to generate wind turbine data
, which is then fed into the discriminator along with real data
. By learning from the historical data of reference turbines and the real distribution, the generator extracts features and enhances its data generation capability. Its goal is to maximize the output probability of the discriminator for the generated data, thereby producing imputed data that closely resembles the real distribution. The loss function of the generator is defined as follows:
where
represents the generator’s generation loss,
represents the generator’s reconstruction loss,
is the generator’s total loss function,
is the weight coefficient.
The discriminator improves its discrimination ability by distinguishing between generated data and real wind turbine data. The input to the discriminator includes conditional information (similar wind farm data), and its goal is to evaluate the plausibility of the generated data. Therefore, the loss function of the discriminator can be expressed as
where
is the loss function of the discriminator, and
represents the known probability distribution of the target wind turbine data.
In the case of feature missing, the generator takes random noise , mask matrix , and strongly correlated features as inputs, enabling it not only to generate missing data from noise but also to enhance imputation accuracy using auxiliary features. Since the reference data come from the target turbine itself, during training, in the generator’s loss function represents the known data distribution of the target turbine. The discriminator also accepts conditional inputs, combining generated or real data with strongly correlated features, allowing it to more accurately evaluate the authenticity of the generated data in a multidimensional feature space.
Ultimately, DT-DCGAIN continuously optimizes the parameters of the generator and discriminator (
,
) through feedback from the discriminator, and iteratively trains until the Nash equilibrium is reached. Mathematically, this optimization process is achieved by minimizing the generator loss function
and the discriminator loss function
. Additionally, to enhance training stability and avoid issues such as mode collapse, computational errors, and training instability, the model introduces the Kantorovich–Rubenstein dual form of the Wasserstein distance and a gradient penalty function, significantly improving robustness.
Among them, represents the calculation of the expected value of the data, and denotes an interpolated sample of the data generated by the generator or the real data. In the case of band missing, is used; in the case of feature missing, is used. is the sampling distribution of , is a random number between 0 and 1, and is the weight coefficient.


