Abstract
Plant diseases and nutrient deficiencies pose significant challenges to food production, making it crucial to identify them accurately and quickly, as their symptoms can often be similar. Prompt and precise detection is essential to implement effective measures that prevent crop losses. While computer vision techniques have demonstrated effectiveness in classification, their high computational demands have limited their adoption by farmers in the field. In this study, a Corn leaf Nutrition Deficiency and Disease network (CNDD-net) is designed based on the ResNet framework, incorporating a depth-wise separable convolution and a convolutional block attention module for a lightweight, high-performance model. The models underwent training, validation, and testing using a corn leaf nutrition deficiencies and diseases data set with seven classes implementing five-fold cross-validation. The performance of the models is assessed using average accuracy, GFLOPs, number of parameters, and model size. Following experiments involving the manipulation of the position of the attention module, the number of feature maps, and the depth of the network, the model was finalised. The CNDD-net design has a model size of 0.24 MB with 48,041 parameters and a GFLOPs of 0.18, providing an average accuracy of 96.71%. Compared to conventional models, this research demonstrates optimal performance and computational complexity, offering an efficient, lightweight solution to identify nutritional deficiencies and diseases of corn leaf, thus supporting sustainable agriculture.
1. Introduction
Maize has been one of the most significant cereal crops, with a diverse range of applications, and has exerted a considerable influence on global economic development in a progressive sequence [1,2,3,4]. However, they are susceptible to viral, fungal and bacterial diseases that have the potential to reduce the production yield by 30% to 80%. This ultimately results in economic loss and may contribute to inflation [5,6]. The yield potential of maize is contingent upon the presence of diseases but also exhibits a 25% reduction in productivity when soil organic matter content declines by a range of 1.7–4.3% [7]. Soil provides essential nutrients that are vital for enzymatic functions and plant health, which are necessary for qualitative and quantitative production. The manifestation of disease infection and nutrient deficiency in plants is evidenced by the appearance of symptoms on the leaves. The necessity for comprehensive soil or plant tissue laboratory testing in diagnostic methods has been a long-standing challenge for farmers [8]. It is likely for nutritional deficiencies to be misclassified as diseases, and conversely, for diseases to be misclassified as nutritional deficiencies [9]. Maize Lethal Necrosis (MLN) and Maize Streak Virus (MSV) symptoms can easily be confused with drought and macro/micro-nutrient deficiency. So, according to [10], a system that can classify nutrition deficiency as well as viral diseases is needed to overcome crop losses.
Traditionally, farmers have relied on their experiences or manual vision inspection, which are expensive, and susceptible to reliability problems. Therefore, the automatic classification of plant diseases and nutrient deficiencies is vital for prompt intervention, helping to avert substantial production and economic losses. Traditional machine learning is limited by manual feature extraction, which restricts its ability to capture complex patterns. In contrast, computer vision techniques in disease detection enable deep learning models to automatically learn hierarchical features from raw data, allowing them to identify intricate patterns and improve disease detection and classification performance [11,12]. Various researchers have implemented deep learning for the classification of maize leaf diseases, achieving high accuracy [13,14,15]. However, the primary concern regarding these models is their size and computational complexity, which limit their suitability for implementation in lightweight, portable devices for use by farmers.
Zeng et al. [16] designed a lightweight LDSNet which comparatively reduced the parameter number but with an accuracy of 95.4%. Fan and Guan [17] modified VGG16 [18] for implementing lightweight which achieved a high accuracy of 98.3% but still has a larger model size with a higher number of parameters. Thakur et al. [19] implemented VGG-ICNN as a customised lightweight model with a combination of VGG and Inception [20], which achieved high accuracy in the plant village overall dataset but was not effective in terms of accuracy. Similarly, the parameters were around 6 million with a model size of 23.2 MB and GFLOPs of 45.7, which is considered a high value for a lightweight model. Although a deep and complex network may offer enhanced detection accuracy, it undoubtedly requires high-performance hardware and access to large training datasets. Therefore, it is crucial to examine the efficacy of lightweight convolutional neural networks for these purposes that can be adopted by the farmers.
A graph convolutional network based on ResNet-50 was developed to diagnose nutrient deficiencies and diseases in plant leaves, specifically for banana, coffee, and potato leaves. However, the model was trained and evaluated separately for each plant type, resulting in an accuracy of approximately 90% but still, the model was not lightweight [21]. The classification of nutritional deficiencies in leaves has been implemented using Convolutional Neural Network (CNN) in palm and black gram plants. However, significant performance with acceptable complexity for a lightweight model has yet to be achieved [22,23]. In the implementation of CNN with reinforcement learning proposed by [24], in the context of rice leaf nutrition deficiencies, a noteworthy level of accuracy of 97% is attained with a mere 1500 datasets. Although significant work on corn leaf nutrition deficiency classification has been limited, notable efforts include the work of Ramos-Ospina et al. [25], who applied CNN for detecting phosphorus content levels in corn leaf with an accuracy of 96%, and Leena and Saju [8], who utilised an optimised Support Vector Machine (SVM) for micronutrient classification, achieving an accuracy of 90%. These findings highlight the need for further research in the field of corn leaf nutrition deficiency classification, particularly the development of lightweight models that maintain high performance, which could offer practical benefits for farmers in the field.
Various studies have been conducted on the automatic detection of nutrient deficiencies and diseases across different plant species [21,22,23,24]. However, there is a lack of research specifically focused on corn species. This gap led to laborious and time-consuming processes for identifying corn leaves affected by nutrient deficiencies and diseases, often resulting in misinterpretation during analysis. Moreover, lightweight models for real-time monitoring of diseases and nutrient deficiencies, tailored for farmers, have been insufficiently explored. This limited understanding increases the reliance on expert consultations or costly tissue and soil tests, which causes an economic burden on farmers. Hence, the key objective of this research is to develop a resource-efficient and computationally optimised network for the classification of corn leaf diseases and corn leaf nutrition deficiencies, along with enhancement in the performance of conventional CNNs by integrating an attention mechanism that can facilitate efficient and portable diagnosis. The convolutional layers, combined with activated depth layers, extract features from the input image datasets. However, model performance can degrade due to background features when encountering unseen images from diverse scenarios. To address this issue and emphasise target features, various studies [26,27,28] have incorporated attention mechanisms into CNN architectures, enhancing model performance. Zeng and Li [29] applied a self-attention mechanism to different layers of a ResNet-based model, evaluating its effectiveness by altering the position of the attention layer. Their findings suggested that placing the attention mechanism at the 8th convolutional layer yielded the highest accuracy in recognising crop leaf diseases. Similarly, Lee et al. [30] used an attention module to the pretrained recurrent neural network and showed significant enhancement of model performance in classifying 20 classes of plant diseases including one healthy class. In this study, a lightweight CNN with depth-wise separable convolution and attention mechanism is designed using the ResNet topology framework [26,31]. The convolutional block attention module (CBAM) is integrated into various positions in between the layers of the network to examine the effect of attention mechanisms and their position on the CNN designed through an ablation study. Furthermore, this study extends beyond the examination of attention mechanism positioning to encompass an investigation of varying layers and channel numbers. Additionally, the effectiveness of the models with respect to varying positions of attention mechanisms, as well as different layer and channel numbers, is evaluated and compared using average accuracy as a classification metric and GFLOPs as a measure of computational complexity. On top of that, the relationship between computational complexity, network parameters, and model sizes is also discussed. The models used a dataset that includes images of maize disease and nutritional deficiencies, split into a 3:1:1 ratio for training, validation and testing purposes. For this approach, k-fold cross-validation where the value of k = 5 is used.
The rest of this article consists of the following: Section 2 describes the data set and method implemented. Section 3 describes the results of all experiments and a brief discussion of the results is performed along with their comparison with existing state-of-the-art and previous similar research. The conclusion of the research is presented in Section 4 along with potential future direction.
2. Materials and Methods
2.1. Data Collection and Preprocessing
Seven classes of corn leaf images were collected, comprising four image classes of corn leaf exhibiting symptoms of nutritional deficiency and two image classes of corn leaf infected with a viral disease, as well as one image of a healthy plant. The soil is the primary source of essential nutrients required for plant growth, such as nitrogen, zinc, iron and phosphorus [32]. Nutrient deficiencies in plants can be diagnosed through two primary methods: soil testing, which determines the availability and quantity of nutrients that the soil can supply to the plant, and leaf tissue testing, which measures the concentration of specific nutrients within the plant tissues, indicating the extent to which the plant has absorbed them from the soil [33,34]. It is evident that both tests need to have a significant financial investment and are time-consuming. However, it should be noted that the soil test has the capacity to provide a comprehensive overview of all plants within a designated plot. Conversely, the tissue test is capable of yielding information pertaining to a single plant. A soil test was conducted on a designated plot of land, whereupon images were collected to validate that the soil had nutrition deficiencies. So, with the assistance of an agronomist subsequent preprocessing and labelling of the collected images were conducted prior to the implementation of the model.
The employment of deep learning techniques to monitor nutritional deficiencies and diseases in leaves, by means of visual symptoms, constitutes an alternative measure that is both efficient in identification and effective in terms of resource utilisation [21,35,36]. The images of plants exhibiting symptoms of nutritional deficiency were captured in a field situated within Pokhara Metropolitan City, Ward 16 of Nepal using a non-destructive data collection approach. The dataset collected in the field is during different daylight conditions varying from mid-morning to early evening, different angular ranges, and non-uniform distance ranges, considering all natural backgrounds indicating variations in collected datasets. The images of plants infected with a viral disease were obtained from the Lucana project in Tanzania [37]. The viral images of crop leaves gathered from Arusha, Tanzania received similar temperature patterns (ranges between 17 to 22 °C) throughout the year while fluctuating temperature patterns (ranges between 11 and 23 °C) can be observed in Pokhara, Nepal from where nutrient deficiency image datasets were collected. Meanwhile, the average rainfall received by Arusha (ranges between 9 to 158 mm) and Pokhara (between 109 and 1114 mm) are also drastically different throughout the year, with the least rainfall in Arusha (97 days in a year) compared to Pokhara (over 189 days in a year). Arusha of Tanzania (1400 m) is located at a high elevation compared to Pokhara of Nepal (822 m), which showcases the different geographical and environmental variations between the two study areas [38]. Sample images in each class can be visualised in Figure 1. Images with multiple leaves in a single image were cropped before categorisation, but images with any background are accepted to generalise its implementation. A total of 4486 images, representing seven distinct classes, were employed for the training, validation, and testing of the models. Table 1 below provides detailed information about the dataset, including class label, class name, number of images per class, and source of the images. The number of data presented in Table 1 is data before augmentation. Here, we have applied “On the fly augmentation” techniques only in the training phase. So, the number of data is not increased using traditional methods; however, the data are increased virtually during training phase. To increase the diversity of the training images, augmentation techniques such as horizontal flips and vertical flips each with probability (p) value of 0.5, rotation at shift factor of 0.1, with scale of factor 0.2 and rotation limit of 10 degrees with a probability value of 0.5 were employed. The images were resized with same height and width of 224 pixels. The three colour channels were normalised with mean and standard deviation values (mean= [0.485, 0.456, 0.406], standard deviation [0.229, 0.224, 0.225]). The valid and test images were resized to standardise the input size of the model.
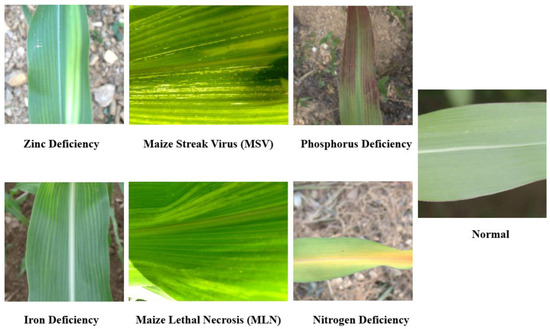
Figure 1.
Sample of nutrition deficiency, normal and viral disease infected corn leaves.

Table 1.
Detailed information on the corn leaf disease and nutritional deficiency datasets, including class label, image distribution per class, and data collection sources.
2.2. Lightweight Attention-Based Architecture Design
Implementing a residual network on a CNN architecture improves performance in the case of detection and classification [39]. This paper addresses the need for a lightweight model using depth-wise separable convolution (DSC) to reduce the number of parameters and computational complexity and CBAM to improve the feature representation. This is designed based on the residual framework to overcome the degradation problem [31]. It consists of four residual layers each with a depth-wise convolution. The model is finalised through a series of rigorous experiments with variations in feature maps, network depth, and attention block position. This research consists of a total of 10 DSC layers. The first and last residual blocks employed two DSC layers each, while the second and third residual blocks utilised three DSC layers (represented as (2, 3, 3, 2)). The CBAM attention module was embedded between the third and fourth residual blocks [26]. Figure 2 shows the detailed architectural representation of the proposed CNDD-net model, together with a detailed description of its parameters, which are listed in Table 2. ResNet architecture [31] was used as a base model integrated with depth-wise convolution (DSC) and channel-based attention mechanism (CBAM) strategically to optimise model convergence. The network begins with a convolutional layer comprising 16 filters and a 7 × 7 kernel. This is followed by batch normalisation, a rectified linear unit (ReLU) activation function, and max pooling, which serves to downscale the input. The network comprises four consecutive residual blocks, wherein depth-wise separable convolutions are employed to effectively reduce the parameter count and computational cost. With series of experiments varying the network depth and feature maps along with position of attention block a lightweight attention-based CNDD-Net was proposed. Each residual block is coupled with batch normalisation and ReLU activation. The architecture incorporates CBAM for enhanced feature representation, involving both channel and spatial attention mechanisms. Ultimately, it utilises adaptive average pooling to transform 2D feature maps into 1D, followed by a dropout layer to avert over-fitting and a fully connected layer to generate the final output. This design establishes an equilibrium between model complexity and performance, maintaining a low parameter count and high efficiency.
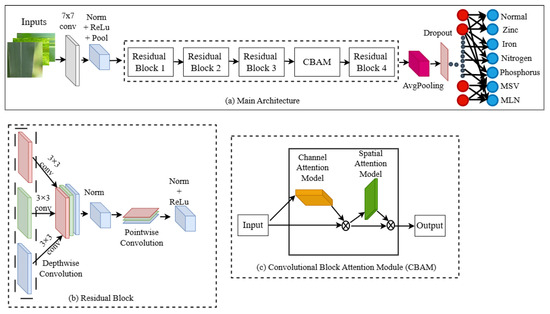
Figure 2.
Overview of proposed CNDD-net architecture. (a) Consists of input to output through main architecture pipeline. (b) Represents depth-wise and point-wise convolution in each residual block. (c) Demonstrates the channel and spatial attention in CBAM.

Table 2.
Detailed architectural parameters of the proposed CNDD-net model.
2.3. Depth-Wise Separable Convolution (DSC)
Depth-wise separable convolution involves applying a 3 × 3 depth convolution to each input channel individually, followed by a 1 × 1 point-wise convolution to combine the outputs, as shown in Figure 3. Both the depth-wise and point-wise convolutions are typically subsequently followed by the application of batch normalisation (BatchNorm) and a ReLU activation function. In this research, ReLU activation was applied after point-wise convolution to regulate the learning dynamics and enhance the model’s ability to learn complex and non-linear patterns. Although the result of the depth-wise separable convolution is almost equivalent to that of the standard convolution, it significantly reduces the number of parameters and computations, to about one-eighth of that required by regular convolution operations [40]. In a standard convolution operation, for an input size, the count of parameters and computational overhead are higher than in a depth-wise separable convolution. These can be determined using Equations (1)–(4) [41].
where Hout and Wout are height and width of the output feature map, Cin and Cout are no of input and output channels, K×K is size of kernel and Hin and Win are height and width of the input feature map which can be visualised in Figure 3 too.
No. of parameters (Standard convolution) = K × K × Cin × Cout + Cout
No. of operations (Standard convolution) = Hout × Wout × K × K × Cin × Cout
No. of parameters (DSC) = K × K × Cin + Cin × Cout
No. of operations (DSC) = Hout × Wout × [(K × K × Cin) + (Cin × Cout)]
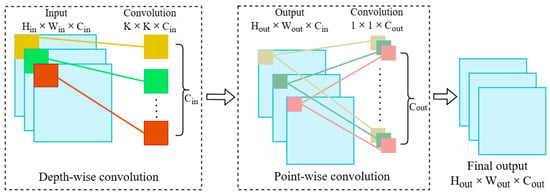
Figure 3.
Block diagram of depth-wise separable convolution.
The depth-wise separable convolution greatly reduces the number of parameters and computational operations required in comparison to standard convolution, particularly when the number of input channels (Cin and Cout) is large. This efficiency makes it an ideal choice for use in resource-limited environments, such as mobile devices, where computational resources are constrained [42].
2.4. Convolution Block Attention Mechanism (CBAM)
CBAM incorporates channel attention and spatial attention modules sequentially [28], as illustrated in Figure 4. The module generates attention maps across two distinct dimensions: channel and spatial, in sequence, using an intermediate feature map as input. The resulting attention maps are then multiplied by the input feature map, thereby facilitating adaptive feature refinement that can be implemented in computer vision tasks with minimal computational overhead. CBAM initially prioritises significant channels through the application of global average pooling and global max pooling to the feature map representing channel attention. Subsequently, it highlights significant spatial locations within the feature map through the application of spatial attention. Channel attention followed by spatial attention can be implemented using Equations (5)–(8), which form a framework for CBAM [28,43].
Channel attention map (Mc) = σ (FC (Concat (GAP(F), GMP(F))))
Refined feature map after channel attention (F′) = F × Mc
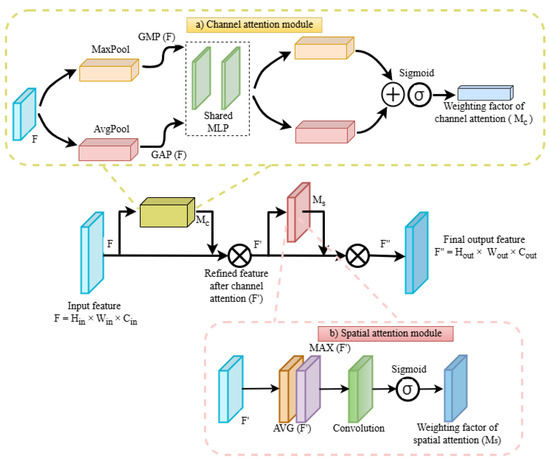
Figure 4.
Architectural diagram of convolution block attention module (CBAM).
The GAP(F) function provides the mean value of each channel, whereas the GMP(F) function provides the maximum value of each channel. The concatenated vector is then passed through the fully connected (FC) layer, and the result is passed through a sigmoid activation function (σ). This value represents the attention weight for each channel, which is within the range of 0 and 1. A higher value indicates a greater importance for the corresponding channel. Subsequently, the channel attention map is applied to the input feature map(F) through element-wise multiplication, with the objective of adjusting the channels in accordance with their respective learned importance.
Spatial attention map (Ms) = σ (Conv7(Concat (AVG(F′), MAX(F′)))
Final refined feature map after spatial attention (F′′) = F′ × Ms = (F × Mc) × Ms
The AVG(F′) function performs the channel-wise average pooling, whereas the MAX (F′) function performs the max pooling across the channel dimension resulting in two 2D maps, one from each pooling. The two pooled maps are then concatenated along the channel dimension and subsequently processed through a Conv7 layer, which is followed by a sigmoid activation function (σ). The spatial attention map is then applied to the refined feature map obtained from channel attention to obtain a final refined output feature map after spatial attention.
3. Experiments and Discussion
3.1. Experimental Conditions
The proposed lightweight model, along with all other models incorporating varying channels, layers and attention module positions, were accessed on the same image datasets. Moreover, to ensure the fairness and objectivity of the comparison, the same hyper-parameters were maintained consistently across all models [44]. The training hyper-parameters used in this evaluation framework are provided in Table 3. In this research, six hyperparameters were tuned to optimise model convergence and evaluation. The batch size was tested across a range of values from 8 to 64, increasing in increments of 8. Based on memory constraints, a batch size of 32 was identified as the most suitable. Adam optimiser was used as a default due to its widespread adoption and versatility for the image classification task [45]. The learning rate was tested across a range of values from 0.01 to 0.000001, step factor of 10. Within this range, a learning rate of 0.0001 was selected based on optimal model convergence. The model was trained for a fixed number of epochs, which was set at 150. Likewise, the 0.01 value of weight decay was selected across a range of values from 0.1 to 0.0001, step factor of 10 to ensure overall model robustness. Since we have multiple classes the well-established cross-entropy loss function was used as default for this research [46]. The experiment was run on a 13th generation Intel Core i7-13700F processor, an NVIDIA (Manufactured by Nvidia Corporation, Santa Clara, CA, USA) RTX 3090 GPU (24,576 MiB of memory), and 96 GB of RAM hardware. The software environment included an operating system of Ubuntu 20.04.6 LTS, Python 3.11.5 and the PyTorch framework (version: 2.2.0 + cu121). The optimally trained model was preserved for testing purposes in each case. The performance of the models was assessed using accuracy as the standard metric, and the resulting values were subsequently averaged, as shown in Equations (9) and (10) [47]. The 95% confidence interval (CI) was calculated to reflect uncertainty and variability in a five-fold cross-validation. The size of the model was defined by the aggregate number of network parameters employed (as in Equation (11)) and the memory space required for the model. The computational complexity was evaluated by assessing the number of floating-point operations (FLOPs), (both multiplication and addition) which quantify the total mathematical operations required for both the forward and backward propagation of an input image. Initially, the calculation is performed for each convolution layer, and the summation is subsequently computed for the entire CNN network, as presented in Equations (12) and (13) [48,49].
where represents a true positive, a true negative, a false positive, and a false negative with respect to the predicted class.

Table 3.
List of hyper-parameter values for the network model.
In the case of -fold cross-validation, the average accuracy is computed as the mean of the accuracies from each fold. Where is total number of folds and Ai is the accuracy of ith fold.
where is height of filter (kernel), is width of the filter, Din is depth of input, Nfilters is number of filters, Nin is number of input neurons, Nout is number of output neurons, Hout is height of output feature map and Wout is depth of output feature map.
For this experimental setup the collected dataset was randomly split into training, validation and testing sets using 5-fold cross-validation approach. For each fold, this model was trained using the training data and the best model was selected based on minimum validation loss. The accuracy for the test data was obtained by the best model. These experiments were replicated for five folds and average accuracy was calculated. Simultaneously, the feature map, the depth of the network and the position of the attention block in the CNND-net architecture were varied and the above experimental setup was repeated. In each experiment accuracy along with the GFLOPs, the number of parameters and the model size were computed and compared with each other to determine the most efficient model in terms of accuracy and computational cost. The series of experiments performed was summarised in Section 3.2, Section 3.3 and Section 3.4. While the findings of this research were compared with previous research under Section 3.5.
3.2. Experiment 1: With Variation in Channel Numbers (Feature Maps)
For CNN, the channels refer to the depth of the feature maps and are important for capturing multi-dimensional information from the input data. Here, a custom CNN model with ResNet framework was designed and imposed with DSC in their residual layers. Training, validation and testing were conducted using a five-fold cross-validation approach for all experiments with varying numbers of channels {8, 16, 32, 64}, {16, 32, 64, 128} and {32, 64, 128, 256}, which represent the combinations of channels utilised in each layer. The relationship between the number of channels and the model’s performance is contingent upon the size of the dataset, the regularisation methods employed and the network architecture. The addition of further channels may enhance performance to a certain extent; however, beyond this point, the performance or result may decline [50]. Table 4 illustrates the impact of varying the number of channels in each layer on the value of GFLOPs, the number of parameters, the model size and the average accuracy.

Table 4.
GFLOPs, number of parameters, model size and average accuracy with variation in channel numbers.
Figure 5 demonstrates the relationship between accuracy and GFLOPs when the channel numbers are varied in each case. The red, green, and blue points in the graph represent the average accuracy from five folds, while the vertical bars aligned with each point indicate the range of the 95% confidence interval of accuracy in each respective channel combination. The model with a reduced channel count {8, 16, 32, 64} exhibits decreased complexity but demonstrates suboptimal performance on test data. Conversely, the model with channel {32, 64, 128, 256} displays elevated complexity but exhibits accuracy that is commensurate with channel count {16, 32, 64, 128}. Since this research focused on designing a lightweight model, the accepted model in this situation is with channel {16, 32, 64, 128}, which has an average accuracy of 96.71% and 0.18 GFLOPs. The 95% CI for this channel combination is also in a reasonable range of 96.38 and 97.03. This indicates that there is not much variance in accuracy when simultaneous experiments are conducted. The presence of an overlap between the blue and green vertical lines suggests that there is no statistically significant difference in terms of average accuracy. This is due to the fact that the objective is to design a lightweight model. Consequently, the feature map with {16, 32, 64, 128} having a lower GFlops value is selected as a suitable model. Increasing the depth of the feature map the feature extraction ability increases, increasing the performance of the network but subsequently increasing the complexity too [51]. In this research, the model with channel {16, 32, 64, 128} exhibited a reasonable value of complexity, as indicated by a GFLOP of 0.18 with a parameter number of 48,041 and a model size of 0.24 MB. This resulted in the highest average accuracy of 96.71% (Figure 5). The channel (feature map) screening strategy optimises CNNs by evaluating feature map contributions to accuracy, reducing computational resources and improving speed bridges large CNNs and resource-constrained devices through pruning, improving both efficiency and performance, as stated by [52]. To resolve such issues, it is advisable to identify the specific channel number that corresponds to the problem statement.
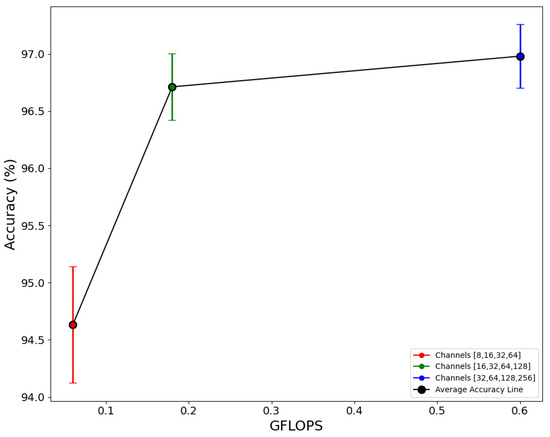
Figure 5.
The relationship between accuracy and GFLOPS with various combinations of channels.
3.3. Experiment 2: With Variation in Layer Number (Depth of Network)
For a CNN layer, refer to the depth of the network, which plays a crucial role in capturing hierarchical features from simple patterns. Increasing layers could indeed enhance the extraction of sophisticated features but it is imperative to balance in depth of the network to avoid overfitting and excessive resource usage [53]. The experiments were conducted using a five-fold cross-validation approach, with the training, validation, and testing processes incorporating different numbers of layers. In the four residual layers, the following format of layer were used: (1, 2, 2, 1); (2, 2, 2, 2); (2, 3, 3, 2); and (3, 4, 4, 3). Table 5 highlights the impact of varying the number of layers in each residual block on the value of GFLOPs, the number of parameters, the model size, and the mean accuracy.

Table 5.
GFLOPs, number of parameters, model size and average accuracy with variation in layers in residual block.
The relationship between accuracy and GFLOPs, when the layer number in each residual layer is varied, has been highlighted in Figure 6. The red, blue, green, and purple points in the graph represent the average accuracy from five folds, while the vertical bars aligned with each point indicate the range of the 95% confidence interval of accuracy in each respective combination of layers. The model with layers (1, 2, 2, 1); (2, 2, 2, 2) and (2, 3, 3, 2) demonstrate reasonable decreased complexity with similar accuracy. A combination with layer (2, 3, 3, 2) exhibited an average accuracy of 96.71%, while the layer (3, 4, 4, 3) with increased complexity did not reach the same level of accuracy, showing an average of 95.54%. In this scenario, the primary objective was to develop a lightweight yet efficient model, with a comprehensive evaluation of layer variations. The model with layer (2, 3, 3, 2) was identified as the optimal configuration demonstrating an average accuracy of 96.71%, while exhibiting a modest 0.18 GFLOPs and a model size of 0.24 MB, with a total parameter count of 48,041. The 95% CI for layer combination (2, 3, 3, 2) is also in a reasonable range of 96.38 and 97.03 as compared to others. This indicates that there is not much variance in accuracy when simultaneous experiments are performed. The depth of CNNs is a critical factor in determining model performance, as it enables the balance between local and global information [54]. However, it is important to note that excessive depth can be detrimental to the model’s effectiveness. Since change in depth generally does not have a significant effect on parameters and GFLOPs, it is always a better idea to have trial and error to determine it.
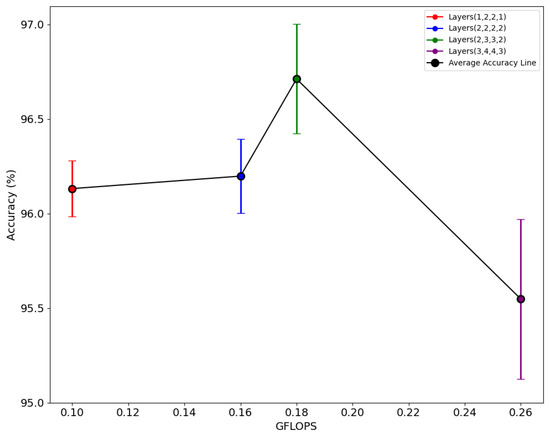
Figure 6.
Relationship between accuracy and GFLOPS with different layer numbers.
3.4. Experiment 3: With Variation in Attention Block Position
The attention mechanism strengthens the representational ability of CNNs by enabling the model to emphasise important features, thereby capturing long-range dependencies and enhancing feature interactions [55]. Bhujel et al. [26] concluded CBAM block was best for fine-grained feature extraction in tomato leaf disease classification. Since, in this research nutrition deficiencies and diseases seem similar, CBAM as an attention module was adopted and a series of experiments were conducted to identify the most effective position for CBAM in the architecture with better performance. The experiments were carried out using a five-fold cross-validation approach, with the training, validation, and testing processes varying the position of the attention block. The CBAM attention block was implemented in the following ways: no CBAM block, between all residual layers, between the first and second residual layers, between the second and third residual layers and between the third and fourth residual layers. Table 6 outlines how changing the placement of the CBAM attention block within the architecture affects GFLOPs, parameter count, model size, and average accuracy.

Table 6.
GFLOPs, number of parameters, model size and average accuracy with variation in attention module position.
The relationship between accuracy and the number of parameters when the CBAM position in each residual layer is varied has been represented by Figure 7. The red, purple, blue, green, and brown points in the graph represent the average accuracy from five folds, while the vertical bars aligned with each point indicate the range of the 95% confidence interval of accuracy in each respective position of the attention block. The model with CBAM block imposed in between the third and fourth layer exhibits an average accuracy of 96.71% with a model size of 24 MB and 48,041 parameters, while the GFLOPs value stays unchanged.
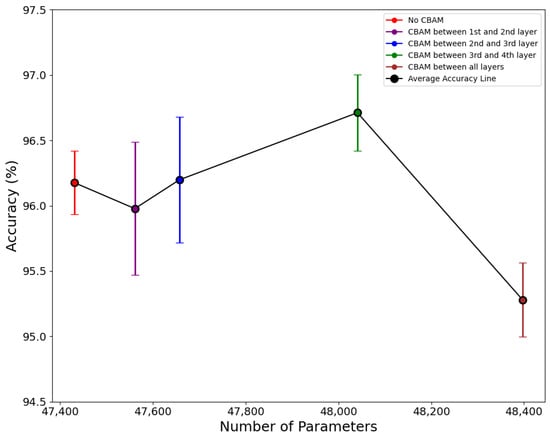
Figure 7.
Relationship between accuracy and number of parameters with various CBAM positions.
The 95% CI for this layer combination is also in a reasonable range of 96.38 and 97.03. The red, purple and blue vertical lines overlap with the green line, indicating that there is no significant difference in accuracy. This suggests that the placement of the CBAM block has a very small effect on overall accuracy. However, the CBAM block position is experimented with together with different depths and feature maps of the network, this implies that CBAM placement alone may not have a significant impact on accuracy. Overall, implementing the CBAM attention block did not affect the GFLOPs value or cause significant changes in the model size and number of parameters, but it led to a notable improvement in accuracy. The performance evaluation of any model with CBAM imposed depends upon the CBAM position and number, for that an optimal configuration for the extraction of discriminative features should be chosen appropriately. The performance of a model incorporating the CBAM block is contingent on its placement and quantity; therefore, selecting the optimal configuration is imperative for the effective extraction of discriminative features [56].
3.5. Evaluation Metrics of Lightweight CNDD-Net
Figure 8 provides the sum of the confusion matrix from 5-fold test data that provides a general overview of the prediction of the unseen image dataset on the respective model. Overall, the model can predict actual class with high performance. However, among all classes, the extracted features of zinc deficiency are likely to be predicted with iron deficiency, phosphorus deficiency and MLN disease classes and vice-versa. Overall, Table 7 provides the value of FPR and FNR in each class of the test data indicating iron deficiency, MLN, MSV, and zinc deficiency leaves, which are likely to be predicted false compared to other classes. Figure 9 provides general sample images of the predicted class with respect to the original class where the clear misclassification between classes can be observed. For instance, the features of nitrogen deficiency images resemble phosphorus deficiency likewise phosphorus deficiency resembles zinc deficiency which can be compared with sample images in each class in Figure 1. This suggests that our model can be optimised with a higher number of diversified datasets for enhancing performance.
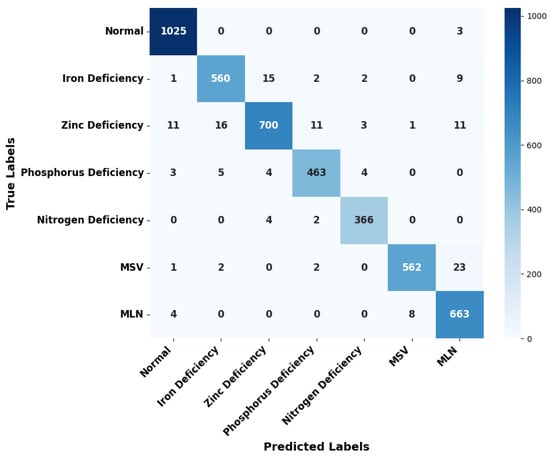
Figure 8.
Aggregation of confusion matrix from the 5-fold test data.

Table 7.
Model performance based on false positive and false negative rate of test data.
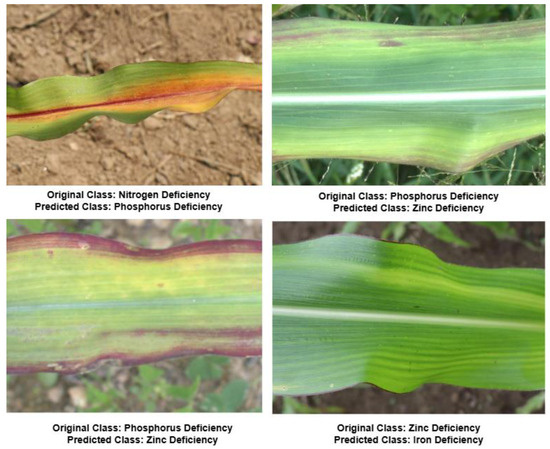
Figure 9.
Sample leaf images with actual and predicted class.
3.6. Performance Evaluation of This Research with Conventional Model and Previous Studies
The proposed model, along with SqueezeNet [57] and EfficientNetB0 [42] (pre-trained on ImageNet via transfer learning), is fine-tuned and trained on the maize leaf nutrition deficiencies and diseases dataset. All models are then evaluated with the same test set and compared using the same experimental conditions for the effectiveness of the model. The results in Table 8 conclude that the proposed model performs better than the other established conventional models. This research achieves a marginally higher average accuracy compared to SqueezeNet and EfficientNetB0 while having 15 times fewer parameters than SqueezeNet and 97 times fewer parameters than EfficientNetB0. Additionally, the proposed model’s size is 12 times smaller than SqueezeNet and 76 times smaller than EfficientNetB0. Additionally, in terms of GFLOPs, SqueezeNet has 1.5 times more than this research model, and EfficientNetB0 has 2 times more. Figure 10 shows the relationship between accuracy and GFLOPs for the proposed model and other models. The green, red, and blue points on the graph represent the average accuracy across five folds, with the vertical bars corresponding to each point showing the range of the 95% confidence interval of accuracy for each model. Notably, the confidence interval range for the proposed model falls within an appropriate range. The overlap observed between the blue and green vertical lines suggests that average accuracy does not show a statistically significant difference. However, the primary goal of the research is to have a lightweight efficient model. In summary, the proposed model achieves an optimal balance of higher performance and lower resource requirements, thus offering an efficient alternative to existing models for practical deployment.

Table 8.
Performance comparison of this research with conventional models in terms of GFLOPs, number of parameters, model size and average accuracy.
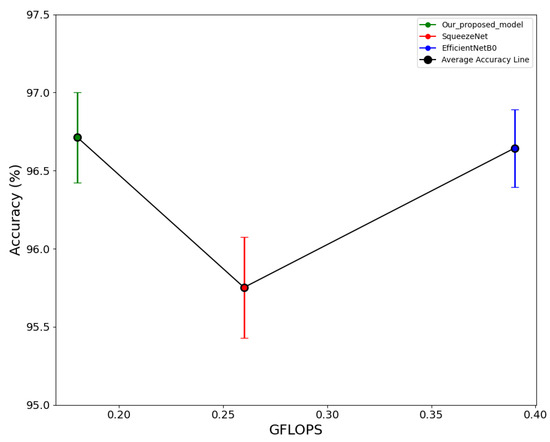
Figure 10.
Relationship showing performance comparison of this research and state of art models.
Table 9 provides a comparison between the proposed model and the lightweight models of corn leaf disease and plant leaf nutrition deficiencies. Bera et al. [21] implemented a convolution network for nutrition deficiency, achieving an accuracy of around 90%, which is lower than the accuracy of this research model. In contrast, Wang et al. [24] implemented a CNN with reinforcement learning for rice nutrition deficiency classification with three classes, achieving an accuracy as predicted by research. However, their model was complex and difficult to implement in lightweight devices. Furthermore, palm leaf, black gram leaf and corn leaf were utilised for the classification of nutrition deficiency yet were unable to attain optimal performance with regard to accuracy [8,22,23]. Conversely, a customised lightweight model has been employed for the classification of corn leaf diseases, yielding an accuracy of up to 98.50% on open data [16,58,59]. As demonstrated in Table 9, previous studies have not implemented nutrition deficiencies and viral diseases for lightweight models with such a large number of images, nor have they achieved the same level of accuracy and efficiency in terms of computational complexity. The proposed model is 12 times lighter than SqueezeNet and 75 times lighter than EfficientNet, with higher performance indicating an efficient model than conventional CNNs. Consequently, this study has the potential to serve as a valuable resource for future researchers seeking to develop efficient and effective plant leaf nutrition deficiency classification methods for portable devices.

Table 9.
Comparison of this research with previous related research on nutrition deficiencies and lightweight.
Alloway [60] stated that crop leaves affected by nutrient deficiency can be observed globally hindering the overall growth and yield. The lightweight classification model developed by our research is paramount for automated real-time identification of nutrient deficiency in crop leaves collected from the images globally. Nevertheless, the viral images gathered from Arusha, Tanzania for this research are not significantly available in Nepal. However, viral pathogens are always a threat to crops worldwide. Therefore, this research is crucial for long-term global monitoring of corn leaf nutrition deficiencies and viral diseases.
4. Conclusions
In this paper, a lightweight model based on the ResNet framework with a DSC network and attention mechanism is proposed to classify viral diseases in corn leaves as well as nutritional deficiencies in corn leaves. The proposed CNDD-Net was optimised by implementing a CBAM module in a suitable position, and the model was further finalised by fine-tuning the appropriate network depth and the number of feature maps through a series of experiments. The designed CNDD-Net has a model size of 0.24 MB with 48,041 parameters, comprising a GFLOPs of 0.18, and providing a reasonable average accuracy of 96.71%. This model is lighter and has a classification accuracy higher than the previously implemented plant leaf nutrition deficiency classification in rice, palm, banana, coffee, black gram, and even corn leaves. The model in the research has a GFLOPs of 0.18, which is extremely low compared to the latest popular edge devices, which have GFLOPs in the range of above 1200 indicating a potential possibility for deployment in edged devices. Though this research is not deployed in edged devices, the accuracy of the model for the unseen image dataset predicts that this model works well for different environmental conditions in real-time scenarios for corn leaves with seven classes used in research. For other crops, this architecture can be replicated and develop the lightweight model starting from the training phase. Since our dataset contains very few blurred and noisy images in this research, we recommend collecting more blurred images or implementing various blur augmentation techniques (e.g., Gaussian Blur, Motion Blur etc.,) during pre-processing which would increase the versatility of the model. Furthermore, the deployment of the CNDD-Net model in the edged devices and the use of drone imagery has the potential to contribute to the advancement of research in the domain of nutrition deficiency classification and the severity of nutritional deficiencies in corn fields.
Author Contributions
S.T.: Conceptualisation (equal), investigation (equal), methodology (equal), software, validation (equal), data collection and curation (equal), formal analysis (equal), writing—original draft, writing—review and editing (equal). S.S.: Formal analysis (equal), validation (equal), writing—review and editing (equal). S.G.: Validation (equal), data collection and curation (equal), formal analysis (equal), writing—review and editing (equal). K.S.: Formal analysis (equal), writing—review and editing (equal). Y.O.: Formal analysis (equal), writing—review and editing (equal). S.W.: Formal analysis (equal), writing—review and editing (equal). S.K.: Conceptualisation (equal), investigation (equal), methodology (equal), validation (equal), formal analysis, writing—original draft, writing—review, and editing (equal), resources, supervision. All authors have read and agreed to the published version of the manuscript.
Funding
This research received no external funding from any funding agency.
Data Availability Statement
Data will be made available on request.
Acknowledgments
We extend our appreciation for the assistance supported through the Project Based Learning-AI (PBL AI) program and the Ministry of Education, Culture, Sports, Science, and Technology (Monbukagakusho: MEXT) scholarship awarded to Suresh Timilsina and Sandhya Sharma. We are deeply grateful to Biplove Pokhrel, Anup Neupane, Sarmila Gautam, Pradip Aryal, Ashok Adhikari, Samit Poudel and Arjun Awasthi for their invaluable assistance in data collection in the field.
Conflicts of Interest
The authors declare that they have no known competing financial interests or personal relationships that could have appeared to influence the work reported in this paper.
Abbreviations
| CBAM | Convolution Block Attention Module |
| CI | Confidence Interval |
| CNDD-Net | Corn Leaf Nutrition Deficiency and Disease Network |
| CNN | Convolutional Neural Network |
| DSC | Depth-wise Separable Convolution |
| FC | Fully Connected |
| FLOPs | Floating Point Operations Per Second |
| FN | False Negative |
| FNR | False Negative Rate |
| FP | False Positive |
| FPR | False Positive Rate |
| GFLOPs | Giga Floating Point Operations Per Second |
| MLN | Maize Lethal Necrosis |
| MSV | Maize Streak Virus |
| ReLU | Rectified Linear Unit |
| SVM | Support Vector Machine |
| TN | True Negative |
| TP | True Positive |
References
- Rouf, S.T.; Prasad, K.; Kumar, P.; Yildiz, F. Maize-A potential source of human nutrition and health: A review. In Contaminants in Agriculture; Springer: Berlin/Heidelberg, Germany, 2016; Volume 2. [Google Scholar] [CrossRef]
- Sapna; Archna, J.; Dar, Z.A.; Qureshi, A.M.I. Maize Fabric: Leading to a New Paradigm Shift. IJCMAS 2020, 9, 1337–1343. [Google Scholar] [CrossRef]
- FAO. World Food and Agriculture—Statistical Yearbook 2023; FAO: Rome, Italy, 2023. [Google Scholar] [CrossRef]
- OECD. OECD-FAO Agricultural Outlook 2023–2032; OECD: Paris, France, 2023. [Google Scholar] [CrossRef]
- Boddupalli, P.; Suresh, L.M.; Mwatuni, F.; Beyene, Y.; Makumbi, D.; Gowda, M.; Olsen, M.; Hodson, D.; Worku, M.; Mezzalama, M.; et al. Maize lethal necrosis (MLN): Efforts toward containing the spread and impact of a devastating transboundary disease in sub-Saharan Africa. Virus Res. 2020, 282, 197943. [Google Scholar] [CrossRef]
- Haque, M.A.; Marwaha, S.; Deb, C.K.; Nigam, S.; Arora, A.; Hooda, K.S.; Soujanya, L.; Aggarwal, S.K.; Lall, B.; Kumar, M.; et al. Deep learning-based approach for identification of diseases of maize crop. Sci. Rep. 2022, 12, 6334. [Google Scholar] [CrossRef]
- Lucas, R.E.; Holtman, J.B.; Connor, L.J. Soil carbon dynamics and cropping practices. In Agriculture and Energy; Lockeretz, W., Ed.; Academic Press: New York, NY, USA, 1977; pp. 333–351. [Google Scholar] [CrossRef]
- Leena, N.; Saju, K.K. Classification of macronutrient deficiencies in maize plants using optimized multi class support vector machines. Eng. Agric. Environ. Food 2019, 12, 126–139. [Google Scholar] [CrossRef]
- Simhadri, C.G.; Kondaveeti, H.K.; Vatsavayi, V.K.; Mitra, A.; Ananthachari, P. Deep learning for rice leaf disease detection: A systematic literature review on emerging trends, methodologies and techniques. Inf. Process Agric. 2024, in press. [Google Scholar] [CrossRef]
- CIMMYT Maize Viral Diseases: MLN and MSV. CIMMYT. Available online: https://repository.cimmyt.org/server/api/core/bitstreams/7a4fdc33-0344-4055-99e1-37e226360605/content (accessed on 5 February 2025).
- Kaya, Y.; Gursoy, E. A novel multi-head CNN design to identify plant diseases using the fusion of RGB images. Ecol. Inform. 2023, 75, 101998. [Google Scholar] [CrossRef]
- Patil, M.A.; Manur, M. Sensitive crop leaf disease prediction based on computer vision techniques with handcrafted features. Int. J. Syst. Assur. Eng. Manag. 2023, 14, 2235–2266. [Google Scholar] [CrossRef]
- Khan, F.; Zafar, N.; Tahir, M.N.; Aqib, M.; Waheed, H.; Haroon, Z. A mobile-based system for maize plant leaf disease detection and classification using deep learning. Front. Plant Sci. 2023, 14, 1079366. [Google Scholar] [CrossRef]
- Nan, F.; Song, Y.; Yu, X.; Nie, C.; Liu, Y.; Bai, Y.; Zou, D.; Wang, C.; Yin, D.; Yang, W.; et al. A novel method for maize leaf disease classification using the RGB-D post-segmentation image data. Front. Plant Sci. 2023, 14, 1268015. [Google Scholar] [CrossRef]
- Pratama, A.; Pristyanto, Y. Classification of corn plant diseases using various convolutional neural network. JITK 2023, 9, 49–56. [Google Scholar] [CrossRef]
- Zeng, W.; Li, H.; Hu, G.; Liang, D. Lightweight dense-scale network (LDSNet) for corn leaf disease identification. Comput. Electron. Agric. 2022, 197, 106943. [Google Scholar] [CrossRef]
- Fan, X.; Guan, Z. VGNET: A Lightweight Intelligent Learning Method for corn Diseases Recognition. Agriculture 2023, 13, 1606. [Google Scholar] [CrossRef]
- Simonyan, K.; Zisserman, A. Very deep convolutional networks for large-scale image recognition. arXiv 2015, arXiv:1409.1556. [Google Scholar]
- Thakur, P.S.; Sheorey, T.; Ojha, A. VGG-ICNN: A Lightweight CNN model for crop disease identification. Multimed. Tools Appl. 2023, 82, 497–520. [Google Scholar] [CrossRef]
- Szegedy, C.; Liu, W.; Jia, Y.; Sermanet, P.; Reed, S.; Anguelov, D.; Erhan, D.; Vanhoucke, V.; Rabinovich, A. Going deeper with convolutions. In Proceedings of the 2015 IEEE Conference on Computer Vision and Pattern Recognition (CVPR), Boston, MA, USA, 7–12 June 2015; pp. 1–9. [Google Scholar] [CrossRef]
- Bera, A.; Bhattacharjee, D.; Krejcar, O. PND-net: Plant Nutrition deficiency and disease classification using graph Convolutional Network. Sci. Rep. 2024, 14, 1079366. [Google Scholar] [CrossRef]
- Ibrahim, S.; Hasan, N.; Sabri, N.; Abu Samah, K.; Rahimi Rusland, M. Palm leaf nutrient deficiency detection using convolutional neural network (CNN). IJNAA 2022, 13, 1949–1956. [Google Scholar] [CrossRef]
- Parnal, P. Pawade. Harnessing Deep Learning for Plant Nutrition: VGG Architecture for Precision Detection of Nutrient Deficiency. IJISAE 2024, 12, 2757–2766. [Google Scholar]
- Wang, C.; Ye, Y.; Tian, Y.; Yu, Z. Classification of nutrient deficiency in rice based on CNN model with Reinforcement Learning Augmentation. In Proceedings of the 2021 International Symposium on Artificial Intelligence and Its Application on Media (ISAIAM), Xi’an, China, 21–23 May 2021. [Google Scholar] [CrossRef]
- Ramos-Ospina, M.; Gomez, L.; Trujillo, C.; Marulanda-Tob’on, A. Deep Transfer Learning for Image Classification of Phosphorus Nutrition States in Individual Maize Leaves. Electronics 2024, 13, 16. [Google Scholar] [CrossRef]
- Bhujel, A.; Kim, N.-E.; Arulmozhi, E.; Basak, J.K.; Kim, H.-T. A Lightweight Attention Based Convolutional Neural Networks for Tomato Leaf Disease Classification. Agriculture 2022, 12, 228. [Google Scholar] [CrossRef]
- Mnih, V.; Heess, N.; Graves, A.; Kavukcuoglu, K. Recurrent models of visual attention. In Proceedings of the Advances in Neural Information Processing Systems: Annual Conference on Neural Information Processing Systems 2014, Montreal, QC, Canada, 8–13 December 2014; Volume 3, pp. 2204–2212. [Google Scholar]
- Woo, S.; Park, J.; Lee, J.Y.; Kweon, I.S. CBAM: Convolutional block attention module. In Proceedings of the Computer Vision—ECCV 2018, Munich, Germany, 8–14 September 2018; Volume 11211, pp. 3–19. [Google Scholar] [CrossRef]
- Zeng, W.; Li, M. Crop leaf disease recognition based on Self-Attention convolutional neural network. Comput. Electron. Agric. 2020, 172, 105341. [Google Scholar]
- Lee, S.H.; Goëau, H.; Bonnet, P.; Joly, A. Attention-Based Recurrent Neural Network for Plant Disease Classification. Front. Plant Sci. 2020, 11, 601250. [Google Scholar] [CrossRef] [PubMed]
- He, K.; Zhang, X.; Ren, S.; Sun, J. Deep residual learning for image recognition. In Proceedings of the IEEE Conference on Computer Vision and Pattern Recognition (CVPR), Las Vegas, NV, USA, 10–17 June 2016; pp. 27–30. [Google Scholar] [CrossRef]
- Shrivastav, P.; Prasad, M.; Singh, T.B.; Yadav, A.; Goyal, D.; Ali, A.; Dantu, P.K. Role of Nutrients in Plant Growth and Development. In Contaminants in Agriculture; Naeem, M., Ansari, A., Gill, S., Eds.; Springer: Cham, Switzerland, 2020. [Google Scholar] [CrossRef]
- Nikitha, S.; Prabhanjan, S.; Sathyanarayan, A. Plant nutritional deficiency detection: A survey of predictive analytics approaches. Iran J. Comput. Sci. 2024, 8, 83–101. [Google Scholar] [CrossRef]
- Missouri Integrated Pest Management. Diagnosing Nutrient Deficiencies. University of Missouri. Division of Plant Sciences. 2011. Available online: https://ipm.missouri.edu/MEG/2011/6/Diagnosing-Nutrient-Deficiencies/ (accessed on 7 January 2025).
- Jung, M.; Song, J.S.; Shin, A.; Choi, B.; Go, S.; Kwon, S.; Park, J.; Park, S.G.; Kim, Y. Construction of deep learning-based disease detection model in plants. Sci. Rep. 2023, 13, 7331. [Google Scholar] [CrossRef]
- Sudhakar, M.; Priya, R.M.S. Computer vision-based machine learning and deep learning approaches for identification of nutrient deficiency in crops: A survey. NEPT 2023, 22, 1387–1399. [Google Scholar] [CrossRef]
- Mduma, N.; Laizer, H. Machine learning imagery dataset for maize crop: A case of Tanzania. Data Brief. 2023, 48, 109108. [Google Scholar] [CrossRef]
- Climate-Data. Climate data for cities worldwide—Climate-Data. 2019. Available online: https://en.climate-data.org (accessed on 27 March 2025).
- Supani, A.; Andriani, Y.; Indarto; Saputra, H.; Joni, A.B.; Alfian, D.; Taqwa, A.; Silvia, A.H. Enhancing deeper layers with residual network on CNN Architecture: A Review. AHE 2023, 14, 449–457. [Google Scholar] [CrossRef]
- Zhou, X.; Liu, H.; Shi, C.; Liu, J. Deep Learning on Edge Computing Devices: Design Challenges of Algorithm and Architecture; Elsevier: Amsterdam, The Netherlands, 2022. [Google Scholar] [CrossRef]
- Howard, A.G.; Zhu, M.; Chen, B.; Kalenichenko, D.; Wang, W.; Weyand, T.; Andreetto, M.; Adam, H. MobileNets: Efficient Convolutional Neural Networks for Mobile Vision Applications. arXiv 2017, arXiv:1704.04861. [Google Scholar]
- Tan, M.; Le, Q.V. EfficientNet: Rethinking Model Scaling for Convolutional Neural Networks. In Proceedings of the 36th International Conference on Machine Learning, ICML 2019, Long Beach, CA, USA, 9–15 June 2019; pp. 6105–6114. Available online: http://proceedings.mlr.press/v97/tan19a.html (accessed on 15 February 2025).
- Hu, J.; Shen, L.; Albanie, S.; Sun, G.; Wu, E. Squeeze-and-Excitation networks. IEEE Trans. Pattern Anal. Mach. Intell. 2019, 42, 2011–2023. [Google Scholar] [CrossRef]
- Ippolito, P.P. Hyperparameter Tuning. In Applied Data Science in Tourism.TV; Egger, R., Ed.; Springer: Cham, Switzerland, 2022. [Google Scholar] [CrossRef]
- Kingma, D.P.; Ba, J.L. Adam: A method for stochastic optimization. arXiv 2014, arXiv:1412.6980. [Google Scholar]
- Mao, A.; Mohri, M.; Zhong, Y. Cross-Entropy Loss Functions: Theoretical analysis and applications. arXiv 2023, arXiv:2304.07288. [Google Scholar]
- Grandini, M.; Bagli, E.; Visani, G. Metrics for Multi-Class Classification: An Overview. arXiv 2020, arXiv:2008.05756. [Google Scholar]
- Molchanov, P.; Tyree, S.; Karras, T.; Aila, T.; Kautz, J. Pruning Convolutional Neural Networks for Resource Efficient Inference. International Conference on Learning Representations (ICLR). 2016. Available online: https://openreview.net/pdf?id=SJGCiw5gl (accessed on 19 February 2025).
- Programmer Sought. CNN Model Complexity (FLOPS, MAC), Parameter Amount and Running Speed. Available online: https://www.programmersought.com/article/50435353828/ (accessed on 25 February 2025).
- Zhu, H.; An, Z.; Yang, C.; Hu, X.; Xu, K.; Xu, Y. Rethinking the Number of Channels for the Convolutional Neural Network. arXiv 2019, arXiv:1909.01861. [Google Scholar]
- Zhao, X.; Wang, L.; Zhang, Y.; Han, X.; Deveci, M.; Parmar, M. A review of convolutional neural networks in computer vision. Artif. Intell. Rev. 2024, 57, 99. [Google Scholar] [CrossRef]
- Zou, J.; Rui, T.; Zhou, Y.; Yang, C.; Zhang, S. Convolutional neural network simplification via feature map pruning. Comput. Electron. Agric. 2018, 70, 950–958. [Google Scholar] [CrossRef]
- Alzubaidi, L.; Zhang, J.; Humaidi, A.J.; Al-Dujaili, A.; Duan, Y.; Al-Shamma, O.; Santamaría, J.; Fadhel, M.A.; Al-Amidie, M.; Farhan, L. Review of deep learning: Concepts, CNN architectures, challenges, applications, future directions. J. Big Data. 2021, 8, 53. [Google Scholar] [CrossRef]
- Chen, F.; Tsou, J.Y. Assessing the effects of convolutional neural network architectural factors on model performance for Remote Sensing Image Classification: An in-depth investigation. Int. J. Appl Earth Obs. Geoinf. 2022, 112, 102865. [Google Scholar] [CrossRef]
- Hassanin, M.; Anwar, S.; Radwan, I.; Khan, F.S.; Mian, A. Visual attention methods in deep learning: An in-depth survey. Inf. Fusion. 2024, 108, 102417. [Google Scholar] [CrossRef]
- Abbas, S.; Hamouma, M.; Abbas, F. Efficient Method Using Attention Based Convolutional Neural Networks for Ceramic Tiles Defect Classification. Rev. D’intelligence Artif. 2023, 37, 53–62. [Google Scholar] [CrossRef]
- Iandola, F.; Han, S.; Moskewicz, M.; Ashraf, K.; Dally, W.; Keutzer, K. SqueezeNet: AlexNet level accuracy with 50x fewer parameters and <0.5 MB model size. arXiv 2016, arXiv:1602.07360. [Google Scholar]
- Chen, J.; Wang, W.; Zhang, D.; Zeb, A.; Nanehkaran, Y.A. Attention embedded lightweight network for maize disease recognition. Plant Pathol. J. 2020, 70, 630–642. [Google Scholar] [CrossRef]
- Liu, L.; Qiao, S.; Chang, J.; Ding, W.; Xu, C.; Gu, J.; Sun, T.; Qiao, H. A multi-scale feature fusion neural network for multi-class disease classification on the maize leaf images. Heliyon. 2024, 10, e28264. [Google Scholar] [CrossRef] [PubMed]
- Alloway, B.J. Micronutrient Deficiencies in Global Crop Production; Springer eBooks: Berlin/Heidelberg, Germany, 2008. [Google Scholar] [CrossRef]
Disclaimer/Publisher’s Note: The statements, opinions and data contained in all publications are solely those of the individual author(s) and contributor(s) and not of MDPI and/or the editor(s). MDPI and/or the editor(s) disclaim responsibility for any injury to people or property resulting from any ideas, methods, instructions or products referred to in the content. |
© 2025 by the authors. Licensee MDPI, Basel, Switzerland. This article is an open access article distributed under the terms and conditions of the Creative Commons Attribution (CC BY) license (https://creativecommons.org/licenses/by/4.0/).