Article

Developing an Alert System for Agricultural Protection: Sika Deer Detection Using Raspberry Pi

by
Sandhya Sharma
1,†,
Buchaputara Pansri
1,
Suresh Timilsina
1,
Bishnu Prasad Gautam
2,
Yoshifumi Okada
1,
Shinya Watanabe
1,
Satoshi Kondo
1 and
Kazuhiko Sato
1,*,†
1
Graduate School of Engineering, Muroran Institute of Technology, 27-1 Mizumoto-cho, Muroran 050-8585, Hokkaido, Japan
2
The Department of Information Engineering, Kanazawa Gakuin University, 10 Suemachi, Kanazawa 920-1392, Ishikawa, Japan
*
Author to whom correspondence should be addressed.
These authors contributed equally to this work.
Electronics 2024, 13(23), 4852; https://doi.org/10.3390/electronics13234852
Submission received: 8 November 2024 / Revised: 28 November 2024 / Accepted: 6 December 2024 / Published: 9 December 2024

Abstract

:
Agricultural loss due to the overpopulation of Sika deer poses a significant challenge in Japan, leading to frequent human–wildlife conflicts. We conducted a study in Muroran, Hokkaido (42°22′56.1″ N–141°01′51.5″ E), with the objective of monitoring Sika deer and notifying farmers and locals. We deployed a Sika deer detection model (YOLOv8-nano) on a Raspberry Pi, integrated with an infrared camera that captured images only when a PIR sensor was triggered. To further understand the timing of Sika deer visits and potential correlations with environmental temperature and humidity, respective sensors were installed on Raspberry Pi and the data were analyzed using an ANOVA test. In addition, a buzzer was deployed to deter Sika deer from the study area. The buzzer was deactivated in the first 10 days after deployment and was activated in the following 20 days. The Sika deer detection model demonstrated excellent performance, with precision and recall values approaching 1, and a bounding box creation latency of 0.82 frames per second. Once a bounding box was established after Sika deer detection, alert notifications were automatically sent via email and the LINE messaging application, with an average notification time of 0.32 s. Regarding the buzzer’s impact on Sika deer, 35% of the detected individuals reacted by standing upright with alert ears, while 65% immediately fled the area. Analysis revealed that the time of day for Sika deer visits was significantly correlated with humidity (F = 8.95, p < 0.05), but no significant association with temperature (F = 0.681, p > 0.05). These findings represent a significant step toward mitigating human–wildlife conflicts and reducing agricultural production losses through effective conservation measures.

1. Introduction

In areas where humans and wildlife interact, competition for resources often leads to conflicts, particularly in agricultural regions [1,2]. As human activities expand and habitats diminish, wildlife increasingly encroaches on farmland in search of scarce resources [3]. This encroachment intensifies competition between humans and wildlife, significantly affecting farmers who rely on their crops for livelihood [4]. Consequently, human–wildlife conflicts become more pronounced, posing challenges to both agricultural productivity and conservation efforts [3,5].
Crop damage caused by wildlife is widespread in various conservation areas of Nepal [6,7]. Elephants are primarily responsible for most of such damages in developing countries such as Zambia [8,9,10], and the damages are often left largely uncompensated [11]. According to a report from Japan’s Ministry of Agriculture, Forestry and Fisheries, wildlife caused approximately JPY 15.5 billion (about USD 104 million) in damage to agricultural production during the fiscal year 2021, with the majority of the damage attributed to Sika deer and bears [12].
Sika deer are native to East Asia, particularly Japan, and were classified as a Least Concern species by the International Union for Conservation of Nature [13]. However, since the 19th century, their populations have surged uncontrollably, attributable to the extinction of Canis lupus hodophilus, a well-known predator responsible for regulating their numbers [14]. This unchecked population growth has resulted in considerable agricultural damage and a decline in biodiversity [15,16]. The overpopulation of Sika deer poses severe challenges for local farmers, leading to crop destruction and consequent economic losses [16]. Therefore, implementing effective detection and alert mechanisms is essential to mitigate the issues stemming from their overpopulation.
Despite the limited measures taken to mitigate damages caused by Sika deer on agricultural production, there is a pressing need for effective solutions. Therefore, we proposed a Sika deer detection system based on Raspberry Pi technology. This system will notify farmers, local authorities, and residents when Sika deer enter agricultural areas and activate a buzzer to help disperse the Sika deer. By implementing this approach, we aim to provide timely alerts and minimize the negative impact of Sika deer on local farming (Figure 1).

2. Materials and Methods

We collected 6400 images of Sika deer over a period of one year (July 2023–July 2024) using three camera traps installed on farmland in Hokkaido, Muroran. The dataset was then split into 80% and 20% for training and validation, respectively. For Sika deer detection and bounding box annotation, we used the YOLOv8-nano model (“yolov8n-oiv7”), which is specifically designed to be lightweight and optimized to run on resource-constrained devices such as Raspberry Pi and mobile devices [17]. The model was trained over 500 epochs with a batch size of 4 and an image size of 640. The trained model was then incorporated into Raspberry Pi 4B (8 GB) for real-time monitoring of the target species.

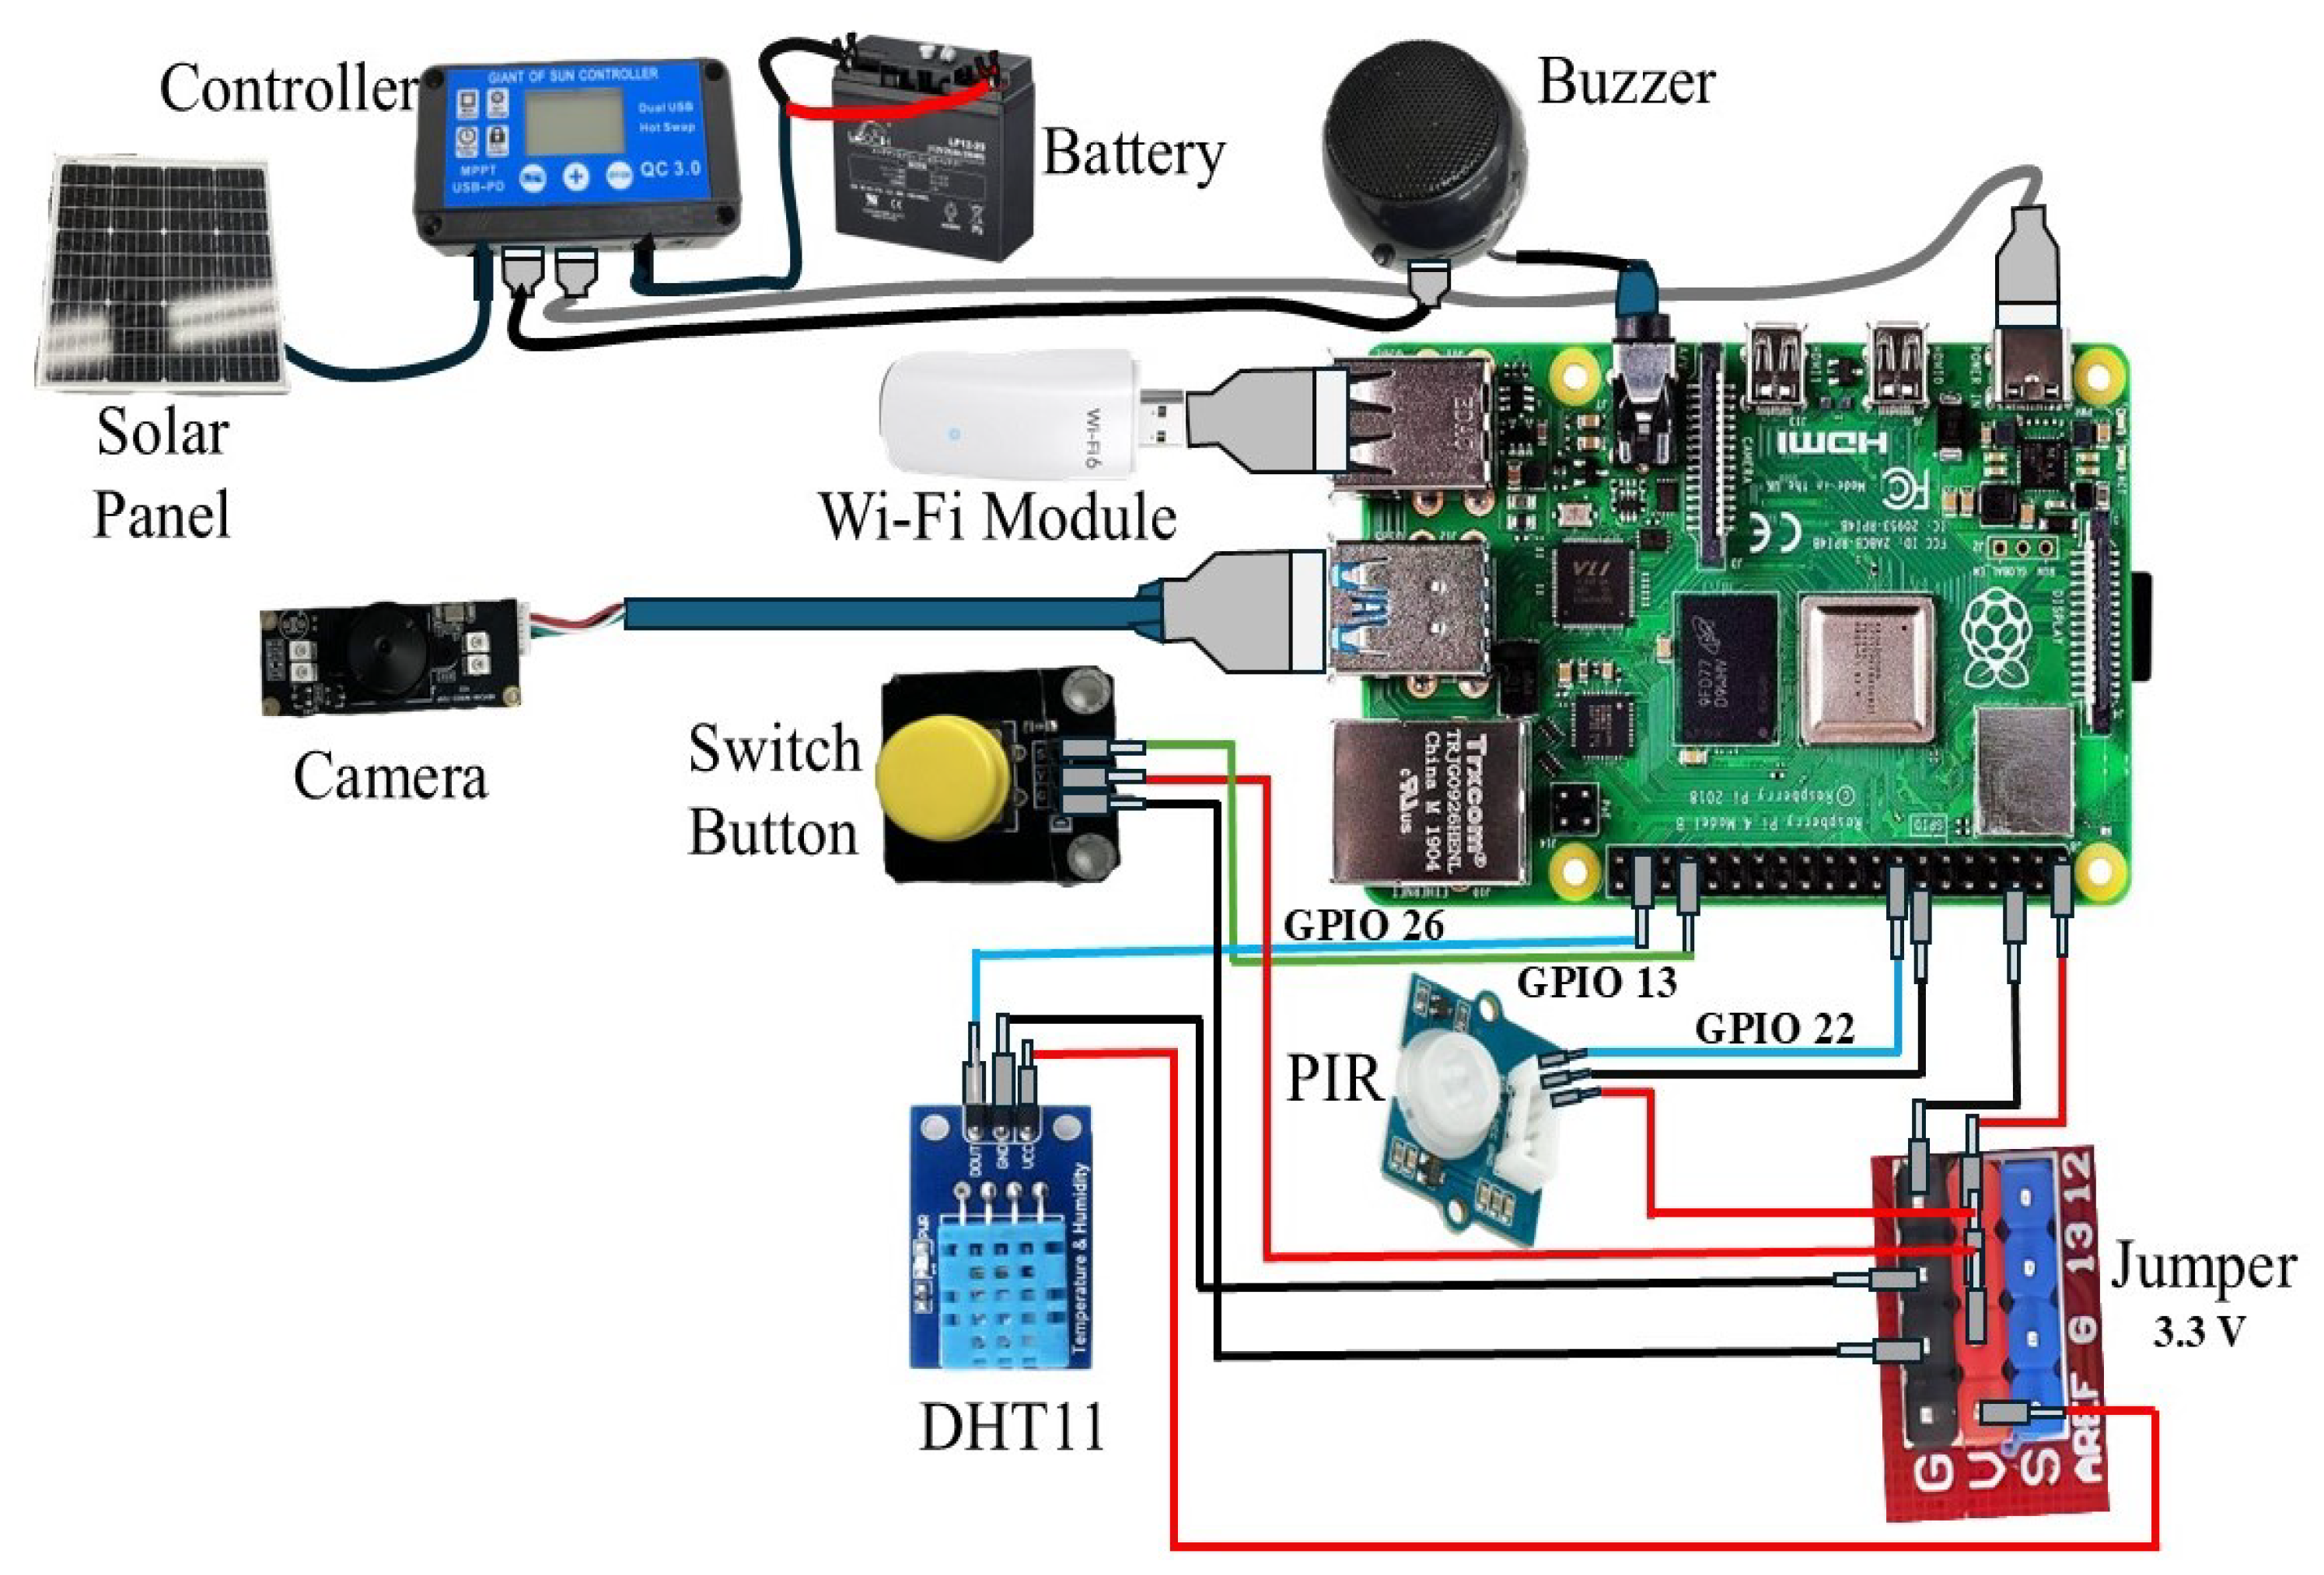
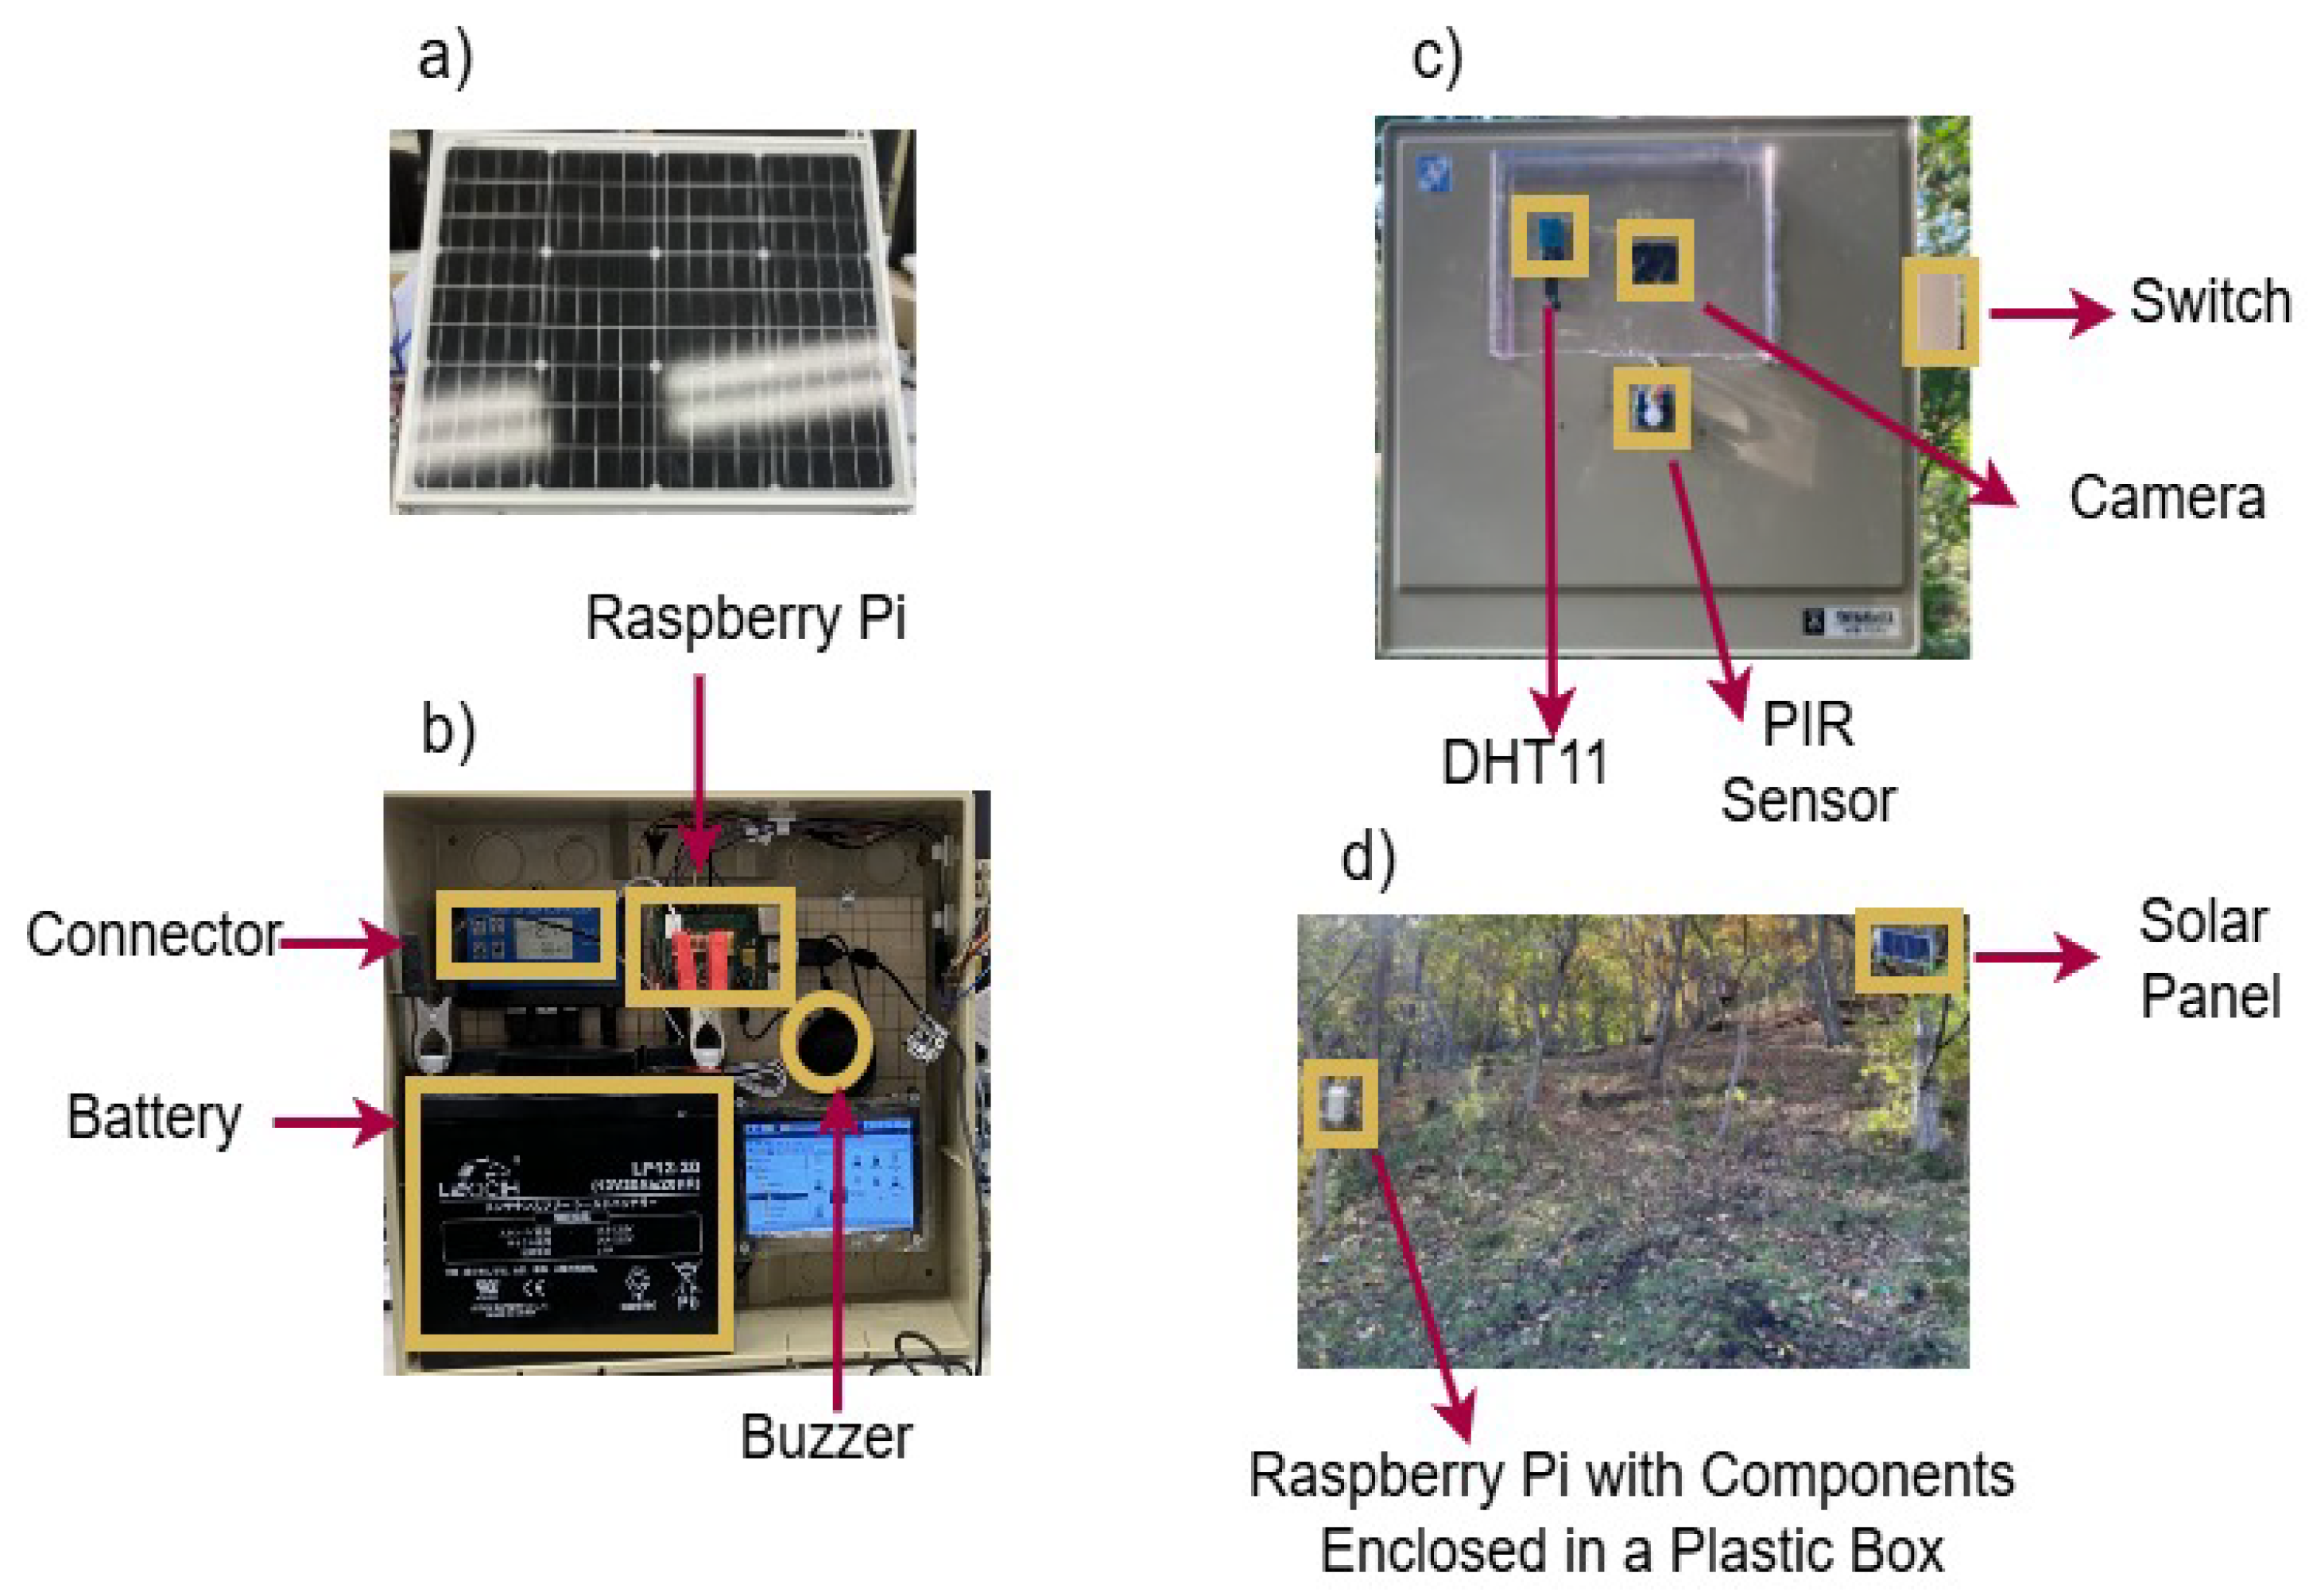
2.1. External Monitoring Components

We equipped the Raspberry Pi with external components, including a PIR sensor. In this study, we used the “Grove-digital PIR sensor”, which can detect motion up to a distance of 12 m [18] (Table 1). Images and videos (3 min) of Sika deer were captured, and bounding boxes were generated in real-time and triggered only after the PIR sensor was activated. We utilized an infrared night vision camera (ASIN: B08775TNBJ) that captured high-resolution images (1280 × 720) under both daylight and low-light conditions, even complete darkness [19]. The camera was directly connected to the Raspberry Pi via USB and configured to operate automatically through a Python script, ensuring continuous monitoring without manual intervention. The camera’s infrared capability enabled effective image capture under varying light conditions, and its integration with Raspberry Pi allowed for seamless data processing and storage [19]. Wildlife distribution is strongly influenced by environmental factors [20]. To better understand the influence of environmental factors, we deployed a DHT11 temperature and humidity sensor [21] to measure environmental conditions and correlate the collected data with the timing of Sika deer visits (Figure 2). Environmental temperature and humidity data were collected every second during the study period (Table 1). To ensure a continuous power supply, we connected the Raspberry Pi to an LEOCH (WP20-12) battery with a capacity of 12 V and 20 Ah. When used alone, the battery allows the Raspberry Pi to operate continuously for 36 h. The battery was charged using a 50 W solar panel (IAKTD), with a 10 A charge controller positioned between the panel and battery to regulate the voltage and current, ensuring safe charging. Being exposed to sunlight for 4 h was sufficient to fully charge the battery, providing ample power for the continuous operation of the Raspberry Pi. In addition, the Raspberry Pi was equipped with a Wi-Fi module for constant data access to the server. In this study, we used the Ruk-Com cloud server.

2.2. Internal Components

We also monitored key internal components of the Raspberry Pi such as the disk space, CPU usage, and CPU temperature, as these are critical for maintaining its continuous functionality (Table 1). To send alert notifications when any of the values of these internal components reached 80 or higher, we set up a sender email with a token via a 2-step verification process. If the CPU temperature exceeds 80 °C, the system triggers the sleep mode for 30 min to allow the CPU to cool down (Figure 3). To manage disk space efficiently, we automated the process of uploading original images with bounding boxes along with videos of detected Sika deer to the server and deleting them from the Raspberry Pi after transfer. Information in the internal components was checked every 2 s and all information was stored in the server in the form of a database. Throughout the study period, the usage percentage of all internal components remained below 80%; therefore, no alert emails were sent. The maximum recorded values were as follows: disk space- /root: 45%; /dev: 0%; /dev/shm: 0%; /run: 1%; /run/lock: 1%; /boot: 13%; /run/user/1000: 1%; CPU temperature: 63.3 °C; and CPU usage: 73.1%.

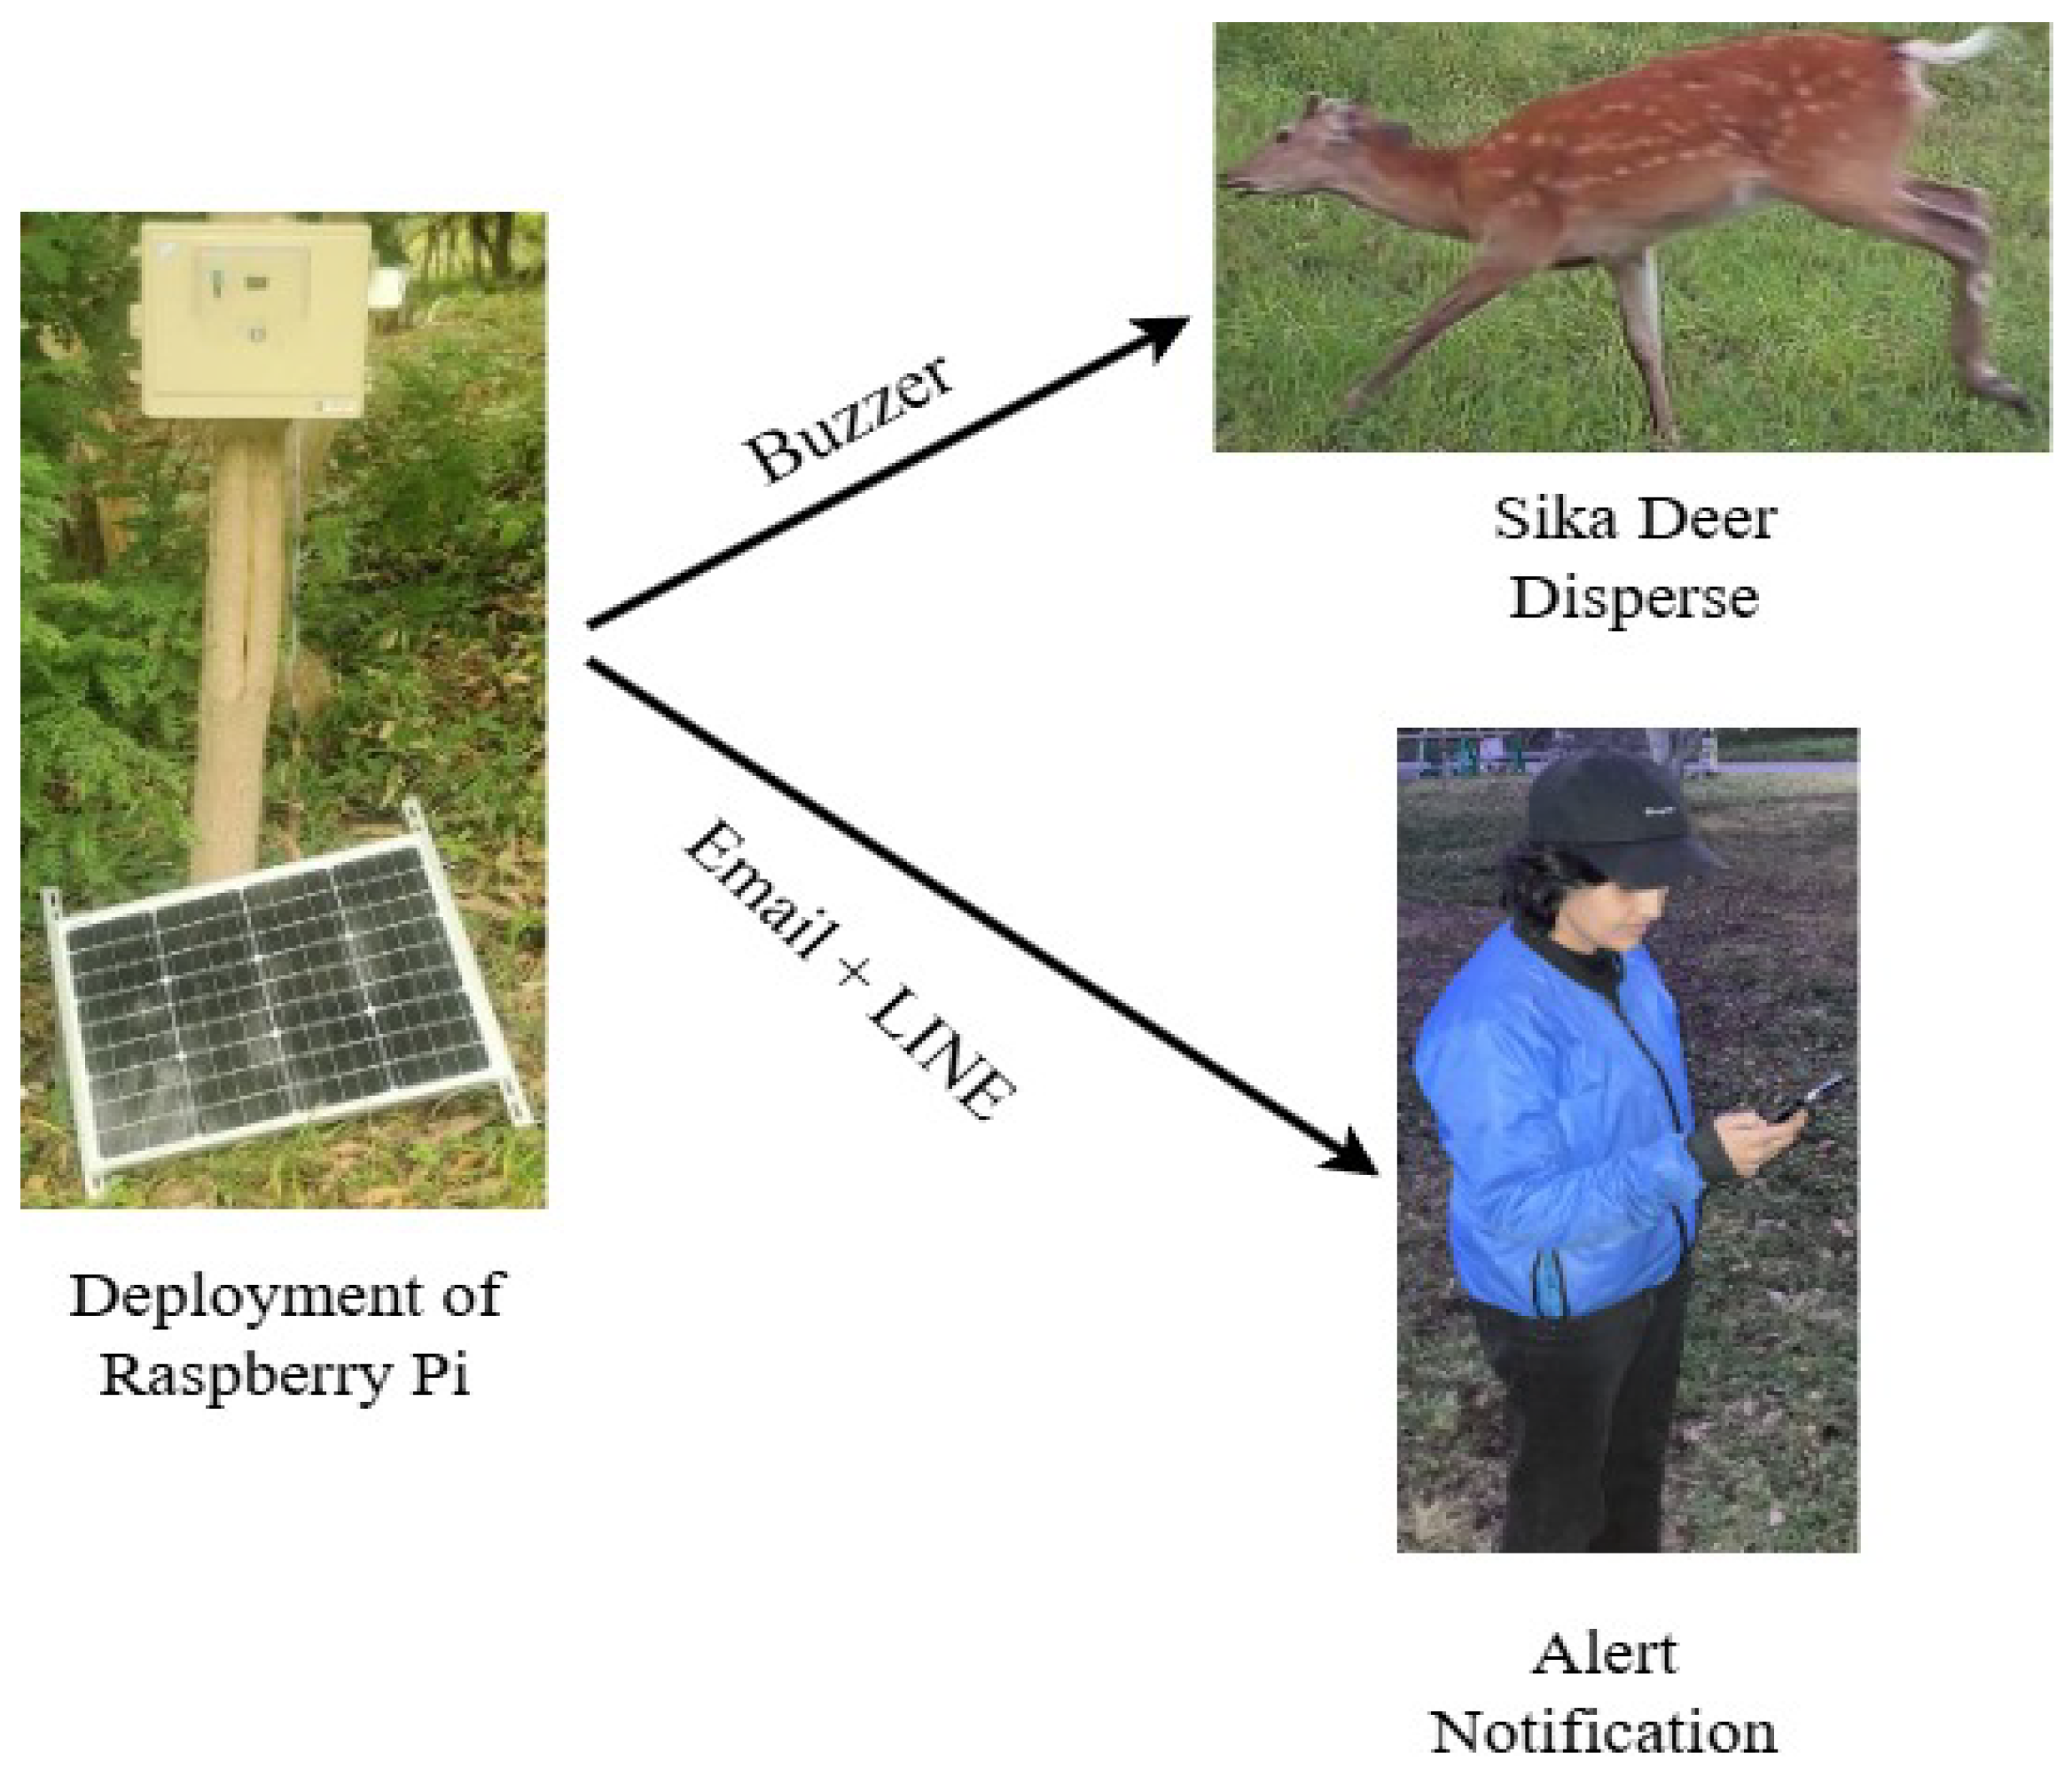
2.3. Alert Notification and Buzzer Implementation
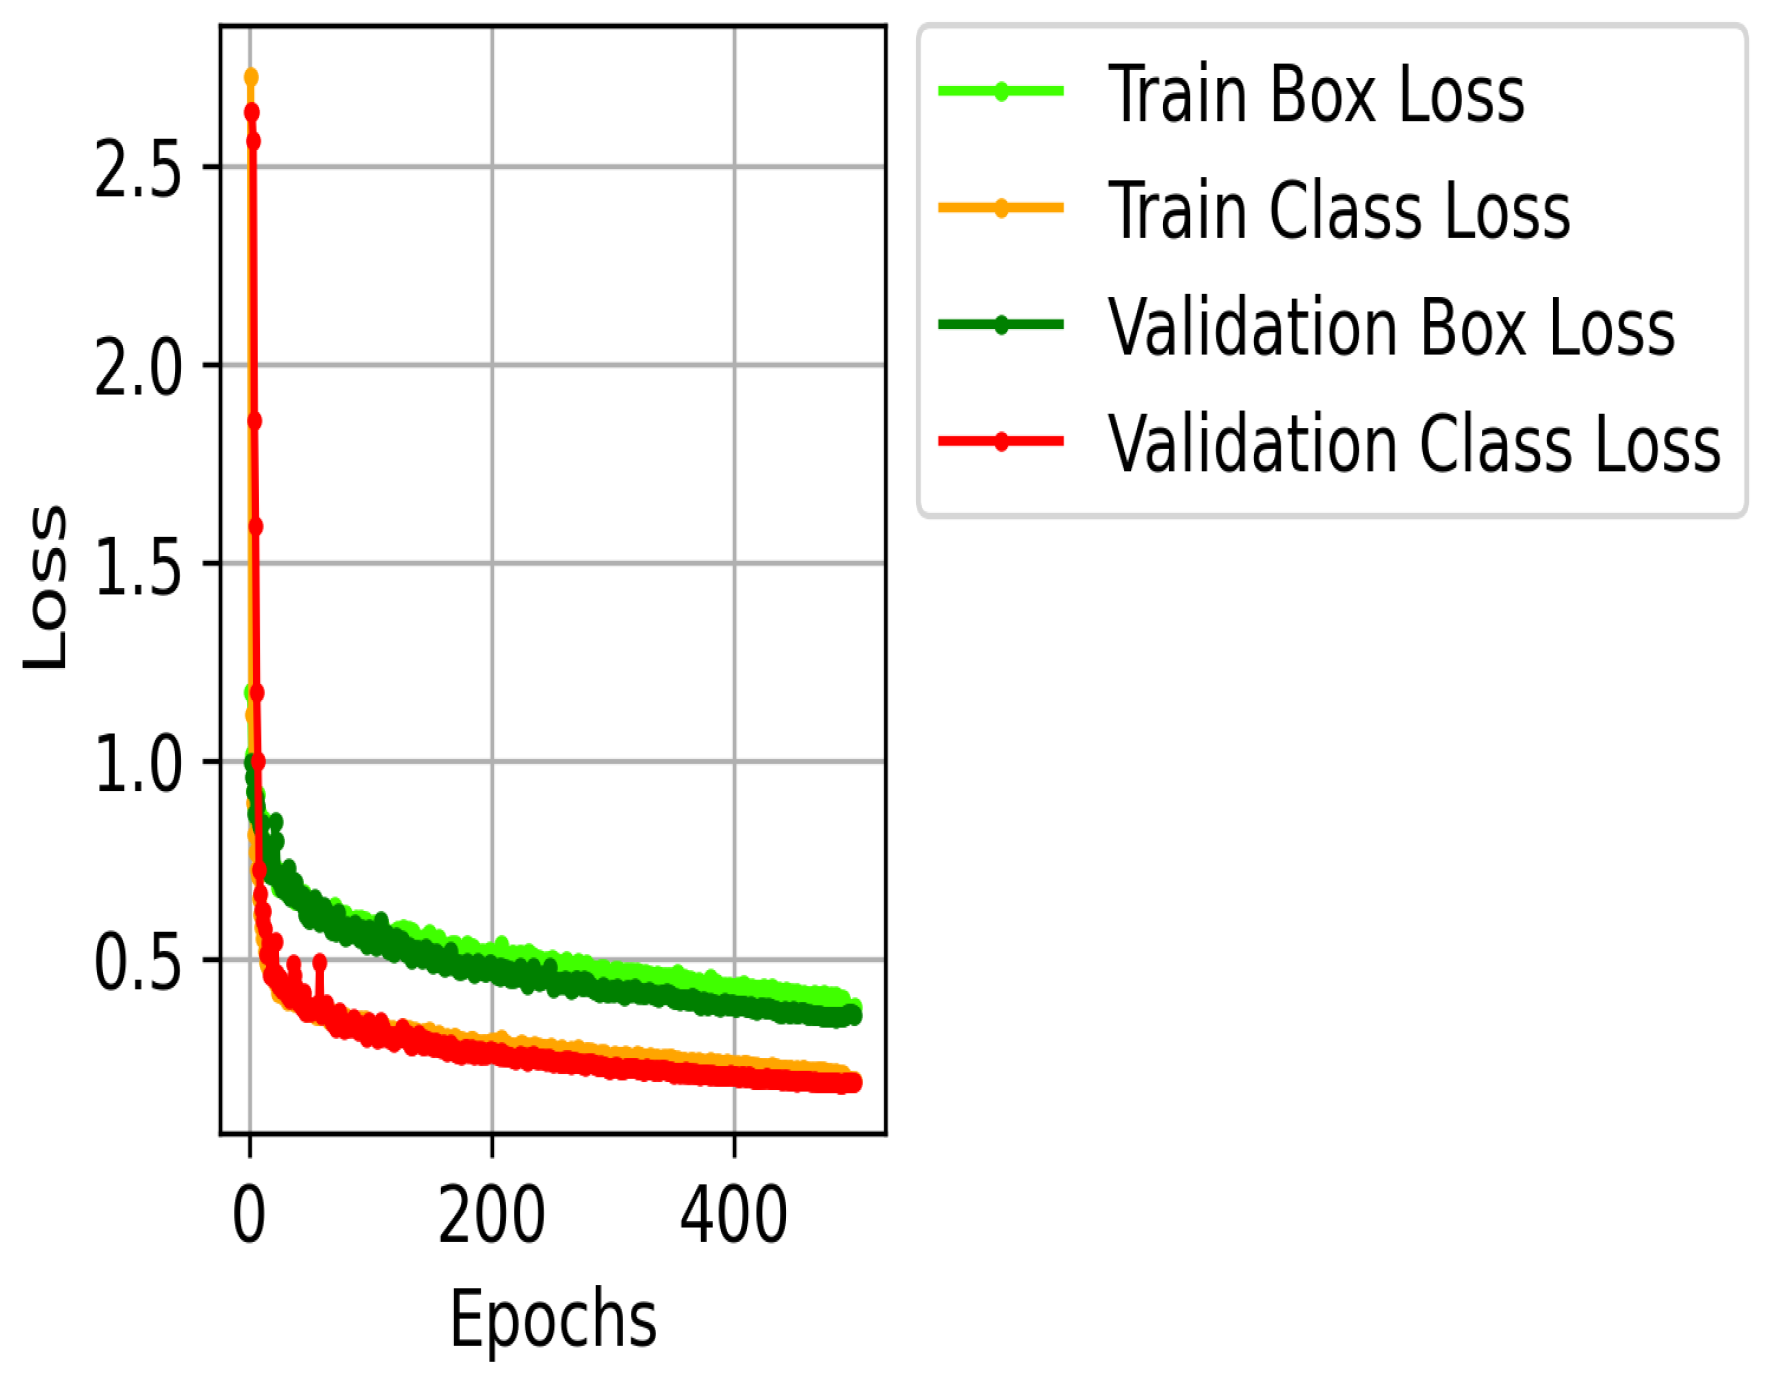
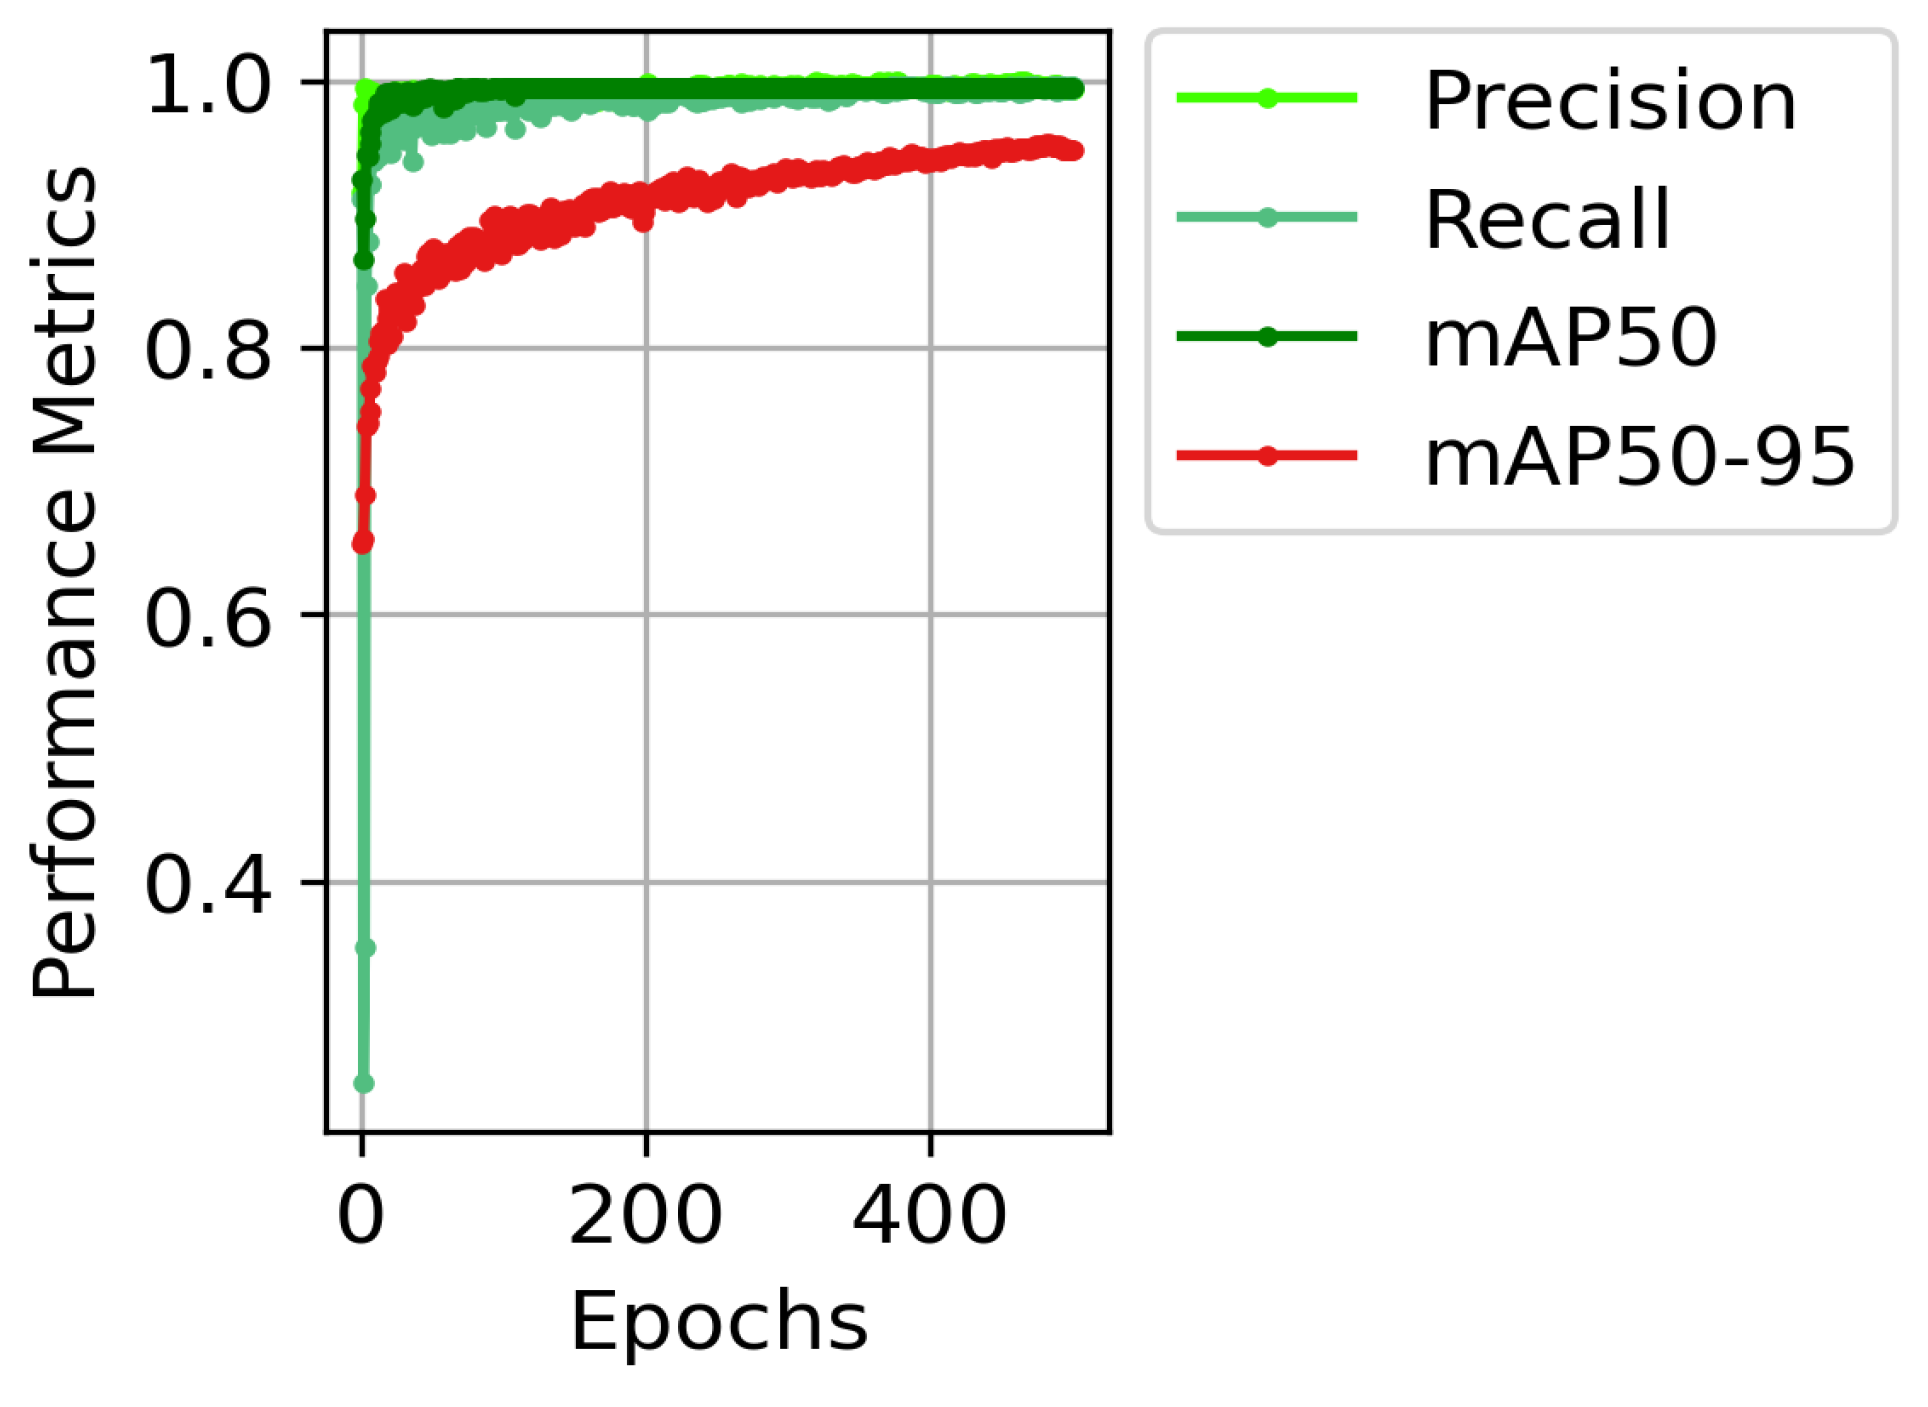
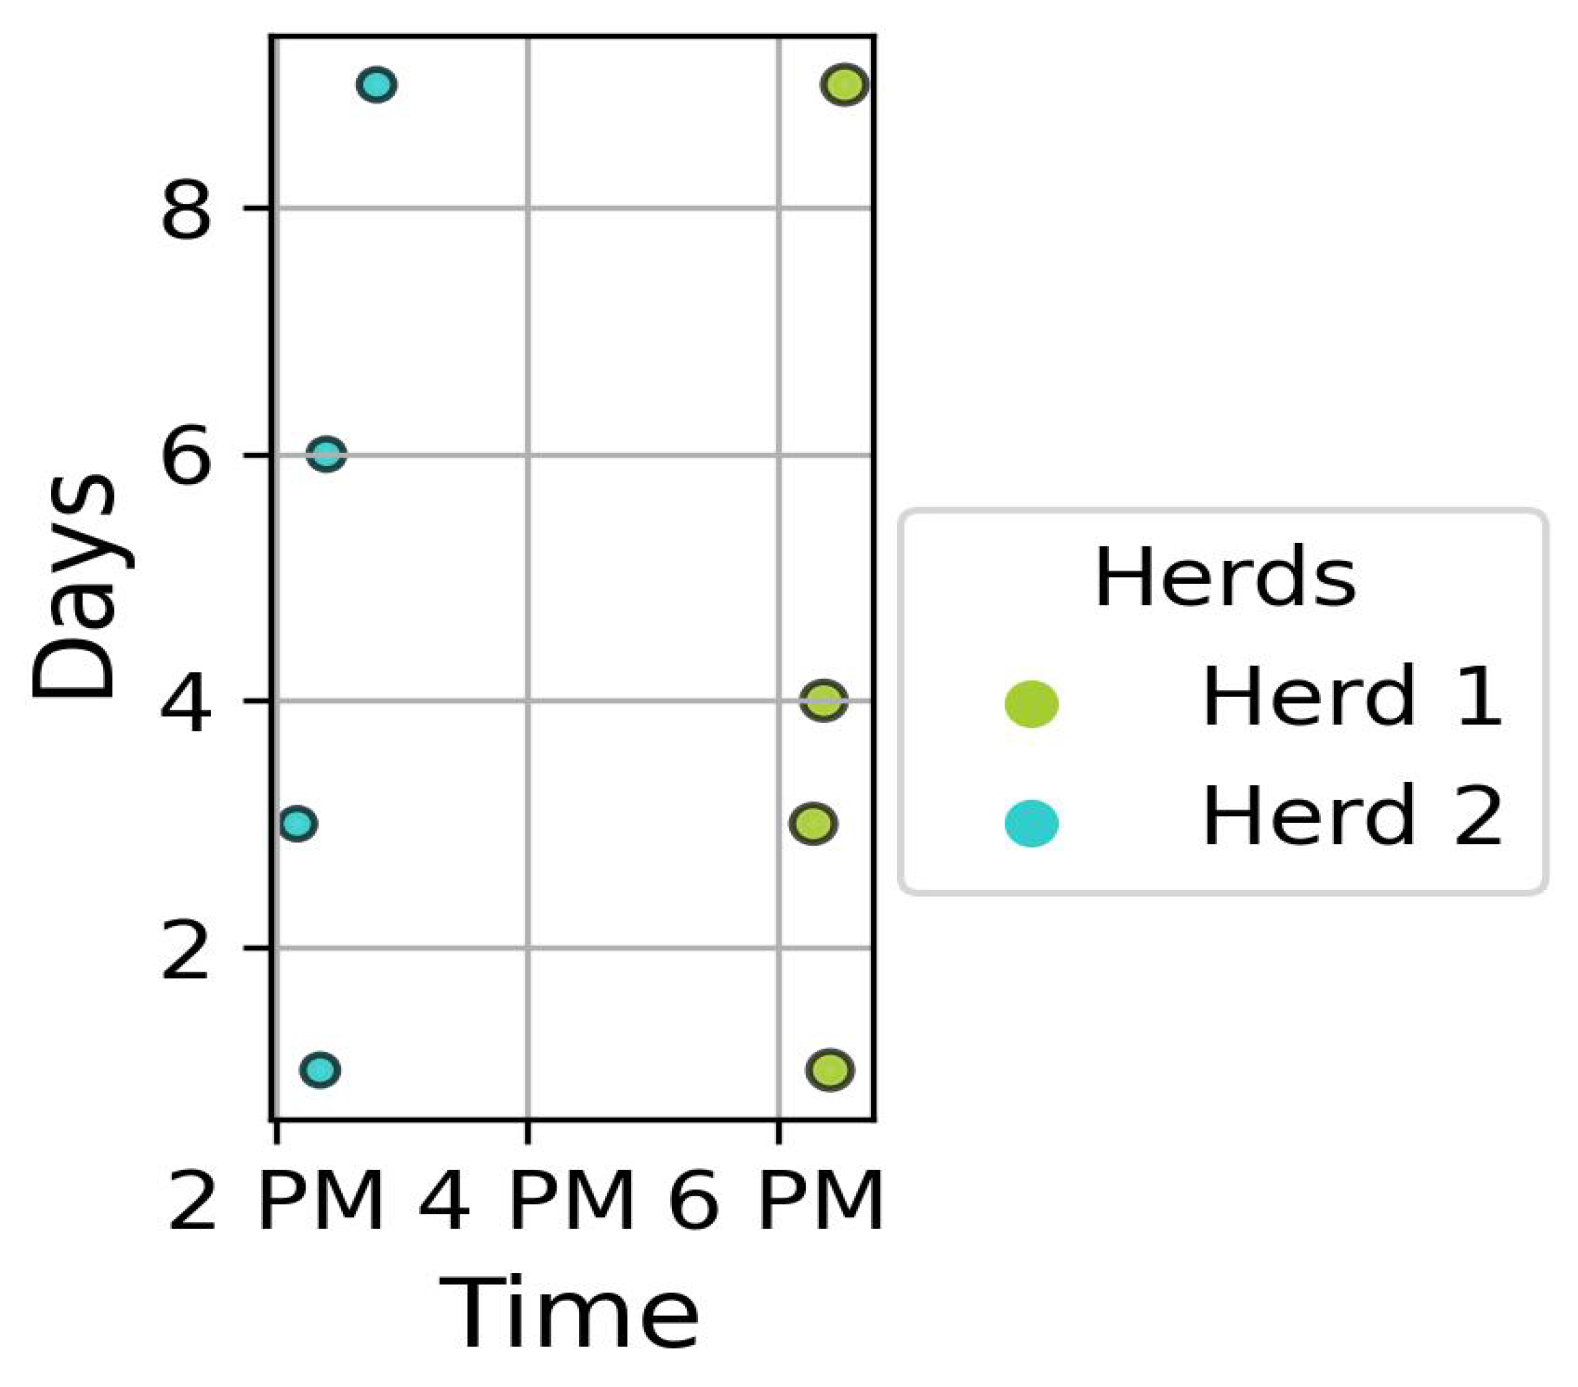
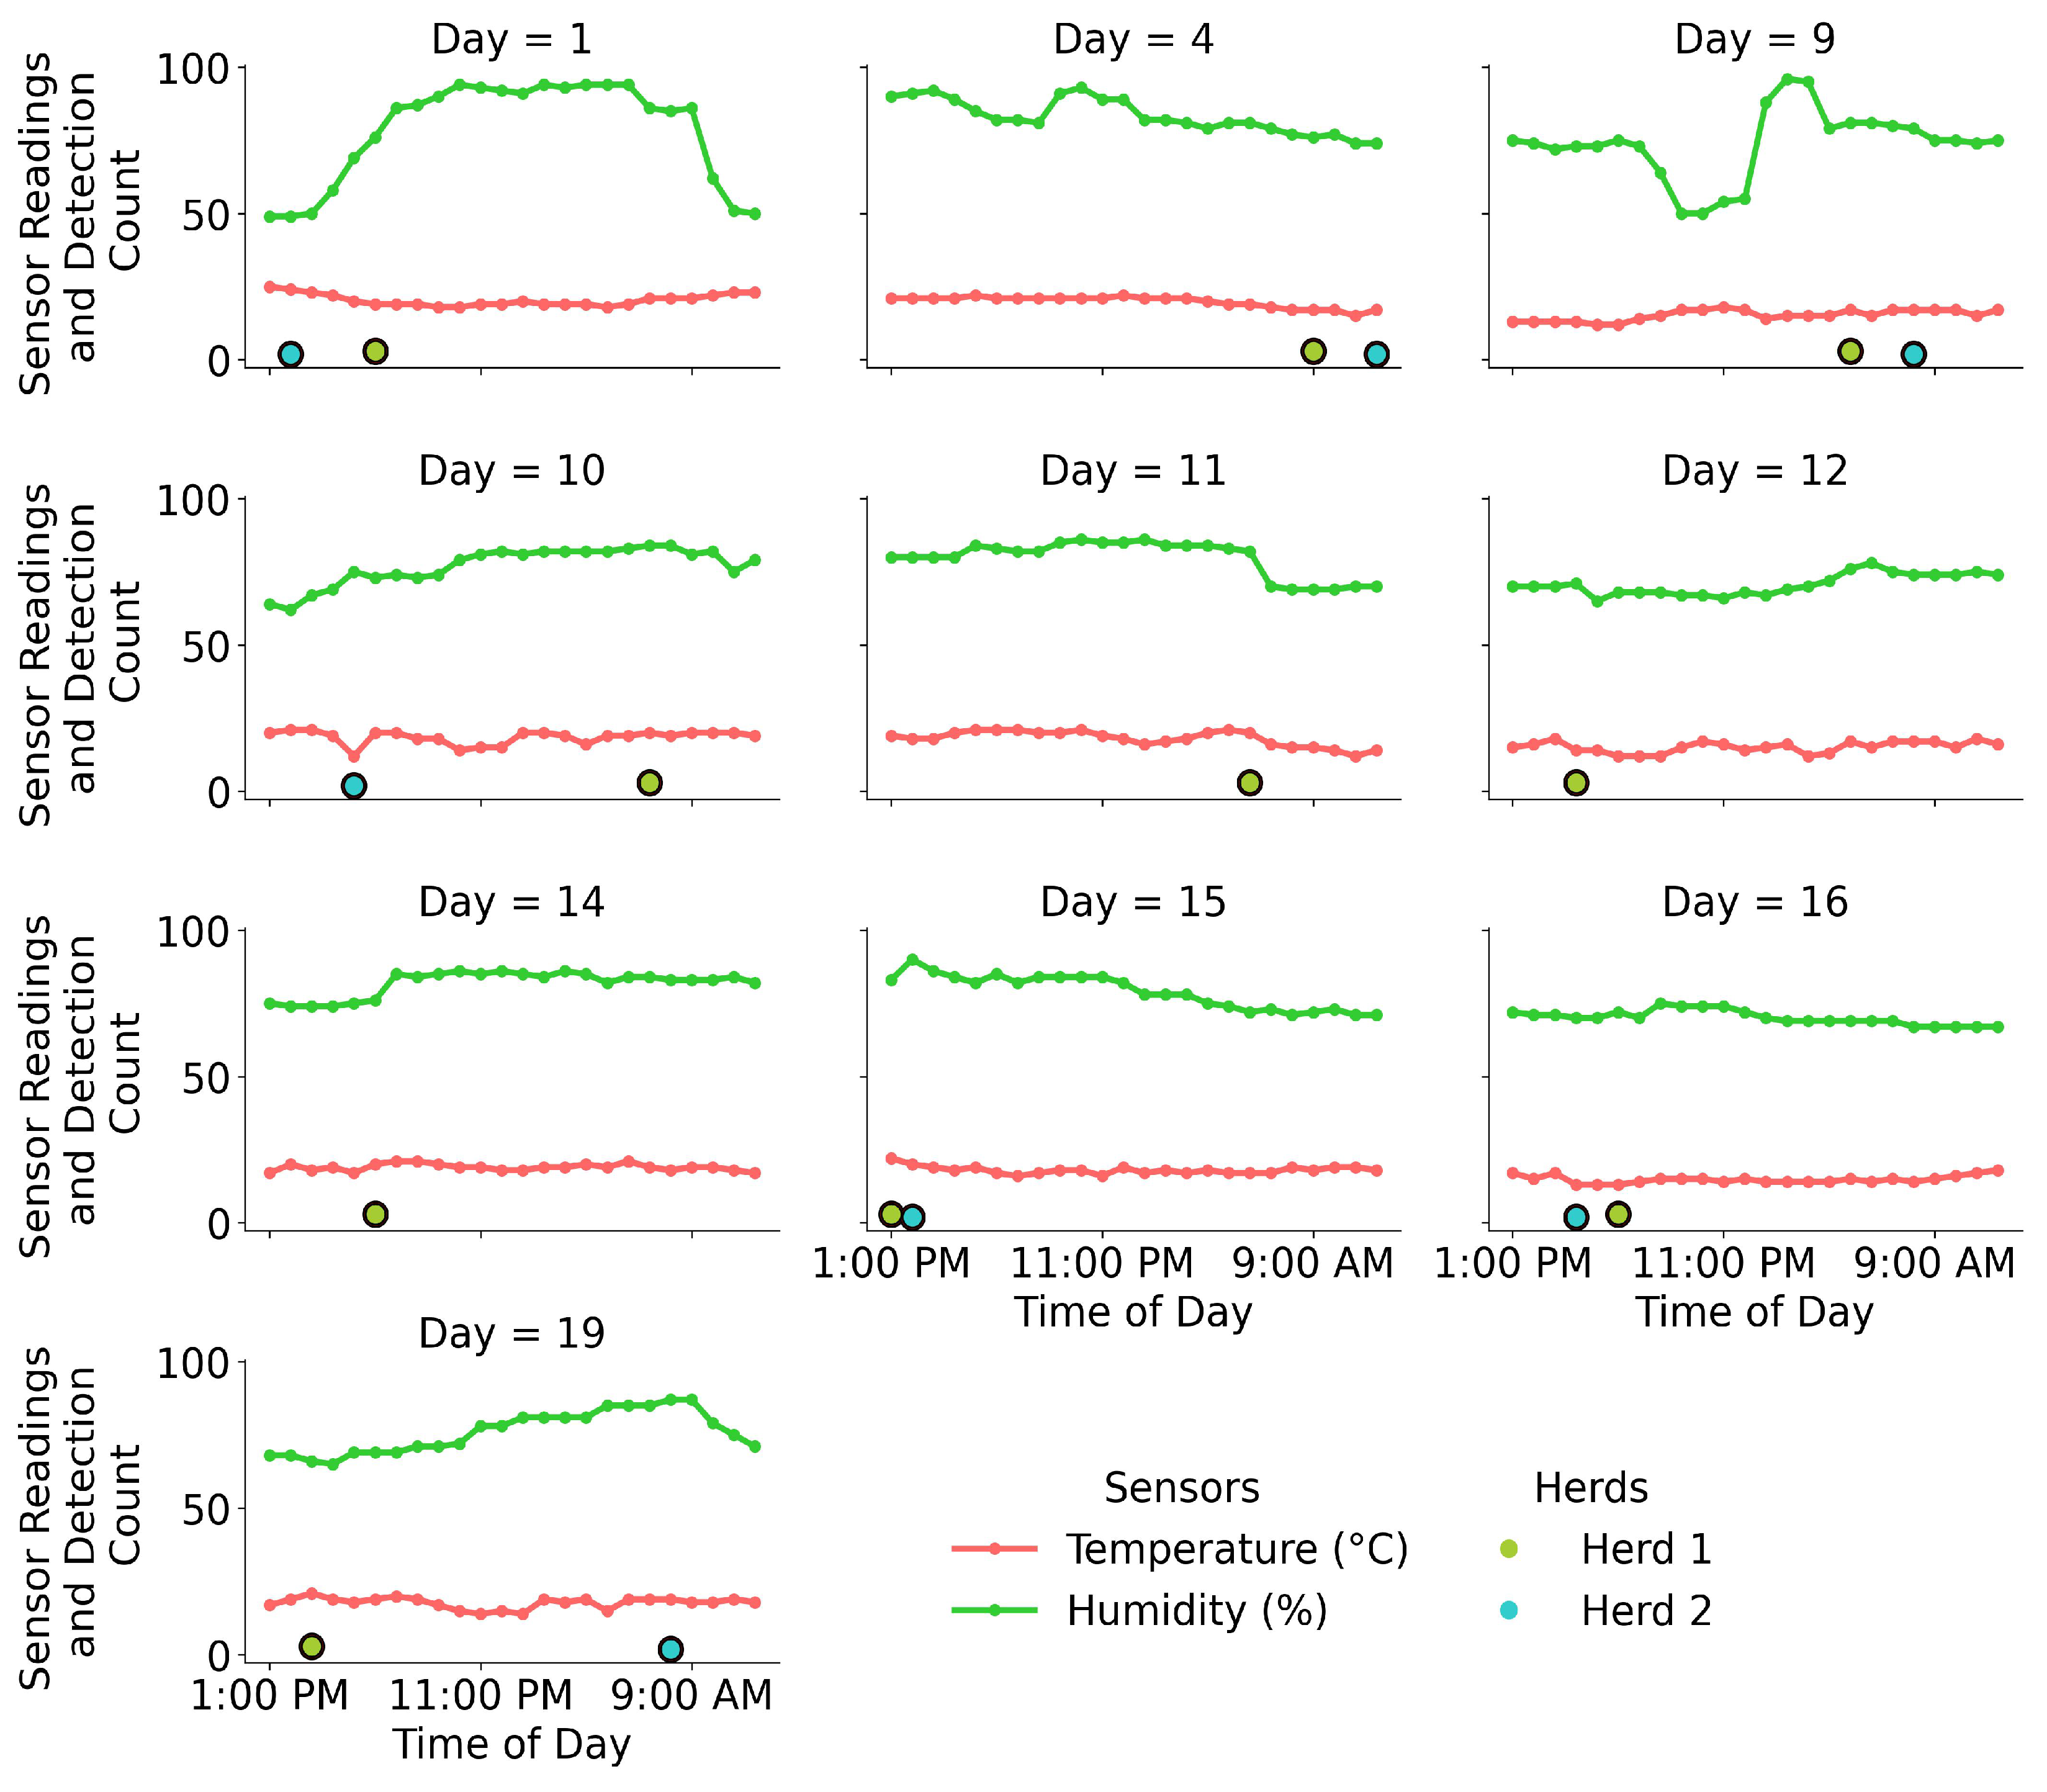
After detecting Sika deer and creating a bounding box, alert notifications were sent to local residents, farmers, and university professors via email and LINE. LINE is a widely used messaging application across Asia, particularly in Japan, Taiwan, Thailand, and Indonesia. It provides free instant messaging, voice calls, and video calls, and is renowned for its intuitive interface and playful customization options [22]. To send notifications via LINE, we generated a token using LINE Notify (Figure 2). Sika deer can detect sounds within the human audible frequency range of 20 Hz to 20 kHz, showing increased sensitivity to frequencies around 16 kHz [23,24]. Therefore, we created a sound at 16 kHz in stereo and saved the audio files in a lossless compressed format (.wav). The lossless file format was used for a buzzer (a Yirdapall small portable speaker) to help deter Sika deer from the area. Overall, after detecting Sika deer and creating a bounding box, the notifications were first sent to locals via email and LINE. Afterward, the buzzer was promptly activated to deter the Sika deer from the deployment site.
For the Raspberry Pi, we implemented a button-based control system that activates automatically with each press. In this study, a tactile push button connected to a GPIO pin 13 was employed to trigger specific actions on the Raspberry Pi. In a field setting, a single press of the button would activate the Raspberry Pi’s functionality. However, because we could not test the system’s functionality in the field, we decided against incorporating a shutdown mechanism. As a result, the Raspberry Pi remained continuously active, regardless of the number of times the button was pressed. We deployed the Raspberry Pi, equipped with all necessary sensors, in the field in Muroran, Hokkaido, Japan (42°22′56.1″ N–141°01′51.5″ E), for a 30-day testing period in October 2024. Throughout this deployment, the Raspberry Pi operated continuously to gather and assess all datasets and required information. We placed all sensors, along with the battery and Raspberry Pi, in a box. We used a plastic covering to shield the sensors from rain, and the switch was enclosed in a plastic box for added protection (Figure 4). We monitored the Sika deer using a Raspberry Pi without the buzzer for the first 10 days (1–10 October 2024), and we activated the buzzer for the next 20 days (11–30 October 2024) to observe the deer’s behavior before and after the buzzer was introduced (Figure 3). We performed weekly checks on the Raspberry Pi in the field.
An ANOVA test was performed to evaluate the impact of the time of day on the temperature and humidity at the Sika deer visiting site. The time of day was categorized into a.m. and p.m., based on the observed hours of Sika deer activity. Separate analyses were performed for temperature and humidity, considering the time of day (a.m./p.m.) as the independent variable. These analyses were performed to determine the influence of environmental conditions on Sika deer’s visiting patterns across different times of the day.

3. Results

The training process of the YOLOv8-nano (“yolov8n-oiv7”) model for Sika deer detection shows a clear downward trend in losses over the course of the epochs. Both training and validation box losses, along with the training and validation class losses, steadily declined. By the time the model reached 500 epochs, the losses started to stabilize, suggesting that further training may not result in significant enhancements (Figure 5). The proposed model demonstrated excellent performance, with precision and recall values close to 1. It achieved a mean Average Precision (mAP) score at 50% IoU (mAP50) of nearly 1 and a mean Average Precision across IoU thresholds from 50% to 95% (mAP50-95) of about 0.98 (Figure 6).
We observed two herds of Sika deer. Herd 1 comprised three individual Sika deer, while Herd 2 comprised two individuals. Before the buzzer activation, both herds displayed similar visitation patterns. Herd 1 visited the site between 6:00 and 7:00 p.m., while Herd 2 visited between 2:00 and 3:00 p.m. (Figure 7 and Figure 8).
The average latency for creating a bounding box when Sika deer were detected in images was 0.82 frames per seconds. Once the bounding boxes were established, alert notifications were automatically sent via email and LINE, with an average time of 0.32 s for each notification. After analyzing the impact of the buzzer on Sika deer, we observed that 35% of the detected individuals reacted by standing upright with their ears alert, while the remaining 65% quickly fled the area. These observations were based on the Sika deer detected within the bounding boxes of the captured images (Figure 9).
After buzzer activation, we observed the same herd of Sika deer that had been seen before activation. However, their visiting times at Raspberry Pi-deployed sites differed from those when the buzzer was inactive. During our study, no Sika deer visits were recorded during nighttime (7:00 p.m. to 6:00 a.m.). Herd 1 visited the site more frequently than Herd 2, and their visits did not overlap, maintaining a minimum gap of 30 min between their appearances (Figure 10). The average temperature and humidity recorded when the Sika deer were observed after buzzer activation were 17 °C and 75%, respectively. The temperature ranged from 12 °C to 24 °C, while the humidity levels varied between 66% and 90% (Figure 10, Table 2). ANOVA revealed no significant effect of the time of day of Sika deer visits (a.m./p.m.) on temperature (F = 0.681, p = 0.410). Meanwhile, the analysis showed that the time of day of Sika deer visits was significantly impacted by humidity (F = 8.95, p = 0.003).

4. Discussion

Regular monitoring of wildlife and promptly notifying locals when wildlife approaches residential areas are essential for reducing human–wildlife conflicts and ensuring effective wildlife management [1]. In this study, we implemented an automated Sika deer detection model on a Raspberry Pi to notify locals upon Sika deer arrival at specific sites. The Sika deer population in Hokkaido, Japan, is growing alarmingly, exerting an increasing pressure on agricultural land and leading to significant economic losses in agricultural production [15]. Therefore, we aimed to provide prompt notifications to inform locals about Sika deer sightings by deploying a buzzer system designed to deter the Sika deer from these areas.
We deployed the fine-tuned YOLOv8-nano model for detecting Sika deer and successfully deployed it on Raspberry Pi for real-time automated detection. The YOLOv8-nano architecture is specifically designed to be lightweight and optimized for resource-constrained devices, such as Raspberry Pi and mobile devices [17]. After evaluating the latency for generating bounding boxes around Sika deer in the captured images, we found an average processing speed of 0.82 frames per second. This performance is slightly below the 0.9 frames per second achieved with the YOLOv3 architecture [25], indicating that the YOLOv8-nano architecture, designed for enhanced efficiency, was effective in this study (Table 3).
Two herds of Sika deer were recorded using the Raspberry Pi set up at the study sites (Figure 7). Herd 1 comprised three individual Sika deer, and Herd 2 comprised two. The herds were differentiated by their distinct spot patterns, as identified in our prior research [26]. Before the activation of the buzzer, the visiting times for the deployed Raspberry Pi locations were predetermined (Herd 1; 6:00 p.m.–7:00 p.m., Herd 2; 2:00 p.m.–3:00 p.m.). However, after the buzzer activation, Sika deer began visiting the sites more frequently, though their timing patterns became increasingly erratic. This change is attributable to the initial disturbance caused by the buzzer, which likely prompted the Sika deer to modify their visiting times to evade the noise. Over time, they appeared to adapt to the new conditions, resulting in a broader range of visiting patterns [27].
The results indicated that temperature did not differ significantly between the times of day (a.m. and p.m.) of Sika deer visits, as evidenced by the high p-value (F = 0.681, p = 0.410). This suggests that temperature fluctuations within the 24-h cycle were relatively minimal or stable in the study area, meaning that temperature may not be a key factor driving the visit timing of Sika deer visits. Meanwhile, the significant difference in humidity (F = 8.95, p = 0.003) highlighted that the time of day had a notable effect on humidity levels. This finding suggests that Sika deer may be more responsive to changes in humidity, with higher humidity potentially influencing their behavior, such as foraging or movement patterns [27].
The effectiveness of alert notifications sent via LINE and email was proven by their swift delivery to locals, supervisors, and colleagues upon detecting Sika deer. We chose LINE as our primary communication method because it is widely used and preferred in our study areas (SS, Pers. Obs.). We evaluated the average notification timing, which was 0.32 s per alert, by comparing the bounding boxes of detected Sika deer in log datasets stored on the server with the corresponding images. The time taken to send alert notifications ranged from 0.28 to 0.4 s, depending on the strength of the cellular data signals used by the Wi-Fi module, which varied based on weather conditions, for instance, whether sunny or cloudy [28]. The average notification time for sending alerts closely aligns with the findings of Dertien et al. [29], who reported a notification time of 0.3 s using WhatsApp with an AI-based sensing camera alert system at the Duhwa Tiger Reserve in India for tiger detection and alert messaging. This analysis showed a 100% success rate. Recipients, including locals, supervisors, and colleagues, expressed complete satisfaction, as each message included the date and time of Sika deer detection, along with its ecological significance and impact on both the ecosystem and agricultural production. Promptly notifying locals about wildlife detection via email and mobile applications effectively mitigates human–wildlife conflicts [29]. All the informants (N = 10), after receiving notifications via email and LINE, did not approach the sites and instead altered the timing of their agricultural tasks, such as irrigation, to avoid conflict with the deer. These actions are effective in mitigating human–wildlife conflict, as demonstrated by Dartien et al. [29] in their real-time study of tiger species.
After buzzer activation, about 65% of the Sika deer fled the area, while the remaining 35% stayed alert by standing upright with their ears perked, despite the buzzer running at full volume. This mixed response under disturbance or threat is commonly observed in deer species [30]. Similarly, Babińska-Werka et al. [31] reported a 68% success rate in using acoustic wildlife warning devices for white-tailed deer, with this percentage of deer escaping after hearing the warning sound.
This research is crucial for the long-term conservation of target species, as it contributes to reducing human–wildlife conflict. The experimental setup, which includes sensors, buzzers, and the architecture for wildlife detection, is adaptable and can be used for various wildlife species. However, the model developed in this study is specifically customized for Sika deer, as it was trained exclusively with Sika deer images. While the architecture from this research can be applied to wildlife detection, it would require fine-tuning with target species images during the training process. Once trained, the model can be deployed on a Raspberry Pi, following the same method outlined in this study, to detect wildlife and send alert notifications.
However, certain limitations should be acknowledged. Initially, we deployed only temperature and humidity sensors to study the micro-environmental conditions associated with Sika deer. Sika deer dynamics are influenced by other factors, such as precipitation, wind, and light intensity. We propose extending this study by incorporating sensors for these additional factors to gain a deeper understanding of the environmental factors affecting Sika deer distribution. This study was conducted during a single season, and we recommend replicating the experiment across different seasons (such as spring, snowy periods, and autumn), and during extreme environmental conditions such as typhoons. Additionally, it is important to consider that crop damage tends to be more severe during harvest periods. By expanding the study to include these different times of year, we can gain a better understanding of the timing and behavior of Sika deer visits. This would also enable a more thorough evaluation of the performance of the sensors deployed on the Raspberry Pi, helping to mitigate human–wildlife conflict and reduce agricultural losses caused by Sika deer under varying environmental conditions. Our findings indicate that the effectiveness of buzzers in deterring Sika deer at deployment sites is minimal. Therefore, we recommend the use of unmanned aerial vehicles (UAVs) to deter Sika deer, as they have been effective in mitigating human–wildlife conflict for other species, such as elephants and tigers.

5. Conclusions

In conclusion, fine-tuning a YOLOv8-nano model proved highly effective for detecting Sika deer, achieving a near-perfect mAP score at 50% IoU (0.98). During the deployment of a Raspberry Pi in the field, we observed two Sika deer herds: Herd 1 comprising three individuals, and Herd 2 comprising two individuals. Alert notifications sent via email and the LINE application after detecting individual Sika deer and generating bounding boxes were 100% effective, as all participants (N = 10) received timely notifications after each Sika deer sighting. Following the alerts, a buzzer was activated, causing 35% of the Sika deer to stay alert, while 65% fled immediately. Before the buzzer activation, the timing of Sika deer visits was specific, with Herd 1 visiting between 6:00 and 7:00 p.m., and Herd 2 between 2:00 and 3:00 p.m.. After the buzzer activation, both herds began visiting at various times throughout the day. We found a significant association between the timing of Sika deer visits and humidity (F = 8.95, p = 0.003), but no such association with temperature (F = 0.681, p = 0.410). This research provides crucial insights for decision-makers in developing conservation strategies aimed at reducing human–wildlife conflicts involving Sika deer.

Author Contributions

Conceptualization, S.S., B.P.G. and K.S.; Methodology, S.S., B.P. and K.S.; Resources, S.S., K.S. and B.P.; Supervision, K.S. and B.P.G.; Writing—Original Draft Preparation, S.S.; Writing—Review and Editing, S.S., B.P., S.T., K.S., B.P.G., Y.O., S.W. and S.K. All authors have read and agreed to the published version of the manuscript.

Funding

The research received no external funding.

Data Availability Statement

The data analysis code and sample raw data are available publicly on GitHub at https://github.com/sand198/real_time_sika_monitoring.git (accessed on 21 April 2024). The repository also includes instructions for executing the code.

Acknowledgments

We sincerely appreciate the support provided through the Project-Based Learning-AI (PBL-AI) program and the Ministry of Education, Culture, Sports, Science, and Technology (Monbukagakusho: MEXT) scholarship awarded to Sandhya Sharma, Buchaputara Pansri, and Suresh Timilsina. We are also deeply grateful to Rakshya Poudel and Dipak Khatri for their invaluable help with data collection in the field.

Conflicts of Interest

The authors declare no conflicts of interest.

References

  1. Lamarque, F.; Anderson, J.; Fergusson, R.; Lagrange, M.; Osei-Owusu, Y.; Bakker, L. Human-Wildlife Conflict in Africa: Causes, Consequences and Management Strategies; Food and Agriculture Organization of the United Nations: Rome, Italy, 2009; p. 112. [Google Scholar]
  2. Madhusudhan, M.D.; Sankaran, P. Seeing the elephant in the room: Human-elephant conflict and the ETF report. In Economic and Political Weekly XLV; The Ministry of Environment and Forest: New Delhi, India, 2010; pp. 29–31. [Google Scholar]
  3. Mhuriro-Mashapa, P.; Mwakiwa, E.; Mashapa, C. Socio-economic impact of human-wildlife conflicts on agriculture based livelihood in the periphery of save valley conservancy, Southern Zimbabwe. J. Anim. Plant Sci. 2018, 28, 903–914. [Google Scholar]
  4. Marchini, S.; Macdonald, D.W. Predicting ranchers’ intention to kill jaguars: Case studies in AMazonia and Pantanal. Biol. Conserv. 2012, 147, 213–221. [Google Scholar] [CrossRef]
  5. Nyhus, P.J. Human-wildlife conflict and coexistence. Annu. Rev. Environ. Resour. 2016, 41, 143–171. [Google Scholar] [CrossRef]
  6. Shrestha, R. A Case Study on Human-Conflict in Nepal (with Particular Reference to Human-Elephant Conflict in Eastern and Western Terai Regions); World Wildlife Fund: Kathmandu, Nepal, 2007. [Google Scholar]
  7. Bajracharya, S.B.; Furley, P.A.; Newton, A.C. Impacts of community-based conservation on local communities in the Annapurna Conservation Area, Nepal. Biodivers. Conserv. 2006, 15, 2765–2786. [Google Scholar] [CrossRef]
  8. Weladji, R.B.; Tchamba, M.N. Conflict between people and protected areas within the Bénoué Wildlife Conservation area, North Cameroon. Oryx 2003, 37, 72–79. [Google Scholar] [CrossRef]
  9. Outoma, J. The Effects of Wildlife-Livestock-Human Interactions on Habitat in the Meru Conservation Area, Kenya; LUCID Working Paper 39, Land Use Change Impacts and Dynamics; International Livestock Research Institute: Nairobi, Kenya, 2004. [Google Scholar]
  10. Granados, A.; Weladji, R.B. Human–elephant conflict around Bénoué National Park, Cameroon: Influence on local attitudes and implications for conservation. Hum. Dimens. Wildl. Int. J. 2012, 17, 77–90. [Google Scholar] [CrossRef]
  11. Richardson, R.B.; Fernandez, A.; Tschirley, D.; Tembo, G. Wildlife Conservation in Zambia: Impacts on Rural Household Welfare. World Dev. 2012, 40, 1068–1081. [Google Scholar] [CrossRef]
  12. MAFF. A Report Submitted by the Ministry of Agriculture, Forest and Fisheries. 2021. Available online: https://www.maff.go.jp/e/index.html (accessed on 7 October 2024).
  13. Harris, R.B. Cervus nippon. The IUCN Red List of Threatened Species 2015:e.T41788A22155877. Available online: https://www.iucnredlist.org/species/41788/22155877 (accessed on 7 October 2024).
  14. Takatsuki, S. Effects of sika deer on vegetation in Japan. A review. Biol. Conserv. 2009, 142, 1922–1929. [Google Scholar] [CrossRef]
  15. Honda, T. Environmental factors affecting the distribution of the wild boar, sika deer, Asiatic 8 black bear and Japanese macaque in central Japan, with implications for human-wildlife conflict. Mammal Study 2009, 34, 107–116. [Google Scholar] [CrossRef]
  16. McMillan, S.E.; Dingle, C.; Allcock, J.A.; Bonebrake, T.C. Exotic animal cafes are increasingly home to threatened biodiversity. Conserv. Lett. 2021, 14, e12760. [Google Scholar] [CrossRef]
  17. Anonymous. YOLOV8 Nano vs. YOLOv8 Large. Medium. 2024. Available online: https://medium.com/@elvenkim1/yolov8-nano-vs-yolov8-large-4f21324baa38 (accessed on 9 October 2024).
  18. Anonymous. Grove-Digital PIR Sensor. Seed Studio. 2024. Available online: https://wiki.seeedstudio.com/Grove-Digital-PIR-Sensor/ (accessed on 9 October 2024).
  19. Anonymous. USB Camera Module Infrared Camera Usb 9712 Chip Infrared Night Vision light ir Camera Module 1280 × 720 30 fps Camera Sensor Module. Amazon. 2024. Available online: https://www.amazon.co.jp/-/en/camera-module-infrared-vision-1280x720/dp/B08775TNBJ (accessed on 12 August 2024).
  20. Ashcroft, M.B.; French, K.O.; Chisholm, L.A. An evaluation of environmental factors affecting species distributions. Ecol. Model. 2011, 222, 524–531. [Google Scholar] [CrossRef]
  21. Anonymous. Grove-Temperature and Humidity Sensor. Seed Studio. 2024. Available online: https://wiki.seeedstudio.com/Grove-TemperatureAndHumidity_Sensor/ (accessed on 9 October 2024).
  22. Anonymous. LINE User Trends 2024: The Largest Messaging App in Japan. Tamilo. 2024. Available online: https://tam-tamlo.com/en/307 (accessed on 21 November 2024).
  23. Minami, M.; Kawamichi, T. Vocal repertories and classification of the Sika deer Cervus nippon. J. Mamm. Soc. Jpn. 1992, 17, 71–94. [Google Scholar]
  24. Long, A.; Moore, N.; Hayden, T. Vocalizations in red deer (Cervus elaphus), Sika deer (Cervus nippon), and redxsika hybrids. J. Zool. 1998, 244, 123–134. [Google Scholar] [CrossRef]
  25. Anonymous. Struggles of Running Object Detection on a Raspberry Pi. Medium. 2019. Available online: https://towardsdatascience.com/struggles-of-running-object-detection-on-a-raspberry-pi-fa61b50a3b9f (accessed on 9 October 2024).
  26. Sharma, S.; Timilsina, S.; Gautam, B.P.; Watanabe, S.; Kondo, S.; Sato, K. Enhancing Sika deer identification: Integrating CNN-based Siamese Networks with SVM classification. Electronics 2024, 13, 2067. [Google Scholar] [CrossRef]
  27. Uzal, A.; Walls, S.; Stillman, R.A.; Diaz, A. Sika deer distribution and habitat selection: The influence of the availability and distribution of food, cover, and threats. Eur. J. Wildl. Res. 2013, 59, 563–572. [Google Scholar] [CrossRef]
  28. Anonymous. Does Weather Affect Cell Service? Weboost. 2022. Available online: https://www.weboost.com/blog/does-weather-affect-cell-phone-signal (accessed on 9 October 2024).
  29. Dartien, J.S.; Negi, H.; Dinerstein, E.; Krishnamurthy, R.; Negi, H.S.; Gopal, R.; Gulick, S.; Pathak, S.K.; Kapoor, M.; Yadav, P.; et al. Mitigating human-wildlife conflict and monitoring endangered tigers using a real-time camera-based alert system. BioScience 2023, 73, 748–757. [Google Scholar] [CrossRef] [PubMed]
  30. Anonymous. 20 Things to Know About Deer Body Language and Behavior. Realtree. 2024. Available online: https://realtree.com/deer-hunting/galleries/20-things-to-know-about-deer-body-language-and-behavior (accessed on 9 October 2024).
  31. Babińska-Werka, J.; Krauze-Gryz, D.; Wasilewski, M.; Jasińska, K. Effectiveness of an acoustic wildlife warning device using natural calls to reduce the risk of train collisions with animals. Transp. Res. D Trans. Environ. 2015, 38, 6–14. [Google Scholar] [CrossRef]
Figure 1. Visualization of the research motivation.
Electronics 13 04852 g001
Figure 2. Circuit diagram for Raspberry Pi-based Sika deer monitoring and alert system.
Electronics 13 04852 g002
Figure 3. Workflow illustrating Sika deer real-time detection and alert mechanism.
Electronics 13 04852 g003
Figure 4. Components connected to the Raspberry Pi for Sika deer detection in the field: (a) external components housed inside a plastic box; (b) sensors, camera, and switch positioned outside the plastic box; (c) solar panel providing a continuous power supply; and (d) Raspberry Pi with components enclosed in a plastic box alongside a solar panel installed in the study field.
Electronics 13 04852 g004
Figure 5. Curves representing box and class loss for training and validation datasets.
Electronics 13 04852 g005
Figure 6. Performance metrics across multiple epochs.
Electronics 13 04852 g006
Figure 7. The number of herds observed daily before the buzzer activation was recorded. Day 1 represented the first day without the buzzer activation on the Raspberry Pi, followed by subsequent days.
Electronics 13 04852 g007
Figure 8. Images of individual Sika deer within each herd: (a) Herd 1, consisting of three individual Sika deer; and (b) Herd 2, consisting of two individual Sika deer.
Electronics 13 04852 g008
Figure 9. Visualization of alert mechanisms following Sika deer detection in captured images: (a) identification of Sika deer using bounding boxes in captured images; (b) alert notification via email; (c) alert notification through LINE application; and (d) analysis of Sika deer behavior following buzzer activation.
Electronics 13 04852 g009
Figure 10. Herd observations recorded at different times throughout the day, along with environmental temperature and humidity, after buzzer activation. The term “Day” refers to the number of days since the buzzer was activated; for example, “Day 1” indicates the first day after activation, “Day 4” refers to the fourth day, and so forth. The visualization only includes days when herds of Sika deer were observed, excluding days without any sightings.
Electronics 13 04852 g010
Table 1. Internal and external monitoring components.
Internal Components with BatteryActivitiesExternal ComponentsGPIO PIN
CPU TemperatureCool down for 30 minTemperature Sensor26
Disk SpaceImages and Datasets sent to serverHumidity Sensor26
CPU UsageCool down for 30 minButton for Controlling Raspberry Pi13
Battery and Solar PanelConnected to ControllerPIR Sensor22
Table 2. The time of Sika deer visit and environmental data after buzzer activation.
ParametersObservation
Herds ObservedHerd 1, Herd 2
Visit FrequencyHerd 1 visited more frequently
Visit Overlap of two HerdsNo overlap, minimum 30 min gap
Nighttime VisitsNone
Average Temperature17 °C
Average Humidity75%
Temperature Range12–24 °C
Humidity Range66–90%
Table 3. Comparison of real-time object detection using YOLOv8-nano in our study and YOLOv3 in existing studies.
MetricYOLOv8-nano (Our Research)YOLOv3 [25]
Latency (frames per second)0.820.9
Detection ArchitectureYOLOv8-nanoYOLOv3
Deployment EnvironmentRaspberry Pi 4BRaspberry Pi 3
Disclaimer/Publisher’s Note: The statements, opinions and data contained in all publications are solely those of the individual author(s) and contributor(s) and not of MDPI and/or the editor(s). MDPI and/or the editor(s) disclaim responsibility for any injury to people or property resulting from any ideas, methods, instructions or products referred to in the content.

