1. Introduction
Over the past years, additive manufacturing (AM) has become increasingly prevalent in high-tech industries, including aerospace, medical, automotive, defense, and tooling [
1,
2,
3]. Unlike conventional subtractive techniques, AM builds components by sequentially layering material, allowing for intricate and highly customized designs. One of the most advanced AM methods, Laser Powder Bed Fusion for Metal (LP-BF/M), enables the fabrication of complex, high-precision parts. Recent technological advancements have significantly enhanced LP-BF/M’s capabilities, making it suitable for various demanding applications. Despite these improvements, integrating LP-BF/M into large-scale production remains challenging due to the need for consistent quality, repeatability, and process reliability [
4,
5].
Various factors, including inadequate or excessive melting temperature, scanning speed, laser power, and the sensitivity of LP-BF/M to environmental conditions, play a crucial role in the metal laser melting process, often contributing to defect formation. Among the most prevalent defects in LP-BF/M are porosity, keyhole formation, and the balling effect caused by surface tension [
6,
7,
8].
The analysis indicates that significant research has been conducted in recent years on methods for evaluating the quality of the laser melting process. Most quality assessment frameworks for this process rely on in situ monitoring techniques. However, there has been limited focus on the quantitative evaluation of in situ quality indicators for laser melting of metal powders, particularly in terms of the potential for automated feedback-based control to ensure consistent, high-quality standards throughout component manufacturing. This area is still in its early stages. As highlighted by the authors of studies [
1,
2,
3], overcoming this challenge will require more thorough research focused on classifying quality indicators based on in situ data. It is essential that such efforts are grounded in clear standards of accuracy (uncertainty) and repeatability, in line with widely accepted guidelines. Therefore, in situ monitoring of the melt pool is crucial for maintaining the integrity of the laser melting process and ensuring the overall quality of the component.
Therefore, the objective of this work is to develop a methodology for the quantitative assessment of the laser melting process quality in situ, based on uncertainty calculations for establishing tolerance intervals within which different quality levels of the melting process can be classified, as well as calculations of Type I and Type II errors for calculating the probabilities of temperature values falling within the established confidence intervals. Type I error (false positive) occurs when the laser melting process of metal powder is classified as non-compliant with quality requirements despite actually meeting them. This error leads to unnecessary corrective actions, increasing production costs and reducing process efficiency [
9,
10]. Type II error (false negative) occurs when the laser melting process of metal powder is classified as compliant with quality requirements despite actually deviating from them. This error is critical as it may lead to defects in the final product, compromising reliability and performance [
10,
11,
12]. In the context of our study, these errors are proposed to be quantitatively assessed based on the established tolerance ranges for melting temperatures, enabling a probabilistic assessment of process quality.
Ye J. et al. [
13] conducted an in-depth investigation into common quality issues in laser-sintered parts, identifying their root causes. Their findings emphasize that thermal factors play a crucial role in determining part quality. Key heat-related parameters, such as laser power, directly influence part geometry and defect formation, while energy density significantly affects surface roughness. However, even with stable and optimized process parameters, excessive heat input can still prevent the molten material from forming the intended geometry. To improve additive manufacturing performance and ensure high-quality final parts, the authors propose the development of a feedback control system for real-time monitoring of the laser melting process. A critical first step in creating such a system is acquiring reliable in situ data to serve as feedback signals from the printing process. However, this work only simulates methods for monitoring in situ parameters of the laser melting process without any experimental measurements of these parameters. Moreover, the quality of the process is assessed after the part has been manufactured, which cannot be considered a quantitative assessment of the in situ quality based on transparent reporting of accuracy.
Li J. et al. [
14] introduced a deep learning-based approach for in situ quality assessment of additively manufactured parts. Their method utilized layer-by-layer visual images as input data, eliminating the need for manual feature extraction. A novel transfer deep learning model, integrating a deep convolutional neural network with transfer learning, was implemented. To facilitate this, an off-axis in situ monitoring system was established, employing a high-resolution digital camera to capture images of each deposited layer. By modifying laser melting parameters, samples with varying quality levels were produced. Each captured image was then labeled according to porosity measurements obtained through optical microscopy, creating a dataset categorized into three quality levels: poor, medium, and high. The developed deep learning model was applied to classify part quality based on these layer-by-layer images. As highlighted by Ye J. et al. [
13], thermal parameters play a crucial role in part quality, making real-time monitoring and control of these factors essential during the metal laser sintering process. However, a limitation of this approach is that quality assessment relied solely on porosity values measured after fabrication via metallographic analysis.
Yan Y. et al. [
15] introduced a method for advanced quality control in additive manufacturing by leveraging hyperspectral imaging and machine learning. Their approach focused on detecting powder contamination, allowing for an evaluation of powder quality before determining its reusability. Hyperspectral imaging, which captures spectral data over a broad frequency range combined with spatial information, facilitates the identification of minute differences in temperature, humidity, and chemical composition, ensuring a more precise assessment of material integrity. These studies focus on non-destructive quality control of metal powder before the melting process begins, using hyperspectral imaging to assess the powder’s purity. However, during the laser melting process, it is important to monitor parameters such as temperature, energy distribution, and other dynamic characteristics, which cannot be fully evaluated based on pre-melting powder analysis. The proposed method assesses the quality of the powder before the melting process rather than during or after it. For in situ monitoring of the laser melting process, methods are needed that can evaluate quality and identify defects in real-time during the actual part formation process. Hyperspectral imaging effectively detects static characteristics of the powder, such as composition and purity. However, during the laser melting process, rapid and dynamic changes occur, including melting, crystallization, and cooling, which may be challenging to monitor using hyperspectral imaging.
Zhang J. et al. [
16] explored the impact of volume energy density (VED) on metal forming quality, emphasizing its dependence on key process parameters such as laser power, scanning speed, scan spacing, and powder layer thickness. These factors collectively determine the energy input required for effective melting. Their study revealed that insufficient VED led to pore formation due to incomplete fusion while increasing VED reduced porosity but introduced crack defects. At excessively high VED values, surface warping occurred, internal crack formation decreased, but larger pores appeared, slightly reducing specimen density. The findings highlight that VED variations significantly influence surface quality, density, defect formation, and the material’s microstructure. The authors emphasize the necessity of thoroughly examining the relationship between VED and these factors to optimize part quality. This study focuses on quality analysis performed only after the laser melting process is completed, which does not allow for in situ monitoring. The proposed quality control methods are aimed at static material characteristics (such as defects and microstructure) and are not capable of tracking changes in real-time. This makes it difficult to apply the results of this study for in situ monitoring during the laser melting process. In real-time, during laser melting, it is crucial to monitor dynamic parameters such as temperature and energy input, as they directly influence the final quality of the part. However, this study does not provide a methodology for monitoring these parameters during the manufacturing process. Moreover, defect analysis performed at the end of the process, once the part is already completed, does not provide the information necessary for making immediate adjustments to the laser melting parameters. In real production scenarios, it is essential to identify defects or deviations during the part formation process, not after it is finished, to enable timely corrections and ensure high quality.
Lupi F. et al. [
17] conducted an extensive review of online-controlled input parameters, observable output signatures, real-time sensing techniques, and feedback control strategies framed within Deming’s Plan-Do-Check-Act (PDCA) cycle. Their study addressed the challenges and advancements in online control of metal LP-BF/M. They explored sensing methods used to capture both input parameters and output signatures, with a focus on state-of-the-art feedback strategies for closed-loop control. Among these, machine learning demonstrated the greatest potential for handling the speed, volume, and complexity challenges inherent in real-time LP-BF/M monitoring. The review concluded that while modern detection techniques provide high sampling rates and broad process coverage, the primary obstacle lies in the efficient application of data analysis methods—whether through machine learning or traditional statistical approaches—particularly in achieving real-time computational speeds for defect detection. Although this work provides a valuable conceptual overview, it remains largely theoretical and does not offer ready-to-implement solutions for real-time, in situ quality monitoring and control in LP-BF/M. The paper presents a limited discussion on the accuracy of the measurement equipment used and lacks practical solutions for detecting and correcting specific deviations in LP-BF/M parameters or defects.
Chua C. et al. [
2] analyzed different methodologies for quantitatively evaluating the quality of components manufactured through layer-based metal powder melting. Their review covered both real-time (in-process) and post-production (post-process) quality assessment techniques. They identified optical monitoring at the melt pool and track level—utilizing temperature and surface topography—as particularly effective for detecting critical process disruptions and lack-of-fusion defects. Variations in laser power during melting can cause irregular melting and solidification, leading to inconsistent material density and incomplete fusion of powder particles. Process instability and variations in part quality continue to be significant obstacles to the widespread industrial implementation of LP-BF/M [
2,
18]. Although this study provides a comprehensive overview of quality assessment strategies in metal powder bed fusion, it has the following limitations regarding in situ process control: a predominant focus on post-process methods, which limits their relevance for real-time monitoring and defect prevention; and the absence of concrete protocols for real-time defect detection and analysis, which are essential for effective process management.
Chua C. et al. [
2] emphasized the need for a standardized framework to unify diverse in situ monitoring techniques and establish consistent quality assessment criteria. They highlighted the necessity of further studies aimed at classifying component quality based on real-time data, ensuring transparent reporting of accuracy and repeatability. Developing a universally accepted standard for evaluating LP-BF/M process reliability would be crucial for enhancing quality control and process optimization.
Thus, the following hypothesis is formulated within the scope of this study: the quality of the LPBF/M process can be quantitatively assessed in situ based on the measurement of the melting temperature of 316L steel powder and the evaluation of measurement uncertainty. This hypothesis is based on the analysis of previous research results, indicating the significant impact of temperature fluctuations on defect formation and process stability during laser melting. Including uncertainty calculations and established tolerance intervals will allow for the determination of Type I and Type II errors, as well as probability levels, ensuring an objective classification of quality levels. Unlike existing approaches, which are primarily based on post-process defect analysis, the proposed methodology aims to develop an automated in situ quality monitoring system for the LPBF/M process.
2. Materials and Equipment
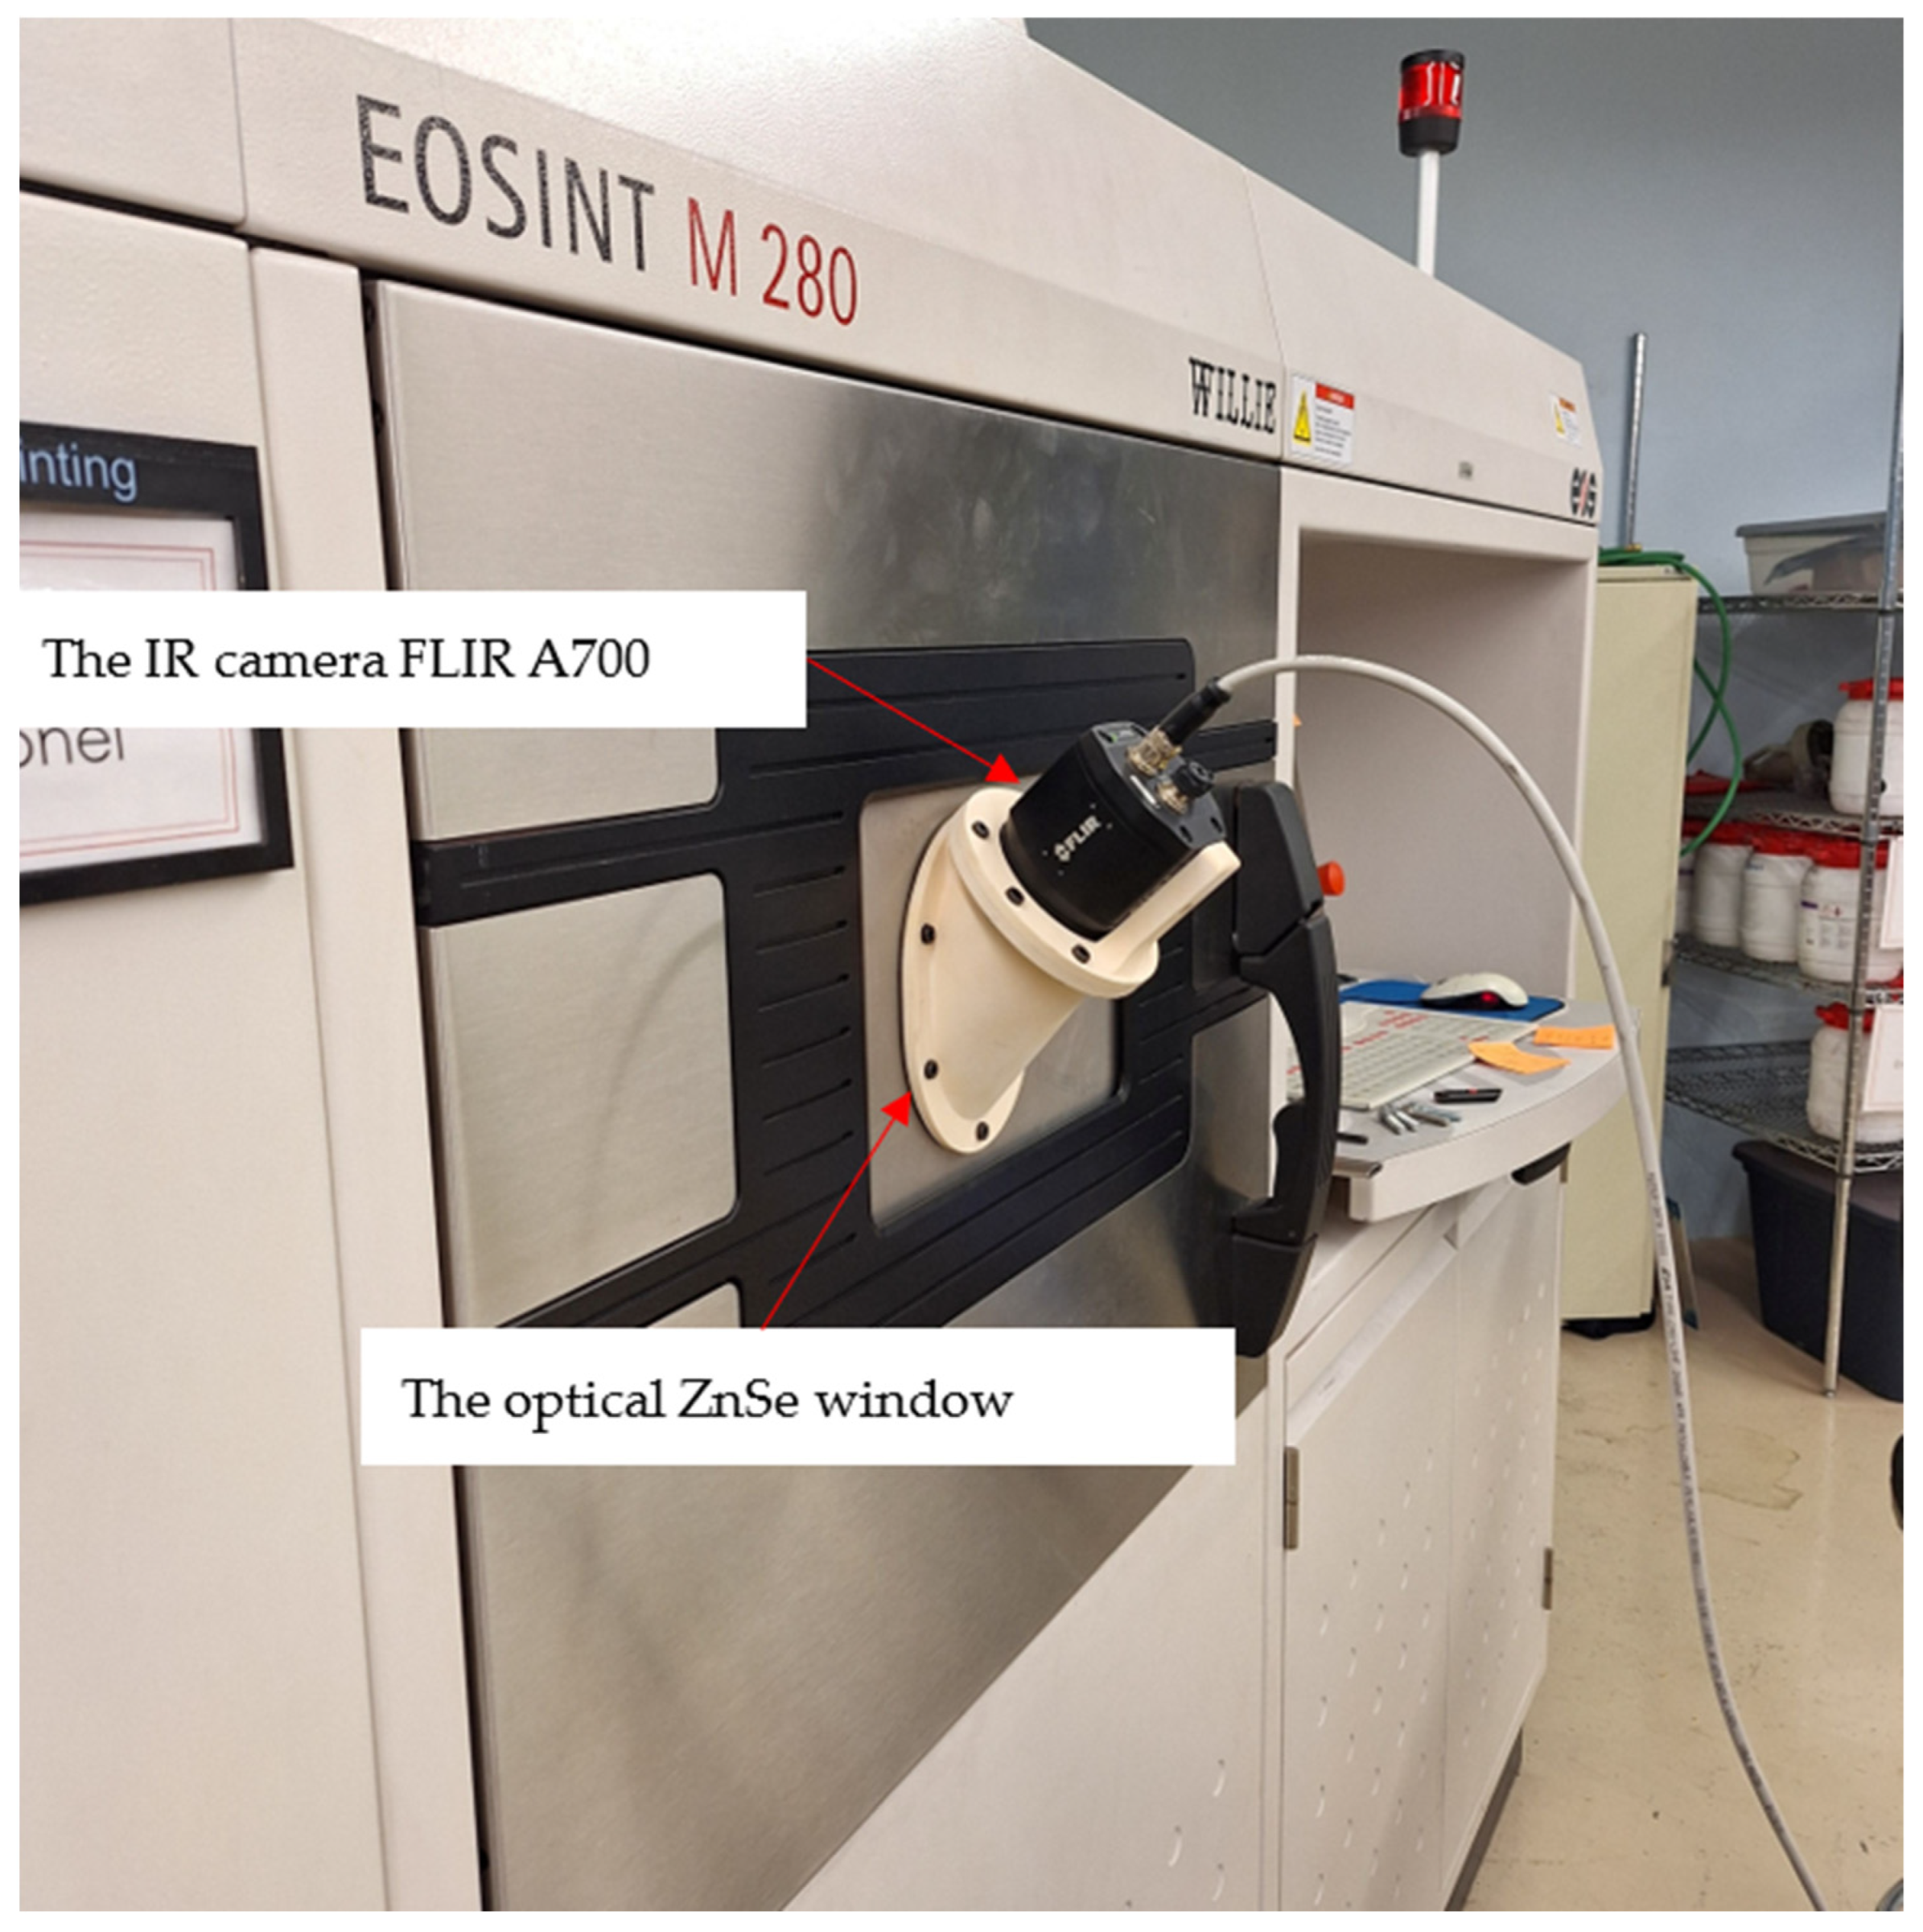
The laser melting process was examined within the build chamber of the EOSINT M280 system (
Figure 1). The optical metrological window substitutes the standard window of the EOSINT M280 system. The ZnSe window enables the transmission of wavelengths ranging from 3 µm to 12 µm. Full technical details of the optical window are available on the manufacturer’s website [
19]. The FLIR A700 infrared (IR) camera operates over a broad temperature range from 300 to 2000 °C, providing high measurement precision with an accuracy of ±2 °C or 2%, whichever is greater. The camera functions within a wavelength range of 7.5 to 14 µm and includes a dedicated output for generating a feedback signal [
20].
According to the user manual of the FLIR A700 IR camera [
20], to improve the accuracy of temperature measurements, the following parameters must be precisely measured and set in the camera settings before use: the distance from the camera lens to the object being studied, the ambient temperature, and the relative humidity between the camera lens and the object. The FLIR A700 IR camera records 30 full frames per second in radiometric mode, storing temperature data at every pixel. The FLIR A700 automatically performs Nonuniformity Correction (NUC) to compensate for changes in detector response across the sensor array, ensuring accurate and uniform thermal imaging. The system also adjusts pixel gain and offset values to reduce fixed pattern noise (FPN) and improve image clarity. The FLIR A700 IR camera with a 10 mm (42°) lens has been calibrated by the National Institute of Standards and Technology (NIST, Gaithersburg, MD, USA). The FLIR A700 provides the ability to adjust measurement parameters to compensate for the effect of the viewing angle on temperature accuracy. When using the infrared camera at an angle, the cosine correction function is applied. The FLIR A700 camera provides a spatial resolution of approximately 0.34 mm per pixel, based on a distance of 0.28 m between the lens and the object under study. To ensure consistent measurements, the IR camera’s position was precisely controlled by securely mounting it at a fixed distance and angle relative to the LPBF/M process.
The material used for manufacturing components was 316L steel powder. The manufacturer’s website provides detailed information on the chemical composition and particle size (20–65 µm) of the 316L steel powder [
21]. The EOSINT M280 system construction chamber used argon. The relative humidity inside the chamber when operating with argon approaches zero, as argon is supplied in a pure form. Typically, the moisture content is controlled at a level of less than 10 ppm (parts per million). However, there is an air gap between the designed ZnSe optical window and the IR camera lens used under laboratory conditions, which corresponds to the relative humidity of the ambient air in the laboratory. According to the FLIR A700 IR camera operating manual, the default relative humidity setting is 50%. To improve the accuracy of temperature measurements, it is necessary to set the measured relative humidity value of the air gap between the camera lens and the optical window [
20]. In our case, during the experimental investigation of the LPBF/M process, the measured relative humidity was 22%. Before conducting the experiments, a layer-by-layer process for creating parts at different power levels was designed, ranging from 150 W to 240 W, with a step size of 15 W. Each individual component was manufactured using a specific power level, which was set in advance. The nominal laser melting power for 316L steel powder, as recommended by the manufacturer of the EOSINT M280 system, is 195 W. The scanning speed was configured to 1083 mm/s. The EOSINT M280 system utilizes a single-mode continuous-wave ytterbium (Yb) fiber laser with a peak output power of up to 400 W. The focused laser spot size is 100 µm.
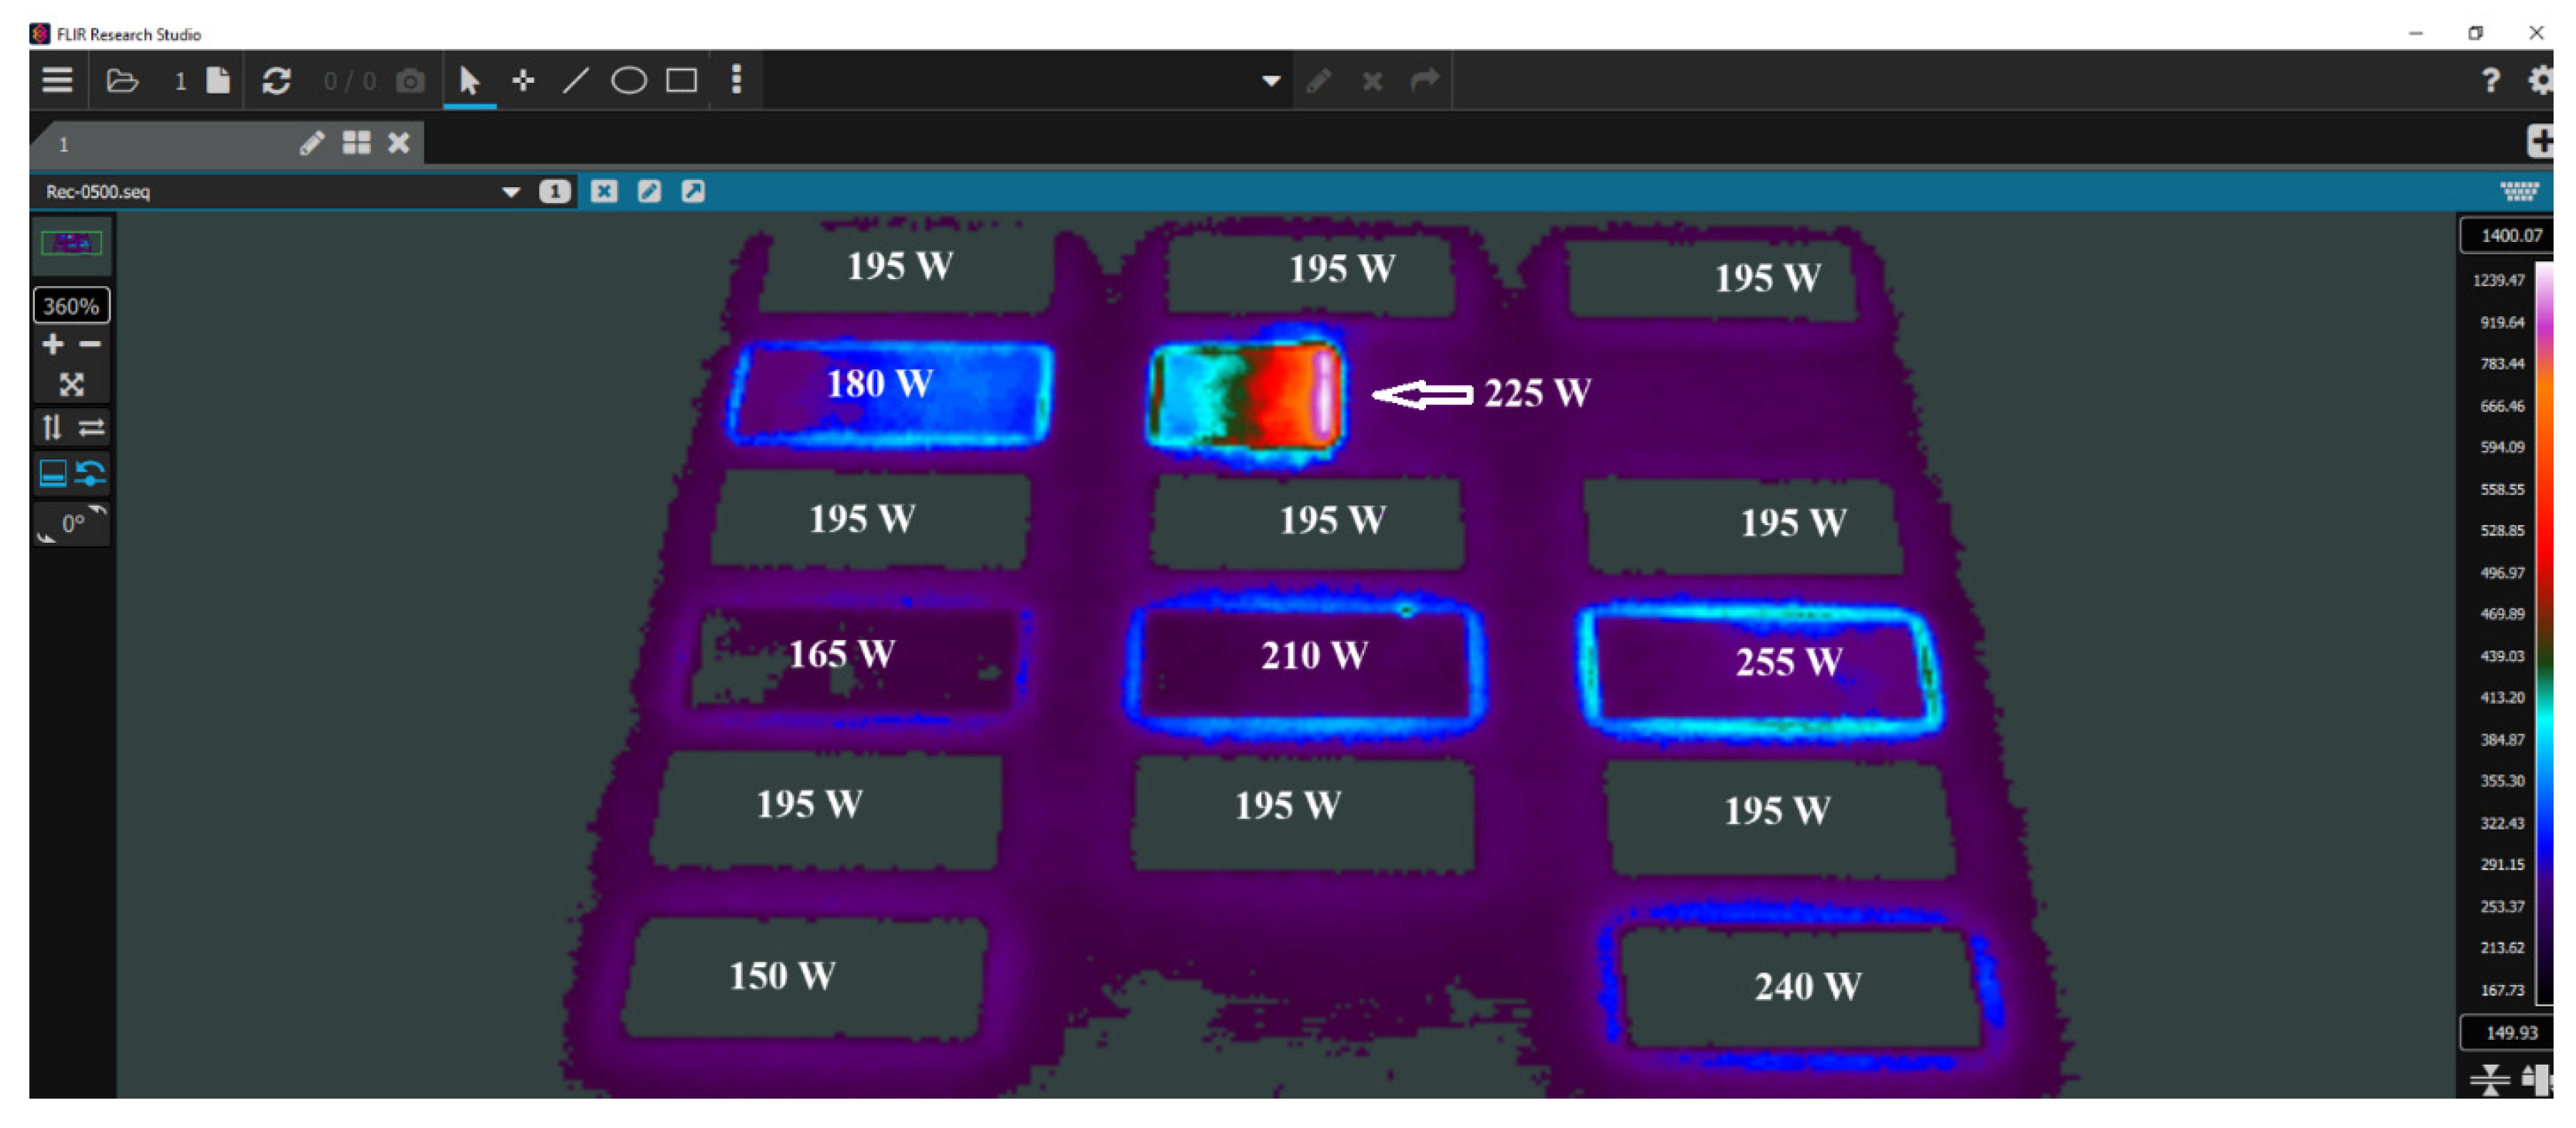
The FLIR Research Studio V2.0 software was applied to measure the sintering/melting temperatures of 316L steel powder at varying laser power levels. It was used to collect data on the peak temperature values for each layer of the produced component. A Kalman filtering algorithm was also implemented to estimate the temperature for each track.
Figure 2 displays the visualization of the laser melting process for a single component layer at different power settings, captured with the FLIR A700 infrared camera and analyzed using the FLIR Research Studio software.
Using the aforementioned equipment and software, multiple temperature measurements were taken during the melting process of 316L steel powder across various layers of components fabricated at different laser power levels. For each laser power level from 150 W to 240 W in 15 W increments, datasets of sintering/melting temperatures were obtained, consisting of 90–100 matrices (each sized 480 × 640) during the creation of a single part layer. To eliminate outliers, Kalman filtering was applied to the measurement results. Each sintering/melting temperature measurement was repeated at least 20 times for each power level. Thus, considering that during the creation of a single layer, the evaluation of sintering/melting temperatures was based on the maximum melt temperature values extracted from arrays (sized 480 × 640) for each track (with the number of tracks varying from 90 to 100), a total of 1800 to 2000 temperature measurements were conducted for each power level with 20 repetitions.
The in situ temperature measurement results during the LPBF/M process indicate that the observed temperatures often far exceed the liquidus temperature due to several factors:
Optical artifacts and measurement noise: the infrared sensor detects radiation intensity, which does not always directly correspond to the actual temperature. Variations in material emissivity, spatter, fumes, vapor, and reflections from the chamber walls or previous layers can all affect the readings;
Localized overheating and energy concentration: the laser generates a highly concentrated energy input within a small melt pool. As a result, the temperature in this region can significantly surpass the melting point to ensure stable melting and proper spreading of the molten metal;
Melting and evaporation dynamics: at high laser power, localized evaporation may occur. If the sensor captures a region with intense evaporation, the measured temperature can be considerably overestimated.
The Kalman filter is widely used in science and engineering, particularly for tracking and monitoring the state of various processes. The parameters of the Kalman filtering algorithm are detailed in studies [
22,
23]. In this case, its key parameters include process noise
=
, which is determined based on the standard error of the mean temperature value and measurement noise
, which is defined based on the combined Type B uncertainty of the measuring equipment used.
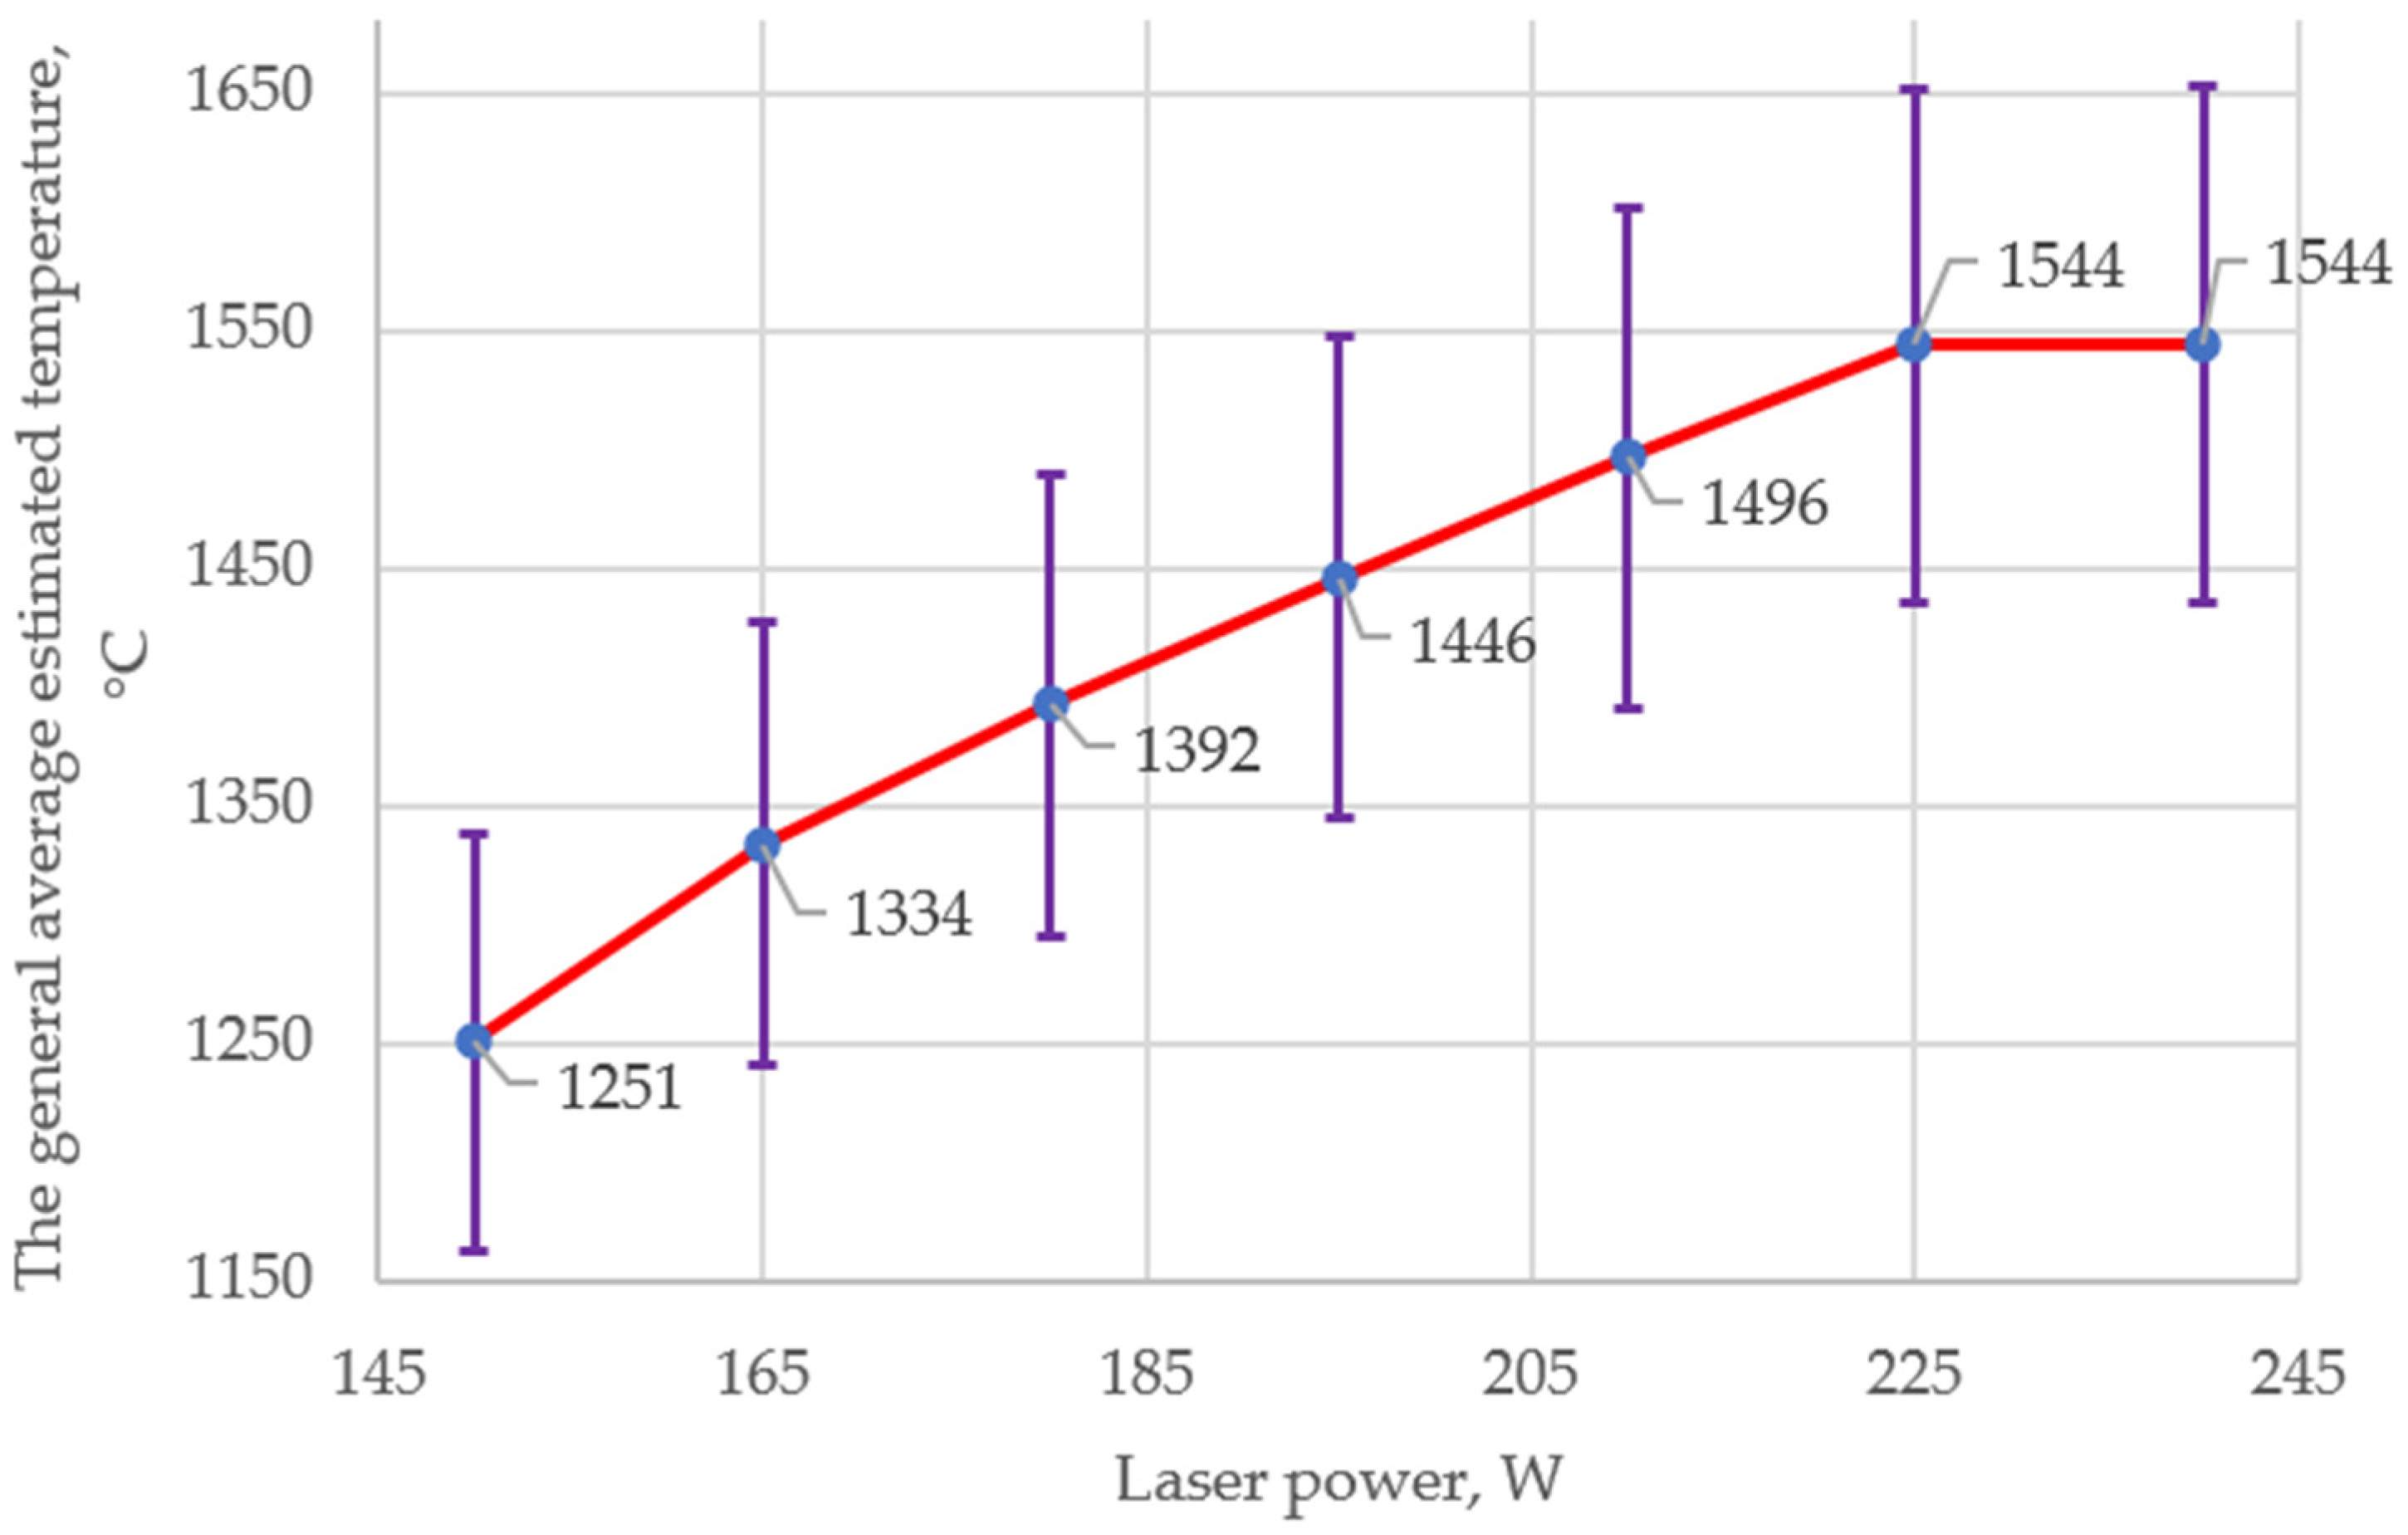
The experimental results provided estimated temperature values for each set of laser powers (
Figure 3). Furthermore, the relative expanded uncertainty of the temperature measurements was calculated at a 95% confidence level. This uncertainty was determined by combining Type A uncertainty (experimental measurement uncertainty of temperature) with Type B uncertainty, which included factors such as the IR camera’s uncertainty, the uncertainty in measuring the distance from the camera to the object, the uncertainty in ambient temperature, and the uncertainty in relative humidity. The combined relative expanded uncertainty was found to be 7% (
Figure 3).
It is well-established that the melting (liquidus) temperature of 316L steel powder can range from 1435 °C to 1449 °C [
18,
19,
20]. The melting temperatures of 316L steel powder at a laser power of 195 W (
Figure 3), estimated in our study, closely align with the findings of melting temperature studies conducted by other researchers [
24,
25,
26].
A three-level quality assessment system (“good”, “satisfactory”, “unsatisfactory”) is widely used for standardized evaluation of processes and outcomes, making it a common practice across various fields [
27]. S. Shevchik et al. [
28] proposed a three-level quality assessment system (high, medium, and poor) for real-time monitoring in the additive manufacturing process. The division into three levels allows for a clear classification of process quality (manufactured parts), facilitating precise control and early detection of defects or parameter deviations in production. The use of a three-level system enables rapid response to deviations in the process by taking necessary corrective actions and preventing the production of defective parts. This system simplifies the monitoring process, allowing for automatic classification of the production process state and ensuring reliable in situ quality control [
27,
28].
Based on the widely accepted three-level quality assessment system [
27,
28], we also proposed evaluating the quality of the laser melting process by dividing it into three levels: good/high (A), satisfactory (B), and unsatisfactory (C).
The threshold values for quality classification in the LPBF/M process were obtained empirically to ensure their applicability to the specific conditions of the laser melting process of 316L stainless steel powder under study. In this study, the quality classification criteria were established through extensive in situ temperature measurements and subsequent statistical analysis. The threshold values for quality levels were determined by analyzing the relationship between temperature variations using measurement uncertainty analysis and calculated tolerance intervals at different laser power levels, ensuring consistency with the experimentally observed stability of the LPBF/M process.
The good/high-quality level (A) for laser melting of 316L steel powder corresponds to a temperature range defined by an expanded temperature measurement uncertainty of
(the relative value of the expanded uncertainty of temperature measurement is
=
=
7%), calculated in relation to the estimated average temperatures at various laser power levels, from 150 W to 240 W (
Figure 3).
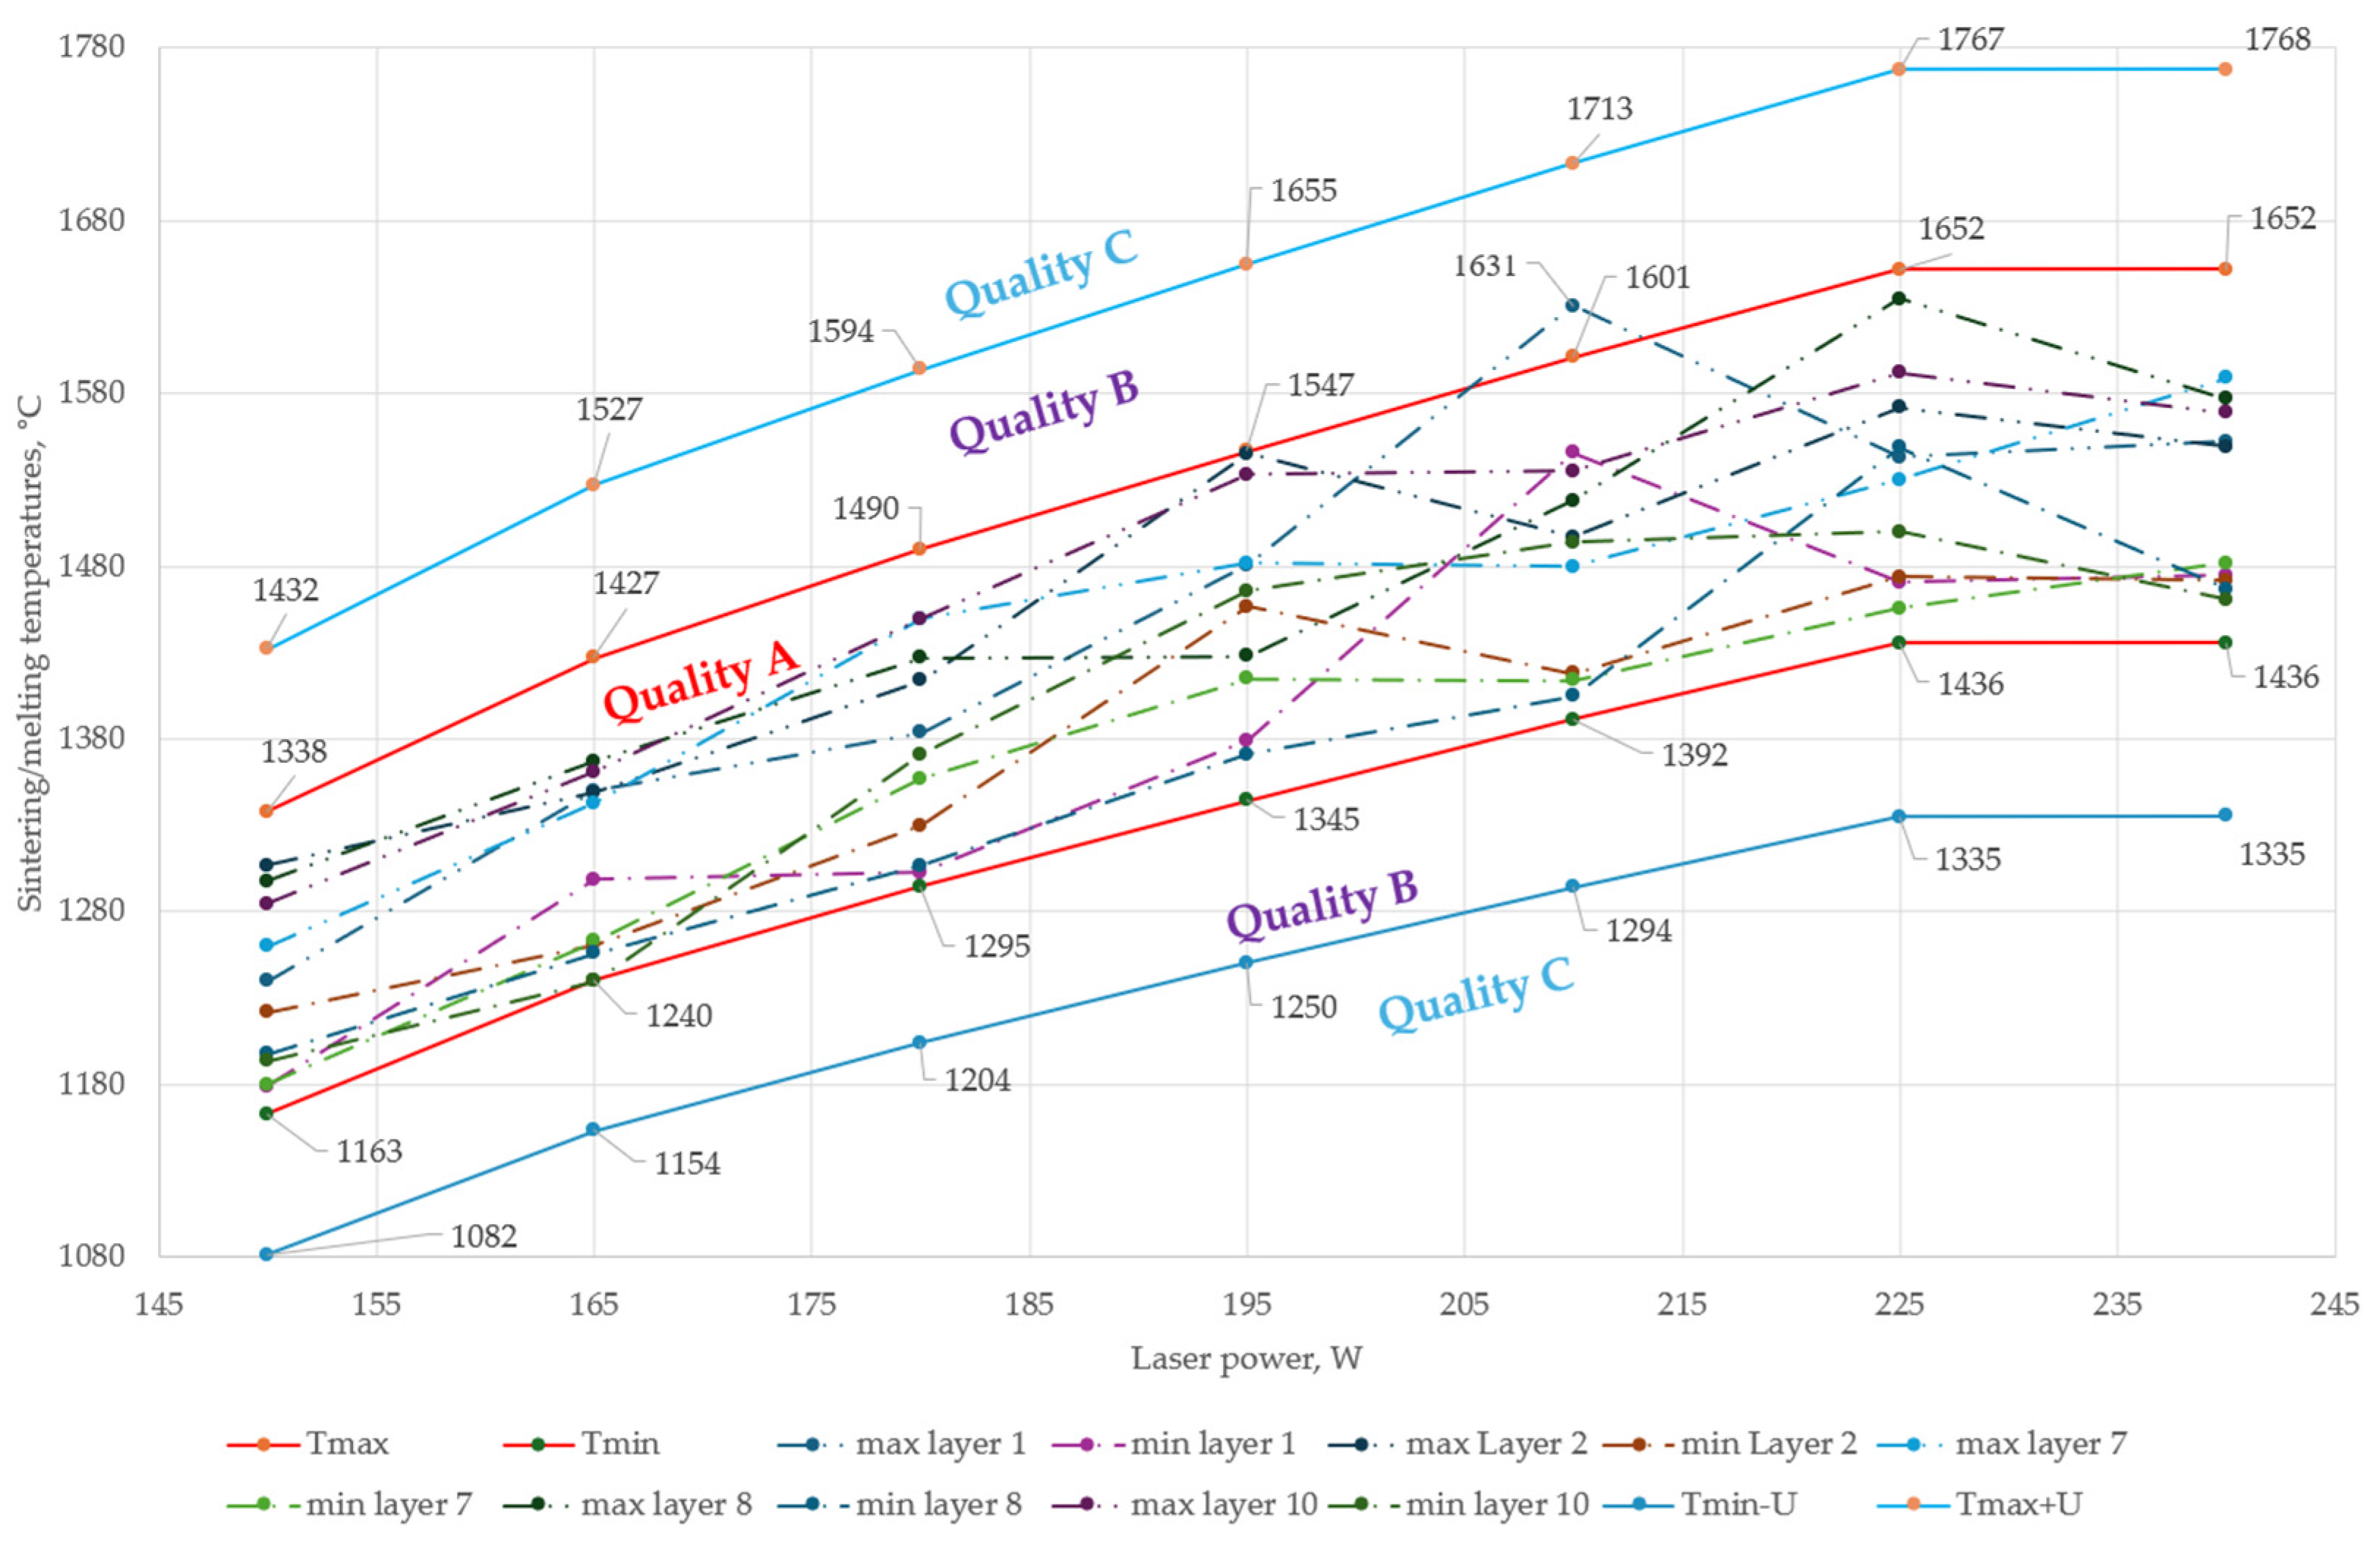
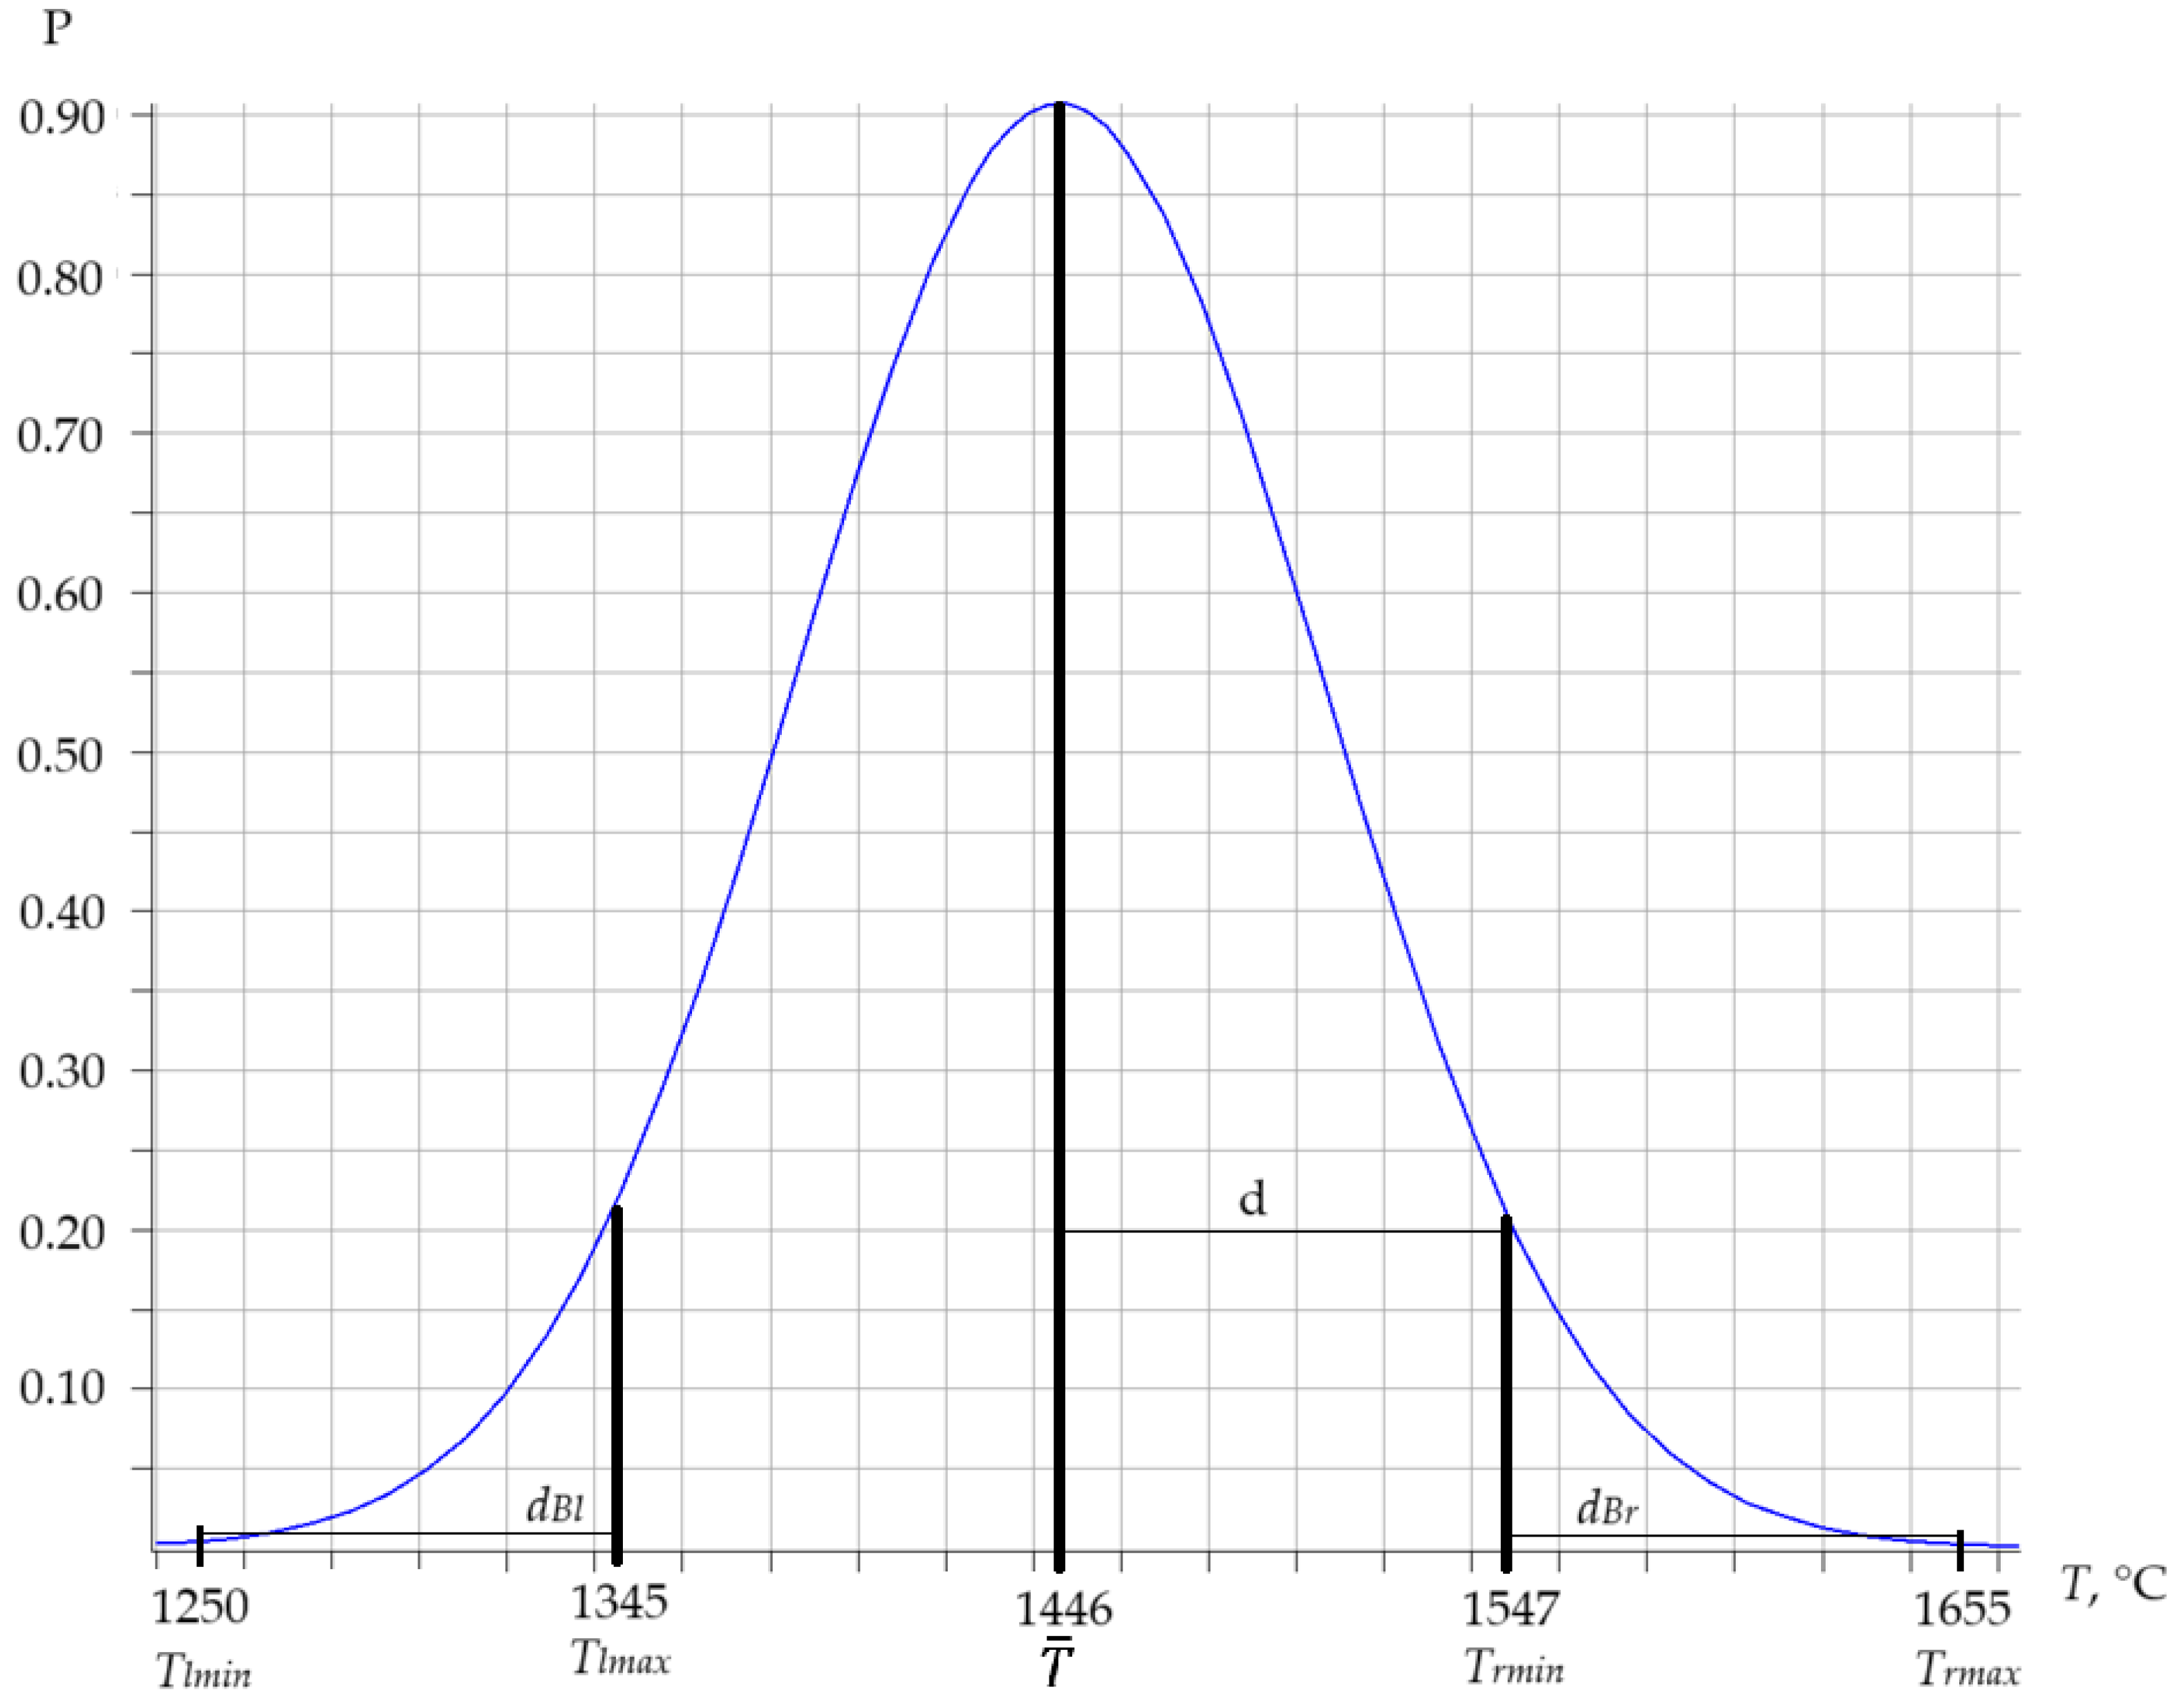
The satisfactory quality level (B) (
Figure 4) was defined based on a temperature range calculated using the relative expanded uncertainty applied to the lower (−7%) and upper (+7%) boundaries of quality level A. Specifically, this range includes an increase of 7% above the maximum allowable temperature T
max + U and a decrease of 7% below the minimum allowable temperature T
min − U at specified laser power levels. The unsatisfactory quality level (C) was assigned to cases where the sintering/melting temperatures exceeded the range defined by T
min − U and T
max + U (
Figure 4).
Figure 4 presents the research results on the maximum (dash-dot lines with two dots) and minimum (dash-dot lines with one dot) sintering/melting temperatures of 316L steel powder during the fabrication of 10 layers of the component.
To quantitatively evaluate quality indicators in the LP-BF/M process, a method is proposed for determining the probabilities that measured temperature values at various laser power levels fall within the predefined tolerance ranges for different quality levels. This approach relies on Type I and Type II errors and is explained in detail in the next section.
3. Methodology
A methodology for evaluating the quality control probability of the laser melting of metal powders involves utilizing mathematical models based on Type I and Type II errors (metrological risks) and tolerance intervals derived from expanded measurement uncertainty value. According to the literature [
9,
10,
29], Type I error (α) corresponds to a false positive result, while Type II error (β) indicates a false negative outcome. Given that the laser melting process is affected by multiple factors—such as the condition of the metal powder, humidity, ambient temperature, thermal diffusion, laser power, and scanning speed—it is reasonable to assume that the measured melting temperature values follow a normal (Gaussian) distribution. The assumption of a normal distribution for temperature values in the LPBF/M process is justified based on previous studies that have demonstrated the normality of thermal distributions in similar additive manufacturing conditions. Prior research [
30,
31] has shown that temperature variations in LPBF/M processes tend to follow a Gaussian distribution due to the combined effects of multiple independent factors, such as laser power fluctuations, thermal diffusion, and material properties. Type I error refers to the risk (probability) that the laser melting temperature falls outside the range identified for melting quality level A (good), even though it should fall within that range. The value of this risk (α) was determined using Equation (1) [
11,
12,
32]:
where
represents the mean value of the temperature of multiple measurement results (estimated value of temperature);
and
are the allowable lower (minimum) and upper (maximum) temperature range values, within which the quality of the laser melting process is classified as good/high (A);
T is the measured temperature value;
TN is the true temperature value;
d is tolerance field for the parameter [
33,
34,
35]:
is a compatible two-dimensional confidence level density [
32,
36]:
where
is the experimental Type A temperature measurement uncertainty
[
37,
38,
39,
40,
41];
is deviation from the true measurement result;
is the Type B combined uncertainty caused by the limited capabilities of the equipment, including the accuracy of the IR camera, the accuracy of the thermocouple when measuring the ambient temperature inside the EOSINT M280 system’s build chamber, the accuracy of the relative humidity measurement device, and the accuracy of the distance measurement device between the camera and the research object [
39,
40,
41,
42]:
where
is the type B humidity measurement uncertainty, assuming a normal distribution of the absolute error of the device (
= 1% RH);
is the measured value of relative humidity (RH) in the laboratory during the experiments, which was 22% RH;
is the atmosphere temperature inside the building chamber of the EOSINT M280 machine during the experiments, which was 33.5 °C;
is the type B atmosphere temperature measurement uncertainty, which is introduced by the thermocouple due to its absolute error of
± 1.1 °C, assuming a uniform distribution of the error;
is the distance from the IR camera to the objects of study, which was 0.28 m;
is the type B distance measurement uncertainty caused by a measurement error of
1 mm, which was calculated assuming a uniform distribution of the error;
represents the average value of the maximum melt pool temperature of the SS 316L powder within the laser power range of 150 W to 240 W, which was 1544 °C;
represents the measurement uncertainty of the temperature of type B caused by the relative error of the IR camera (δ = 2%) [
42].
By substituting the calculated values of Type B uncertainties into Equation (4), the value of the combined Type B uncertainty was obtained, which amounted to 3.44%. Considering the maximum estimated temperature value of
1544 °C and the relative combined Type B uncertainty of
3.44%, the maximum absolute value of the combined measurement uncertainty
of the melting temperature of 316L steel powder, caused by the limitations of the properties of the equipment used, was
. Taking into account the estimated values of the measured temperatures at different laser powers (
Figure 3), absolute values of combined uncertainties of type B were calculated considering the average values of the sintering/melting temperatures of 316L steel powder at each studied laser power (
Table 1).
Type II error refers to the risk (probability) that the laser sintering/melting temperature falls within the established range for good quality, but the quality is actually not good. The value of this risk (β) was calculated using Equation (5):
The probability (risk P
error) of falling outside the temperature range corresponding to good quality (A) was evaluated based on Type I (1) and Type II (5) errors using the Formula (6) [
11,
32]:
The probability of falling within the temperature range where the quality is classified as quality A (
Figure 4) is evaluated using Equation (7) [
32,
43]:
To assess the probability level of satisfactory quality (B) in the LPBF/M process, Type I (
and
) and Type II (
and
) errors were calculated based on the following expressions:
where
and
are the lower (minimum)
and upper (maximum)
temperature values of the lower (left
) range, where the quality of the laser melting process is classified as satisfactory (B);
and
are the lower (minimum)
and upper (maximum)
temperature values of the upper (right
) range, where the quality of the laser melting process is classified as satisfactory (B);
is the total tolerance interval of the lower (left) allowable range, including the lower interval
, where the quality was identified as satisfactory (B);
is total tolerance interval of the upper (right) allowable range, including the upper interval
, where the quality was identified as satisfactory B (
Figure 5).
The probability level of satisfactory quality (B) in the LPBF/M process (
Figure 4) is determined based on Equations (8)–(11) by the following formula:
By inputting the respective minimum and maximum temperature values at various laser power levels ranging from 150 W to 240 W (
Figure 4) into Equations (1), (5) and (8)–(11), the Type I and Type II errors associated with laser melting temperature control were calculated. Using these computed errors, the probabilities of achieving good (A) quality (7) and satisfactory (B) quality (12) in the 316L steel powder laser melting process were determined. The results of this study are presented in the next section.
4. Results
This study is devoted to the evaluation of quality parameters exclusively in the melting process of metal powder of steel 316L. Temperature, in this case, is the only parameter that can be measured and controlled in situ during the manufacturing process of the part. Other quality parameters, such as porosity, microstructure, and mechanical properties, can be determined only after the LPBF/M process is completed. And they are not considered in this work.
The probabilistic evaluation of quality indicators in the laser melting process relies on the quantitative assessment of both type A and type B measurement uncertainties [
37,
38,
39,
40,
41,
42]. To begin, temperature measurement uncertainties at various laser melting power levels were calculated after performing multiple temperature measurements of 316L steel powder melting and applying the Kalman filter to the recorded values. The calculated uncertainty values are provided in
Table 1. Using these uncertainty values (
Table 1) alongside the tolerance interval values (d), derived from the minimum and maximum temperature limits (
Figure 4) that define the good quality “A” classification for the 316L steel powder melting process at different power levels, type I (1) and type II (5) errors (risks) were then determined. The numerical results for these errors are shown in
Table 1. Finally, using the type I and type II errors, the probabilities (P) of the quality indicators classified as good “A” were calculated for the 316L steel powder melting process at various laser power levels using Formula (7). This step involves identifying the sintering/melting temperature that remains within the permissible expanded measurement uncertainty limits, ensuring that the quality remains in the good “A” category.
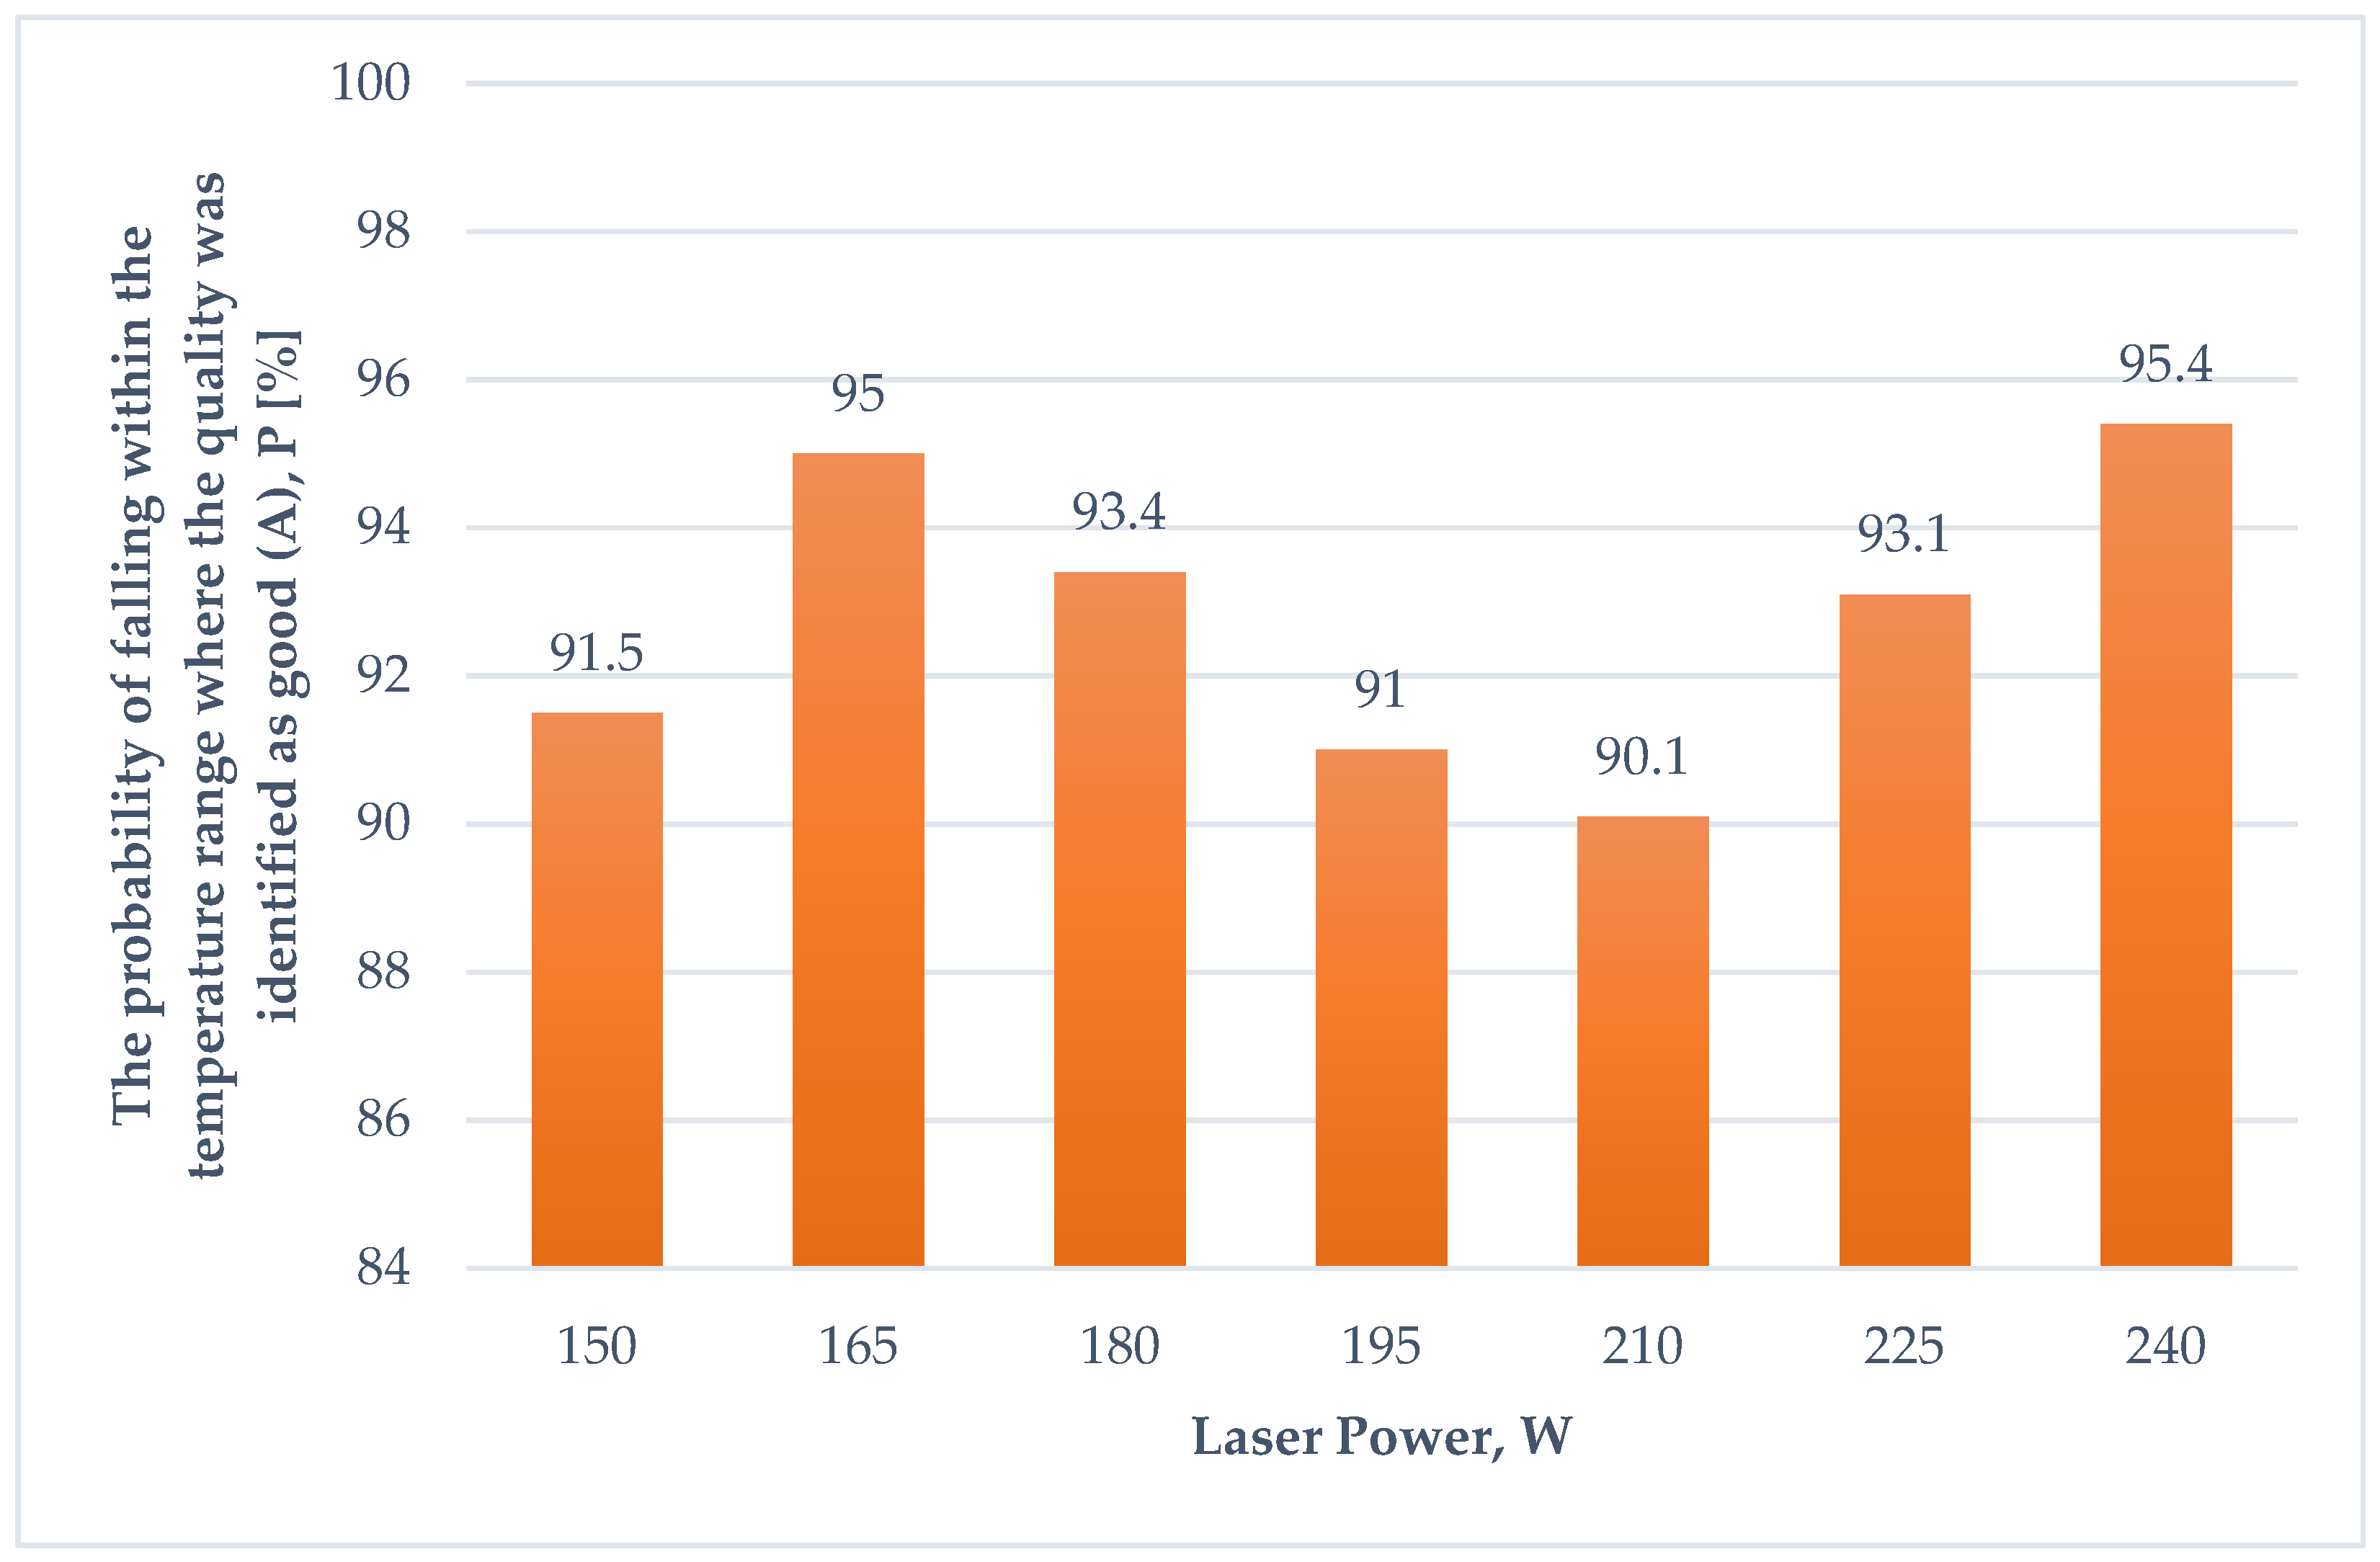
Therefore, by applying MATLAB R2023a software, the probabilities of good quality (A) indicators for the 316L steel powder laser melting process at various laser power levels, ranging from 150 W to 240 W, were determined. These probability values for good quality are shown in
Figure 6.
Using the same estimated type A and type B uncertainties (
Table 1) within the MATLAB environment, the Type I (8, 9) and Type II (10, 11) errors were calculated. Based on these, the probability values (12) for satisfactory quality (B) indicators of the 316L steel powder laser melting process were determined. In contrast to the probability values for quality indicator A, the probability values for indicator B are associated with two temperature tolerance intervals: the lower (left in
Figure 5) range, which is the minimum temperature value minus the expanded uncertainty (T
min − U,
Figure 4), and the upper (right in
Figure 5) range, which is the maximum temperature value plus the expanded uncertainty (T
max + U,
Figure 4). The total probability value for quality indicator B is derived from the sum of the probabilities of the lower and upper tolerance intervals. The results of these total probabilities for satisfactory quality indicator (B) of the 316L steel powder laser melting process are presented in
Table 2.
As seen from the calculated Type I and Type II errors and the probabilities of satisfactory quality (B) of the laser powder bed fusion process for 316L steel presented in
Table 2, most probabilities of satisfactory quality (B) have very low values at different laser power levels, except for a probability of 0.14% at a laser power of 210 W. This high probability of satisfactory quality at 210 W is due to the fact that during the experimental studies of the melting temperatures of 316L steel powder, the temperature values of the melt pool tracks exceeded the expected temperature range, meaning they were higher than the calculated tolerance interval (expanded measurement uncertainty), within which the quality of laser melting is classified as good (A). The obtained increased probability of satisfactory quality (B) at a laser power of 210 W correlates with the results of the experimental studies presented in
Figure 4. It can be seen from
Figure 4 that during the monitoring of the melting temperatures of 316L steel powder, temperature values were recorded that exceeded the expanded measurement uncertainty range, within which the quality is classified as good (A) and fell within the established temperature range where the quality is classified as satisfactory (B).
The confidence intervals for the probability values of the LPBF/M process quality indicators correspond to the confidence intervals used in the calculation of the expanded uncertainty of temperature measurements and are set at 95%.
Thus, the calculated values of Type I (False positive conclusion, α) and Type II (False Negative Conclusion, β) control errors, which are possible at good (A) quality of the laser powder bed fusion process for 316L steel powder, are presented in
Table 1. For the manufacturer-recommended laser power of 195 W in the EOSINT M280 system during the melting of 316L steel powder, the Type I control error (False Positive Conclusion) was 0.0894, and the Type II control error (False Negative Conclusion) was 9.46
10
−4, indicating low error values.
As illustrated in
Figure 6, the probability of attaining high-quality (A) results in the laser melting process at the manufacturer-recommended laser power of 195 W for the EOSINT M280 system reached 91%. Meanwhile, the overall probability of achieving satisfactory quality (B) for the 316L steel powder melting process was just 0.03% (
Table 2). These findings indicate that the process maintains a consistently high-quality level (A), suggesting a strong probability of manufacturing a final component with excellent quality. This probabilistic assessment of the laser melting process can be utilized as a key metric for evaluating the overall quality of the finished part.
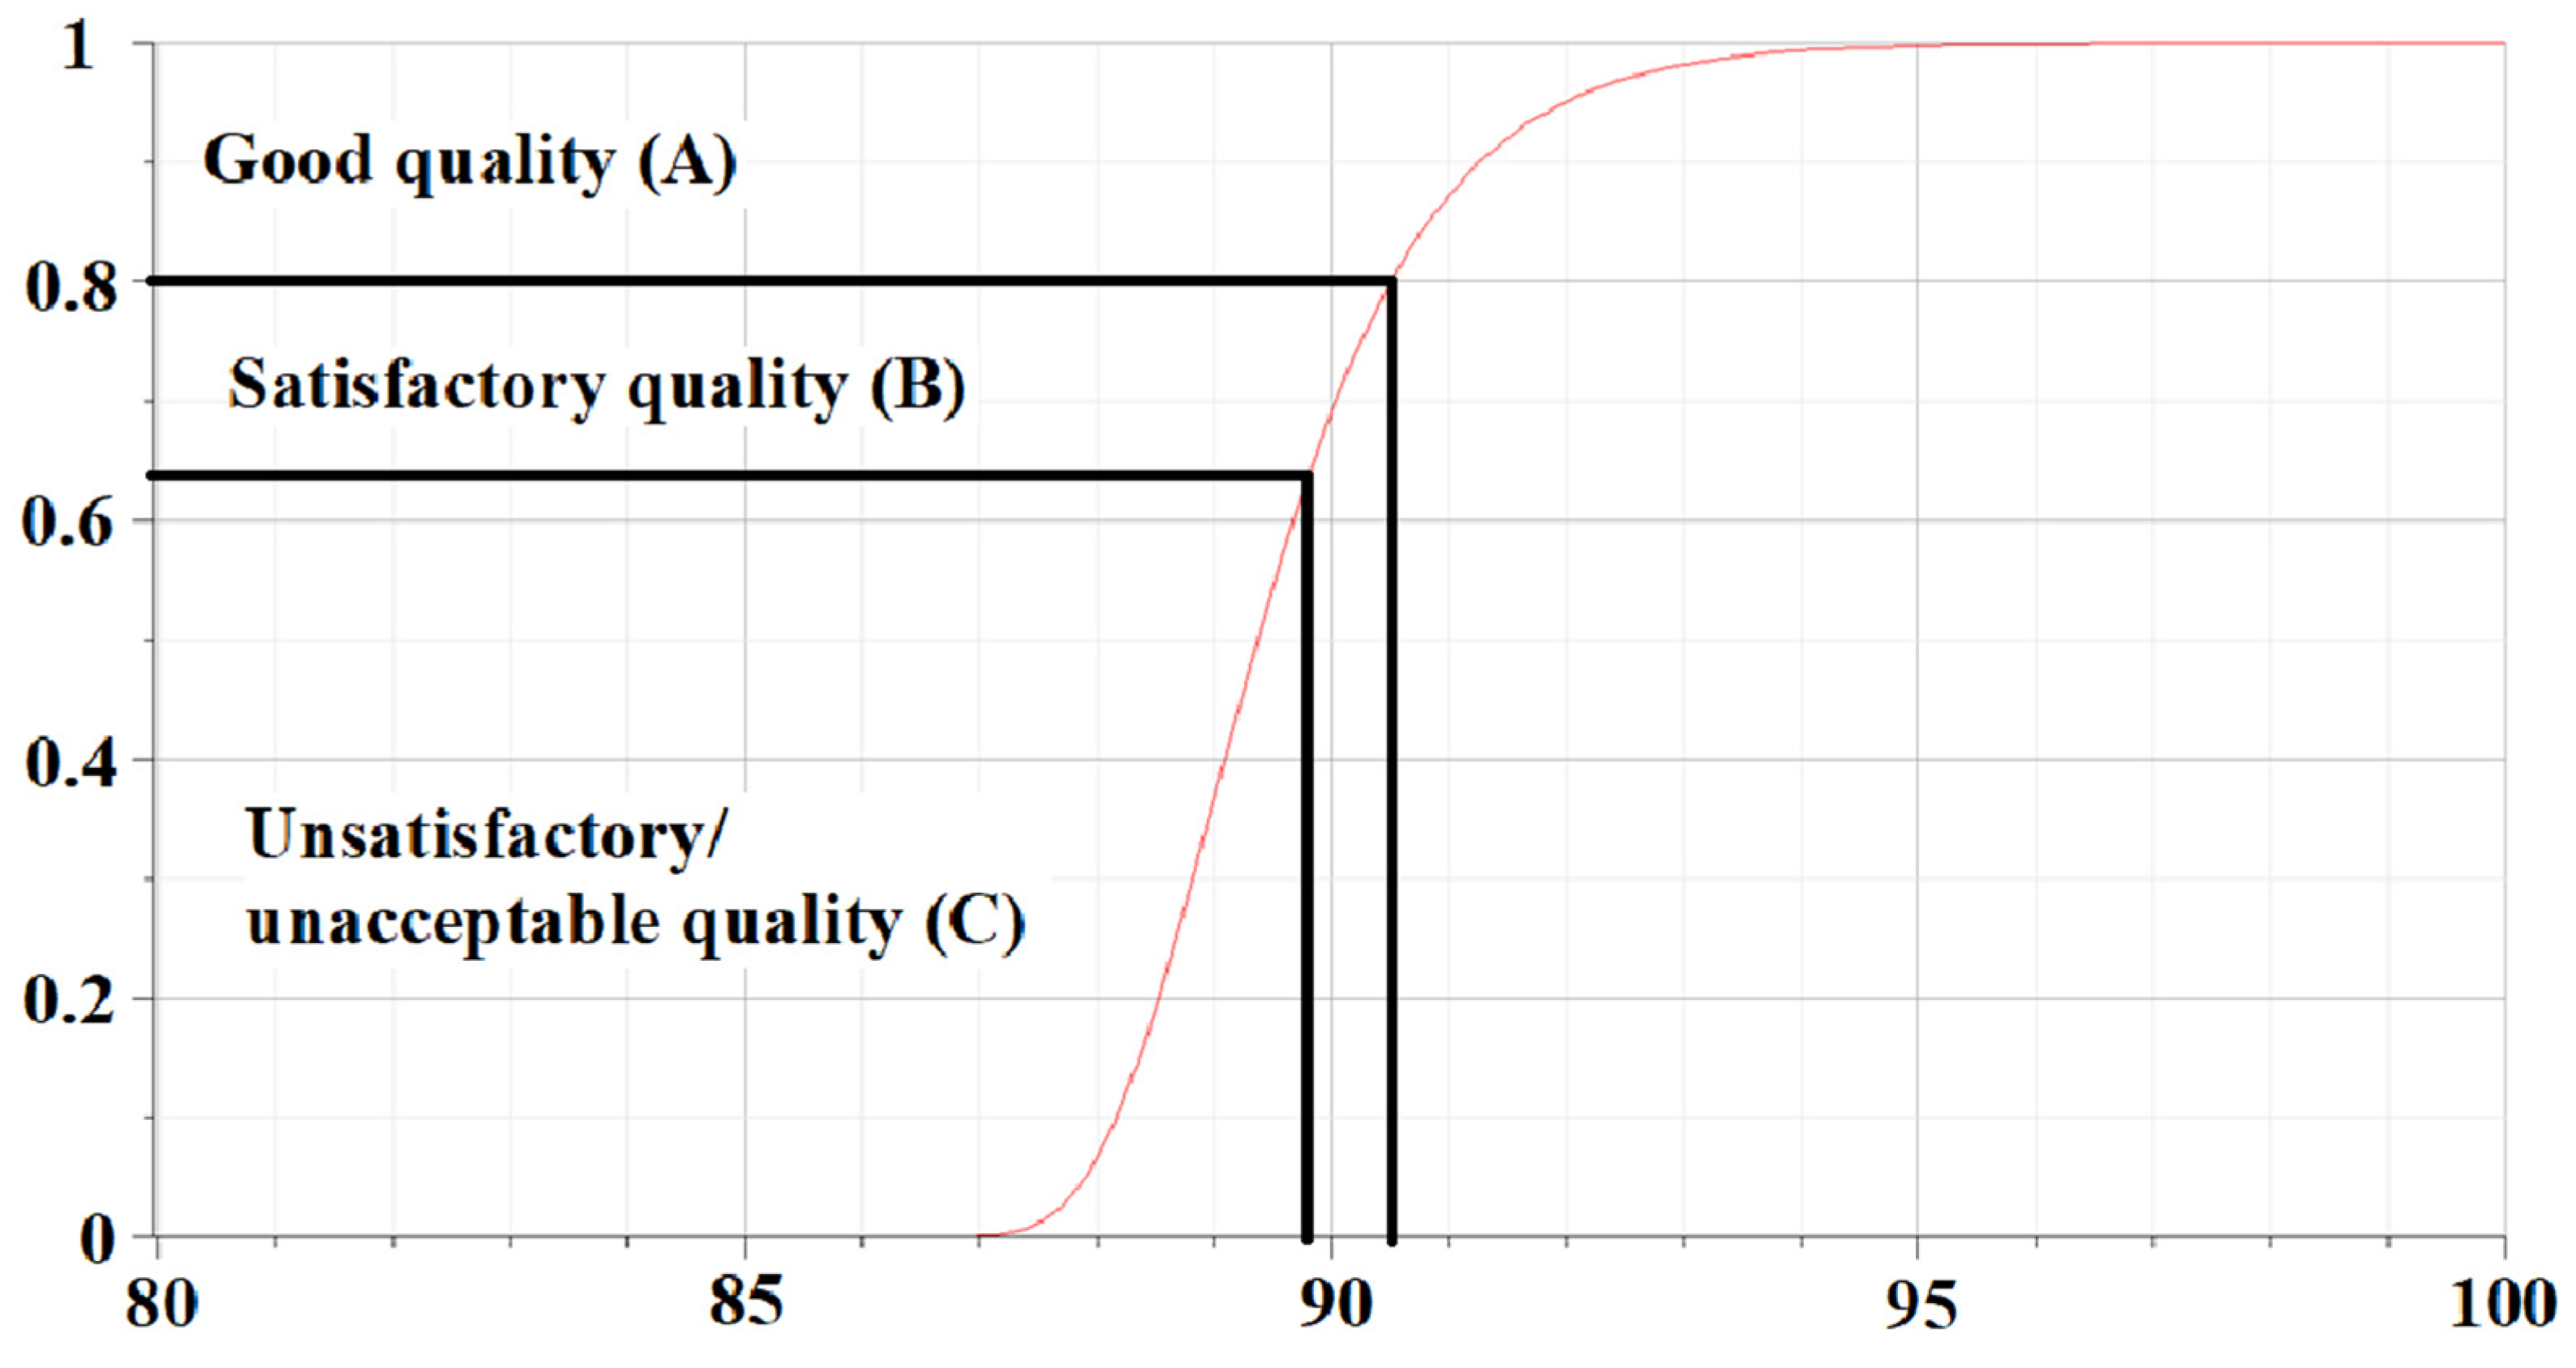
The Harrington function was proposed to evaluate the quality of the 316L steel powder laser melting process. This function converts the obtained probabilistic assessment results into a dimensionless scale from 0 to 1 and reflects the overall desirability of the results. For the criterion where a higher value is better, the following formula was used:
where
is the minimum acceptable value.
Since in the theory of product quality control, 90% is the lower limit of acceptable compliance with standards [
44,
45], then the threshold of
= 90% was adopted as the minimum probability value of the laser melting process at which the quality can still be classified as good (A).
Substituting this minimum probability value into Equation (13), we obtain the following characteristic of the change in Harrington’s desirability function (
Figure 7).
For the purposes of applying this in practice, the following boundaries are often considered [
46,
47,
48]:
D = 0.8 to 1 (good quality, A): a range within which the result is considered acceptable, close enough to the ideal target;
D = 0.63 to 0.8 (satisfactory quality, B): results falling within this range indicate the need for a decision (generation of a control signal) to improve the process quality and return to good quality;
D < 0.63 (unacceptable quality, C): these results are considered poor or unacceptable, significantly deviating from the ideal target.
This helps to convert complex multi-objective optimization problems into simpler single-objective models.
Based on the commonly accepted quality assessment criteria shown in
Figure 7, a good quality level (A) corresponds to a probability range of 90.5% to 100%, which translates to quality levels from 0.8 to 1 (0.8 ≤ D ≤ 1). A probability range from 89.78% to 90.49% corresponds to a satisfactory quality level (B), which is identified with a quality level in the range of 0.63 to 0.8 (0.63 ≤ D < 0.8). Probability values below 89.77% are classified as unsatisfactory/unacceptable quality (C), with a desirability level lower than 0.63 (D < 0.63).
By comparing the obtained probability assessment results for the melting temperatures falling within the permissible interval (
Figure 4), which is determined based on the expanded measurement uncertainty and where the laser melting process quality is classified as good (A), with the constructed desirability function for the laser melting process of 316L steel powder (
Figure 7), which represents quality indicators on a dimensionless scale, we observe that the direct laser melting process of 316L steel powder corresponds to a high-quality level (A), with a desirability value greater than 0.8.
5. Conclusions
This study presents a methodology for assessing the quality of the metal laser sintering/melting process using 316L steel powder, tested in the EOSINT M280 system across various laser power levels. The proposed methodology is based on temperature measurements of the LP-BF/M process using an IR camera, evaluating the uncertainty of temperature readings, and calculating the probabilities of temperatures falling within specified confidence intervals, utilizing Type I and Type II control errors.
The experimental results indicate that the average melting temperature of 316L steel powder was 1446 °C at a laser power of 195 W, with an expanded measurement uncertainty of 7%. Based on these results, a three-level quality indicator evaluation system was proposed, categorizing the process into good (A), satisfactory (B), and unsatisfactory (C) quality. The probability of achieving good quality (A) was 91% at 195 W laser power, while the probability of achieving satisfactory quality (B) was only 0.03%.
The findings underscore the reliability of the proposed methodology for in situ monitoring of the LP-BF/M process. The approach enables continuous evaluation of the melting temperature against established tolerance intervals, offering the possibility of adjusting the process parameters dynamically when temperatures exceed the acceptable range for good quality (A) and fall within the range for satisfactory quality (B).
The proposed methodology has direct industrial applications, as it provides an in situ quality assessment tool for LPBF/M systems. By integrating in situ temperature monitoring and measurement uncertainty analysis, manufacturers can improve the stability of the laser melting process, reduce defect rates resulting from failure to reach the metal’s melting point, and effectively control the quality of the LPBF/M process. This approach can be implemented in modern LPBF/M machines with in situ feedback control, enabling automatic parameter adjustments to maintain optimal process conditions. Additionally, the methodology can be incorporated into quality assurance protocols to enhance consistency and reliability in metal additive manufacturing, particularly in industries requiring high-precision components such as aerospace, medical implants, and automotive manufacturing.
Future research will focus on evaluating the post-process quality of fabricated parts at varying laser power levels, further contributing to the development of a comprehensive quality indicator for the overall production process. At the same time, it is planned to correlate the identified defects with the corresponding probability values of the quality indicators for the LPBF/M process.


