Article

Development of Machine Learning-Based Indicators for Predicting Comeback Victories Using the Bounty Mechanism in MOBA Games

Department of Applied Statistics, Gachon University, 1342 Seongnam-daero, Sujung-gu, Seongnam 13120, Republic of Korea
*
Author to whom correspondence should be addressed.
Electronics 2025, 14(7), 1445; https://doi.org/10.3390/electronics14071445
Submission received: 9 March 2025 / Revised: 29 March 2025 / Accepted: 2 April 2025 / Published: 3 April 2025

Abstract

:
Multiplayer Online Battle Arena (MOBA) games, exemplified by titles such as League of Legends and Dota 2, have attained global popularity and have been formally recognized as an official event in the 2022 Hangzhou Asian Games, thus establishing their significance in the esports industry. In this study, we proposed a machine learning-based model for predicting comeback victories by leveraging the object bounty mechanism, a critical yet underexplored aspect of previous research. By closely examining the game environment following the activation of the bounty system, we identified pivotal variables and constructed novel indicators that contribute to successful comebacks. Furthermore, an individualized case analysis based on SHapley Additive exPlanations (SHAP) provides new insights to support strategic in-game decision-making and enhance the player experience. The experimental results demonstrate that the indicators introduced in this study, such as the weighted team champion mastery and similarity in champion mastery among the team’s main champions, significantly influence the likelihood of a comeback victory. By capturing the intrinsic dynamism of MOBA games, the proposed model is expected to improve player engagement and satisfaction.

1. Introduction

The Multiplayer Online Battle Arena (MOBA) genre originated with the custom map “Aeon of Strife” in StarCraft and evolved through Defense of the Ancients (Dota) in Warcraft III, which established core gameplay elements such as champion selection, leveling, and turret destruction [1]. In Korea, the game Chaos, inspired by Dota, gained significant popularity and paved the way for commercial successes such as League of Legends (LoL).
Today, MOBA games such as LoL, Dota 2, and Arena of Valor enjoy global acclaim, with LoL featured as an official event in the 2022 Asian Games. A defining characteristic of MOBA games is the excitement surrounding comeback victories, in which teams overcome early disadvantages to secure wins, thereby delivering highly engaging gameplay.
LoL has emerged as one of the most popular esports titles, with its annual World Championship attracting increasing viewership, as illustrated in Figure 1. Despite the genre’s success, challenges remain in improving the player experience. Existing research on victory prediction primarily focuses on overall outcomes, often neglecting unique scenarios such as comeback victories. These scenarios, which are influenced by factors such as objective control, champion progression, and team synergy, are crucial for fostering player immersion.
While the significance of comeback victories is widely recognized in MOBA games, research on the psychological and team dynamic factors driving such scenarios remains limited. In contrast, traditional sports such as soccer and NBA have been extensively studied, with research indicating that psychological factors such as motivation, confidence, and resilience play a crucial role in achieving comeback victories [2,3,4]. While studies on esports have examined psychological factors and teamwork in match outcomes, they have largely overlooked their role in comeback victories [5,6,7,8,9]. Research utilizing NetEase’s MOBA game test version has employed visual analytics to examine the occurrence of snowballing and comebacks, identifying key events and variables [10]. However, there remains a gap in understanding how psychological factors and team dynamics influence comeback victories in LoL and other MOBA games.
In this study, a comeback victory is defined as follows: a victory is classified as a comeback if the team with the activated bounty system ultimately wins the match.
The bounty system in LoL is a mechanism designed to provide opportunities for disadvantaged teams to recover. This system awards additional gold when major objectives, such as turrets, dragons, or Baron Nashor, are secured, thereby offering the disadvantaged team a chance to regain momentum. Although the specific criteria for activation are not publicly disclosed, key game metrics such as gold difference, experience difference, turret destruction, and dragon kills are known to influence the activation of the bounty system. The bounty system provides an objective, system-defined measure of disadvantage, which allows the study to maintain a clear research focus and enhances the reliability of the analytical results.
In Figure 2, the horizontal axis represents the time at which the bounty system is activated (Objective Bounty Time), while the vertical axis indicates the remaining playtime after the activation (Playtime After Bounty). The figure reveals that the bounty system is frequently activated within the first 15 min of the game. Additionally, many matches conclude within 10 min after the bounty system is triggered. This pattern suggests that players tend to give up easily when they are in a losing position. This tendency is based on the belief that a comeback victory is unlikely. If players perceive the early game state as irreversibly disadvantageous, they may opt for an early surrender rather than attempt to utilize the bounty system for a comeback. This undermines the intended function of the bounty system, which is designed to provide opportunities for disadvantaged teams to regain momentum. As a result, players’ game time decreases, and their engagement diminishes. Therefore, it is necessary to enhance player interest by making comeback victories more feasible.
To address these challenges, this study aimed to: (1) define comeback victories, (2) explore their potential following bounty system activation, and (3) identify the key factors contributing to successful comebacks. By developing a prediction model that captures in-game dynamics, this study sought to mitigate the occurrence of early surrenders and promote strategic mid-to-late game play.

2. Background

2.1. League of Legends

MOBA games are strategic team-based games where two opposing teams compete to destroy the enemy’s main structure while defending their own. LoL is one of the most popular MOBA games, featuring a 5v5 match structure where each player controls a unique champion with distinct abilities. Victory is achieved by destroying the enemy Nexus located in the opposing team’s base.
Figure 3 depicts Summoner’s Rift, the primary map in LoL. It has a symmetric design, with each team’s Nexus positioned at the bottom-left and top-right corners. The map consists of three main lanes (Top, Mid, and Bottom), where players engage in combat while pushing towards the enemy base. Surrounding these lanes are jungle areas, which contain neutral monsters such as dragons and Baron Nashor, providing strategic advantages when secured.
Each of the three lanes typically accommodates a specific role: the Top lane usually features durable fighters or tanks, the Mid lane is occupied by high-damage mages or assassins, and the Bottom lane includes both an ADC (Attack Damage Carry) and a Support. The Jungle area is patrolled by a Jungler, who assists lanes and secures neutral objectives. Because each role demands different types of champions, players usually specialize in a certain lane and develop mastery in champions suited for that position. Each lane is also defended by turrets, which act as defensive structures that teams must destroy to advance towards the enemy Nexus.

2.1.1. Game Features

To systematically analyze the factors influencing comeback victories, game features are categorized into four key aspects: Resource, Combat, Objective, and Vision. These categories encapsulate different dimensions of gameplay, providing a structured way to interpret feature importance in predicting match outcomes.

Resource

Represents gold and experience accumulation, which are crucial for champion growth and team progression. Includes metrics such as Total Gold, Current Gold, XP, Turret, Inhibitor, Jungle Minion, and Minion, which reflect the overall economic state of a team.

Combat

Encompasses direct engagements between champions, including kills, assists, and champion mastery. Key variables include Champion Kill, Champion Assist, Jungle Pressure, Damage Type Ratio, Tank Role Count, WCM CV, Similarity, WCM Mean, and CM Top10, which indicate team fighting effectiveness.

Objective Monster

Covers major map objectives, which significantly impact a team’s advantage by providing buffs, gold, and strategic positioning. Includes features such as Baron Nashor, Rift Herald, and dragons, which provide significant buffs and advantages. The dragon category consists of Elder Dragon and elemental dragons, including Chemtech, Hextech, Ocean, Infernal, Mountain, and Cloud Drake.

Vision

Represents map control and information gathering, which are essential for making informed strategic decisions. Variables such as Ward Place, Control Ward Place, and Ward Kill quantify how well a team controls vision across the map.

2.1.2. Match Categories

LoL games can generally be categorized into professional matches and ranked solo queue matches, each exhibiting distinct characteristics in terms of strategy, player coordination, and objectives.
Professional matches are played by esports teams in competitive leagues and emphasize highly coordinated playstyles, with extensive use of macro-strategies and objective control. Players have fixed roles and rely on specialized strategies for champion selection, counterplay, and team synergy.
In contrast, ranked solo queue matches are played by individual players who are matched with and against others of similar skill levels. Unlike professional matches, team coordination is less structured, placing greater emphasis on individual skill and adaptability. Players progress up the ranked ladder, climbing from Iron to Challenger based on personal performance and win rates.
While professional matches focus on structured team coordination, ranked solo queue matches tend to be more dynamic and unpredictable, as players must adapt to different team compositions and playstyles. This distinction is critical, as this study focuses on comeback victories in solo queue matches, analyzing how game dynamics influence the likelihood of a comeback.

2.2. Related Works

Machine learning has been widely applied in various fields to enhance the efficiency of data analysis and prediction. For instance, in domains such as healthcare, finance, and sports, machine learning techniques have proven to be effective tools for solving complex problems and supporting decision-making processes [11,12,13,14,15,16,17]. Moreover, recent advancements in explainable artificial intelligence (XAI) have enabled interpretation of model predictions, providing meaningful insights beyond simple predictions [18,19,20]. Building on these advancements, machine learning has also been widely adopted for game data analysis [21,22]. Among them, research on MOBA games has continuously evolved, focusing on optimizing player experience and game strategies. Studies in this field can be broadly categorized into three main areas:
  • Victory Prediction [23,24,25,26,27,28,29,30,31]: Studies in this area aim to enhance strategic planning and team coordination during gameplay.
  • Champion Recommendation [32,33,34,35]: This type of research focuses on improving the player experience by aligning recommendations with player preferences and current meta trends.
  • Psychological Research and Player Behavior Analysis [36]: Studies in this field contribute to increased immersion and long-term engagement by understanding player motivations and behaviors.
Most studies predominantly focus on the first topic, victory prediction, and are summarized in Table 1. The abbreviations for the models listed in Table 1 are provided in Table 2. As illustrated in Table 1, victory prediction studies in MOBA games can be categorized based on the type of data analyzed and the time point of the analysis. The data are typically divided into professional match data and solo ranked match data, whereas the timing of the analysis is classified according to the use of post-game data, pre-game data, or specific in-game time points. According to the time points analyzed, the studies exhibit the following characteristics:
First, studies utilizing post-game data focus on information collected after match completion, such as the total number of champion kills, gold differences, and objective captures. These studies aim to analyze match outcomes based on comprehensive data and quantitatively evaluate the effects of specific variables on the outcome of the match.
Second, studies employing pre-game data utilize the information available before a match begins, including team composition, player champion mastery, and records of picks and bans during the draft phase. These approaches explore the potential of predicting match outcomes based on pre-match information, with a particular emphasis on supporting strategic decision-making in high-level competitions such as professional leagues.
Third, studies that predict outcomes based on in-game data at specific time points examine key variables collected during different stages of a match, such as the early, mid, and late game. These studies contribute to improving strategic adaptation and enhancing our understanding of match dynamics.
While previous studies have mainly focused on overall match outcomes, comeback scenarios remain underexplored. This study addressed that gap by analyzing post-bounty activation data to identify key factors influencing comeback victories.

3. Methodology

3.1. Data Collection

This study utilized the data collection framework outlined in Figure 4. Data were collected using the Riot Games API [37], which includes the Champion Mastery API, Match Detail API, and Timeline API, through Python (version 3.9) scripts. The collected data were stored in JSON format on a local PC. Key variables were then extracted and organized into a DataFrame, which was subsequently stored in a MySQL (version 8.0) database for efficient querying and analysis.
A Crontab-based system was implemented to automate data collection. This system was designed to be executed periodically to ensure that the dataset was continuously updated. After the data were stored in the MySQL database, DBeaver (version 24.0.3) was used to query and join the Match ID, Champion Mastery, Timeline, and Details tables, resulting in an integrated dataset necessary for comprehensive analysis.
Data were collected from the Korean server over a two-week period, from 11 September to 24 September 2024. Initially, 855,858 Match IDs were obtained. A tier-based sampling strategy was implemented to ensure the validity and representativeness of the study. For the Challenger and Grandmaster tiers, data from the 10 most recent matches of each player were collected. For tiers ranging from Iron to Master, 12,000 players per tier were randomly sampled, and one match per player was collected. This approach ensured balanced data representation across tiers, which is critical for a robust analysis.
Following the initial data collection, additional preprocessing was performed. In instances where the same Match ID appeared in multiple tiers, data from higher tiers, such as Challenger or Grandmaster, were prioritized, while duplicates from lower tiers were removed. To maintain consistency in the analysis, only solo-ranked matches were included. After these preprocessing steps, the final dataset comprised 24,985 Match IDs.
The dataset was collected using Patch 14.18, the official patch version for the 2024 League of Legends World Championship, which garnered significant attention. Considering the frequent meta changes and short patch cycles in LoL, maintaining a consistent patch environment is critical for reliable data analysis. Therefore, the dataset was aligned with the official patch version to ensure consistency and enhance the credibility of the results.

3.2. Data Preprocessing

In this study, we constructed a dataset that reflected the relative differences between teams from the activation of the bounty system until the end of the game. Of the 24,985 collected data points, only 20,686 instances in which the objective bounty system was activated were included in the analysis. This selection was designed in alignment with the study’s focus on analyzing comeback victories, excluding data that were irrelevant to the research objectives.
To address class imbalance, the dataset was divided into training and test sets using stratified sampling at an 8:2 ratio. This approach ensured that the proportion of comeback victories remained consistent across both datasets, thereby ensuring the robustness of the model evaluation. Additionally, the training data were further split using 3-fold cross-validation for hyperparameter optimization, allowing for a more reliable assessment of the model’s performance.
During the preprocessing stage, min–max scaling was applied to normalize variables within a range of 0 to 1 for all models, except for tree-based models, which do not require normalization. The key details of the dataset are presented in Table 3.

3.3. Proposed Indicators and Definitions

To further investigate comeback victories, we developed a prediction model for MOBA games by leveraging various metrics that reflect resource management and team dynamics. The dataset was constructed based on cumulative metrics from the activation of the bounty system to the end of the game, focusing on the relative differences between the two teams. This approach quantified key metrics such as differences in champion kills, minion counts, and inhibitor destructions, enabling an analysis of how these metrics influence the likelihood of a comeback victory.
The relative changes in these metrics during the bounty system period are crucial for understanding the flow of the game, as the bounty system provides an objective criterion for assessing disadvantages. Furthermore, this study proposed the following novel indicators to explore the potential for comeback victories in MOBA games, extending beyond the variables commonly used in previous research [28,32].

3.3.1. Weighted Champion Mastery (WCM)

The Weighted Champion Mastery (WCM) metric was designed to assess the overall mastery level of a team and the consistency of mastery among its members by utilizing individual champion mastery data. This metric incorporates time decay and grade weights to calculate team-level averages and the coefficient of variation.
To calculate the WCM, the individual mastery score of each team member is first determined. Subsequently, log transformation and min–max normalization are applied to mitigate the impact of outliers and adjust the data scale, ensuring that the scores are comparable across different champions and players. The final WCM metric represents the aggregated team mastery level, reflecting both the average proficiency of the team’s members with their champions and the consistency of mastery among its members.

Calculation of Weighted Champion Mastery

W C M i = C P i T W i G W i
C P i : Champion Mastery of player i for the given champion
T W i : Time decay weight of player i for the given champion
G W i : Grade weight of player i for the given champion
T W = 1.0 , Elapsed   time 7 days 0.8 , 7 days < Elapsed   time 14 days 0.6 , 14 days < Elapsed   time 30 days 0.5 , 30 days < Elapsed   time 90 days 0.4 , 90 days > Elapsed   time
Time decay is defined based on the time elapsed between the last game played with a specific champion and the current match.
G W = 0.95 , S + 0.92 , S 0.90 , S 0.85 , A + 0.50 , D 0.70 , o t h e r w i s e
Grade weight is determined by the performance grade recently achieved by the player for a specific champion. If multiple grades are available, the weights are averaged to calculate the final grade weight.

Team-Level Relative Differences

Team Average Mastery: Although the bounty-activated team is currently at a disadvantage, a higher average champion mastery compared to the opposing team may reflect greater player experience or competence. This suggests that champion mastery can positively influence the likelihood of a comeback, even if the team is temporarily behind.
WCM   Mean = W C M i N , N : Number   of   team   members
Δ WCM   Mean = WCM   Mean Bounty   Active WCM Mean Bounty   Inactive
Team Mastery Coefficient of Variation (CV): A lower coefficient of variation in mastery scores within the bounty-activated team, relative to the opposing team, suggests more consistent experience levels across players. This stability in team composition may enhance coordination and strategic execution, thereby increasing the potential for overcoming a disadvantageous situation.
WCM   CV = σ W C M i μ W C M i   ,
σ :   standard   deviation ,   μ :   mean
Δ WCM   CV = WCM CV Bounty   Active WCM CV Bounty   Inactive

3.3.2. Similarity Based on Key Champion Mastery

The similarity metric based on key champion mastery assesses the similarity among the top 10 champion mastery vectors of team members. This metric was designed to evaluate potential disadvantages arising from team composition and matching quality. In LoL, each role (e.g., top, jungle, mid, ADC, support) typically requires different types of champions. Therefore, if multiple players have high mastery of similar champion types, it may indicate role overlap and suboptimal team matching.
A higher similarity within a team, indicated by an increased cosine similarity score, suggests that the champion mastery levels of the team members are more similar. This lack of diversity in champion mastery may limit the team’s strategic options and adaptability, especially if players are assigned to roles that do not align well with their top champions. Such scenarios can hinder overall team performance and increase the likelihood of early disadvantages.

Calculation of Team Member Similarity

Team   Similarity   = i = 1 N 1 j = i + 1 N cos v I , v j n 2
cos v i , v j = v i v j | | v i | |   | | v j | |
v i , v j : Top 10 champion mastery vectors of two players on the same team
N: Number of team members
N 2 Number of all player combinations in the team
cos v i , v j : Cos ine   similarity   between   two   vectors

Team-Level Relative Differences

Δ Similarity = Team   Similarity Bounty   Active Team   Similarity Bounty   Inactive
Specifically, if the bounty-activated team exhibits lower similarity in champion mastery than the opposing team, this may suggest that a more diverse team composition contributes to a greater ability to recover from disadvantageous situations.

3.3.3. Top Mastery Selection Rate (CM Top10)

The Top Mastery Selection Rate quantifies the contribution of skilled players within a team by measuring the frequency with which team members select champions from their top 10 most mastered champions. This metric indicates how often team members choose their most practiced champions in a specific match, thus providing valuable insights into the team’s reliance on individual expertise.

Calculation of Top Mastery Selection Rate

CM   Top 10 = X N
N: Number of team members
X : Number of players who selected a mastered champion on the team

Team-Level Relative Differences

Δ CM   Top 10 = CM   Top 10 Bounty   Active CM   Top 10 Bounty   Inactive
A higher Top Mastery Selection Rate in the bounty-activated team, despite their current disadvantage, may indicate that selecting highly mastered champions contributes to the team’s potential to recover and achieve a comeback.

3.3.4. Jungle Pressure

Jungle Pressure quantifies the level of pressure exerted by a jungle player on the opposing team by measuring the frequency of incursions into the enemy jungle. This metric is calculated by aggregating the number of times the jungle player is located in the enemy jungle, using position data recorded at one-minute intervals from the game logs.
A higher Jungle Pressure index for the jungle player from the bounty-activated team indicates increased activity in the enemy jungle, reflecting a greater degree of pressure applied to the opposing team. This heightened presence can disrupt the enemy’s farming, limit their strategic options, and create opportunities for the bounty-activated team to secure objectives, thereby influencing the overall dynamics of the match.

3.4. Feature Selection

To visually assess the relationships between the variables in the dataset, we designed a correlation heatmap, as illustrated in Figure 5. Simultaneously, a variable selection process utilizing the Variance Inflation Factor (VIF) was conducted to ensure data reliability and mitigate multicollinearity. This selection process was based on both statistical evidence and domain knowledge, following the steps outlined below.
First, VIF analysis was performed to identify multicollinearity among the variables. A VIF value exceeding 10 is generally considered to indicate severe multicollinearity [38]. In this study, variables with high VIF values were identified, and their relationships were visually evaluated using the correlation heatmap shown in Figure 5. This assessment allowed for a better understanding of how multicollinearity among variables affected model stability and interpretability, thereby aiding in decisions regarding variable removal. Table 4 presents the top 10 variables ranked by VIF.
Previous studies, such as [29,30], identified champion experience (XP), turret destruction, and gold as critical factors for predicting victory, leveraging their strong correlations to enhance model predictions. However, in this study, VIF analysis, excluding the response variable, revealed significant multicollinearity issues: gold (15.9175), XP (13.6273), and turret destruction (6.1828).
The primary objective of this study is to address the question “What causes a comeback victory?” Upon evaluation, the XP, turret destruction, and gold variables were determined to reflect cumulative game outcomes rather than specific team behaviors or strategies, rendering them less relevant to the study’s objective. Consequently, these variables were excluded from the dataset to focus on the core causes of comeback victories, ensure model stability, and create a dataset more aligned with the research goals.
Table 5 displays the top 10 variables ranked by VIF after the variable selection process. Following the removal of XP, turret destruction, and gold, the VIF value for champion kills decreased from 7.0370 to 5.2940, alleviating concerns regarding multicollinearity. As a result, champion kills were retained as a variable in the analysis. The final dataset comprised 25 variables, with champion kills identified as a key variable that is directly related to comeback victories and critical for explaining their underlying causes. This variable selection process significantly enhanced the reliability of the analysis and improved model interpretability.
By removing variables with high multicollinearity, model stability was ensured, and irrelevant outcome indicators were excluded based on domain knowledge, further strengthening the validity of the study. Table 6 outlines the final selection of one response variable and 24 explanatory variables. Each variable represents metrics calculated for each team based on the differences between teams with and without activated bounties. This configuration, which uses the differences between opposing teams’ features, was designed to align with the research objective of identifying the primary causes of comeback victories, while also following precedents in prior studies to reduce model complexity and improve analytical clarity [30].

3.5. Prediction Model

To construct our prediction model, we selected seven machine learning algorithms commonly used in prior research on victory prediction [23,24,25,26,27,28,29,30,31]. Given the complexity and nonlinear nature of factors involved in comeback victories in MOBA games, this diverse set of models was chosen to effectively capture such relationships. These models also serve as base learners for potential ensemble modeling in subsequent analysis. The following sub-sections describe each algorithm and its mathematical formulation.

3.5.1. Logistic Regression

Logistic regression is a supervised learning model designed to solve binary classification problems by applying a sigmoid activation function to a linear regression model [39]. It assumes a linear relationship between the input and output data, which enhances interpretability. Additionally, it employs a loss function with L2 regularization to mitigate overfitting. The predicted probability p is given by the following:
p y = 1 x = 1 1 + e w T x + b
x : feature vector
w : weight vector
b : bias term

3.5.2. Support Vector Machine (SVM)

SVM is a supervised learning model that classifies data by identifying a hyperplane that maximizes the margin between classes [40]. The decision function is:
f x = w T x + b
x : feature vector
w : weight vector
b : bias term
To handle nonlinear relationships, the radial basis function (RBF) kernel is applied, enabling the model to map data into a higher-dimensional space using the kernel trick. The RBF kernel function is defined as:
K x i , x j = exp γ x i x j 2
γ : hyperparameter that controls the influence of training examples

3.5.3. Tree-Based Models

Tree-based models are a type of ensemble learning algorithm that enhance predictive performance by combining multiple decision trees. Each model has distinct characteristics in terms of training strategy, data handling, and regularization, which are outlined below. While some models are presented with mathematical formulations to clarify key mechanisms, others are described through their algorithmic strategies.
Random Forest utilizes the bagging method, where multiple decision trees are trained on different bootstrap samples and combined through majority voting (i.e., hard voting). By introducing random feature selection, it enhances model diversity and reduces overfitting, making it robust and easy to interpret [41]. The final predicted class y ^ is determined by hard voting across all trees:
y ^ = mode h 1 x , h 2 x , , h T x
h t x : prediction of the t -th decision tree
T : total number of trees in the ensemble
XGBoost (Extreme Gradient Boosting) is a boosting model that sequentially improves performance by correcting errors from previous models. It incorporates regularization and supports parallel processing, which contributes to both accuracy and computational efficiency [42]. The predicted value y i ^ for an input x i is calculated as the sum of the outputs from all K trees:
y i ^ = k = 1 K f k x i , f k F
F : space of decision trees
f k : function learned at the k -th boosting iteration
The objective function minimized during training is defined as:
L = i = 1 n l y i , y i ^ + k = 1 K Ω f k ,   Ω f = γ T + 1 2 λ | w | 2
l y i , y i ^ : differentiable loss function
Ω f k : regularization term
T : number of leaves in a tree
w : vector of leaf weights
γ : penalty for adding a leaf node
λ : controls the L2 regularization strength
CatBoost (Categorical Boosting) is optimized for categorical variables through permutation-based transformations, reducing overfitting while maintaining fast training times [43]. For a given categorical feature, x , the target statistic for the i -th sample is computed as:
TS i = j < i 𝟙 x j = x i y j + a p j < i 𝟙 x j = x i + a
𝟙 x j = x i : indicator function that returns 1 if x j = x i
y j : target value of the j -th sample
a : regularization parameter controlling the strength of the prior
p : prior (e.g., global mean of the target variable)
LightGBM (Light Gradient Boosting Machine) adopts a leaf-wise tree growth strategy, offering superior training speed and memory efficiency, particularly well-suited for handling large-scale datasets [44].

3.5.4. Multi-Layer Perceptron (MLP)

MLP is a neural network model capable of learning nonlinear relationships between input and output data based on their hierarchical structure [45]. In this study, three baseline MLP models were designed, featuring one, two, and three hidden layers. Each hidden layer employed the rectified linear unit (ReLU) activation function, whereas the output layer utilized the sigmoid activation function to solve the binary classification problem. Forward propagation is:
a l + 1 = f W l a l + b l ,   f x = max 0 , x
W l : weight matrix
b l : bias vector
f : ReLU activation function
To enhance training stability, He initialization, which is compatible with the ReLU activation function, was used for weight initialization [46]. Additionally, the Adam optimizer, which is known for its computational efficiency and adaptive learning rate adjustments, was adopted for optimization [47].

3.6. Evaluation Metrics

The dataset used in this study presents a class imbalance issue, as comeback victories are relatively rare. To address this challenge, we selected precision, recall, and F1 score as the primary evaluation metrics, rather than relying solely on accuracy, which may overestimate the performance in imbalanced datasets.
Accuracy measures the proportion of correct predictions across the entire dataset; however, it may not accurately reflect model performance when class imbalance exists.
Accuracy = T P + T N T P + T N + F P + F N
Precision evaluates the reliability of positive predictions by focusing on minimizing the number of false positives. This metric is crucial for ensuring that strategic recommendations in gameplay do not lead to misleading outcomes.
Precision = T P T P + F P
Recall assesses the proportion of true positives that are correctly identified, thereby minimizing the number of false negatives. This metric is vital for effectively detecting comeback scenarios, which is a key focus of this study.
Recall = T P T P + F N
The F1 score provides a balanced evaluation by using the harmonic mean of precision and recall. This makes it particularly suitable for assessing overall model performance in this research.
F 1   s c o r e = 2 × Precision × Recall Precision + Recall
These metrics were deliberately chosen to ensure a comprehensive evaluation of the model’s ability to accurately identify and interpret comeback scenarios in MOBA games, thereby enhancing the relevance and applicability of the findings.

4. Results

4.1. Model Performance Evaluation

The results of the model comparison conducted in this study are presented in Table 7. Various machine learning algorithms were applied to develop models for predicting comeback victories, with the F1 score designated as the primary performance metric and recall designated as a secondary metric. This dual focus ensures effective identification of comeback scenarios while balancing precision and recall. To ensure reproducibility, each model experiment was repeated 30 times, and the average performance was measured. Based on the performance metrics shown in Table 7, three models—SVM, XGBoost, and MLP—were selected for further analysis. These models exhibited strong recall and F1 score values, aligning well with the study’s objective of accurately identifying comeback victories.
The SVM model achieved the highest recall of 0.9621, indicating that it effectively minimized false negatives (FNs) in comeback prediction scenarios. By leveraging the RBF kernel, the model could effectively learn nonlinear decision boundaries and capture complex patterns in the data. This capability makes the SVM a suitable choice for problems requiring high sensitivity, aligning well with the primary objective of this study.
The XGBoost model demonstrated balanced performance, achieving a recall of 0.9394 and an F1 score of 0.9254. As a tree-based ensemble model using the Gradient Boosting algorithm, XGBoost effectively captured complex nonlinear relationships in the data. Further performance improvements can be achieved through hyperparameter tuning, making it useful for identifying critical patterns in comeback prediction.
The MLP model with architectures of (64, 32) achieved the highest F1 score of 0.9367, reflecting well-balanced performance between recall and precision. The MLP is optimized for learning intricate data patterns, and its performance can be further enhanced by exploring various architectures and hyperparameter tuning.
The results of the hyperparameter optimization for each model, along with the ensemble model performance, are summarized in Table 8. In addition to evaluating individual models, an ensemble approach was employed to further improve predictive performance. The details of the optimization process, including search strategies and selected hyperparameters, can be found in Appendix B (Table A2, Table A3 and Table A4).
An ensemble model combining the optimized SVM, XGBoost, and MLP (128, 64) models was constructed to enhance overall performance. This ensemble utilized both soft and hard voting methods to aggregate predictions [48], resulting in more stable and robust performance across metrics.
The ROC curves of individual models and the soft voting ensemble are illustrated in Figure 6, where XGBoost, MLP, and soft voting exhibited similarly high AUC values (above 0.996), while SVM showed slightly lower performance. These results visually confirm the superior discrimination ability of the proposed models. Note that the hard voting ensemble was excluded from the ROC analysis as it does not generate probability estimates required for curve construction.
These results highlight that the proposed models offer greater performance consistency and better generalization, particularly in handling diverse gameplay dynamics.

4.2. Feature Importance Analysis

Figure 7 illustrates the results of the feature importance analysis conducted using the XGBoost model. Feature importance was measured based on two metrics: Information Gain and Weight. Information Gain measures the contribution of each feature to model performance when used as a split criterion, whereas Weight reflects the frequency of feature utilization. The importance values were normalized to enable an appropriate comparison. By considering both metrics, this analysis comprehensively evaluated the relative importance and roles of the individual features.
Among the features analyzed, Champion Kill recorded the highest importance based on Information Gain, indicating that this feature significantly enhanced the model’s ability to predict comeback victories. However, its relatively low Weight suggests that Champion Kill is highly informative even when it is selected in a limited number of situations.
Inhibitor destruction ranked second in terms of Information Gain, reflecting its critical role in late-game strategies and its strong influence on victory probabilities. Despite its high Information Gain, this feature exhibited a low Weight, implying that only a few splits using this variable can deliver substantial information to the model.
Champion Assist ranked highly in terms of both Information Gain and Weight, highlighting the model’s consistent reliance on teamwork-related variables. This finding underscores the importance of team collaboration as a key factor for predicting comeback victories.
WCM and similarity based on Key Champion Mastery recorded lower Information Gain but high Weight, indicating that these features were frequently utilized across various splits. This suggests that team-level champion mastery and similarity consistently contribute to predicting comeback victories.
Among the dragon-related features, Cloud Drake exhibited the highest Information Gain, reflecting its strategic value in providing movement speed benefits to teams in specific scenarios. Similarly, Hextech Drake and Chemtech Drake yielded notable results, suggesting that the impact of dragons varies depending on the game context. Conversely, other dragon features exhibited relatively low importance.
Minion-related features, such as Jungle Minion and Minion, recorded high Weight values but relatively low Information Gain. This suggests that although these features are frequently used, their contribution to Information Gain is limited. In contrast, vision-related features, such as Ward Place and Ward Kill, showed below-average values for both metrics. This indicates that although vision is critical in gameplay, it is not a decisive factor for predicting comeback victories in this study.
Overall, the analysis of feature importance underscores the nuanced contributions of different game variables. By leveraging both Information Gain and Weight, the XGBoost model effectively captures the multidimensional nature of comeback victories in MOBA games.

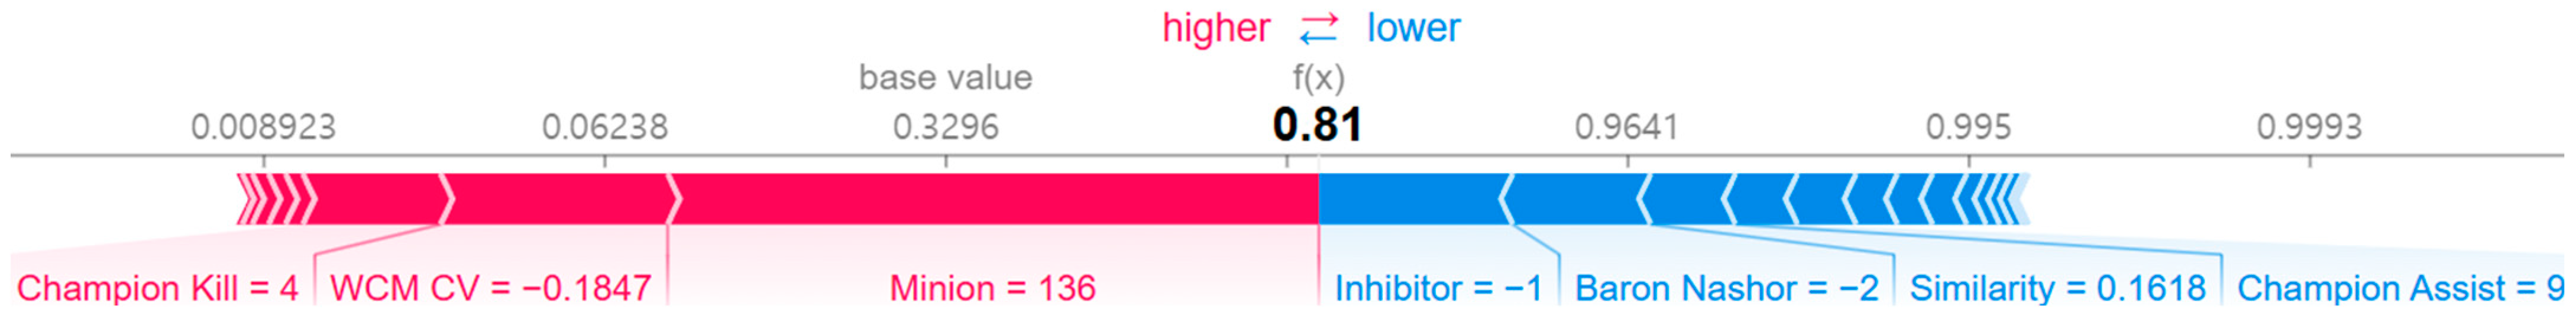
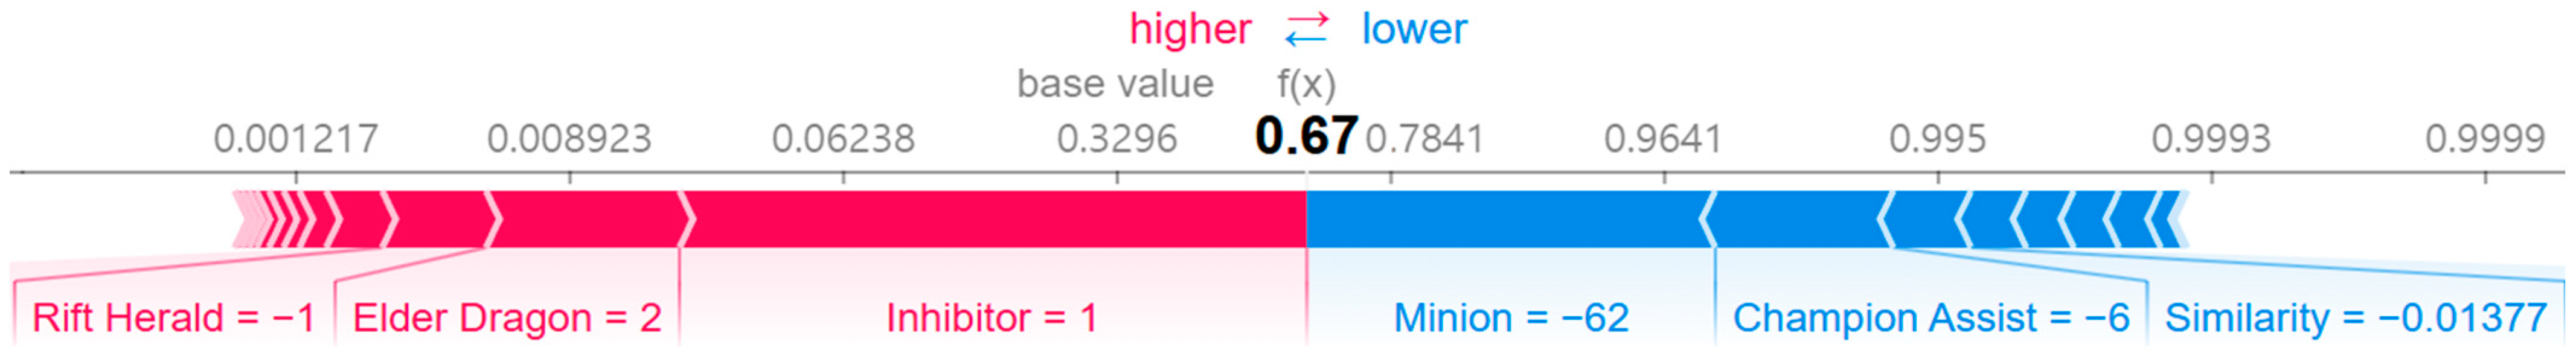
4.3. Individual Case Analysis

After creating the prediction model, individual cases were analyzed using SHAP analysis. SHAP is fundamentally based on Shapley values from cooperative game theory. It provides a mathematically consistent approach to attributing contributions of individual features [49]. Unlike alternative techniques such as LIME or Surrogate models, SHAP maintains theoretical consistency and effectively captures feature interactions, making it well-suited for analyzing complex MOBA game data.
A SHAP force plot is a visual explanation method that illustrates how each feature contributes to increasing or decreasing the model’s prediction from the base value. Features pushing the prediction higher are shown in red, while those lowering the prediction are shown in blue.
Figure 8 illustrates an example of a correctly classified comeback victory, showcasing the contribution of the individual variables to the model’s prediction. In this case, the model assigned a prediction probability of approximately 0.81, indicating a high likelihood of a comeback victory.
In this instance, Minion Kill and Champion Kill emerged as significant variables in the prediction. These findings suggest that the disadvantaged team gained an advantage in lane management and resource allocation during the mid-to-late stages of the game. Specifically, the Weighted Champion Mastery Coefficient of Variation (WCM CV) supported this observation, with its negative value indicating lower variability in champion mastery compared to that of the opposing team. This implies greater stability in champion mastery within the team, which positively contributed to the prediction.
Conversely, Inhibitor Destruction and Baron Nashor were key variables that negatively influenced the prediction. These results indicate that the team with the activated bounty system had lost control of both the inhibitors and Baron Nashor, placing them in a highly disadvantaged position. Additionally, the positive value of the Similarity variable indicated higher similarity in champion mastery among team members compared to the that of the opposing team. Despite this lack of diversity, the team overcame the disadvantage and achieved a comeback victory.
This case demonstrates that strategic superiority in lane management and resource utilization during the mid-to-late stages, coupled with stable champion mastery within the team, facilitates a comeback victory. Moreover, the team’s ability to recover from the loss of key objectives, such as inhibitors and Baron Nashor, highlights their effectiveness in strategic responses, even in unfavorable situations. These findings underline the multifaceted nature of comeback victories and the critical roles of both team coordination and resource management.
In contrast, Figure 9 illustrates a case in which the comeback prediction model identified a high probability of a comeback victory, but the actual match result did not align with this prediction. The model assigned a prediction probability of approximately 0.67, indicating a relatively high likelihood of a comeback victory. However, the match ultimately resulted in a loss.
The key features that influenced the model’s positive prediction included Inhibitor Destruction and the Elder Dragon. Specifically, securing the Elder Dragon twice and destroying an inhibitor reflected the team’s ability to dominate critical objectives later in the game, applying significant pressure on the opposing team.
Conversely, Minion Kill and Champion Assist negatively impacted the model’s prediction. The negative value associated with Minion Kill highlights insufficient lane management capabilities. Similarly, the lower Champion Assist value compared to that of the opposing team indicates weaker team fight coordination.
In summary, this case illustrates that, despite controlling major objectives, weaknesses in game management and team fight execution contributed to the lack of a comeback. The lack of effective resource management in the mid-to-late game prevented the team from sustaining control over the flow of the match. These findings emphasize that securing powerful objectives, such as the Elder Dragon, does not guarantee victory. Instead, detailed aspects of gameplay, such as effective lane management and resource allocation, play critical roles in achieving comeback victories.

5. Conclusions

This study proposed a novel approach to analyzing and predicting comeback victories in MOBA games, with a particular focus on LoL, by leveraging the bounty mechanism. By identifying key variables contributing to comeback victories and applying SHAP-based case analyses, the study offers actionable insights for both game design and post-match analysis. These findings can support individualized feedback on gameplay patterns and inform the development of coaching tools and training support systems. From a long-term perspective, our findings have significant implications for reducing player churn and strengthening the community and ecosystem of MOBA games.
Although this study provides meaningful contributions, it also highlights areas for further research. The analysis primarily focused on data from the Korean server; therefore, future studies should include global servers to enhance the generalizability of the findings. Such expansions could reflect regional and server-specific player behavior patterns, enabling the development of more comprehensive prediction models.
Additionally, this study was based on data collected from a specific patch version (14.18). Given the significant impact of patch updates on the meta and gameplay environment in MOBA games, future research should address generalizability across multiple patch versions. Incorporating machine learning operations (MLOps) methodologies could facilitate continuous model retraining and improvement, allowing for adaptive learning and maintaining performance in dynamic gaming environments.
Finally, future studies should consider integrating new variables, such as player psychological factors (e.g., motivation, confidence) and behavioral patterns (e.g., risk-taking tendencies or decision-making styles), to further enhance prediction performance. Additionally, incorporating the outcomes of sequential games could help capture the momentum effect, where the result of a previous match influences player behavior in the following game. Future research could also explore time-specific effects by segmenting matches into early, mid, and late game phases to investigate how the timing of bounty activation relates to comeback probability. Such analyses may reveal critical windows where teams are most likely to recover or lose control.
These enhancements could deepen the understanding of player behavior and motivation, improve model accuracy, and increase applicability in real-world gaming environments. By addressing these areas, future research can build on this study’s foundation, advancing the field of esports analytics and contributing to the development of more engaging and balanced MOBA games.

Author Contributions

Conceptualization, J.L. and N.K.; methodology, J.L. and N.K.; software, J.L.; validation, J.L. and N.K.; formal analysis, J.L.; investigation, J.L. and N.K.; resources, N.K.; data curation, J.L.; writing—original draft preparation, J.L.; writing—review and editing, J.L. and N.K.; visualization, J.L.; supervision, N.K.; project administration, N.K.; funding acquisition, N.K. All authors have read and agreed to the published version of the manuscript.

Funding

This work was supported by the National Research Foundation of Korea (NRF), with the grant funded by the Korean government (MSIT), grant number No. 2021R1F1A1050602.

Institutional Review Board Statement

Not applicable.

Informed Consent Statement

Not applicable.

Data Availability Statement

The dataset used in this study is available on Kaggle: https://www.kaggle.com/datasets/dlwnsgur0708/league-of-legends-comeback-dataset (accessed on 9 March 2025).

Conflicts of Interest

The authors declare no conflicts of interest.

Appendix A. Experimental Environment

The experimental environment utilized Ubuntu Server 20.04.6 LTS as the operating system. The hardware configuration included an Intel i9-13900K CPU (Intel Corporation, Santa Clara, CA, USA), an NVIDIA GeForce RTX 4090 GPU (NVIDIA Corporation, Santa Clara, CA, USA), and 128 GB of RAM (Samsung Electronics Co., Ltd., Suwon-si, Republic of Korea). The experiments were conducted in a Docker container-based environment using Docker version 24.0.5. Key packages and experimental configurations were encapsulated in a Docker image, which was stored on Docker Hub to enable reproducibility and sharing of the experimental setup.
Table A1. Experimental environment and computing resources.
ComponentDetails
OSUbuntu Server 20.04.6 LTS
CPUIntel i9-13900K
GPUNVIDIA GeForce RTX 4090
RAM128 GB (32 GB × 4)
Docker ImageDocker Hub: 3won/comeback-prediction:1.1
Programming LanguagePython 3.9
Packagescikit-learn 1.5.1
XGBoost 2.1.1
CatBoost 1.2.5
LightGBM 4.5.0
optuna 3.6.1
shap 0.46.0

Appendix B. Hyperparameter Optimization

Hyperparameter optimization is a crucial step in maximizing the performance of machine learning models. The efficient identification of optimal hyperparameters in a large search space significantly affects the predictive accuracy and generalization capability of the models. In this study, the Optuna optimization library was employed, integrating the Tree-structured Parzen Estimator (TPE) sampler with the Median Pruner for effective optimization.
TPE is a Bayesian optimization-based algorithm that models the distribution of high-performing hyperparameter combinations, thereby enhancing search efficiency. Unlike random sampling methods, TPE focuses on exploring regions of the search space where promising hyperparameter configurations are more likely to exist, thus offering improved efficiency in large search spaces [50]. In this study, the TPE sampler was utilized to effectively reflect the correlations between hyperparameters and optimize the selection process.
The Median Pruner plays a crucial role in optimizing computational resources by terminating trials early if their intermediate performance falls below the median performance of previous trials. By halting underperforming trials, this technique reduces unnecessary computational overhead and enables the allocation of resources to more promising configurations. This approach ensures the efficient use of time and computational resources during the optimization process.
The hyperparameter optimization process was conducted in two stages. In the initial exploration stage, the TPE sampler was used to identify optimal candidates across a broad search space. Subsequently, based on the identified candidates, the search space was narrowed and the TPE sampler was applied again for fine-tuned optimization. The optimized hyperparameters derived from this process are presented in Table A2, Table A3 and Table A4.
Table A2. SVM hyperparameters.
HyperparameterValue
Regularization (C)8.7
Kernel Functionrbf
Kernel Coefficient (gamma)3.0403
Table A3. XGBoost hyperparameters.
HyperparameterValue
N Estimators571
Max Depth19
Min Child Weight2
Subsample Ratio0.9993
Colsample by Tree0.5886
Grow PolicyLoss Guide
Max Leaves83
Tree MethodHist
Learning Rate (eta)0.0863
Min Split Loss (gamma)0.0011
L2 Regularization (lambda)1.8137
L1 Regularization (alpha)0.0079
Scale Positive Weight7.6183
Table A4. MLP hyperparameters.
HyperparameterValue
Hidden Layer Sizes(128, 64)
ActivationReLU
Optimizer (Solver)Adam
Initial Learning Rate0.0011
Max Iterations419
Batch Size200

References

  1. Funk, J. MOBA, DOTA, ARTS: A Brief Introduction to Gaming’s Biggest, Most Impenetrable Genre. Polygon, 3 September 2013. Available online: https://www.polygon.com/2013/9/2/4672920/moba-dota-arts-a-brief-introduction-to-gamings-biggest-most (accessed on 7 January 2025).
  2. Berger, J.; Pope, D. Can Losing Lead to Winning? Manag. Sci. 2011, 57, 817–827. [Google Scholar] [CrossRef]
  3. Gomez, M.A.; Reus, M.; Parmar, N.; Travassos, B. Exploring Elite Soccer Teams’ Performances during Different Match-Status Periods of Close Matches’ Comebacks. Chaos Solitons Fractals 2020, 132, 109566. [Google Scholar] [CrossRef]
  4. Goldschmied, N.; Mauldin, K.; Thompson, B.; Raphaeli, M. NBA Game Progression of Extreme Score Shifts and Comeback Analysis: A Team Resilience Perspective. Asian J. Sport Exerc. Psychol. 2024, 4, 75–81. [Google Scholar] [CrossRef]
  5. Kou, Y.; Gui, X. Playing with Strangers: Understanding Temporary Teams in League of Legends. In Proceedings of the First ACM SIGCHI Annual Symposium on Computer-Human Interaction in Play, Toronto, ON, Canada, 19–21 October 2014; pp. 161–169. [Google Scholar] [CrossRef]
  6. Tang, W. Understanding Esports from the Perspective of Team Dynamics. Sport J. 2018, 21, 1–14. [Google Scholar]
  7. Kou, Y.; Gui, X. Emotion Regulation in Esports Gaming: A Qualitative Study of League of Legends. Proc. ACM Hum. Comput. Interact. 2020, 4, 158. [Google Scholar] [CrossRef]
  8. Kwon, S.H. Analyzing the Impact of Team-Building Interventions on Team Cohesion in Sports Teams: A Meta-Analysis Study. Front. Psychol. 2024, 15, 1353944. [Google Scholar] [CrossRef]
  9. Mateo-Orcajada, A.; Vaquero-Cristóbal, R.; Gallardo-Guerrero, A.M.; Abenza-Cano, L. The Impact of Videogames on the Mood of Amateur Youth Players During Consecutive Games. Front. Sports Act. Living 2023, 5, 1309918. [Google Scholar] [CrossRef]
  10. Li, Q.; Xu, P.; Chan, Y.Y.; Wang, Y.; Wang, Z.; Qu, H.; Ma, X. A Visual Analytics Approach for Understanding Reasons Behind Snowballing and Comeback in MOBA Games. IEEE Trans. Vis. Comput. Graph. 2017, 23, 211–220. [Google Scholar] [CrossRef]
  11. Tahri, O.; Usman, M.; Demonceaux, C.; Fofi, D.; Hittawe, M.M. Fast Earth Mover’s Distance Computation for Catadioptric Image Sequences. In Proceedings of the 2016 IEEE International Conference on Image Processing (ICIP), Phoenix, AZ, USA, 25–28 September 2016; pp. 2485–2489. [Google Scholar] [CrossRef]
  12. Lee, J.-N.; Lee, J.-Y. A Study on the Factors Influencing Rank Prediction in PlayerUnknown’s Battlegrounds. Electronics 2025, 14, 626. [Google Scholar] [CrossRef]
  13. Lee, C.M.; Ahn, C.W. Feature Extraction for StarCraft II League Prediction. Electronics 2021, 10, 909. [Google Scholar] [CrossRef]
  14. Mohan, S.; Thirumalai, C.; Srivastava, G. Effective Heart Disease Prediction Using Hybrid Machine Learning Techniques. IEEE Access 2019, 7, 81542–81554. [Google Scholar] [CrossRef]
  15. Randhawa, K.; Loo, C.K.; Seera, M.; Lim, C.P.; Nandi, A.K. Credit Card Fraud Detection Using AdaBoost and Majority Voting. IEEE Access 2018, 6, 14277–14284. [Google Scholar] [CrossRef]
  16. Moreira, D.O.; Reis, L.P.; Cortez, P. Using Machine Learning to Predict Wine Quality and Prices: A Demonstrative Case Using a Large Tabular Database. IEEE Access 2024, 12, 182296–182309. [Google Scholar] [CrossRef]
  17. Al-Asadi, M.A.; Tasdemir, S. Predict the Value of Football Players Using FIFA Video Game Data and Machine Learning Techniques. IEEE Access 2022, 10, 22631–22645. [Google Scholar] [CrossRef]
  18. Adadi, A.; Berrada, M. Peeking Inside the Black-Box: A Survey on Explainable Artificial Intelligence (XAI). IEEE Access 2018, 6, 52138–52160. [Google Scholar] [CrossRef]
  19. Kumar, R.; Srirama, V.; Chadaga, K.; Muralikrishna, H.; Sampathila, N.; Prabhu, S.; Chadaga, R. Using Explainable Machine Learning Methods to Predict the Survivability Rate of Pediatric Respiratory Diseases. IEEE Access 2024, 12, 189515–189534. [Google Scholar] [CrossRef]
  20. El-Sofany, H.F. Predicting Heart Diseases Using Machine Learning and Different Data Classification Techniques. IEEE Access 2024, 12, 106146–106160. [Google Scholar] [CrossRef]
  21. Gu, W.; Foster, K.; Shang, J.; Wei, L. A Game-Predicting Expert System Using Big Data and Machine Learning. Expert Syst. Appl. 2019, 130, 293–305. [Google Scholar] [CrossRef]
  22. Brown, J.A.; Cuzzocrea, A.; Kresta, M.; Kristjanson, K.D.L.; Leung, C.K.; Tebinka, T.W. A Machine Learning Tool for Supporting Advanced Knowledge Discovery from Chess Game Data. In Proceedings of the 16th International Conference on Machine Learning and Applications (ICMLA), Cancun, Mexico, 18–21 December 2017; pp. 649–654. [Google Scholar] [CrossRef]
  23. Hitar-García, J.A.; Morán-Fernández, L.; Bolón-Canedo, V. Machine Learning Methods for Predicting League of Legends Game Outcome. IEEE Trans. Games 2022, 15, 171–181. [Google Scholar] [CrossRef]
  24. Costa, L.M.; Mantovani, R.G.; Souza, F.C.M.; Xexeo, G. Feature Analysis to League of Legends Victory Prediction on the Picks and Bans Phase. In Proceedings of the 2021 IEEE Conference on Games (CoG), Copenhagen, Denmark, 17–20 August 2021; pp. 1–5. [Google Scholar] [CrossRef]
  25. Wang, N.; Li, L.; Xiao, L.; Yang, G.; Zhou, Y. Outcome Prediction of Dota2 Using Machine Learning Methods. In Proceedings of the 2018 International Conference on Mathematics and Artificial Intelligence (ICMAI), Chengdu, China, 20–22 April 2018; pp. 61–67. [Google Scholar] [CrossRef]
  26. Hodge, V.J.; Devlin, S.; Sephton, N.; Block, F.; Cowling, P.I.; Drachen, A. Win Prediction in Multiplayer Esports: Live Professional Match Prediction. IEEE Trans. Games 2019, 13, 368–379. [Google Scholar] [CrossRef]
  27. Ani, R.; Harikumar, V.; Devan, A.K.; Deepa, O.S. Victory Prediction in League of Legends Using Feature Selection and Ensemble Methods. In Proceedings of the 2019 International Conference on Intelligent Computing and Control Systems (ICCS), Madurai, India, 15–17 May 2019; pp. 74–77. [Google Scholar] [CrossRef]
  28. Do, T.D.; Wang, S.I.; Yu, D.S.; McMillian, M.G.; McMahan, R.P. Using Machine Learning to Predict Game Outcomes Based on Player-Champion Experience in League of Legends. In Proceedings of the 16th International Conference on the Foundations of Digital Games, Montreal, QC, Canada, 3–6 August 2021; pp. 1–5. [Google Scholar] [CrossRef]
  29. Omar, H.I.; Prayogo, M.; Muliawan, V.; Gunawan, A.A.S.; Setiawan, K.E. Finding Feature Importance in Optimized Classification Model: League of Legends Ranked Matches. In Proceedings of the 2024 IEEE International Conference on Artificial Intelligence and Mechatronics Systems (AIMS), Bandung, Indonesia, 21–23 February 2024; pp. 1–5. [Google Scholar] [CrossRef]
  30. Shen, Q. A Machine Learning Approach to Predict the Result of League of Legends. In Proceedings of the 2022 International Conference on Machine Learning and Knowledge Engineering (MLKE), Guilin, China, 25–27 February 2022; pp. 38–45. [Google Scholar] [CrossRef]
  31. Lee, S.K.; Hong, S.J.; Yang, S.I. Predicting Game Outcome in Multiplayer Online Battle Arena Games. In Proceedings of the 2020 International Conference on Information and Communication Technology Convergence (ICTC), Jeju Island, Republic of Korea, 21–23 October 2020; pp. 1261–1263. [Google Scholar] [CrossRef]
  32. Do, T.D.; Dylan, S.Y.; Anwer, S.; Wang, S.I. Using Collaborative Filtering to Recommend Champions in League of Legends. In Proceedings of the 2020 IEEE Conference on Games (CoG), Osaka, Japan, 24–27 August 2020; pp. 650–653. [Google Scholar] [CrossRef]
  33. Chen, S.; Zhu, M.; Ye, D.; Zhang, W.; Fu, Q.; Yang, W. Which Heroes to Pick? Learning to Draft in MOBA Games with Neural Networks and Tree Search. IEEE Trans. Games 2021, 13, 410–421. [Google Scholar] [CrossRef]
  34. Bao, Z.; Sun, X.; Zhang, W. A Pre-Game Item Recommendation Method Based on Self-Supervised Learning. In Proceedings of the 2023 IEEE 6th International Conference on Pattern Recognition and Artificial Intelligence (PRAI), Haikou, China, 18–20 August 2023; pp. 961–966. [Google Scholar] [CrossRef]
  35. Hong, S.-J.; Lee, S.-K.; Yang, S.-I. Champion Recommendation System of League of Legends. In Proceedings of the 2020 International Conference on Information and Communication Technology Convergence (ICTC), Jeju Island, Republic of Korea, 21–23 October 2020; pp. 1252–1254. [Google Scholar] [CrossRef]
  36. Smerdov, A.; Somov, A.; Burnaev, E.; Zhou, B.; Lukowicz, P. Detecting Video Game Player Burnout with the Use of Sensor Data and Machine Learning. IEEE Internet Things J. 2021, 8, 16680–16691. [Google Scholar] [CrossRef]
  37. Riot Games. Riot Games API. Available online: https://developer.riotgames.com/ (accessed on 16 December 2024).
  38. Kutner, M.H.; Nachtsheim, C.J.; Neter, J. Applied Linear Regression Models, 4th ed.; McGraw-Hill Education: New York, NY, USA, 2004. [Google Scholar]
  39. Yu, H.F.; Huang, F.L.; Lin, C.J. Dual Coordinate Descent Methods for Logistic Regression and Maximum Entropy Models. Mach. Learn. 2011, 85, 41–75. [Google Scholar] [CrossRef]
  40. Burges, C.J. A Tutorial on Support Vector Machines for Pattern Recognition. Data Min. Knowl. Discov. 1998, 2, 121–167. [Google Scholar] [CrossRef]
  41. Breiman, L. Random Forests. Mach. Learn. 2001, 45, 5–32. [Google Scholar] [CrossRef]
  42. Chen, T.; Guestrin, C. XGBoost: A Scalable Tree Boosting System. In Proceedings of the 22nd ACM SIGKDD, San Francisco, CA, USA, 13–17 August 2016; pp. 785–794. [Google Scholar] [CrossRef]
  43. Dorogush, A.V.; Ershov, V.; Gulin, A. CatBoost: Gradient Boosting with Categorical Features Support. arXiv 2018, arXiv:1810.11363. [Google Scholar]
  44. Ke, G.; Meng, Q.; Finley, T.; Wang, T.; Chen, W.; Ma, W.; Ye, Q.; Liu, T.Y. LightGBM: A Highly Efficient Gradient Boosting Decision Tree. In Proceedings of the NIPS 2017, Long Beach, CA, USA, 4–9 December 2017; pp. 3149–3157. [Google Scholar]
  45. Hinton, G.E. Connectionist Learning Procedures. In Machine Learning; Morgan Kaufmann: Burlington, MA, USA, 1990; pp. 555–610. [Google Scholar]
  46. He, K.; Zhang, X.; Ren, S.; Sun, J. Delving Deep into Rectifiers: Surpassing Human-Level Performance on ImageNet Classification. In Proceedings of the 2015 IEEE International Conference on Computer Vision (ICCV), Santiago, Chile, 7–13 December 2015; pp. 1026–1034. [Google Scholar] [CrossRef]
  47. Kingma, D.P.; Ba, J. Adam: A Method for Stochastic Optimization. arXiv 2015, arXiv:1412.6980. [Google Scholar] [CrossRef]
  48. Zhang, C.; Ma, Y. Ensemble Machine Learning; Springer: New York, NY, USA, 2012. [Google Scholar] [CrossRef]
  49. Lundberg, S.M.; Lee, S.I. A Unified Approach to Interpreting Model Predictions. In Proceedings of the 31st International Conference on Neural Information Processing Systems (NIPS’17), Long Beach, CA, USA, 4–9 December 2017. [Google Scholar]
  50. Watanabe, S. Tree-Structured Parzen Estimator: Understanding Its Algorithm Components and Their Roles for Better Empirical Performance. arXiv 2023, arXiv:2304.11127. [Google Scholar] [CrossRef]
Figure 1. Peak concurrent viewers of the League of Legends World Championship by year.
Electronics 14 01445 g001
Figure 2. Distribution of playtime after the activation of the bounty system.
Electronics 14 01445 g002
Figure 3. Summoner’s Rift map.
Electronics 14 01445 g003
Figure 4. Data collection framework.
Electronics 14 01445 g004
Figure 5. Heatmap of game feature correlations.
Electronics 14 01445 g005
Figure 6. ROC curves for XGBoost, MLP, SVM, and soft voting ensemble.
Electronics 14 01445 g006
Figure 7. Variable importance analysis based on Weight and Gain.
Electronics 14 01445 g007
Figure 8. Success case analysis of the comeback prediction model based on SHAP.
Electronics 14 01445 g008
Figure 9. Failure case analysis of the comeback prediction model based on SHAP.
Electronics 14 01445 g009
Table 1. Victory prediction studies in MOBA games.
Research TypeData ScopeMain FocusModelGame Title
Professional Match AnalysisPre-gamePlayer–champion combinations and team synergyLR, SVM, NB,
KNN, XGBoost, MLP, Stacking
LoL [23]
Player–champion statisticsLR, SVM, NB,
KNN, DT, RF
LoL [24]
Past champion statistics and
champion bans/picks
LR, SVM, RFDota 2 [25]
Entire game
(5 min intervals)
Real-time prediction based on
in-game indicators
LR, RF, LGBM, CfsSubsetEvalDota 2 [26]
Combination of
pre-game and in-game data
Champion bans/picks and
in-game indicators
RF, GBoost, XGBoostLoL [27]
Solo Ranked Match AnalysisPre-game
(Iron through
Diamond tiers)
Player–champion masterySVM, KNN, RF
GBOOST, MLP
LoL [28]
Early game
(Diamond tier)
In-game indicatorsLR, SVM, NB,
KNN, RF
LoL [29]
LR, SVM, LB, KNN, DT, ET, RF, GBoost, Adaboost, VotingLoL [30]
Post-game
(Top tier)
RFLoL [31]
Table 2. Model Abbreviations.
AbbreviationMeaning
LRLogistic Regression
SVMSupport Vector Machine
NBNaive Bayes
KNNK-Nearest Neighbors
DTDecision Tree
ETExtra Trees
RFRandom Forest
GBoostGradient Boosting
AdaboostAdaptive Boosting
XGBoostExtreme Gradient Boosting
LGBMLight Gradient Boosting Machine
MLPMulti-Layer Perceptron
CfsSubsetEvalCorrelation-based Feature Subset Evaluation
Table 3. Experimental data.
DatasetTotalNo ComebackComeback Victory
# Train16,54815,4911057
# Test41383874264
TaskBinary Classification
EvaluationAccuracy, Precision, Recall, F1 Score
Table 4. Multicollinearity analysis results (Top 10 VIF values).
VariableVIF
Total Gold15.9175
XP13.6273
Champion Kill7.0370
Turret6.1828
Champion Assist4.2609
Inhibitor3.2327
Minion2.6836
Baron Nashor2.6138
Jungle Pressure2.1851
Jungle Minion2.0661
Table 5. Multicollinearity analysis results after variable selection (Top 10 VIF values).
VariableVIF
Champion Kill5.2940
Champion Assist3.9325
Jungle Pressure2.0319
Inhibitor1.8965
Jungle Minion1.8272
CM Top101.7576
WCM Mean1.7567
Baron Nashor1.4128
Minion1.3323
Ward Kill1.2353
Table 6. Variables derived from differences between objective bounty and non-bounty teams.
VariableDescription
Comeback VictoryWhether a comeback victory occurred (1, 0)
InhibitorNumber of inhibitors destroyed
Jungle MinionNumber of jungle monsters killed
MinionNumber of minions killed
Mountain DrakeNumber of Mountain Drakes killed
Chemtech DrakeNumber of Chemtech Drakes killed
Cloud DrakeNumber of Cloud Drakes killed
Infernal DrakeNumber of Infernal Drakes killed
Ocean DrakeNumber of Ocean Drakes killed
Hextech DrakeNumber of Hextech Drakes killed
Elder DragonNumber of Elder Dragons killed
Rift HeraldNumber of Rift Heralds killed
Baron NashorNumber of Baron Nashors killed
Champion KillNumber of champion kills
Champion AssistNumber of champion assists
Ward PlaceNumber of wards placed
Control Ward PlaceNumber of control wards placed
Ward KillNumber of wards killed
Damage Type RatioRatio of physical damage (AD) to magic damage (AP) within the team
Tank Role CountNumber of tanks within the team
Jungle PressureFrequency of jungle invades by the jungle player (per minute)
WCM MeanWeighted average champion mastery of the team’s five players, based on recent match records and performance
WCM CVWeighted coefficient of variation of champion mastery for the team’s five players, based on recent match records and performance
CM Top10A rate quantifying the contribution of skilled players within the team, calculated based on the frequency of selecting the top 10 highest-mastery champions played by team members
SimilarityA metric representing the similarity among team members based on the top 10 highest-mastery champions for each player
Table 7. Performance evaluation of baseline models.
ModelAccuracyPrecisionRecallF1 Score
LR0.98430.82840.95080.8854
SVM0.98720.85520.96210.9055
Random Forest0.98990.95630.88130.9173
XGBoost0.99030.91180.93940.9254
CatBoost0.98840.87400.95670.9134
LightGBM0.98910.88970.94700.9174
MLP (32)0.99170.96630.90080.9323
MLP (64, 32)0.99210.95780.91730.9367
MLP (128, 64, 32)0.99110.93990.92180.9300
Table 8. Performance evaluation of optimized models and ensemble models.
ModelAccuracyPrecisionRecallF1 Score
SVM0.98840.88850.93560.9114
XGBoost0.99150.92250.94700.9346
MLP (128, 64)0.99370.96120.93940.9502
Soft Voting0.99280.94660.93940.9430
Hard Voting0.99320.94700.94700.9470
Disclaimer/Publisher’s Note: The statements, opinions and data contained in all publications are solely those of the individual author(s) and contributor(s) and not of MDPI and/or the editor(s). MDPI and/or the editor(s) disclaim responsibility for any injury to people or property resulting from any ideas, methods, instructions or products referred to in the content.

