1. Introduction
Pumped storage is currently recognized as the most technologically mature and extensively developed solution to address the intermittency challenges of renewable energy sources [
1]. Variable-speed pumped storage units (VSPSUs) have attracted significant attention due to their superior hydraulic efficiency across a wider head range and enhanced power regulation capabilities [
2]. VSPSUs can be primarily classified into two categories: doubly fed and full-size. Compared to doubly fed induction generator units, full-size converter-based variable-speed pumped storage units (FSC-VSPSUs) demonstrate superior performance characteristics, including faster start-up and operational mode transition capabilities, broader speed and power regulation ranges, and enhanced fault ride-through capacity. These advantages position FSC-VSPSUs as a promising technology with extensive application potential in modern power systems [
3,
4].
For the FSC-VSPSU control strategy, grid-side converters (GSCs) predominantly employ grid-following control strategies [
5,
6,
7]. However, in modern power systems with high penetration of renewable energy, the strong coupling between phase-locked loops and current loops leads to oscillatory instability issues [
8]. Grid-forming control strategies have gained prominence in renewable energy integration due to their superior frequency and voltage support capabilities [
9]. Currently, two technical approaches exist for implementing grid-forming control strategies based on back-to-back converters. The first approach utilizes virtual synchronous machine control for the GSC while maintaining DC-link voltage control through the machine-side converter (MSC) [
10,
11]. However, the slow response of prime movers may cause the generator speed to exceed threshold limits during transient processes. The second approach exploits the similarity between DC-link capacitor dynamics and rotor motion equations to achieve synchronization through DC-link voltage control [
12,
13]. Nevertheless, this strategy faces challenges due to the significantly smaller capacitance of DC-link capacitors compared to rotational inertia and the limited allowable voltage variation range, necessitating coordinated inertia and frequency support from the MSC.
The aforementioned studies primarily focus on steady-state performance, with limited investigation into system control and protection under grid fault conditions. Various current limiting methods have been developed, which can be mainly categorized into direct current-limiting methods [
14,
15] and indirect current-limiting methods [
16,
17]. Direct current-limiting methods sacrifice the voltage source characteristics during LVRT to achieve rapid current restriction [
18]. This approach can be further divided into circular limiters [
19] and priority-based limiters [
20]. Circular limiters restrict only the current magnitude without altering the phase angle, thus requiring integration with power reference adjustment strategies. Priority-based limiters can adjust both the current magnitude and phase angle, enabling full reactive current injection during LVRT to enhance grid support capability. However, priority-based limiters introduce new equilibrium points, which may prevent the system from recovering to its pre-fault operating state after fault clearance, a phenomenon known as “windup” [
21].
Most current studies assume a constant DC-link voltage, thereby neglecting its impact on system stability. In [
22], the DC-link voltage exhibits significant fluctuations during high-power step changes and load variations. Consequently, poor DC-link voltage control on one converter side can significantly affect power flow control on the opposite side, ultimately compromising the operational stability of the FSC-VSPSU. Furthermore, the slow response of the prime mover leads to the injection of substantial unbalanced power into the DC-link, causing a sharp rise in the DC-link voltage, which jeopardizes the insulation of the DC-link capacitors. Although crowbar circuits are widely employed as a hardware protection mechanism [
12,
23], they are prone to overheating of the energy-dissipating resistor during LVRT and significantly escalate system hardware costs.
To fill the research gap, a crowbar-less LVRT control strategy for FSC-VSPSU in generation mode is proposed. The topology for FSC-VSPSU implemented without a crowbar circuit is proposed, the mathematical model of the FSC-VSPSU is established, and the corresponding control strategy is elaborated in detail. Furthermore, a novel parameter design methodology for the DC-link voltage controller is proposed, significantly improving system stability during LVRT. The specific contributions are summarized as follows.
- (1)
A crowbar-less LVRT control strategy for FSC-VSPSU is proposed, which adopts a power-priority system-level control strategy under generation mode. The control objectives and specific implementation strategies are provided for the governor, GSC, MSC, and ER, respectively. Under this control strategy, the substantial energy storage capacity of the rotor is utilized to absorb power imbalances, thereby eliminating the need for hardware protection measures, such as crowbar circuits, and enabling LVRT solely through the existing topology. This approach significantly reduces system-operating costs and control complexity.
- (2)
To investigate the impact of DC-link voltage loop control performance on system stability, a small-signal model of the DC-link voltage loop is established, which elucidates the mechanism of grid-side power disturbances on the DC-link voltage. A novel parameter design methodology for the DC-link voltage controller is proposed, where the controller parameters are designed through three evaluation tools: bode diagram, pole locus, and step response. This ensures that the DC-link voltage remains stable within the threshold range even under severe grid-side power fluctuations during fault occurrence and recovery.
The remainder of this article is organized as follows:
Section 2 presents the topology and mathematical model of the FSC-VSPSU.
Section 3 introduces the control strategy for FSC-VSPSU.
Section 4 describes the proposed parameter design methodology for the DC-link voltage controller.
Section 5 provides the simulation results. Finally,
Section 6 concludes this article.
3. Control Strategy for FSC-VSPSU
In generation mode, power priority control is recommended as the system-level control strategy due to its enhanced capability for rapid frequency and voltage support in power grids [
32]. To achieve power priority control, the responsibilities of each control unit are assigned as follows: the governor is responsible for controlling the rotational speed to ensure unit stability; GSC is responsible for directly regulating the active power flow; MSC is responsible for controlling the DC-link voltage to facilitate power flow transfer; and ER is responsible for maintaining constant stator flux to prevent magnetic saturation. The complete control block diagram of the FSC-VSPSU is illustrated in
Figure 4.
3.1. Control Strategy for the Governor
Since the unit speed is decoupled from the grid frequency through the full-size converter, the speed range of the unit is significantly expanded, allowing the RPT to always operate at its highest efficiency point, thereby improving the overall system efficiency. By obtaining the static head
and grid-side power reference
under the current operating conditions, the optimal speed reference
for the current scenario is determined through a look-up table [
33]. This control strategy is referred to as coordinated control.
Unlike conventional fixed-speed pumped storage units (FSPSUs), due to the presence of the full-size converter, the grid support strategy is managed by GSC. Therefore, the governor omits the transient droop and permanent droop components and only employs a simple PI controller (, ) to achieve closed-loop control of the unit speed.
3.2. Control Strategy for the Grid-Side Converter
3.2.1. Virtual Synchronous Machine Control
The active power control (APC) loop is designed to emulate the dynamic behavior of a synchronous machine, enabling grid synchronization through the simulation of its motion equations. Concurrently, the reactive power control (RPC) loop implements a voltage-reactive power droop characteristic to regulate reactive power output. The mathematical representations of these control loops are expressed as follows [
21]:
where
,
,
, and
denote the virtual inertia, damping coefficient, nominal grid frequency, and GSC frequency, respectively.
,
and
denote the droop coefficient, nominal voltage, and voltage magnitude reference, respectively.
During LVRT, the reactive current needs to be injected into the grid to facilitate the rapid recovery of the grid voltage. Therefore, the active and reactive power reference should be adjusted as follows [
14]:
where
refers to the voltage magnitude at the PCC;
k refers to the overcurrent coefficient, which is selected to be 1.5 in this case;
refers to the maximum apparent power that the converter is allowed to output.
3.2.2. Grid-Side Converter Inner Control
The PCC voltage and GSC current are controlled using a cascaded closed-loop control system with a voltage PI controller (
,
) and a current PI controller (
,
), combined with full feedforward decoupling to accelerate the system’s response speed. To prevent instantaneous overcurrent in GSC, a circular current limiter is added between the voltage loop and the current loop to ensure that the inverter current magnitude never exceeds the maximum limit value
, which is given by
where
is the original GSC current reference;
is the saturated GSC current reference;
is the maximum allowable current magnitude.
The SAT symbol denotes the triggering signal, which is activated when the current reference magnitude surpasses the predefined limit. Additionally, the voltage loop controller utilizes conditional integration, whereby the integration term is reset to zero upon activation of the circular current limiter. This mechanism enables the voltage loop to rapidly restore closed-loop control of the grid voltage once the current loop exits saturation.
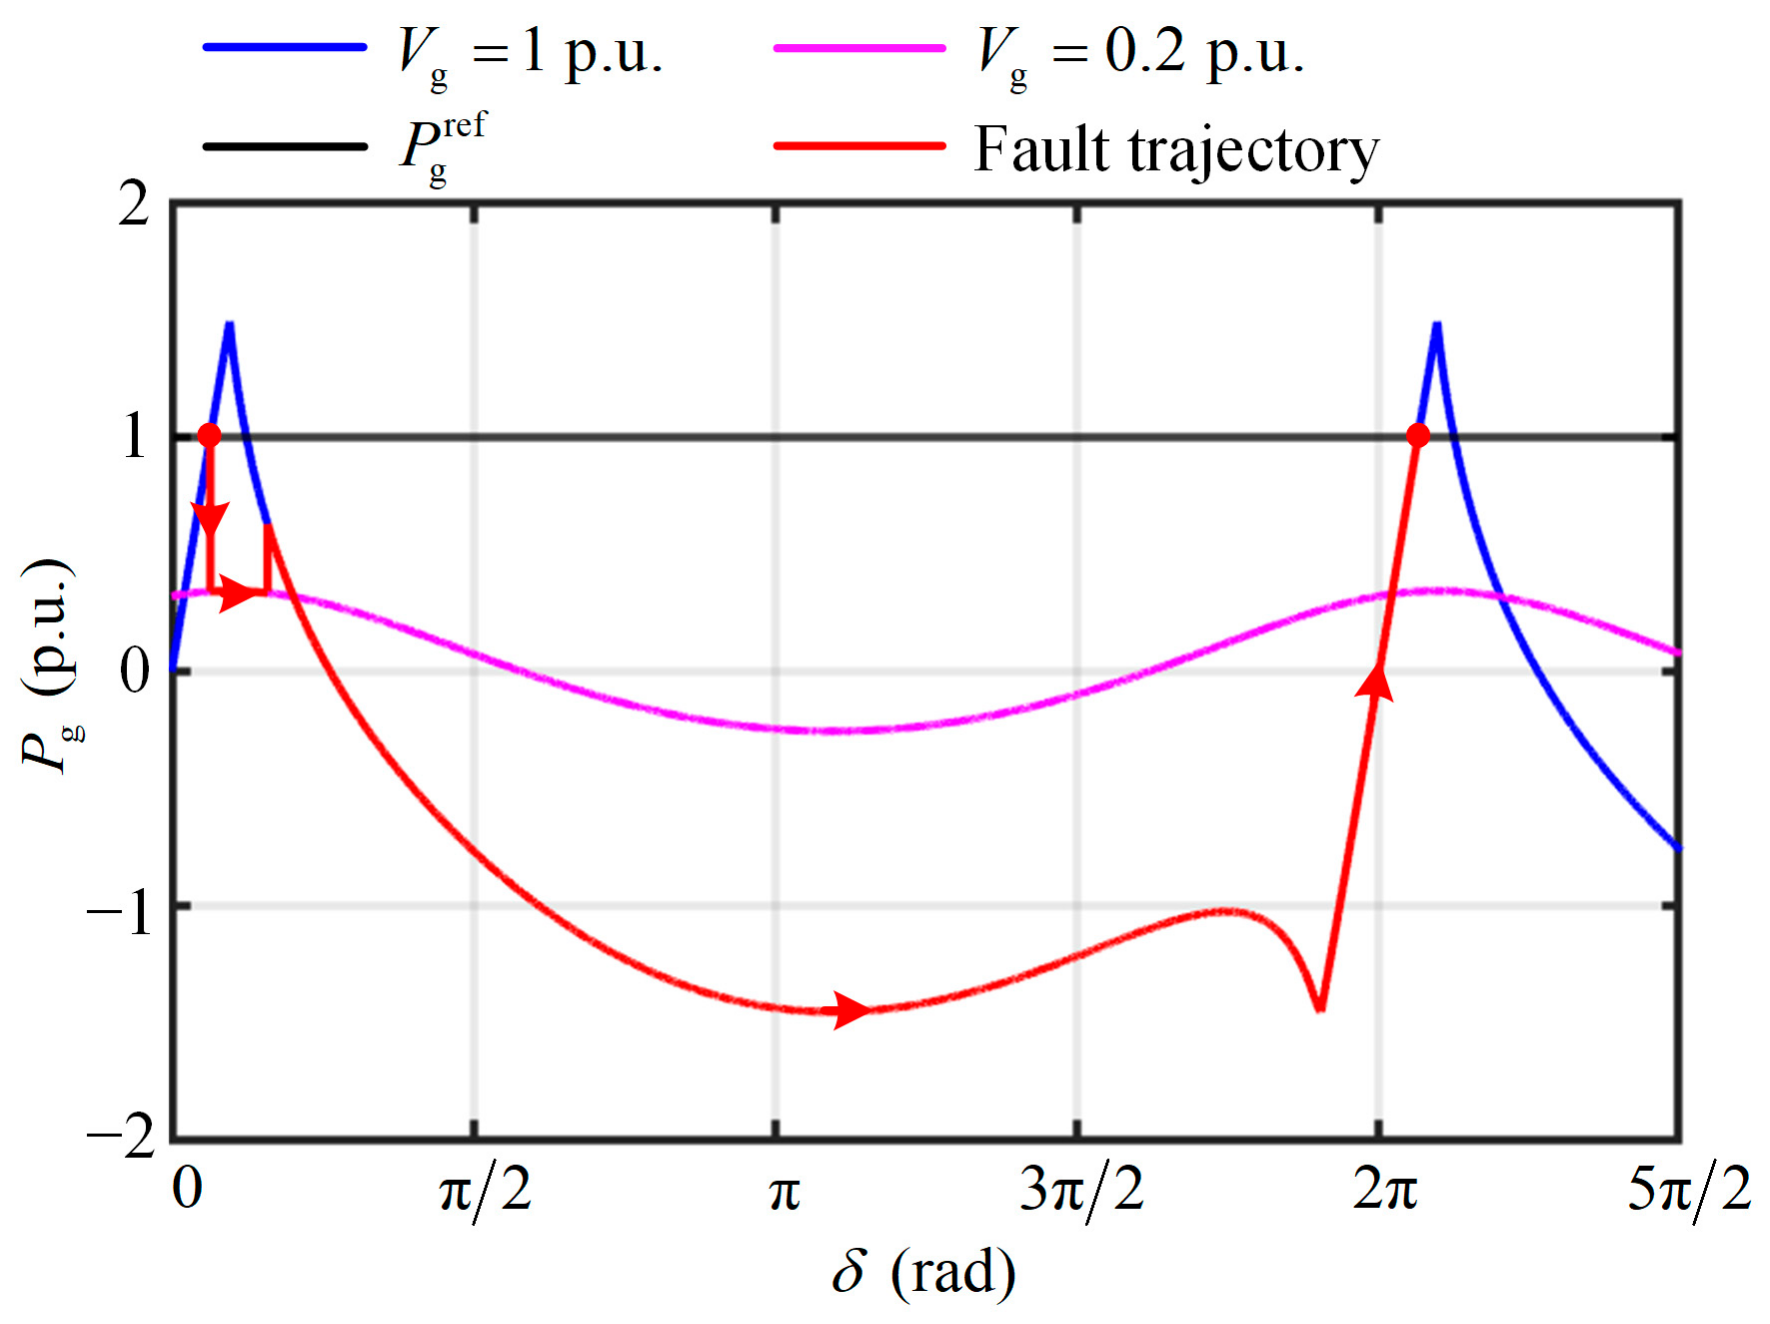
The power angle characteristic curves obtained with the circular current limiter during LVRT are illustrated in
Figure 5 [
34]. The figure depicts the power angle characteristic curves and fault ride-through trajectories under different grid voltage conditions. The blue line represents the power angle characteristic curve at
= 1 p.u., the pink line corresponds to
= 0.2 p.u., the black line indicates the constant power reference, and the red line illustrates the complete fault ride-through curve during the LVRT process.
It can be observed that when a fault occurs, rapidly decreases and follows the trajectory indicated by the pink line to prevent overcurrent in the grid-side converter. Upon fault clearance, transitions back to the blue line and ultimately stabilizes at the original operating point. This control strategy effectively mitigates the windup issue associated with priority-based limiters.
However, the circular current limiter also introduces new challenges. As shown in
Figure 5,
exhibits a reverse power flow during fault recovery, which poses a significant challenge for power generation systems with limited energy storage capacity. For FSC-VSPSU, although the system possesses substantial energy storage capacity, the DC-link voltage may exceed its threshold if the parameters of the DC-link voltage controller are not properly designed, thereby compromising the system’s safety and stability. The specific reasons and solutions will be discussed in detail in
Section 4.
3.3. Control Strategy for the Machine-Side Converter
The MSC employs a cascaded closed-loop control strategy. The outer loop utilizes a PI controller (, ) to ensure the stability of the DC-link voltage and generates the corresponding d-axis and q-axis stator current references. Meanwhile, the inner loop employs a PI controller (, ) to generate the stator voltage reference.
To ensure system safety and prevent potential damage to the MSC caused by stator overcurrent conditions, the stator current must be constrained within predefined operational limits. This is achieved through the implementation of a circular-current-limiting strategy, which effectively restricts the current loop references. The mathematical representation of this current limiter is expressed as follows:
where
is the original stator current reference;
is the saturated stator current reference. When the circular current limiter is triggered, only the magnitude is decreased, while the angle is kept unchanged.
Furthermore, to address potential saturation issues in the inner current loop that could cause integral windup in the outer loop controller, an anti-windup PI control mechanism is implemented in the outer control loop. This design effectively prevents integral saturation while maintaining controller stability and performance.
The rotor flux orientation control strategy is widely used due to its straightforward implementation. However, this approach presents limitations under heavy load conditions, where an intensified armature reaction may lead to motor magnetic saturation and consequent stator overvoltage. In contrast, a stator flux orientation control strategy effectively mitigates these issues.
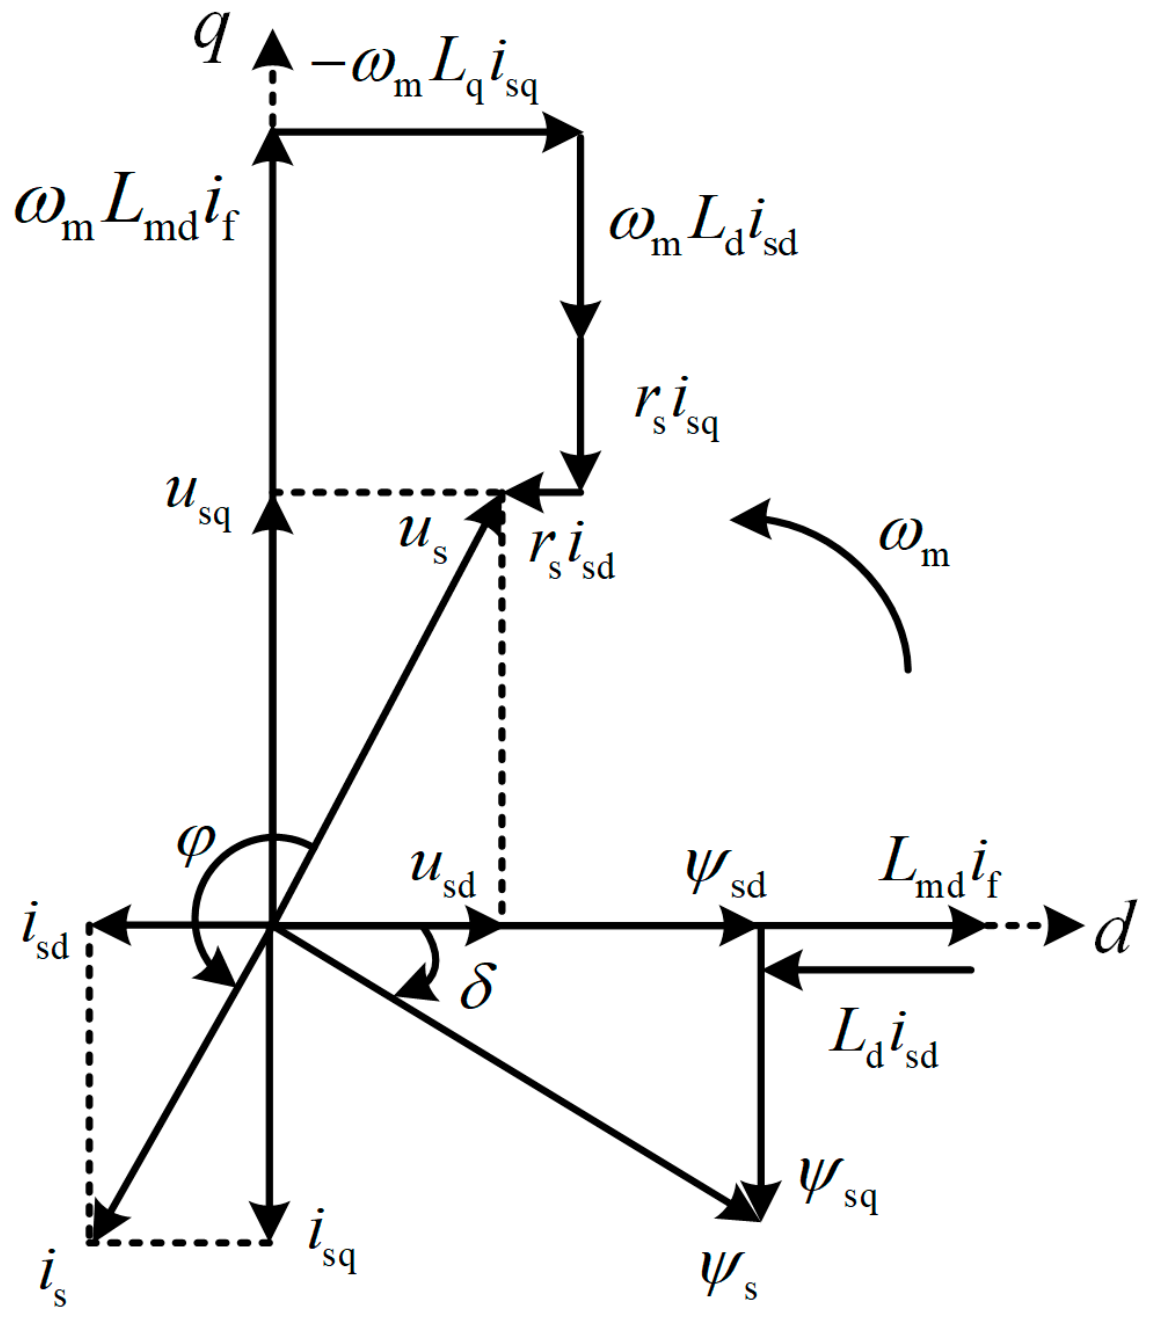
Under steady-state conditions, the stator voltage, stator flux, and electromagnetic torque equations of the EESM can be expressed as follows [
24]:
where
refers to the stator resistance;
L refers to the synchronous reactance;
refers to the armature reaction reactance;
refers to the stator voltage;
refers to the stator current;
refers to the excitation current;
refers to the stator flux;
refers to the electromagnetic torque;
refers to the power angle; and
refers the power factor angle. The subscripts ‘d’ and ‘q’ represent the d-axis component and q-axis component, respectively. The phasor diagram of the EESM derived from the above equations is shown in
Figure 6.
The principle of stator flux orientation control is to set the stator current phase perpendicular to the stator flux, thereby achieving maximum electromagnetic torque under the same stator current magnitude. In generation mode, the electromagnetic torque is of braking nature, and thus the stator current phase lags the stator flux by 90°. Meanwhile, the back electromotive force phase leads the stator flux by 90°, and the stator resistance voltage drop is in phase with the stator current. Consequently, the stator voltage and stator current phases are completely opposite. This control strategy is also known as unity power factor control.
Based on the phasor diagram, the trigonometric relationship between the power angle reference, stator flux reference, and stator current reference can be derived as follows:
Therefore, the expressions for the d-axis and q-axis stator current references can be obtained as follows:
3.4. Control Strategy for the Excitation Regulator
The control strategy of ER differs from that of conventional FSPSUs. Due to the isolation effect of the DC-link capacitor, the reactive power generated by EESM cannot be transmitted to the grid, and the grid-side reactive power is entirely supplied by the GSC. Therefore, the control strategy can be modified to ensure that the machine only generates active power, which further reduces the capacity requirements of EESM.
As indicated by Equation (17), the electromagnetic torque is equal to the product of the stator current and stator flux, while MSC is responsible for controlling the stator current. Consequently, ER needs to regulate the stator flux. To some extent, the MSC and ER operate in a coordinated manner to achieve stator flux orientation control.
Similarly to the DC-link voltage control strategy of the MSC, the stator flux control also adopts a cascaded closed-loop control structure. The outer loop utilizes a PI controller (
,
) to maintain constant stator flux and generates the excitation current reference for the inner loop, while the inner loop employs a PI controller (
,
) to produce the excitation voltage reference. Additionally, when the rotor speed exceeds 1 p.u., a flux-weakening control strategy is activated to prevent excessive stator voltage, which could otherwise cause damage. The expression for the flux-weakening control is as follows:
The stator flux observer estimates the stator flux by acquiring stator voltage and stator current , thus providing critical stator flux feedback for closed-loop control implementation. Since the flux observer is not the focus of this study, its implementation details are omitted for conciseness.
4. Proposed Parameter Design Methodology for the DC-Link Voltage Controller
4.1. Small-Signal Modeling of DC-Link Voltage Loop
To investigate the impact of DC-link voltage loop control performance on system stability, it is necessary to establish a mathematical model of the DC-link voltage loop.
According to Kirchhoff’s current law, the dynamic equation of the DC-link capacitor can be expressed as follows [
35]:
By multiplying both sides of the above equation by
and applying the Laplace transform, the following expression is obtained:
Through small-signal linearization at the rated operating condition (
= 1 p.u.,
= 1 p.u.), the small-signal equation of the DC-link dynamics can be derived as follows [
22]:
The above equation can be further transformed into the following:
The derived equation establishes the small-signal model for DC-link dynamics.
Figure 7 accordingly shows the PI controller-based closed-loop control structure for DC-link voltage regulation, implemented through this modeling methodology.
The open-loop transfer function of the DC-link voltage loop can be given by
The closed-loop transfer function and the disturbance transfer function can be expressed as follows:
It can be observed that the DC-link voltage is not only related to the command signal but is also influenced by the grid-side active power. As introduced in
Section 3.2.2, significant fluctuations in grid-side power occur during fault recovery. These fluctuations act on the DC-link voltage, causing it to exceed its threshold range: excessively high DC-link voltage may threaten the insulation of the DC-link capacitor, while excessively low DC-link voltage may lead to over-modulation, resulting in system instability. Therefore, it is essential to design the parameters of the DC-link voltage controller appropriately.
The proposed parameter design methodology for the DC-link voltage controller addresses this issue through three evaluation tools: bode plot, pole locus, and step response. This approach ensures the steady-state and dynamic performance of the DC-link voltage loop meet the required specifications, enabling robust and reliable operation under varying grid conditions.
4.2. Bode Plot Analysis
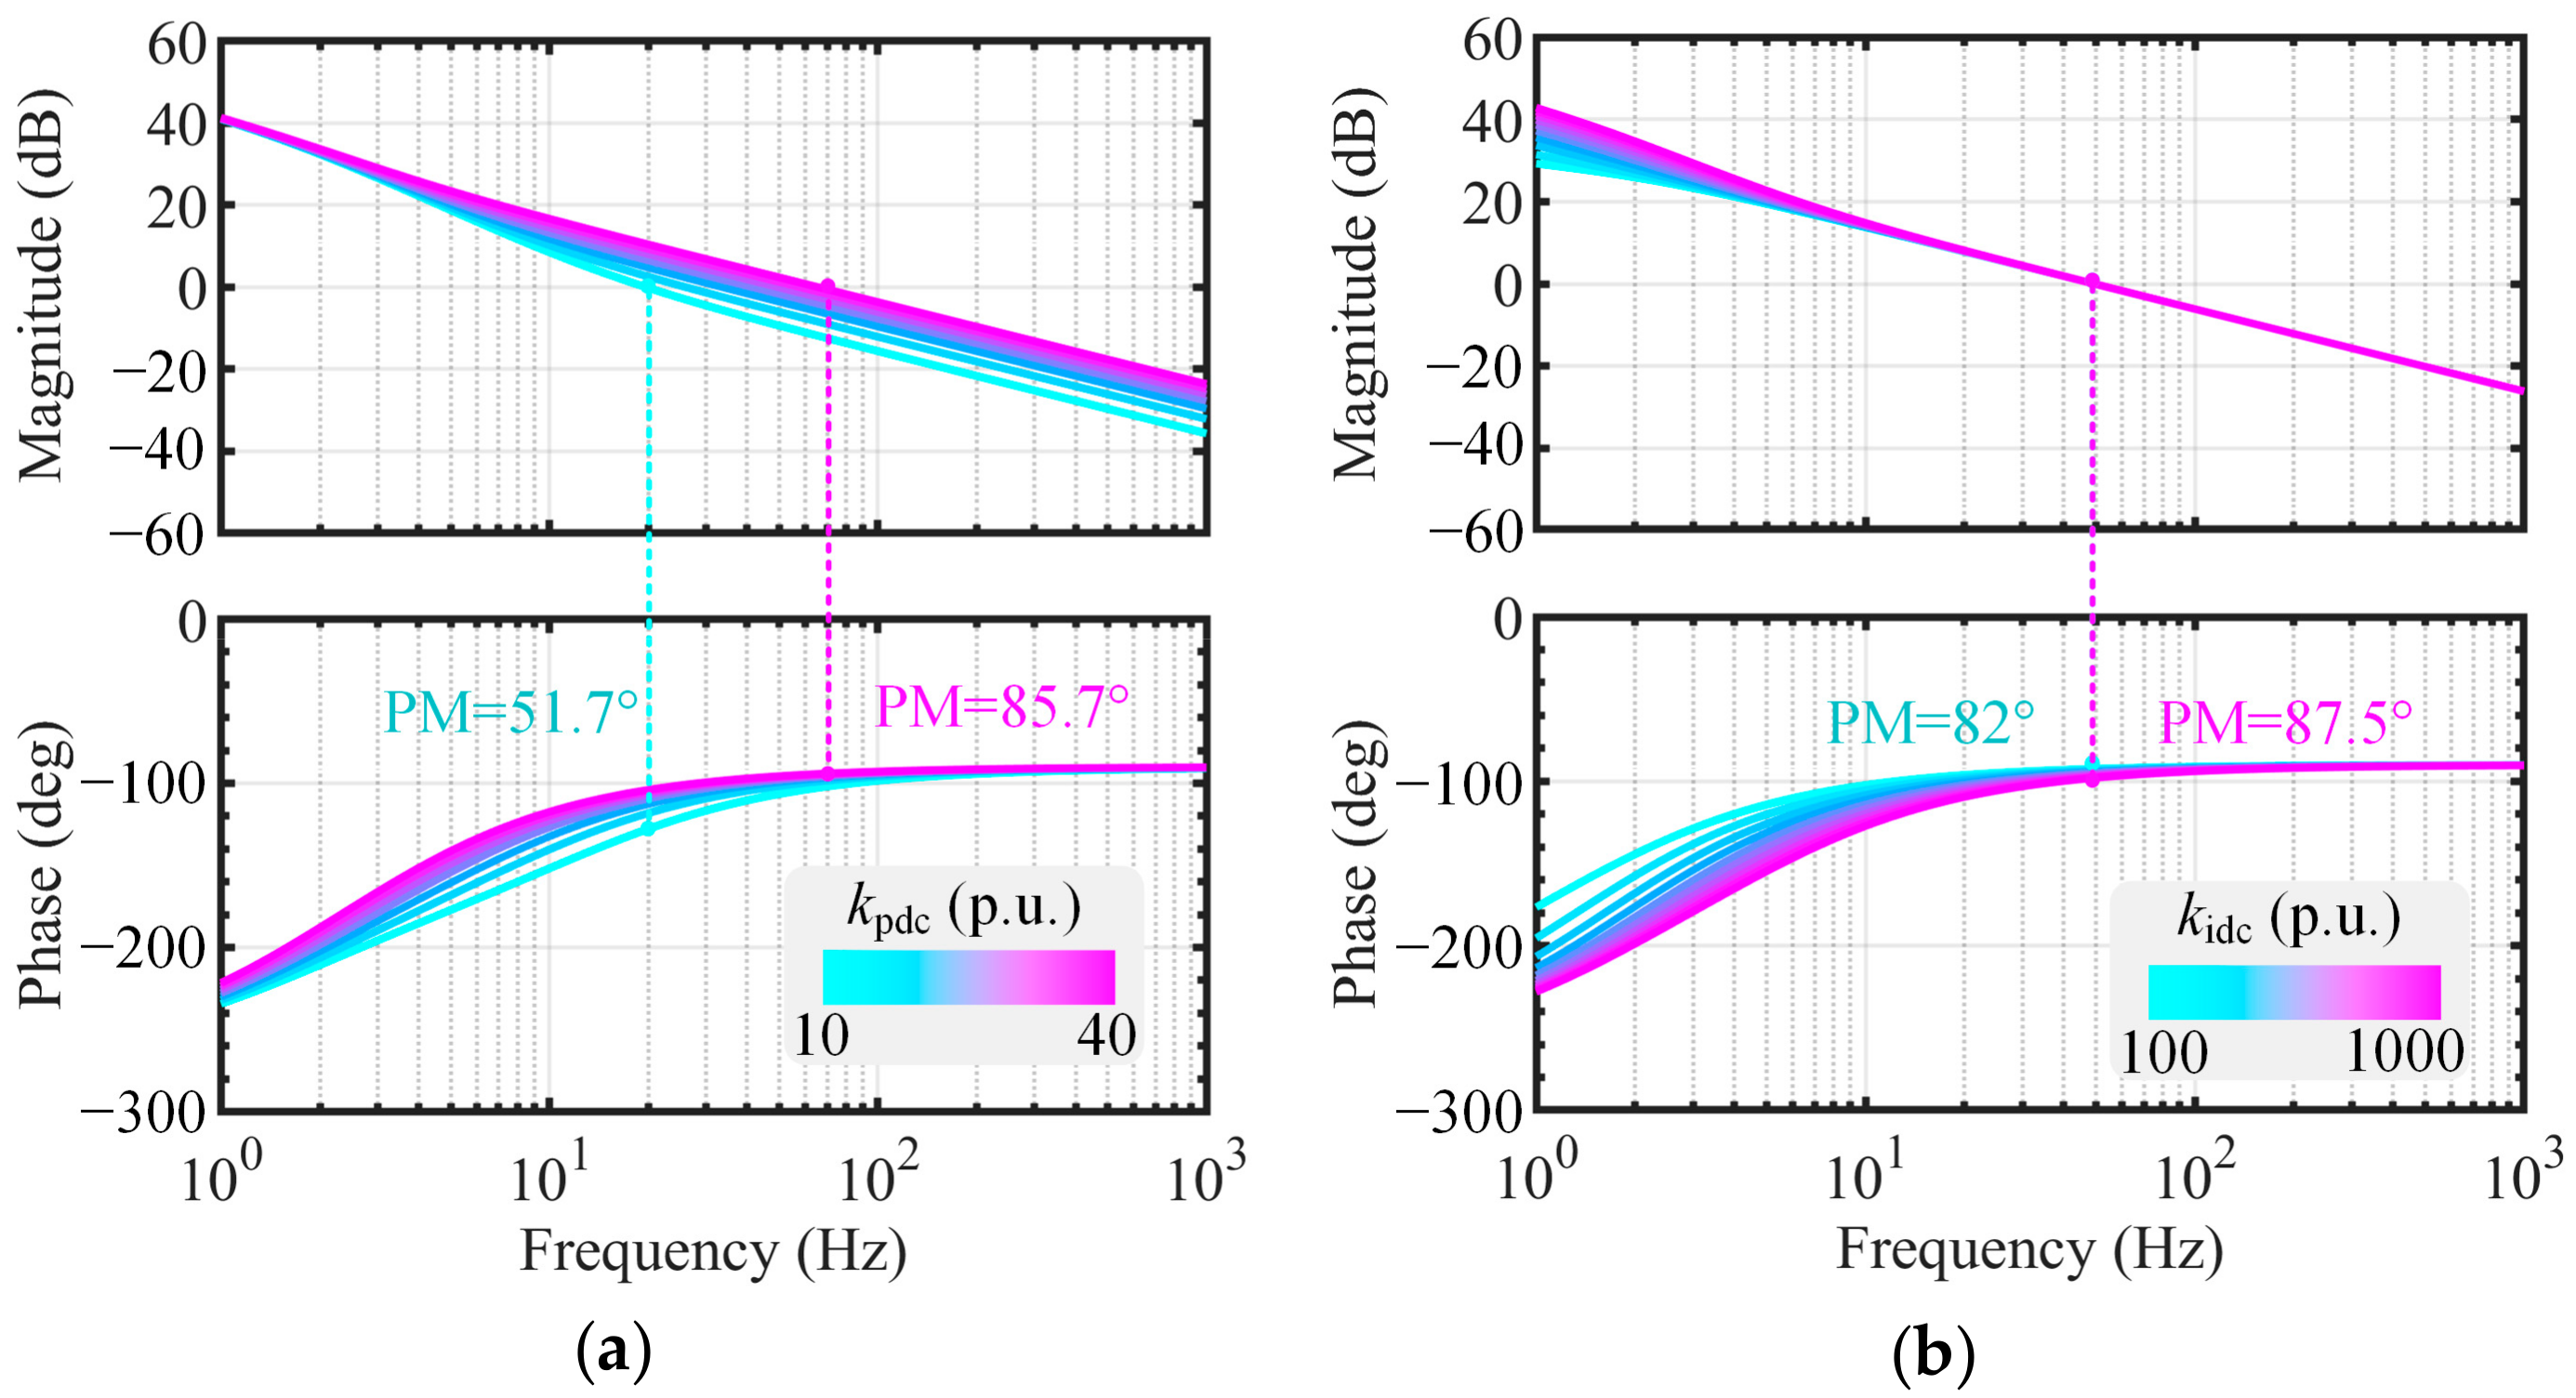
The bode plots showing the changes in the open-loop transfer function with controller parameters are presented in
Figure 8.
It is evident that the effects of
and
on the system exhibit distinct characteristics.
primarily influences the system gain in the high-frequency range. Increasing
shifts the gain crossover frequency to higher frequencies, thereby enhancing the phase margin, improving system stability, and reducing overshoot. As shown in
Figure 8a, when
= 10 p.u., the phase margin is approximately 51.7°, whereas increasing
to 40 p.u. results in a phase margin of 85.7°. Notably, the low-frequency gain remains unaffected, ensuring that the system’s response speed remains relatively consistent. Conversely,
predominantly affects the low-frequency gain of the system. As
increases, the low-frequency gain rises, indicating an expansion of the system’s bandwidth and a corresponding increase in response speed. However, variations in
do not significantly alter the gain crossover frequency, leaving the phase margin largely unchanged. From
Figure 8b, it can be observed that when
= 100 p.u., the phase margin is 82°, and when
= 1000 p.u., the phase margin increases marginally to 87.5°, representing a mere 5.5° improvement. In conclusion, increasing
effectively reduces system overshoot, while increasing
enhances the response speed.
4.3. Pole Locus Analysis
The pole loci resulting from the variation in the controller parameters are shown in
Figure 9. From the pole locus, it can be observed that as
increases, the closed-loop poles gradually approach the real axis and ultimately distribute along the real axis. This indicates an increase in the system’s damping ratio, growth in phase margin, and improvement in steady-state performance. On the other hand, as
increases, the dominant closed-loop pole moves leftward, indicating that the system’s response speed increases with the rise in
. The experimental conclusions show strong agreement with the frequency response characteristics observed in the bode plot analysis.
One important point to note is that the closed-loop zeros also influence the system’s dynamic response. For , as increases, the zeros move to the right, while as increases, the zeros move to the left. However, regardless of how the closed-loop zeros move, they remain far from the imaginary axis. To simplify the analysis, the impact of closed-loop zeros on the dynamic response of the system for different values of and can be considered approximately the same. In contrast, for , the closed-loop zeros are always located at the origin, and their influence on the system’s dynamic response entirely depends on the dynamic response produced by the closed-loop poles. Therefore, it is concluded that the dynamic response of both and systems primarily depends on the distribution of the closed-loop poles.
4.4. Step Reponse Analysis
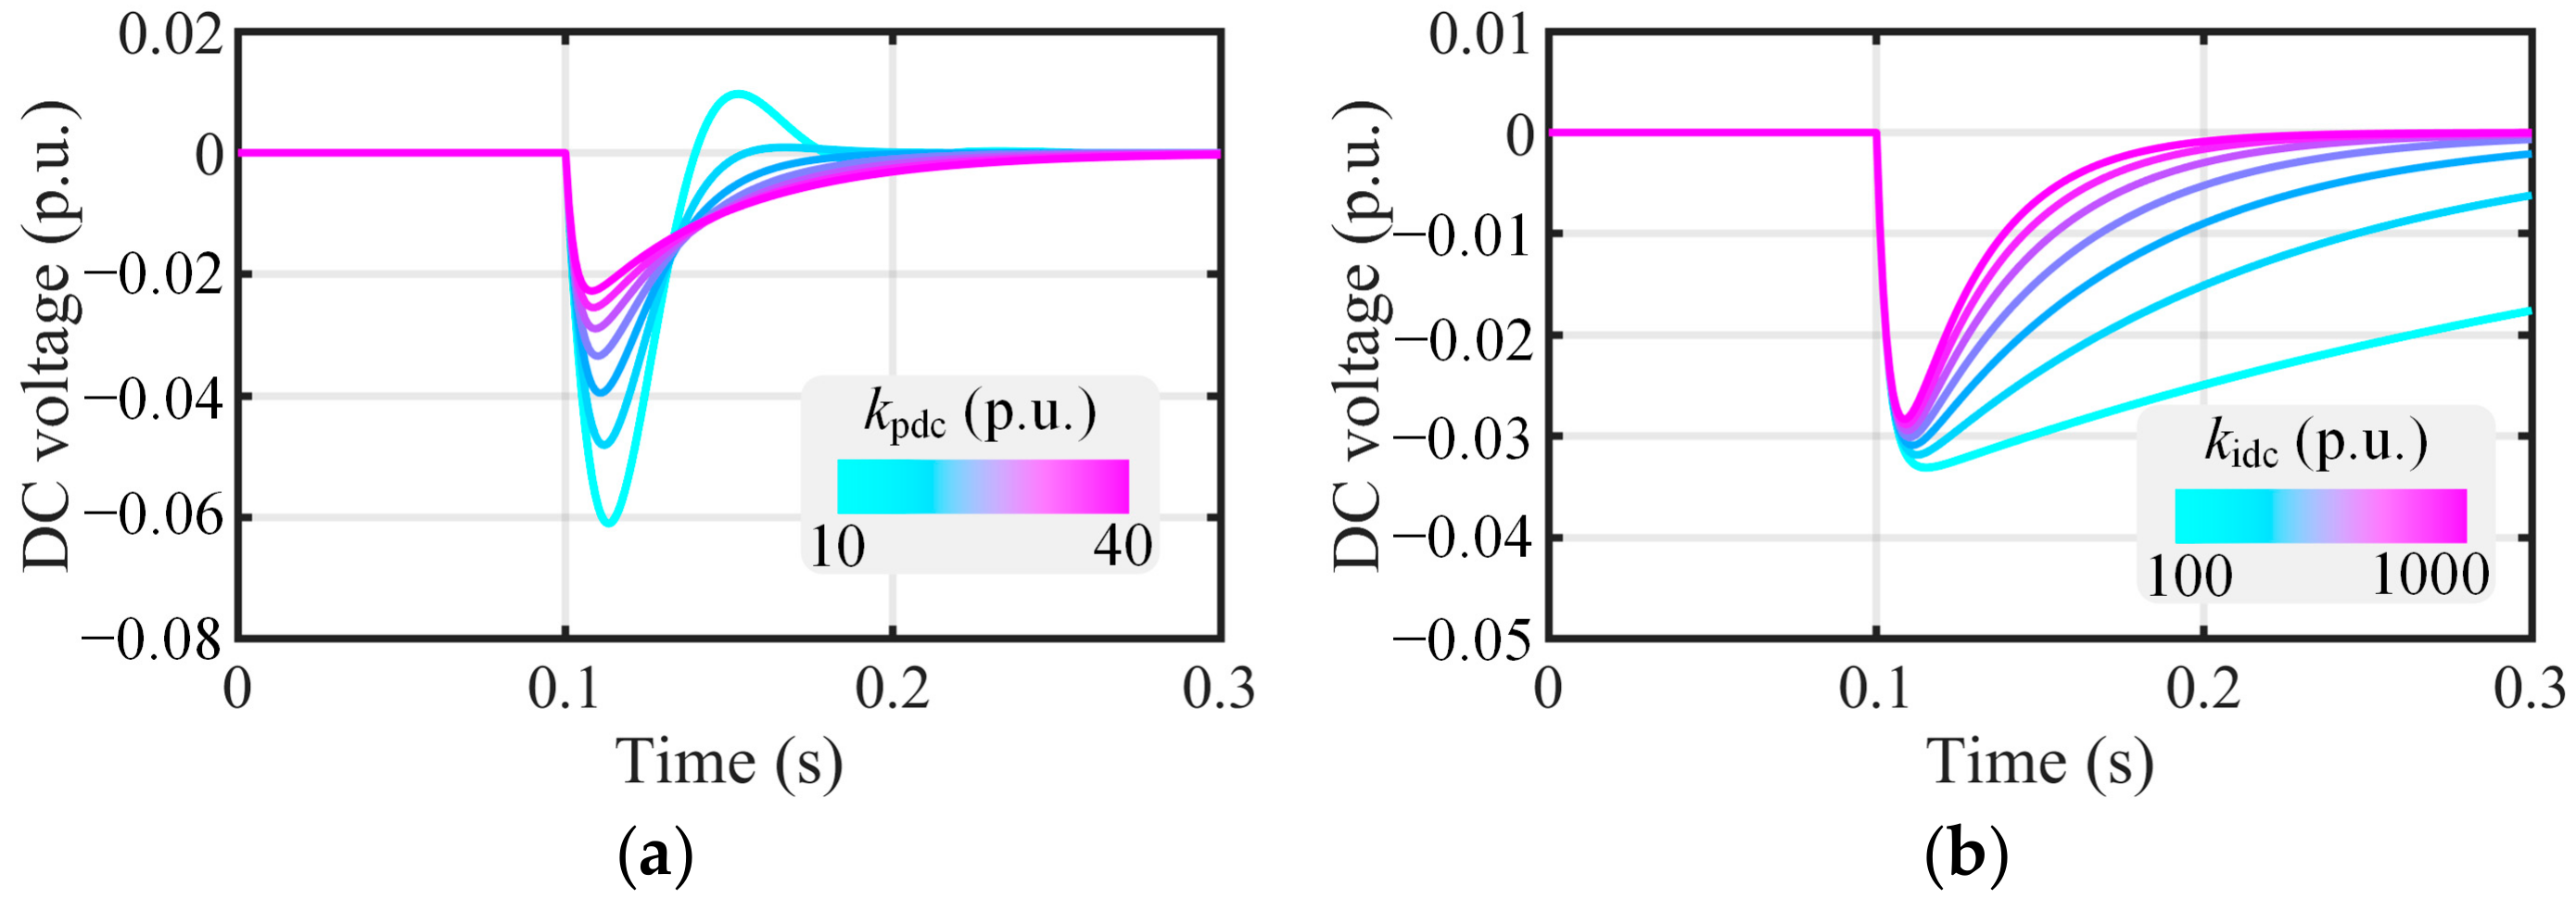
The step response waveforms of the closed-loop transfer function under varying controller parameters are illustrated in
Figure 10 and
Figure 11. For
, the step response reference transitions from 1 p.u. to 1.05 p.u., while for
, a unit step response is applied, with both references initiated at 0.1 s.
For both and , as , increases, the overshoot of the step response progressively diminishes. Concurrently, increasing leads to a reduction in the response time, aligning with the findings from the bode plot and pole locus analysis. Furthermore, despite the presence of closed-loop zeros, the step response waveforms are predominantly influenced by the closed-loop poles, validating the earlier assumption regarding the negligible impact of closed-loop zeros on the system’s dynamic response.
4.5. Parameters Selection for DC-Link Voltage Controller
To ensure that the DC-link voltage remains within the threshold range, the worst-case scenario must be considered: during fault recovery, the GSC may experience a power step disturbance close to 3 p.u. In this case, the maximum fluctuation of the DC-link voltage must be controlled within 0.1 p.u., meaning that the system’s overshoot under a unit step disturbance should not exceed 3.3%, and the response time should not exceed 0.1 s. Furthermore, under the action of a step input reference, the system’s overshoot should not exceed 10%, with the response time also not exceeding 0.1 s. Ultimately, selecting the control parameters = 30 p.u. and = 800 p.u. can effectively meet the specified requirements.
5. Simulation Results
To validate the proposed crowbar-less LVRT control strategy and the parameter design methodology for the DC-link voltage controller, a comprehensive simulation model of the FSC-VSPSU was developed in MATLAB/Simulink. The detailed system parameters are provided in
Table 1,
Table 2 and
Table 3.
The simulation conditions are established as follows: The FSC-VSPSU operates at full load capacity prior to fault occurrence. At t = 20 s, the grid voltage undergoes an instantaneous dip from 1.0 p.u. to 0.2 p.u., sustaining this reduced voltage level for 1 s before recovering to the nominal value.
5.1. Validation of the Proposed Crowbar-Less Low-Voltage Ride-Through Control Strategy
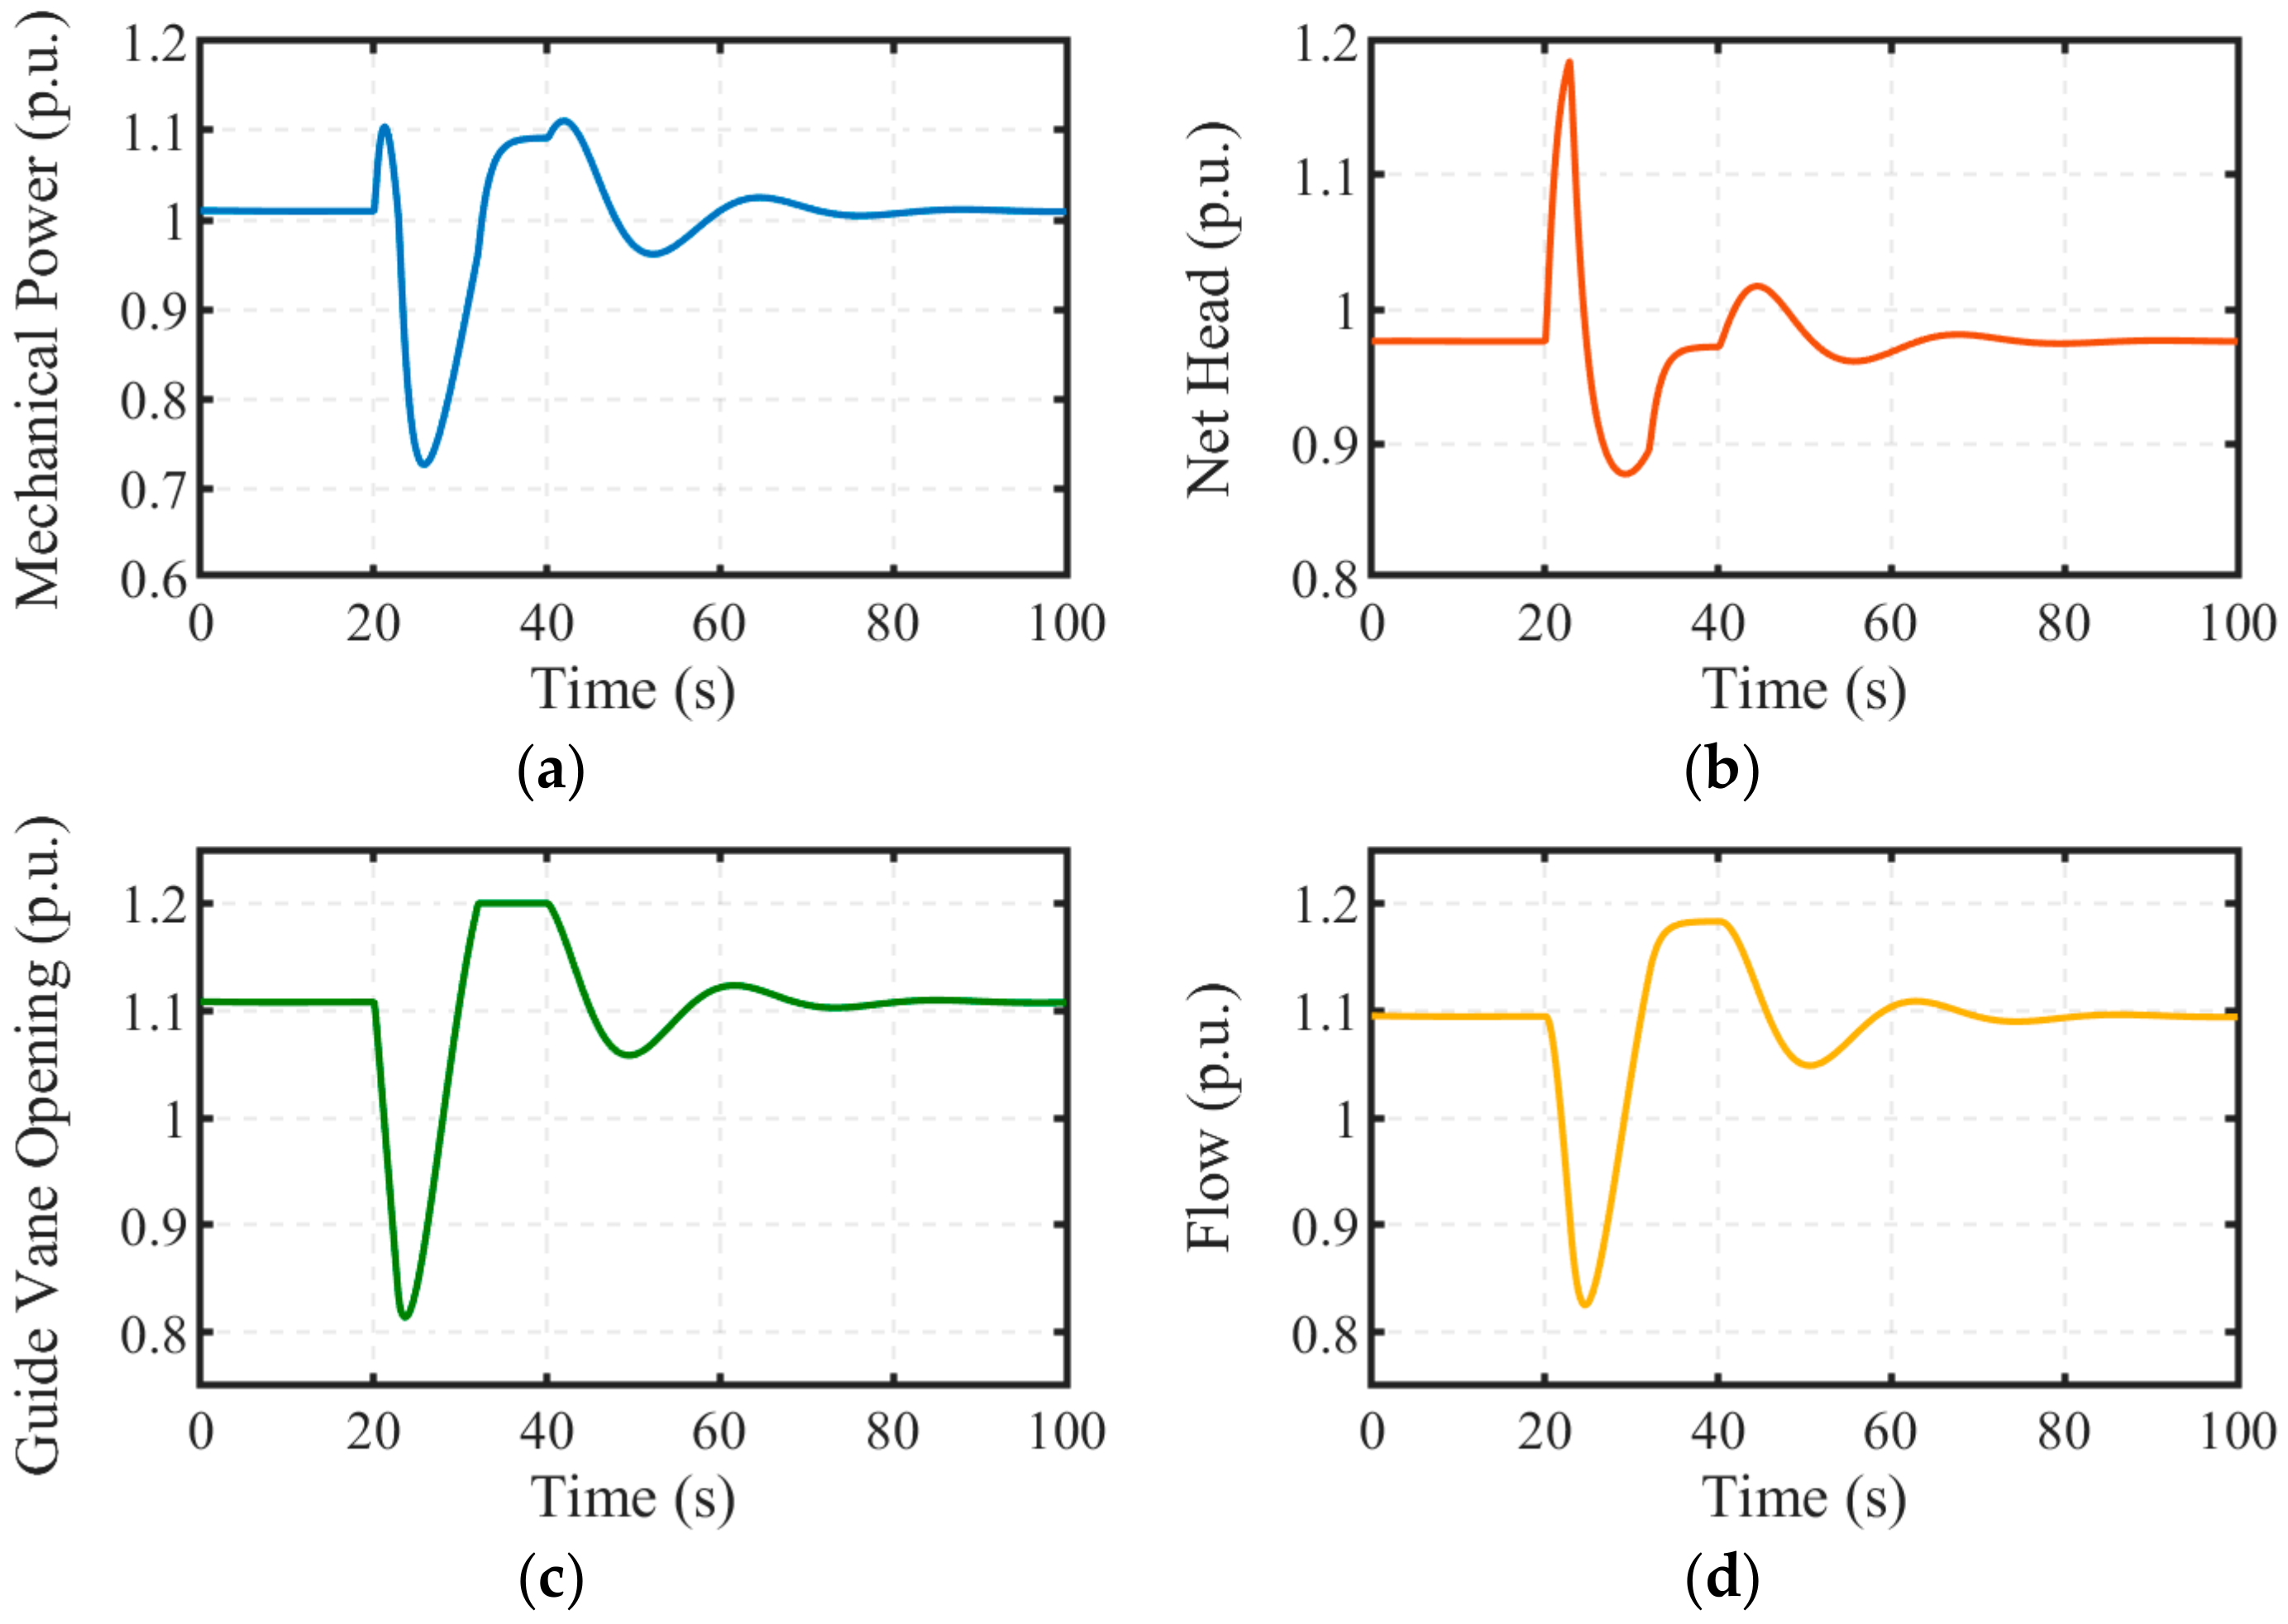
Figure 12 illustrates the dynamic responses of the hydraulic system. When a grid voltage dip occurs, the activation of the grid-side current limiter leads to a power imbalance between the machine-side and grid-side power, resulting in an increase in rotational speed. Simultaneously, the governor closes the gate to reduce the output power of the RPT. However, due to the water hammer effect, the water head suddenly increases as the gate is reduced, causing the initial power response to deviate from the expected trend. During grid voltage recovery, the restoration of grid-side power causes the rotational speed to decrease, prompting the governor to increase the gate to enhance the machine-side power output. Eventually, the hydraulic system stabilizes, with the entire process lasting approximately 80 s.
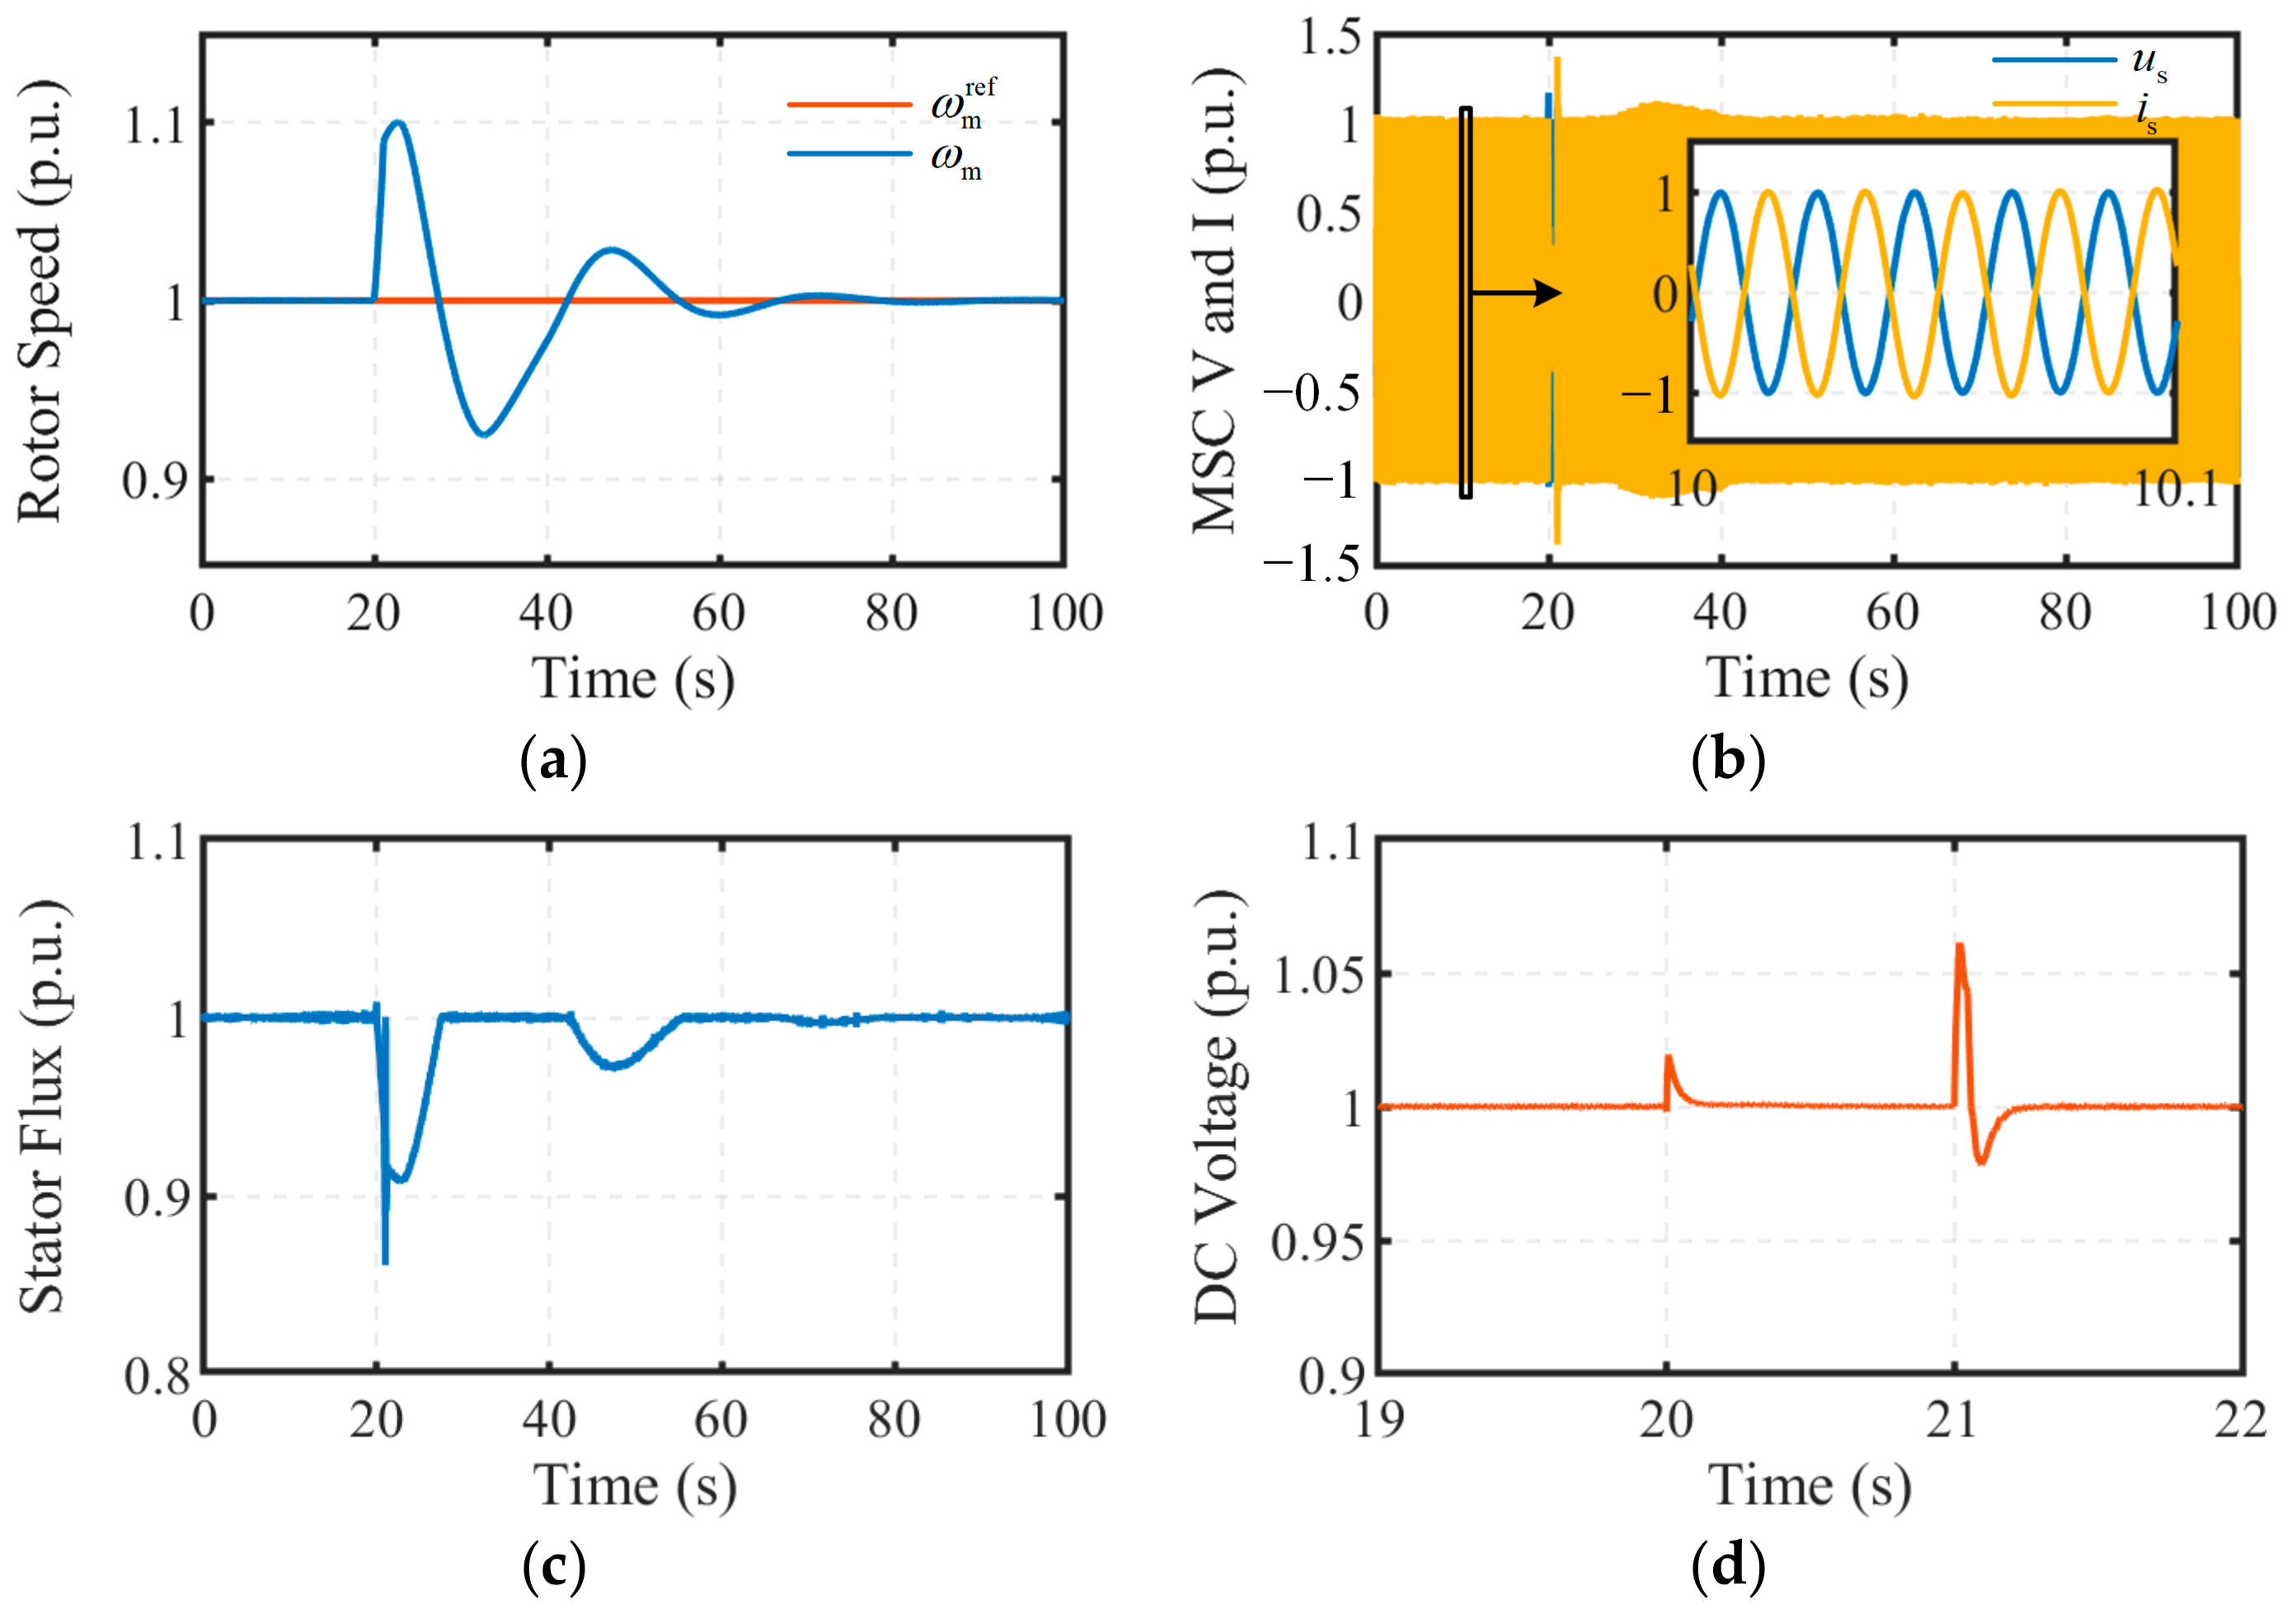
The simulation results of the MSC are shown in
Figure 13. During LVRT, relying solely on rotor energy storage to absorb power imbalances, the maximum rotational speed reaches 1.1 p.u., which is significantly lower than the permissible maximum speed limit. This demonstrates that achieving LVRT without crowbar circuits by utilizing rotor energy storage is entirely feasible. Moreover, due to the effects of flux weakening control and the circular current limiter, the stator voltage and current are consistently maintained below their respective limits, ensuring the reliable operation of the MSC. Additionally, thanks to stator–flux orientation control, the phases of the stator voltage and current are completely opposite, resulting in a unity power factor on the stator side. Throughout the entire LVRT process, even though the DC-link voltage is affected by grid-side power disturbances, its variation stays within the 10% threshold, indicating that the selected parameters for the DC-link voltage controller are entirely reasonable.
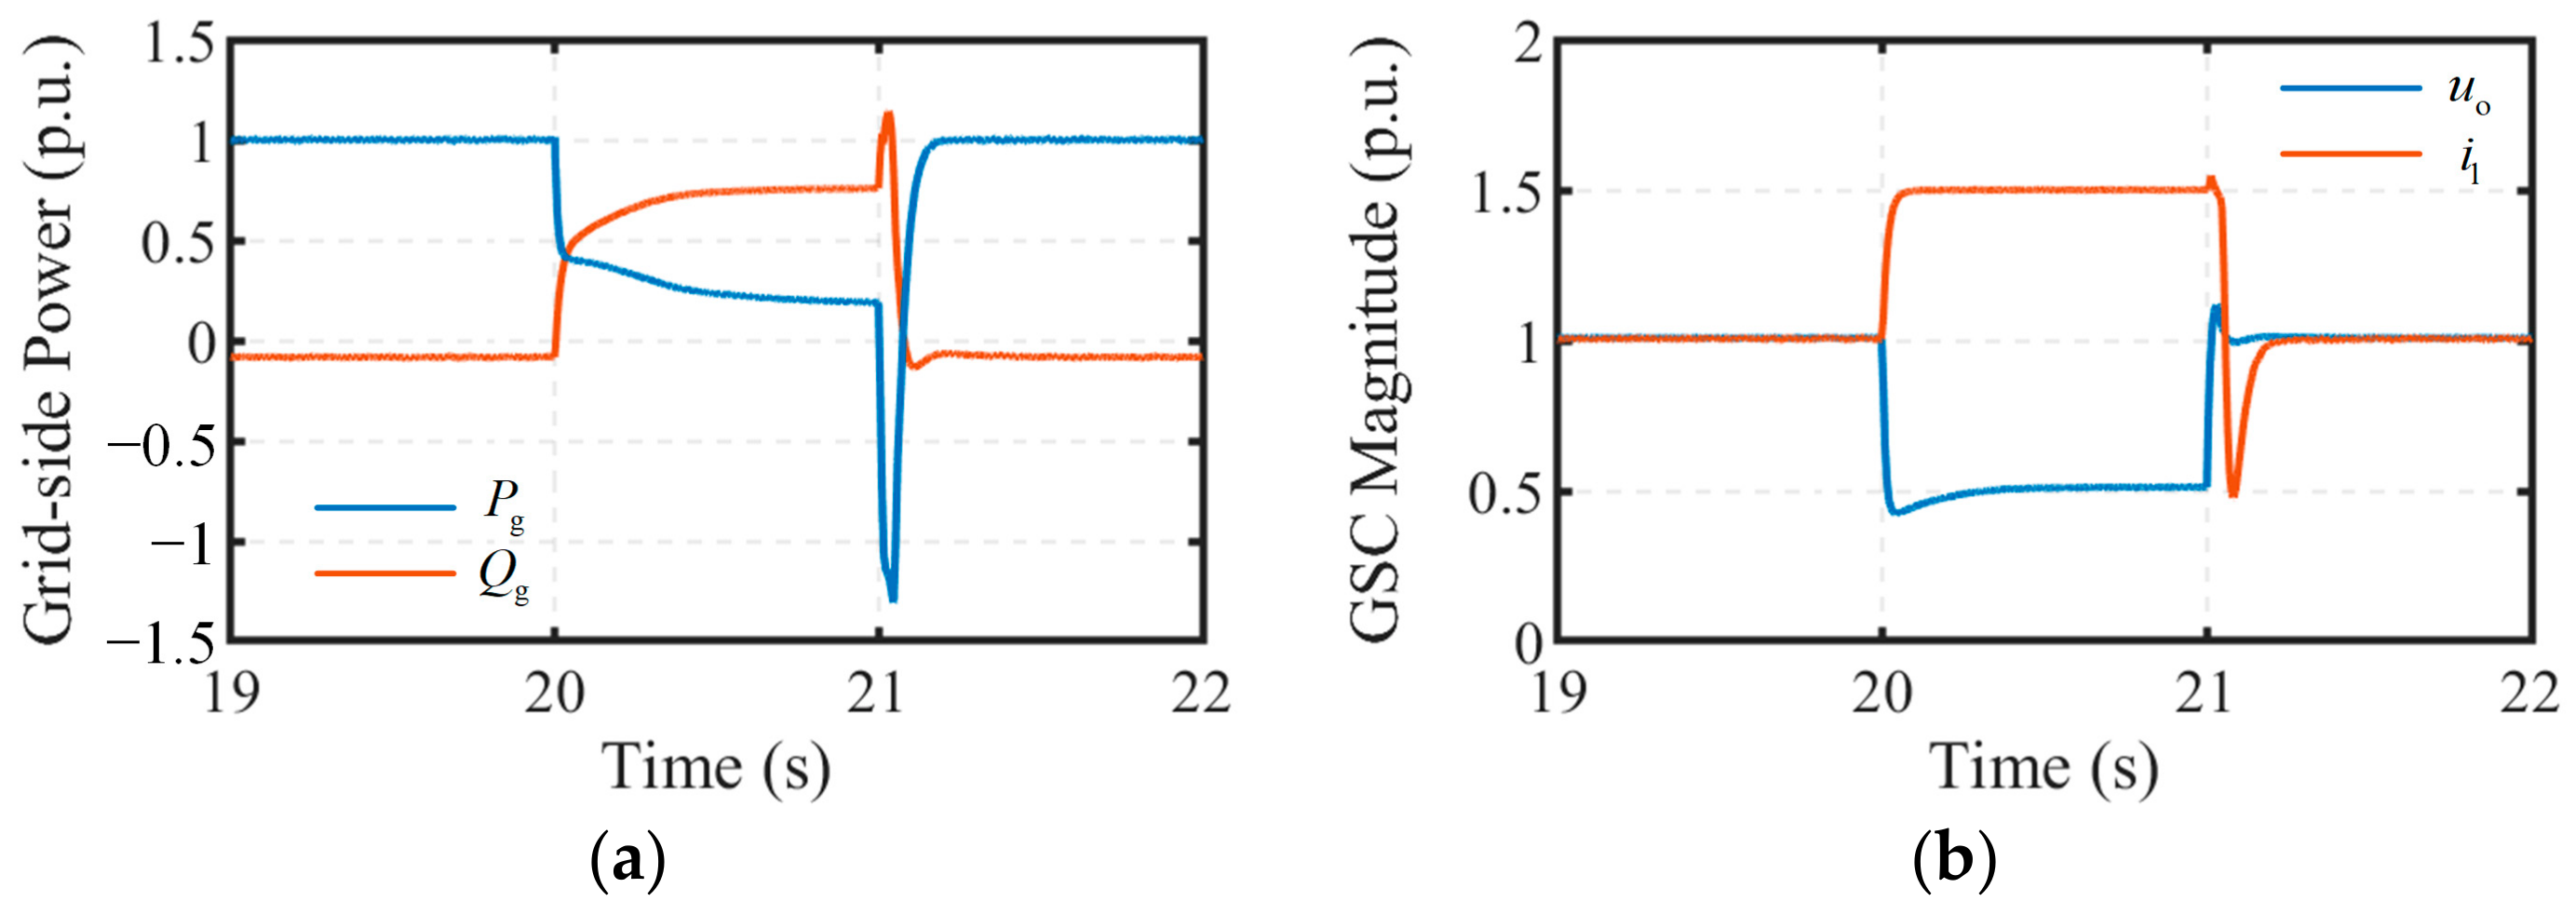
The simulation results of the GSC are shown in
Figure 14. When a sudden grid voltage dip occurs, the circular current limiter promptly activates to restrict the grid-side converter current to its maximum allowable value. Simultaneously, the reference values of the APC and RPC loops are adjusted accordingly. The reactive power rapidly increases to support grid voltage recovery, while the active power decreases to ensure sufficient reactive power compensation. Upon grid voltage recovery, the active power exhibits a reverse absorption effect before returning to the pre-fault operating point, which aligns with the theoretical analysis presented in
Section 3.2.2. The entire fault recovery process is completed within approximately 0.2 s. Notably, due to the presence of grid impedance, even when the grid voltage drops to 0.2 p.u., the PCC voltage does not decrease to 0.2 p.u., remaining at approximately 0.5 p.u.
From the simulation results above, it can be observed that during LVRT, all physical quantities operate within their permissible working ranges. Furthermore, the effectiveness of both the system-level control strategy and the unit-level control strategies for the governor, MSC, GSC, and excitation regulator has been validated. In summary, the proposed crowbar-less LVRT control strategy has been proven effective.
5.2. Validation of the Proposed DC-Link Voltage Controller Parameter Design Methodology
Figure 15 presents the step response waveforms of the DC-link voltage under different controller parameters. At 0.1 s, a step signal with an amplitude of 0.01 p.u. is applied to the DC-link voltage reference. For
, as its value increases, the overshoot of the DC-link voltage gradually decreases. Specifically, when
= 10 p.u., the overshoot is approximately 50%, while at
= 30 p.u., the overshoot reduces to 10%. These results align well with the theoretical findings illustrated in
Figure 10a. However, due to the inherent fluctuations in the DC-link voltage, the differences in the step responses corresponding to different
values are less pronounced. In fact, this is consistent with the theoretical results in
Figure 10b, indicating that variations in
have minimal impact on the step response of the closed-loop transfer function.
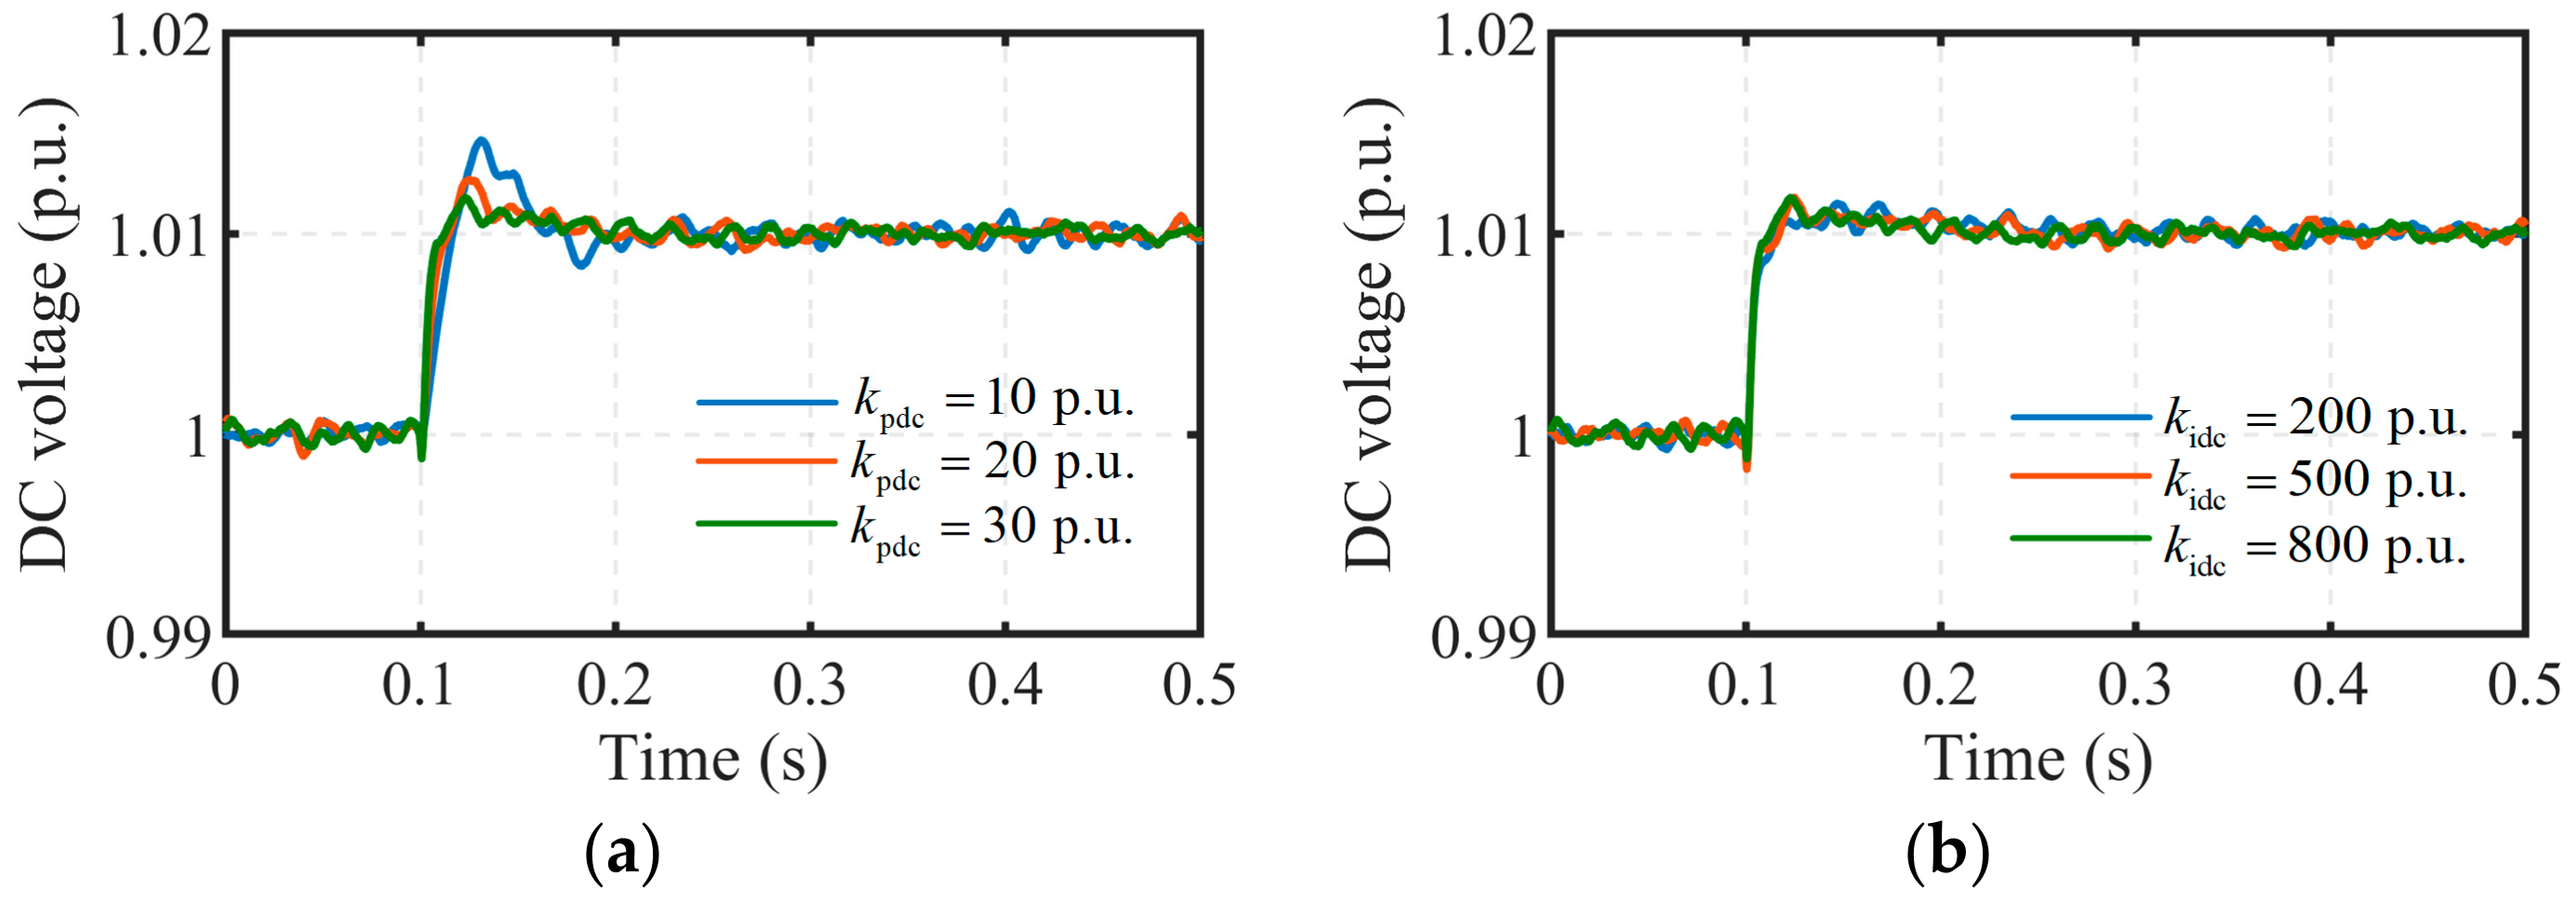
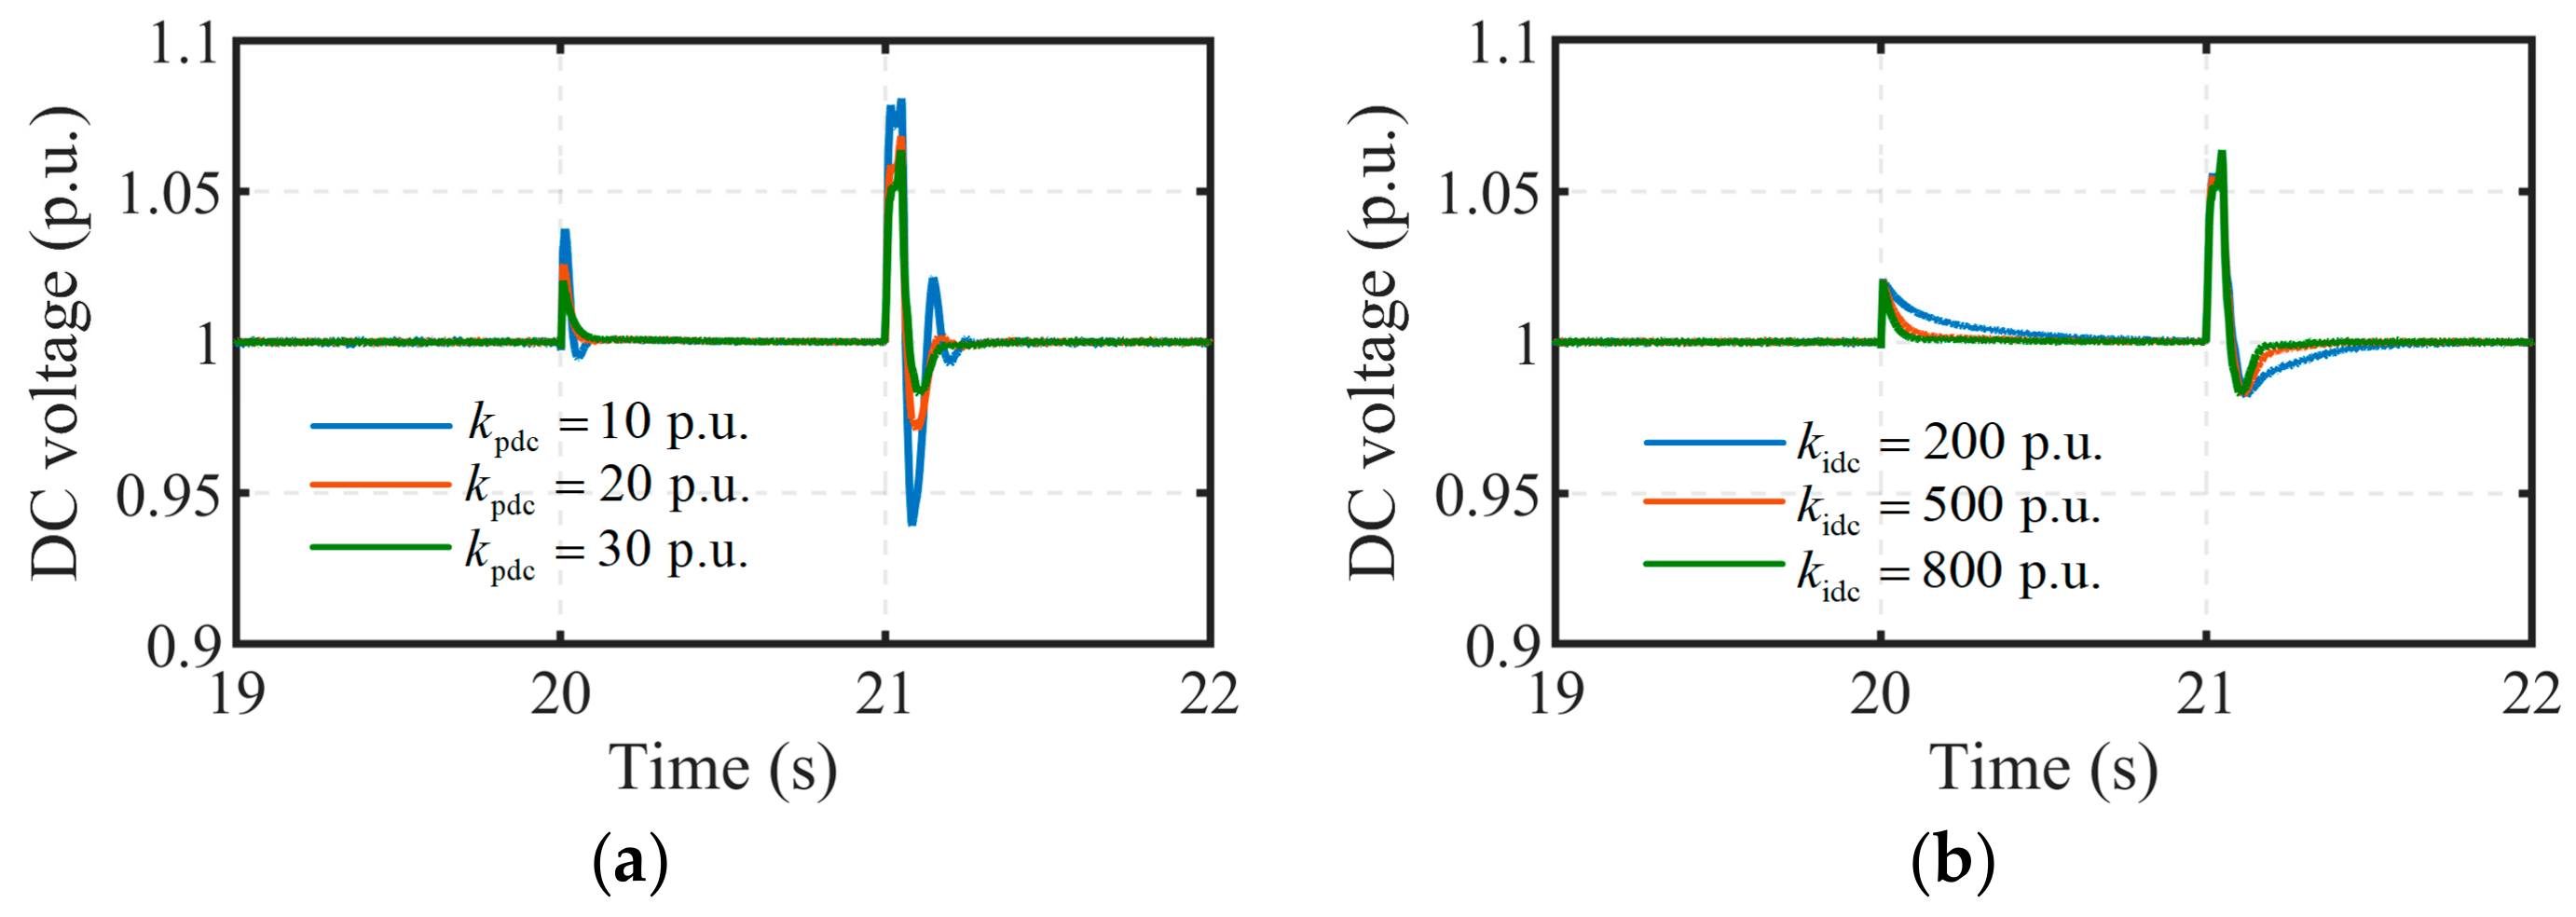
Figure 16 illustrates the simulation results of the DC-link voltage under varying controller parameters during LVRT. It is evident that the DC-link voltage undergoes two distinct fluctuations during both the initiation and recovery phases of the grid fault, driven primarily by rapid changes in grid-side power. Notably, the most pronounced fluctuation occurs during fault recovery, a consequence of the reverse power absorption effect on the grid side. For
, as its value decreases, the settling time remains largely consistent, while the amplitude of the DC-link voltage fluctuation escalates progressively. Specifically, when
= 30 p.u., the DC-link voltage peaks at 1.06 p.u., whereas when
= 10 p.u., it momentarily reaches 1.08 p.u. A further reduction in
could potentially drive the DC-link voltage beyond the acceptable threshold range. Conversely, for
, an increase in its value leaves the overshoot virtually unaffected but significantly reduces the response time. For instance, at
= 200 p.u., the settling time is approximately 0.5 s, whereas at
= 800 p.u., it diminishes to merely 0.2 s. The simulation results demonstrate excellent agreement with the theoretical results presented in
Figure 11.
The variations in the DC-link voltage waveforms due to changes in controller parameters, as observed from the simulation results, are entirely consistent with the theoretical derivations. Specifically, increasing effectively reduces the system overshoot, while increasing significantly shortens the system settling time. The accuracy of he established small-signal model of the DC-link voltage and the proposed parameter design methodology for the DC-link voltage controller have both been validated.
6. Conclusions
This article proposes a crowbar-less LVRT control strategy for FSC-VSPSU in generation mode. By leveraging the substantial energy storage capacity of the rotor to absorb power imbalances during LVRT, the proposed strategy eliminates the need for crowbar circuits, thereby avoiding issues such as overheating of energy-dissipating resistors and increased system costs. To better cope with grid fluctuations and faults, a power priority-based system-level control strategy is adopted, and the control objectives of each control unit are clearly defined: the governor is responsible for controlling the rotational speed; GSC is responsible for directly regulating the power flow; MSC is responsible for controlling the DC-link voltage; and ER is responsible for maintaining the stator flux magnitude. It is noteworthy that the MSC and ER must coordinate to achieve unity power factor control. Additionally, to investigate the mechanism of grid-side power disturbances on the DC-link voltage, a small-signal model of the DC-link voltage loop is established. A parameter design methodology for the DC-link voltage controller is proposed, and the controller parameters are designed using three evaluation tools: bode plots, root locus, and step response. The analysis demonstrates that increasing the proportional gain of the controller helps reduce the overshoot, while increasing the integral gain shortens the settling time. Therefore, selecting larger proportional and integral gains ensures that the DC-link voltage can quickly return to its reference value even under significant grid-side power disturbances and remains within its threshold range throughout the transient process.


